Application and Validation of a Dynamic Energy Simulation Tool: A Case Study with Water Flow Glazing Envelope


 ,
, 
 ,
,
Abstract
1. Introduction
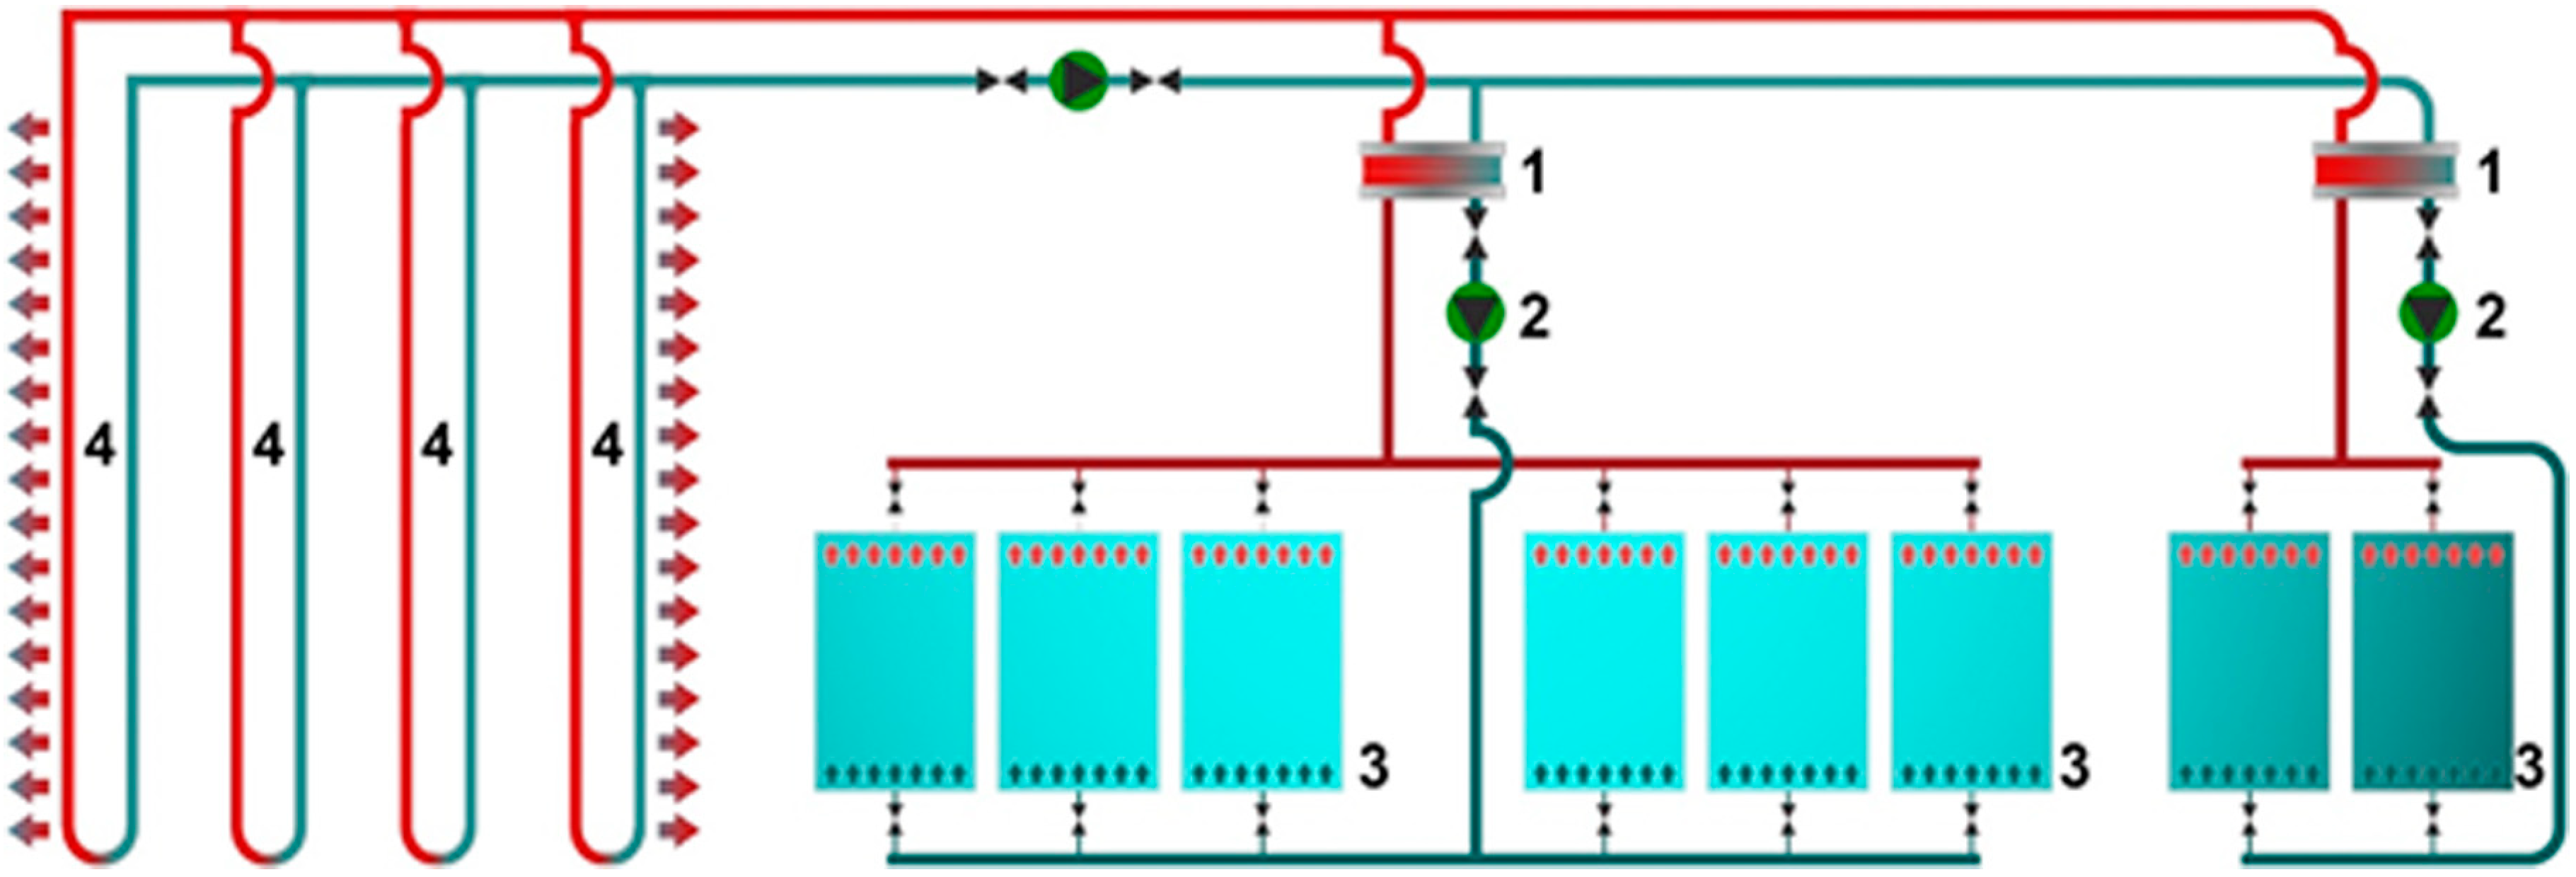
1.1. Closed-Loop Ground Source Systems
1.2. The Water Flow Glazing (WFG)
1.3. Dynamic Building Energy Modeling
1.4. Innovation and Objectives
2. Materials and Methods
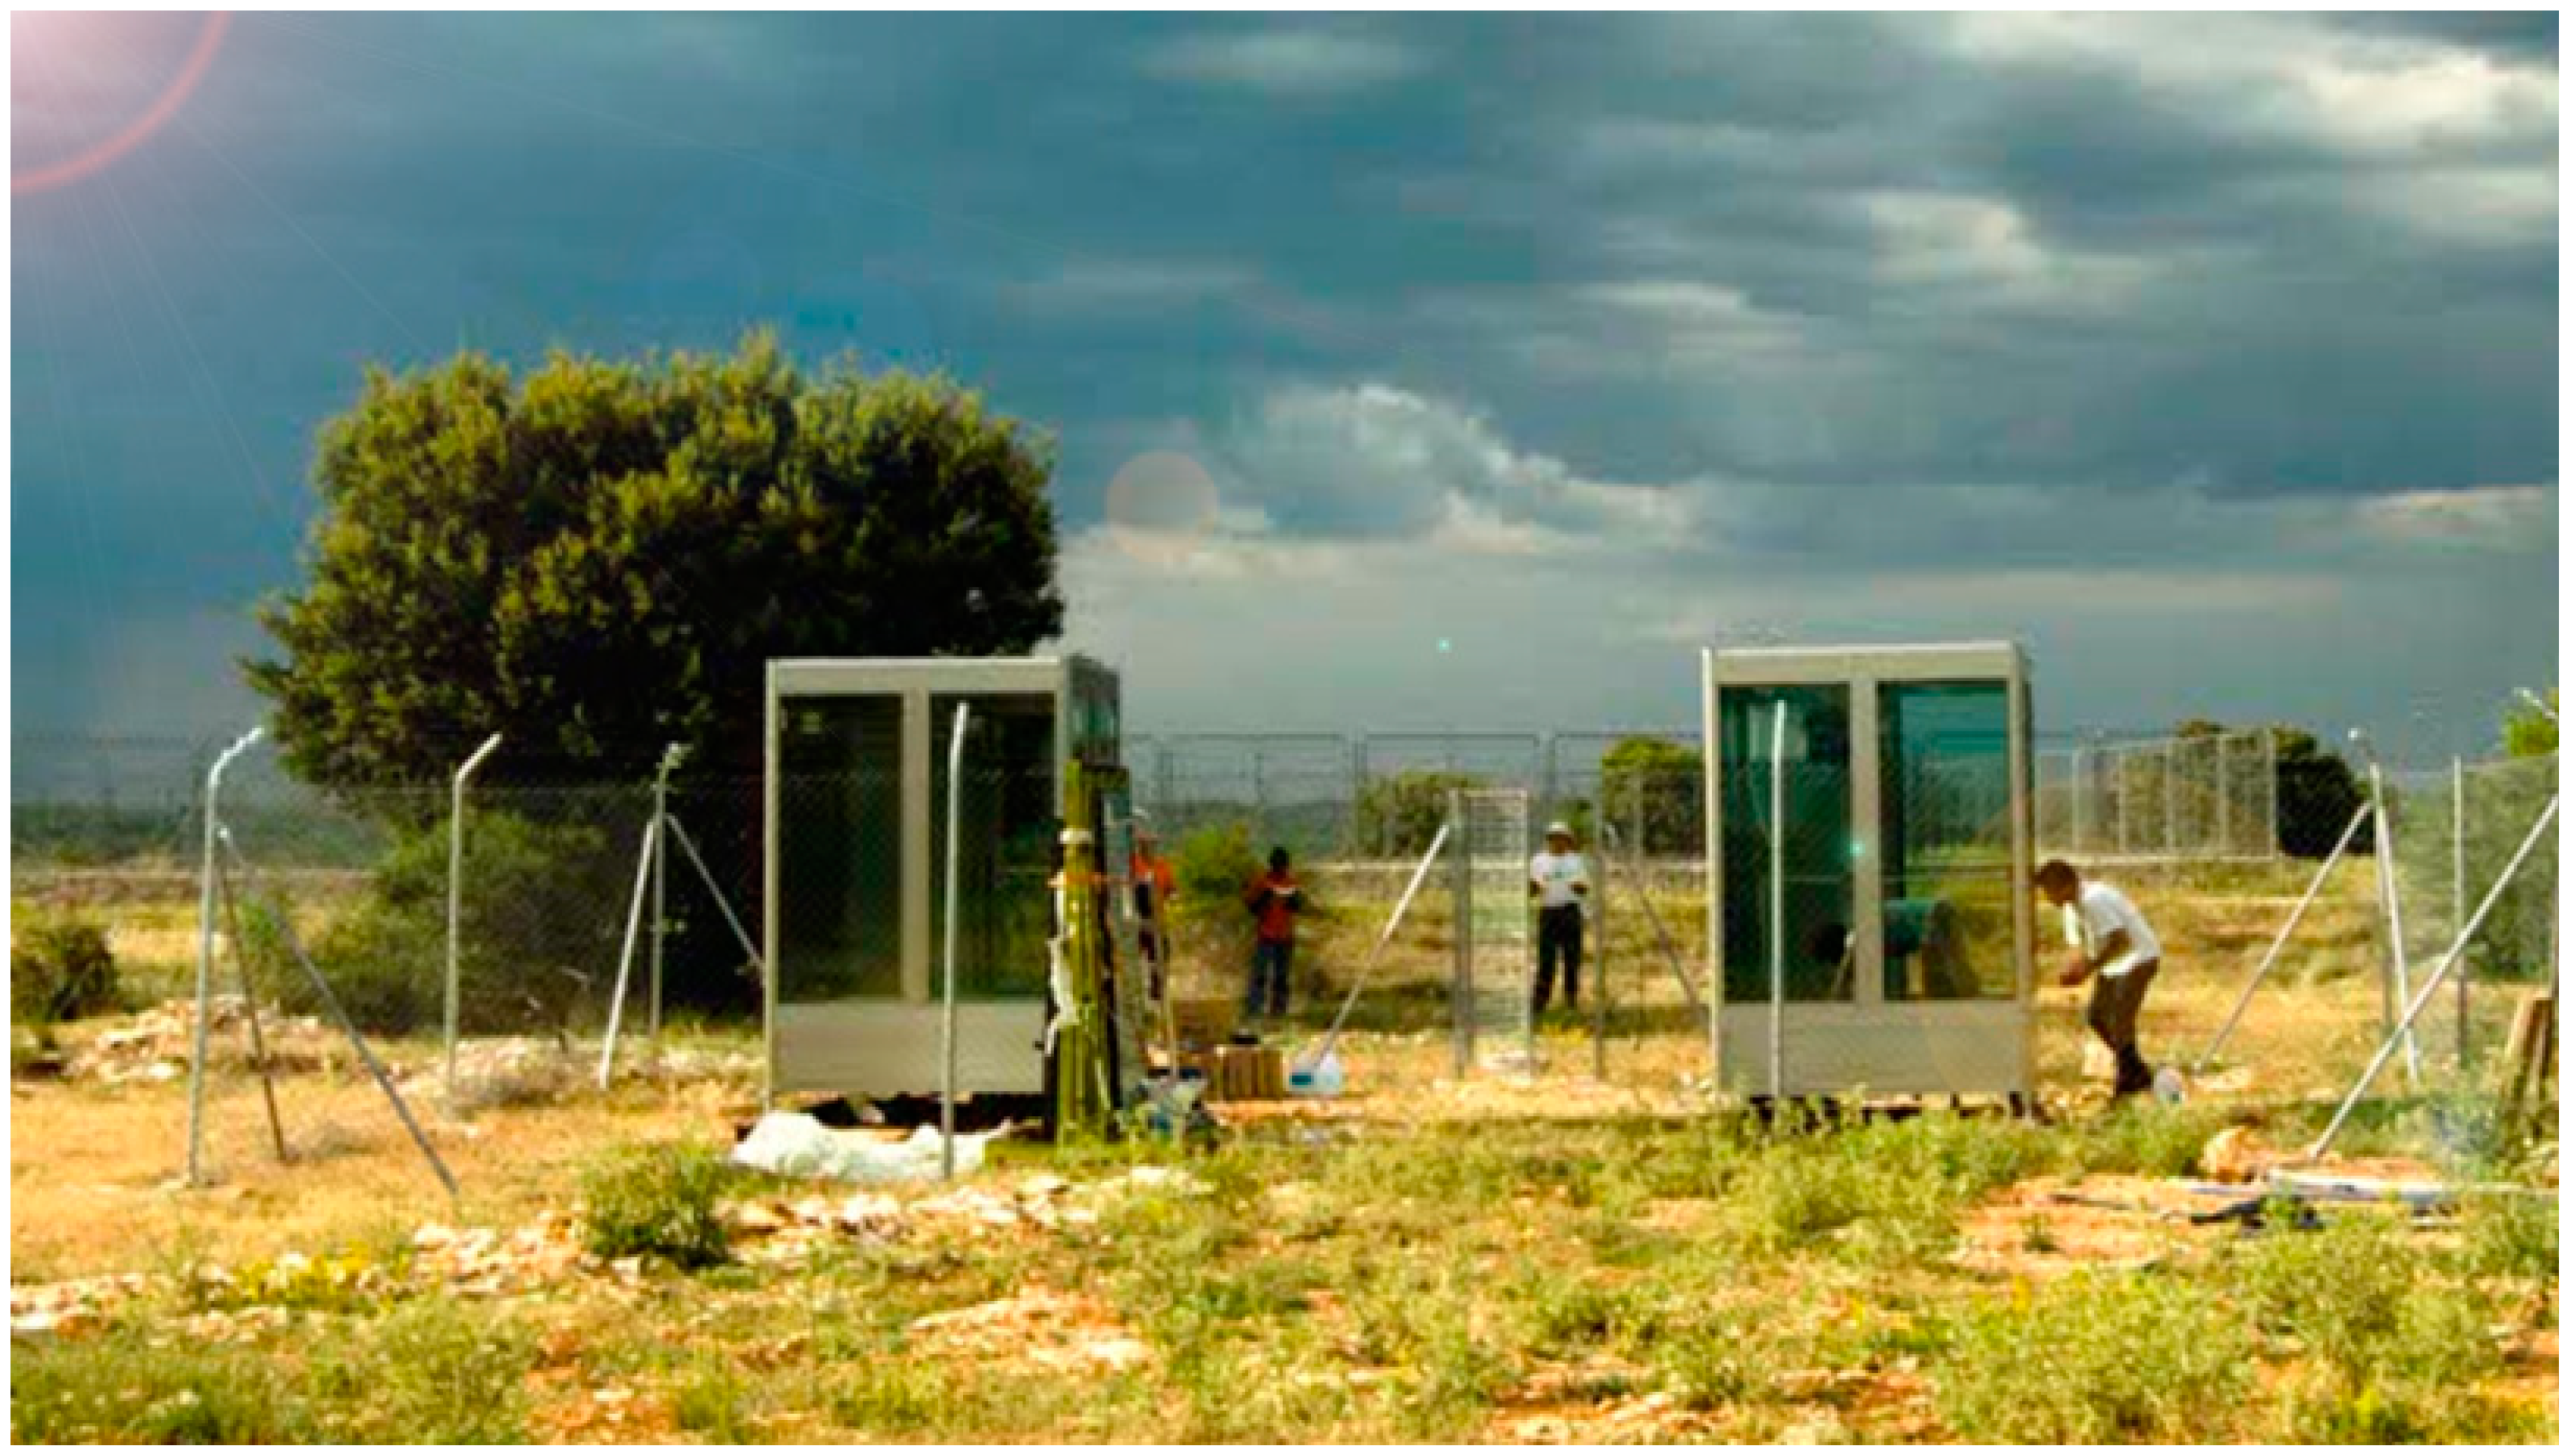
2.1. Description of the Prototype
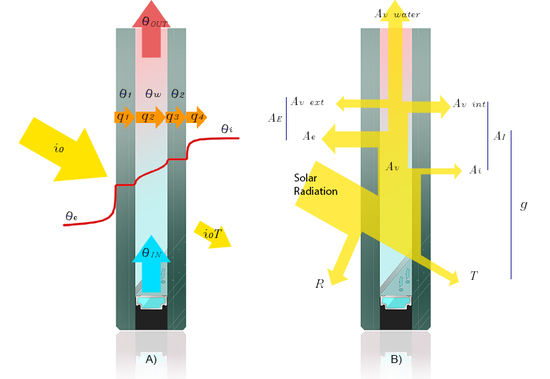
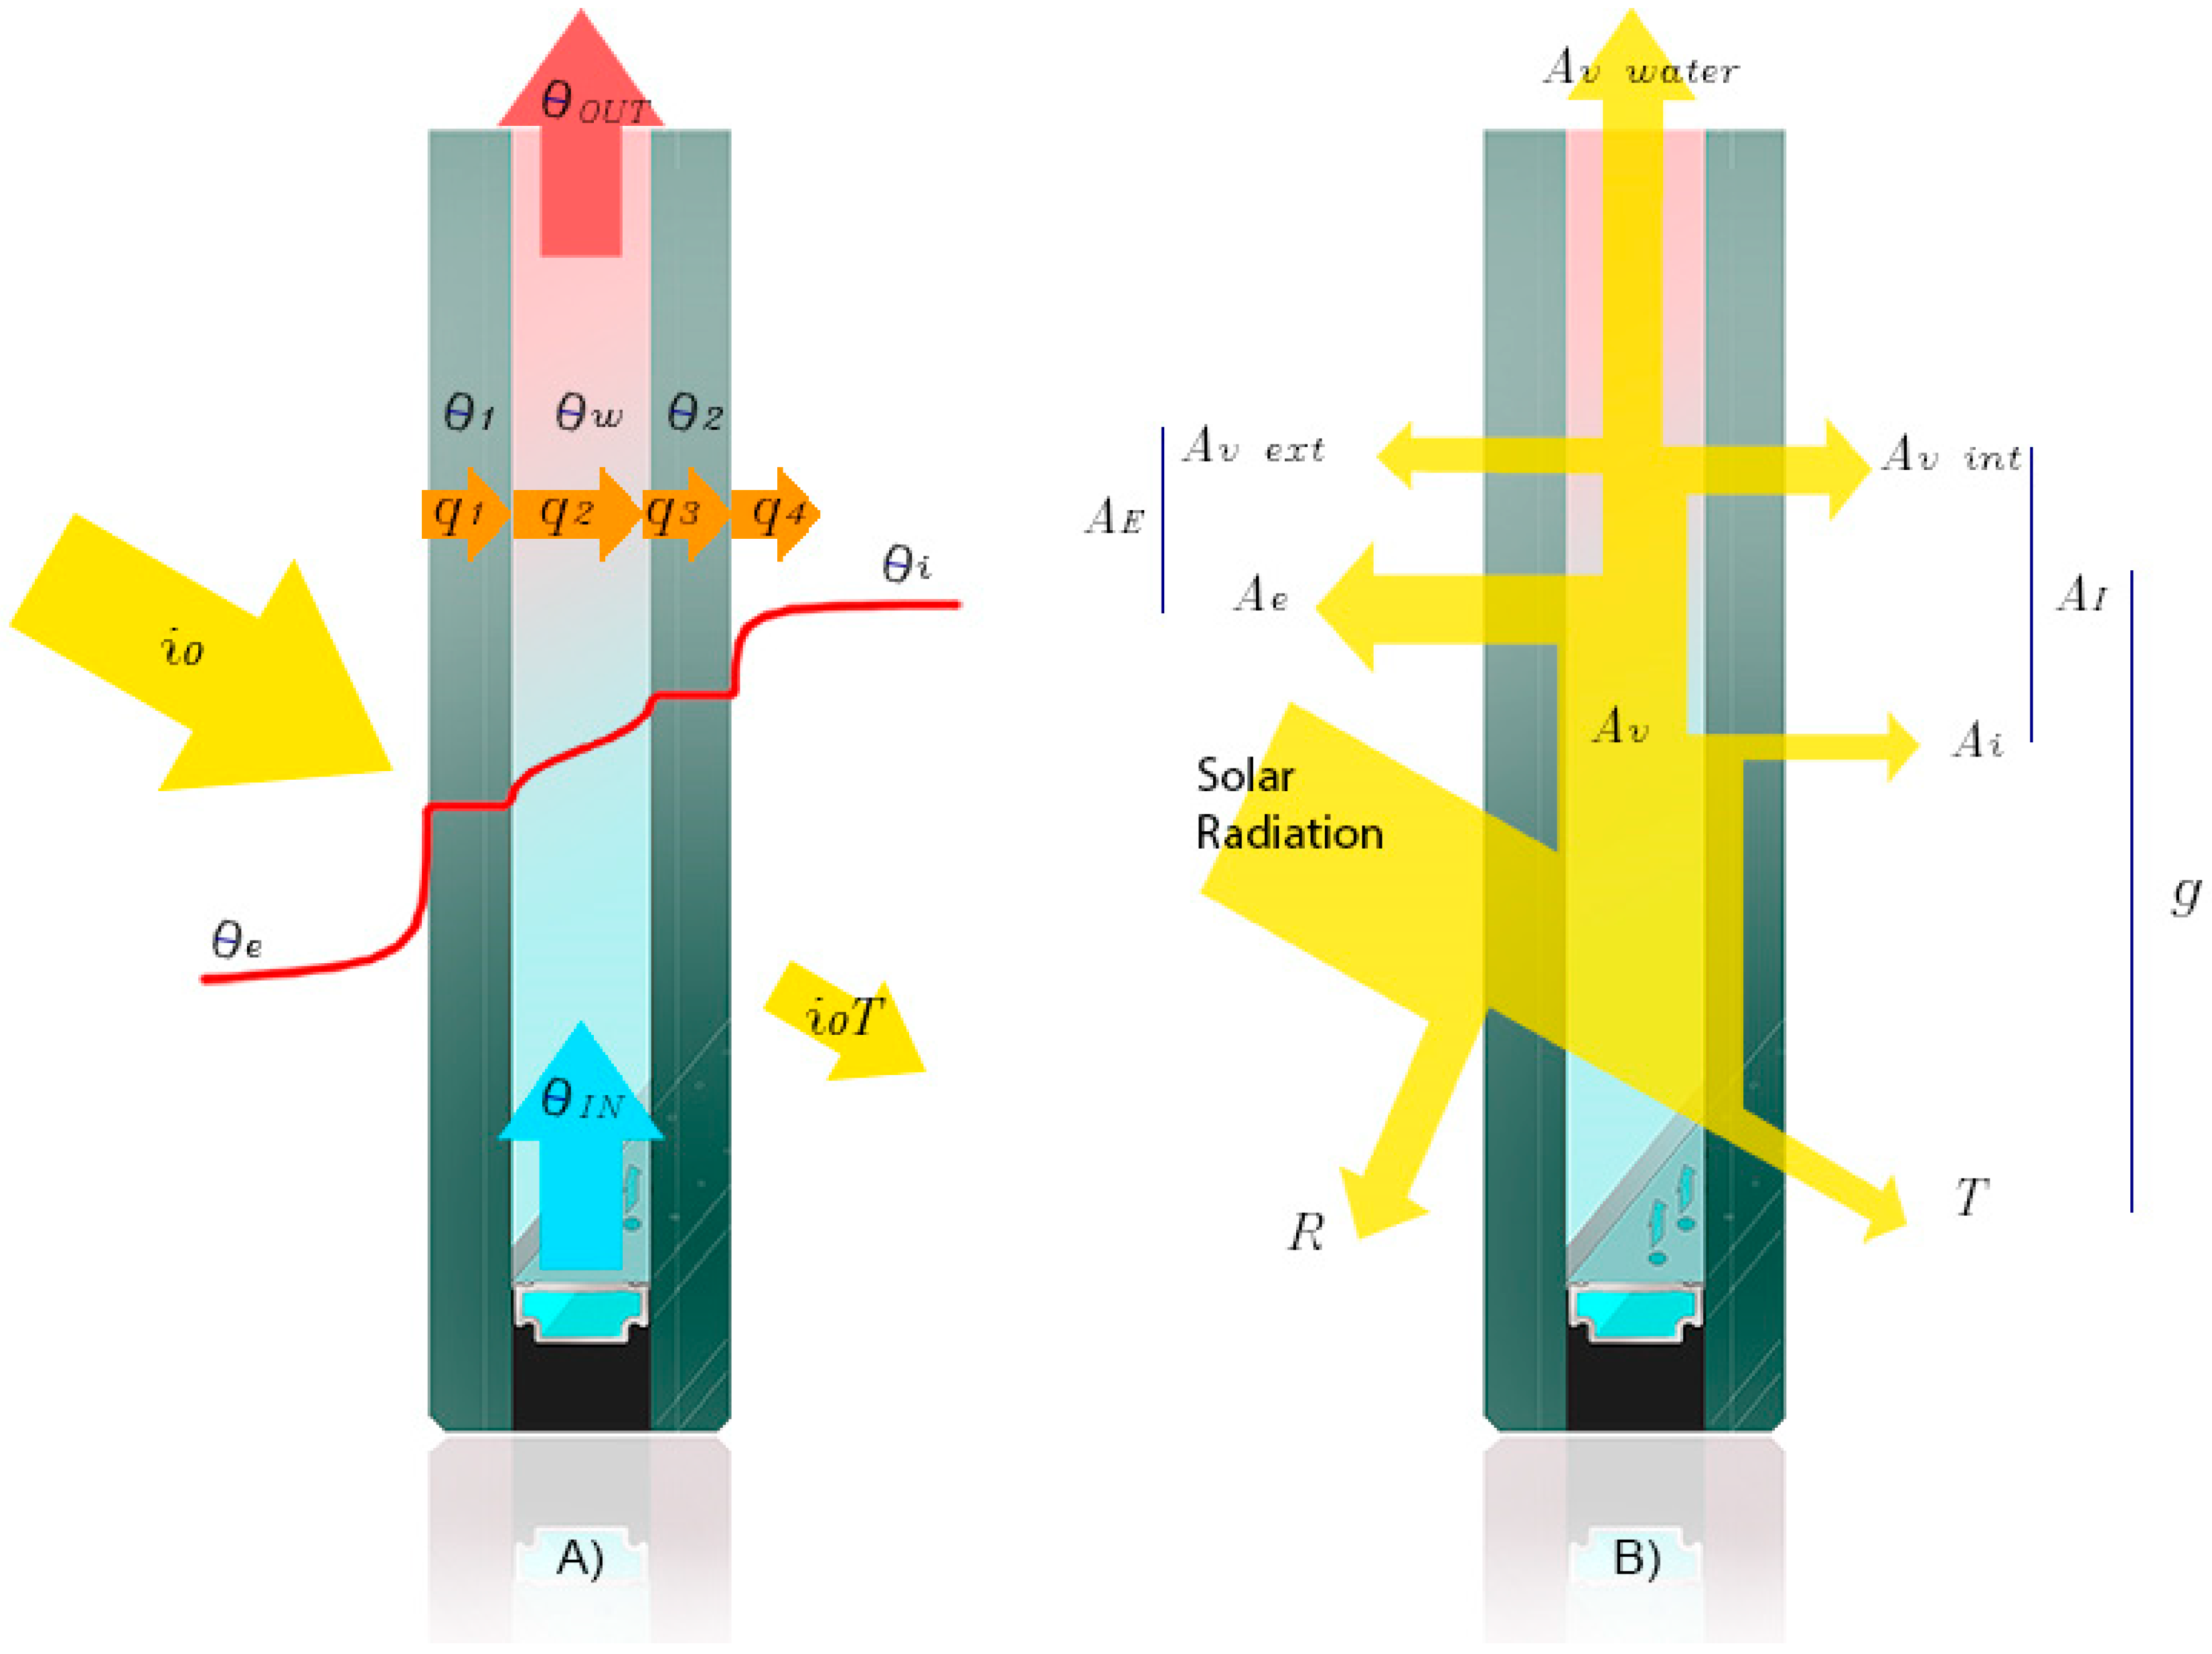
2.2. Mathematical Model
2.2.1. Double Glazing with a Gas Cavity
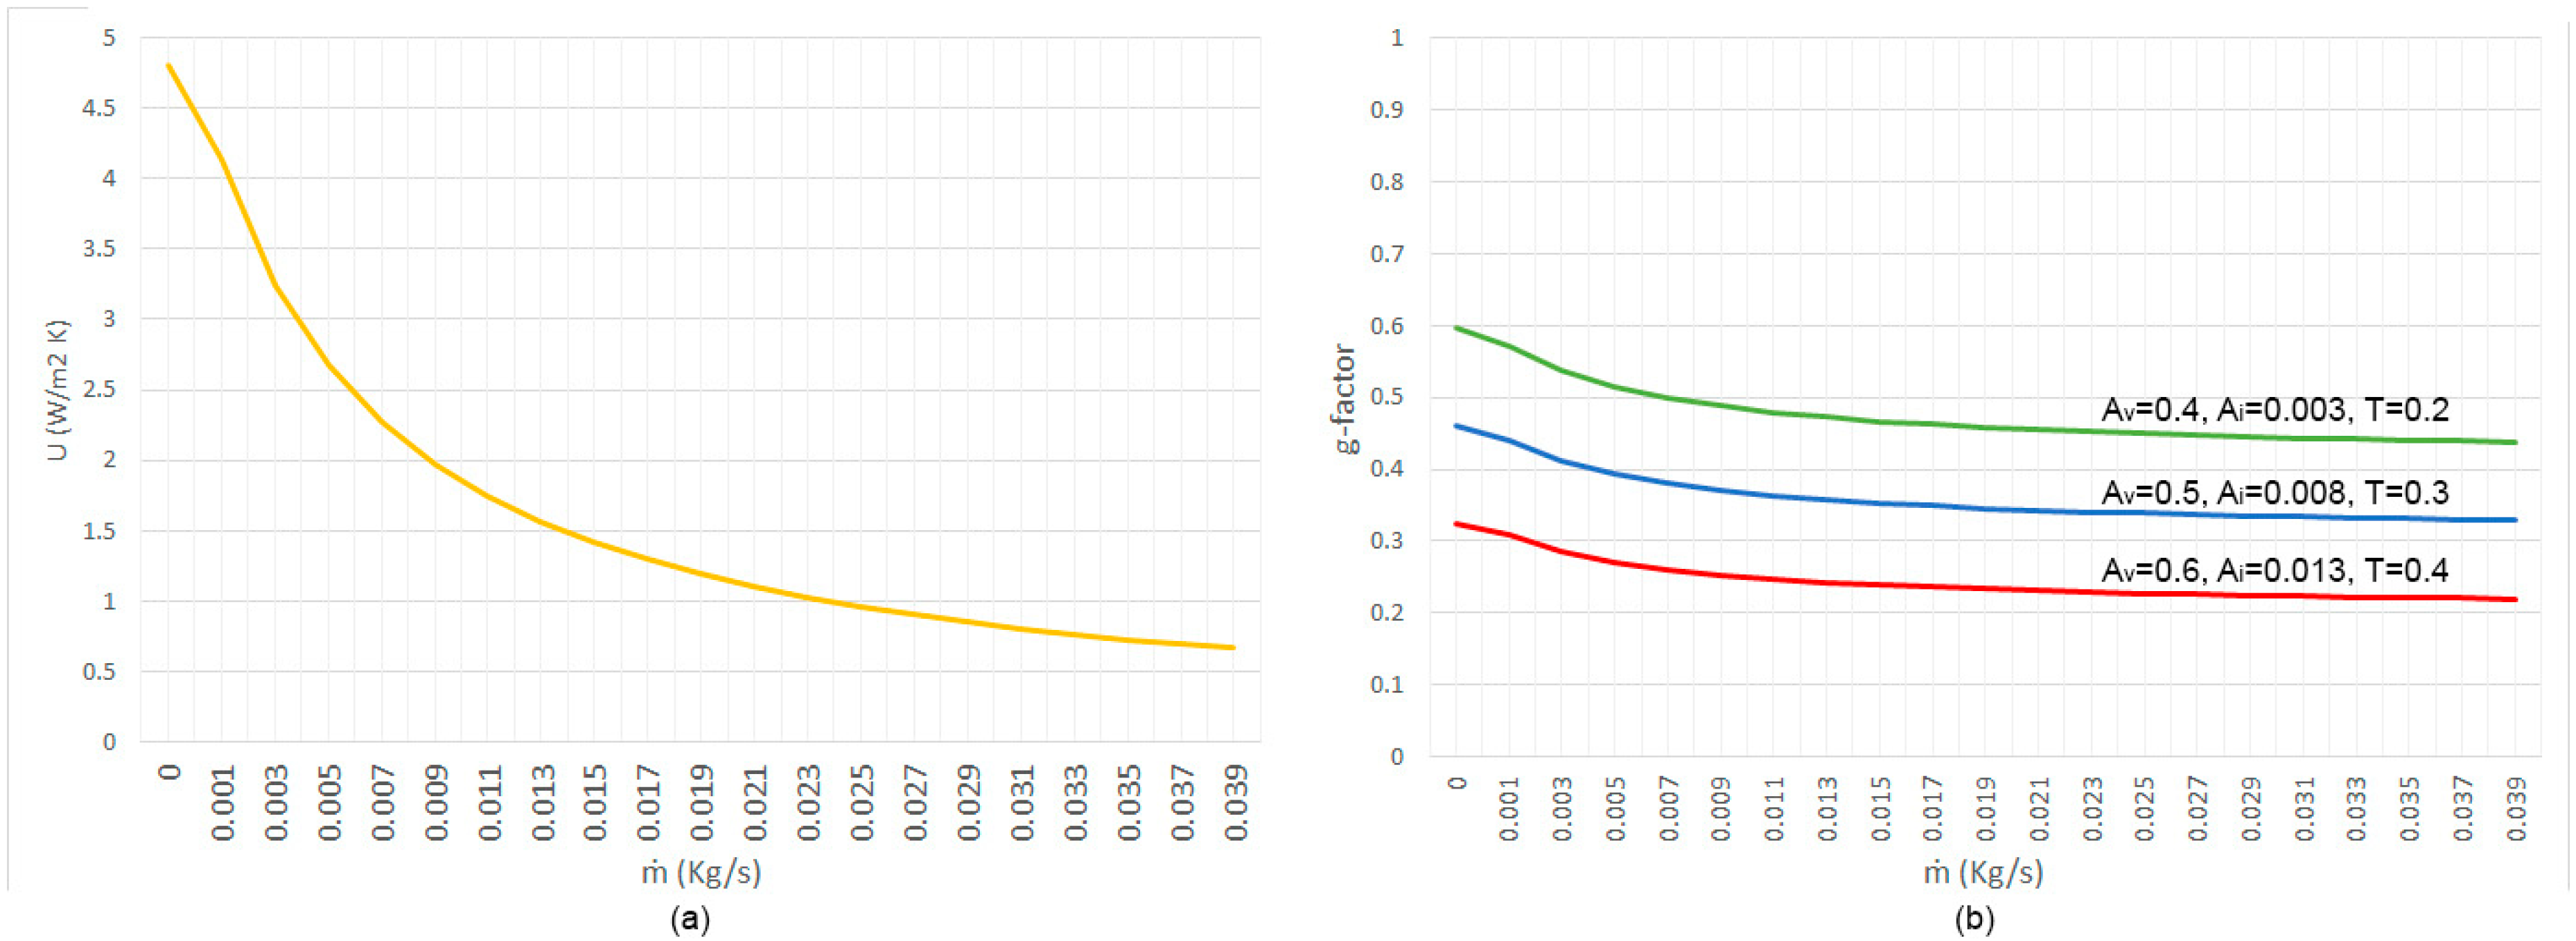
2.2.2. The Influence of Water Flow Glazing
2.3. Glass Selection
- 1.
- Energy balance considerations based on the location, including potential sun energy.
- 2.
- Spectral properties of glass panes and coatings.
- 3.
- Thermal simulator of the WFG modules.
- 4.
- Thermal simulator of simplified rooms combining WFG and non-transparent walls, roofs, and floors.
3. Results
3.1. Data from the Prototype
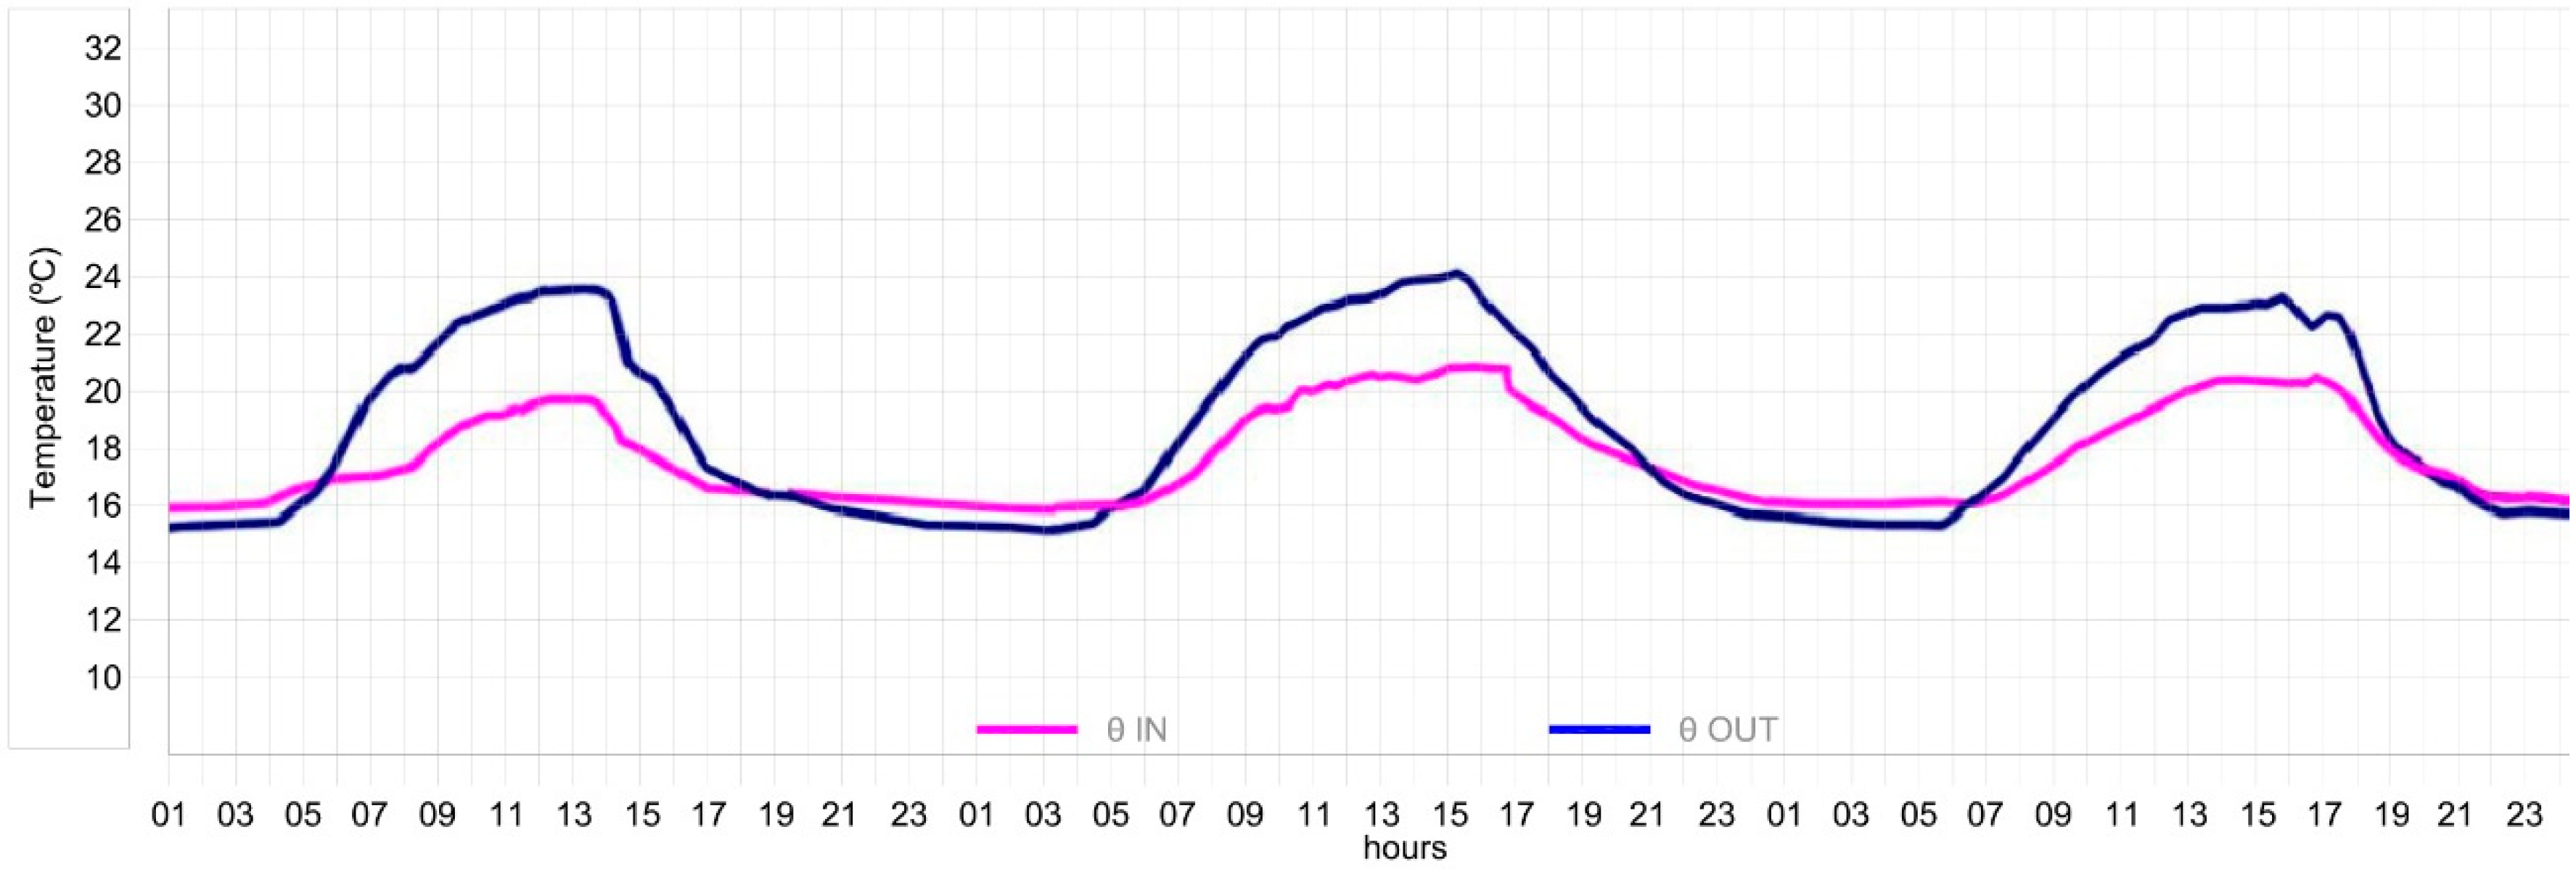
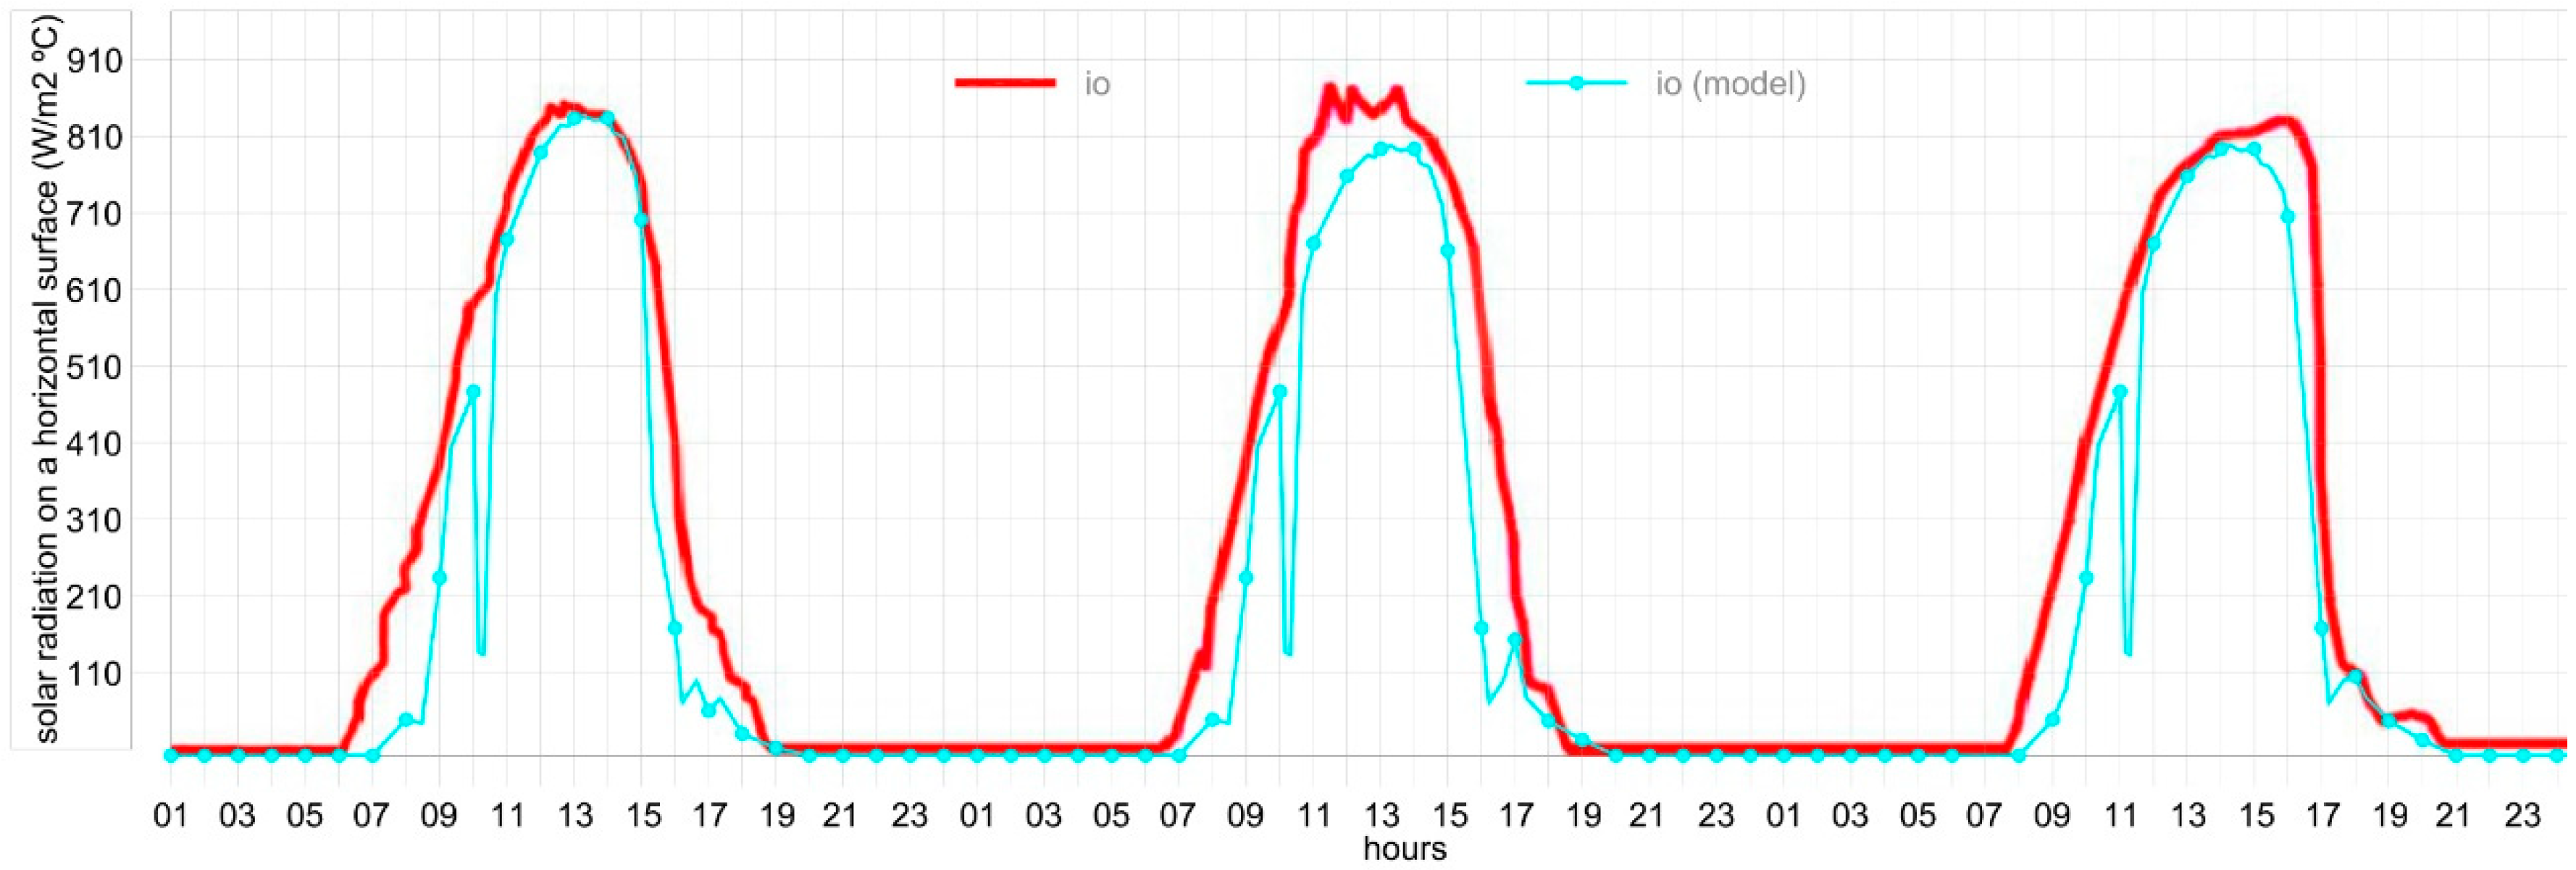
3.2. Validation of the Mathematical Model
4. Discussion
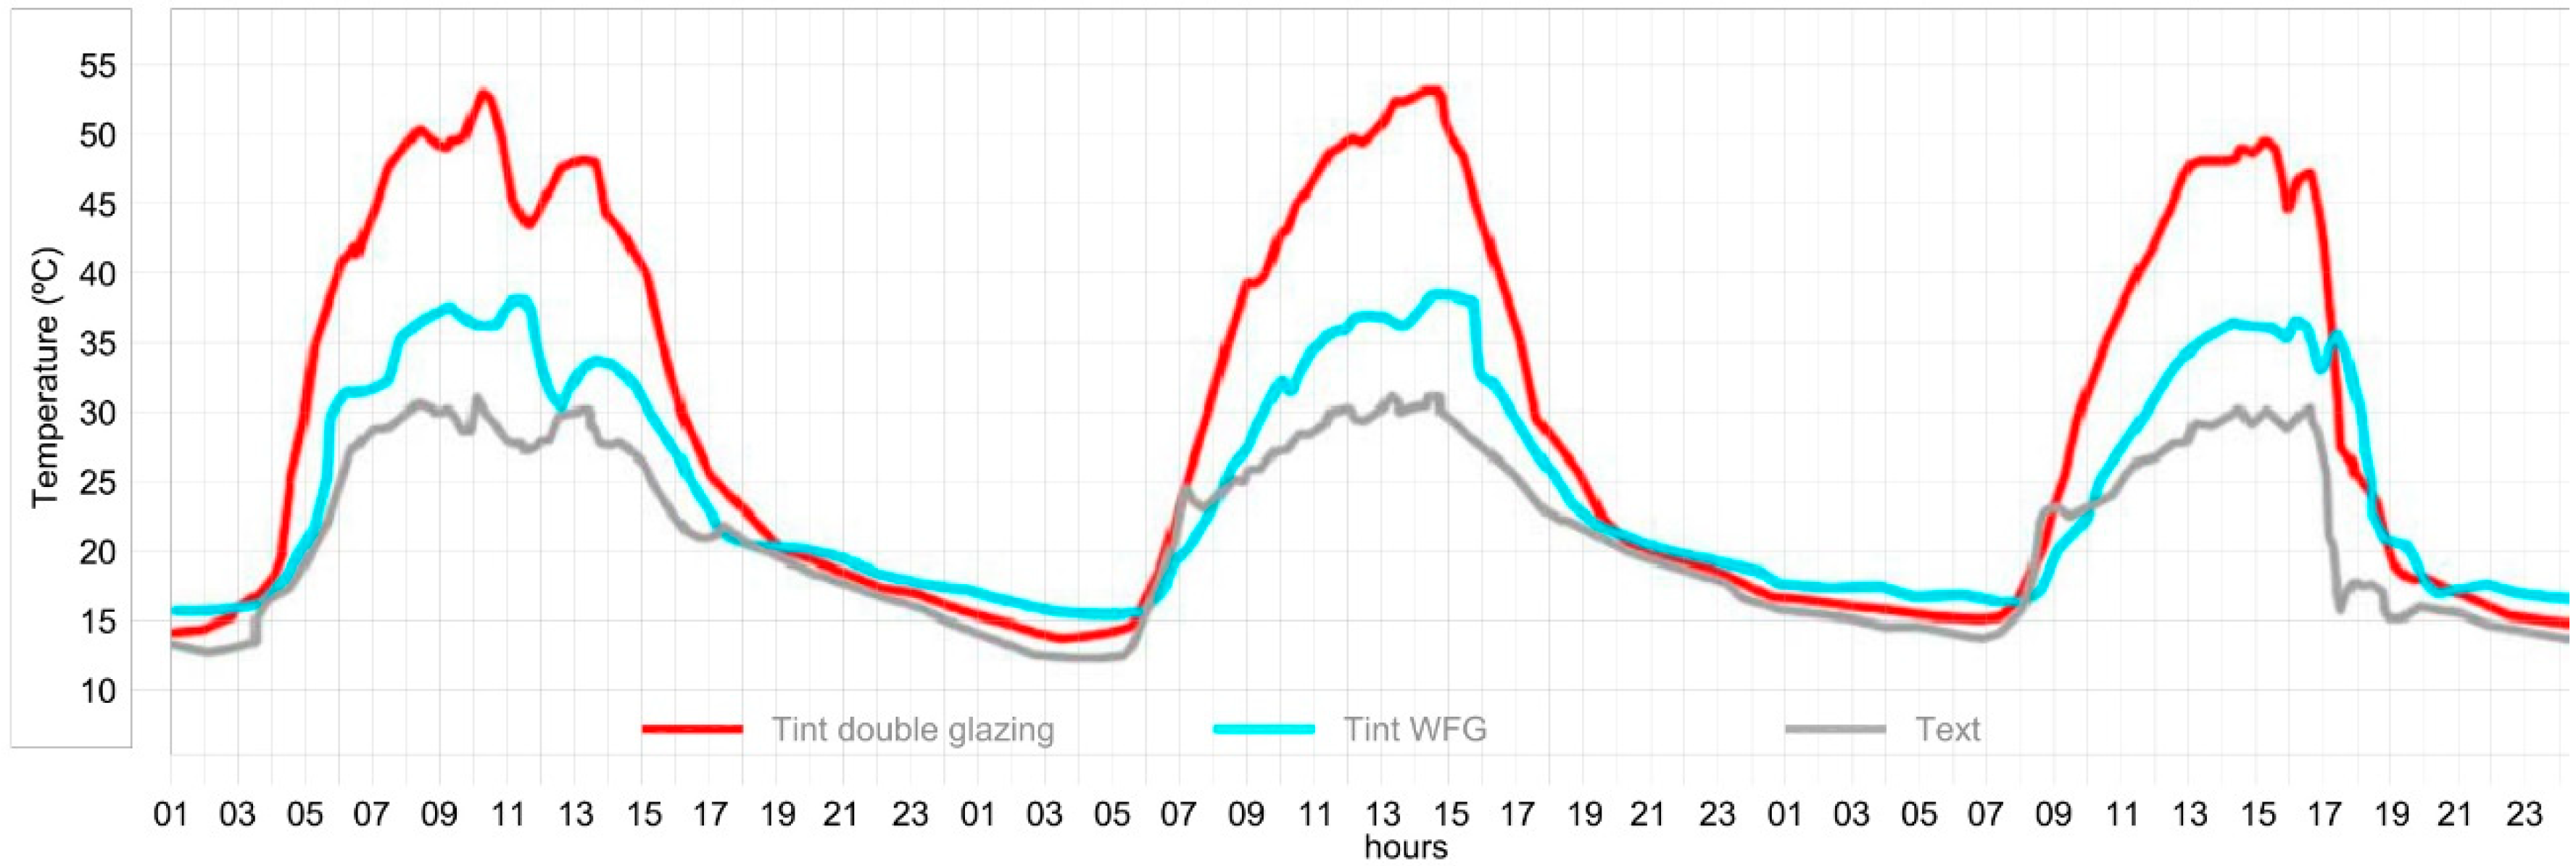
4.1. Comparison between the WFG Cabin Data and the Simulation
4.2. Energy Management of the WFG Cabin
4.3. Cost Considerations
5. Conclusions
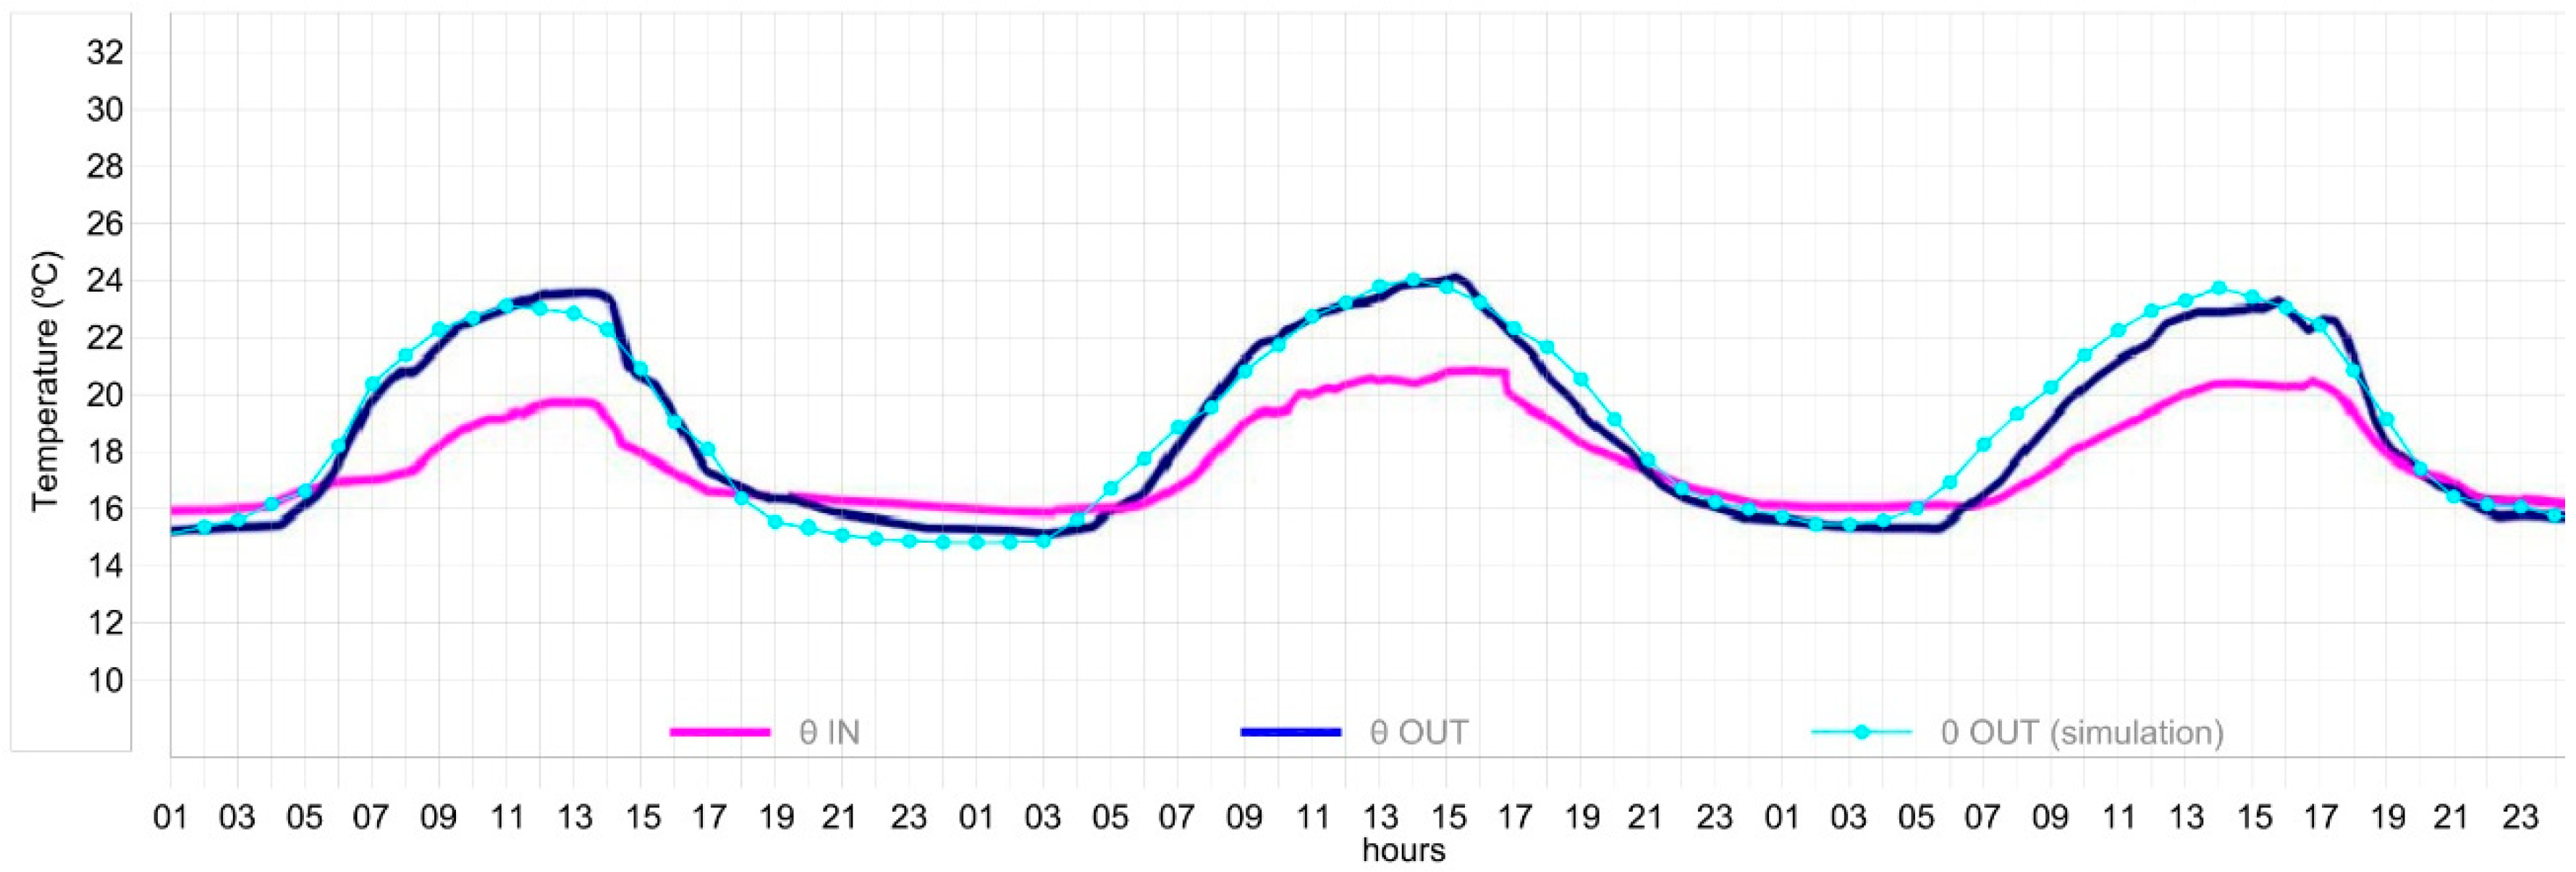
- The ME of the outlet temperature, θOUT, was 0.29 C, and the MPE was 2.1%.
- The ME of the indoor temperature, θi, was 0.7, and the MPE was 2.8%.
- The performance of WFG in the wintertime.
- The effect of WFG in comfort by analyzing the mean radiant temperature (MRT).
- The study of different energy generation systems in buildings (fuel-based or heat pumps) and its potential for energy savings using WFG envelopes.
Author Contributions
Funding
Acknowledgments
Conflicts of Interest
References
- Sun, Y.; Wilson, R.; Wu, Y. A Review of Transparent Insulation Material (TIM) for building energy saving and daylight comfort. Appl. Energy 2018, 226, 713–729. [Google Scholar] [CrossRef]
- Cao, X.; Dai, X.; Liu, J. Building energy-consumption status worldwide and the state-of-the-art technologies for zero-energy buildings during the past decade. Energy Build. 2016, 128, 198–213. [Google Scholar] [CrossRef]
- Hermanns, M.; del Ama, F.; Hernández, J.A. Analytical solution to the one-dimensional non-uniform absorption of solar radiation in uncoated and coated single glass panes. Energy Build. 2012, 47, 561–571. [Google Scholar] [CrossRef]
- EU. Directive 2010/31/EU of the European Parliament and of the Council of 19 May 2010 on the energy performance of buildings (recast). Off. J. Eur. Union 2010, 153, 13–35. [Google Scholar]
- Priarone, A.; Silenzi, F.; Fossa, M. Modelling Heat Pumps with Variable EER and COP in EnergyPlus: A Case Study Applied to Ground Source and Heat Recovery Heat Pump Systems. Energies 2020, 13, 794. [Google Scholar] [CrossRef]
- Sanner, B.; Karytsas, C.; Mendrinos, D.; Rybach, L. Current status of ground source heat pumps and underground thermal energy storage in Europe. Geothermics 2003, 32, 579–588. [Google Scholar] [CrossRef]
- Vienken, T.; Kreck, M. Dietrich, P. Monitoring the impact of intensive shallow geothermal energy use on groundwater temperatures in a residential neighborhood. Geotherm. Energy 2019, 7, 8. [Google Scholar] [CrossRef]
- Boockmeyer, A.; Bauer, S. Efficient simulation of multiple borehole heat exchanger storage sites. Environ. Earth Sci. 2016, 75, 1021. [Google Scholar] [CrossRef]
- Bauer, S.; Pfeiffer, T.; Boockmeyer, A.; Dahmke, A.; Beyer, C. Quantifying induced effects of subsurface renewable energy storage. Energy Procedia 2015, 76, 633–641. [Google Scholar] [CrossRef]
- Shao, H.; Hein, P.; Sachse, A.; Kolditz, O. Geoenergy Modeling II: Shallow Geothermal Systems; Springer: Berlin, Germany, 2016. [Google Scholar]
- Pan, S.; Kong, Y.; Chen, C.; Pang, Z.; Wang, J. Optimization of the utilization of deep borehole heat exchangers. Geotherm. Energy 2020, 8, 6. [Google Scholar] [CrossRef]
- Nalla, G.; Shook, G.; Mines, G.; Bloomfield, K. Parametric sensitivity study of operating and design variables in wellbore heat exchangers. Geothermics 2005, 34, 30–46. [Google Scholar] [CrossRef]
- Erbs Poulsen, S.; Alberdi-Pagola, M.; Cerra, D.; Magrini, A. An Experimental and Numerical Case Study of Passive Building Cooling with Foundation Pile Heat Exchangers in Denmark. Energies 2019, 12, 2697. [Google Scholar] [CrossRef]
- Li, Z.; Zhu, W.; Bai, T.; Zheng, M. Experimental study of a ground sink direct cooling system in cold areas. Energy Build. 2009, 41, 1233–1237. [Google Scholar] [CrossRef]
- Li, D.; Wong, S.L.; Tsang, C.L.; Cheung, H.W. A study of the daylighting performance and energy use in heavily obstructed residential buildings via computer simulation techniques. Energy Build. 2006, 38, 1343–1348. [Google Scholar] [CrossRef]
- Gueymard, C.; DuPont, W. Spectral effects on the transmittance, solar heat gain, and performance rating of glazing systems. Sol. Energy 2009, 83, 940–953. [Google Scholar] [CrossRef]
- Chow, T.T.; Li, C.; Lin, Z. Thermal characteristics of water-flow double-pane window. Int. J. Therm. Sci. 2010, 50, 140–148. [Google Scholar] [CrossRef]
- Zevenhoven, R.; Fält, M.; Gomes, L.P. Thermal radiation heat transfer: Including wavelength dependence into modelling. Int. J. Therm. Sci. 2014, 86, 189–197. [Google Scholar] [CrossRef]
- Del Ama Gonzalo, F.; Moreno, B.; Hernandez, J.A. Dynamic Solar Energy Transmittance for Water Flow Glazing in Residential Buildings. Int. J. Appl. Eng. Res. 2018, 13, 9188–9193. [Google Scholar]
- Fokaides, P.A.; Kylili, A.; Kalogirou, S.A. Phase change materials (PCMs) integrated into transparent building elements: A review. Mater. Renew. Sustain. Energy 2015, 4, 6. [Google Scholar] [CrossRef]
- Feijo Munoz, J.; Poza Casado, I.; González-Lezcano, R.A.; Pardal, C.; Echarri, V.; Assiego De Larriva, R.; Fernández-Agüera, J.; Dios-Viéitez, M.J.; Del Campo-Díaz, V.J.; Montesdeoca Calderín, M.; et al. Methodology for the study of the envelope airtightness of residential buildings in Spain: A case study. Energies 2018, 11, 704. [Google Scholar] [CrossRef]
- Evangelisti, L.; Battista, G.; Guattari, C.; Basilicata, C.; de Lieto Vollaro, R. Influence of the Thermal Inertia in the European Simplified Procedures for the Assessment of Buildings’ Energy Performance. Sustainability 2014, 6, 4514–4524. [Google Scholar] [CrossRef]
- Mateus, N.M.; Pinto, A.; da Graça, G.C. Validation of EnergyPlus thermal simulation of a double skin naturally and mechanically ventilated test cell. Energy Build. 2014, 75, 511–522. [Google Scholar] [CrossRef]
- Torregrosa-Jaime, B.; Martínez, P.J.; González, B.; Payá-Ballester, G. Modelling of a Variable Refrigerant Flow System in EnergyPlus for Building Energy Simulation in an Open Building Information Modelling Environment. Energies 2019, 12, 22. [Google Scholar] [CrossRef]
- Nardi, I.; Lucchi, E.; de Rubeis, T.; Ambrosini, D. Quantification of heat energy losses through the building envelope: A state-of-the-art analysis with critical and comprehensive review on infrared thermography. Build. Environ. 2018, 146, 190–205. [Google Scholar] [CrossRef]
- Bambardekar, S.; Poerschke, U. The architect as performer of energy simulation in the early design stage. In Proceedings of the IBPSA 2009—International Building Performance Simulation Association, Glasgow, Scotland, 27–30 July 2009; pp. 1306–1313. [Google Scholar]
- Fernandez-Antolin, M.; del-Rio, J.M.; del Ama Gonzalo, F.; Gonzalez-Lezcano, R. The Relationship between the Use of Building Performance Simulation Tools by Recent Graduate Architects and the Deficiencies in Architectural Education. Energies 2020, 13, 1134. [Google Scholar] [CrossRef]
- Echarri, V.; Espinosa, A.; Rizo, C. Thermal Transmission through Existing Building Enclosures: Destructive Monitoring in Intermediate Layers versus Non-Destructive Monitoring with Sensors on Surfaces. Sensors 2017, 17, 2848. [Google Scholar] [CrossRef]
- Pires, I.M.; Garcia, N.M.; Pombo, N.; Flórez-Revuelta, F.; Rodríguez, N.D. Validation Techniques for Sensor Data in Mobile Health Applications. J. Sens. 2016, 2016, 2839372. [Google Scholar] [CrossRef]
- Abdulmohsin, H.; Aritra, G.; Senthilarasu, S.; Tapas, K.M. Evaluation of thermal performance for a smart switchable adaptive polymer dispersed liquid crystal (PDLC) glazing. Sol. Energy 2020, 195, 185–193. [Google Scholar] [CrossRef]
- Allen, K.; Connelly, K.; Rutherford, P.; Wu, Y. Smart windows—Dynamic control of building energy performance. Energy Build. 2017, 139, 535–546. [Google Scholar] [CrossRef]
- Ghosh, A.; Norton, B.; Duffy, A. Measured overall heat transfer coefficient of a suspended particle device switchable glazing. Appl. Energy 2015, 159, 362–369. [Google Scholar] [CrossRef]
- Ghosh, A.; Norton, B.; Duffy, A. Behaviour of a SPD switchable glazing in an outdoor test cell with heat removal under varying weather conditions. Appl. Energy 2016, 180, 695–706. [Google Scholar] [CrossRef]
- Casini, M. Smart windows for energy efficiency of buildings. Int. J. Civ. Struct. Eng. IJCSE 2015, 2, 230–238. [Google Scholar] [CrossRef]
- Moreno, B.; Del Ama Gonzalo, F.; Ferrandiz, J.A.; Hernandez, J.A. A Building energy simulation methodology to validate energy balance and comfort in zero energy buildings. J. Energy Syst. 2019, 3, 168–182. [Google Scholar] [CrossRef]
- Sierra, P.; Hernandez, J.A. Solar heat gain coefficient of water flow glazing. Energy Build. 2017, 139, 133–145. [Google Scholar] [CrossRef]
- Chow, T.T.; Li, C. Liquid-filled solar glazing design for buoyant water-flow. Build. Environ. 2013, 60, 45–55. [Google Scholar] [CrossRef]
- Chow, T.T.; Li, C.; Lin, Z. Innovative solar windows for cooling-demand climate. Sol. Energy Mater. Sol. Cells 2010, 94, 212–220. [Google Scholar] [CrossRef]
- EN 673, Glass in Building. In Determination of Thermal Transmittance (U Value). Calculation Method; British Standards Institution: London, UK, 2011.
- EN 410, Glass in Building. In Determination of Luminous and SolarCharacteristics of Glazing; British Standards Institution: London, UK, 2011.
- ISO 18292. Energy Performance of Fenestration Systems for Residential Buildings—Calculation Procedure; ISO: Geneva, Switzerland, 2011. [Google Scholar]
- Li, C.; Chow, T.T. Water-filled double reflective window and its year-roundperformance. Proc. Environ. Sci. 2011, 11, 1039–1047. [Google Scholar] [CrossRef]
- Finlayson, E.; Arasteh, D.; Huizenga, C.; Rubin, M.; Reilly, M. WINDOW 4.0:Documentation of Calculation Procedures; University of California, LawrenceBerkeley Laboratory: Berkeley, CA, USA, 1993. [Google Scholar]
- Spanish Regulation of Thermal Installations in Buildings (RITE). Factores de Emisión de CO2 y Coeficientes de paso a Energía Primaria de Diferentes Fuentes de Energía Final Consumidas en el Sector de Edificios en España; Instituto para la Diversificación y Ahorro de la Energía (IDAE): Madrid, Spain, 2016. [Google Scholar]
- Meggers, F.; Ritter, V.; Goffin, P.; Baetschmann, M.; Leibundgut, H. Low exergy building systems implementation. Energy 2012, 41, 48–55. [Google Scholar] [CrossRef]
- Statistical Requirements Compendium; Eurostat: Luxembourg, 2019.


| A1 | A2 | Aw | U | g | gON 1 | ||
|---|---|---|---|---|---|---|---|
| Reference Glazing | 0.585 | 0.037 | 2.6 | - | 0.67 | - | |
| WFG | 0.585 | 0.037 | 0.429–0.524 | 0.762 | 5.802 | - | 0.544 |
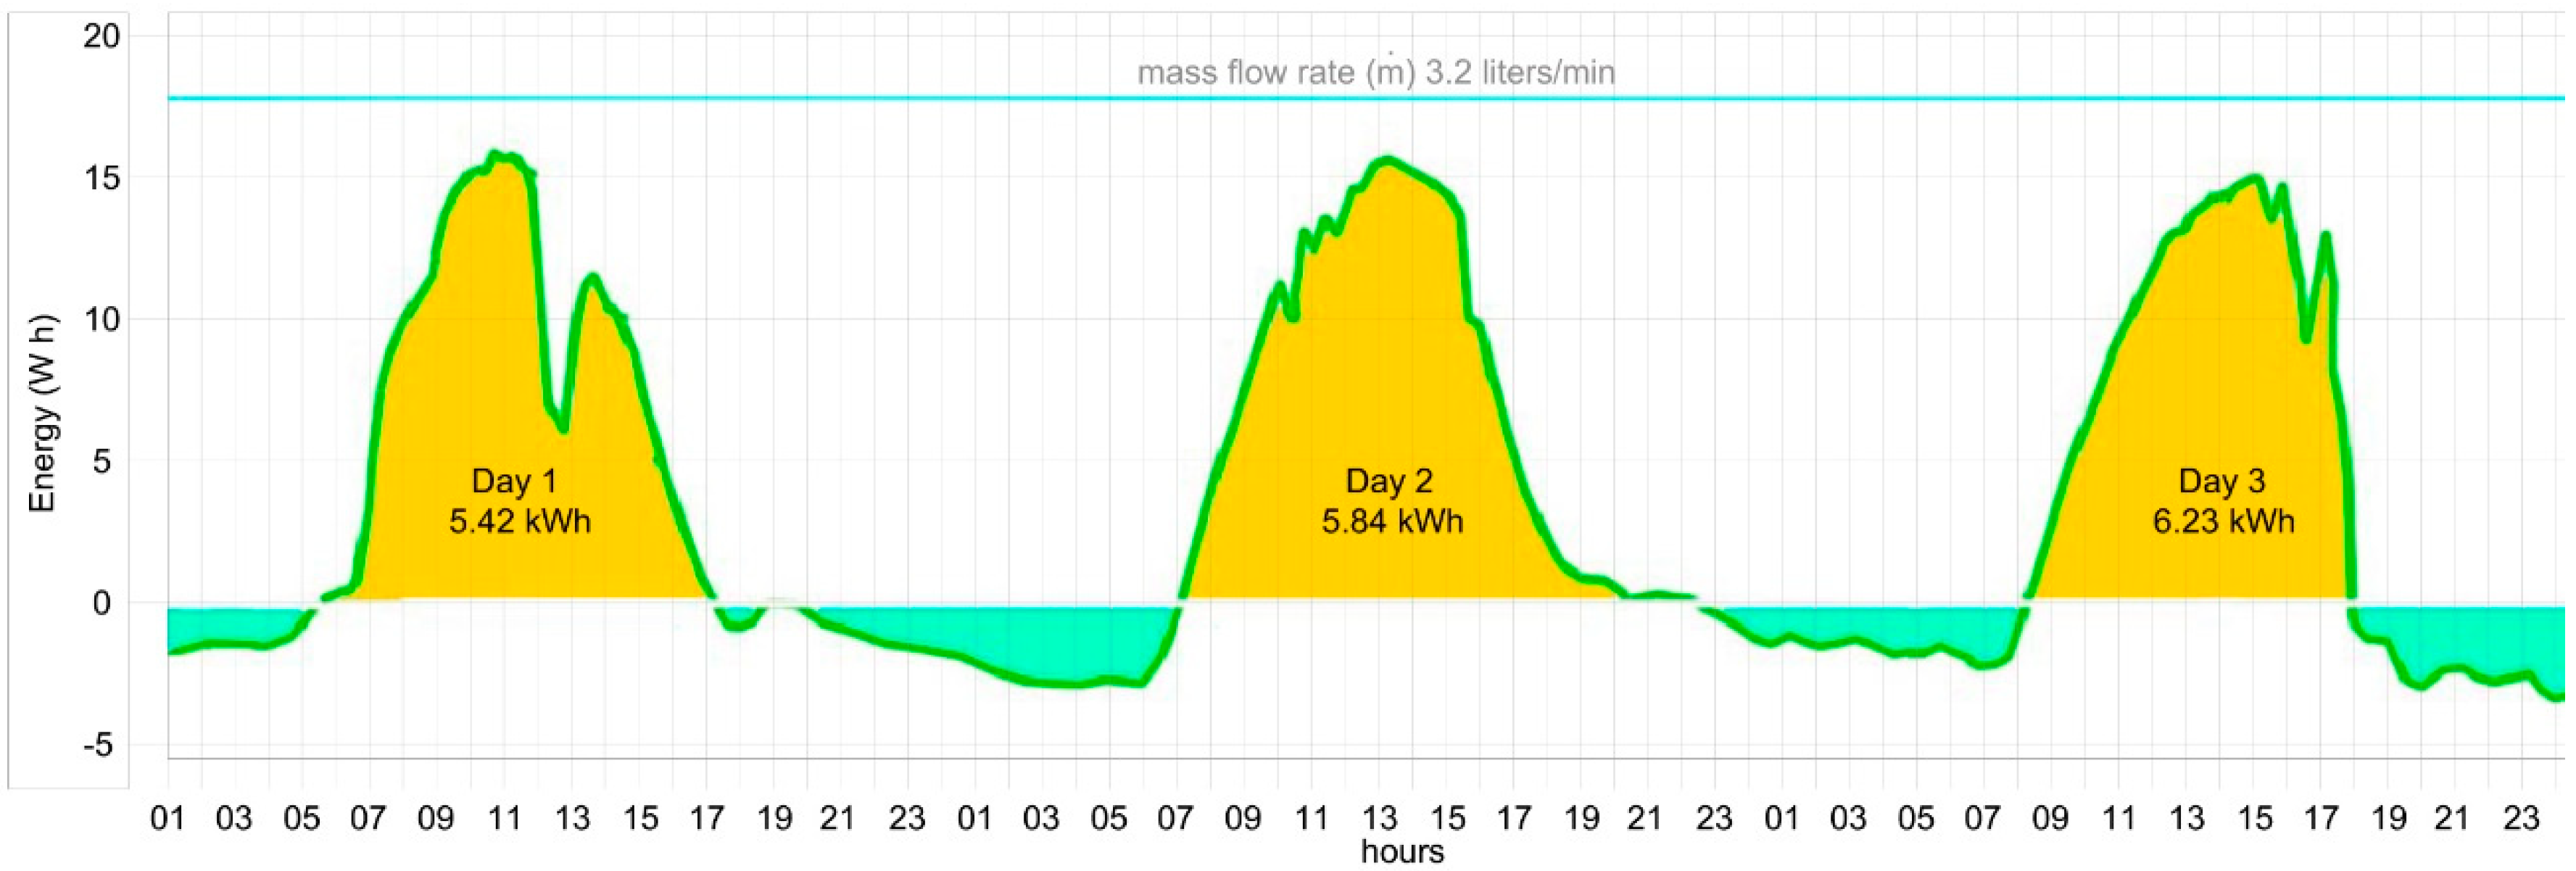
| Absorbed Energy, kWh (Day Time) | Dissipated Energy, kWh (Night Time) | Water Pump, kWh (24 h) | |
|---|---|---|---|
| Day 1 | 5.42 | 1.47 | 0.58 |
| Day 2 | 5.84 | 1.55 | 0.58 |
| Day 3 | 6.23 | 1.51 | 0.58 |
| WFG Absorbed Energy (3-Day Time) | Water Pump (3-Day Time) | |
|---|---|---|
| Energy consumption | 17.49 | 1.74 |
| SCOP | 3 | |
| FE consumption (Kwh) | 5.83 | 1.74 |
| NRFE consumption (Kwh) | 5.83 × 1.954 = 11.39 | 1.74 × 1.954 = 3.39 |
| CO2 emissions (KgCO2) | 5.83 × 0.331 = 1.93 | 1.74 × 0.331 = 0.57 |
© 2020 by the authors. Licensee MDPI, Basel, Switzerland. This article is an open access article distributed under the terms and conditions of the Creative Commons Attribution (CC BY) license (http://creativecommons.org/licenses/by/4.0/).
Share and Cite
Moreno Santamaria, B.; del Ama Gonzalo, F.; Pinette, D.; Gonzalez-Lezcano, R.-A.; Lauret Aguirregabiria, B.; Hernandez Ramos, J.A. Application and Validation of a Dynamic Energy Simulation Tool: A Case Study with Water Flow Glazing Envelope. Energies 2020, 13, 3203. https://doi.org/10.3390/en13123203
Moreno Santamaria B, del Ama Gonzalo F, Pinette D, Gonzalez-Lezcano R-A, Lauret Aguirregabiria B, Hernandez Ramos JA. Application and Validation of a Dynamic Energy Simulation Tool: A Case Study with Water Flow Glazing Envelope. Energies. 2020; 13(12):3203. https://doi.org/10.3390/en13123203
Chicago/Turabian StyleMoreno Santamaria, Belen, Fernando del Ama Gonzalo, Danielle Pinette, Roberto-Alonso Gonzalez-Lezcano, Benito Lauret Aguirregabiria, and Juan A. Hernandez Ramos. 2020. "Application and Validation of a Dynamic Energy Simulation Tool: A Case Study with Water Flow Glazing Envelope" Energies 13, no. 12: 3203. https://doi.org/10.3390/en13123203
APA StyleMoreno Santamaria, B., del Ama Gonzalo, F., Pinette, D., Gonzalez-Lezcano, R.-A., Lauret Aguirregabiria, B., & Hernandez Ramos, J. A. (2020). Application and Validation of a Dynamic Energy Simulation Tool: A Case Study with Water Flow Glazing Envelope. Energies, 13(12), 3203. https://doi.org/10.3390/en13123203