1. Introduction
The objective of this study is to quantify battery electric vehicles’ (BEVs’) energy consumption for different intersection control types, including a roundabout, a traffic signal, and a two-way stop sign using a microscopic traffic simulation model. The findings of this study can be used in developing vehicle-specific routing strategies that favor or avoid specific types of intersections depending on the vehicle technology. The market penetration rate of BEVs has significantly increased in recent years. The International Energy Agency reported that in 2018, 1.98 million BEVs were sold worldwide [
1]. During the first 6 months of 2019, global sales of BEVs increased by 92% [
2].
Compared to ICEVs, BEVs have significant benefits, including low maintenance costs, zero emissions, energy savings, and the ability to use electricity generated from renewable resources. Furthermore, BEVs can produce regenerative braking energy to improve energy efficiency. Specifically, in a BEV’s regenerative braking system, the electric motor works as a generator by sending energy from the vehicle’s wheels to the electric motor and storing it in the battery system.
Previous studies demonstrated that BEVs have different energy consumption patterns than ICEVs. An ICEVs’ fuel efficiency is typically maximized under constant speed highway driving conditions, whereas BEVs are more energy efficient in intermittent driving conditions, as these conditions allow the regenerative braking system to recover more energy [
3]. A previous study also investigated the fuel and energy consumption associated with various driving cycles for both BEVs and ICEVs [
4]. For a test ICEV (a Nissan Versa), the “LA92” and “New York” cycles were the worst fuel economy driving cycles, whereas the “Freeway Level of Service A-C” and “Freeway Level of Service D” cycles were the best fuel economy cycles. In contrast, for the test BEV (a Nissan Leaf), the “Area” and “Ramp” cycles utilized more electricity than the other driving cycles, and the “Freeway Level of Service E” and “Freeway Level of Service F” cycles were the most energy efficient. These results suggest that BEVs’ energy consumption patterns should be systematically compared to ICEVs’ patterns.
A number of studies have investigated the effects of traffic controls on ICEVs and developed optimum traffic signal controls to reduce fuel consumption and emissions. Varhelyi investigated the effects of small roundabouts on emissions and fuel consumption [
5]. Coelho et al. [
6] utilized a vehicle-specific power method to evaluate fuel consumption and emissions impacts on roundabout intersections in Raleigh, North Carolina and in Lisbon, Portugal. Researchers from Kansas State University utilized video-recorded traffic flow through the roundabout to extract speed, acceleration, deceleration, and other characteristics, and evaluated the emission impacts of roundabouts using SIDRA software (SIDRA SOLUTIONS, Balwyn, Australia) [
7]. Ahn et al. [
8] investigated the impacts of fuel consumption and emissions on a high-speed roundabout using a traffic simulation model. Kwak et al. [
9] investigated the effects of traffic signal optimization on fuel and greenhouse gas emissions in an urban corridor and optimized traffic signal timing plans based on vehicle fuel consumption using a genetic algorithm. Park et al. [
10] introduced a sustainable traffic signal control system and demonstrated that the system could reduce fuel consumption and pollutants with moderate increases in vehicle delays and number of stops. Stevanovic et al. [
11] developed a fuel optimum traffic control system by integrating the Comprehensive Modal Emission Model and Vissim-based genetic algorithm optimization of signal timings with the Vissim traffic simulation model. Michel et al. [
12] investigated the potential impacts of connected and automated vehicles on fuel consumption and found that the connectivity removed some stops and strong accelerations and increased overall vehicle speed, concluding that the best fuel consumption levels for hybrid electric vehicles and BEVs are achieved with connectivity.
While the above studies investigated the effects of traffic control strategies on ICEV fuel consumption and emissions, most did not consider BEVs. Thus, a systematic analysis of the effects of various intersection controls and signal plans on BEVs’ energy consumption is needed. To address this gap in knowledge, this study aimed to quantify BEVs’ energy consumption for different intersection controls—a roundabout, traffic signal, and two-way stop sign—and compare BEV’s energy and ICEV’s fuel consumption patterns. The study also investigated the effects of various traffic signal coordination planned BEVs’ energy consumption. In attempt to reduce greenhouse gas emissions, more BEVs will be utilized in the near future and some cities may adopt zero emission zones where only BEVs may be operated. The results of this study can be utilized by researchers, transportation practitioners, and politicians to make decisions related to alternative intersection control strategies for BEVs in the near future.
According to the definition given by the US Department of Energy, plug-in electric vehicles include BEVs (e.g., Nissan Leaf) and plug-in hybrid electric vehicles (PHEVs). The latter include blended/parallel vehicles (e.g., Toyota Prius Plug-In) along with extended-range electric vehicles (EVs) (e.g., Chevy Volt) which have a variety of configurations. In this study, EVs refer to battery-only EVs (i.e., BEVs), since a Nissan Leaf was utilized as a test vehicle.
The contributions of the study include the following: (a) we attempted to identify the impacts of various traffic controls on ICEV and BEV fuel/energy consumption; (b) we used a microscopic analysis tool to evaluate instantaneous ICEV and BEV fuel/energy consumption; and (c) while most other studies have utilized simplified BEV energy models which consider an average regenerative braking energy efficiency or a regenerative braking factor that depends on vehicle speed, this study utilized a BEV energy model that can estimate the instantaneous energy consumed (kWh) and the instantaneous energy regenerated (kWh) required to accurately capture the regenerative braking energy.
The remainder of this paper is organized as follows. The next sections present the methodology utilized in the study; the energy model for BEVs and the fuel consumption model for ICEVs; and the simulation model and results. The discussion and future works are summarized in the final section.
2. Methodology
This study evaluated the effects on energy/fuel efficiency of two factors. First, the effects of different intersection controls (i.e., a roundabout, a traffic signal, and a stop sign) were investigated for both BEV and ICEV energy/fuel consumption. Second, the effects of fixed-time traffic signal control strategies with various signal coordination plans were assessed by evaluating BEV and ICEV energy/fuel consumption levels in a corridor with three intersections using three signal coordination plans: a well-coordinated plan, a partially coordinated plan, and a poorly coordinated plan.
The study required two main tasks: (1) the simulation or measurement of vehicle driving patterns for different intersection control types; and (2) measurements and/or estimates both BEV and ICEV energy/fuel consumption. Typically, field measurements and simulation are used to identify vehicle driving patterns. The use of a probe vehicle is a popular method to record vehicle driving patterns; however, it is difficult to collect the speed profiles of all approaching vehicles for different intersection control strategies. Thus, this study used the INTEGRATION software (Hesham Rakha, Blacksburg, VA, USA), a microscopic traffic simulation software, to obtain realistic representations of individual vehicles for different traffic control types. INTEGRATION software was validated against standard traffic flow theory and has also been used to evaluate various intelligent transportation system applications [
13].
The energy consumption of BEV and the fuel consumption of ICEV can be measured with on-board measurement devices or dynamometer testing. While field measurements are relatively accurate in measuring the BEV’s battery state-of-charge (SOC) and ICEV fuel consumption, data collection is limited to test vehicles equipped with measurement devices. This limits the usefulness of this method, because it is difficult to recruit test vehicles, install the data collection equipment, and collect sufficient field data. Thus, this study employed a microscopic BEV energy model to estimate BEV energy consumption and a microscopic fuel consumption model to estimate ICEV fuel consumption.
A number of BEV energy models and ICEV fuel consumption models use an average speed as an input variable. However, this approach is not suitable for the purposes of this study. In particular, the average speed-based models cannot identify the effects of transient changes in a vehicle’s speed and acceleration which have significant effects on energy/fuel consumption as demonstrated in earlier studies [
14]. Significant and frequent speed changes are observed while approaching and traversing intersection controlled approaches including roundabouts, traffic signals, and stop signs [
8]. Thus, this study utilized microscopic energy/fuel consumption models to estimate the vehicle energy/fuel consumption for various scenarios. These models are described in more detail below.
2.1. BEV Energy Model
The study utilized the Virginia Tech Comprehensive Power-Based EV Energy Consumption Model (i.e., VT-CPEM), to estimate BEV energy consumption [
4]. The VT-CPEM model is a microscopic, power-based EV energy model developed to estimate BEVs’ instantaneous energy consumption using vehicle operational variables, including instantaneous speed, acceleration, and grade information. The model estimates the instantaneous energy consumed (kWh), the instantaneous energy regenerated (kWh), and the final SOC of the electric battery (%). The VT-CPEM has a simple structure that allows it to be implemented in other modeling tools, including in-vehicle/smartphone applications and microscopic traffic simulation models. One of the major advantages of using VT-CPEM is that it can capture instantaneous braking energy regeneration, which is not available in most BEV energy models. Most other BEV energy models instead use an average regenerative braking energy efficiency [
15] or a regenerative braking factor that depends on the vehicle’s speed [
16]. However, these models cannot accurately capture the instantaneous regenerative braking energy required in this study.
Using VT-CPEM, the power at the electric motor was computed from the power at the wheels, assuming a driveline efficiency of 92% and an electric motor with an efficiency of 91%. The model also considered the power consumed by the auxiliary systems (700 W) [
17]. The VT-CPEM was validated against independent data, producing an average error of 5.9% [
18]. A detailed description of VT-CPEM is found in Reference [
4].
2.2. ICEV Fuel Consumption Model
The study utilized the VT-Micro model to estimate ICEVs’ fuel consumption. The VT-Micro model uses instantaneous speed and acceleration as explanatory variables and estimates instantaneous vehicle fuel consumption and emissions. The model consists of the following form:
where
Lei,j and
Mei,j denote coefficients for measure of effectiveness (MOE) including fuel consumption, HC, CO, NOx, and CO
2 emissions at speed exponent
i and acceleration exponent
j;
u is instantaneous speed; and
a is instantaneous acceleration rate.
The VT-Micro model utilizes a number of data sources, including the Environmental Protection Agency and Oak Ridge National Laboratory (ORNL). Due to the simplicity and accuracy of the model, the VT-Micro model is one of the most popular microscopic fuel and emission models. A detailed description of the model is found in Reference [
19].
3. Microscopic Traffic Simulation Modeling and Results
INTEGRATION software, which has been utilized and validated for a number of traffic control applications, was used in the simulations in this study. The model provides a reasonable assessment of how the studied intersection functions.
3.1. Analysis of Alternative Intersection Control Strategies: Roundabout, Traffic Signal, and Stop Sign Control
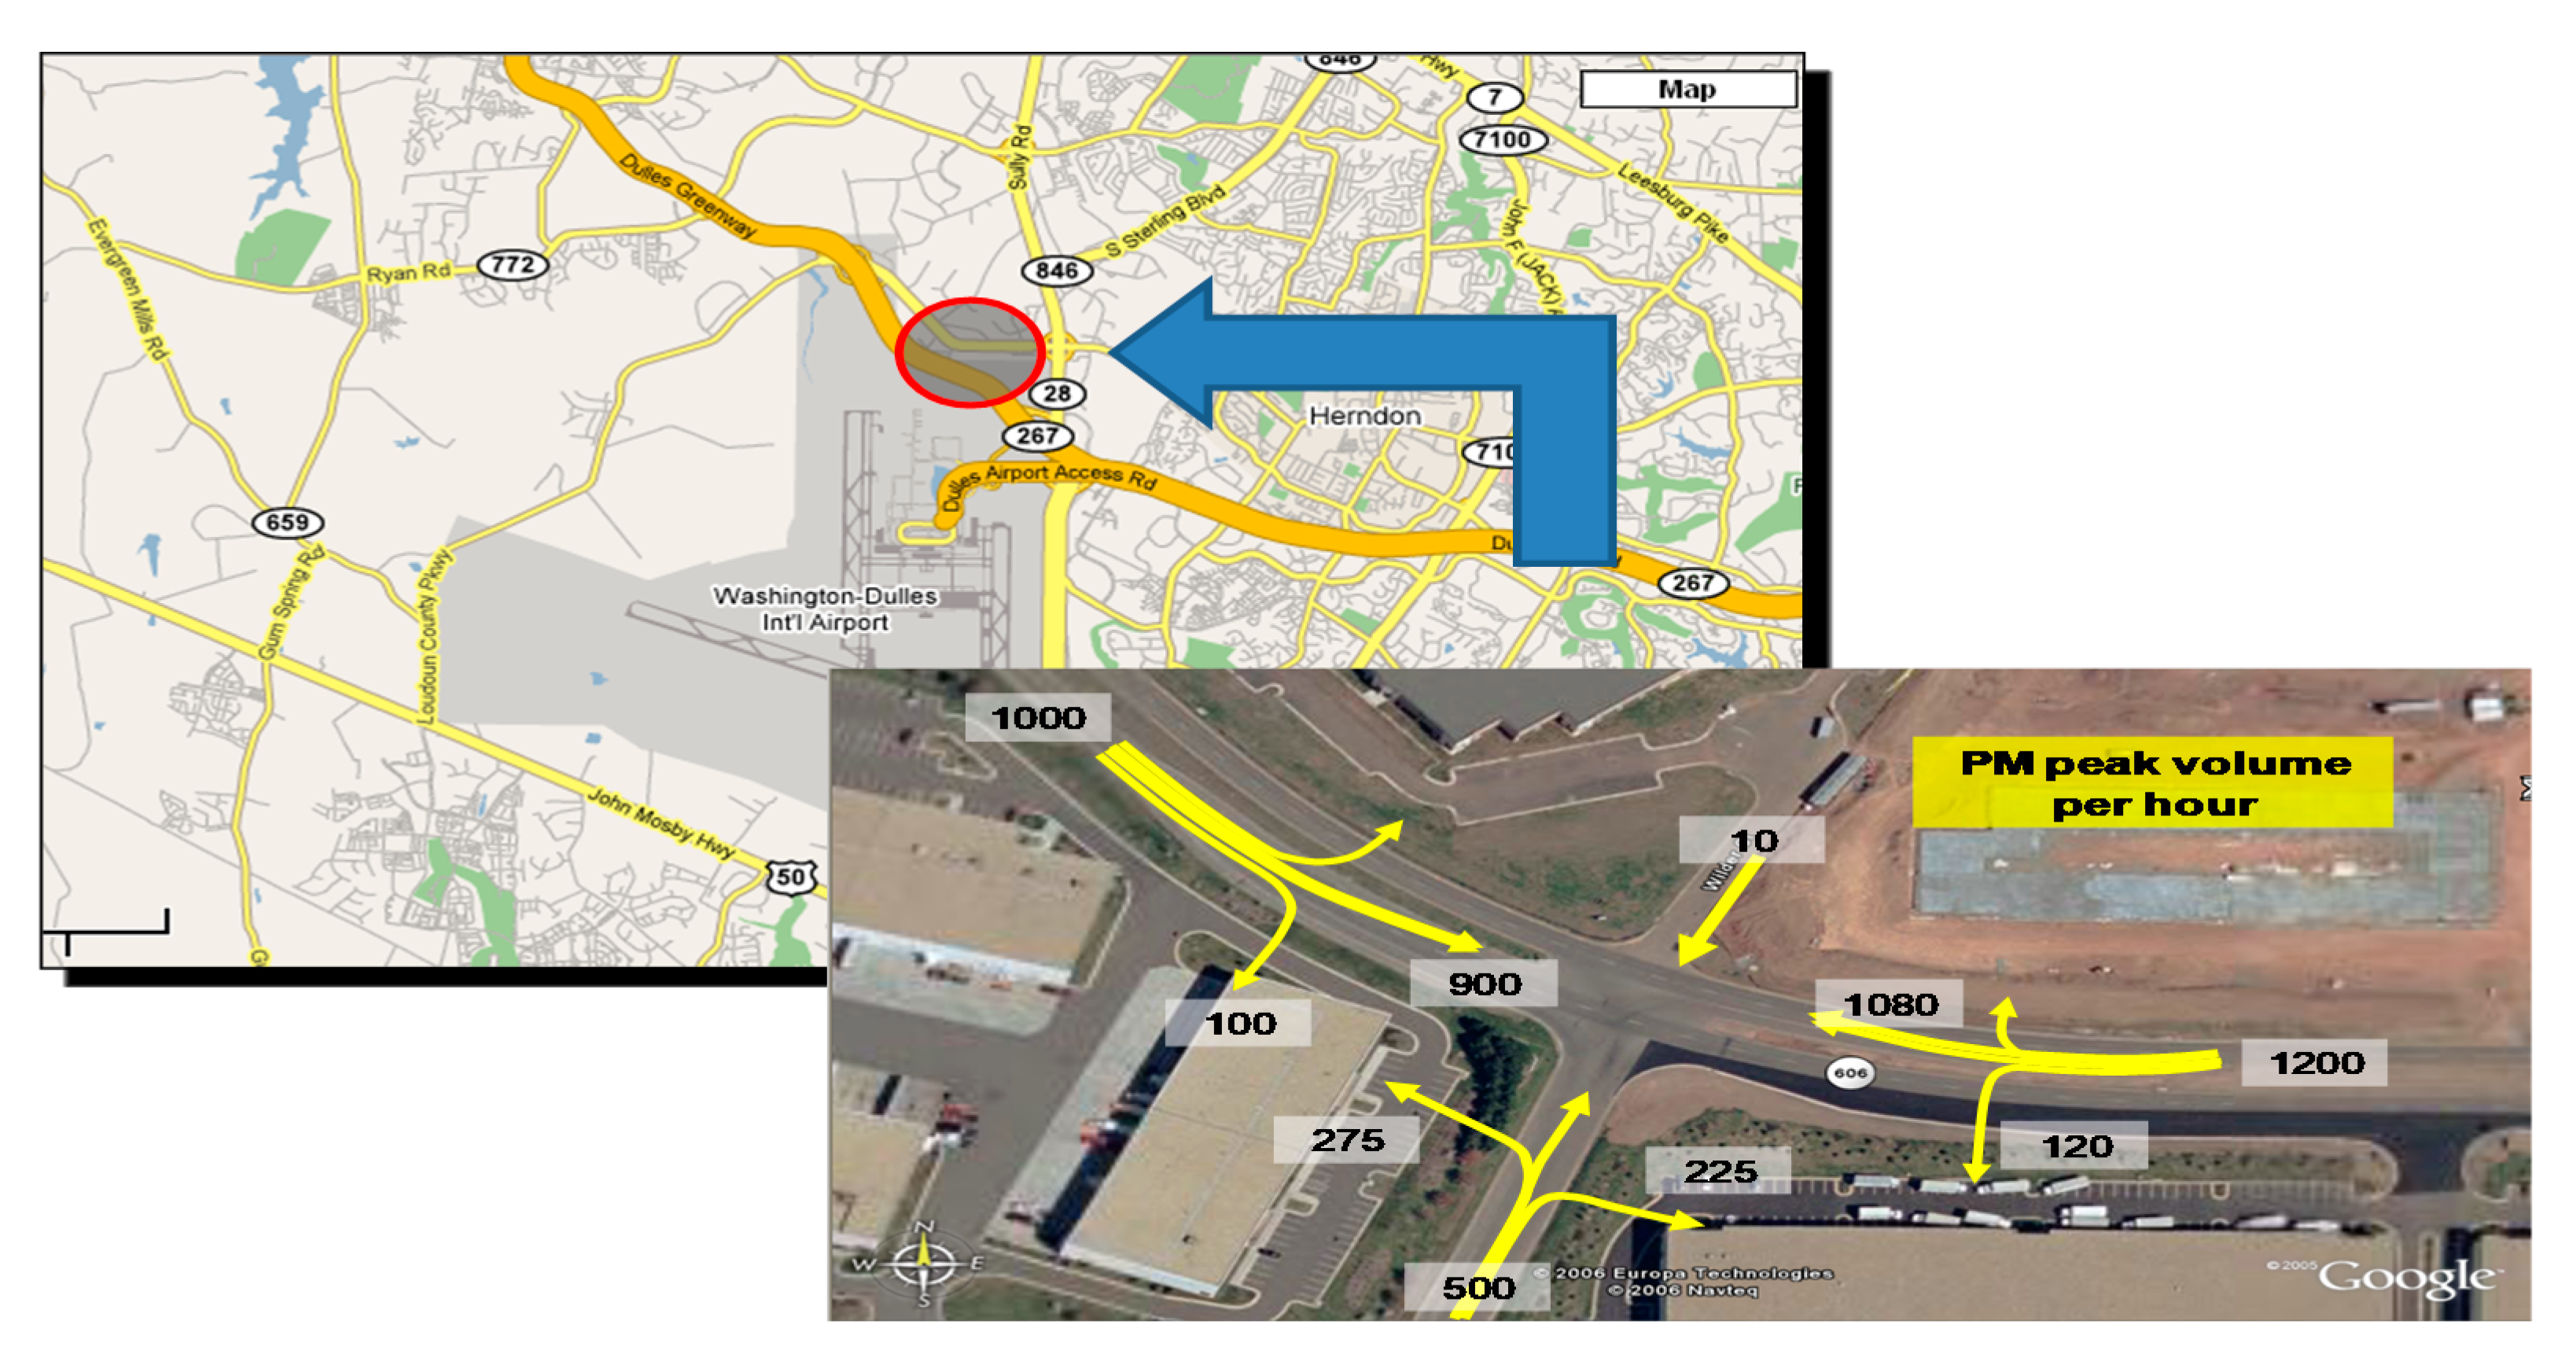
Driving behavior and deceleration/acceleration events were modeled at a roundabout, a two-way stop sign, and a signalized intersection using INTEGRATION software. The intersection of Ariane Way and Virginia 606 in Loudoun County, Virginia—which is adjacent to the Washington Dulles Airport (
Figure 1)—was used as the case study site.
The test intersection is typically used as a substitute route for airport travelers. The speed limit is 88 km/h for eastbound and westbound and 40 km/h for northbound and southbound. Northbound and southbound traffic is controlled by two-way stop signs. The average afternoon peak hour traffic volumes are shown in
Figure 1. Virginia 606 is a four-lane corridor with an extra left-turn lane, and Ariane Way has two lanes. While traffic volume is low during non-peak hours, travel time and delays are significantly increased at the two-way, stop-controlled intersection during peak hours. The typical queue length at Ariane Way is from 10 to 15 vehicles and those vehicles make for unsafe gap-acceptance maneuvers through the high-speed approaching vehicles from eastbound and westbound directions.
We developed simulation models using parameters derived from field data, including speed, traffic volume, saturation flow rate, jam density, number of lanes, and lane striping data. We modeled a base saturation flow rate and a jam density of 1800 veh/h/lane and 120 veh/km/lane, respectively, for all links except the northbound approaches. Due to the aggressive driving behavior of the northbound approaches, we used a saturation flow rate of 2000 veh/h/lane. We set the base gap between 3 and 4 s to simulate the driver gap behaviors. We calibrated and validated the simulation model against collected field data. For signalized intersection scenarios, we designed two phase movements with a 35 s cycle length, which was estimated based on the traffic demand. For roundabout scenarios, we used an entry speed of 50 km/h and a diameter of 60 m, which were recommended in
Roundabouts: An Information Guide [
20].
The BEVs’ energy consumption was estimated using VT-CPEM from individual second-by-second profiles of vehicle speed that were generated using the INTEGRATION simulation. The ICEV fuel consumption was generated directly from the INTEGRATION software, since INTEGRATION includes the VT-Micro model. Three approach speeds, 56 km/h (35 mph), 72 km/h (45 mph), and 88 km/h (55 mph) were evaluated to identify the effects of different approach speeds.
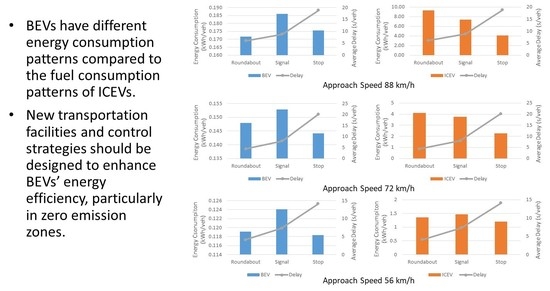
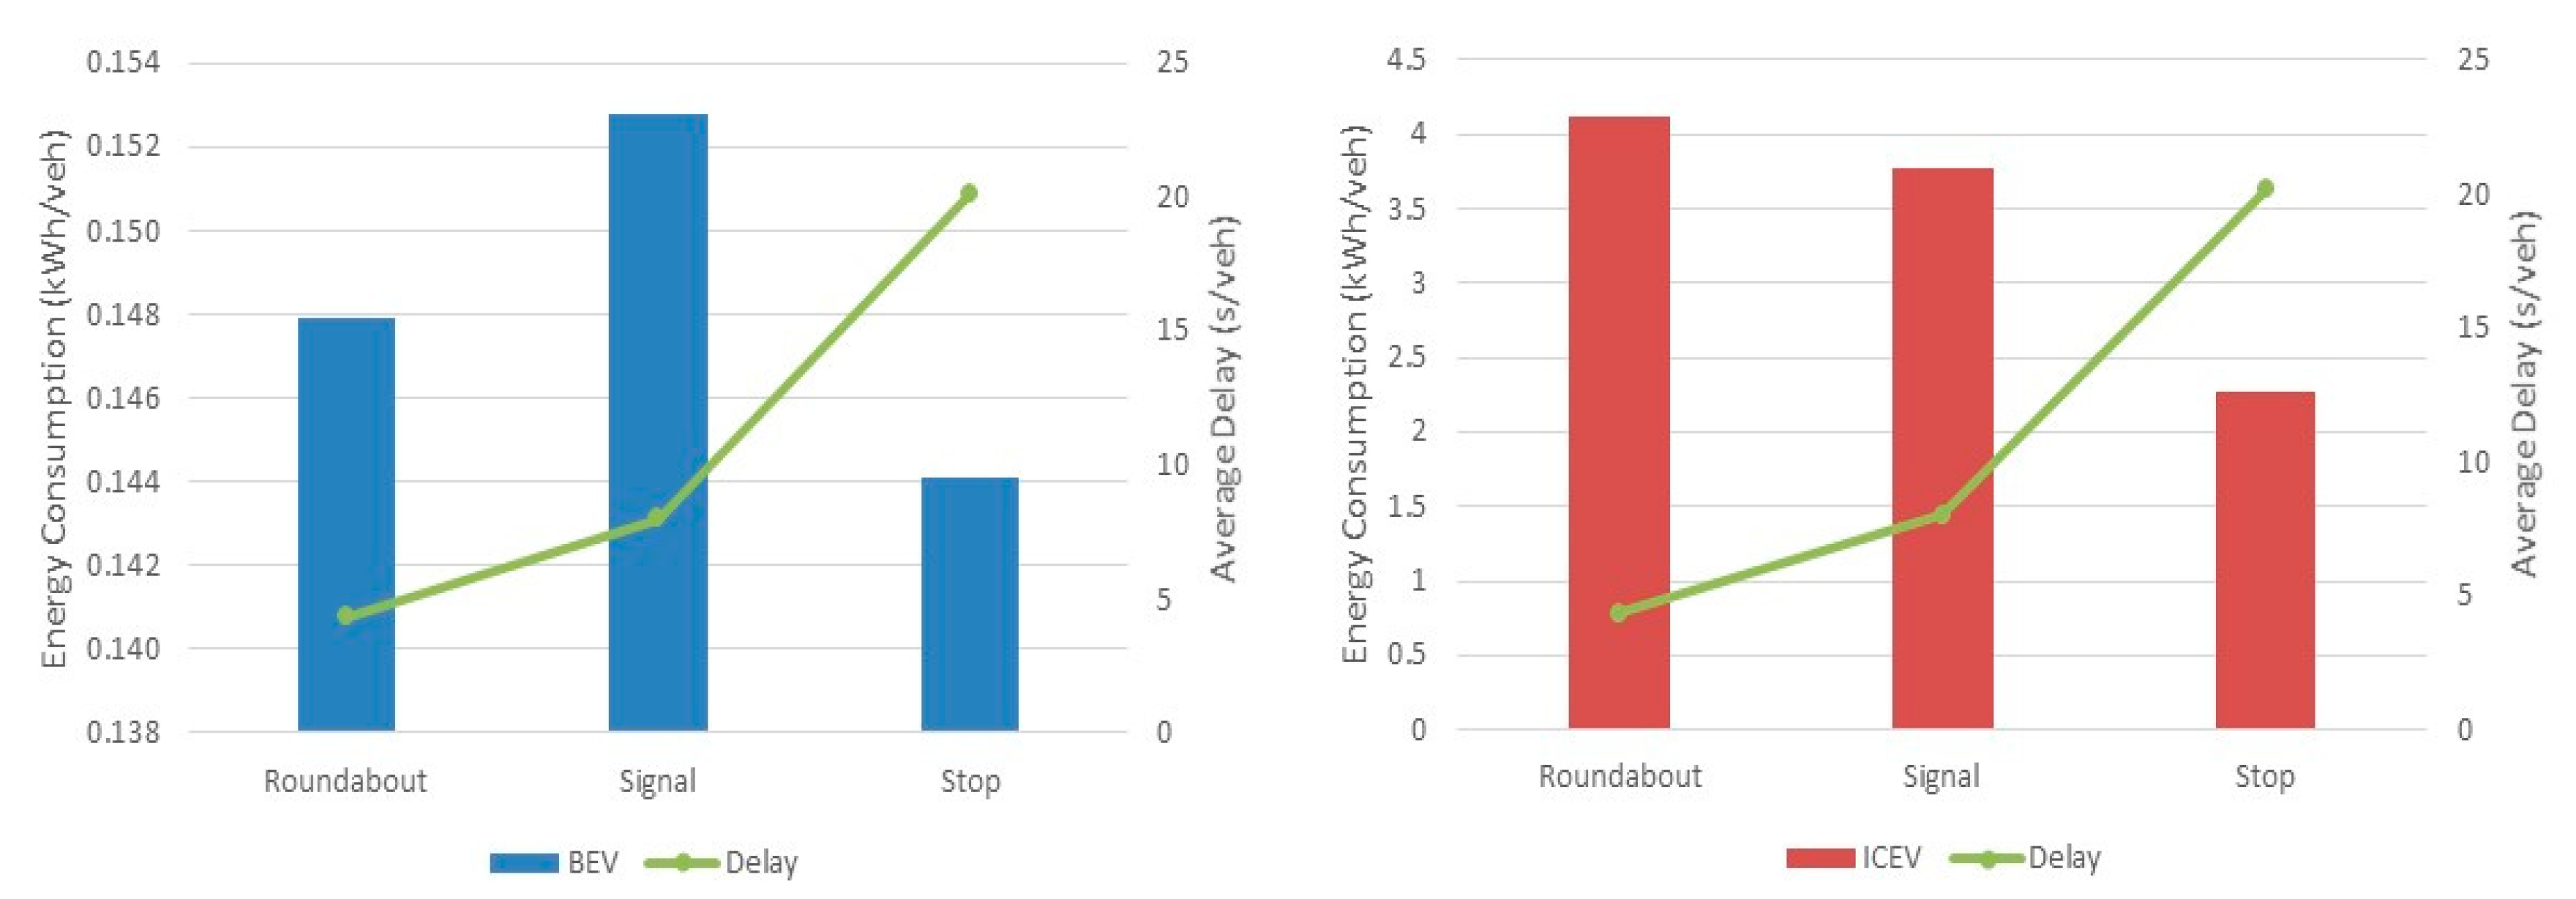
Figure 2 compares the simulated ICEV fuel consumption and BEV energy consumption at a roundabout, a signalized intersection, and a two-way stop-sign-controlled intersection for an approach speed of 88 km/h. BEVs and ICEVs clearly had different energy/fuel consumption patterns. We converted ICEV fuel consumption to a comparable energy consumption unit, kWh based on Reference [
21]. Based on the report, one liter of gasoline contains the energy equivalent to 8.9 kWh of electricity. The fuel consumption of ICEV increased by 126% and 79% when the stop-sign-controlled intersection was replaced with a roundabout and a signalized intersection, respectively. In contrast, for BEVs, the roundabout reduced energy consumption by 2.3% and 8.4% compared to the stop-sign-controlled and signalized intersections, respectively. The roundabout decreased total delay by 68% (from 18.81 to 6.07 s/veh) compared to the stop-sign-controlled intersection and by 45% (from 8.78 to 6.07 s/veh) compared to the signalized intersection. These results demonstrate that, for the modeled intersection, a roundabout would improve BEVs’ energy efficiency, whereas ICEVs would have better fuel economy at a two-way stop-controlled intersection.
Figure 3 illustrates BEV and ICEV energy/fuel consumption for different intersection controls with an approach speed of 72 km/h. For ICEVs, the results were similar to those obtained at the approach speed of 88 km/h; the stop-sign-controlled intersection was the most fuel efficient, while the roundabout led to the worst fuel economy. However, for BEVs, the stop-sign-controlled intersection was slightly more energy efficient than the other two control strategies, although the energy consumption was similar for all three control types (0.15, 0.15, and 0.14 kWh/veh for the roundabout, signalized intersection, and stop-sign-controlled intersection, respectively). The roundabout considerably reduced vehicle delay by 46% and 78% compared to the signalized and stop-sign-controlled intersections, respectively.
The BEV and ICEV energy/fuel consumption levels at the different intersections are shown in
Figure 4 for an approach speed of 56 km/h. For ICEVs, the stop-sign-controlled intersection was the most fuel efficient, while the signalized intersection was the least fuel efficient. For BEVs, the energy efficiencies were nearly identical (0.12 kWh/veh) for all three control strategies. As for the other approach speeds, the roundabout was the most efficient intersection control type in terms of vehicle delay.
The simulation results for all evaluated approach speeds show that the roundabout significantly reduced vehicle delay compared to the signalized and stop-sign-controlled intersections. For ICEVs, the stop-sign-controlled intersection significantly reduced fuel consumption compared to the other two control methods at all three approach speeds, and the roundabout resulted in the worst fuel efficiency at approach speeds of 88 and 72 km/h. The ICEVs’ higher fuel consumption in the roundabout resulted from the acceleration of vehicles leaving the roundabout. A vehicle entering a roundabout must yield or stop before entering the roundabout; thus, after negotiating the roundabout, the vehicle must accelerate to full speed upon exiting, increasing the rate of fuel consumption. Acceleration rate is one of the most important contributors to vehicle fuel consumption [
19,
22].
Compared to ICEVs, BEVs’ energy consumption patterns were significantly different. For example, at an approach speed of 88 km/h, the roundabout was the most energy-efficient intersection, whereas the stop-sign-controlled intersection resulted in the lowest electricity usage at the approach speed of 72 km/h. Nonetheless, the differences in BEV energy consumption between the different intersection types were relatively small compared to the fuel consumption of ICEVs. These results can be explained by the energy BEVs regenerate during deceleration.
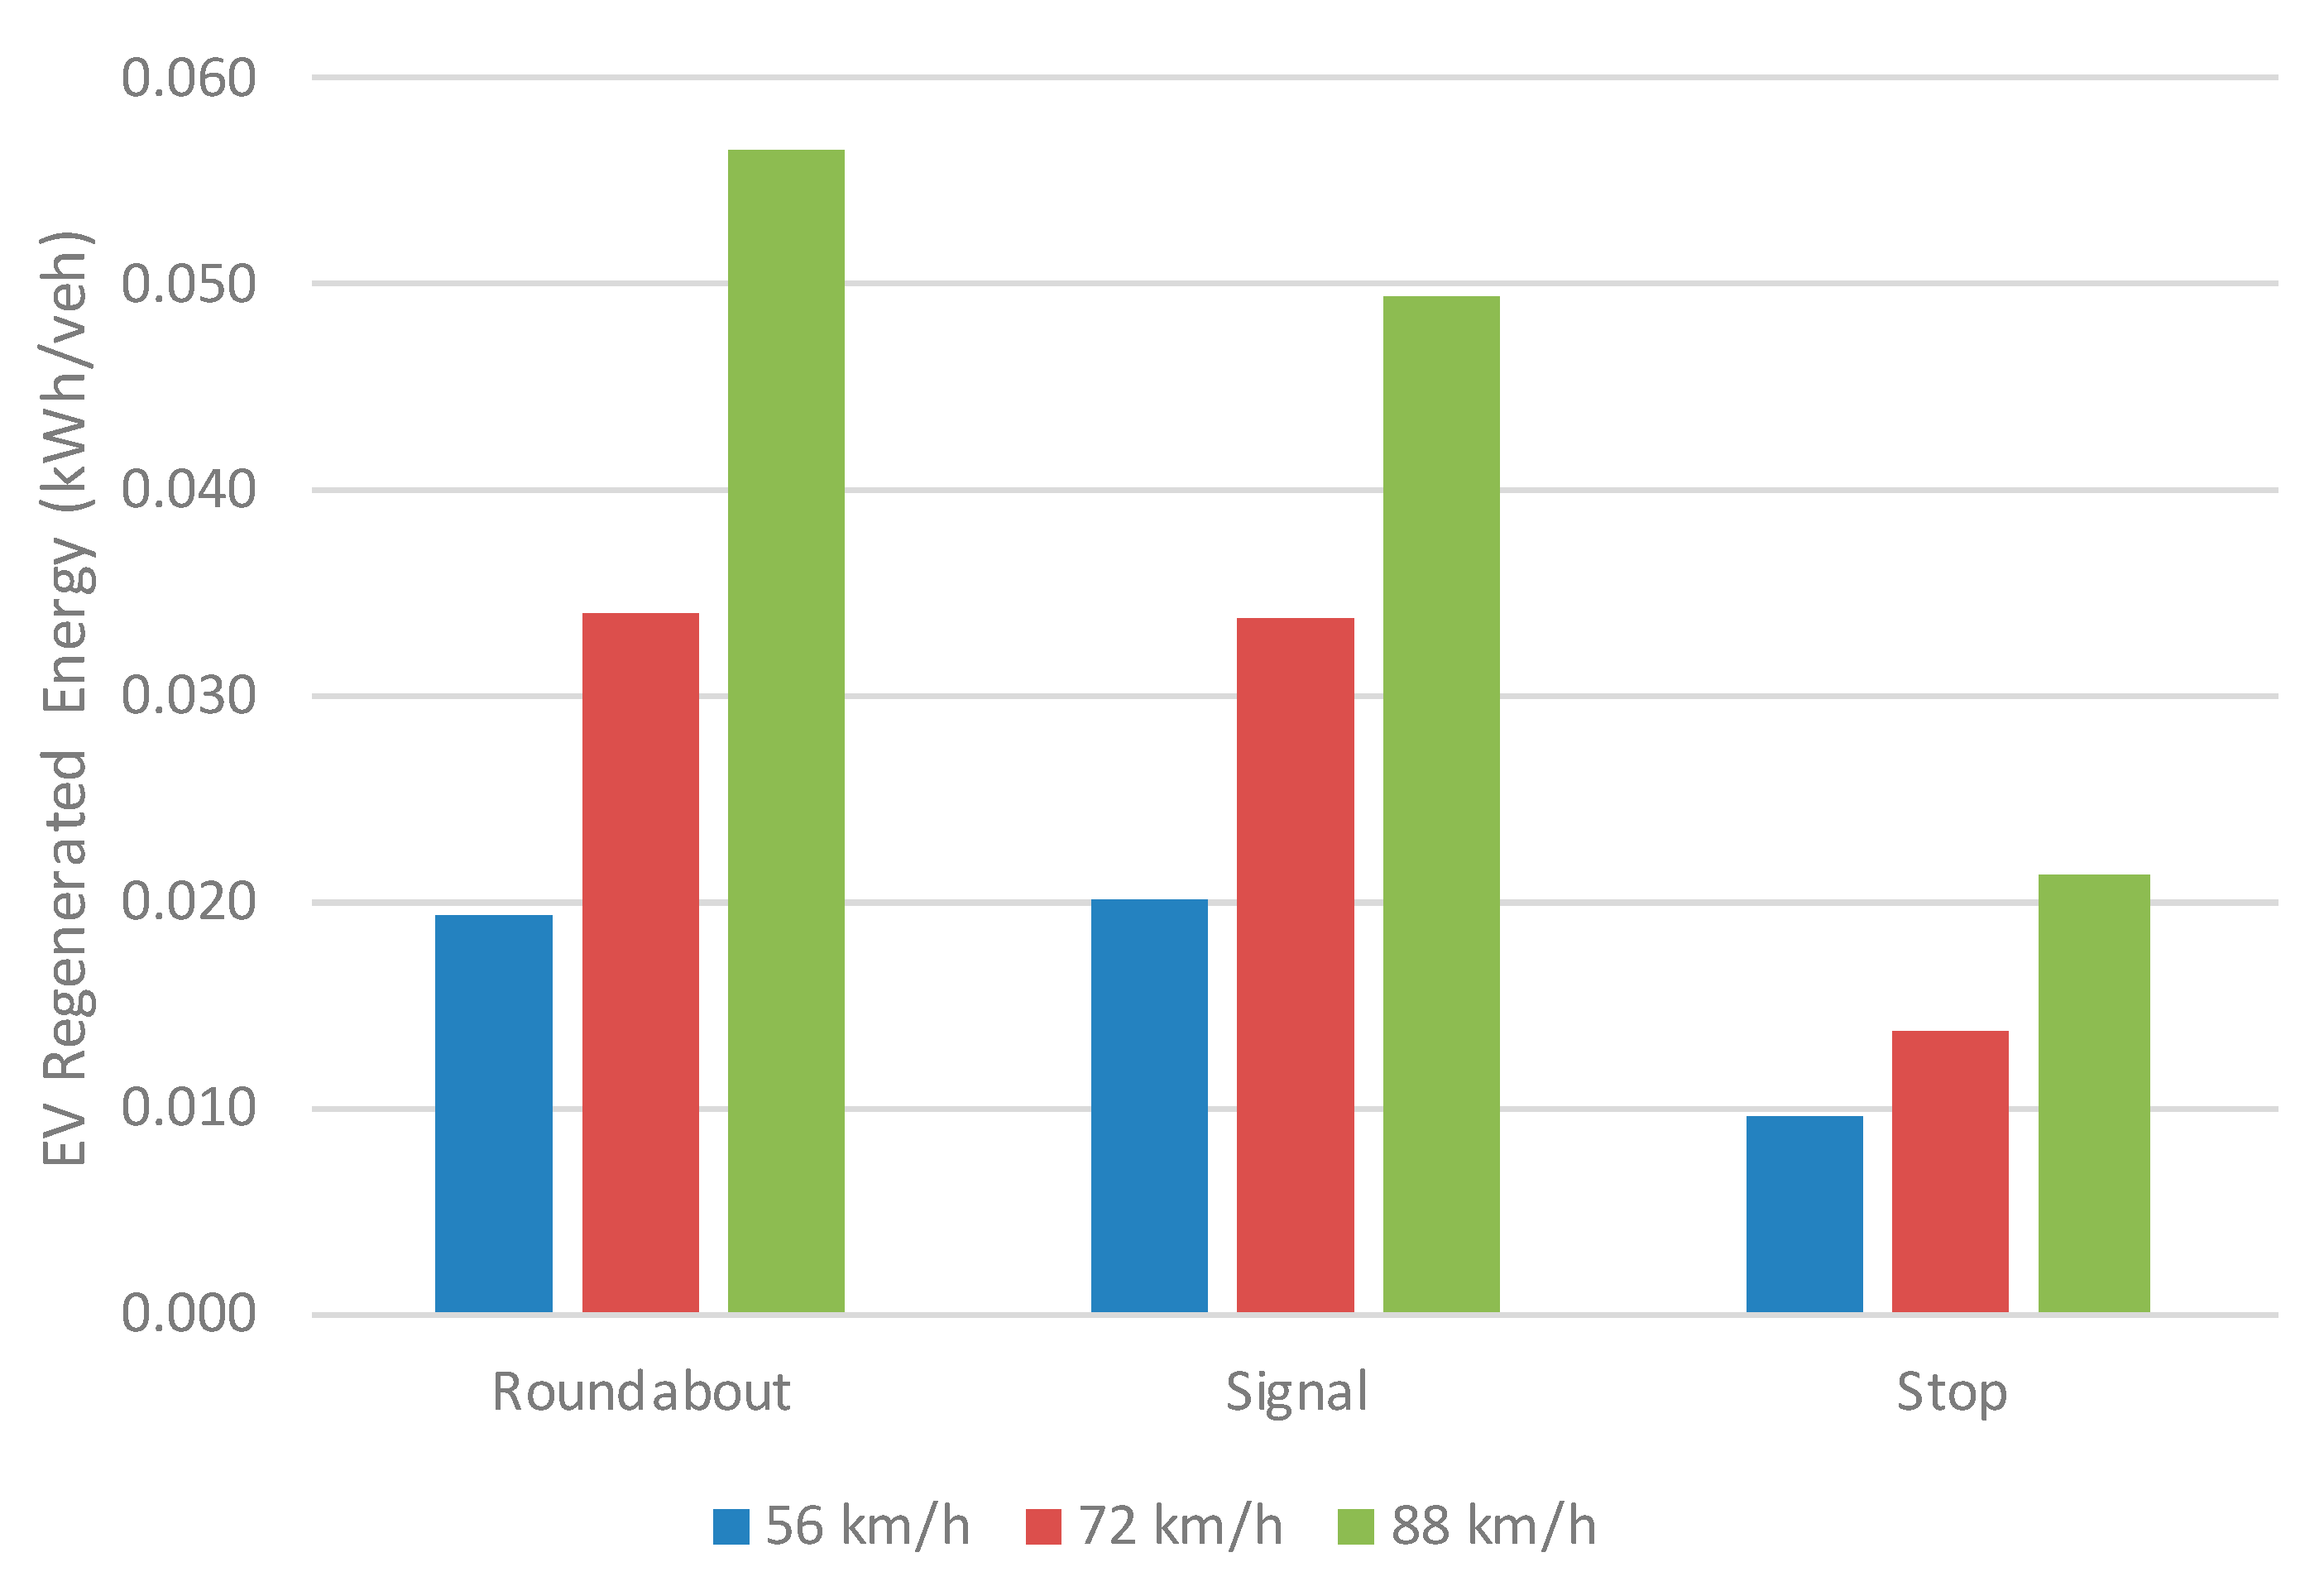
Figure 5 illustrates the average recovered energies corresponding to the three intersection controls at different approach speeds. The regenerative energy produced increased with increasing approach speed. For the roundabout, BEVs generated 193% more regenerative energy at an approach speed of 88 km/h compared to an approach speed of 56 km/h.
Figure 5 also demonstrates that BEVs recovered more energy at the roundabout compared to the signalized and stop-sign-controlled intersections.
Table 1 shows the percentage of regenerated energy compared to total BEV energy consumption. For example, BEVs recovered 32.9% of the total energy through regenerative energy at the roundabout with an approach speed of 88 km/h. These results indicate that regenerative energy is critical to BEVs maintaining their energy efficiency at roundabouts.
3.2. Analysis of Various Traffic Signal Coordination Plans
The effects of various signal coordination plans on BEV and ICEV energy/fuel consumption were also investigated. A previous study found that good traffic signal coordination can significantly reduce fuel consumption and ICEV emissions [
14].
Figure 6 illustrates a sample corridor with three intersections and four links. Each link was 0.5 km in length which is a reasonable intersection length in an urban area. The demand from the start node to the end node was 1200 veh/h. The last vehicle injected into the simulation departed 15 min from the beginning of the simulation. A free speed of 80 km/h was applied to the entire corridor. This scenario was meant to show how a signal coordination plan can affect the energy/fuel consumption in a specific corridor. To evaluate the effects of signal coordination in this study, three scenarios were adopted: (1) a poorly coordinated fixed-time signal plan, (2) a partially coordinated fixed-time signal plan, and (3) a well-coordinated fixed-time signal plan. Each traffic signal had a 60 s cycle length, 30 s effective green time, and a 2.5 s effective lost time.
Figure 7 illustrates the effects of different signal coordination plans on BEV and ICEV energy/fuel consumption and vehicle delay. As expected, the well-coordinated signal plan significantly reduced vehicle delay from 72.64 s to 15.51 s compared to the poorly coordinated signal plan. The well-coordinated signal plan also reduced vehicle delay by 26% compared to the partially coordinated signal plan.
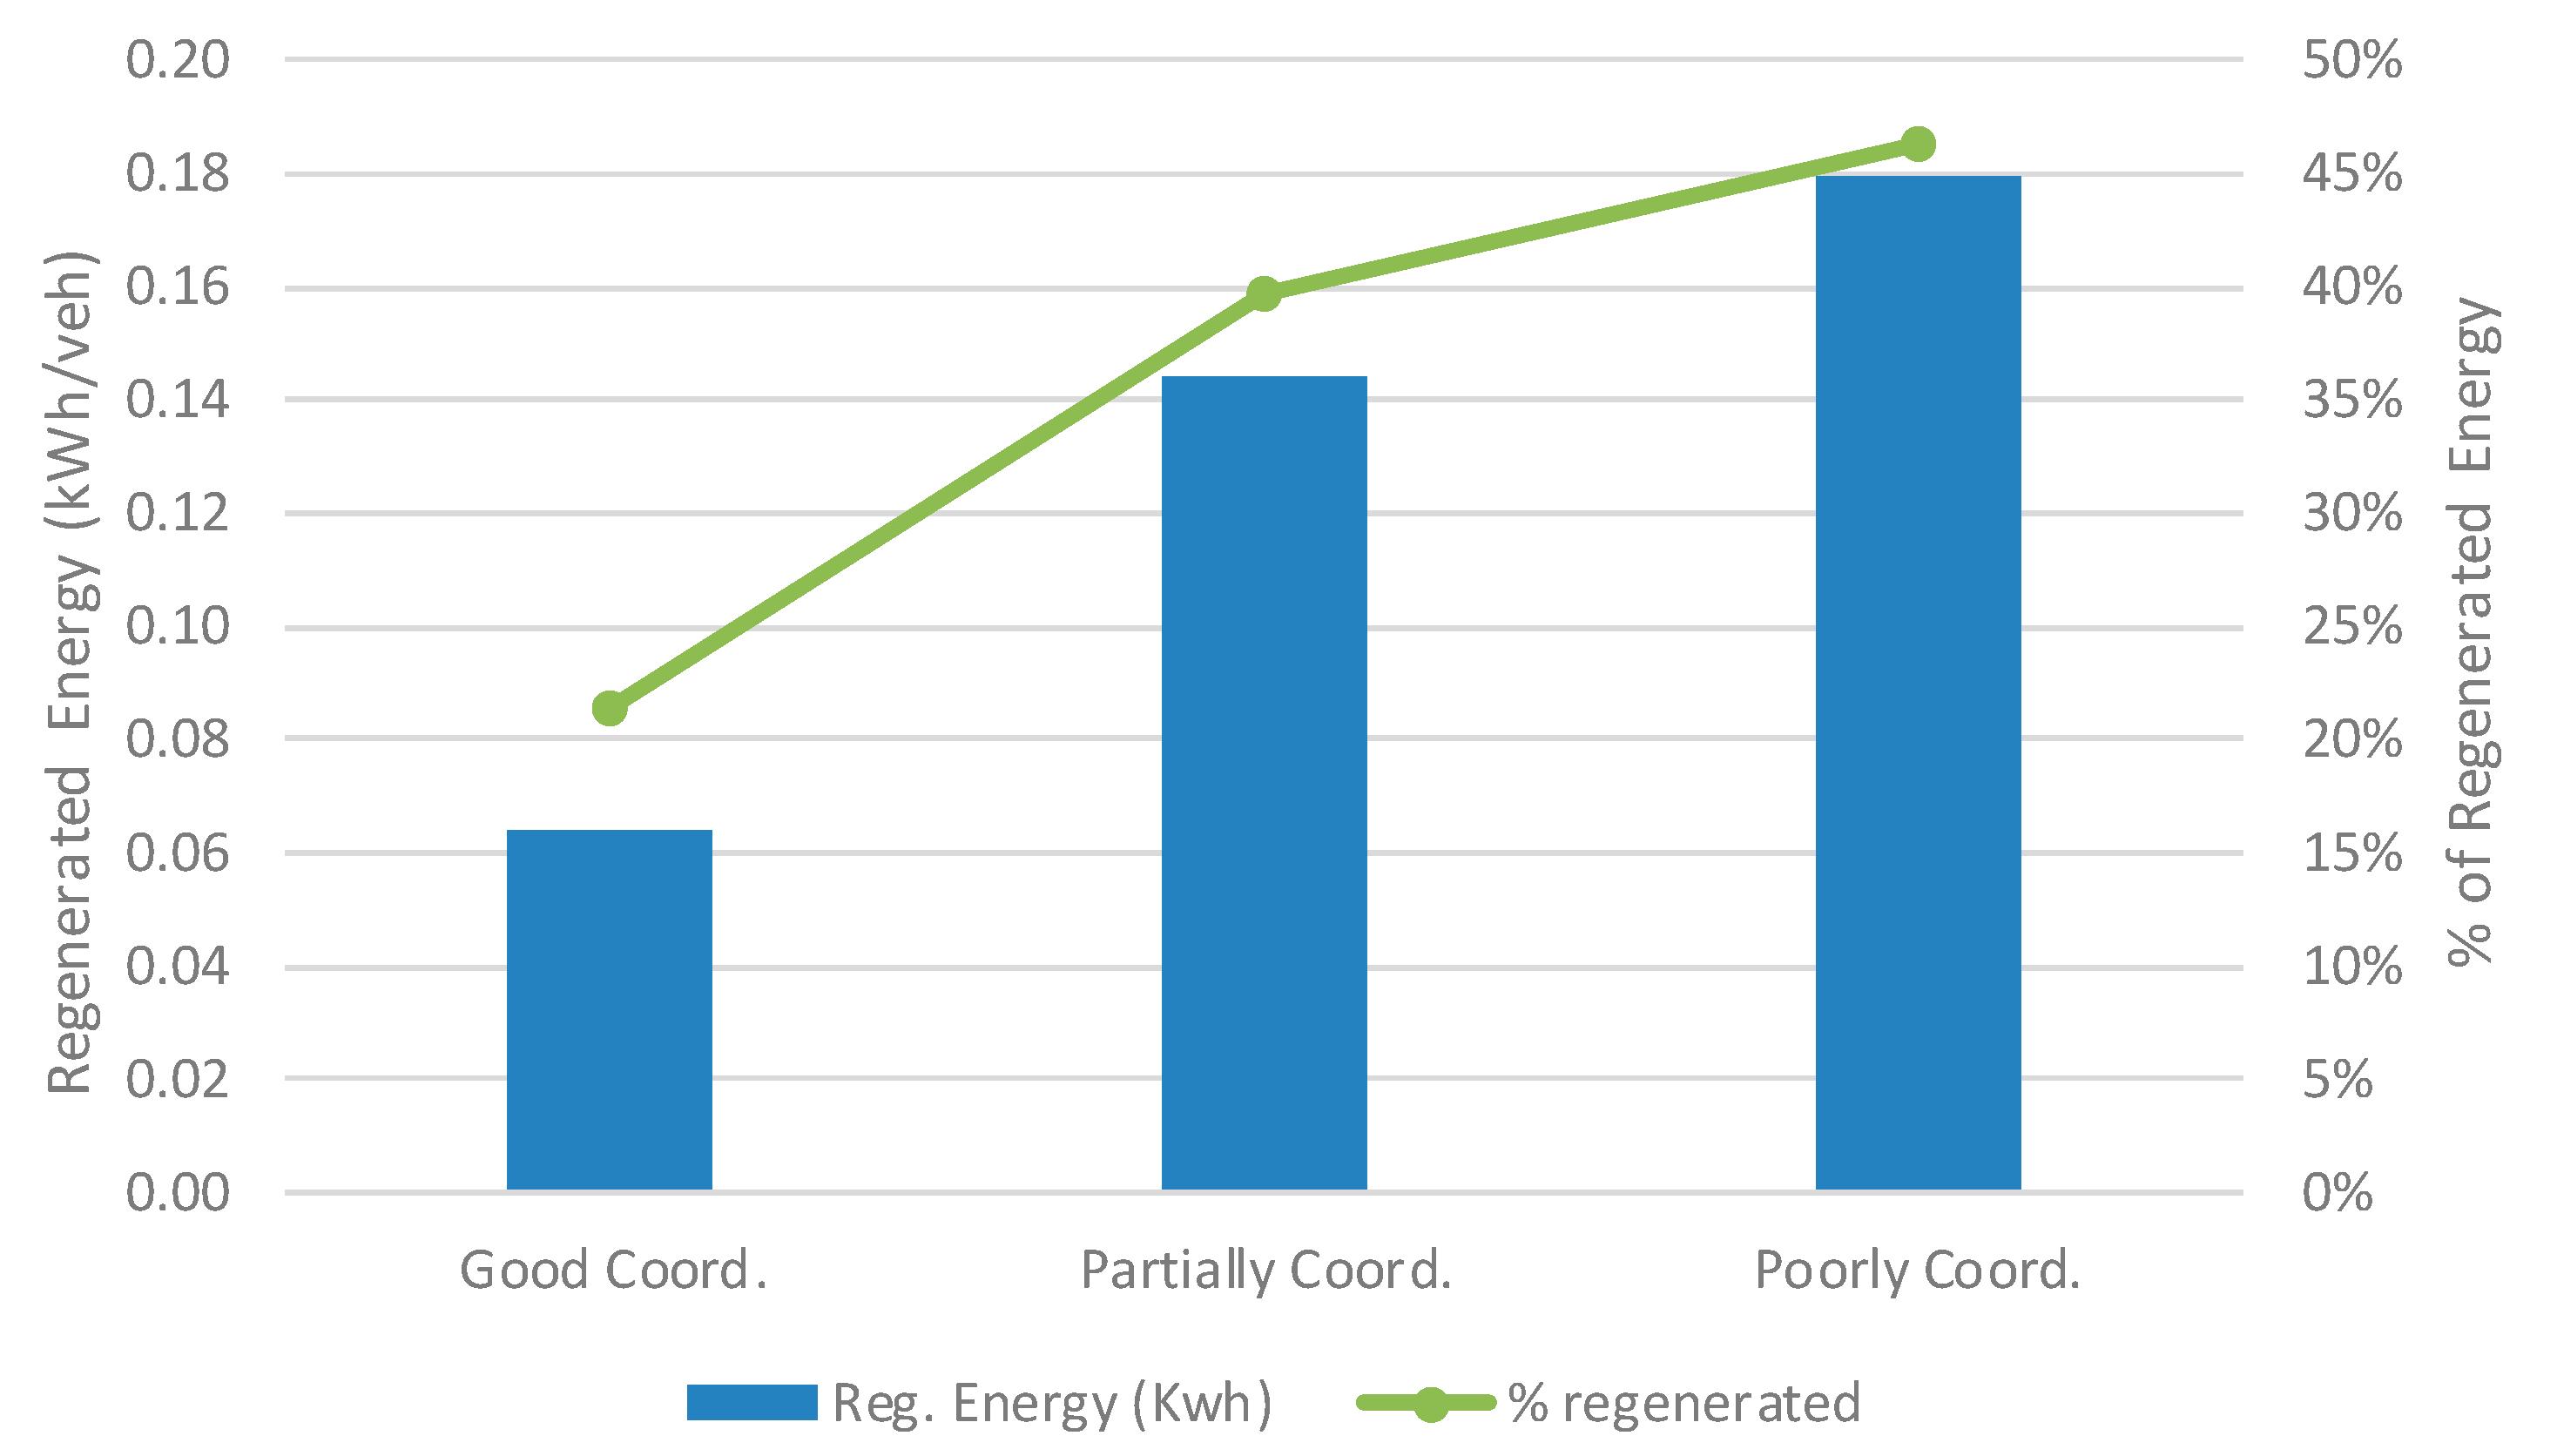
Figure 7 also shows that the well-coordinated signal plan improved energy/fuel efficiency in both ICEVs and BEVs. In particular, ICEVs’ fuel consumption was reduced by 28% and 35% compared to the partially coordinated and poorly coordinated signal plans, respectively, while BEVs’ energy efficiency was improved by 17% and 20%, respectively. These results indicate that BEVs’ energy consumption was less sensitive to signal coordination than ICEVs’ fuel consumption, since BEVs produced more regenerative energy on the corridors with partially and poorly coordinated signal plans. The BEVs recovered 21%, 40%, and 49% of total energy through regenerative braking for the well-coordinated, partially coordinated, and poorly coordinated signal plans, respectively, as illustrated in
Figure 8.
4. Conclusions and Recommendations for Future Research
This study investigated the effects of different intersection controls (i.e., a roundabout, traffic signal, and stop sign) and signal coordination plans (i.e., well-coordinated, partially coordinated, and poorly coordinated) on BEV and ICEV energy/fuel consumption. The second-by-second speed profiles of individual vehicles were derived from a traffic simulation model, and the speed profiles were utilized as inputs to estimate ICEV fuel consumption and BEV energy consumption using microscopic fuel consumption and energy models.
The results indicate that the most energy/fuel efficient traffic controls are different for BEVs and ICEVs. For BEVs approaching an intersection at a speed of 88 km/h, the roundabout was the most energy-efficient intersection control, while the stop sign was the least energy efficient. In contrast, for ICEVs at the same approach speed, the two-way stop sign was the most fuel-efficient control, while the roundabout was the least fuel efficient. The BEV and ICEV energy/fuel consumption patterns also differed at other approach speeds (72 and 56 km/h). For BEVs, the energy consumption at all intersection control types was similar, while for ICEVs, stop-sign-controlled intersections significantly reduced fuel consumption compared to the other two intersection types.
The ICEVs’ higher fuel consumption levels at roundabouts resulted from acceleration leaving the roundabout, as acceleration rate is a major contributor to vehicle fuel consumption. The BEVs’ energy consumption levels were less affected by the intersection control strategy than were ICEVs’. This can be attributed to the energy regenerated by BEVs during deceleration; BEVs recovered 32.9% of the total energy through regenerative braking at the roundabout for an approach speed of 88 km/h, thereby improving overall energy efficiency.
The effects of different signal coordination plans on energy/fuel consumption were also investigated for BEVs and ICEVs. Both BEV and ICEV energy/fuel efficiency was improved by the well-coordinated signal plan. Signal coordination had a weaker effect on energy efficiency in BEVs compared to ICEVs, because BEVs produced more regenerative energy on corridors with partially and poorly coordinated signal plans. The study found BEVs recovered 21%, 40%, and 49% of total energy through regenerative braking on the corridors for well-coordinated, partially coordinated, and poorly coordinated signal plans, respectively.
In summary, this study demonstrated that regenerative energy in BEVs is a critical factor in energy efficiency. Among the tested intersection controls, BEVs recovered the largest amount of energy at the roundabout for the studied intersection site. The market penetration rate of BEVs has increased sharply in recent years, and the number of BEVs on the road is expected to continue to increase in the near future. Recently, a number of transportation researchers and engineers have developed fuel-efficient transportation facilities and control strategies to improve fuel economy and reduce ICEV emissions. The findings of this study suggest that transportation facilities and control strategies should be designed to enhance BEVs’ energy efficiency, particularly in zero-emission zones [
23], where only BEVs can be utilized. Furthermore, the findings of this study can be used in the development of energy-efficient routing strategies. For example, the routing of BEVs might entail sending the vehicles through roundabouts, whereas the routing for ICEVs might send the vehicles through two-way stop sign intersections.
Future research will investigate the effects of combinations of various vehicle types, different demand levels, and more facility types on BEVs’ energy consumption. The development of a multimodal traffic signal control system that can improve both BEV and ICEV energy/fuel efficiencies is also recommended.


