Abstract
The paper presents the study of an anti-lock braking system (ABS) that has been complemented by a fuzzy controller. The fuzzy controller was used to improve the braking performance of the vehicle, particularly in critical situations, for example, when braking a vehicle on wet road. The controller for the ABS was designed in the MATLAB/Simulink program. The designed controller was simulated on a medium-size vehicle model. During testing, three braking systems were simulated on the vehicle model. We compared the performance of a braking system without an ABS, a system with a threshold-based conventional ABS, and a braking system with the proposed ABS with a fuzzy controller. These three braking systems were simulation tested during braking the vehicle on a dry straight road and on a road with combined road adhesion. A maneuverability test was conducted, where the vehicle had to avoid an obstacle while braking. The results of each test are provided at the end of the paper.
1. Introduction
The increasing number of cars on the roads and the related rising accident rate have brought the concept of road safety to the forefront. The primary safety objective is to protect the health and lives of passengers and minimize the consequences of an accident. In order to achieve this goal, various security features are being applied in vehicles. They can be divided into two groups:
- (1)
- Active safety features.
- (2)
- Passive safety features.
One of the most important active safety features includes the braking system of the vehicle, which is considered to be the most important system in the vehicle, as safe stopping or slowing down of the vehicle is one of the ways of accident prevention. Since its introduction, the braking system has undergone numerous improvements, one of them being the application of the ABS. The anti-lock braking system (ABS), which has been developed and implemented from the late 1970s, prevents the wheels from locking during braking of the vehicle, and thereby, allows the driver to maintain control over steering [1]. Although this vehicle safety system has been used for decades, it is constantly being improved using either conventional or intelligent control methods [2].
Several studies have been published that focus on optimizing the vehicle’s braking system using various strategies, both for vehicles with internal combustion engines and electric vehicles. For electric vehicles, the most commonly applied method is regenerative braking control. The authors of paper [3] present regenerative braking control strategy intended to improve braking performance while maximizing braking energy recovery. Application of fuzzy logic rules enables the optimization of regenerative braking in order to achieve better braking performance. This issue is addressed in paper [4], where the rules of fuzzy logic were used to optimize the slip parameter of a sliding mode controller and to thereby achieve a shortening of the vehicle’s braking distance and an increase in the energy efficiency of regenerative braking.
As shown in several studies [5,6,7,8,9,10,11,12], the use of fuzzy logic rules in different ways of controlling the ABS has improved the braking performance of the vehicle in simulations on different road surfaces. Another possible approach to optimizing the braking performance of a vehicle is to use fuzzy logic to optimize the parameters of conventional methods of controlling ABSs. In paper [13], the authors present the achievement of optimal slip rate parameters using fuzzy logic. The presented simulation results prove the improved maneuverability and stability of the vehicle. In paper [14], the authors deal with the optimization of braking properties and shortening of vehicle braking distance using a PID-fuzzy controller with parameter adaptation.
Using fuzzy logic is not the only way to improve the vehicle ABS. The application of artificial neural networks to optimize the rules of the fuzzy controller [15], or as observers, or the implementation of neuro-controllers as such, seem to be suitable alternatives. Comparison of various strategies [16] and selection of the most appropriate method or combination of methods can result in optimization of the ABS performance, and thus, in the improvement of vehicle safety.
Mathematical modeling and simulation are powerful tools in the initial stages of research and in the verification of hypotheses, which is sometimes not possible to implement in practice, be it for safety, for physical or other reasons [17,18]. Therefore, in our design, we used a combination of two simulation tools, MATLAB/Simulink and CarSim, which allowed detailed setting of the vehicle parameters and simulation in different environments. Suitable setting and interlinking with other software, such as MATLAB/Simulink, provides the opportunity of testing vehicle performance in real time. Using the CarSim simulation software enables the verification of vehicle performance in situations where failure could have destructive consequences or even result in loss of life.
2. ABS—Anti-Lock Braking System
In terms of control, the ABS represents a feedback control system that controls brake pressure based on measuring wheel deceleration, and thereby, maintaining wheel slip at optimum value. The basic idea is the use of friction properties of tires on the road surface. As a result of the transmitted longitudinal friction force during braking, deformation and slipping of the individual parts of the tire tread on the road will occur. The result is that during braking, the wheel rotates more slowly than would correspond to the vehicle speed, so it rotates with specific slips. The maximum braking force that a tire is able to transfer onto the concrete road surface is highly dependent on this very specific slip of the wheel. The braking force reaches maximum at the specific value of slip and a further increase in slip reduces the braking force. At maximum value of brake force on normal road surfaces, using normal tires, the specific slip is in the range of 15–20%.
The ABS ensures that even at maximum braking (maximum pressure of the driver on the brake pedal), the specific slip of the wheel does not exceed the said range of 15–20%. This ensures that the vehicle is braked with maximum efficiency, i.e., on the shortest path, plus the transferable lateral forces are in the area of specific slip and are even large enough to allow the correction of direction during braking, in case the vehicle has to get round an obstacle [19,20,21].
2.1. Tire Slip Characteristics
Tire slip characteristics are described by curves that characterize the longitudinal and lateral forces that are transmitted onto the road by the tire at various slips of the tire. The tire slip characteristic shown in Figure 1 presents a typical course of the longitudinal and lateral forces.
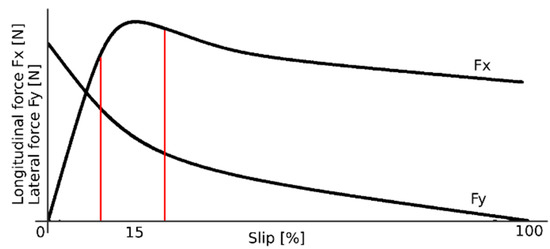
Figure 1.
Slip characteristics of tires with radial construction.
The longitudinal forces Fx are the braking and driving forces that a tire can transfer onto the road under various slip values. The lateral forces Fy are forces that a tire transfers onto the road when the vehicle is changing direction. Figure 1 demonstrates the size of the braking (driving) force and the lateral force that a tire can transfer onto the road at various slips [22,23].
Slip λ is calculated according to the equation:
where:
- v
- is vehicle velocity,
- ω
- is angular velocity of tire,
- Rω
- is tire radius.
2.2. Vehicle Braking System
The principle scheme of the braking system used for simulation is shown in Figure 2.
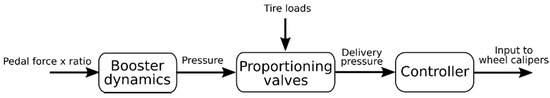
Figure 2.
Basic scheme of the vehicle brake system.
The input variable for the vehicle braking system is the force exerted on the brake pedal by the driver—the pedal force. The force that enters the master cylinder is multiplied by the mechanical transmission brake pedal—ratio.
where:
- Fpedal
- is the pedal force,
- ratio
- is the mechanical transmission brake pedal,
- Fin
- is the force entering the brake booster.
The pressure of the master cylinder is calculated according to the equation:
where:
- FMC
- is the master cylinder output force,
- D
- is the diameter.
The braking torque depends on the pressure in the brake cylinders and the temperature of the brake disc. The calculation of brake disc temperature uses the input energy from the braking torque, the rotational speed and the energy loss due to cooling. Input energy is dependent on brake torque and wheel speed. Output energy loss due to cooling is dependent on the cooling coefficient as a function of vehicle speed, brake disc weight, specific heat of the wheel as a function of the temperature of the wheel, brake disc temperature and air temperature.
The output heat change (ΔT) is calculated according to:
where:
- ∆T
- is output heat change,
- Ein
- is input energy,
- Eout
- is output energy,
- Md
- is brake disc weight,
- Cp(Td)
- is specific heat of the wheel as a function of the temperature of the wheel.
First order delay is applied to the brake booster. It is a specific time constant that depends on whether the brake pedal is pressed or released. Consequently, the brake pressure is transferred through proportioning valves to the brake cylinders of the wheels as the supply pressure, which together with other parameters generates the mechanical braking torque, as demonstrated in Figure 3. This type of brake system was used for simulation in the CarSim program.
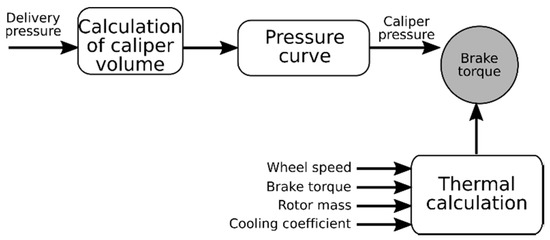
Figure 3.
Brake system—basic scheme of generating mechanical braking torque.
2.3. Basic Model of ABS Control
The input to the ABS controller is the vehicle speed and the equivalent speeds of the individual wheels. These speeds are processed in the controller and slip is evaluated on their basis. The output of the controller are then values from −1 to 1 depending on the speed and slip. This dependence of the output values is shown in Table 1.

Table 1.
ABS controller logic.
The basic block diagram of the ABS control model used in the CarSim program is shown in Figure 4.
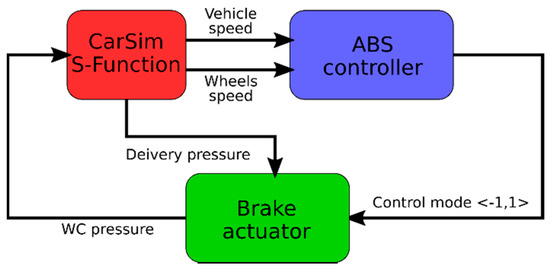
Figure 4.
Block scheme of ABS control model.
3. Fuzzy Control of ABS
The fuzzy control of the ABS is based on a conventional ABS complemented by a fuzzy controller. The design and the subsequent verification by simulation were carried out in CarSim and MATLAB/Simulink. The designed fuzzy ABS control system consists of three parts:
- (1)
- Speed controller.
- (2)
- Fuzzy controller.
- (3)
- Brake pressure control device.
The block model of the proposed fuzzy control is shown in Figure 5.
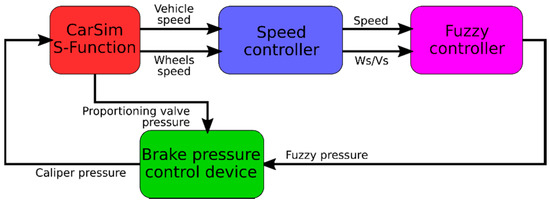
Figure 5.
Block scheme of ABS control with fuzzy controller.
The basic parameters for speed controller input were the values of vehicle speed and the speed values of individual wheels. As shown in Figure 6, the output of the speed controller is the value of the vehicle speed multiplied by a constant that modifies the speed value, and this then, becomes the input value to the fuzzy controller. Constant 1/200 was selected on the basis of the defined maximum speed 200 km/h. For tests involving a higher speed, this constant has to be modified. The second output is the ratio of the wheel speed and the vehicle speed. The ratio of vehicle speed and wheel speed can be in the range of values between 0 and 1, where value 0 represents an unblocked wheel (slip 0), and value 1 represents a blocked wheel (slip 1).
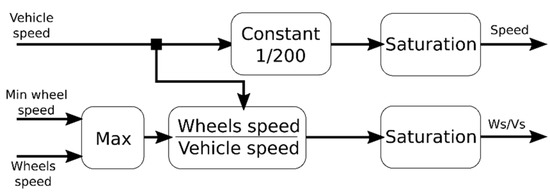
Figure 6.
Block scheme of the speed controller.
The input for the fuzzy controller, shown in Figure 7, is the modified vehicle speed and speeds of the individual wheels.
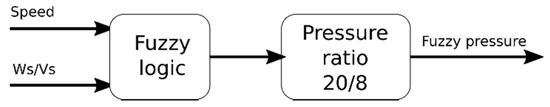
Figure 7.
Block scheme of the fuzzy controller.
The range of values for the first input is from 0 to 1. Zero value represents zero vehicle speed and 1 is the highest speed. The range of values for the second input can also be from 0 to 1. In this case, the 0 value represents zero slip and value 1 represents maximum slip value.
The fuzzy controller output value is in the range −1 to 1. Value 1 represents full brake pressure applied to the wheels and −1 represents the application of negative pressure, which means that the wheel is released. The constant output pressure ratio is 20/8 for the front/rear wheels. The constant ratio in favor of the front wheels was chosen in view of the fact that during braking, the vehicle weight is transferred forward and the rear wheels are relieved, which at full braking force would cause blocking of the wheels and subsequent loss of control over the vehicle. This ratio value has been taken as ideal from the CarSim brake pressure control actuator model. Since a fuzzy controller is used to control the braking force, a ratio of 20/8 was chosen as ideal for achieving the largest possible parameter of relative deceleration. The maximum pressure for the simulation was limited to 10 MPa. Table 2 shows the decision rules for the fuzzy controller setting.
Table 2.
Table of rules for the fuzzy controller.
Values of the individual variables for the FIS matrix shown in Figure 8 were selected on the basis of tire slip, which was set at 20%. At such slip, the vehicle is still operable even under heavy braking. A graph showing the dependence between vehicle speed, ratio of vehicle and wheel speed and the resulting pressure is presented in Figure 9.
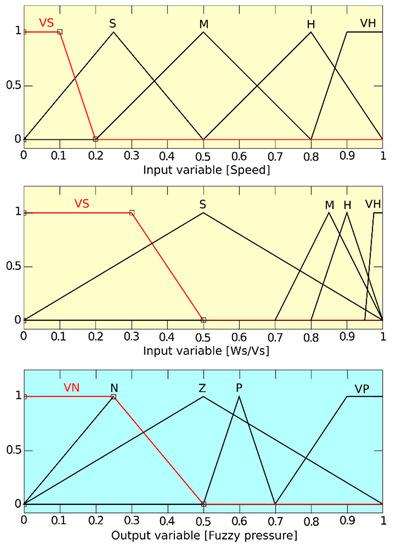
Figure 8.
Setting rules of FIS matrix for fuzzy controller.
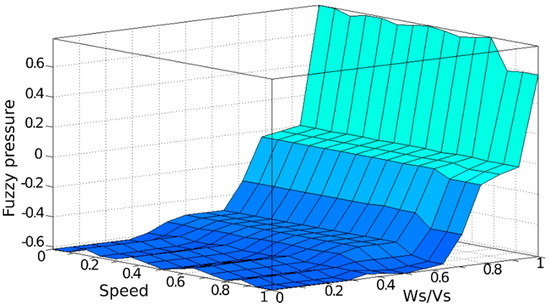
Figure 9.
Graph showing the dependence of output variable on the input variables in the fuzzy controller.
4. Braking Systems Comparison by Simulation
In order to verify the properties of the proposed ABS with the fuzzy controller, simulation tests were performed in the CarSim and MATLAB/Simulink programs. The simulation tests were performed on a medium-size category vehicle model with independent front and rear suspension. The vehicle had a 7-speed automatic transmission and the maximum engine torque was 534 Nm. During the simulation, the vehicle had 225/60/R18 radial tires.
The tests were performed for a given vehicle in three different combinations. A comparison was made of the vehicle’s braking behavior with a conventional threshold-based ABS, with the proposed ABS with a fuzzy controller designed to slip around 0.2, and with braking without an ABS, where the wheels were locked during braking.
The tests of these systems were carried out for the following operating states:
- (1)
- Dry road;
- (2)
- Road with combined adhesion;
- (3)
- Avoiding an obstacle on the road.
The results of each simulation test are presented below.
4.1. Vehicle Braking Systems Test on Dry Road
In this test, we observed the performance of individual braking systems when the vehicle was braking on a straight dry road. The test was performed for the initial vehicle speeds of 100 and 140 km/h. The results of the braking test for the individual braking systems from speed 100 km/h are shown in Figure 10 and Table 3.
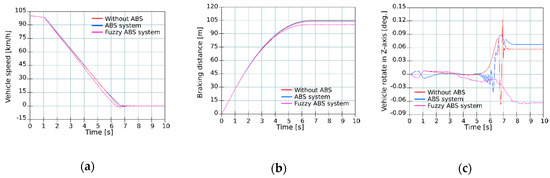
Figure 10.
Test on dry road at speed 100 km/h—(a) Speed curve; (b) Braking distance; (c) Vehicle rotation.
Table 3.
Test results on dry road at speed 100 km/h.
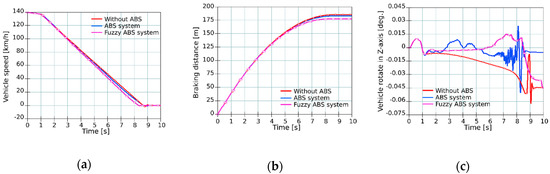
Figure 11.
Test on dry road at speed 140 km/h—(a) Speed curve; (b) Braking distance; (c) Vehicle rotation.
Table 4.
Test results on dry road at speed 140 km/h.
As seen from the test results, all vehicles were kept in their lane and the vehicle with the fuzzy ABS in both cases had the shortest braking distance.
4.2. Vehicle Braking Systems Test on Road with Combined Adhesion
This test was performed on a straight road with different adhesion values for the right and left sides. The left side of the vehicle was on the road with adhesion value 0.2, and the right side of the vehicle on the road with adhesion value 0.5. In general, such combination of surface adhesion represents an icy road. The test was performed for the initial vehicle speeds of 100 and 140 km/h. The results of the braking test for the individual braking systems for speed 100 km/h are shown in Figure 12 and Table 5.
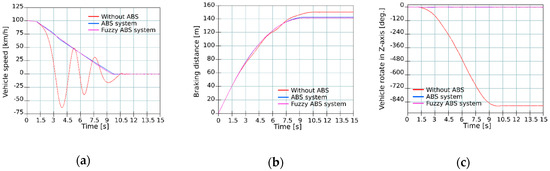
Figure 12.
Test on road with combined adhesion at speed 100 km/h—(a) Speed curve; (b) Braking distance; (c) Vehicle rotation.
Table 5.
Test results on road with combined adhesion at speed 100 km/h.
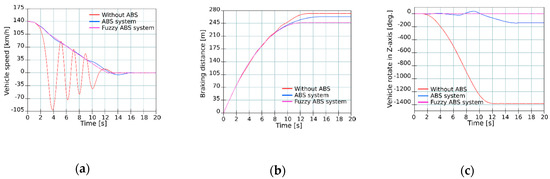
Figure 13.
Test on road with combined adhesion at speed 140 km/h—(a) Speed curve; (b) Braking distance; (c) Vehicle rotation.
Table 6.
Test results on road with combined adhesion at speed 140 km/h.
As demonstrated by the test results, a vehicle without an ABS slipped into skidding on the icy road and at both speeds ended off the road. The vehicle with a conventional ABS also skidded at the speed of 140 km/h and finished off turned in the opposite direction. The vehicle with the fuzzy ABS was the only one able to remain on the road and had the shortest braking distance at both speeds.
4.3. Vehicle Braking Systems Test When Avoiding an Obstacle on the Road
In this test, we observed the ability of the vehicle to maneuver on a dry road during braking, employing the individual braking systems. During this test, the vehicle was avoiding an obstacle during braking. The obstacle was simulated by delimiting the route using cones, as illustrated in Figure 14.
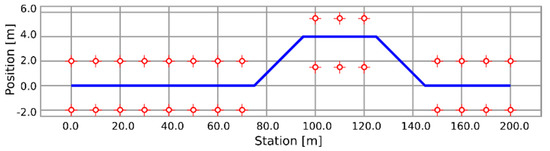
Figure 14.
Road during maneuverability test.
The test was performed for the initial vehicle speeds of 100 and 130 km/h. Because it was important to avoid an obstacle in this test, instead of vehicle rotation in z-axis, the shift of the vehicle from the defined route was under observation. The results of this test for individual braking systems at speed 100 km/h are shown in Figure 15 and Table 7.
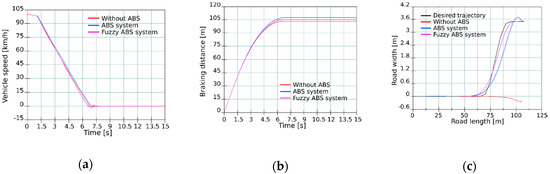
Figure 15.
Maneuverability test on dry road at speed 100 km/h—(a) Speed curve; (b) Braking distance; (c) Vehicle trajectory.
Table 7.
Maneuverability test on dry road at speed 100 km/h.
As seen from the vehicle maneuverability tests during braking at speed 100 km/h, the vehicle with the fuzzy ABS was able to copy the desired trajectory with most accuracy. A vehicle without an ABS would not be able to maneuver when braking, it would just move straight forward with locked wheels and would hit the obstacle.
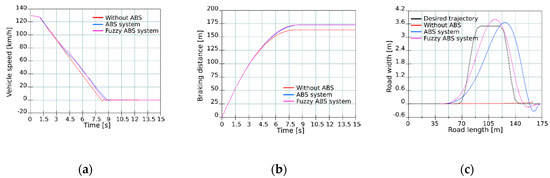
Figure 16.
Maneuverability test on dry road at speed 130 km/h—(a) Speed curve; (b) Braking distance; (c) Vehicle trajectory.
Table 8.
Maneuverability test on dry road at speed 130 km/h.
As demonstrated in the vehicles’ maneuverability test during braking at speed 130 km/h, the vehicle with the fuzzy ABS was able to copy the desired trajectory most accurately of all the vehicles. The vehicle with the conventional ABS showed problems in copying the desired trajectory at this speed. The vehicle without an ABS would not be able to maneuver when braking, it would just move straight forward with locked wheels and would hit the obstacle the same as before.
5. Discussion
The CarSim and MATLAB/Simulink programs were used to verify the design of the vehicle’s fuzzy ABS controller. The main goal of this work was to improve the braking properties of the vehicle by using fuzzy logic for the brake pressure regulator. We have chosen three types of operating states for testing the fuzzy ABS. The first was to test the vehicle’s braking behavior on dry roads at speeds of 100 and 140 km/h.
In this test, the shortest braking distance was the main criterion for assessing the quality of the proposed fuzzy ABS controller. The value of the braking distance of a vehicle with a classic ABS was taken as a reference value for comparison, as we wanted to improve the properties of this ABS by using a fuzzy logic.
As can be seen from the comparison in Table 9 and Figure 17, the ABS with the fuzzy controller achieved better properties with all monitored parameters, i.e., directional stability, braking time and braking distance than when using ABS without a fuzzy controller.
Table 9.
Comparison of parameters when braking on dry road.
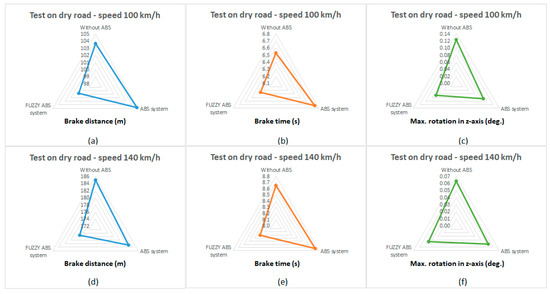
Figure 17.
Graphical comparison of the test on dry road.(a): Graphical comparison of the braking distance during a dry road test at a vehicle speed of 100 km/h; (b): Graphical comparison of the braking time during a dry road test at a vehicle speed of 100 km/h; (c): Graphical comparison of the vehicle rotation in z-axis during a dry road test at a vehicle speed of 100 km/h; (d): Graphical comparison of the braking distance during a dry road test at a vehicle speed of 140 km/h; (e): Graphical comparison of the braking time during a dry road test at a vehicle speed of 140 km/h; (f): Graphical comparison of the vehicle rotation in z-axis during a dry road test at a vehicle speed of 140 km/h.
In the second test, we observed the braking behavior of the vehicle on the road with different adhesion on the right and left side. In this test, in addition to monitoring the shortest braking distance, the ABS’s ability to maintain the vehicle in a straight line when braking was also monitored. Again, as in the previous test, the reference values were obtained by simulating a conventional ABS. As can be seen from the comparison shown in Table 10 and Figure 18, the ABS with the fuzzy controller achieved better results also in this case.
Table 10.
Comparison of parameters when braking on road with combined adhesion.
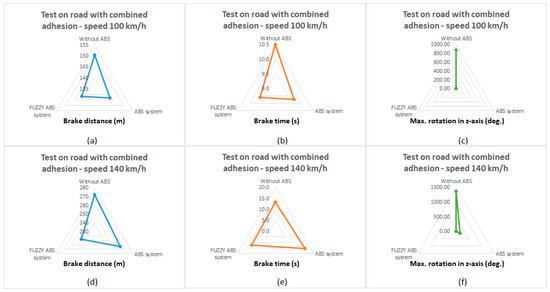
Figure 18.
Graphical comparison of the test on road with combined adhesion. (a): Graphical comparison of the braking distance during a test on a road with combined adhesion at speed of 100 km/h; (b): Graphical comparison of the braking time during a test on a road with combined adhesion at speed of 100 km/h; (c): Graphical comparison of the vehicle rotation in z-axis during a test on a road with combined adhesion at speed of 100 km/h; (d): Graphical comparison of the braking distance during a test on a road with combined adhesion at speed of 140 km/h; (e): Graphical comparison of the braking time during a test on a road with combined adhesion at speed of 140 km/h; (f): Graphical comparison of the vehicle rotation in z-axis during a test on a road with combined adhesion at speed of 140 km/h.
In the last test, we observed the behavior of the vehicle during braking and simultaneously avoiding an obstacle in the roadway. In this test, we monitored the vehicle’s ability to maintain within the prescribed path, and the reference value in this test was the value of the maximum deviation from the prescribed path for a vehicle with a conventional ABS. As Table 11 and Figure 19 demonstrates, although the vehicle without ABS had the shortest braking distance at speed 130 km/h, this vehicle was not able to avoid the obstacle and continued straight on, which would eventually cause the vehicle to collide with the obstacle.
Table 11.
Comparison of parameters during avoiding an obstacle on the road.
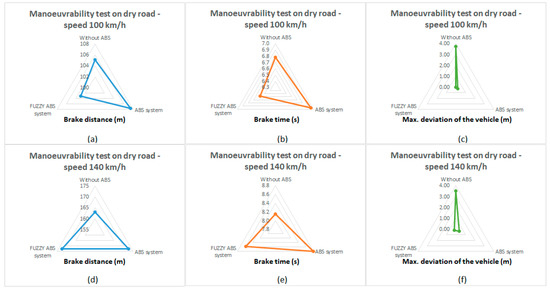
Figure 19.
Graphical comparison of the maneuverability test on road. (a): Graphical comparison of the braking distance during a manoeurability test on a dry road at speed of 100 km/h; (b): Graphical comparison of the braking time during a manoeurability test on a dry road at speed of 100 km/h; (c): Graphical comparison of the vehicle deviation from the prescribed road during a manoeurability test on a dry road at speed of 100 km/h; (d): Graphical comparison of the braking distance during a manoeurability test on a dry road at speed of 140 km/h; (e): Graphical comparison of the braking time during a manoeurability test on a dry road at speed of 140 km/h; (f): Graphical comparison of the vehicle deviation from the prescribed road during a manoeurability test on a dry road at speed of 140 km/h.
Based on the previous results, we made a percentage comparison of the improvement in the performance of the ABS with the fuzzy controller compared to the classic ABS. The result of this comparison is shown in Table 12.
Table 12.
Percentage comparison of the improvement of key indicators.
It is shown in Table 11 that by using a fuzzy controller for the vehicle’s ABS, we can achieve up to a 6% reduction in braking distance when braking on a road with combined adhesion. In the simulations, however, we achieved much more significant results in the directional stability of the vehicle or when avoiding an obstacle.
6. Conclusions
In this paper, we presented the design of an ABS with a fuzzy controller. Integrating fuzzy control into a conventional ABS has resulted in achieving improved maneuverability of the vehicle when braking on different surfaces and in different situations at high speed. As can be seen from the simulation results presented in the discussion, in all tests, the ABS with a fuzzy controller achieved better results than the conventional ABS. Comparing the key parameters in Table 12, we can see that by using a fuzzy controller, we achieved a reduction in the braking distance compared to the conventional ABS by 6% in the test on the road with combined adhesion. We achieved significantly better results mainly in the directional stability of the vehicle during the test on a road with a combined surface and the test of maneuverability.
Author Contributions
P.G. conceived and wrote the paper; P.G., J.Ž. and J.K. methology; P.G. designed the experiments; P.G., J.Ž. and J.K. analysed the experimental data; P.G., J.Ž. and J.K. proposed the theory. All authors have read and agreed to the published version of the manuscript.
Funding
This work was supported by the Slovak Research and Development Agency under the contract No. APVV-15-0750. This work was supported by the Slovak Research and Development Agency under the contract No. APVV-16-0206. The authors wish to thank the project VEGA 1/0187/18 for its support.
Conflicts of Interest
The authors declare no conflicts of interest.
References
- Minh, V.; Oamen, G.; Vassiljeva, K.; Teder, L. Development of Anti-lock Braking System (ABS) for Vehicles Braking. Open Eng. 2016. [Google Scholar] [CrossRef]
- Aly, A.; Zeidan, E.; Hamed, A.; Salem, F. An Antilock-Braking Systems (ABS) Control: A Technical Review. Intell. Control Autom. 2011, 186–195. [Google Scholar] [CrossRef]
- Liu, H.; Lei, Y.; Fu, Y.; Li, X. An Optimal Slip Ratio-Based Revised Regenerative Braking Control Strategy of Range-Extended Electric Vehicle. Energies 2020, 13, 1526. [Google Scholar] [CrossRef]
- Guo, J.; Jian, X.; Lin, G. Performance Evaluation of an Anti-Lock Braking System for Electric Vehicles with a Fuzzy Sliding Mode Controller. Energies 2014, 7, 6459–6476. [Google Scholar] [CrossRef]
- Sun, J.; Xue, X.; Cheng, K.W.E. Fuzzy Sliding Mode Wheel Slip Ratio Control for Smart Vehicle Anti-Lock Braking System. Energies 2019, 12, 2501. [Google Scholar] [CrossRef]
- Cabrera, J.A.; Ortiz, A.; Castillo, J.J.; Simon, A. A fuzzy logic control for antilock braking system integrated in the imma tire test bench. IEEE Trans. Veh. Technol. 2005, 54, 1937–1949. [Google Scholar] [CrossRef]
- Keshmiri, R.; Shahri, A.M. Intelligent ABS Fuzzy Controller for Diverse Road Surfaces. World Acad. Sci. Eng. Technol. 2007, 29, 292–297. [Google Scholar]
- Layne, J.R.; Passino, K.M.; Yurkovich, S. Fuzzy learning control for antiskid braking systems. IEEE Trans. Control Syst. Technol. 1993, 1, 122–129. [Google Scholar] [CrossRef]
- Lennon, W.K.; Passino, K.M. Intelligent control for brake systems. IEEE Trans. Control Syst. Technol. 1999, 7, 188–202. [Google Scholar] [CrossRef]
- Mauer, G.F. A fuzzy logic controller for an ABS braking system. IEEE Trans. Fuzzy Syst. 1995, 3, 381–388. [Google Scholar] [CrossRef]
- Ayush, A.K.; Amitosh, K.; Sridevi, S.; Venkateswaran, K. ABS using Fuzzy Logic in MATLAB and Its Hardware Implementation. Int. J. Recent Technol. Eng. 2019, 8, 1007–1010. [Google Scholar]
- Modi, D.; Padia, Z.; Patel, K. Fuzzy logic Anti-lock brake system. Int. J. Sci. Eng. Res. 2012, 3, 1–8. [Google Scholar]
- Yin, G.; Wang, S.; Jin, X. Optimal Slip Ratio Based Fuzzy Control of Acceleration Slip Regulation for Four-Wheel Independent Driving Electric Vehicles. Math. Probl. Eng. 2013, 1–7. [Google Scholar] [CrossRef]
- Chen, C.K.; Shih, M.C. PID-Type Fuzzy Control for Anti-Lock Brake Systems with Parameter Adaptation. JSME International Journal Series C Mechanical Systems. Mach. Elem. Manuf. 2004, 47, 675–685. [Google Scholar] [CrossRef][Green Version]
- Raesian, N.; Khajehpour, N.; Yaghoobi, M. A New Approach in Anti-lock Braking System (ABS) Based on Adaptive Neuro-Fuzzy Self-tuning PID Controller. In Proceedings of the 2nd International Conference on Control, Instrumentation and Automation (ICCIA), Shiraz, Iran, 27–29 December 2011; pp. 530–535. [Google Scholar] [CrossRef]
- Pretagostini, F.; Ferranti, L.; Berardo, G.; Ivanov, V.; Shyrokau, B. Survey on Wheel Slip Control Design Strategies, Evaluation and Application to Antilock Braking Systems. IEEE Access 2020, 8, 10951–10970. [Google Scholar] [CrossRef]
- Lonkwic, P.; Syta, A. Nonlinear analysis of braking delay dynamics for the progressive gears in variable operating conditions. J. Vibroeng. 2016, 18, 4401–4408. [Google Scholar] [CrossRef]
- Wolszczak, P.; Lonkwic, P.; Cunha, A.; Litak, G.; Molski, S. Robust optimization and uncertainty quantification in the nonlinear mechanics of an elevator brake system. Meccanica 2019, 54, 1057–1069. [Google Scholar] [CrossRef]
- Day, A. Braking of Road Vehicles; Elsevier: Oxford, UK, 2014. [Google Scholar]
- Ribbens, W. Understanding Automotive Electronics—An Engineering Perspective, 7th ed.; Elsevier: Oxford, UK, 2012. [Google Scholar]
- Stone, R.; Ball, J.K. Automotive Engineering Fundamentals; SAE International: Warrendale, PA, USA, 2004. [Google Scholar]
- Aksjonov, A.; Vodovozov, V.; Augsburg, K.; Petlenkov, E. Design of regenerative anti-lock braking system controller for 4 in-wheel-motor drive electric vehicle with road surface estimation. Int. J. Automot. Technol. 2018, 19, 727–742. [Google Scholar] [CrossRef]
- Pacejka, H. Tire and Vehicle Dynamics, 3rd ed.; Elsevier: Oxford, UK, 2012. [Google Scholar]


© 2020 by the authors. Licensee MDPI, Basel, Switzerland. This article is an open access article distributed under the terms and conditions of the Creative Commons Attribution (CC BY) license (http://creativecommons.org/licenses/by/4.0/).