Reactor Design and Thermal Performance Analysis for Solar Thermal Energy Storage Application


 ,
,  ,
, 
 ,
,
Abstract

1. Introduction
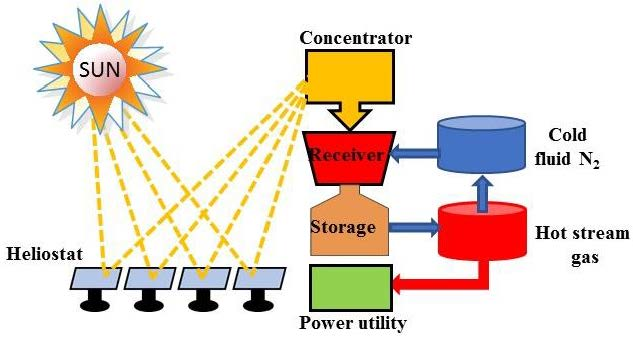
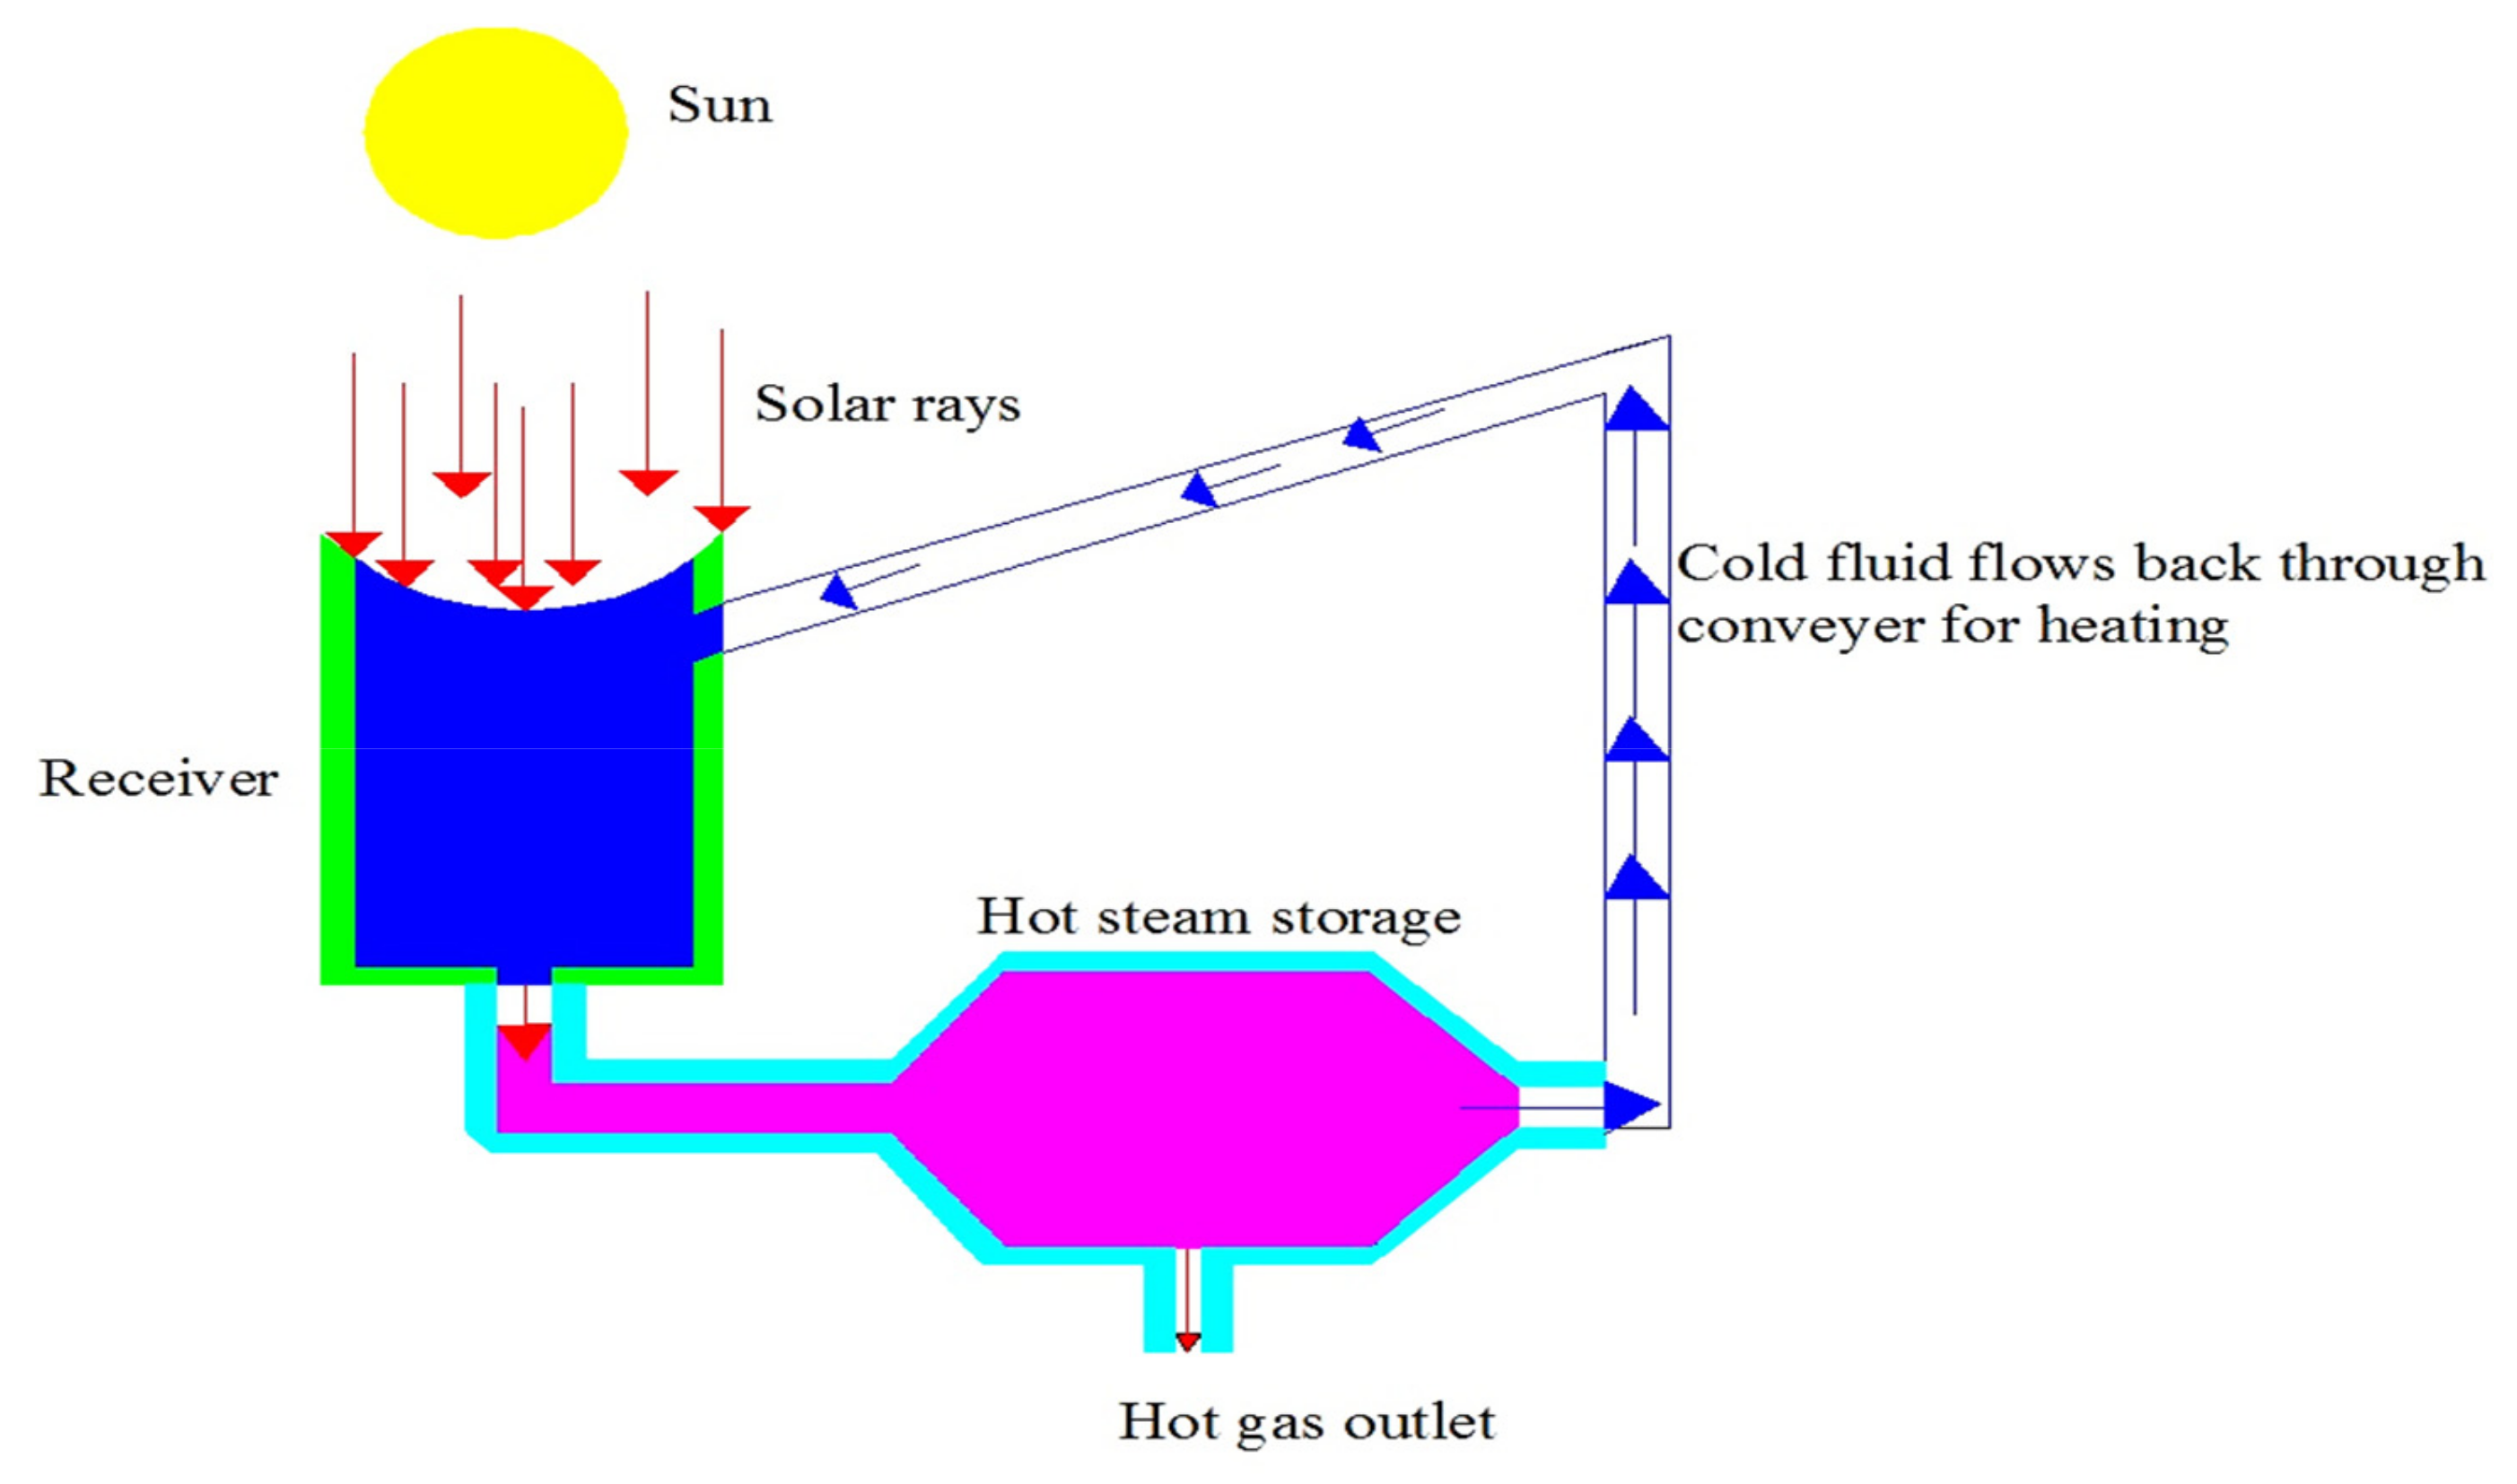
2. System Configuration
3. Reactor Model
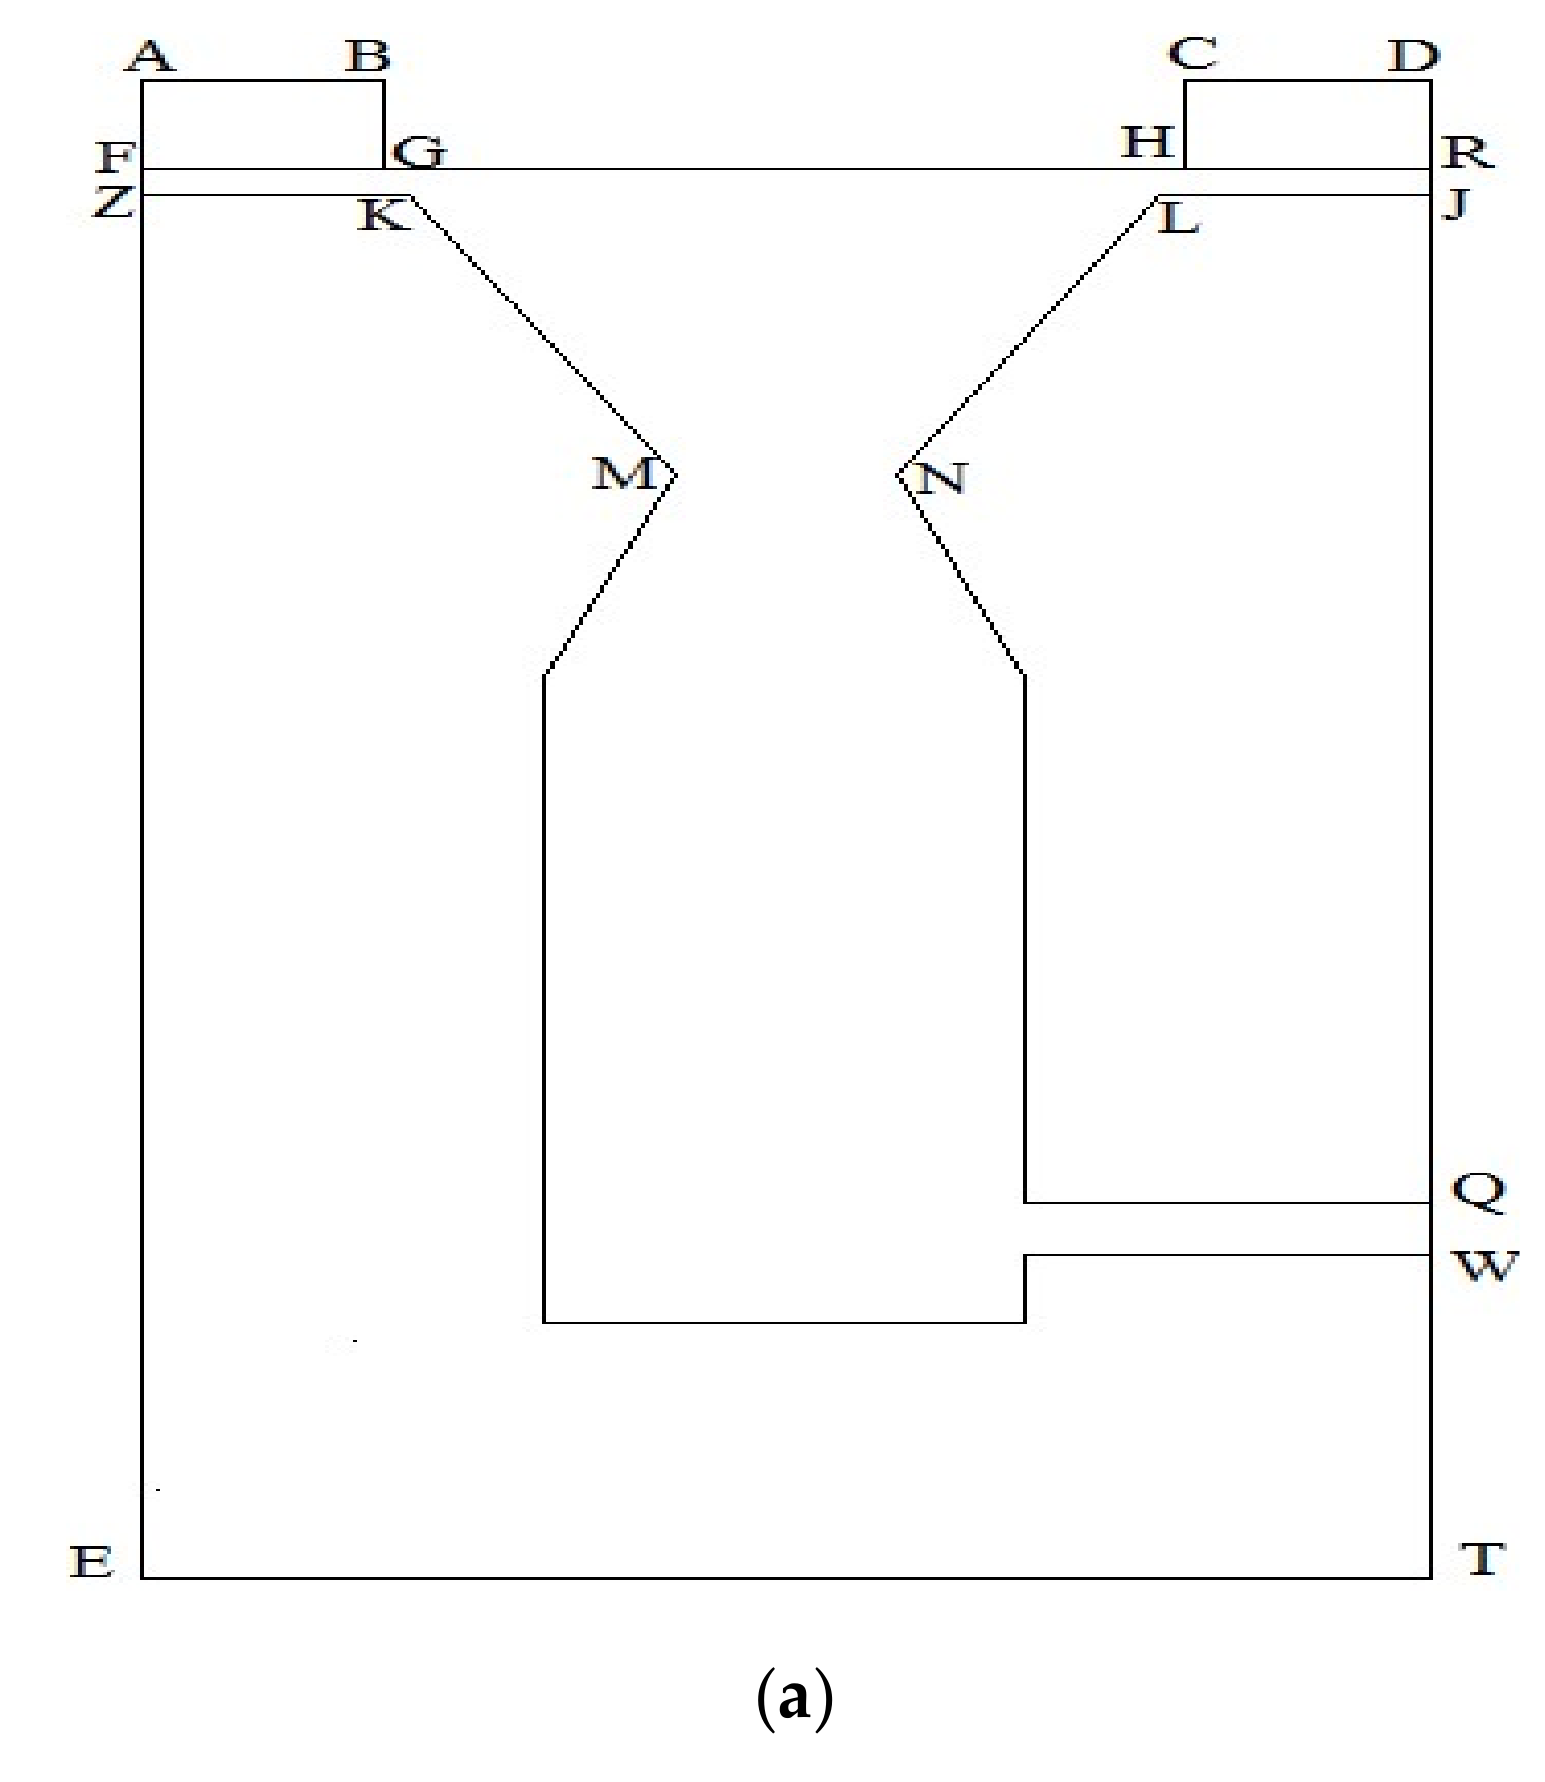
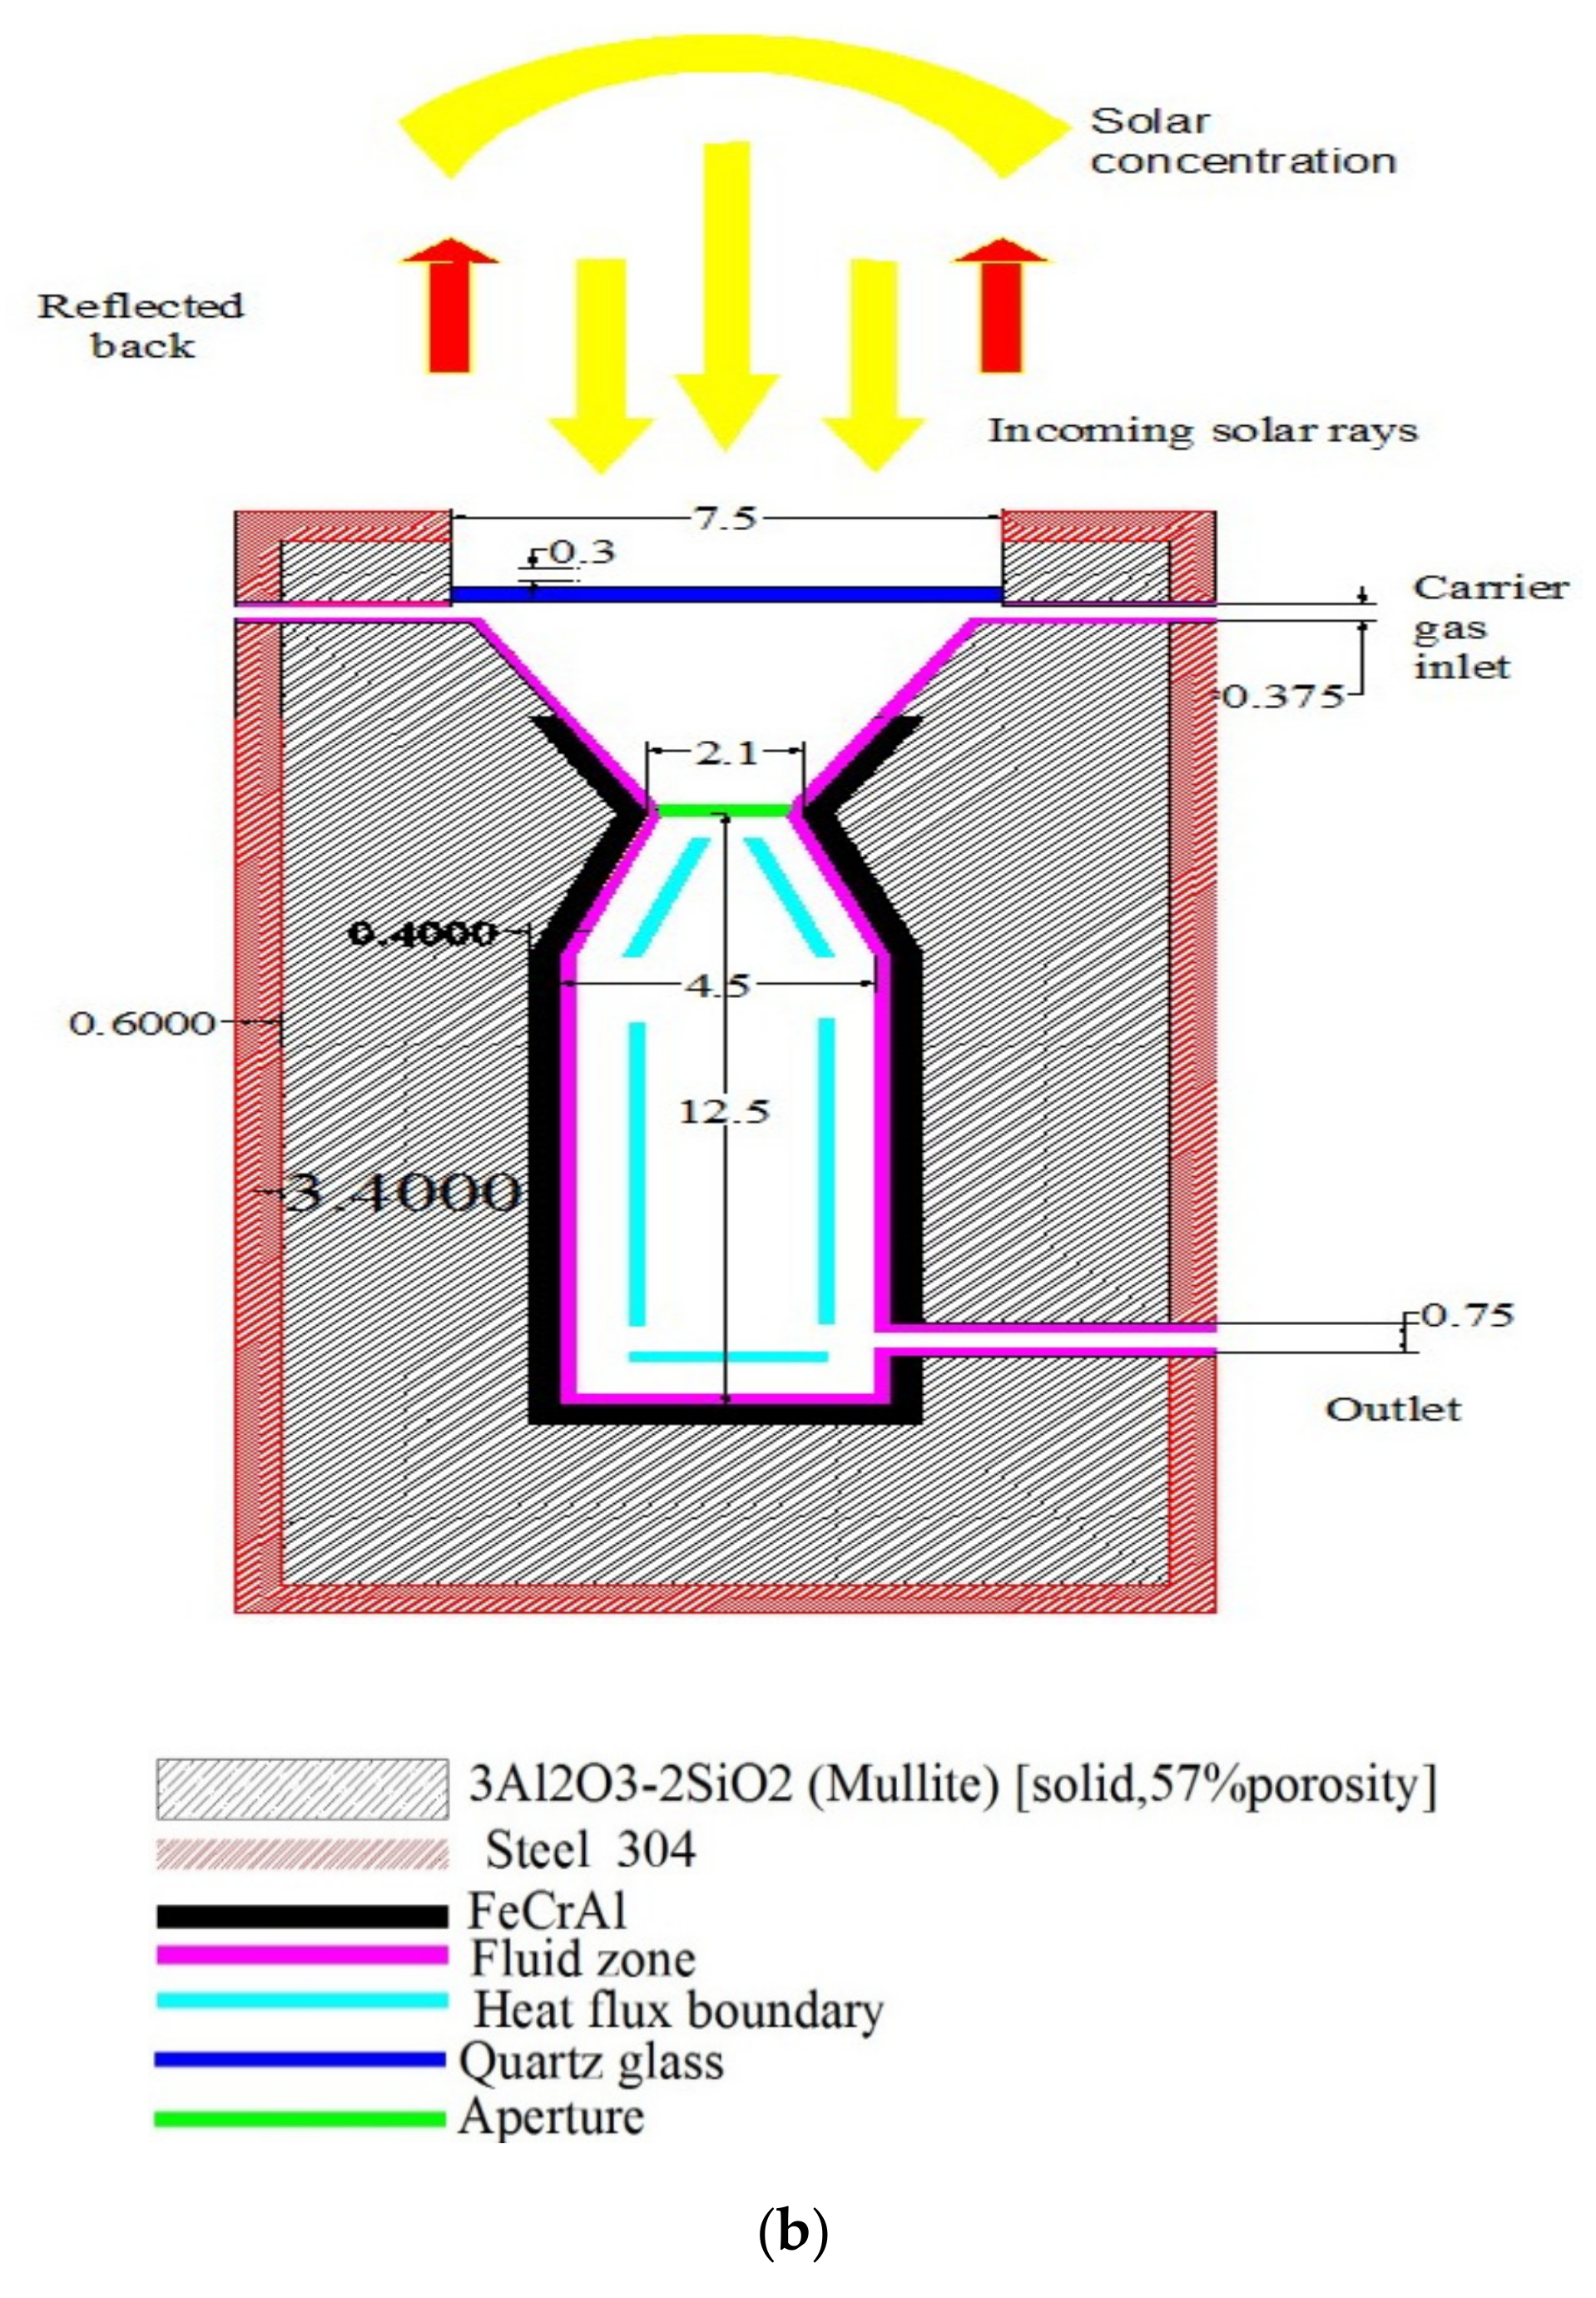
3.1. Physical Model
3.2. Model Equations
3.3. Boundary Conditions
3.4. Numerical Solution Methods
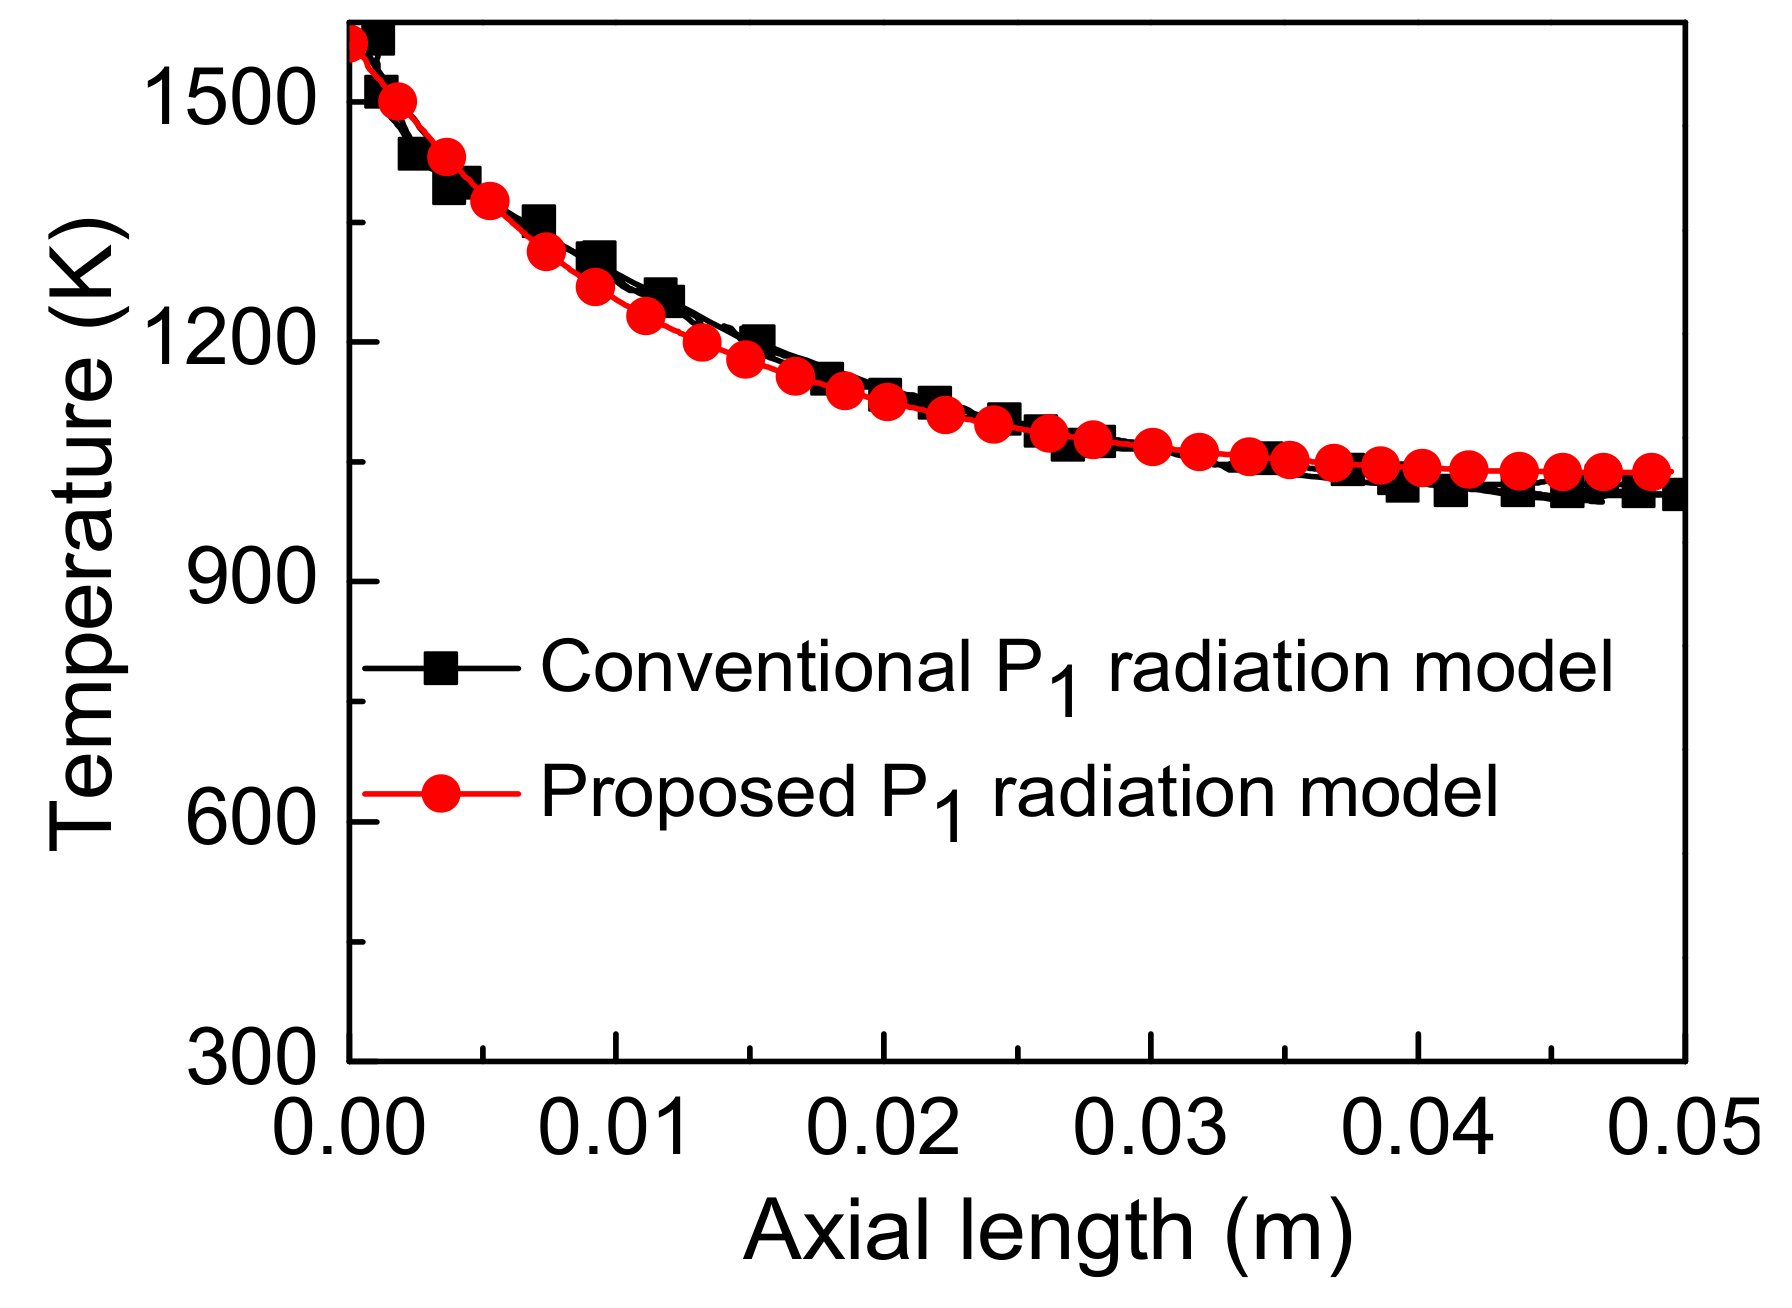
3.5. Model Validation
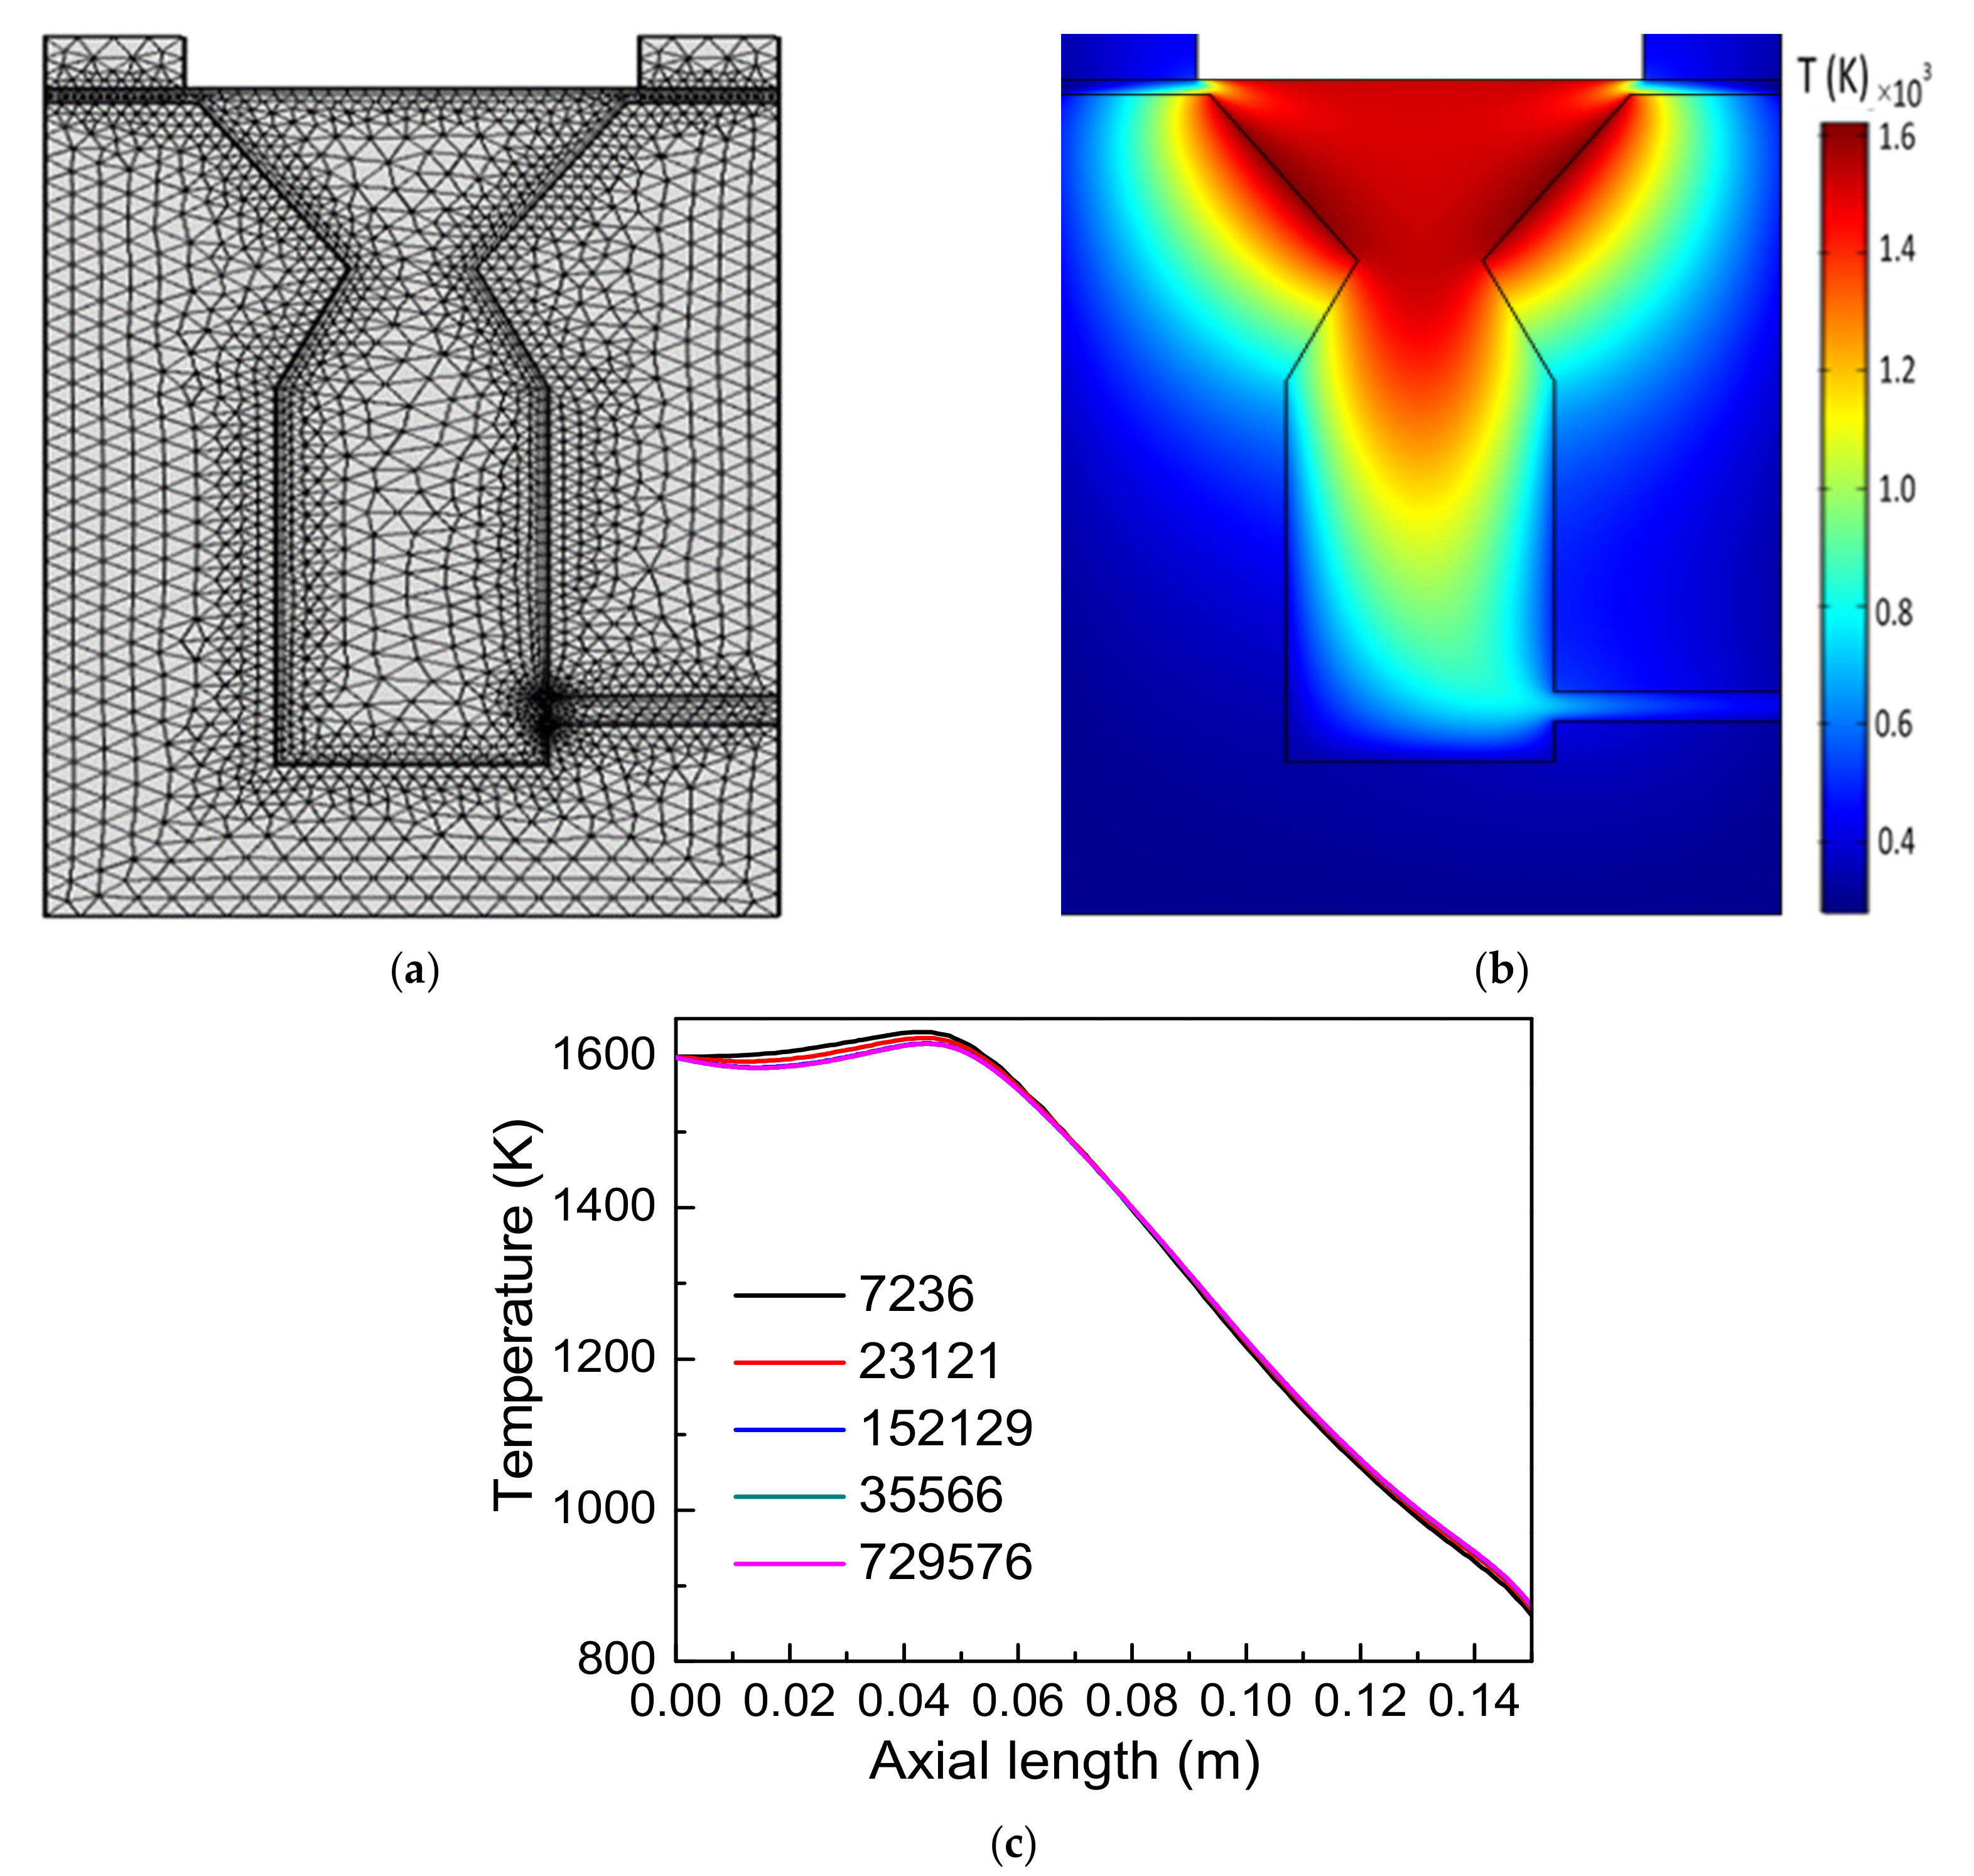
3.6. Grid Independency Tests
4. Result and Discussion
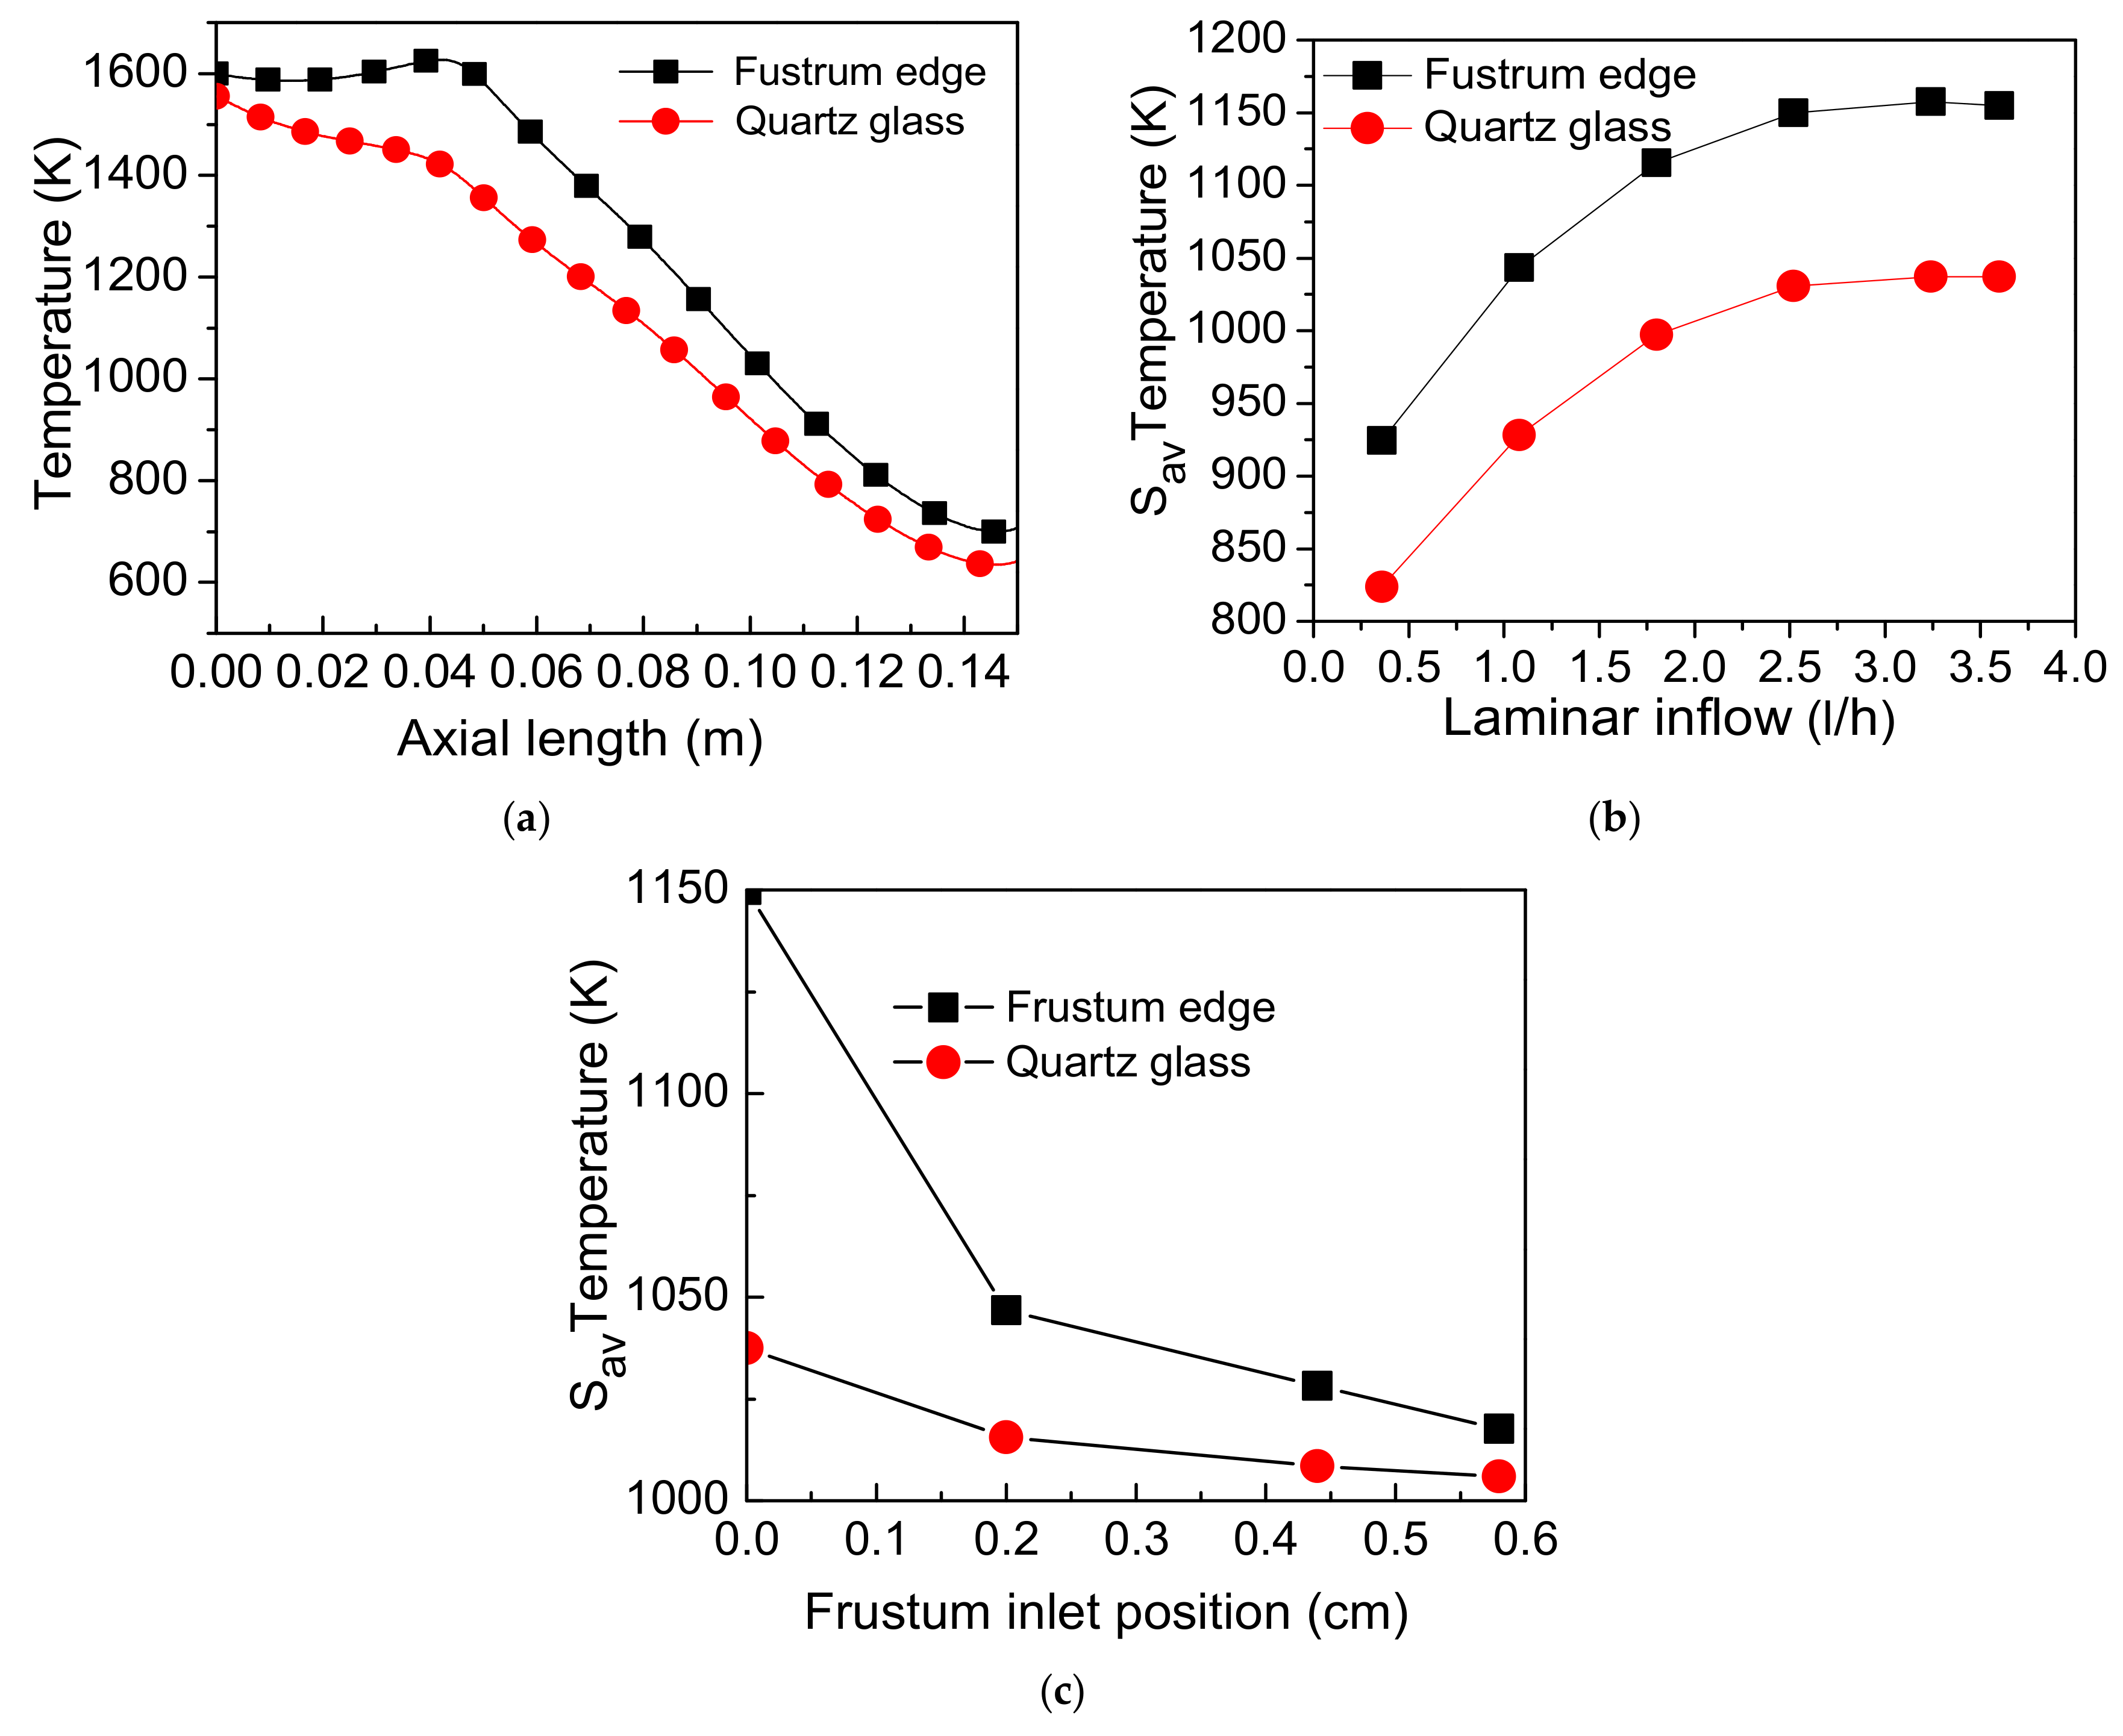
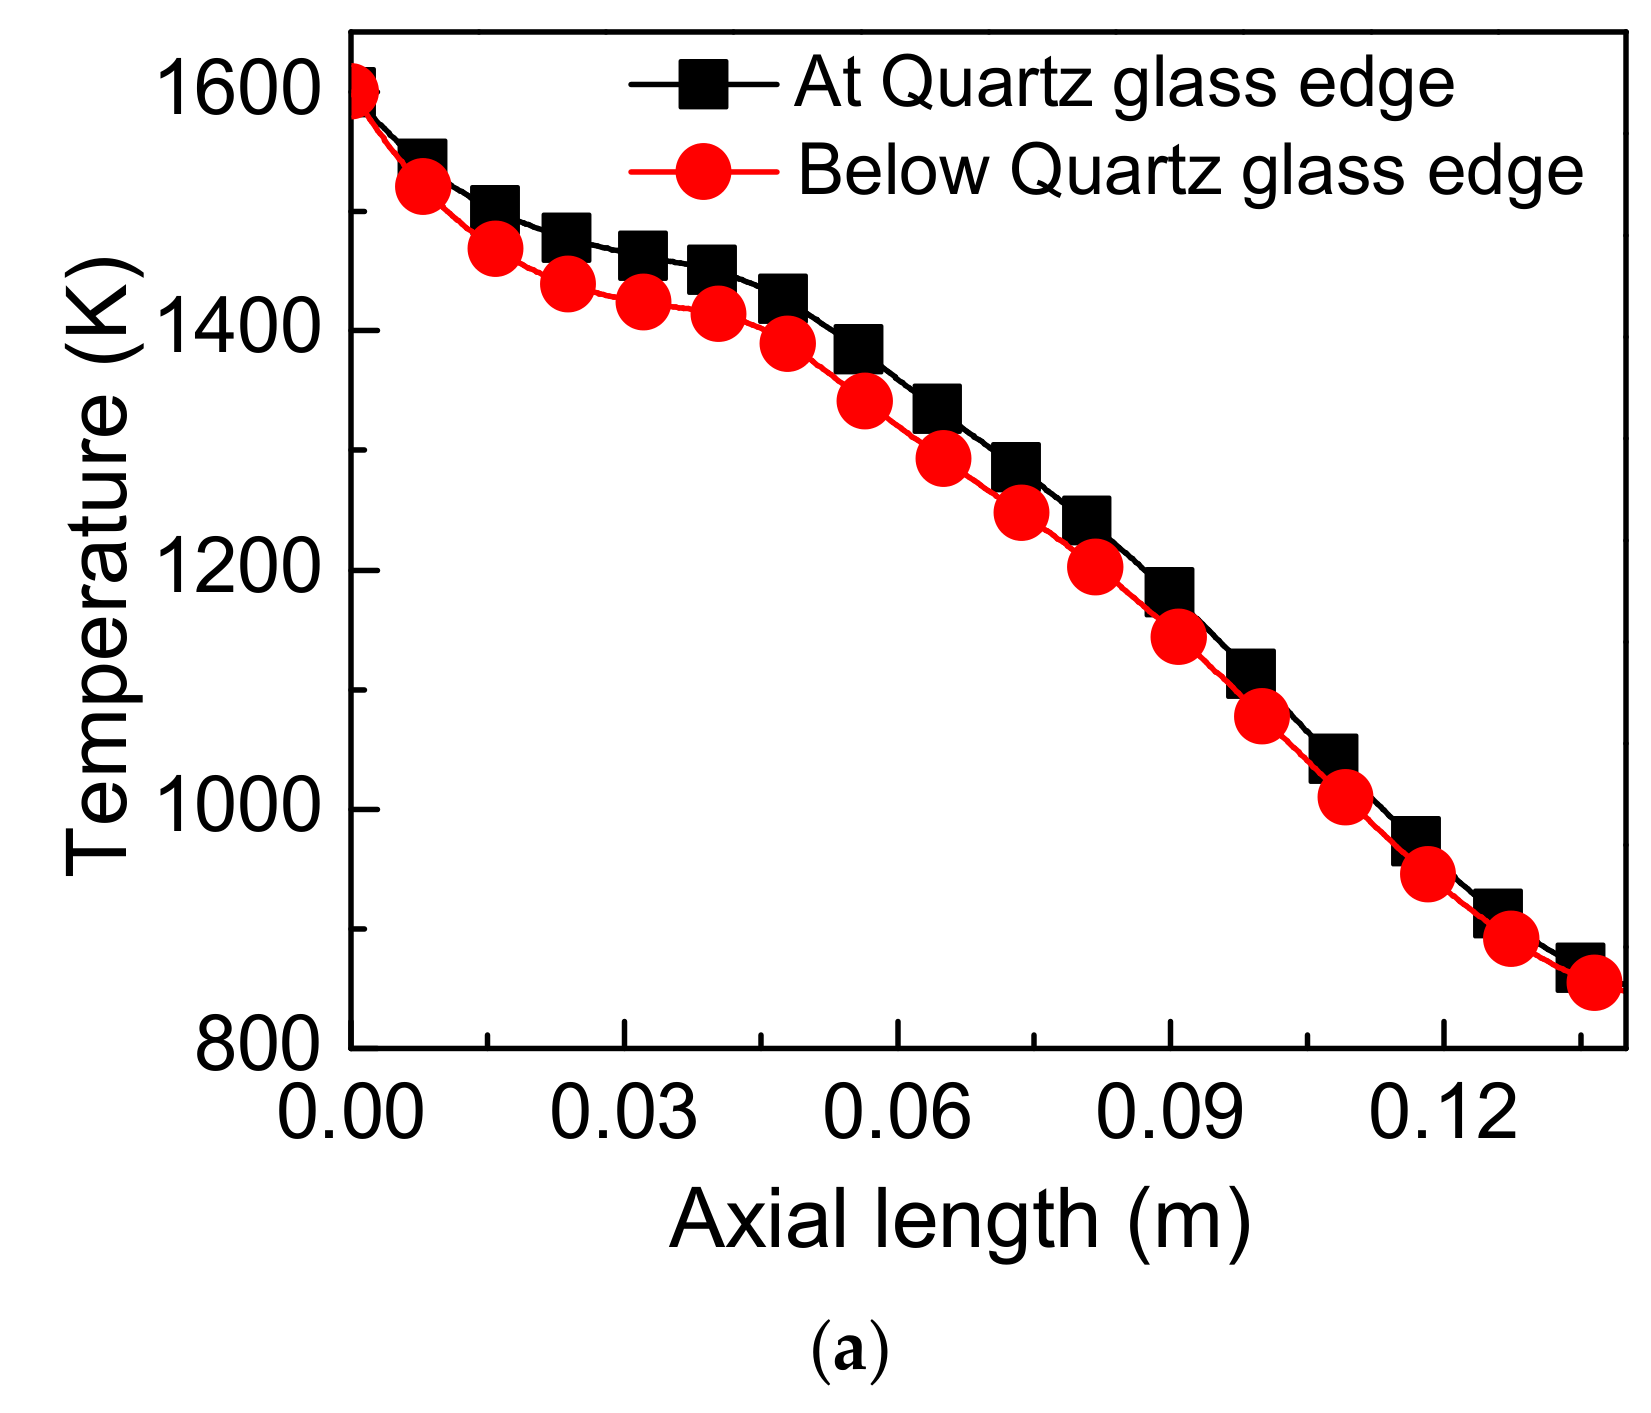
4.1. Impact of Applied Heat Resource Frustum Edges and Quartz Edge Using Varying Simulator Direction for Thermal Performance of the Reactor
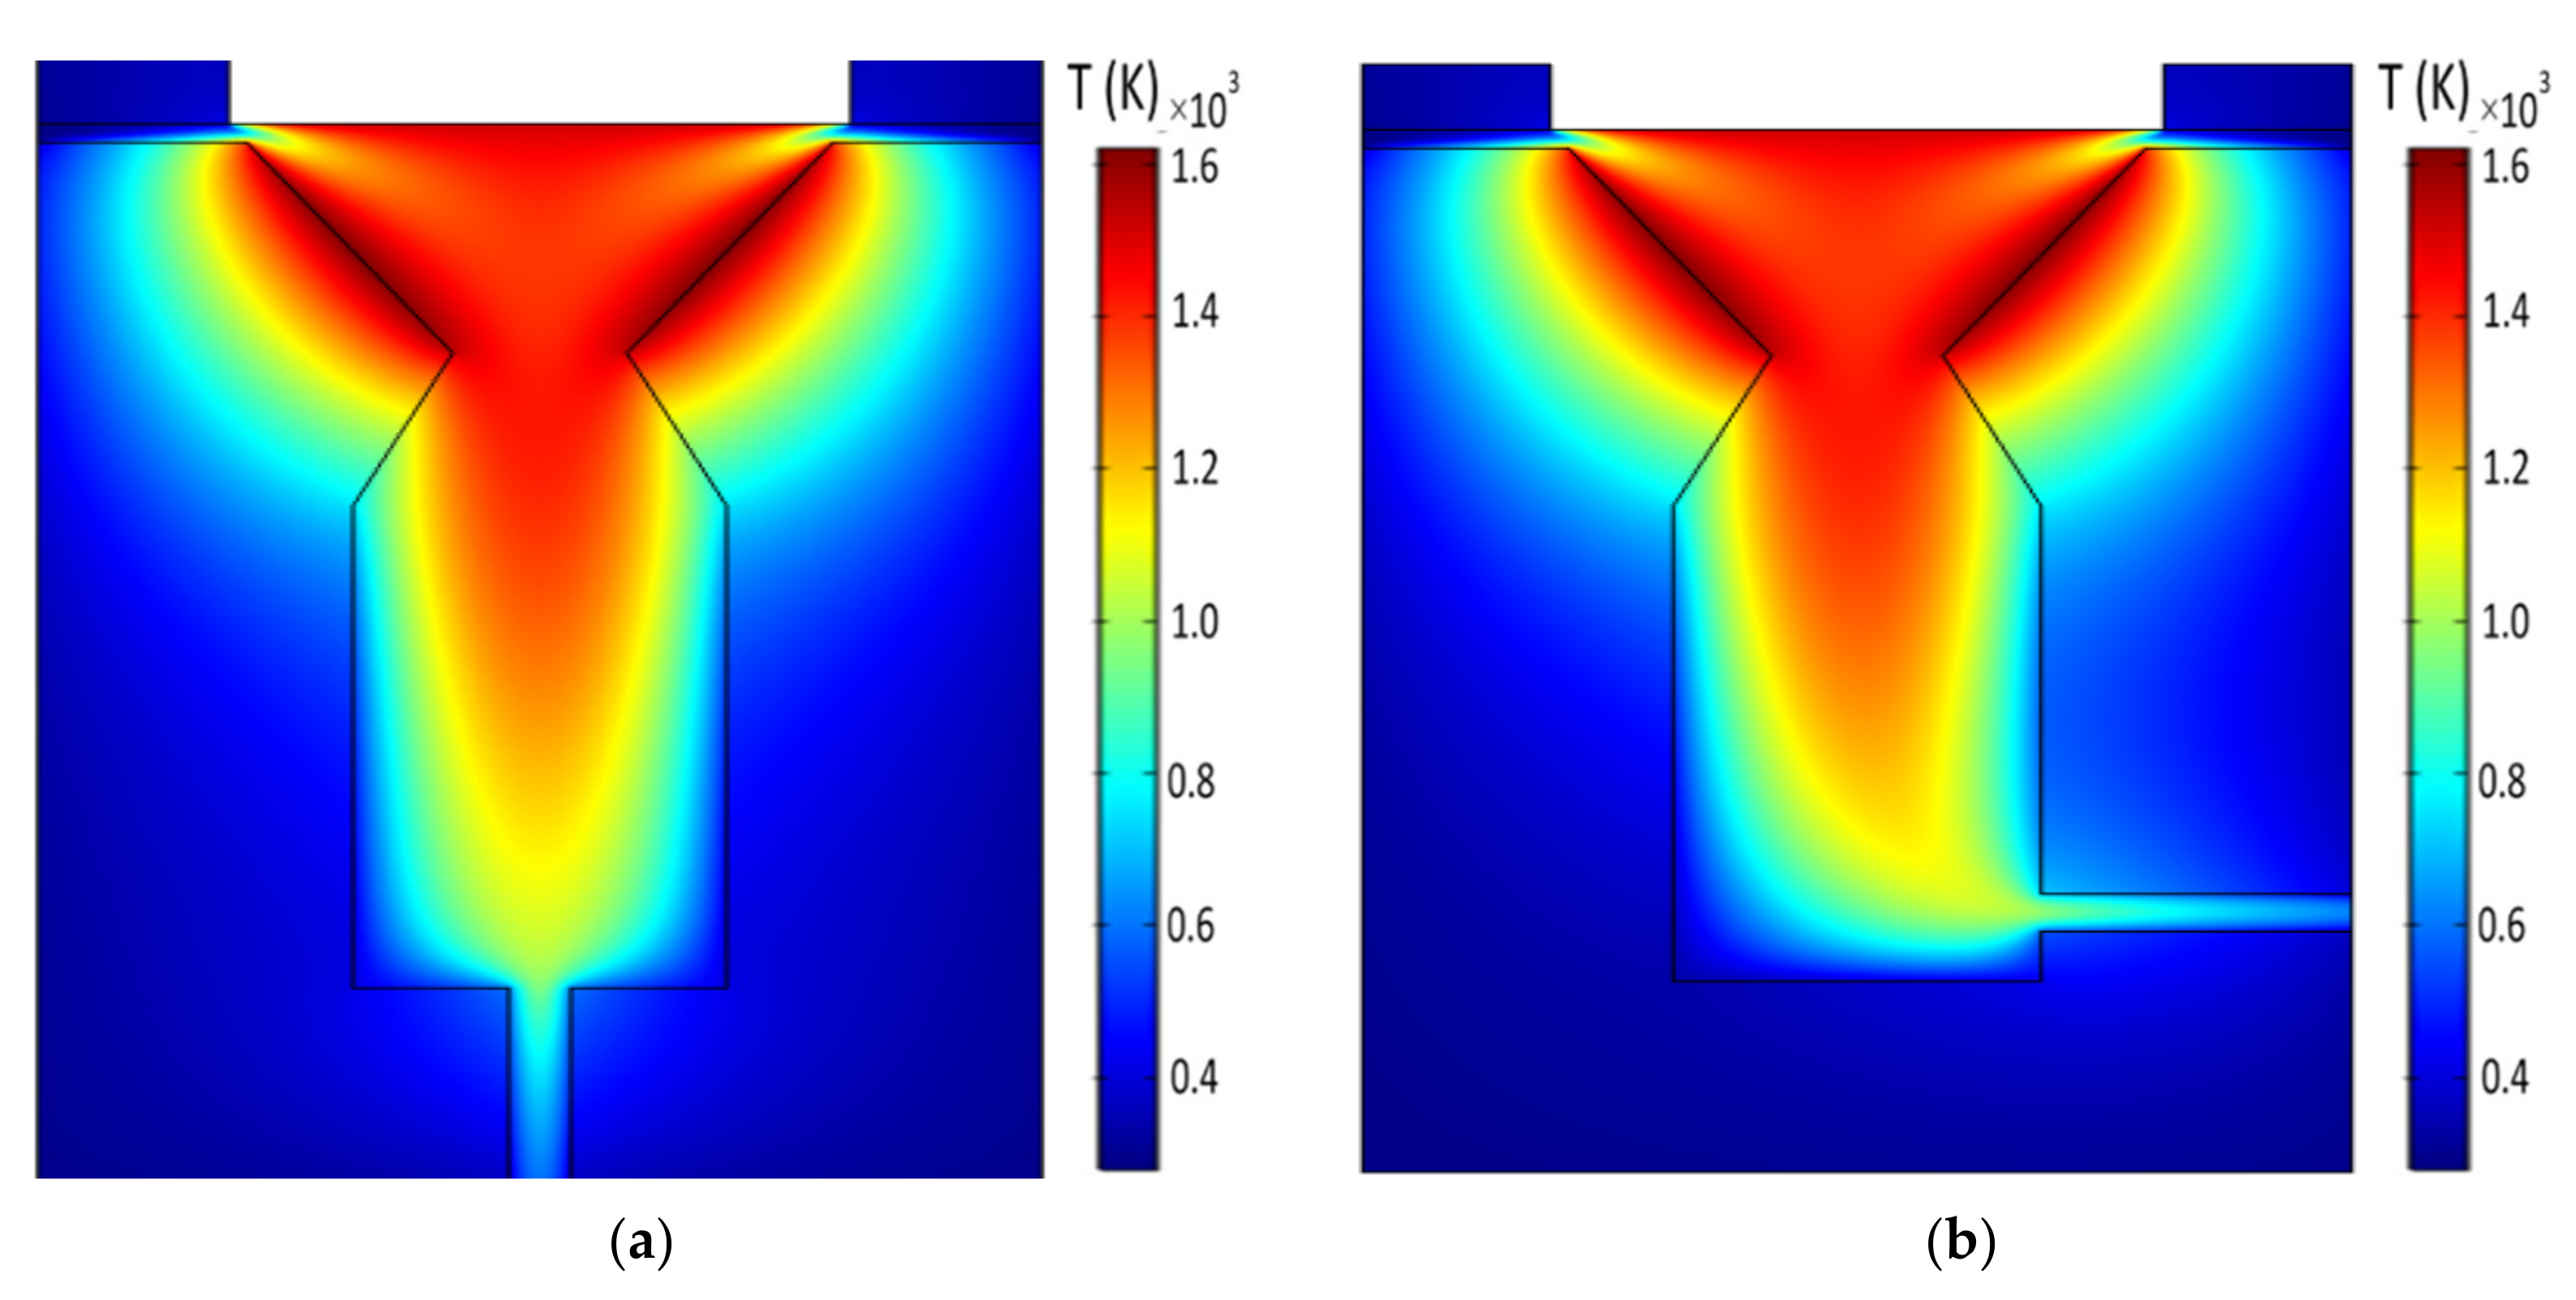
4.2. Impact of Outlet Position on Temperature Distribution
4.3. Incident Radiation Heat Flux and the Radiation Temperature Distribution
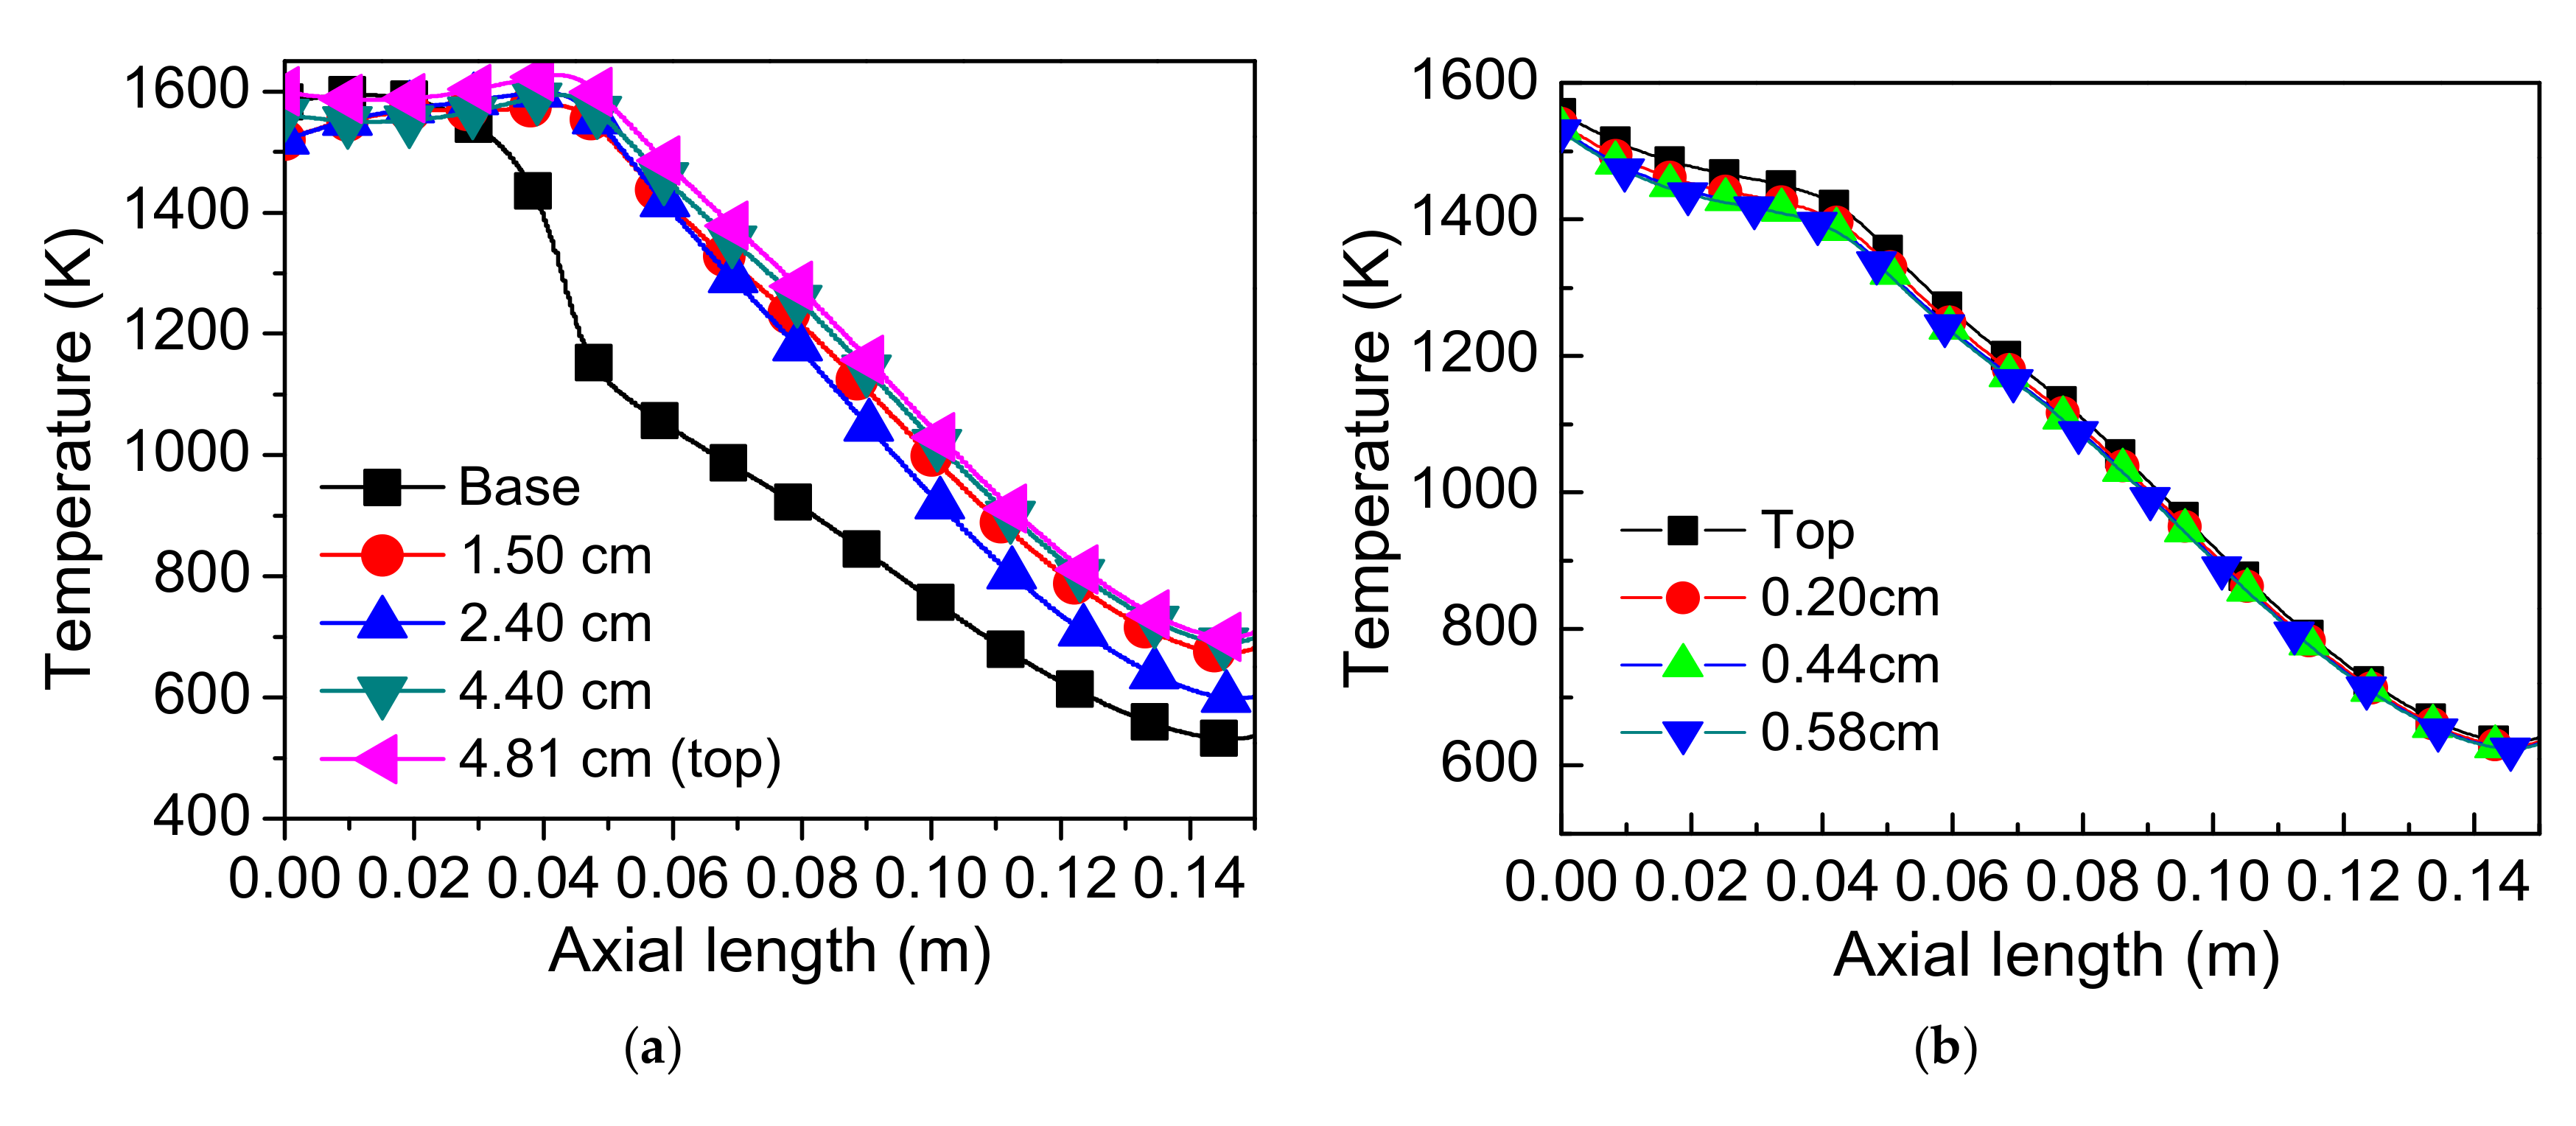
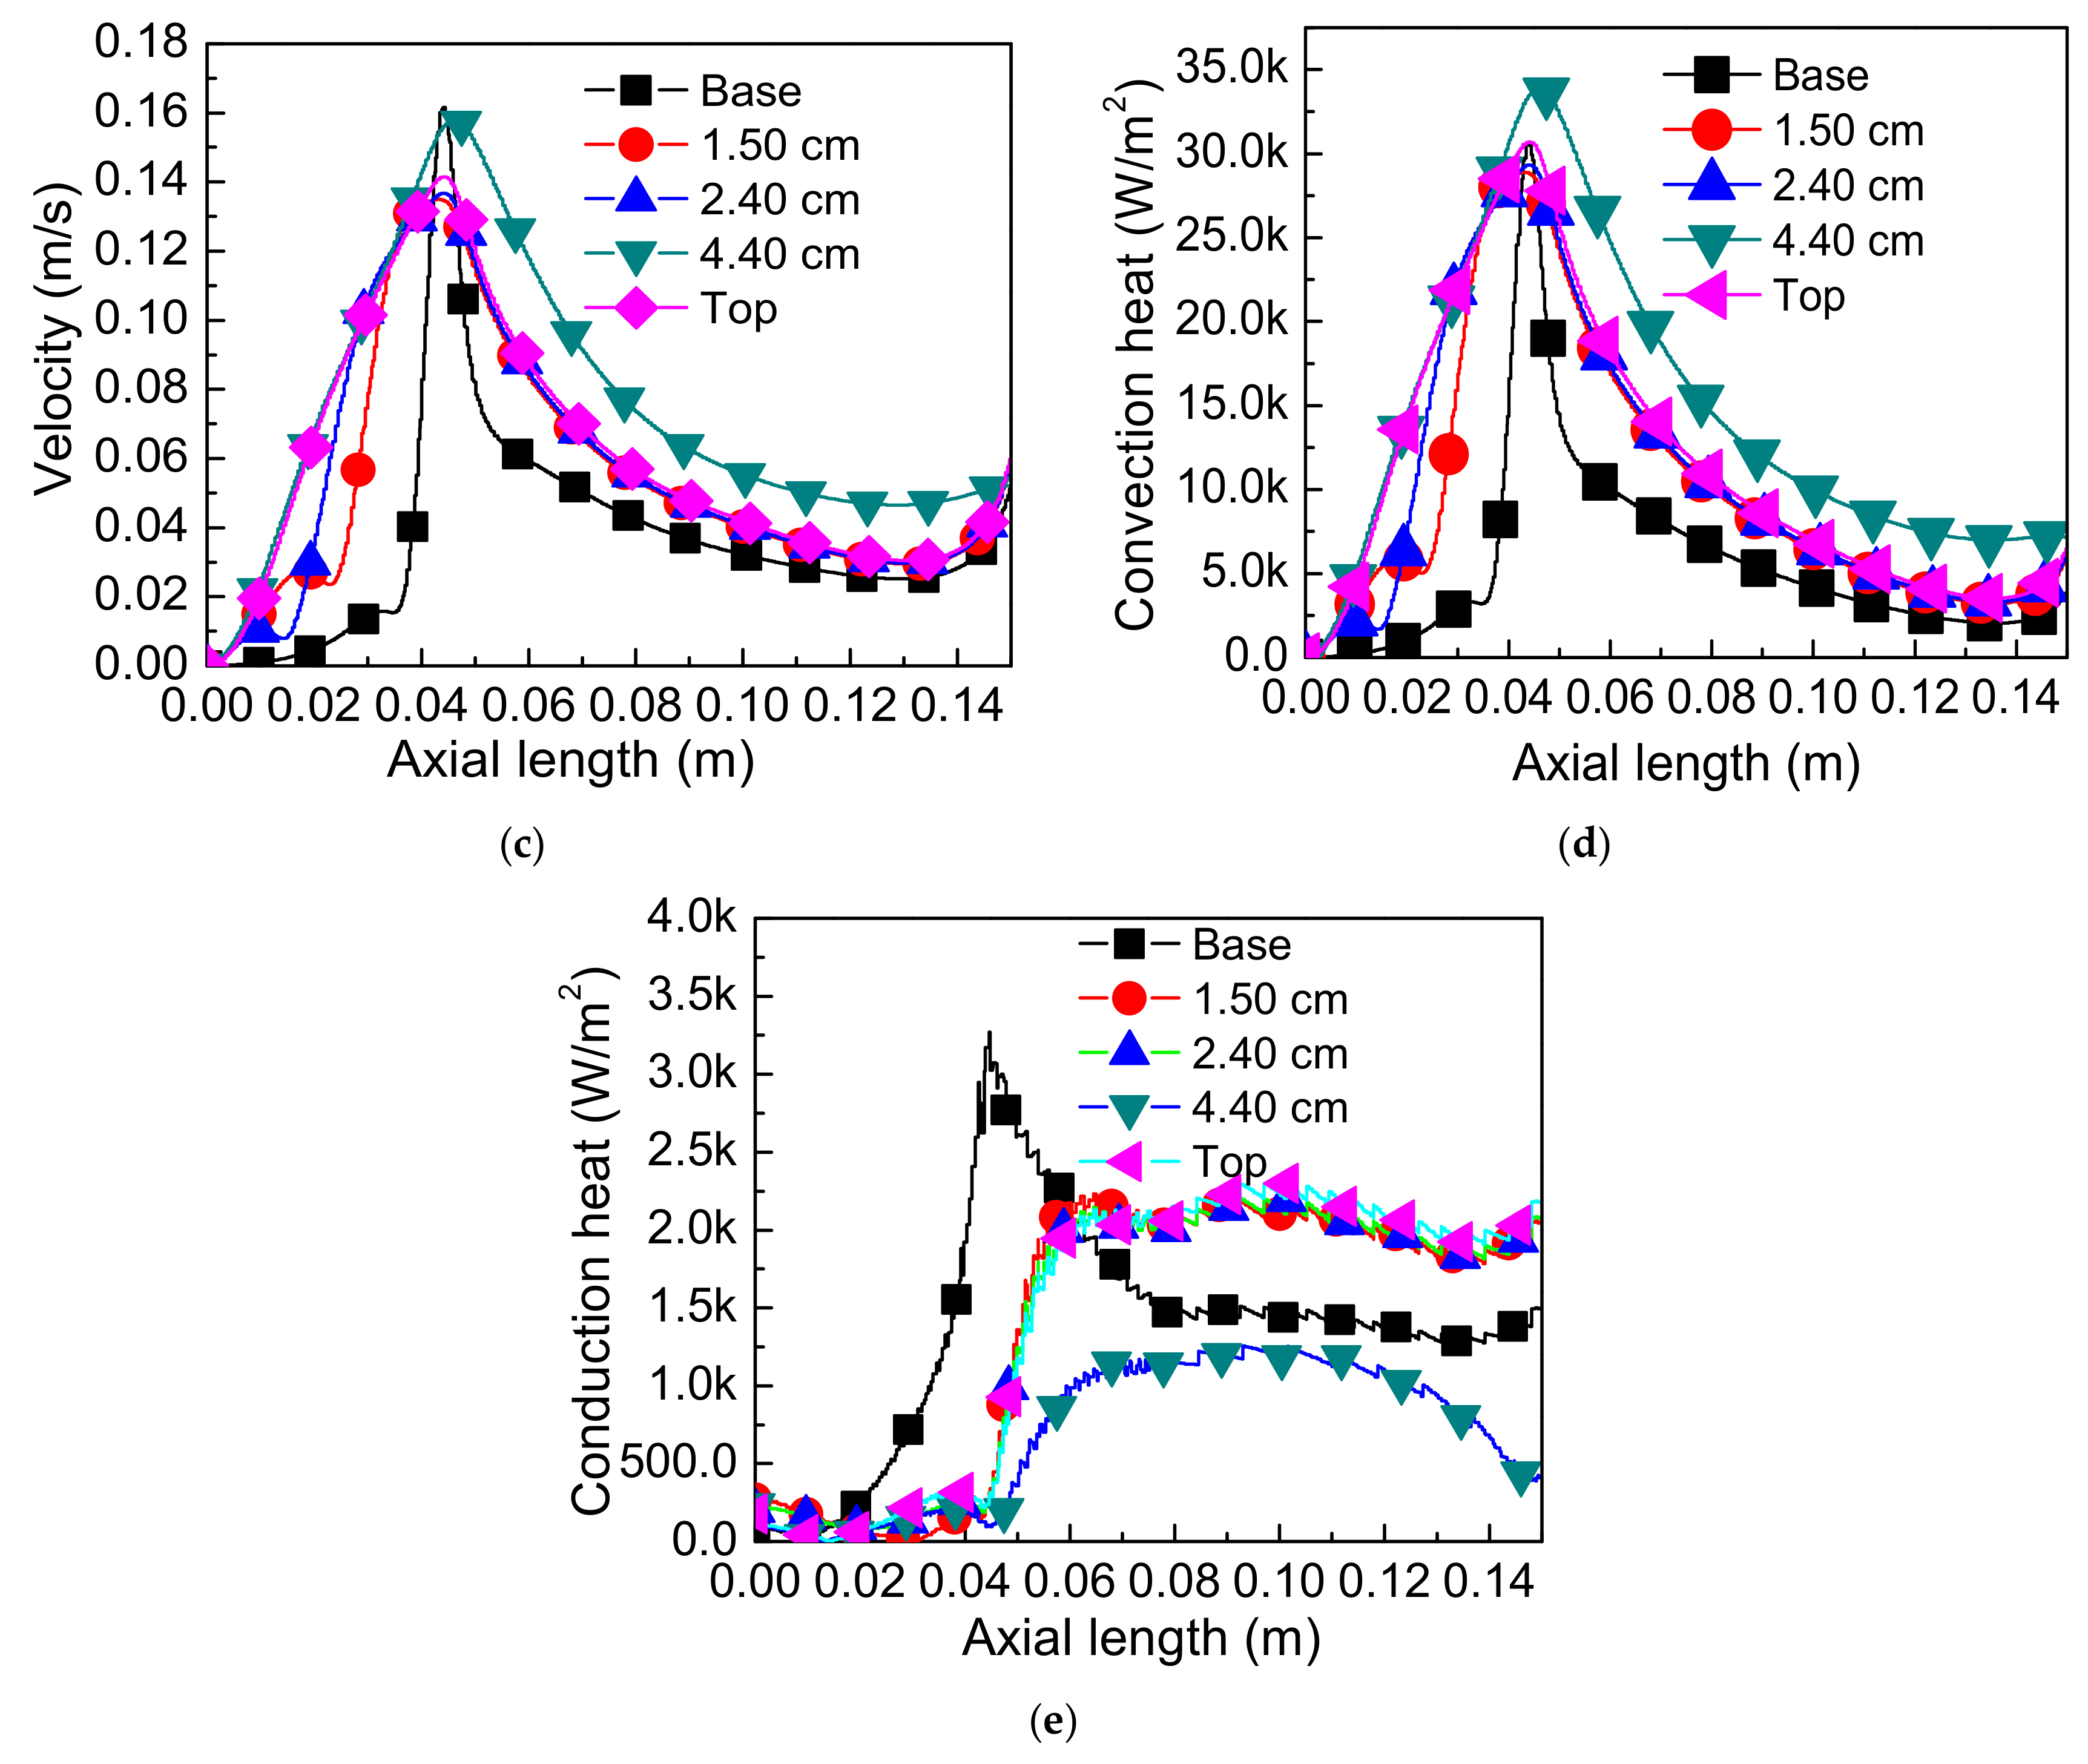
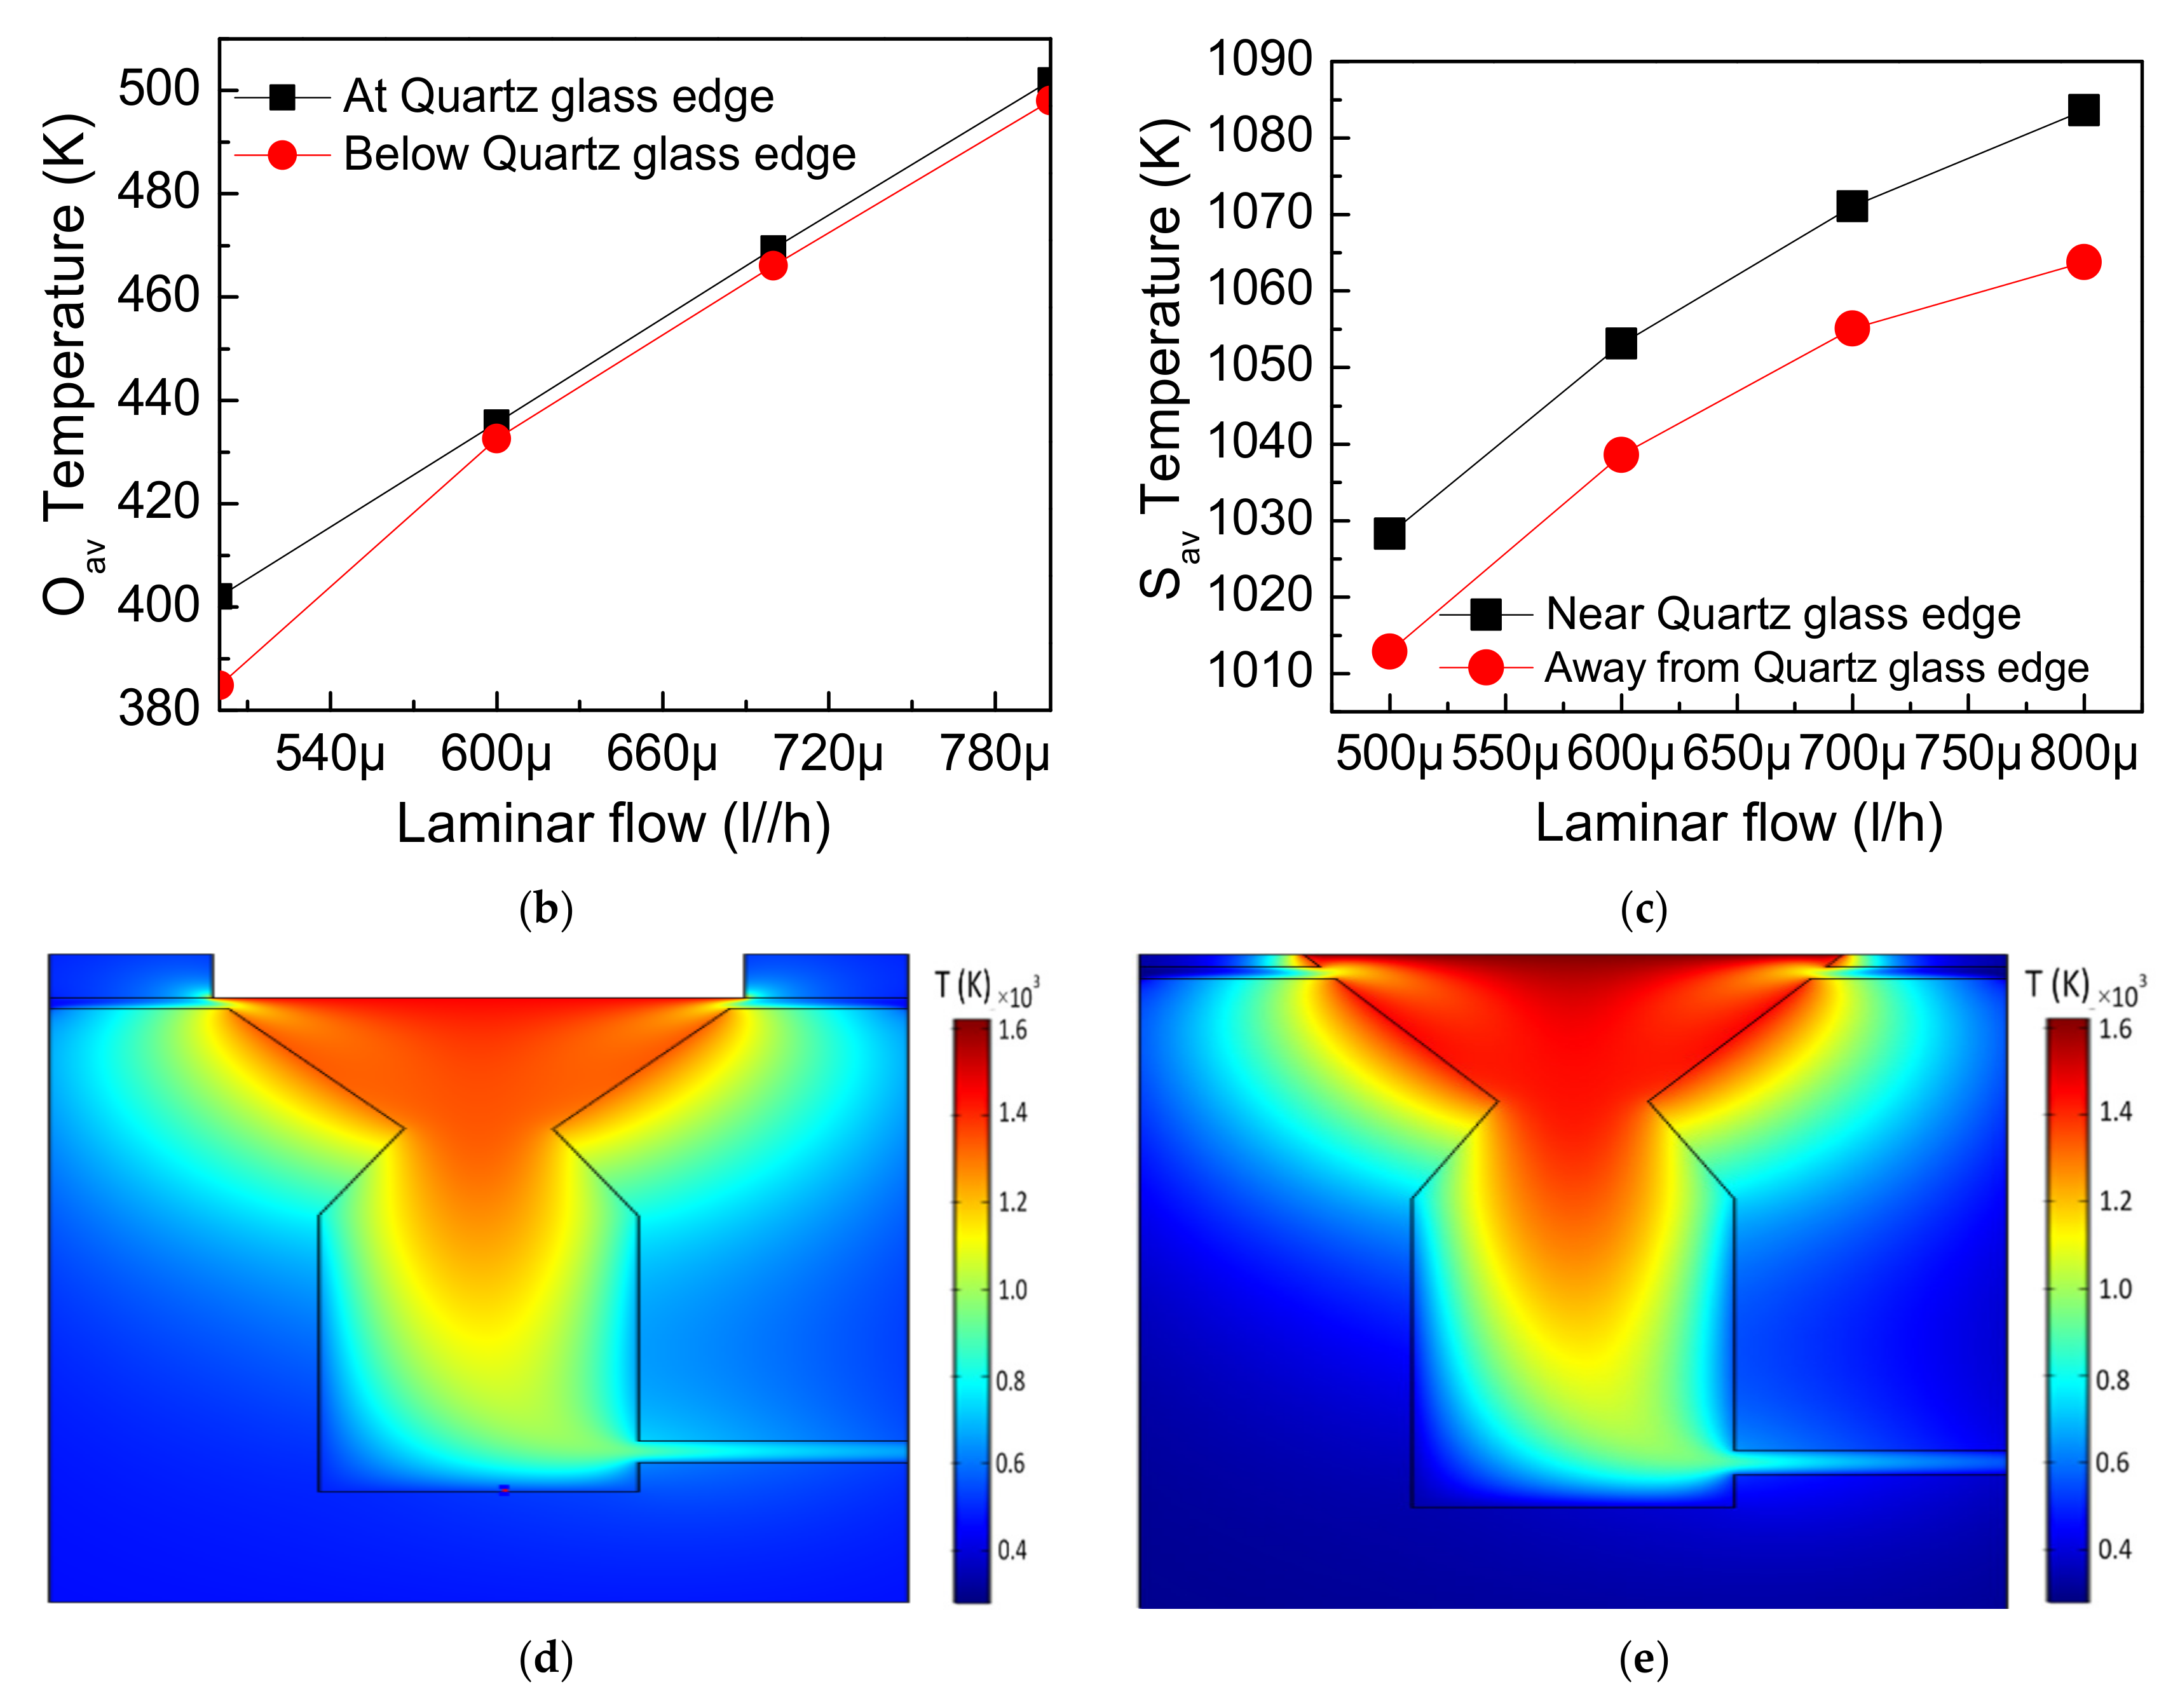
4.4. Effect of Thermal Performance of Inlet Location on Edges of Frustum
4.5. Impacts of Inlet Tube Location and Its Insulation Condition
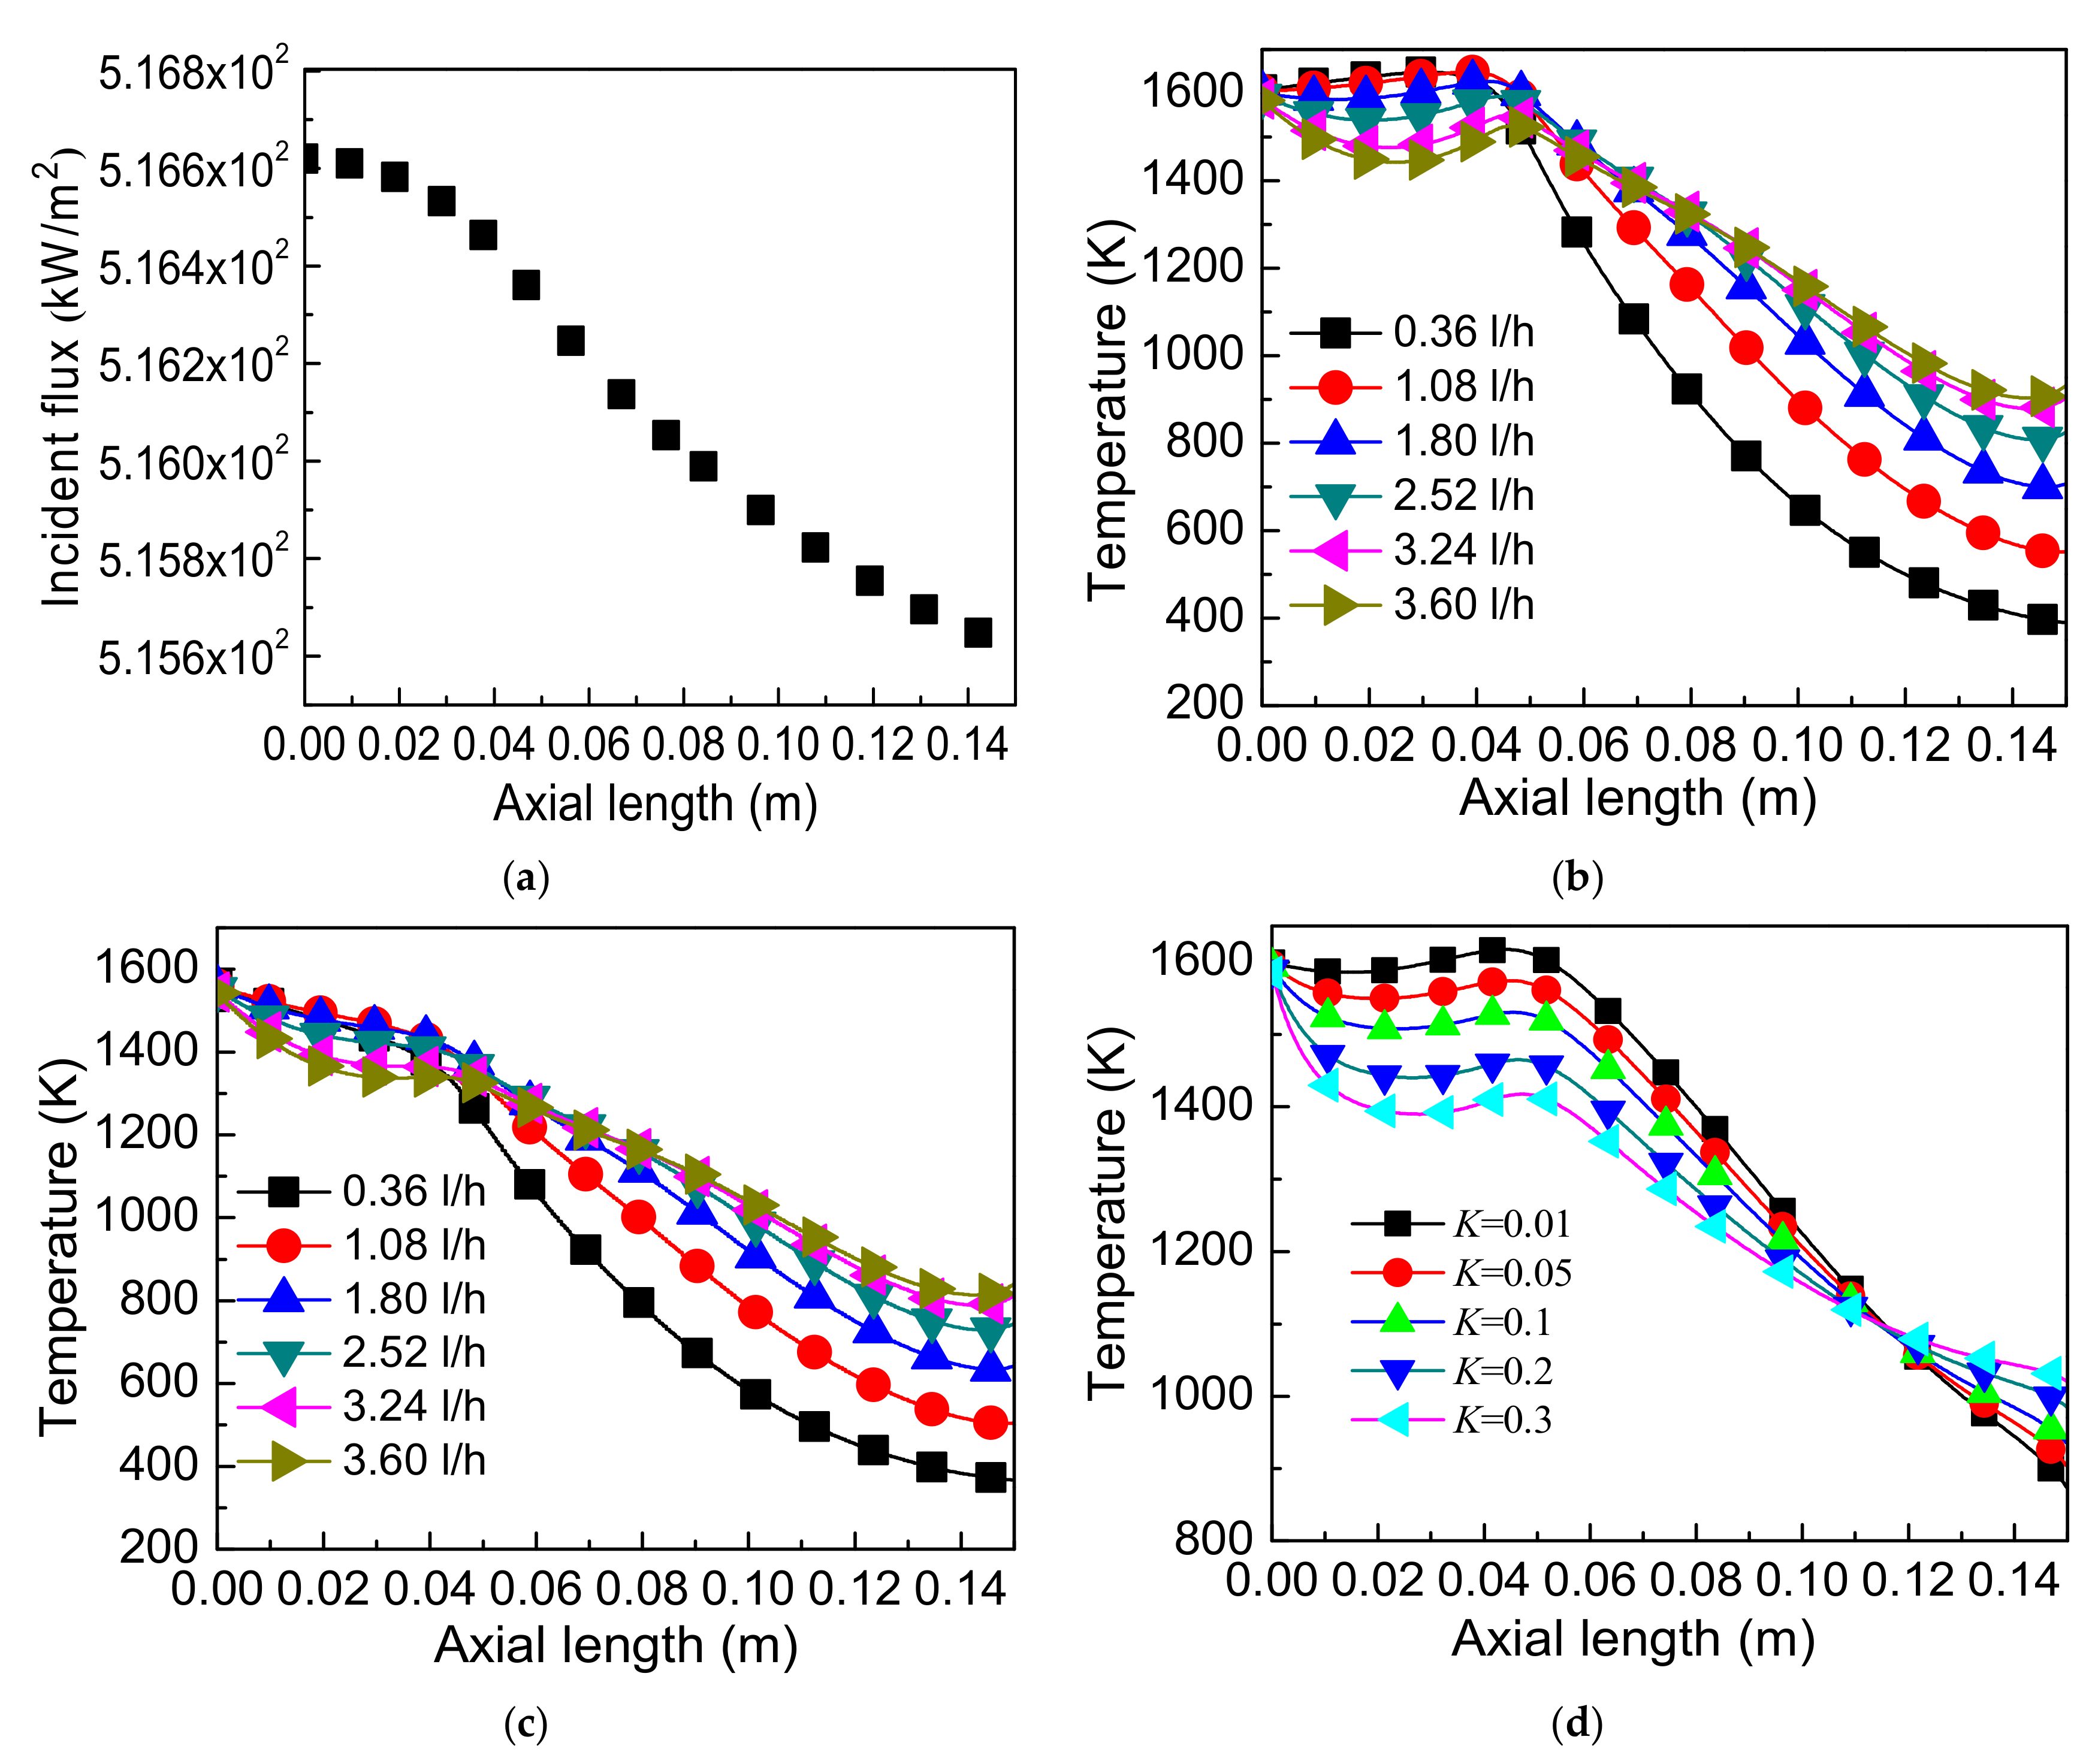
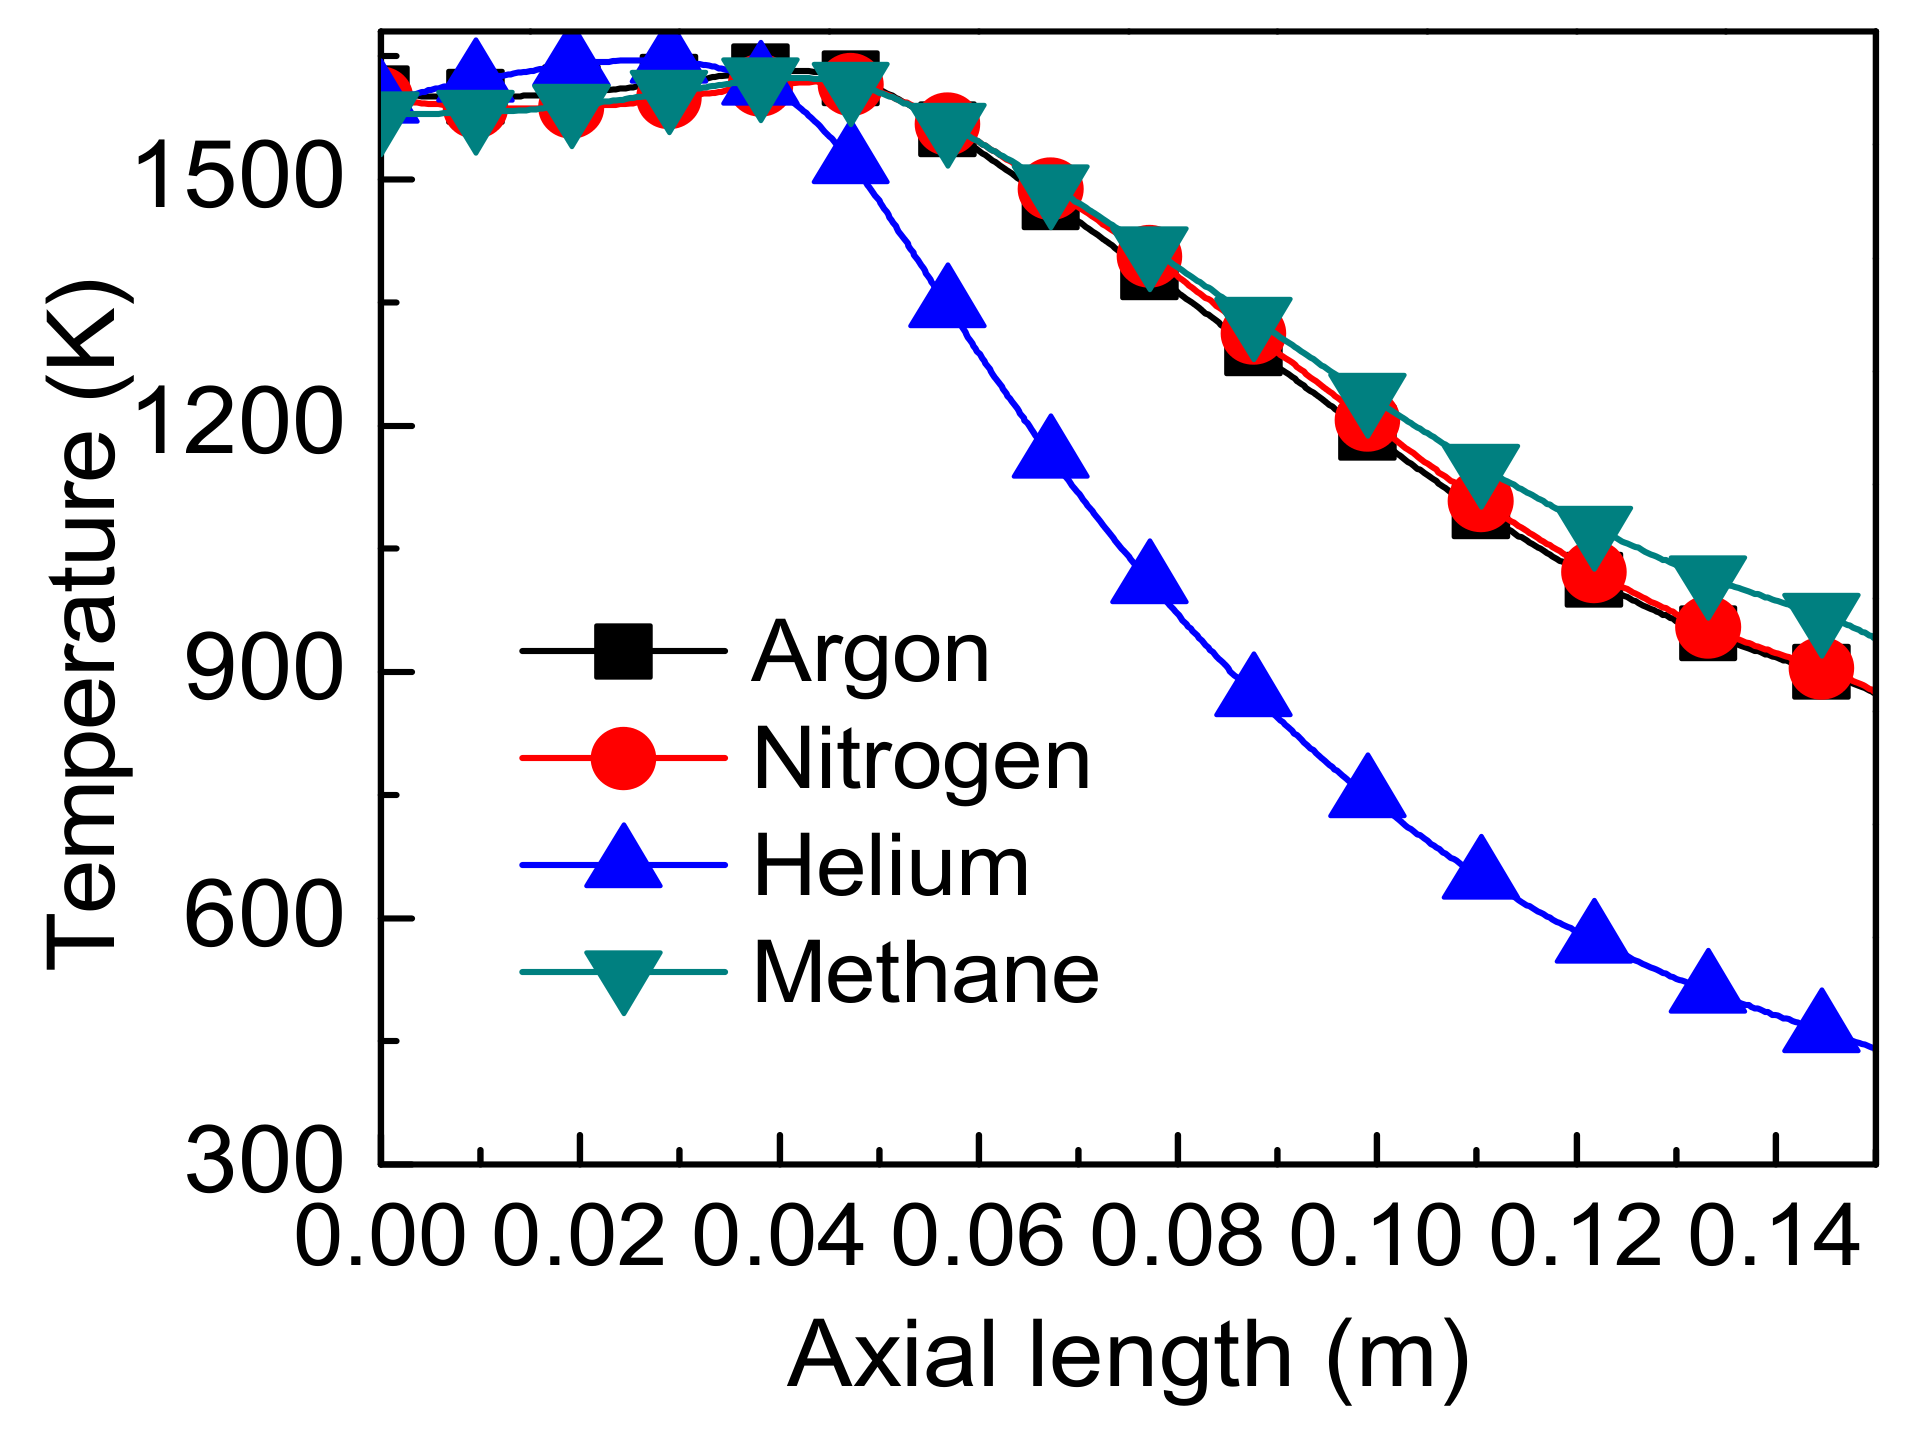
4.6. Effect of Fluid on Thermal Performance of Storage Reactor
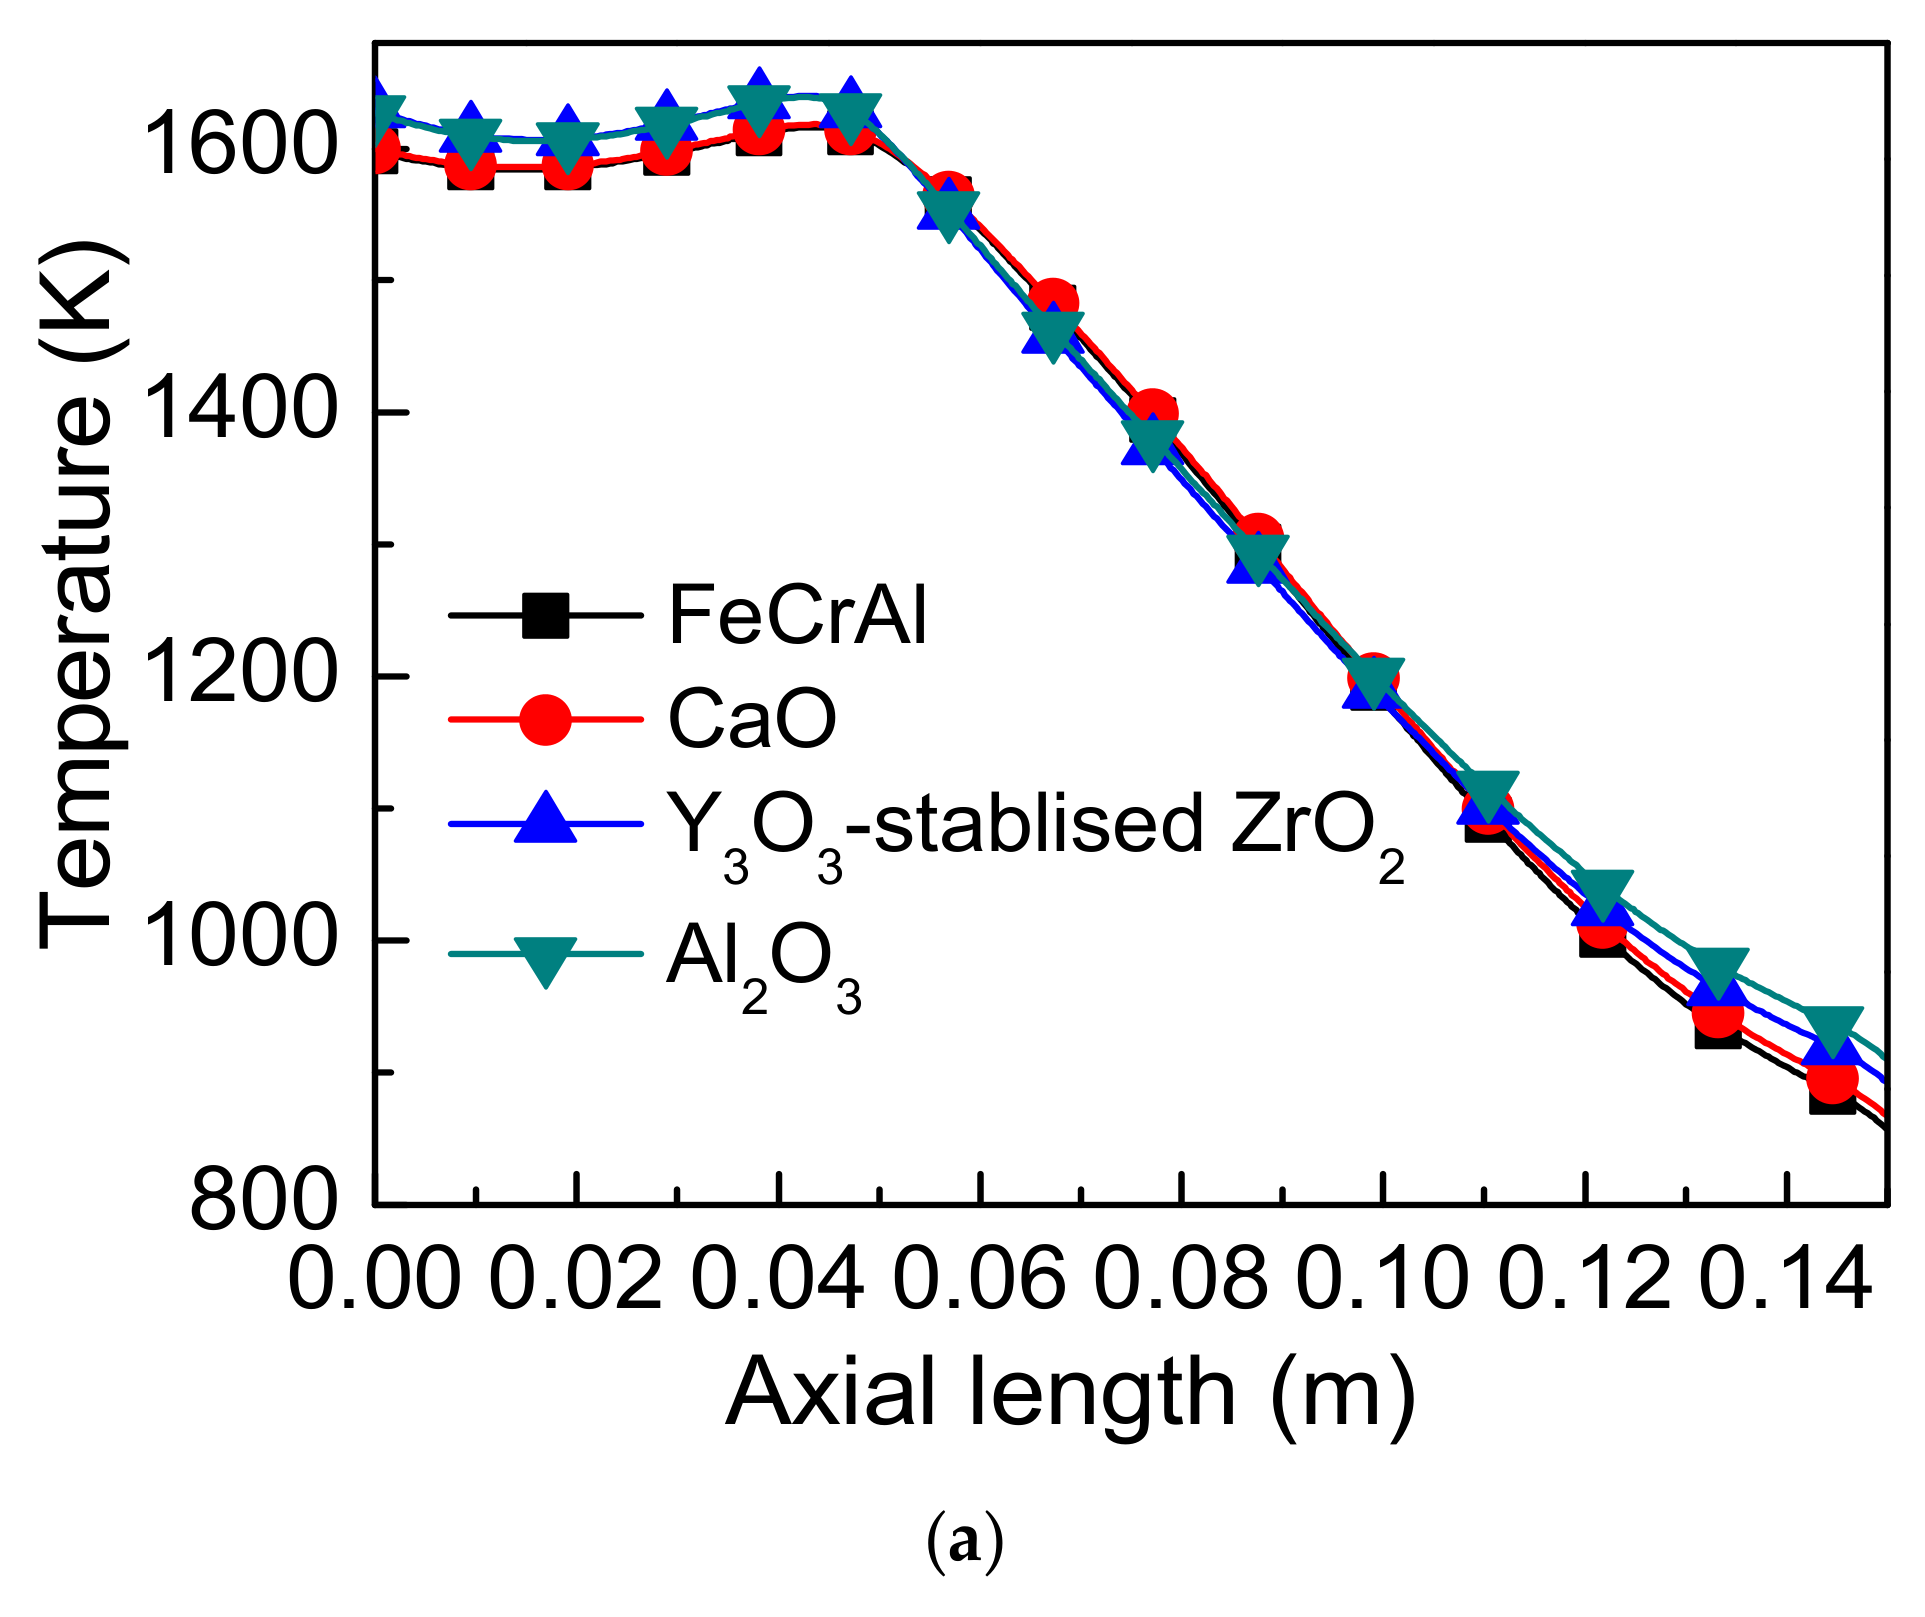
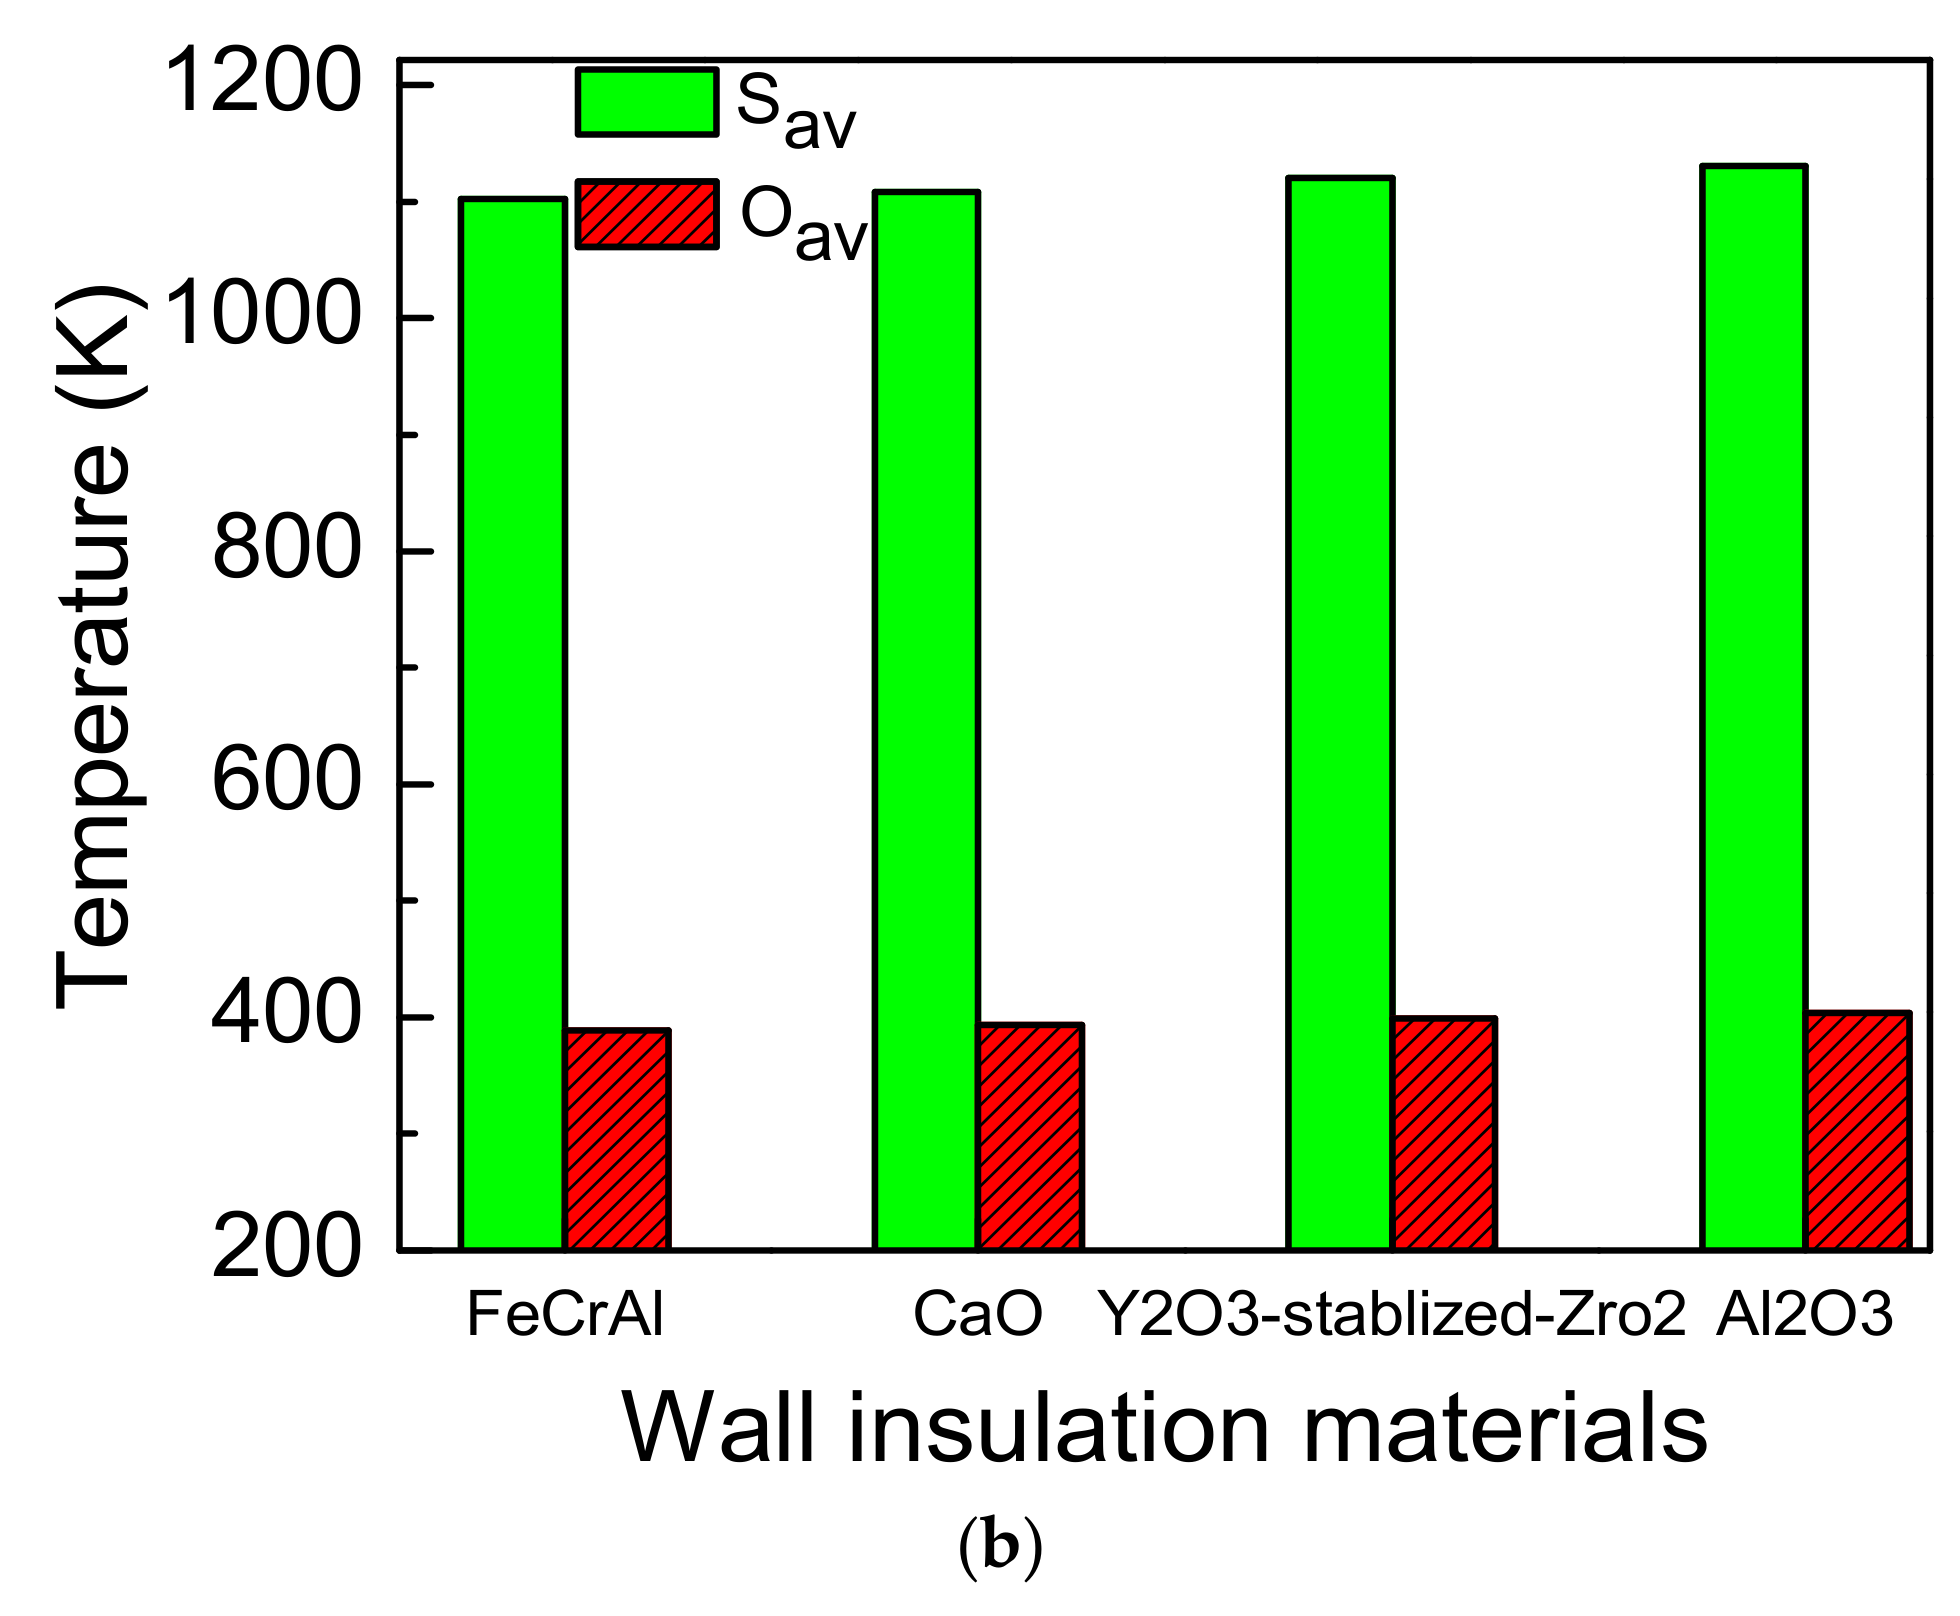
4.7. Effect of Wall Cavity Insulation Materials on Thermal Performance
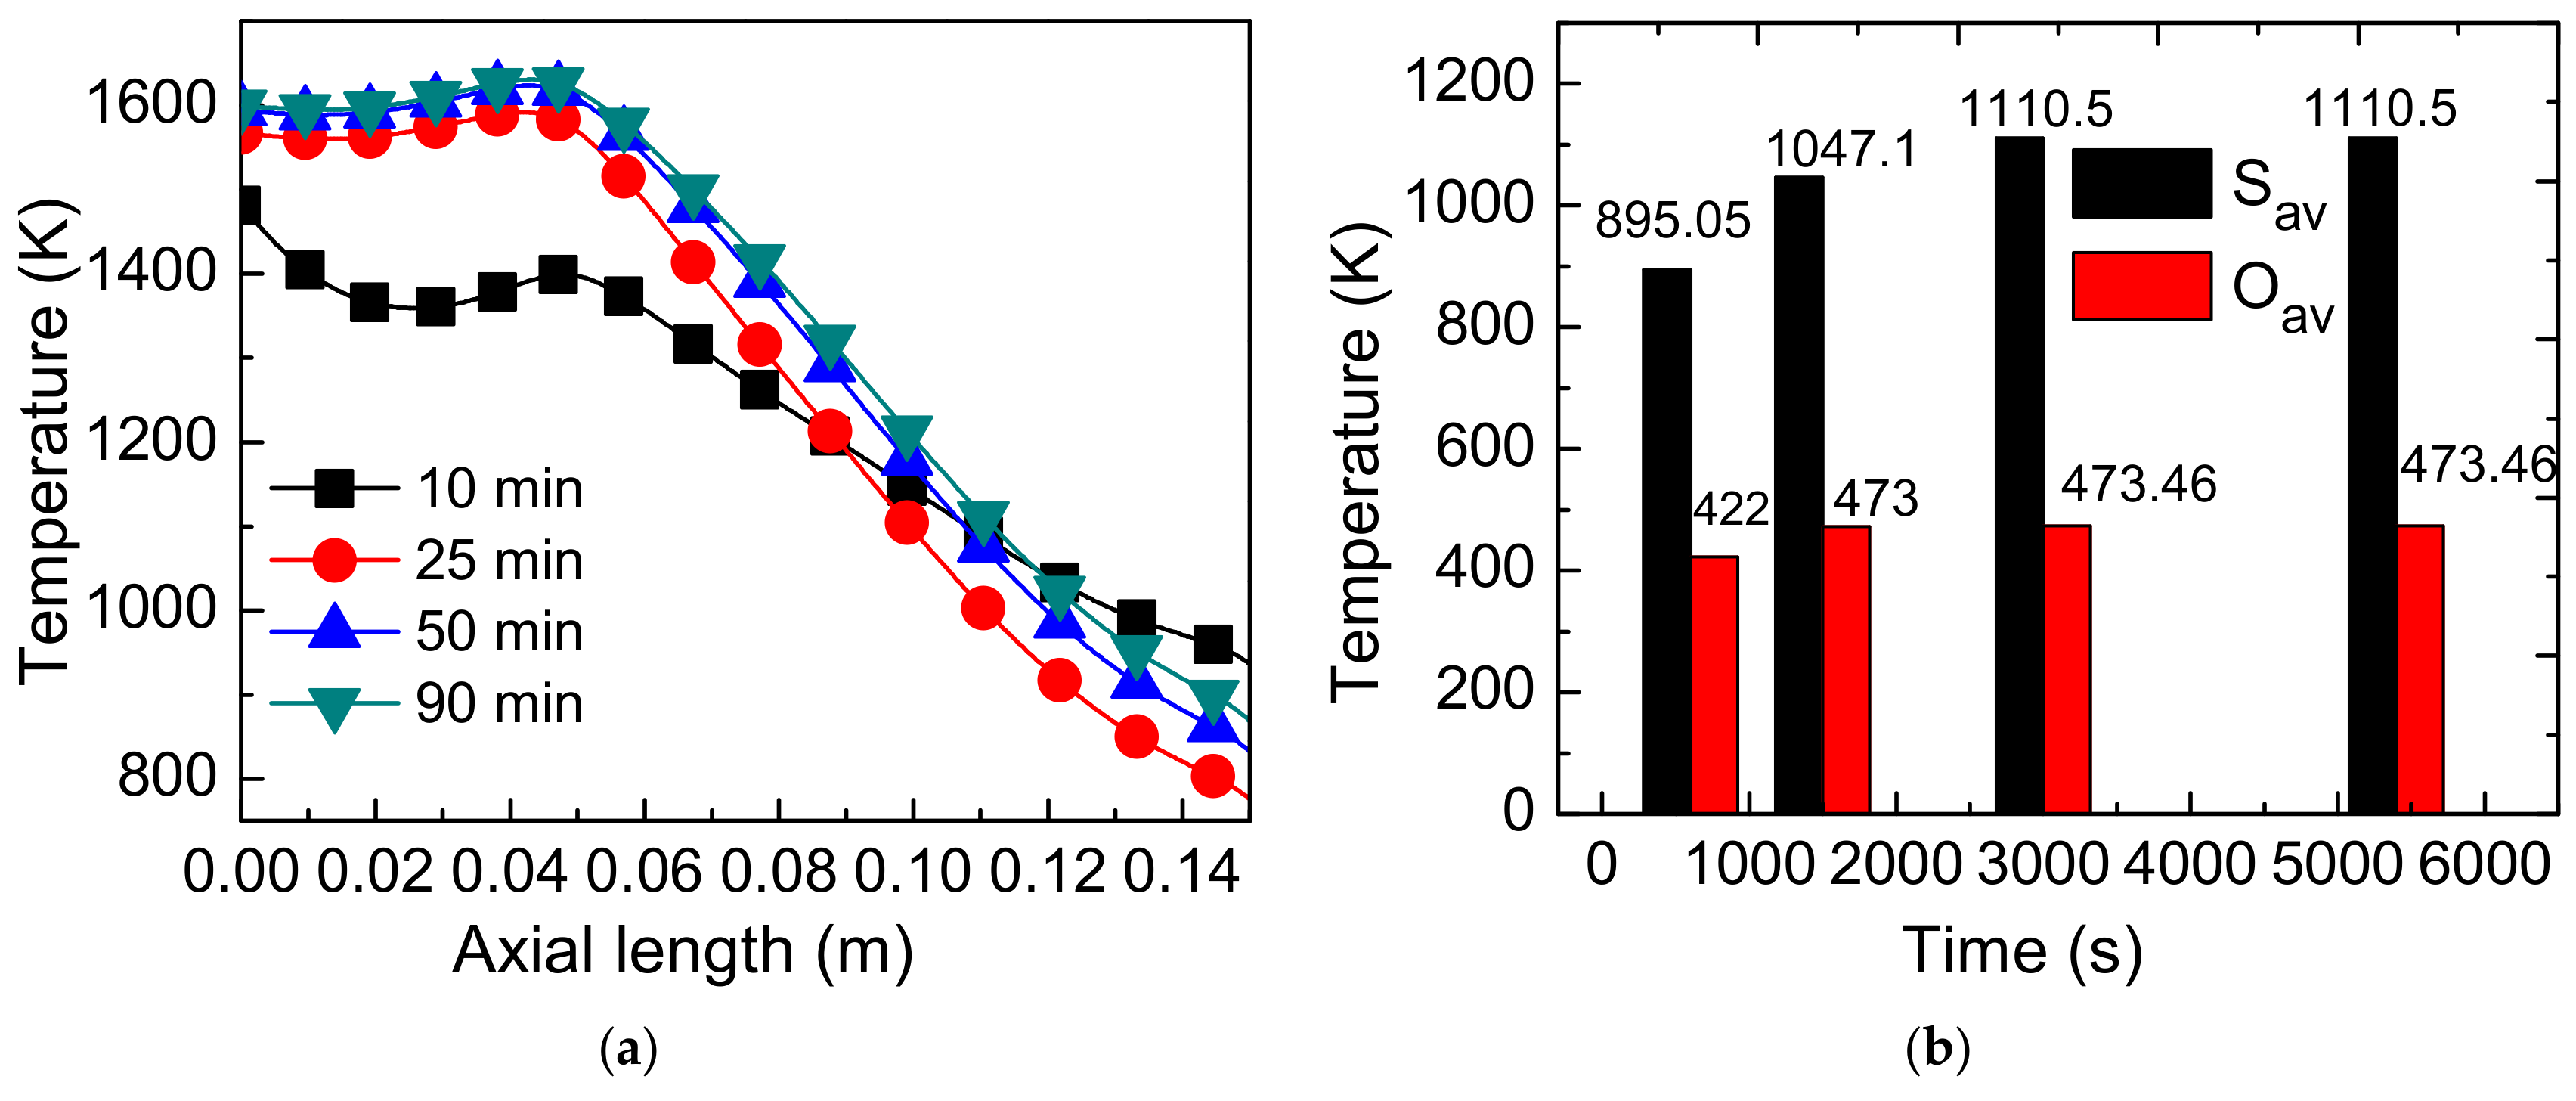
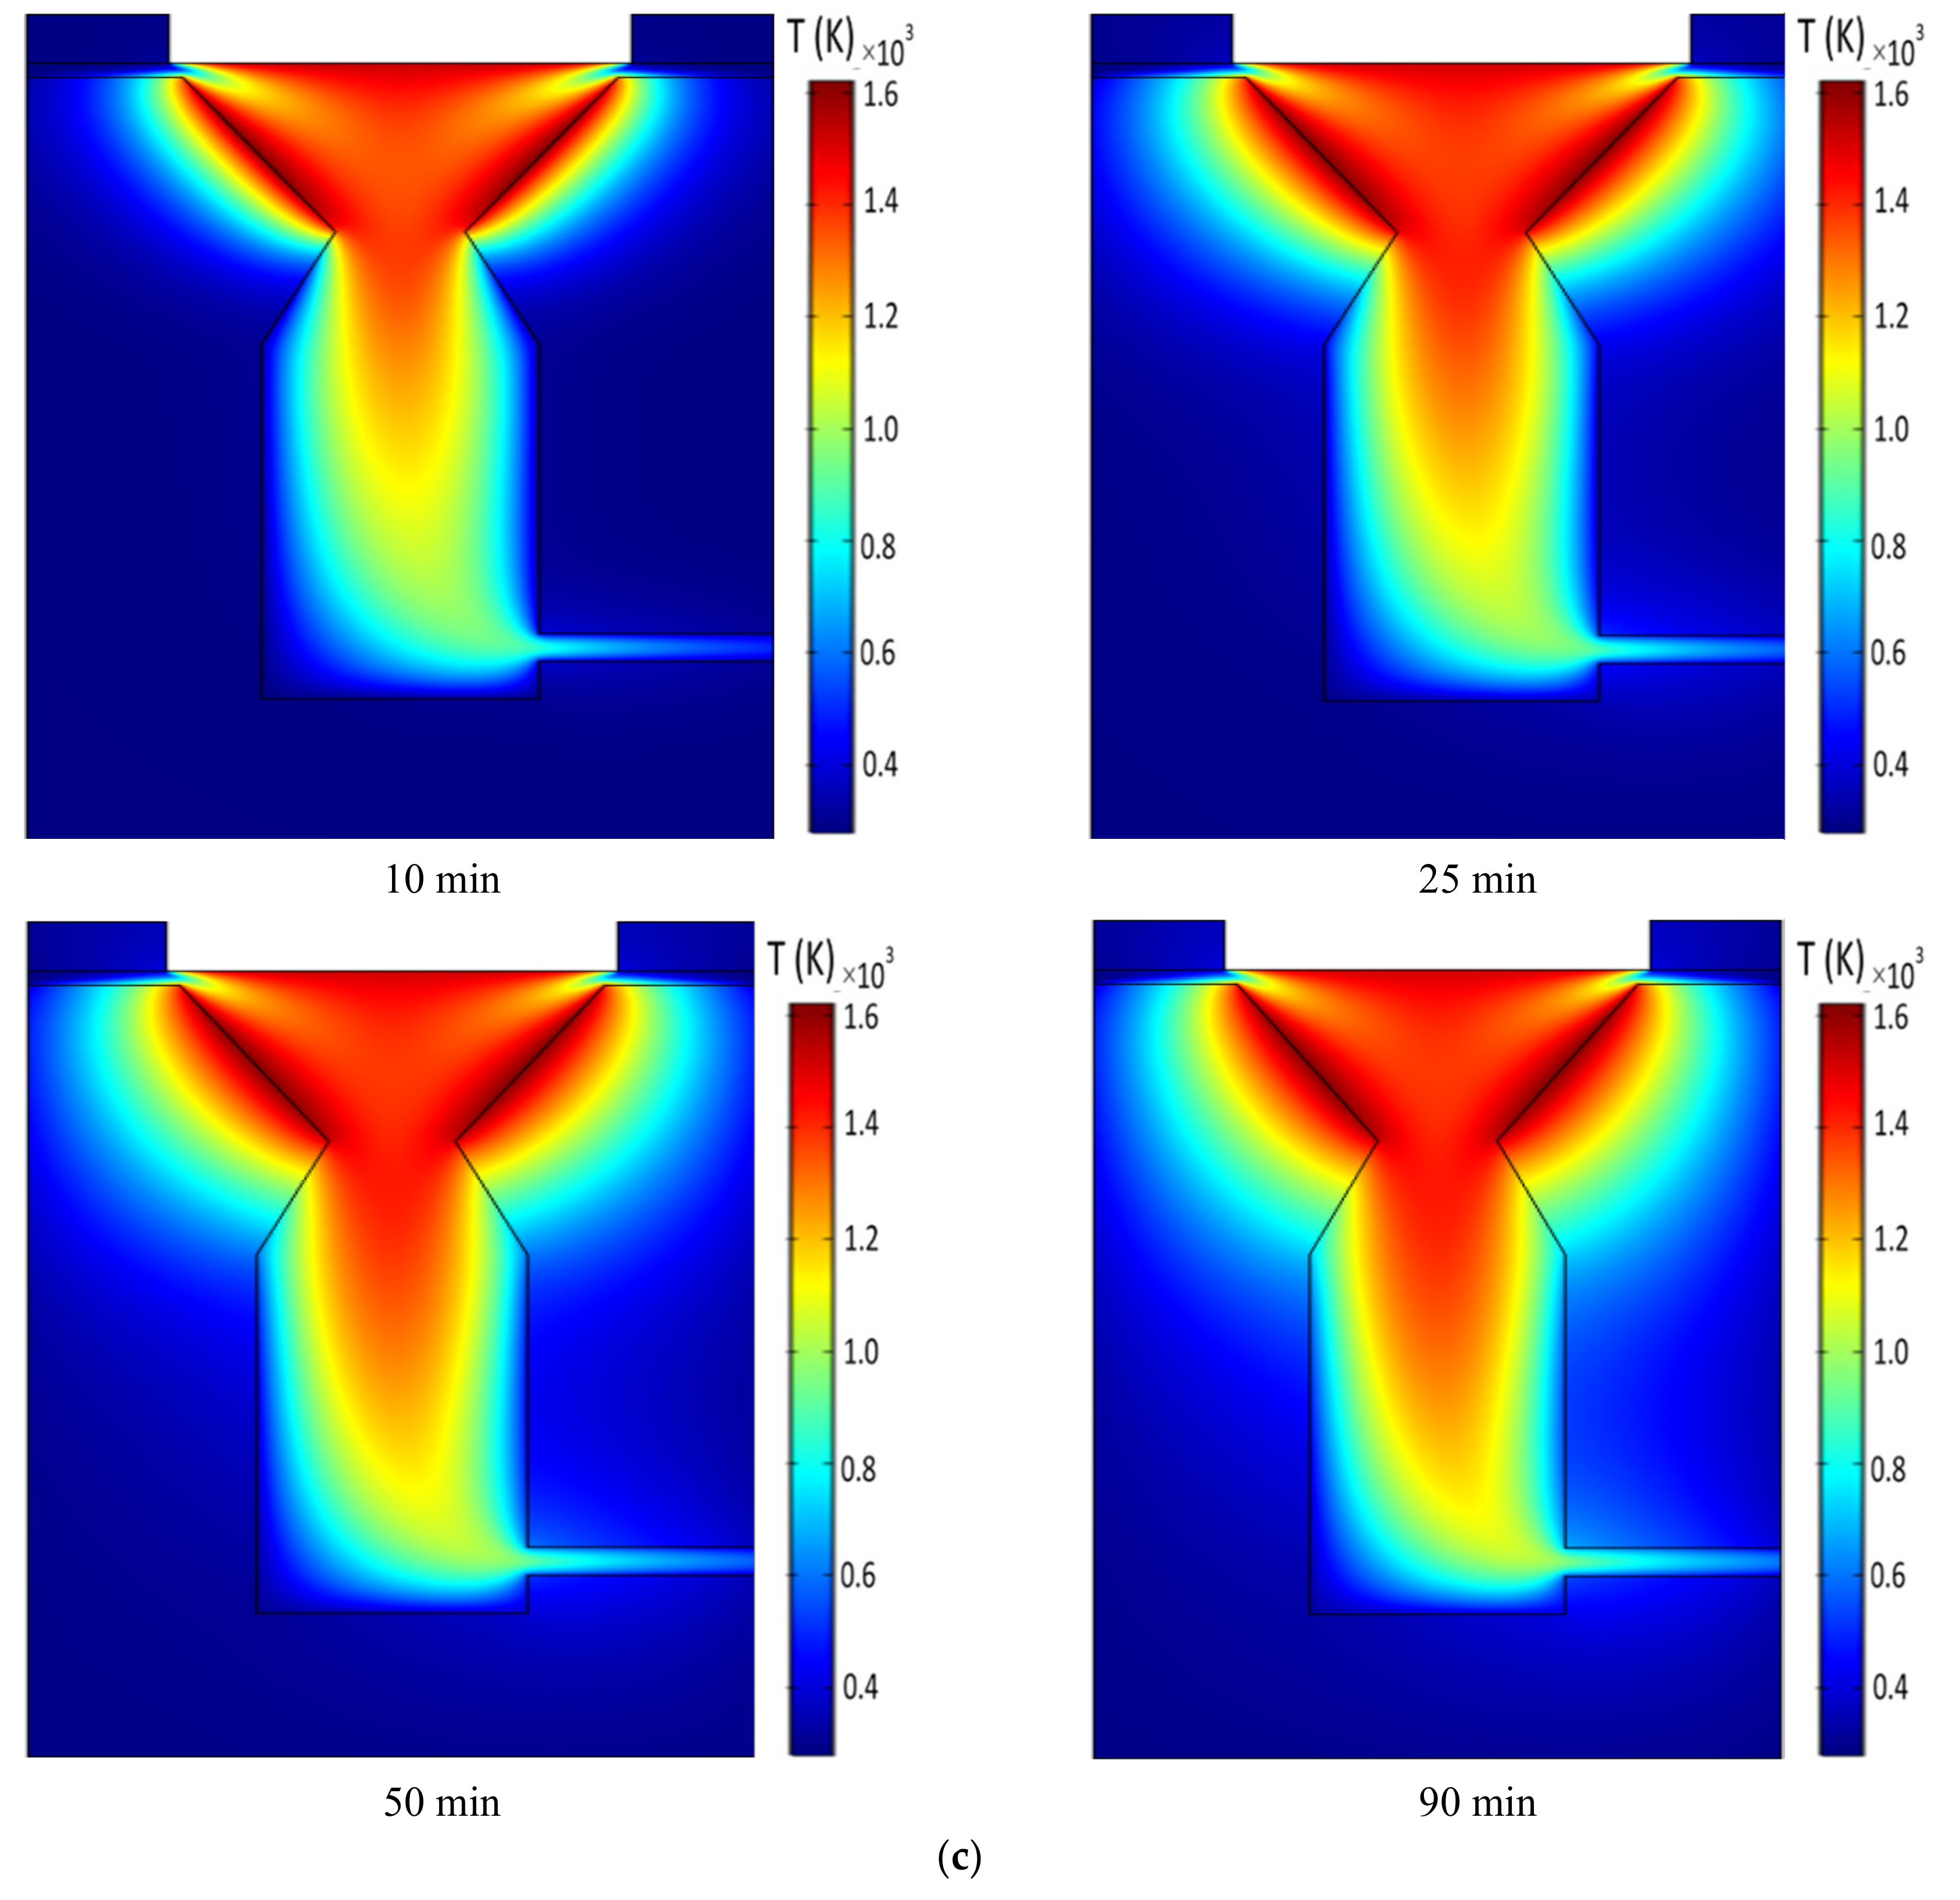
4.8. Instantaneous Temperature Distribution
5. Conclusions
Author Contributions
Funding
Acknowledgments
Conflicts of Interest
Nomenclature
| CP | Specific heat capacity | J/(kg·K) |
| G | Incident radiation intensity | W/m2 |
| T | Temperature | K |
| H | Heat conductivity | W/(m2/K) |
| P | Pressure | Pa |
| K | Thermal conductivity | J/(m·K) |
| U | Velocity vector | m/s |
| F | Body force vector | N/m2 |
| Qrad | Radiation heat source | W/m3 |
| nr | Refraction index | - |
| I | Radiation intensity | W/(m2·sr−1) |
| Greek symbol | ||
| Fluid density | kg/m3 | |
| Coefficient of thermal expansion | 1/K | |
| Absorption constant | 1/m | |
| Emissivity | m2·s−3 | |
| Stefan-Boltzmann constant | W/(m2·K4) | |
| Dynamic viscosity | Pa·s | |
| Scattering coefficient | 1/m | |
References
- Mao, Q. Recent developments in geometrical configurations of thermal energy storage for concentrating solar power plant. Renew. Sust. Energ. Rev. 2016, 59, 320–327. [Google Scholar] [CrossRef]
- Mahfuz, M.H.; Anisur, M.R.; Kibria, M.A.; Saidur, R.; Metselaar, I.H.S.C. Performance investigation of thermal energy storage system with Phase Change Material (PCM) for solar water heating application. Int. Commun. Heat Mass. 2014, 57, 132–139. [Google Scholar] [CrossRef]
- Mao, Q.; Shuai, Y.; Yuan, Y. Study on radiation flux of the receiver with a parabolic solar concentrator system. Energ. Convers. Manage. 2014, 84, 1–6. [Google Scholar] [CrossRef]
- Mao, Q.; Chen, H.; Zhao, Y.; Wu, H. A novel heat transfer model of a phase change material using in solar power plant. Appl. Therm. Eng. 2018, 129, 557–563. [Google Scholar] [CrossRef]
- Romero, M.; Steinfeld, A. Concentrating solar thermal power and thermochemical fuels. Energy Environ. Sci. 2012, 5, 9234–9245. [Google Scholar] [CrossRef]
- Kodama, T.; Gokon, N. Thermochemical cycles for high-temperature solar hydrogen production. Chem. Rev. 2007, 107, 4048–4077. [Google Scholar] [CrossRef]
- Meier, A.; Ganz, J.; Steinfeld, A. Modeling of a novel high-temperature solar chemical reactor. Chem.Eng. Sci. 1996, 51, 3181–3186. [Google Scholar] [CrossRef]
- Steinfeld, A.; Schubnell, M. Optimum aperture size and operating temperature of a solar cavity-receiver. Sol. Energy 1993, 50, 19–25. [Google Scholar] [CrossRef]
- Steinfeld, A.; Palumbo, R. Solar thermochemical process technology. Encycl. Phys. Sci.Technol. 2001, 15, 237–256. [Google Scholar]
- Schunk, L.O.; Haeberling, P.; Wepf, S.; Wuillemin, D.; Meier, A.; Steinfeld, A. A receiver-reactor for the solar thermal dissociation of zinc oxide. J. Sol.Energy Eng. 2008, 130, 021009. [Google Scholar] [CrossRef]
- Sturzenegger, M.; Nüesch, P. Efficiency analysis for a manganese-oxide-based thermochemical cycle. Energy 1999, 24, 959–970. [Google Scholar] [CrossRef]
- Bellan, S.; Alonso, E.; Gomez-Garcia, F.; Perez-Rabago, C.; Gonzalez-Aguilar, J.; Romero, M. Thermal performance of lab-scale solar reactor designed for kinetics analysis at high radiation fluxes. Chem.Eng. Sci. 2013, 101, 81–89. [Google Scholar] [CrossRef]
- Gardon, R. An instrument for the direct measurement of intense thermal radiation. Rev. Sci. 1953, 24, 366–370. [Google Scholar] [CrossRef]
- Gómez, F.; Gonzalez-Aguilar, J.; Romero, M. Experimental 3D flux distribution of a 7 kWe-solar simulator. In Proceedings of the SolarPACES Conference, Granada, Spain, 20–23 September 2011. [Google Scholar]
- Kenisarin, M.M. High-temperature phase change materials for thermal energy storage. Renew. Sust. Energ. Rev. 2010, 14, 955–970. [Google Scholar] [CrossRef]
- Yuan, Y.; Ruan, Z.-H.; Huang, X.; Jiang, Y.-Q.; Tan, H.-P. Energy-absorption-based explanation of the TiO2/C photocatalytic activity enhancement mechanism. J. Catal. 2017, 348, 246–255. [Google Scholar] [CrossRef]
- Fuqiang, W.; Ziming, C.; Jianyu, T.; Yuan, Y.; Yong, S.; Linhua, L. Progress in concentrated solar power technology with parabolic trough collector system: A comprehensive review. Renew. Sust. Energ. Rev. 2017, 79, 1314–1328. [Google Scholar] [CrossRef]
- Medrano, M.; Gil, A.; Martorell, I.; Potau, X.; Cabeza, L.F. State of the art on high-temperature thermal energy storage for power generation. Part 2—Case studies. Renew. Sust. Energ. Rev. 2010, 14, 56–72. [Google Scholar] [CrossRef]
- Zalba, B.; Marín, J.M.; Cabeza, L.F.; Mehling, H. Review on thermal energy storage with phase change: Materials, heat transfer analysis and applications. Appl. Therm. Eng. 2003, 23, 251–283. [Google Scholar] [CrossRef]
- Bie, Y.; Li, M.; Chen, F.; Królczyk, G.; Yang, L.; Li, Z.; Li, W. A novel empirical heat transfer model for a solar thermal storage process using phase change materials. Energy 2019, 168, 222–234. [Google Scholar] [CrossRef]
- Bie, Y.; Li, M.; Malekian, R.; Chen, F.; Feng, Z.; Li, Z. Effect of phase transition temperature and thermal conductivity on the performance of Latent Heat Storage System. Appl. Therm. Eng. 2018, 135, 218–227. [Google Scholar] [CrossRef]
- Lougou, B.G.; Shuai, Y.; Chen, X.; Yuan, Y.; Tan, H.; Xing, H. Analysis of radiation heat transfer and temperature distributions of solar thermochemical reactor for syngas production. Front. Energy 2017, 11, 480–492. [Google Scholar] [CrossRef]
- Lougou, B.G.; Shuai, Y.; Guohua, Z.; Chaffa, G.; Ahouannou, C.; Tan, H. Analysis of H2 and CO production via solar thermochemical reacting system of NiFe2O4 redox cycles combined with CH4 partial oxidation. Int. J. Hydrog. Energy 2018, 43, 5996–6010. [Google Scholar] [CrossRef]
- Lougou, B.G.; Shuai, Y.; Zhang, J.; Huang, X.; Yuan, Y.; Tan, H. Syngas production by simultaneous splitting of H2O and CO2 via iron oxide (Fe3O4) redox reactions under high-pressure. Int. J. Hydrog. Energy 2016, 41, 19936–19946. [Google Scholar]
- Lougou, B.G.; Shuai, Y.; Chaffa, G.; Xing, H.; Tan, H.; Du, H. Analysis of CO2 utilization into synthesis gas based on solar thermochemical CH4-reforming. J. Energy Chem. 2019, 28, 61–72. [Google Scholar] [CrossRef]
- Harris, J.A.; Lenz, T.G. Thermal performance of solar concentrator/cavity receiver systems. Sol. Energy 1985, 34, 135–142. [Google Scholar] [CrossRef]
- Reddy, K.S.; Vikram, T.S.; Veershetty, G. Combined heat loss analysis of solar parabolic dish—Modified cavity receiver for superheated steam generation. Sol. Energy 2015, 121, 78–93. [Google Scholar] [CrossRef]
- Le Roux, W.G.; Bello-Ochende, T.; Meyer, J.P. Operating conditions of an open and direct solar thermal Brayton cycle with optimised cavity receiver and recuperator. Energy 2011, 36, 6027–6036. [Google Scholar] [CrossRef]
- Prakash, M. Numerical study of natural convection heat loss from cylindrical solar cavity receivers. Renew. Energy 2014, 2014, 1–7. [Google Scholar] [CrossRef]
- Singh, A.; Lapp, J.; Grobbel, J.; Brendelberger, S.; Reinhold, J.P.; Olivera, L.; Ermanoski, I.; Siegel, N.P.; McDaniel, A.; Roeb, M.; et al. Design of a pilot scale directly irradiated, high temperature, and low pressure moving particle cavity chamber for metal oxide reduction. Sol. Energy 2017, 157, 365–376. [Google Scholar] [CrossRef]
- Bellan, S.; Alonso, E.; Perez-Rabago, C.; Gonzalez-Aguilar, J.; Romero, M. Numerical modeling of solar thermochemical reactor for kinetic analysis. Energy Procedia 2014, 49, 735–742. [Google Scholar] [CrossRef]
- Cheng, P. Two-dimensional radiating gas flow by a moment method. Am. Inst. Aeronaut. Astronaut. 1964, 2, 1662–1664. [Google Scholar] [CrossRef]
- Cheng, P. Dynamics of a radiating gas with application to flow over a wavy wall. Am. Inst. Aeronaut. Astronaut. 1966, 4, 238–245. [Google Scholar] [CrossRef]
- Wang, F.; Shuai, Y.; Tan, H.; Yu, C. Thermal performance analysis of porous media receiver with concentrated solar irradiation. Int. J. Heat Mass Transf. 2013, 62, 247–254. [Google Scholar] [CrossRef]
- Palumbo, R.; Keunecke, M.; Möller, S.; Steinfeld, A. Reflections on the design of solar thermal chemical reactors: Thoughts in transformation. Energy 2004, 29, 727–744. [Google Scholar] [CrossRef]
- Abanades, S.; Flamant, G. Production of hydrogen by thermal methane splitting in a nozzle-type laboratory-scale solar reactor. Int. J. Hydrog. Energy 2005, 30, 843–853. [Google Scholar] [CrossRef]
- Suter, S.; Steinfeld, A.; Haussener, S. Pore-level engineering of macroporous media for increased performance of solar-driven thermochemical fuel processing. Int. J. Heat Mass Transf. 2014, 78, 688–698. [Google Scholar] [CrossRef]
- Alonso, E.; Pérez-Rábago, C.; González-Aguilar, J.; Romero, M. A novel lab-scale solar reactor for kinetic analysis of non-volatile metal oxides thermal reductions. Energy Procedia 2014, 57, 561–569. [Google Scholar] [CrossRef]
- Costandy, J.; El Ghazal, N.; Mohamed, M.T.; Menon, A.; Shilapuram, V.; Ozalp, N. Effect of reactor geometry on the temperature distribution of hydrogen producing solar reactors. Int. J. Hydrog. Energy 2012, 37, 16581–16590. [Google Scholar] [CrossRef]
- Müller, R.; Haeberling, P.; Palumbo, R.D. Further advances toward the development of a direct heating solar thermal chemical reactor for the thermal dissociation of ZnO (s). Sol. Energy 2006, 80, 500–511. [Google Scholar] [CrossRef]
- Ackermann, S.; Takacs, M.; Scheffe, J.; Steinfeld, A. Reticulated porous ceria undergoing thermochemical reduction with high-flux irradiation. Int. J. Heat Mass Transf. 2017, 107, 439–449. [Google Scholar] [CrossRef]
- Lougou, B.G.; Shuai, Y.; Pan, R.; Chaffa, G.; Ahouannou, C.; Zhang, H.; Tan, H. Radiative heat transfer and thermal characteristics of Fe-based oxides coated SiC and Alumina RPC structures as integrated solar thermochemical reactor. Sci. China Technol. Sci. 2018, 61, 1788–1801. [Google Scholar] [CrossRef]
- Bellouard, Q.; Rodat, S.; Abanades, S.; Ravel, S.; Frayssines, P.-É. Design, simulation and experimental study of a directly-irradiated solar chemical reactor for hydrogen and syngas production from continuous solar-driven wood biomass gasification. Int. J. Hydrog. Energy 2019, 44, 19193–19205. [Google Scholar] [CrossRef]


| Section | Boundary Type | Flow Rate Vi | Energy |
|---|---|---|---|
| Left inlet (FZ) | Laminar-Inlet | Laminar inflow rate | Temperature 293.15 (K) |
| Right inlet (RJ) | Laminar-Inlet | Laminar inflow rate (L/h) | Temperature 273.15 (K) |
| Irradiated walls (KM, LN, GH) | Walls | 0.0 | |
| External Boundaries (GB, AF, HC, DR, ZW, JQ) | Wall | 0.0 | |
| Quartz window (GH) | Wall | 0.0 | |
| Outlet (QW) | Pressure outlet |
| Maximum Element Size (mm) | Minimum Element Size (mm) | Maximum Element Growth Rate | Resolution Narrow Region | Curvature Factor | Minimum Element Quality | Average Element Quality | Element Length Ratio |
|---|---|---|---|---|---|---|---|
| 0.657 | 0.001 | 1.300 | 1.000 | 0.300 | 0.568 | 0.957 | 0.938 |
© 2020 by the authors. Licensee MDPI, Basel, Switzerland. This article is an open access article distributed under the terms and conditions of the Creative Commons Attribution (CC BY) license (http://creativecommons.org/licenses/by/4.0/).
Share and Cite
Getahun Dessie, Y.; Guene Lougou, B.; Qi, H.; Tan, H.; Zhang, J.; Gao, B.; Islam, M.A. Reactor Design and Thermal Performance Analysis for Solar Thermal Energy Storage Application. Energies 2020, 13, 3186. https://doi.org/10.3390/en13123186
Getahun Dessie Y, Guene Lougou B, Qi H, Tan H, Zhang J, Gao B, Islam MA. Reactor Design and Thermal Performance Analysis for Solar Thermal Energy Storage Application. Energies. 2020; 13(12):3186. https://doi.org/10.3390/en13123186
Chicago/Turabian StyleGetahun Dessie, Yabibal, Bachirou Guene Lougou, Hong Qi, Heping Tan, Juqi Zhang, Baohai Gao, and Md Arafat Islam. 2020. "Reactor Design and Thermal Performance Analysis for Solar Thermal Energy Storage Application" Energies 13, no. 12: 3186. https://doi.org/10.3390/en13123186
APA StyleGetahun Dessie, Y., Guene Lougou, B., Qi, H., Tan, H., Zhang, J., Gao, B., & Islam, M. A. (2020). Reactor Design and Thermal Performance Analysis for Solar Thermal Energy Storage Application. Energies, 13(12), 3186. https://doi.org/10.3390/en13123186