Article

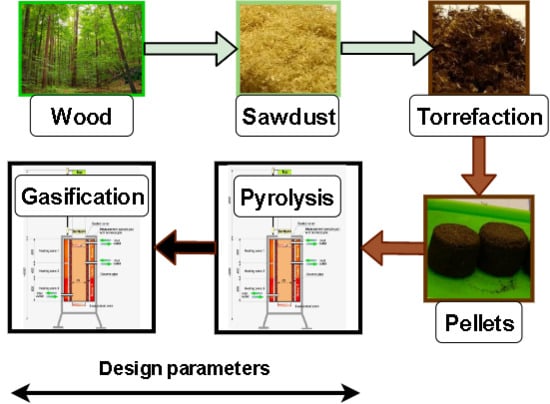
Influence of Torrefaction and Pelletizing of Sawdust on the Design Parameters of a Fixed Bed Gasifier

1
Department of Chemical and Biochemical Engineering, Technical University of Denmark, DK-2800 Kongens Lyngby, Denmark
2
Department of Mechanics, Machines, Devices and Energy Processes; Wrocław University of Science and Technology, 50-370 Wrocław, Poland
3
Department of Chemical Engineering, Shaheed Bhagat Singh State Technical Campus, Ferozepur 152004, Punjab, India
4
School of Electric Power, South China University of Technology, Guangzhou 510641, China
*
Author to whom correspondence should be addressed.
Energies 2020, 13(11), 3018; https://doi.org/10.3390/en13113018
Submission received: 1 May 2020 / Revised: 5 June 2020 / Accepted: 8 June 2020 / Published: 11 June 2020

Abstract

:
Gasification of biomass in fixed bed gasifiers is a well-known technology, with its origins dating back to the beginning of 20th century. It is a technology with good prospects, in terms of small scale, decentralized power co-generation. However, the understanding of the process is still not fully developed. Therefore, assessment of the changes in the design of a gasifier is typically performed with extensive prototyping stage, thus introducing significant cost. This study presents experimental results of gasification of a single pellet and bed of particles of raw and torrefied wood. The procedure can be used for obtaining design parameters of a fixed bed gasifier. Results of two suits of experiments, namely pyrolysis and CO2 gasification are presented. Moreover, results of pyrolysis of pellets are compared against a numerical model, developed for thermally thick particles. Pyrolysis time, predicted by model, was in good agreement with experimental results, despite some differences in the time when half of the initial mass was converted. Conversion times for CO2 gasification were much longer, despite higher temperature of the process, indicating importance of the reduction reactions. Overall, the obtained results could be helpful in developing a complete model of gasification of thermally thick particles in a fixed bed.

Graphical Abstract

1. Introduction

Nowadays the importance of renewable energy sources, such as biomass, is increasing due to the increased international pressure to gradually phase out the fossil fuels. Biomass is the one of non-intermittent, controllable and potentially flexible sources [1] and it can be used with sensibly low thermo-ecologic cost [2,3].
Torrefaction is a process of thermal valorization of solid fuel in order to enhance its fuel properties subsequently allowing low-grade fuels, such as biomass, to become a tradable commodity [4]. It is a process that is considered to improve the logistics and handling of the upgraded fuel [5,6,7,8,9,10] and make it more suitable for final use, such as co-firing [11,12,13] or gasification [14,15,16]. Torrefaction is sometimes called slow pyrolysis and it typically takes place at temperatures between 250 °C and 300 °C with residence times ranging between 10 min and 60 min [4,17,18,19,20,21,22,23,24,25,26]. During torrefaction, part of the mass of the feedstock is removed. Some literature sources treat torrefaction as mild pyrolysis, which is a thermal decomposition of the organic material under the absence of oxygen [27]. Depending on the parameters of the process, pyrolysis may result in different yields of char, liquids (oils) and gases [28,29]. For lignocellulosic material reactions proceed, starting with a set of primary reactions, among which one can name char formation, depolymerization and fragmentation [30]. Released volatile organic compounds are typically unstable and are a subject of secondary reactions such as cracking, recombination or re-polymerization [30], with the latter taking place even in the pyrolysis oil [28].
Gasification is a process that converts solid fuel to gas [31,32]. Air and steam are mostly used as a gasifying agents [33]. The gas, produced by a gasifier (sometimes called producer gas or more often syngas), consists mainly of CO, H2, CO2, H2O (vapor), with smaller shares of other light hydrocarbons such as methane [33,34] as well as more heavy hydrocarbons such as phenols, toluene, naphthalene, benzene along with other aromatic compounds [35], which are often referred to as tars [31,36]. After heating and drying of the solid fuel, pyrolysis takes place. In case of the fixed bed gasifiers, it is often referred to as flaming pyrolysis [31,37] as the heat for the pyrolysis is obtained from the combustion of the pyrolytic gases. Extensive amount of work has been done so far on numerical modelling of the gasification in the entrained flow reactors, working with coal [38]. Much less work was dedicated to gasification of biomass [39], although the existence of an extensive amount of pyrolysis kinetics data, using a multitude of different models shall not be overlooked [40,41,42,43]. Nonetheless, only scarce amount of work has been dedicated to numerical models of gasification of torrefied biomass in a fixed bed. However, more recently some works were dedicated to modelling of the pyrolysis of thermally thick biomass particles, which could be considered as laying the foundation for comprehensive numerical modeling of the gasification of biomass in fixed bed reactors [44,45,46,47,48].
There is little information, mentioned in the literature, about the influence of torrefaction of biomass on its subsequent gasification. Prins et al. suggested improvement in the efficiency of the gasification when torrefaction is applied as the valorization technique [14]. Xue et al. suggested that torrefaction might have a positive influence on gasification, due to the improved reactivity of the biomass (Miscanthus), after torrefaction [49]. Couhert et al. reported improved quality of gas, from entrained flow gasification of torrefied wood, in comparison to gasification of raw material [16]. The research, performed by Weiland et al., showed increased gasification efficiency, when comparing torrefied and raw biomass, gasified in a pilot scale entrained flow gasifier [50]. Sarkar et al. studied gasification of raw and torrefied switchgrass in an allothermal fixed bed gasifier and observed increased efficiency of the gasification of torrefied material [51]. Pawlak-Kruczek et al. showed, that valorization of sewage sludge, by means of torrefaction, resulted in decreased content of tars with high melting points, during gasification in fixed bed allothermal gasifier [24].
Gasification in a fixed bed has been a subject of extensive research [31,36,37,52,53,54,55,56,57,58]. However, there is still a knowledge gap in terms of influence of torrefaction on the gasification of thermally thick particles. Moreover, little is known in terms of the combined effect of torrefaction and pelletizing on gasification of such particles. The aim of this paper is to fill this gap and expand knowledge on the influence of torrefaction and density of pellets on gasification of a thermally thick particle—i.e., torrefied wood pellets. The study aims to compare experimental results with model developed by Luo et al. [59], by comparing the devolatilization times of a thermally thick pellet. Finally, this study is also focused on reporting of some practical values useful as design parameters of a fixed bed gasifier.

2. Materials and Methods

2.1. Sample Preparation and Analysis of Raw and Torreffied Materials

Sawdust from mixed wood species was used for this research. Sawdust was separated into different particle size fractions by using a set of calibrated sieves and a sieve shaker. Sieving was performed for 30 min. Sieved sample was separated into two fractions according to the size, i.e. a coarse fraction between 3150 µm and 1000 µm, and fine fraction with particles smaller than 200 µm.
In order to perform pre-selection of torrefaction conditions, a sample of a raw sawdust, was a subject of thermogravimetric analysis and differential thermogravimetry (TGA/DTG) that was performed using a TGA/DT Pyris Diamond instrument from Perkin Elmer (Waltham, MA, United States). A two-step program was set. During the first step, the sample was heated in up to 105 °C with a heating rate of 10 °C/min, with a hold period of 20 min afterwards. During the second step, the sample was heated up to 850 °C with a heating rate of 10 °C/min. The nitrogen of 99.999% purity was used as inert gas for pyrolysis tests. Fine particles, of particle size smaller than 200 μm, were used.
A Perkin Elmer (Waltham, MA, United States) 2400 analyzer was used for the ultimate analysis, which was performed in compliance with the procedure set in the standard EN ISO 16948 [60]. Each of the tested materials was milled and sieved through a sieve with aperture size of 200 µm, using mortar and pestle, prior to ultimate analysis. Friedl Equation [61,62,63] was used to estimate the Higher Heating Value (HHV) of both raw and torrefied wood:
HHV = 3.55·C2 − 232·C − 2230·H + 51.2·C·H + 131·N + 20,600
where, C, H, N represent carbon, hydrogen, and nitrogen, respectively, in dry biomass (i.e. values of C, H and N are substituted, without % sign, using values from the ultimate analysis). The result of the calculation gives HHV with kJ/kg unit. This equation was chosen as it had been validated for many different types of biomass, including woody biomass [61]. Friedl et al. reported a standard error of calibration of 337 kJ/kg and an R2 coefficient of 0.943 achieved during validation of Equation (1) against the experimental results [61]. Moreover, Gucho et al. [64] compared results obtained by calorimetric bomb with the results obtained by this formula for torrefied beech wood and Miscanthus, concluding that results obtained by Equation (1) varied less than 5% from calorimetry results [64].

2.2. Torrefaction and Pelletizing

Torrefaction of fine particles (particle sizes smaller than 200 μm) and coarse particles (particle sizes between 1000 μm and 3150 μm) was performed in closed ceramic dishes of ellipsoidal footprint, with wall thickness of approx. 4 mm and volume of approx. 100 ml, length of 10 cm, width of 6 cm, and height of 4 cm. Prior to the experiment, each dish was filled with material, which was poured from the height of approx. 5 cm, above the upper rim of the container. Pouring was performed, until a conical shaped heap formed, with the bottom of the heap aligned with the rim of the dish. Then the excess material was removed by shuffling a rigid scantling over the edge of the container in a manner similar to bulk density measurement, according to EN ISO 17828. This allowed the material to fill the container completely, without significant compaction. Closed containers were subsequently inserted into hot laboratory furnace, pre-heated to 300 °C. Torrefaction was performed, in duplicate, with two distinct residence times of 15 min and 30 min, in order to obtain distinctly different samples, with respect to the severity of the torrefaction process. Temperature and residence time were selected based on a typical range of torrefaction conditions, reported in the literature [4,8,23,24,25,26,65,66,67,68]. Selection of the temperatures from the higher end and residence time from lower end of reported conditions was dictated by the way these parameters influence productivity of torrefaction reactors. Containers were closed in order to prevent access of the air, as torrefaction in slightly oxidizing conditions can have significant influence on the product [18,69,70,71,72,73,74,75,76,77]. Closed containers were subsequently taken out of the furnace and placed into a desiccator, filled with silica gel, in order to cool down.
Pelletizing was performed, using a laboratory pelletizer, producing one pellet at a time. Pellets were pressed, using fine particles, in a dye of 12 mm diameter. Pressure of 60 bars was applied constantly for 1 min, using manual hydraulic press. Pressure of the hydraulic fluid was measured by an analogue gauge. Pelletizing was repeated at least 10 times for each material.

2.3. Devolatisation Model for Thermally Thick Particles

The model was originally developed by Luo et al. [59] to investigate spherical wood devolatilization at high temperature conditions in a single particle combustor. It is further modified to simulate biomass devolatilization of cylinder wood particles in this work.
The model is a one-dimensional model for cylinder wood particles and the anisotropy of the wood is neglected. Both internal and external heat transfer are included, and the mass transfer of the released volatiles is assumed to be unlimited. Radiation between wood particles and reactor walls is considered. The particle shrinkage changes linearly with the devolatilization degree. A fully devolatilized particle has a shrinkage factor of 0.2 (volume based).
Based on the assumptions, mentioned above, the heat balance of thermally-thick biomass particle can be expressed by the following Equation:
C p ρ p T ( t , r ) t = 1 r ( r λ e f f T ( t , r ) r ) r d X w d t ρ D B Y w 0 Q w d X v o l d t ρ D B Y v o l 0 Q p y r o
where, Cp, ρp, λeff are the specific heat capacity (J/(kgK)), particle density (kg/m3), and effective thermal conductivity (W/(m K)) of the biomass particle at time t, respectively; ρDB is the initial particle density (kg/m3) at t = 0 s; r indicates the radial position (m), t indicates time (s), whereas T is the particle temperature (K) and Yw0 is the initial water mass fraction (dry basis), and Yvol0 is the initial mass fraction of volatiles (dry basis). Qw and Qpyro are the evaporation heat and devolatilization heat (J/kg), respectively. dXw/dt and dXvol/dt are conversion rates described by a drying model and a devolatilization model. More details on drying and devolatilization models, and physical properties (such as conductivity of biomass, heat capacity, enthalpy of pyrolysis etc.) can be found in Luo et al. [59]. The boundary conditions at particle center and the external particle surface are described by Equation (3) and Equation (4), respectively:
T r | r = 0 = 0 ,     all t
λ e f f T r | r = R = h c ( T g T s ) + ξ σ ( T w 4 T s 4 )     t > 0
where, hc is the convective heat transfer coefficient, W/(m2K) determined by the correlation of Churchill and Bernstein [78], Tg, Tw, and Ts are gas, wall and particle external surface temperatures (K) respectively; ξ is the particle emissivity, which depends on many factors (e.g. temperature, wood type, surface structure). Following Luo et al. [59] it was assumed to be 0.85. R is the particle radius (m).

2.4. Pyrolysis and Gasification Experiments Using Isothermal Furnace

Pyrolysis is one of the stages of a gasification process [31,33,38]. Therefore, a pyrolysis zone can be distinguished in all types of fixed bed gasifiers [31,33]. Consequently, it influences design parameters, such as the residence time of the particles in the bed of a gasifier and its size [37]. However, Boudouard reaction along with other reduction reactions also play role in gasification [33,37]. Therefore, sizing of the reduction zone should not be overlooked in a design of a fixed bed gasifier. Due to these reasons two suits of experiments were performed, within the course of this study. Firstly a suite of pyrolysis experiments was performed at temperature of 600 °C, in N2 atmosphere (impurities <1%). Subsequently gasification tests were performed at temperature of 950 °C, in CO2 atmosphere (impurities <1%). Both temperatures were selected, as representative for the two distinct zones, based on temperature distribution in each of the zones, during fixed bed gasification of wood [31]. Each time a sample of approx. 1 g was used, either in a form of a pellet or as a bed of particles, which were introduced in a basket made of heat resistant steel mesh. Experiments were performed in duplicates.
Experiments were performed in a custom build isothermal furnace (Figure 1). The furnace has three distinct heating zones. Each of the zones consists of a band heater with ceramic insulation. Centre of the furnace is made of heat resistant steel tube, 2 m long, with an inner diameter of 60 mm. The furnace allows feeding various gases in and taking samples of the gases out at three different heights. Overall length of the tube is significant enough, with respect to its diameter, to preheat the gases relatively quickly. Thus, the temperature gradient in the furnace is considered negligible. Two fittings are used to close the top and the bottom of the pipe. The top fitting has a 10 mm hole in the center axis of the furnace. The drive shaft mounted at the top of the furnace can move vertically. A heat resistant wire is attached to the top of the drive shaft on one side, and to the sample basket on the other. Sample basket is made of heat resistant steel plate and mesh. Samples can be loaded by moving the drive shaft all the way to the bottom, with the bottom fitting taken off, thus moving the sample basket into the loading zone (Figure 1).
The composition of permanent gases in both cold, dry producer gas and pyrolytic gas was determined on-line using the Gas 3100P analyzer (manufactured by G.E.I.T Europe bvba, Bunsbeek, Belgium and supplied by Atut Sp. z O.O. Lublin, Poland). This analyzer uses non-dispersive infra-red (NDIR) sensors for measurements of CO2, CO, CH4 and CxHy (light hydrocarbons, given as an methane equivalents). A thermal conductivity detector (TCD) sensor is used to measure the H2 content, whereas an electrochemical sensor is used for the determination of the O2 content. The T90 response time of the analyzer is 15 s. Due to this reason time step for recording of the measurement of composition was set to be 15 s.
Conversion during the pyrolysis experiment was determined indirectly, using measurement of the composition of gaseous products, according to the following Equation:
C t i = t = 0 t i ( u CO 2 + u CO + u H 2 + u CH 4 + u CxHy ) t = 0 t Ω ( u CO 2 + u CO + u H 2 + u CH 4 + u CxHy )
where u CO 2 , u CO , u H 2 , u CH 4 , u CxHy is a respective share of CO2, CO, H2, CH4 and CxHy in the measured gas in the time step t i and t Ω is the time, when concentrations of the respective compounds were below detectability of the gas analyzer. Method could not be used for determination of the degree of conversion, during gasification, as it was impossible to distinguish between CO2 delivered to the process and produced during pyrolysis stage.

2.5. Uncertainty of Measurements

For the determination of the density of pellets maximum permissible error of the scale was 0.01 g, whereas, maximum permissible error of the caliper was 0.02 mm. Each measurement was repeated at least 10 times. For A type uncertainty confidence level of 95% was assumed, along with t-student distribution of the results. B type uncertainty was calculated according to Equation (6):
u B = g 3
where, g was respective standard permissible error.
Combined standard uncertainty for respective measurements of mass, length and diameter of produced pellets was calculated according to the following Equation:
u C = u A 2 + u B 2
where, u A and u B were A and B type uncertainties for measurement of each value (mass, length, diameter) respectively.
Combined standard uncertainties for measurements of length, diameter and mass of pellets were subsequently used to calculate systematic uncertainty for density of pellets, with the following Equation:
u ρ = d ρ d l u C l 2 + d ρ d φ u C φ 2 + d ρ d m u C m 2
where indexes l , φ and m indicate length, diameter and mass of pellets, respectively.
The maximum linearity error of Gas 3100P is 2% of the full measuring range. Measuring ranges were as follows: CO2 20%, CO 40%, CH4 10%, CxHy 5%, H2 55% and 25% in the case of O2. The Gas 3100P device has a linearity drift of 1% of measuring range per week, both for zero and for span. Uncertainty for the time measurement was assumed to be 15 seconds as this was the time step set for the gas analyzer.

3. Results and Discussion

Results of the ultimate analysis (Table 1), show increased carbon content of the torrefied biomass, when comparing to untreated wood. This trend has been confirmed by many different studies, for many different types of feedstock [62,79,80,81,82,83,84]. Similarly, an increase in HHV of torrefied wood was observed, which is similar to results reported different types of biomass in different studies [85,86,87,88]. The increase of carbon content is not significant, in comparison to results reported for torrefaction of wood at 300 °C [4,21,22,23]. This is especially the case for the torrefaction performed within the course of this study, with residence time of 15 min. This could be attributed to the way of performing torrefaction—i.e., bed of torrefied material was not packed and there was no flow of gas through the bed of material. Thus conduction was the only mean of heat transport throughout the bed of material.
This heat conduction limitation had more profound effect on smaller particles, which could be attributed to more void spaces between the particles. Typically gases are bad conductors of heat, therefore void spaces between particles have detrimental effect on heat conduction within a bed of particles.
It is well known that thermal processing influences any subsequent pelletizing process [89,90,91,92]. First of all, pellets of raw biomass are limited, in terms of their density, by the upper limit of the plant cell wall density, ranging between 1450 kg/m3 and 1500 kg/m3 [93]. This is determined by the density of the polymers the cell wall consists of, i.e., cellulose and hemicellulose [93,94,95]. During torrefaction this structure is effectively broken down, but also significant part of hemicellulose is lost due to thermal decomposition [19,22,66,96]. Nonetheless, true density reported for particles after torrefaction, can be higher, ranging between 1525 kg/m3 and 1640 kg/m3 [77]. Therefore, effectively the density of pellets obtained from torrefied biomass is a result of an intertwined relationship between the strengths and structure of material as well as the availability of surfaces that can be potentially bonded to one another, as well as the presence of the binder itself. Pellets made of torrefied wood within the course of the study are not significantly different to pellets of torrefied wood, presented in other studies. Comparisons with some existing literature results are made in Figure 2. Stelte et al. obtained pellets with densities, ranging between 700 kg/m3 and 830 kg/m3, for wood torrefied at temperatures lower than in this study (from 250 °C to 270 °C) [97]. However, severity of torrefaction might have not been as significant as suggested by the process temperature, as torrefaction was performed with relatively long residence time of 120 min [97]. Higher densities (between 950 kg/m3 and 1000 kg/m3) were achieved by Wang et al. [77], for similar torrefaction times and temperature ranging between 250 °C and 290 °C [77]. Torrefaction in this study was performed in the presence of oxygen [77]. However, this should not be considered as a cause of higher density of pellets, as similar density was also achieved by Wang et al. for material torrefied under an atmosphere with 0% oxygen content [77] (see Figure 2). Use of a hot die pre-heated to 170 °C during the experiments [77], seems to be the most plausible explanation. Another study, by Gaitan-Alvarez et al. [98] seems to confirm this hypothesis. The study reported densities of pellets ranging between 900 kg/m3 and 1300 kg/m3. Different species of tropical wood from Costa Rica were torrefied at relatively low temperatures (from 200 °C to 250 °C) and residence times (from 8 min to 12 min) [98]. However, temperature of 180 °C was applied during pelletizing process [98]. Overall, in comparison to untreated biomass, torrefaction introduces additional difficulty in terms of its pelletizing. However, in practice this could be off-set by decreased energy consumption for comminution, which is a pre-requisite for pelletizing or any other form of densification [99].
At first glance, the density of pellets does not seem to be an important design parameter of the fixed bed gasifier. However, density, shape, and the way pellets are stacked determine bulk density of the bed. Any particular size of the gasifier’s bed will only be able to hold certain volume of the material and higher density will undoubtedly imply higher mass of the bed. The mass of the bed, in conjunction with the time necessary to devolatilize and gasify a portion of that mass will determine the required size of the bed.
Additional practical implications will concern the mass of the bed that can be held, without collapsing. Typically, char after complete devolatilization becomes brittle. Thus, too high mass of the bed, pressing from the top, might introduce unnecessary compaction of the bed, leading to increase of the pressure drop. Pressure drop over the bed is a very important parameter of fixed bed gasification, as it significantly influences the flow rate of the air [100,101]. Moreover, density is an important parameter for thermally-thick particle devolatilization models [45,59].
The ability to correctly predict thermal decomposition of thermally-thick particle is crucial for estimation of the basic design parameter for a fixed bed gasifier—i.e., the residence time. This in turn allows estimation of the total size of the reactor, as well as the pyrolysis zone. Mass loss during pyrolysis, measured within the course of this study, is compared against the results obtained by the model (Figure 3).
However, the deviation seems to be significant for α between 0.05 and 0.95 (Figure 3). Furthermore, it seems to be important to state that the model seems to be good at predicting total devolatilization time as well as the time when the particle is almost completely decomposed (Figure 4). Therefore, it seems plausible to conclude that the model gives satisfactory predictions, which could be used for estimation of the design parameters of fixed bed gasifiers. It seems prudent to mention that estimation of the mass loss history indirectly (Figure 5) is prone to some errors, both on the modeling and experimental side.
The degree of conversion, predicted by the model, was slightly underestimated for raw wood pellets, in comparison to experimental results (Figure 3a). On the other hand, the model overestimated the degree of conversion (α) for torrefied wood, with the difference increasing with the severity of torrefaction (Figure 3b,c). Regarding the modeling side, it seems plausible to state that the observed differences were probably caused by two reasons:
(1)
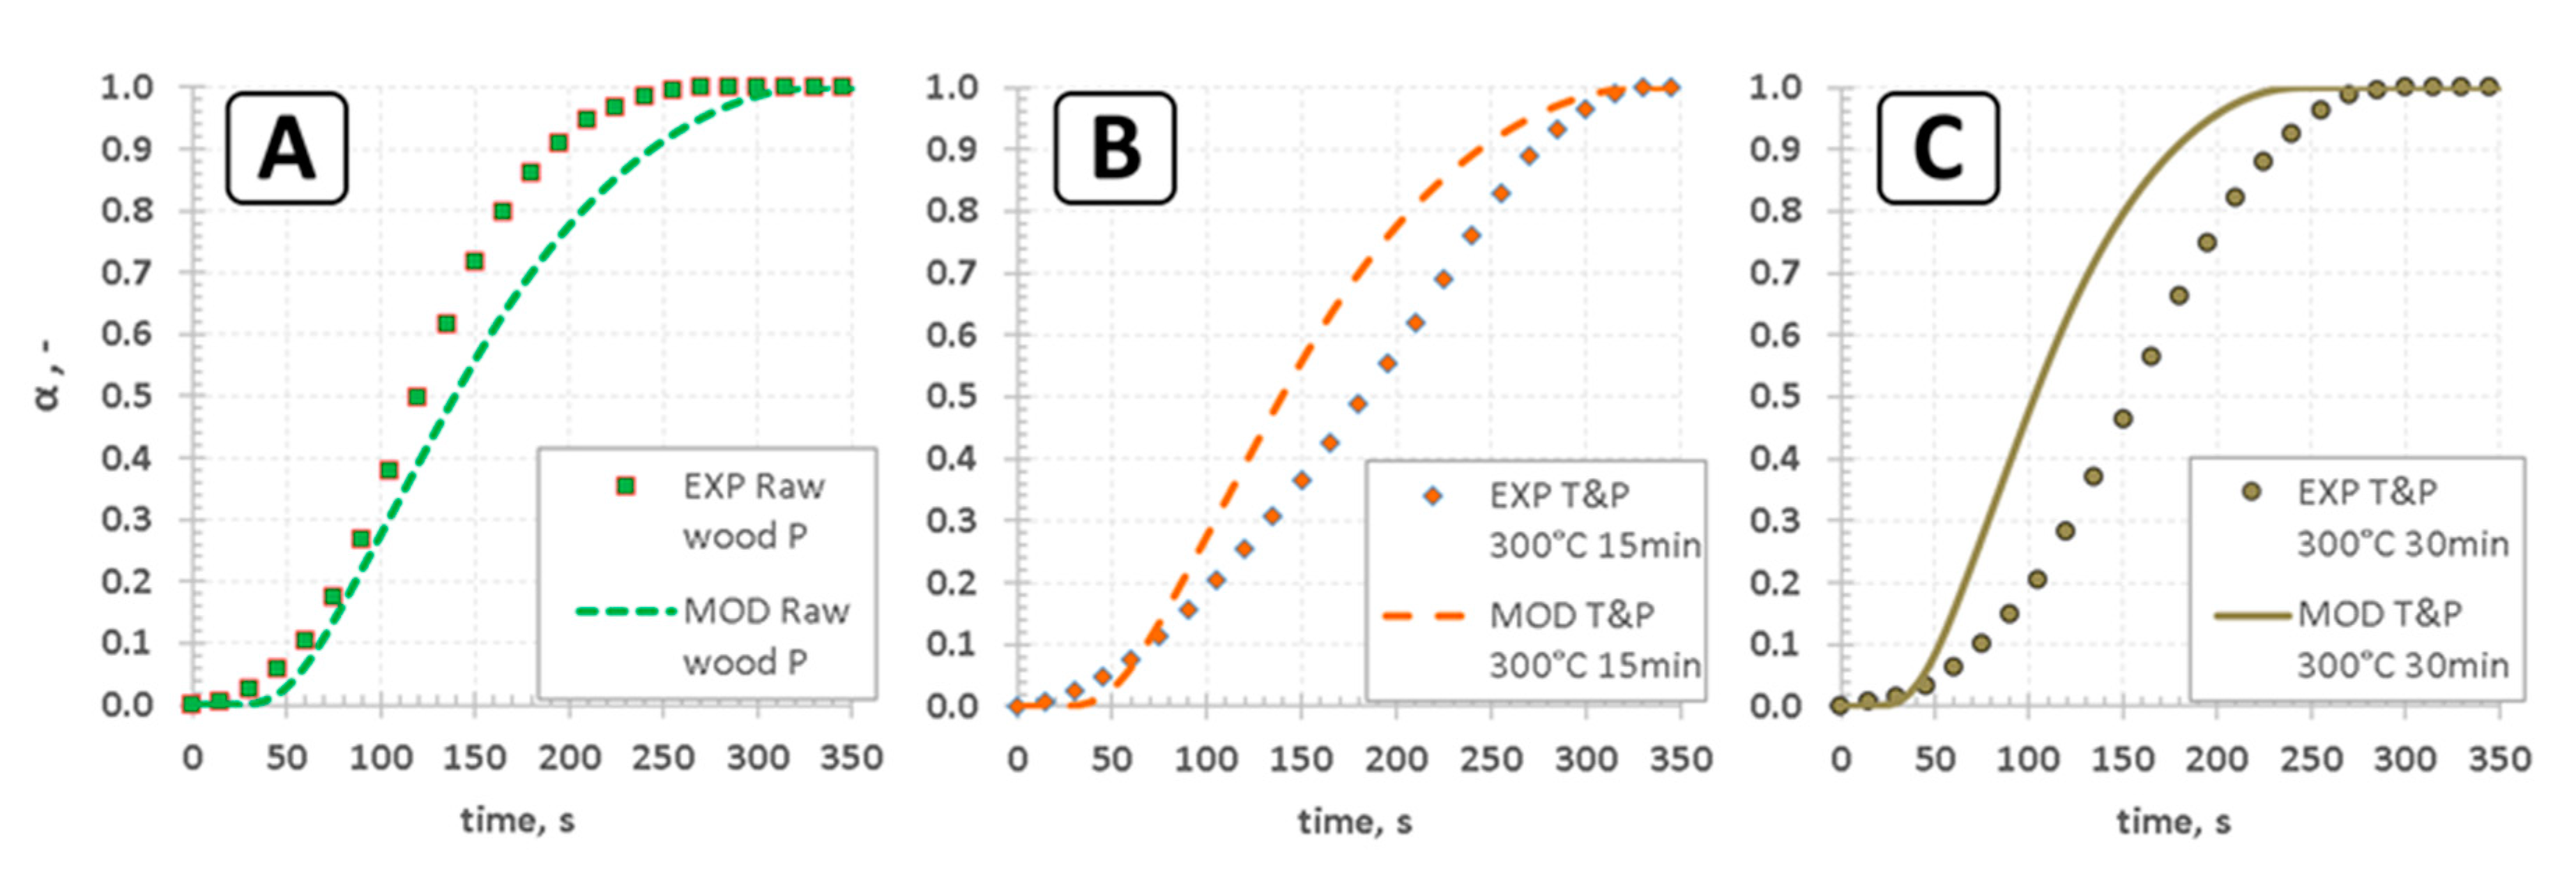
The devolatilization kinetic used here was derived from raw wood [102] which may be not a good choice for torrefied wood particles.
(2)
The model is 1D model, which assumes that the cylinder particle should be infinitely long (length/diameter >4). However, the experimental cylinder wood particle’s length/diameter is in range of 1–2, which may lead to an overestimation of devolatilization rates [103].
Regarding the mass loss history, obtained from the experiments, the underlying assumption behind the indirect estimation, according to Equation (5), is the plug flow along the sampling train. Velocity of the gases in the tubes connecting the outlet of the gas (Figure 1) from the series of impinger bottles with the gas analyzer was approx. 1 m/s, which is not sufficient to obtain a fully developed turbulent flow. However, the gas sample was the subject of mixing in impinger bottles. Moreover, the hose was not perfectly straight, thus introducing additional sources of turbulence. Furthermore, the results were adjusted, by moving the starting point, by the time necessary for the gas to travel between the sampling point (Figure 1—outlet located at heating zone 3) and the inlet to the analyzer, also adjusting for the time necessary for the analyzer to react (t90). Finally, an indirect determination of the degree of conversion by measuring exclusively main permanent gases does not take into the account condensable compounds. However, the extent of the influence of the condensable compounds, produced during pyrolysis, on the overall result is not likely to be profound for high values of α, which is exactly the time that is the aim of the estimation. Overall, only results of experiments performed with pellets could be compared with the model (Figure 3 and Figure 4), as the model cannot be used to make prediction for beds of material [59].
Figure 6 shows the amount of residue (fixed carbon) that remained after each pyrolysis experiment. Two important observations could be made, based on the obtained results. Firstly, the amount of fixed carbon is higher in torrefied samples, in comparison to raw wood. Moreover, increased amount of fixed carbon can be observed with increasing severity of torrefaction. This is sensible, as part of the volatile matter is removed during torrefaction. However, difference can be observed between the results of pyrolysis for pellets and non-packed bed of raw sawdust (Figure 6). It could be stated without any doubt, that the pyrolysis of raw wood pellet was complete, as could be observed in Figure 3a. Entrainment of the bed of particles also does not seem to give plausible explanation, as it would’ve been a factor also for the case of torrefied material. Moreover, the bed of particles was held together by the basket made of a heat resistant steel mesh. It seems plausible to hypothesize that densely packet structure of the pellet restricted the mass flow of the pyrolysis products within the inside of the pellet. This, in conjunction with relatively high amount of volatile matter, could’ve caused secondary reactions to happen inside of the pellet, which would include re-polymerization of some of the products of primary reactions. More research is needed to confirm this hypothesis and unequivocally state that re-polymerization is responsible for results observed in Figure 6, for raw wood pellets.
Experimental study on gasification of raw and torrefied wood yielded interesting results, as shown in Figure 7, Figure 8 and Figure 9. Peak times for CO were relatively shorter for pelletized and torrefied material, in comparison to their respective non-pelletized equivalent, whereas release times were generally longer, for the dominant species (Figure 7). This could be caused by an impeded flow of hot gas through the bed of non-pelletized material. In conjunction with poor heat transfer within the bed of sawdust it most likely resulted in higher thermal gradient within that bed, thus causing a longer release time of the gases. From the practical point of view of some designs of fixed bed gasifiers, incorporating constrictions and nozzles, such as Imbert gasifier, it implies that the use of pelletized biomass might decrease the problem with limited penetration of the bed by the gasifying agent. Peaks for both H2 (Figure 8) and CH4 (Figure 9) appeared sooner than respective CO peaks.
Overall, it could be stated that both pelletizing and torrefaction had influence on the composition of the gas. The release time of CO was somewhat longer than release time of CH4 and significantly longer than release time of H2 for corresponding samples. Moreover, negligible amounts of sample were left at the end of gasification, for all of the cases. This is probably due to the Boudouard reaction, according to the following Equation [33]:
C + CO 2   2 CO
It seems perfectly reasonable, taking into account the temperature selected for gasification experiments and the abundance of CO2. It seems important to note that the release time for hydrogen and methane were much longer, than conversion times recorded for pyrolysis in relatively lower temperatures (600 °C for pyrolysis and 950 °C for gasification). It can be partially contributed to impurities in the gasification agent (impurities <1%). However, the influence of the impurities is limited and cannot be used as the only explanation of the presence of H2 and CH4. The reason for these impurities is imperfect separation of CO2 from other compounds, such as N2 or water vapors. Drying of the gas is relatively easier than separation of CO2 and N2. Moreover, N2 can be considered inert, so only water vapors, which would be a minor part of the remaining 1% of the gas, could take part in generation of additional CH4 and H2 by steam gasification of carbon (10) and methanation reactions (11, 12 and 13) [33]:
C + H 2 O   CO +   H 2
2 CO + 2 H 2   CH 4 + CO 2
CO + 3 H 2   CH 4 + H 2 O
CO 2 + 4 H 2   CH 4 + 2 H 2 O
Water gas shift reaction (14) is less likely to occur, as CO2 content of the gas was initially high, due to the use of CO2 for gasification:
CO + H 2 O   CO 2 +   H 2
Therefore it seems plausible to hypothesize that the composition of the gasification agent and the composition of the surrounding atmosphere, which is a subject of change during the pyrolysis stage, can have influence on the composition of the gas. It should be noted that respective peaks of CH4 and H2 occurred relatively early, in comparison to the respective peaks of CO (Figure 7, Figure 8 and Figure 9).
Interesting observation could be made, based on the offset between this negative peak and peak of CO (Figure 10) increased with growing severity of torrefaction. However, that was the case for non-pelletized torrefied material only. For torrefied and pelletized material the CO peak appeared much closer to the CO2 negative peak. This could be attributed to the already mentioned heat transfer issues of non-pelletized material. The much shorter time of the CO2 negative peak, when comparing raw and torrefied sawdust, was probably caused by much quicker release of the gases during pyrolysis phase, which could be attributed to a higher reactivity of the torrefied material.
Overall, it could be stated that both physical (pelletizing) and thermal (torrefaction) valorization has an influence on the performance of the feedstock during gasification in a fixed bed gasifier, which in turn will have influence on both composition of producer gas and the amount of unreacted carbon, remaining after the process. In order to obtain satisfactory performance, unreacted carbon loss should be minimized. Reduction zone of sufficient size is needed to achieve that.
The work of Reed et al. [37] reported propagation front values in the order of magnitude of 1 cm/min, for raw wood gasification. Looking at the results obtained within the course of this study, much more time is needed for complete conversion of char in the reduction reactions, for torrefied material, which could be attributed to the higher content of fixed carbon in pellets made of torrefied wood, when comparing to raw feedstock. It does not seem plausible at this point to state, that propagation velocity for the gasification of torrefied wood would be similar to raw wood. Nevertheless, for a single particle at least 25% up higher residence time is needed, in order to avoid losses caused by chemical energy left in unreacted carbon. This should be also taken into account, in the design of gasifiers aiming at using torrefied wood pellets. Moreover, proper consideration is advised for the projects where torrefied wood pellets are to replace raw wood pellets.
Therefore, it seems to be sensible to recommend further work on development of a model for fixed bed gasification. In order to give satisfactory results for carbon conversion, such model would need to intake into account reduction reactions (especially Boudouard reaction). Such a model would also need to incorporate features of a thick-particle model, as the obtained results clearly show the influence of the particle, especially its density, on the gasification process. The model used in this study seems to be a good foundation for such development. Moreover, it could be used as a first approximation of the size of the pyrolysis zone.

4. Conclusions

Of three major compounds released during gasification, release of CO was the slowest one, therefore this release time should be used as a required residence time, if maximum carbon conversion is to be achieved. Both release time and the time of achieving a peak concentration of CO increased with increased severity of the torrefaction. Both release time and the time of achieving a peak concentration of CO were significantly lower for pelletized torrefied biomass in comparison to their respective non-pelletized equivalents. Concentrations of all the measured compounds were higher for pelletized torrefied sawdust in comparison to the respective non-pelletized equivalents.
Peak times were relatively shorter for pelletized and torrefied material, in comparison to their respective non-pelletized equivalent, whereas release times were generally longer, for the dominant species (CO). This suggests that pelletized biomass is potentially less susceptible for potential problems with penetration of the gasifying agent in gasifiers with constrictions, due to better heat transfer within individual particles. With respect to the design parameters of the stratified gasifiers, for torrefied pellets, at least 25% higher residence time is advised, in comparison to the use of raw wood pellets. This would imply increase in the assumed height of the bed of material above the grate. However, more research is needed to confirm this, as the gasification propagation velocities within the bed also need to be determined for the case, where torrefied pellets are used.
The offset between the negative peak of CO2 and the peak of CO concentration was rising with increased severity of torrefaction, however, for non-pelletized torrefied material only. For torrefied and pelletized material the CO peak appeared much closer to the CO2 negative peak. This could be attributed to the already mentioned heat transfer issues for non-pelletized material.
Further work is recommended on development of the model that could work for a bed of material, taking into account all stages of gasification. Such a model would be a pre-requisite for tailoring designs of fixed bed gasifier allowing the most optimal use of valorized fuels. This would eliminate the trial and error phase of research and development process and speed up the effort aiming for optimization of the design of gasifiers.

Author Contributions

Conceptualization: H.L., H.P.-K. and L.N.; methodology: H.L., H.P.-K. and L.N.; validation: K.K. and M.B.; formal analysis: H.L. and L.N.; investigation: L.N., H.L., K.K., M.T., T.S. and A.S.; resources: H.P.-K. and A.A.; data curation: M.T., T.S., A.S., K.K. and M.B.; writing—original draft preparation: L.N., H.L. and A.A.; writing—review and editing: L.N., Z.L., and H.L.; supervision: H.P.-K., A.A. and K.M.; project administration: L.N., K.M.; funding acquisition: L.N. and H.P.-K. All authors have read and agreed to the published version of the manuscript.

Funding

Support of this research from the National Science Centre, Poland, project no. 2019/33/N/ST8/02641, is gratefully acknowledged.

Conflicts of Interest

The authors declare no conflict of interest.

References

  1. Pawlak-Kruczek, H.; Niedźwiecki, Ł.; Ostrycharczyk, M.; Czerep, M.; Plutecki, Z. Potential and methods for increasing the flexibility and efficiency of the lignite fired power unit, using integrated lignite drying. Energy 2019, 181, 1142–1151. [Google Scholar] [CrossRef]
  2. Stanek, W.; Czarnowska, L.; Gazda, W.; Simla, T. Thermo-ecological cost of electricity from renewable energy sources. Renew. Energy 2018, 115, 87–96. [Google Scholar] [CrossRef]
  3. Stanek, W.; Simla, T.; Gazda, W. Exergetic and thermo-ecological assessment of heat pump supported by electricity from renewable sources. Renew. Energy 2019, 131, 404–412. [Google Scholar] [CrossRef]
  4. Moscicki, K.J.; Niedzwiecki, L.; Owczarek, P.; Wnukowski, M. Commoditization of biomass: Dry torrefaction and pelletization-a review. J. Power Technol. 2014, 94, 233–249. [Google Scholar]
  5. Uslu, A.; Faaij, A.P.C.; Bergman, P.C.A. Pre-treatment technologies, and their effect on international bioenergy supply chain logistics. Techno-economic evaluation of torrefaction, fast pyrolysis and pelletisation. Energy 2008, 33, 1206–1223. [Google Scholar] [CrossRef]
  6. Batidzirai, B.; Mignot, A.P.R.; Schakel, W.B.; Junginger, H.M.; Faaij, A.P.C. Biomass torrefaction technology: Techno-economic status and future prospects. Energy 2013, 62, 196–214. [Google Scholar] [CrossRef]
  7. Dyjakon, A.; Noszczyk, T.; Smȩdzik, M. The influence of torrefaction temperature on hydrophobic properties of waste biomass from food processing. Energies 2019, 12, 4609. [Google Scholar] [CrossRef] [Green Version]
  8. Ribeiro, J.M.C.; Godina, R.; de Oliveira Matias, J.C.; Nunes, L.J.R. Future perspectives of biomass torrefaction: Review of the current state-of-the-art and research development. Sustainability 2018, 10, 2323. [Google Scholar] [CrossRef] [Green Version]
  9. Szwaja, S.; Magdziarz, A.; Zajemska, M.; Poskart, A. A torrefaction of Sida hermaphrodita to improve fuel properties. Advanced analysis of torrefied products. Renew. Energy 2019, 141, 894–902. [Google Scholar] [CrossRef]
  10. Botelho, T.; Costa, M.; Wilk, M.; Magdziarz, A. Evaluation of the combustion characteristics of raw and torrefied grape pomace in a thermogravimetric analyzer and in a drop tube furnace. Fuel 2018, 212, 95–100. [Google Scholar] [CrossRef]
  11. Boylan, D.M.; Roberts, G.K.; Zemo, B.R.; Wilson, J.L. Torrefied Wood Field Tests at a Coal-Fired Power Plant. IEEE Trans. Ind. Appl. 2016, 52, 751–757. [Google Scholar] [CrossRef]
  12. Bergman, P.C.A.; Boersma, A.R.; Zwart, R.W.R.; Kiel, J.H.A. Torrefaction for Biomass Co-Firing in Existing Coal-Fired Power Stations; Energy Research Centre of The Netherlands: Petten, The Netherlands, 2005. [Google Scholar]
  13. Li, J.; Zhang, X.; Pawlak-Kruczek, H.; Yang, W.; Kruczek, P.; Blasiak, W. Process simulation of co-firing torrefied biomass in a 220 MWe coal-fired power plant. Energy Convers. Manag. 2014, 84, 503–511. [Google Scholar] [CrossRef] [Green Version]
  14. Prins, M.J.; Ptasinski, K.J.; Janssen, F.J.J.G. More efficient biomass gasification via torrefaction. Energy 2006, 31, 3458–3470. [Google Scholar] [CrossRef]
  15. Bergman, P.C.A.; Boersma, A.R.; Kiel, J.H.A.; Prins, M.J.; Ptasinski, K.J.; Janssen, F.J.J. Torrefaction for entrained-flow gasification of biomass. In The 2nd World Conference and Technology Exhibition on Biomass for Energy, Industry and Climate Protection; Energy Research Centre of The Netherlands (ECN): Rome, Italy, 2004. [Google Scholar]
  16. Couhert, C.; Salvador, S.; Commandré, J. Impact of torrefaction on syngas production from wood. Fuel 2009, 88, 2286–2290. [Google Scholar] [CrossRef] [Green Version]
  17. Eseyin, A.E.; Steele, P.H.; Pittman, C.U., Jr. Current trends in the production and applications Torrefied Wood/Biomass—A review. Bioresources 2015, 10, 8812–8858. [Google Scholar] [CrossRef]
  18. Pawlak-Kruczek, H.; Wnukowski, M.; Krochmalny, K.; Kowal, M.; Baranowski, M.; Zgóra, J.; Czerep, M.; Ostrycharczyk, M.; Niedzwiecki, L. The Staged Thermal Conversion of Sewage Sludge in the Presence of Oxygen. J. Energy Resour. Technol. 2019, 141, 070701. [Google Scholar] [CrossRef]
  19. Tumuluru, J.S.; Sokhansanj, S.; Hess, J.R.; Wright, C.T.; Boardman, R.D. A review on biomass torrefaction process and product properties for energy applications. Ind. Biotechnol. 2011, 7, 384–401. [Google Scholar] [CrossRef] [Green Version]
  20. Koppejan, J.; Sokhansanj, S.; Melin, S.; Madrali, S. Status Overview of Torrefaction Technologies; International Energy Agency: Enschede, 2012. [Google Scholar]
  21. Van der Stelt, M.J.C.; Gerhauser, H.; Kiel, J.H.A.; Ptasinski, K.J. Biomass upgrading by torrefaction for the production of biofuels: A review. Biomass Bioenergy 2011, 35, 3748–3762. [Google Scholar] [CrossRef]
  22. Nhuchhen, D.; Basu, P.; Acharya, B. A Comprehensive Review on Biomass Torrefaction. Int. J. Renew. Energy Biofuels 2014, 2014, 1–56. [Google Scholar] [CrossRef]
  23. Thran, D.; Witt, J.; Schaubach, K.; Kiel, J.; Carbo, M.; Maier, J.; Ndibe, C.; Koppejan, J.; Alakangas, E.; Majer, S.; et al. Moving torrefaction towards market introduction—Technical improvements and economic-environmental assessment along the overall torrefaction supply chain through the SECTOR project. Biomass Bioenergy 2015, 89, 184–200. [Google Scholar] [CrossRef] [Green Version]
  24. Pawlak-Kruczek, H.; Wnukowski, M.; Niedzwiecki, L.; Czerep, M.; Kowal, M.; Krochmalny, K.; Zgora, J.; Ostrycharczyk, M.; Baranowski, M.; Tic, W.J.; et al. Torrefaction as a Valorization Method Used Prior to the Gasification of Sewage Sludge. Energies 2019, 12, 175. [Google Scholar] [CrossRef] [Green Version]
  25. Pawlak-Kruczek, H.; Arora, A.; Gupta, A.; Azam, M.; Niedzwiecki, L.; Andrews, G.; Phylaktou, H.; Gibbs, B.; Newlaczyl, A.; Livesey, P.M. Biocoal - Quality control and assurance. Biomass Bioenergy 2020, 135, 105509. [Google Scholar] [CrossRef]
  26. Pawlak-Kruczek, H.; Arora, A.; Mościcki, K.; Krochmalny, K.; Sharma, S.; Niedzwiecki, L. A transition of a domestic boiler from coal to biomass – Emissions from combustion of raw and torrefied Palm Kernel shells (PKS). Fuel 2020, 263. [Google Scholar] [CrossRef]
  27. Jahirul, M.I.; Rasul, M.G.; Chowdhury, A.A.; Ashwath, N. Biofuels production through biomass pyrolysis—A technological review. Energies 2012, 5, 4952–5001. [Google Scholar] [CrossRef]
  28. Bridgwater, A.V. Review of fast pyrolysis of biomass and product upgrading. Biomass Bioenergy 2012, 38, 68–94. [Google Scholar] [CrossRef]
  29. Butler, E.; Devlin, G.; Meier, D.; McDonnell, K. A review of recent laboratory research and commercial developments in fast pyrolysis and upgrading. Renew. Sustain. Energy Rev. 2011, 15, 4171–4186. [Google Scholar] [CrossRef] [Green Version]
  30. Collard, F.X.; Blin, J. A review on pyrolysis of biomass constituents: Mechanisms and composition of the products obtained from the conversion of cellulose, hemicelluloses and lignin. Renew. Sustain. Energy Rev. 2014, 38, 594–608. [Google Scholar] [CrossRef]
  31. Reed, T.B.; Das, A. Handbook of Biomass Downdraft Gasifier Engine Systems; SERI a Division of Midwest Research Institute: Golden, CO, USA, 1988. [Google Scholar]
  32. Reed, T.B.; Jantzen, D. Generator Gas—The Swedish Experience from 1939–1945, 3rd ed.; Biomass Energy Foundation: Golden, CO, USA, 1979; ISBN 1890607010. [Google Scholar]
  33. Basu, P. Biomass Gasification and Pyrolysis—Practical Design and Theory; Elsevier: Amsterdam, The Netherlands, 2010; ISBN 978-0-12-374988-8. [Google Scholar]
  34. Basu, P. Combustion and Gasification in Fluidized Beds; CRC Press: Boca Raton, FL, USA, 2006; ISBN 9780849333965. [Google Scholar]
  35. Wnukowski, M. Methods used in tar removal from biomass gasification gas—A review. Arch. Waste Manag. Environ. Prot. 2016, 18, 17–34. [Google Scholar]
  36. Werle, S.; Dudziak, M. Analysis of organic and inorganic contaminants in dried sewage sludge and by-products of dried sewage sludge gasification. Energies 2014, 7, 462–476. [Google Scholar] [CrossRef] [Green Version]
  37. Reed, T.B.; Markson, M. Biomass Gasification Reaction Velocities. In Fundamentals of Thermochemical Biomass Conversion; Overend, R.P., Milne, T.A., Mudge, L.K., Eds.; ElsevierScience Publishing Co. Inc.: Barking, UK, 1985; pp. 951–965. [Google Scholar]
  38. Mularski, J.; Pawlak-Kruczek, H.; Modlinski, N. A review of recent studies of the CFD modelling of coal gasification in entrained flow gasifiers, covering devolatilization, gas-phase reactions, surface reactions, models and kinetics. Fuel 2020, 271, 117620. [Google Scholar] [CrossRef]
  39. Ramos, A.; Monteiro, E.; Rouboa, A. Numerical approaches and comprehensive models for gasification process: A review. Renew. Sustain. Energy Rev. 2019, 110, 188–206. [Google Scholar] [CrossRef]
  40. White, J.E.; Catallo, W.J.; Legendre, B.L. Biomass pyrolysis kinetics: A comparative critical review with relevant agricultural residue case studies. J. Anal. Appl. Pyrolysis 2011, 91, 1–33. [Google Scholar] [CrossRef]
  41. Sobek, S.; Werle, S. Solar pyrolysis of waste biomass: Part 2 kinetic modeling and methodology of the determination of the kinetic parameters for solar pyrolysis of sewage sludge. Renew. Energy 2020, 153, 962–974. [Google Scholar] [CrossRef]
  42. Sobek, S.; Werle, S. Kinetic modelling of waste wood devolatilization during pyrolysis based on thermogravimetric data and solar pyrolysis reactor performance. Fuel 2020, 261, 116459. [Google Scholar] [CrossRef]
  43. Sobek, S.; Werle, S. Solar pyrolysis of waste biomass: Part 1 reactor design. Renew. Energy 2019, 143, 1939–1948. [Google Scholar] [CrossRef]
  44. Luo, H.; Wu, H.; Lin, W.; Dam-Johansen, K.; Luo, H. Heat transfer corrected isothermal model for devolatilization of thermally-thick biomass particles. In Nordic Flame Days; International Flame Research Foundation: Stockholm, Sweden, 2017. [Google Scholar]
  45. Mehrabian, R.; Zahirovic, S.; Scharler, R.; Obernberger, I.; Kleditzsch, S.; Wirtz, S.; Scherer, V.; Lu, H.; Baxter, L.L. A CFD model for thermal conversion of thermally thick biomass particles. Fuel Process. Technol. 2012, 95, 96–108. [Google Scholar] [CrossRef]
  46. Gómez, M.A.; Porteiro, J.; Patiño, D.; Míguez, J.L. Fast-solving thermally thick model of biomass particles embedded in a CFD code for the simulation of fixed-bed burners. Energy Convers. Manag. 2015, 105, 30–44. [Google Scholar] [CrossRef]
  47. Sieradzka, M.; Gao, N.; Quan, C.; Mlonka-Mędrala, A.; Magdziarz, A. Biomass thermochemical conversion via pyrolysis with integrated CO2 capture. Energies 2020, 13, 1050. [Google Scholar] [CrossRef] [Green Version]
  48. Mlonka-Mędrala, A.; Magdziarz, A.; Dziok, T.; Sieradzka, M.; Nowak, W. Laboratory studies on the influence of biomass particle size on pyrolysis and combustion using TG GC/MS. Fuel 2019, 252, 635–645. [Google Scholar] [CrossRef]
  49. Xue, G.; Kwapinska, M.; Kwapinski, W.; Czajka, K.M.; Kennedy, J.; Leahy, J.J. Impact of torrefaction on properties of Miscanthus × giganteus relevant to gasification. Fuel 2014, 121, 189–197. [Google Scholar] [CrossRef]
  50. Weiland, F.; Nordwaeger, M.; Olofsson, I.; Wiinikka, H.; Nordin, A. Entrained flow gasification of torrefied wood residues. Fuel Process. Technol. 2014, 125, 51–58. [Google Scholar] [CrossRef] [Green Version]
  51. Sarkar, M.; Kumar, A.; Tumuluru, J.S.; Patil, K.N.; Bellmer, D.D. Gasification performance of switchgrass pretreated with torrefaction and densification. Appl. Energy 2014, 127, 194–201. [Google Scholar] [CrossRef]
  52. Reed, T.B.; Levie, B.; Graboski, M.S. Fundamentals, Development and Scaleup of the Air-Oxygen Stratified Downdraft Gasifier; Solar Energy Research Institute: Golden, CO, USA, 1988. [Google Scholar]
  53. Hasler, P.; Nussbaumer, T. Gas cleaning for IC engine applications from fixed bed biomass gasification. Biomass Bioenergy 1999, 16, 385–395. [Google Scholar] [CrossRef]
  54. Mandl, C.; Obernberger, I.; Biedermann, F. Modelling of an updraft fixed-bed gasifier operated with softwood pellets. Fuel 2010, 89, 3795–3806. [Google Scholar] [CrossRef]
  55. Zhang, Z.Z.; Zhu, M.M.; Liu, P.F.; Wan, W.C.; Zhou, W.X.; Chan, Y.L.; Zhang, D.K. Effect of Biochar on the Cracking of Tar from the Pyrolysis of a Pine Sawdust in a Fixed Bed Reactor. Energy Procedia 2015, 75, 196–201. [Google Scholar] [CrossRef] [Green Version]
  56. Sharma, A.K. Experimental investigations on a 20 kWe, solid biomass gasification system. Biomass Bioenergy 2011, 35, 421–428. [Google Scholar] [CrossRef]
  57. Werle, S. Gasification of a Dried Sewage Sludge in a Laboratory Scale Fixed Bed Reactor. Energies 2015, 8, 8562–8572. [Google Scholar] [CrossRef] [Green Version]
  58. Werle, S. Impact of feedstock properties and operating conditions on sewage sludge gasification in a fixed bed gasifier. Waste Manag. Res. 2014, 32, 954–960. [Google Scholar] [CrossRef]
  59. Luo, H.; Lu, Z.; Jensen, P.A.; Glarborg, P.; Lin, W.; Dam-Johansen, K.; Wu, H. Experimental and modelling study on the influence of wood type, density, water content, and temperature on wood devolatilization. Fuel 2020, 260, 116410. [Google Scholar] [CrossRef]
  60. CEN (European Committe for Standardisation). EN ISO 16948:2015 Determination of Total Content of Carbon, Hydrogen and Nitrogen—Instrumental Methods; European Committe for Standardisation: Brussels, Belgium, 2015. [Google Scholar]
  61. Friedl, A.; Padouvas, E.; Rotter, H.; Varmuza, K. Prediction of heating values of biomass fuel from elemental composition. Anal. Chim. Acta 2005, 544, 191–198. [Google Scholar] [CrossRef]
  62. Sidiras, D.K.; Nazos, A.G.; Giakoumakis, G.E.; Politi, D.V. Simulating the effect of torrefaction on the heating value of barley straw. Energies 2020, 13, 736. [Google Scholar] [CrossRef] [Green Version]
  63. Wilk, M.; Magdziarz, A. Hydrothermal carbonization, torrefaction and slow pyrolysis of Miscanthus giganteus. Energy 2017, 140, 1292–1304. [Google Scholar] [CrossRef]
  64. Gucho, E.M.; Shahzad, K.; Bramer, E.A.; Akhtar, N.A.; Brem, G. Experimental study on dry torrefaction of beech wood and miscanthus. Energies 2015, 8, 3903–3923. [Google Scholar] [CrossRef] [Green Version]
  65. Pawlak-Kruczek, H.; Wnukowski, M.; Niedzwiecki, L.; Kowal, M.; Krochmalny, K. Gasification of torrefied sewage sludge with the addition of calcium carbonate. J. Energy Resour. Technol. 2020, 142, 070904-1–070904-8. [Google Scholar] [CrossRef]
  66. Khalsa, J.H.A.; Leistner, D.; Weller, N.; Darvell, L.I.; Dooley, B. Torrefied biomass pellets—Comparing grindability in different laboratory mills. Energies 2016, 9, 794. [Google Scholar] [CrossRef] [Green Version]
  67. Medic, D.; Darr, M.; Shah, A.; Rahn, S. The effects of particle size, different corn stover components, and gas residence time on torrefaction of corn stover. Energies 2012, 5, 1199–1214. [Google Scholar] [CrossRef] [Green Version]
  68. Pawlak-Kruczek, H.; Krochmalny, K.; Mościcki, K.; Zgóra, J.; Czerep, M.; Ostrycharczyk, M.; Niedźwiecki, Ł. Torrefaction of Various Types of Biomass in Laboratory Scale, Batch-Wise Isothermal Rotary Reactor and Pilot Scale, Continuous Multi-Stage Tape Reactor. Eng. Prot. Environ. 2017, 20, 457–472. [Google Scholar] [CrossRef]
  69. Lasek, J.A.; Kopczyński, M.; Janusz, M.; Iluk, A.; Zuwała, J. Combustion properties of torrefied biomass obtained from flue gas-enhanced reactor. Energy 2017, 119, 362–368. [Google Scholar] [CrossRef]
  70. Rousset, P.; Macedo, L.; Commandré, J.M.; Moreira, A. Biomass torrefaction under different oxygen concentrations and its effect on the composition of the solid by-product. J. Anal. Appl. Pyrolysis 2012, 96, 86–91. [Google Scholar] [CrossRef] [Green Version]
  71. Uemura, Y.; Omar, W.; Othman, N.A.; Yusup, S.; Tsutsui, T. Torrefaction of oil palm EFB in the presence of oxygen. Fuel 2013, 103, 156–160. [Google Scholar] [CrossRef]
  72. Uemura, Y.; Saadon, S.; Osman, N.; Mansor, N.; Tanoue, K.I. Torrefaction of oil palm kernel shell in the presence of oxygen and carbon dioxide. Fuel 2015, 144, 171–179. [Google Scholar] [CrossRef]
  73. Lu, K.M.; Lee, W.J.; Chen, W.H.; Liu, S.H.; Lin, T.C. Torrefaction and low temperature carbonization of oil palm fiber and eucalyptus in nitrogen and air atmospheres. Bioresour. Technol. 2012, 123, 98–105. [Google Scholar] [CrossRef] [PubMed]
  74. Chen, W.H.; Zhuang, Y.Q.; Liu, S.H.; Juang, T.T.; Tsai, C.M. Product characteristics from the torrefaction of oil palm fiber pellets in inert and oxidative atmospheres. Bioresour. Technol. 2016, 199, 367–374. [Google Scholar] [CrossRef] [PubMed]
  75. Joshi, Y.; Di Marcello, M.; Krishnamurthy, E.; De Jong, W. Packed-Bed Torrefaction of Bagasse under Inert and Oxygenated Atmospheres. Energy Fuels 2015, 29, 5078–5087. [Google Scholar] [CrossRef]
  76. Chen, W.H.; Lu, K.M.; Liu, S.H.; Tsai, C.M.; Lee, W.J.; Lin, T.C. Biomass torrefaction characteristics in inert and oxidative atmospheres at various superficial velocities. Bioresour. Technol. 2013, 146, 152–160. [Google Scholar] [CrossRef]
  77. Wang, C.; Peng, J.; Li, H.; Bi, X.T.; Legros, R.; Lim, C.J.; Sokhansanj, S. Oxidative torrefaction of biomass residues and densification of torrefied sawdust to pellets. Bioresour. Technol. 2013, 127, 318–325. [Google Scholar] [CrossRef]
  78. Churchill, S.W.; Bernstein, M. A correlating equation for forced convection from gases and liquids to a circular cylinder in crossflow. J. Heat Transfer 1977, 99, 300–306. [Google Scholar] [CrossRef]
  79. Li, J.; Brzdekiewicz, A.; Yang, W.; Blasiak, W. Co-firing based on biomass torrefaction in a pulverized coal boiler with aim of 100% fuel switching. Appl. Energy 2012, 99, 344–354. [Google Scholar] [CrossRef]
  80. Park, S.; Kim, S.J.; Oh, K.C.; Cho, L.H.; Kim, M.J.; Jeong, I.S.; Lee, C.G.; Kim, D.H. Characteristic analysis of torrefied pellets: Determining optimal torrefaction conditions for agri-byproduct. Energies 2020, 13, 423. [Google Scholar] [CrossRef] [Green Version]
  81. Świechowski, K.; Liszewski, M.; Babelewski, P.; Koziel, J.A.; Białowiec, A. Oxytree pruned biomass torrefaction: Mathematical models of the influence of temperature and residence time on fuel properties improvement. Materials 2019, 12, 2228. [Google Scholar] [CrossRef] [Green Version]
  82. Bajcar, M.; Zaguła, G.; Saletnik, B.; Tarapatskyy, M.; Puchalski, C. Relationship between torrefaction parameters and physicochemical properties of torrefied products obtained from selected plant biomass. Energies 2018, 11, 2919. [Google Scholar] [CrossRef] [Green Version]
  83. Sh, L.; Lee, B.H.; Lee, Y.J.; Jeon, C.H. Comparing the physicochemical properties of upgraded biomass fuel by torrefaction and the ashless technique. Appl. Sci. 2019, 9, 5519. [Google Scholar] [CrossRef] [Green Version]
  84. Dudek, M.; Świechowski, K.; Manczarski, P.; Koziel, J.A.; Białowiec, A. The effect of biochar addition on the biogas production kinetics from the anaerobic digestion of brewers’ spent grain. Energies 2019, 12, 1518. [Google Scholar] [CrossRef] [Green Version]
  85. Stępień, P.; Świechowski, K.; Hnat, M.; Kugler, S.; Stegenta-Dąbrowska, S.; Koziel, J.A.; Manczarski, P.; Białowiec, A. Waste to carbon: Biocoal from elephant dung as new cooking fuel. Energies 2019, 12, 4344. [Google Scholar] [CrossRef] [Green Version]
  86. Syguła, E.; Koziel, J.A.; Białowiec, A. Proof-of-concept of spent mushrooms compost torrefaction—Studying the process kinetics and the influence of temperature and duration on the calorific value of the produced biocoal. Energies 2019, 12, 3060. [Google Scholar] [CrossRef] [Green Version]
  87. Poudel, J.; Karki, S.; Oh, S.C. Valorization of waste wood as a solid fuel by torrefaction. Energies 2018, 11, 1641. [Google Scholar] [CrossRef] [Green Version]
  88. Wilk, M.; Magdziarz, A.; Kalemba, I. Characterisation of renewable fuels’ torrefaction process with different instrumental techniques. Energy 2015, 87, 259–269. [Google Scholar] [CrossRef]
  89. Distler, T.; Sitzmann, W. An investigation on additives for pelletizing highly torrefied biomass. Biofuels Bioprod. Biorefining 2018, 1–8. [Google Scholar] [CrossRef]
  90. Stelte, W.; Nielsen, N.P.K.; Hansen, H.O.; Dahl, J.; Shang, L.; Sanadi, A.R. Pelletizing properties of torrefied wheat straw. Biomass Bioenergy 2013, 49, 214–221. [Google Scholar] [CrossRef]
  91. Reza, M.T.; Uddin, M.H.; Lynam, J.G.; Coronella, C.J. Engineered pellets from dry torrefied and HTC biochar blends. Biomass Bioenergy 2014, 63, 229–238. [Google Scholar] [CrossRef]
  92. Białowiec, A.; Micuda, M.; Koziel, J.A. Waste to carbon: Densification of torrefied refuse-derived fuel. Energies 2018, 11, 3233. [Google Scholar] [CrossRef] [Green Version]
  93. Stelte, W.; Holm, J.K.; Sanadi, A.R.; Barsberg, S.; Ahrenfeldt, J.; Henriksen, U.B. Fuel pellets from biomass: The importance of the pelletizing pressure and its dependency on the processing conditions. Fuel 2011, 90, 3285–3290. [Google Scholar] [CrossRef] [Green Version]
  94. Dinwoodie, J.M. Timber: Its Nature and Behaviour, 2nd ed.; Routledge: Abingdon, UK, 2000; ISBN 978-0419235804. [Google Scholar]
  95. Forest Products Laboratory—USDA. Wood Handbook: Wood as an Engineering Material; United States Department of Agriculture: Madison, WI, USA, 2010.
  96. Acharya, B.; Dutta, A.; Minaret, J. Review on comparative study of dry and wet torrefaction. Sustain. Energy Technol. Assess. 2015, 12, 26–37. [Google Scholar] [CrossRef]
  97. Stelte, W.; Clemons, C.; Holm, J.K.; Sanadi, A.R.; Ahrenfeldt, J.; Shang, L.; Henriksen, U.B. Pelletizing properties of torrefied spruce. Biomass Bioenergy 2011, 35, 4690–4698. [Google Scholar] [CrossRef] [Green Version]
  98. Gaitán-Alvarez, J.; Moya, R.; Puente-Urbina, A.; Rodriguez-Zuñiga, A. Physical and compression properties of pellets manufactured with the biomass of five woody tropical species of Costa Rica torrefied at different temperatures and times. Energies 2017, 10, 1205. [Google Scholar] [CrossRef] [Green Version]
  99. Shang, L.; Nielsen, N.P.K.; Dahl, J.; Stelte, W.; Ahrenfeldt, J.; Holm, J.K.; Thomsen, T.; Henriksen, U.B. Quality effects caused by torrefaction of pellets made from Scots pine. Fuel Process. Technol. 2012, 101, 23–28. [Google Scholar] [CrossRef]
  100. Donaj, P.; Izadpanah, M.R.; Yang, W.; Blasiak, W. Effect of pressure drop due to grate-bed resistance on the performance of a downdraft gasifier. Energy Fuels 2011, 25, 5366–5377. [Google Scholar] [CrossRef]
  101. Gunarathne, D.S.; Chmielewski, J.K.; Yang, W. Pressure drop prediction of a gasifier bed with cylindrical biomass pellets. Appl. Energy 2014, 113, 258–266. [Google Scholar] [CrossRef]
  102. Wagenaar, B.M.; Prins, W.; van Swaaij, W.P.M. Flash pyrolysis kinetics of pine wood. Fuel Process. Technol. 1993, 36, 291–298. [Google Scholar] [CrossRef] [Green Version]
  103. Momeni, M.; Yin, C.; Kær, S.K.; Hansen, T.B.; Jensen, P.A.; Glarborg, P. Experimental Study on Effects of Particle Shape and Operating Conditions on Combustion Characteristics of Single Biomass Particles. Energy Fuels 2013, 27, 507–514. [Google Scholar] [CrossRef] [Green Version]
Figure 1. Isothermal furnace—diagram of the experimental rig.
Energies 13 03018 g001
Figure 2. Density of the pellets pressed using torrefied sawdust, in comparison to results published in the literature [77,97]; (LIT—results from the literature; EXP—experimental results obtained in this study).
Energies 13 03018 g002
Figure 3. Rate of conversion—comparison of model and experiment for pyrolysis of pellets of raw and torrefied wood at 600 °C: (a) raw wood pellet; (b) pellet of fine wood particles torrefied at 300 °C for 5 min; (c) pellet of fine wood particles torrefied at 300 °C for 30 min.
Energies 13 03018 g003
Figure 4. Conversion times for pyrolysis of pellets of raw and torrefied wood at 600 °C, comparison of experiment and model: (a) conversion time for α = 1.0; (b) conversion time for α = 0.95; (c) conversion time for α = 0.5.
Energies 13 03018 g004
Figure 5. Concentrations of gases measured during pyrolysis experiments: (a) raw wood pellet; (b) pellet of fine wood particles torrefied at 300 °C for 5 min; (c) pellet of fine wood particles torrefied at 300 °C for 30 min.
Energies 13 03018 g005
Figure 6. Fixed carbon left after pyrolysis at 600 °C (% mass left after pyrolysis, in comparison to the initial sample mass).
Energies 13 03018 g006
Figure 7. CO concentration for performed gasification experiments: (a) average concentrations of carbon monoxide; (b) release time and the time of peak concentration (Torr. & Pell.—torrefied and pelletized).
Energies 13 03018 g007
Figure 8. H2 concentration for preformed gasification experiments: (a) average concentrations of hydrogen; (b) release time and the time of peak concentration (Torr. & Pell.—torrefied and pelletized).
Energies 13 03018 g008
Figure 9. CH4 concentration for preformed gasification experiments: (a) average concentrations of methane; (b) release time and the time of peak concentration (Torr. & Pell.—torrefied and pelletized).
Energies 13 03018 g009
Figure 10. Off-set between negative peak of CO2 and peak of CO for performed gasification experiments (Torr. & Pell.—torrefied and pelletized).
Energies 13 03018 g010
Table 1. Ultimate analysis and higher heating value of raw and torrefied sawdust.
SampleCHNSAshHHV
% dry% dry% dry% dry% drykJ/kg
Raw Sawdust44.756.240.590.190.6117,786
Torrefied; 300 °C; 15 min; φ 1 < 200 µm46.214.810.280.130.7818,150
Torrefied; 300 °C; 15 min; φ > 1000 µm46.594.560.140.090.8418,224
Torrefied; 300 °C; 30 min; φ < 200 µm48.084.720.420.141.0918,801
Torrefied; 300 °C; 30 min; φ > 1000 µm52.844.920.280.211.2420,629
1 φ—particle size.

