Article

Smart Energy Management for Series Hybrid Electric Vehicles Based on Driver Habits Recognition and Prediction

1
DRIVE EA1859, Université Bourgogne Franche-Comté, 58027 Nevers, France
2
DANIELSON ENGINEERING, Technopôle du Circuit, 58470 Magny-Cours, France
3
Femto-ST, CNRS, Université Bourgogne Franche-Comté, 90010 Belfort, France
*
Author to whom correspondence should be addressed.
Energies 2020, 13(11), 2954; https://doi.org/10.3390/en13112954
Submission received: 22 April 2020 / Revised: 4 June 2020 / Accepted: 5 June 2020 / Published: 9 June 2020
(This article belongs to the Section E: Electric Vehicles)

Abstract

:
The objective of this work is to develop an optimal management strategy to improve the energetic efficiency of a hybrid electric vehicle. The strategy is built based on an extensive experimental study of mobility in order to allow trips recognition and prediction. For this experimental study, a dedicated autonomous acquisition system was developed. On working days, most trips are constrained and can be predicted with a high level of confidence. The database was built to assess the energy and power needed based on a static model for three types of cars. It was found that most trips could be covered by a 10 kWh battery. Regarding the optimization strategy, a novel real time capable energy management approach based on dynamic vehicle model was created using Energetic Macroscopic Representation. This real time capable energy management strategy is done by a combination of cycle prediction based on results obtained during the experimental study. The optimal control strategy for common cycles based on dynamic programming is available in the database. When a common cycle is detected, the pre-determined optimum strategy is applied to the similar upcoming cycle. If the real cycle differs from the reference cycle, the control strategy is adapted using quadratic programming. To assess the performance of the strategy, its resulting fuel consumption is compared to the global optimum calculated using dynamic programming and used as a reference; its optimality factor is above 98%.

Graphical Abstract

1. Introduction

To reduce the environmental impact of the transportation sector, governments and institutions introduce more and more stringent legislation and pollutant emissions limits. To respect these drastic limits and reduce fuel consumption and pollutant emissions, car manufacturers have to develop more environmentally sensible powertrains and cost efficient solutions. Due to the high battery cost, electric vehicles are still not able to fully answer the demands. Furthermore, limited battery lifetime, long recharge times and the lack of recharge infrastructure also limit their development [1]. Moreover, drivers fear to run out of electricity, also called range anxiety [2]. To face this anxiety, Plug-in Hybrid Electric Vehicles (PHEV), associating a thermal engine and an electric motor, are expected to be the missing link from conventional thermal to full electric vehicles in order to reduce emissions [3,4,5]. Since their energy comes from both liquid fuel and electricity, 60% of the driving cycles can be covered electrically, due to their electric autonomy of 30–50 km [6,7,8,9] and longer ranges can be achieved thanks to the internal combustion engine. However, to fully benefit from their potential and globally reduce CO2 emissions, electrical energy from renewable sources should be available at destination and PHEV should arrive there just at the moment when its battery is discharged [10,11]. A non-optimum energy management system may lead to an excessive use of the thermal engine and associated fuel consumption, whereas the driving cycle could have been fully performed using electric energy. In the worst case, the battery could be empty before arriving at the destination and the internal combustion engine will have to cover all vehicle needs. Due to the use of non-optimal working points, this would create non-necessary pollution, reduces the global efficiency and increases fuel consumption [12,13].
Numerous control strategies have been developed in order to optimize the energy management inside the hybrid powertrain for different on-road and off-road applications [14,15,16,17,18,19,20]. The optimization strategy is either based on Pontryagin’s Minimum Principle (PMP) [21] or Dynamic Programming (DP) [5]. Wirasingha and Emadi [12] presented an exhaustive analysis of control strategies for PHEVs. They reviewed the state-of-the-art control strategies and showed the algorithm are either rule-based or optimization-based but they did not focus their analysis on the prediction aspects. More recently, Zhang et al. and Chrenko et al. reviewed the different control strategies based on bibliometrics and showed that the driving cycle highly influence the control strategy [22,23]. Therefore, it is highly important to predict the energy use in order to optimize the efficiency. Numerous authors state that model predictive control has already shown its potential for optimizing energy use in a hybrid electric vehicle (HEV) [24]. Recently, Shen et al. [25] proposed an energy management strategy for a PHEV bus using speed profile predictions based on Markov’s chain. They were able to reduce fuel consumption by 3.11%–7.9% by using Model Predictive Control. Liu et al. [26] also developed an energy management based on Markov’s chain to generate probability matrices of power demand for an hybrid vehicle.
The goal of the present study is to provide the most adapted energy management for a particular driving cycle under real driving conditions based on a predicted cycle and the corresponding control strategy. The trip includes the itinerary, which corresponds to the position of the vehicle between departure point and arrival as a function of time, the speed profile as a function of time and drivers habits. A same trip might be realized numerous times and each realization is called an occurrence. The driving cycle takes into account speed profiles, elevation and driver’s habits. The objective is to develop an energy management tool to optimize the energy distribution inside a plug-in series hybrid vehicle. This is done by a real-time control system, based on usual trips recognition, which adapts on-line the DP based control strategy for a previously recorded reference driving cycle in order to reach the best energy distribution along the particular forthcoming driving cycle. The work will lead to an innovative predictive management.
The following section presents a summary of vehicle usage in France and focuses on the analysis of the use in the Nièvre area due to an intensive measurement campaign. The innovative energy management based on driving cycle prediction is presented in Section III, including the optimization approach based on off-line and real-time strategies with the corresponding results. Finally, the article ends with Conclusions and Perspectives in Section 4.

2. Assessment of Vehicle Use

2.1. General Survey of Passenger Car Use in France

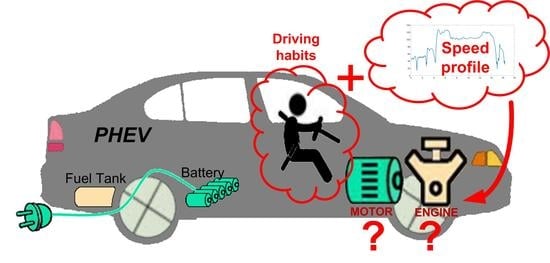
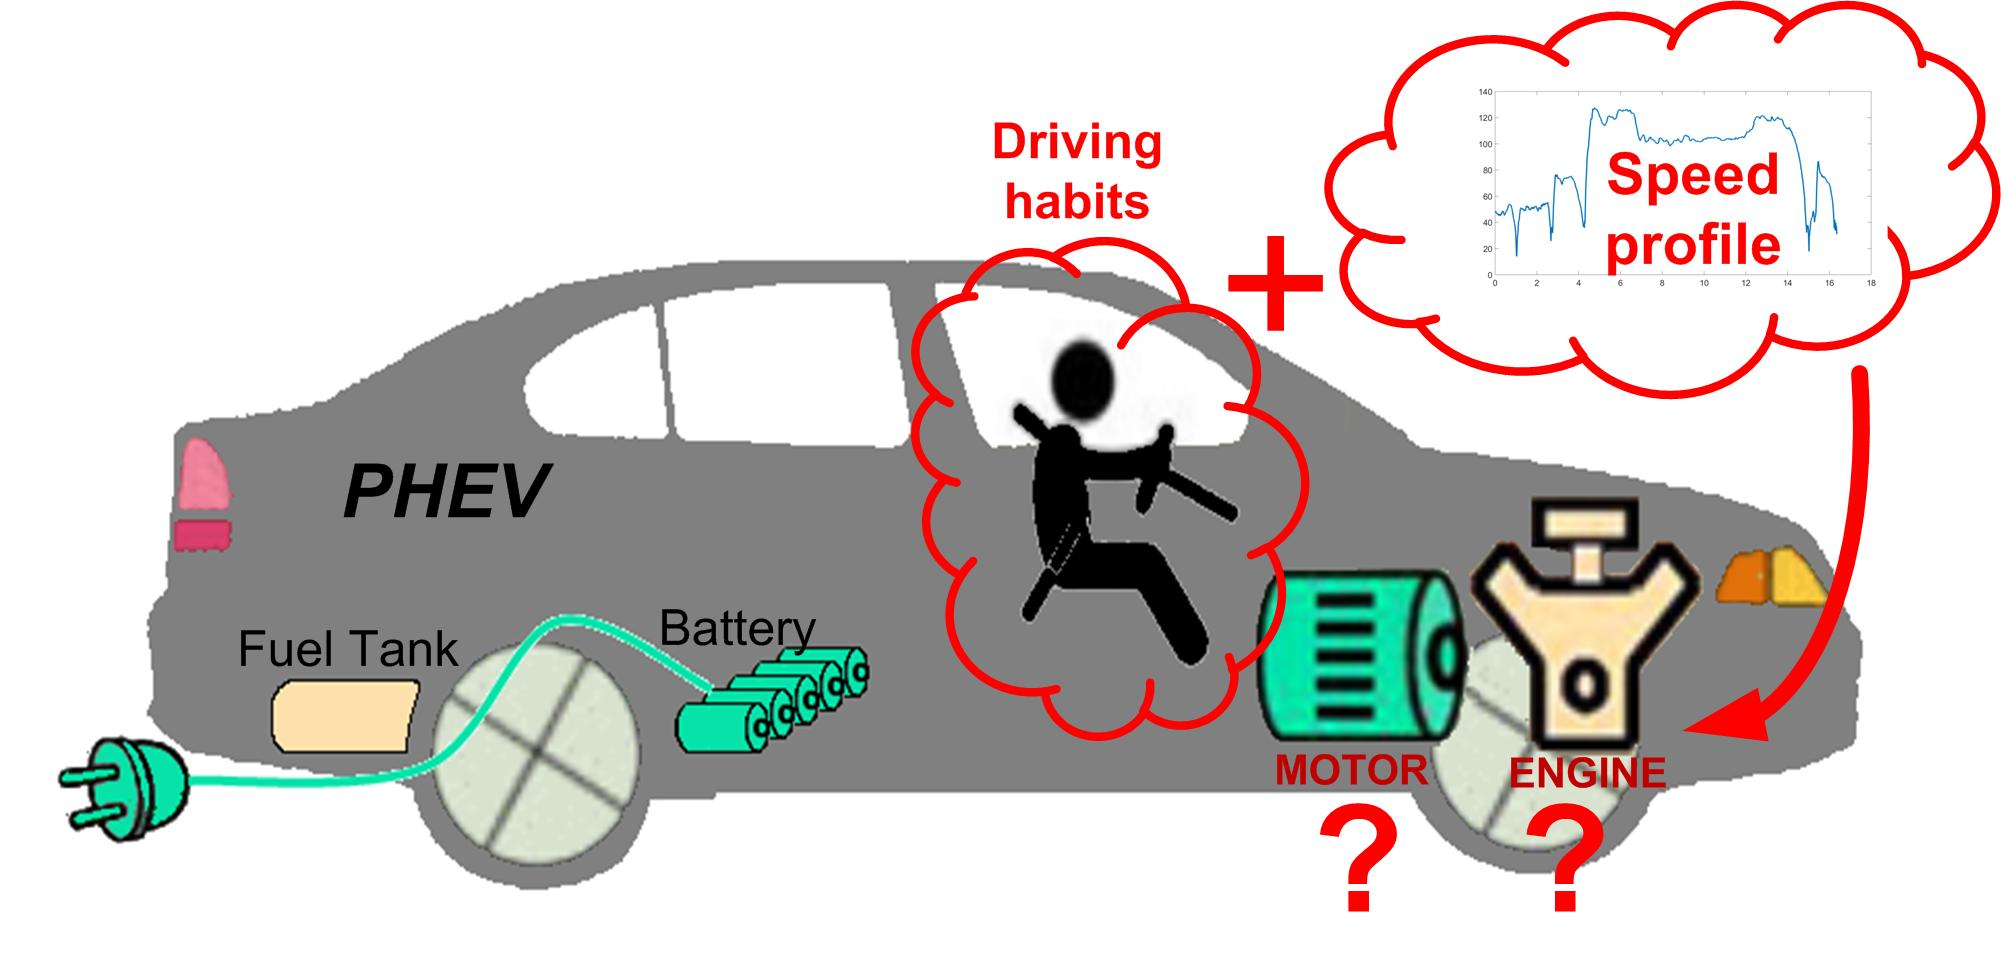
Creating the optimal control strategy for a PHEV first requires one to confirm that the mobility is mainly motivated by habits and constraints. According to previous surveys in France in 1994 and 2008 [27], more than 50% of trips are constrained by the needs to go working, studying or shopping (Figure 1). Such a stable distribution suggests that it could be possible to recognize and predict the trips, including destination and itinerary, during working days.
Furthermore, on a daily basis, the average distance travelled is below 30 km (Table 1), which is within the electric range of a PHEV. These values are averaged over numerous drivers and do not take into account driver behavior (speed profile and acceleration). Hence, it does not reflect the dependency on driving style, road load and the car’s characteristics (power, weight, etc.). As previously mentioned by many authors [7,28,29], these parameters have a strong impact on the power demand and affect energy consumption. Therefore, they have to be considered for the energy management in order to reduce fuel consumption. Creating artificial realistic speed cycles is possible due to modeling [30]. Moreover, studying the use of vehicles under real driving conditions allows identifying whether a reduced number of trips are frequently reproduced. Thus, in the following we performed an identification of frequent trips, their associated speed profiles and a study of the influence of the driver behavior. The results from this mobility study are presented in the next subsection.
The mobility survey presented in this study first aimed at comparing the previous statistics for France with the statistics in the rural context of the Nièvre department in France. The goal was to record, due to an autonomous acquisition system, real driving cycles and recognize frequent trips.

2.2. Design of the Experimental Study

In order to get statistical results in agreement with the previous census from the INSEE (Institut National de la Statistique et des Etudes Economiques) [31] in 2008, a representative panel, of 40 people, representing the working population in Nièvre has been defined to fulfill the criterion based on the quota method (age and sex). This is a required condition to obtain significant results. The detailed composition of the panel is presented in Table 2 and included 47% of women and 53% of men. The age distribution was nearly spread evenly between 20 and 60. To take into account the amount of working people older than 60 (French legal retirement age is 62), only one driver represented this age group. Each volunteer received a fully autonomous acquisition system fixed in the car during one month. Overall, the mobility study was performed during 4 months.
Arduino systems were used to develop ten identical on-board data acquisition systems (Table 3). These autonomous systems works without any action from the driver once placed inside the vehicle, usually below the driver’s seat. Thus, the driver cannot see the acquisition system while driving and this reduces any potential bias due to a change of driving style. Each acquisition device includes a 9 axis inertial unit, a GPS and a 32 Go micro SD card for data storage. To avoid any power failure, 18 lithium-ion batteries (BRC 18,650, 3.7 V) ensure a one-month autonomy. The acquired data, recorded during one month at a frequency of 10 Hz, consist of date, time, GPS coordinates, speed and acceleration over 3 axes. Such a frequency corresponds to the frequency previously used in Ericsson’s study [8]. Greater acquisition frequencies (up to 500 Hz) were tested but they did not increase accuracy but increased the storage capacity needed. Moreover, the agreement between the 10 data acquisition systems and the comparison with a RTK GPS, which has a precision of a few centimeters, was validated on the same trip and showed very good agreement since the maximum difference between the data acquisition systems and the RTK GPS was less than 0.5 m. The energy difference generated over the trip was less than ±3%.

2.3. Results of the Mobility Study

The measurement campaign lasted 4 months and included 40 drivers. Overall, the database includes 2013 trips, which corresponds to 19,000 km (Table 4). Most trips were performed during week days. On a daily basis, the results presented in this study were in good agreement with a previous broader study performed in French rural areas [27] (Table 1). Even if the number of trips was very similar, the average daily distance was increased since the employment area and the housing area were often not close one from another and a motorway crossed the Nièvre. This also explains the increase of the average driving time and the average speed because 61.5% of the drivers used this motorway.
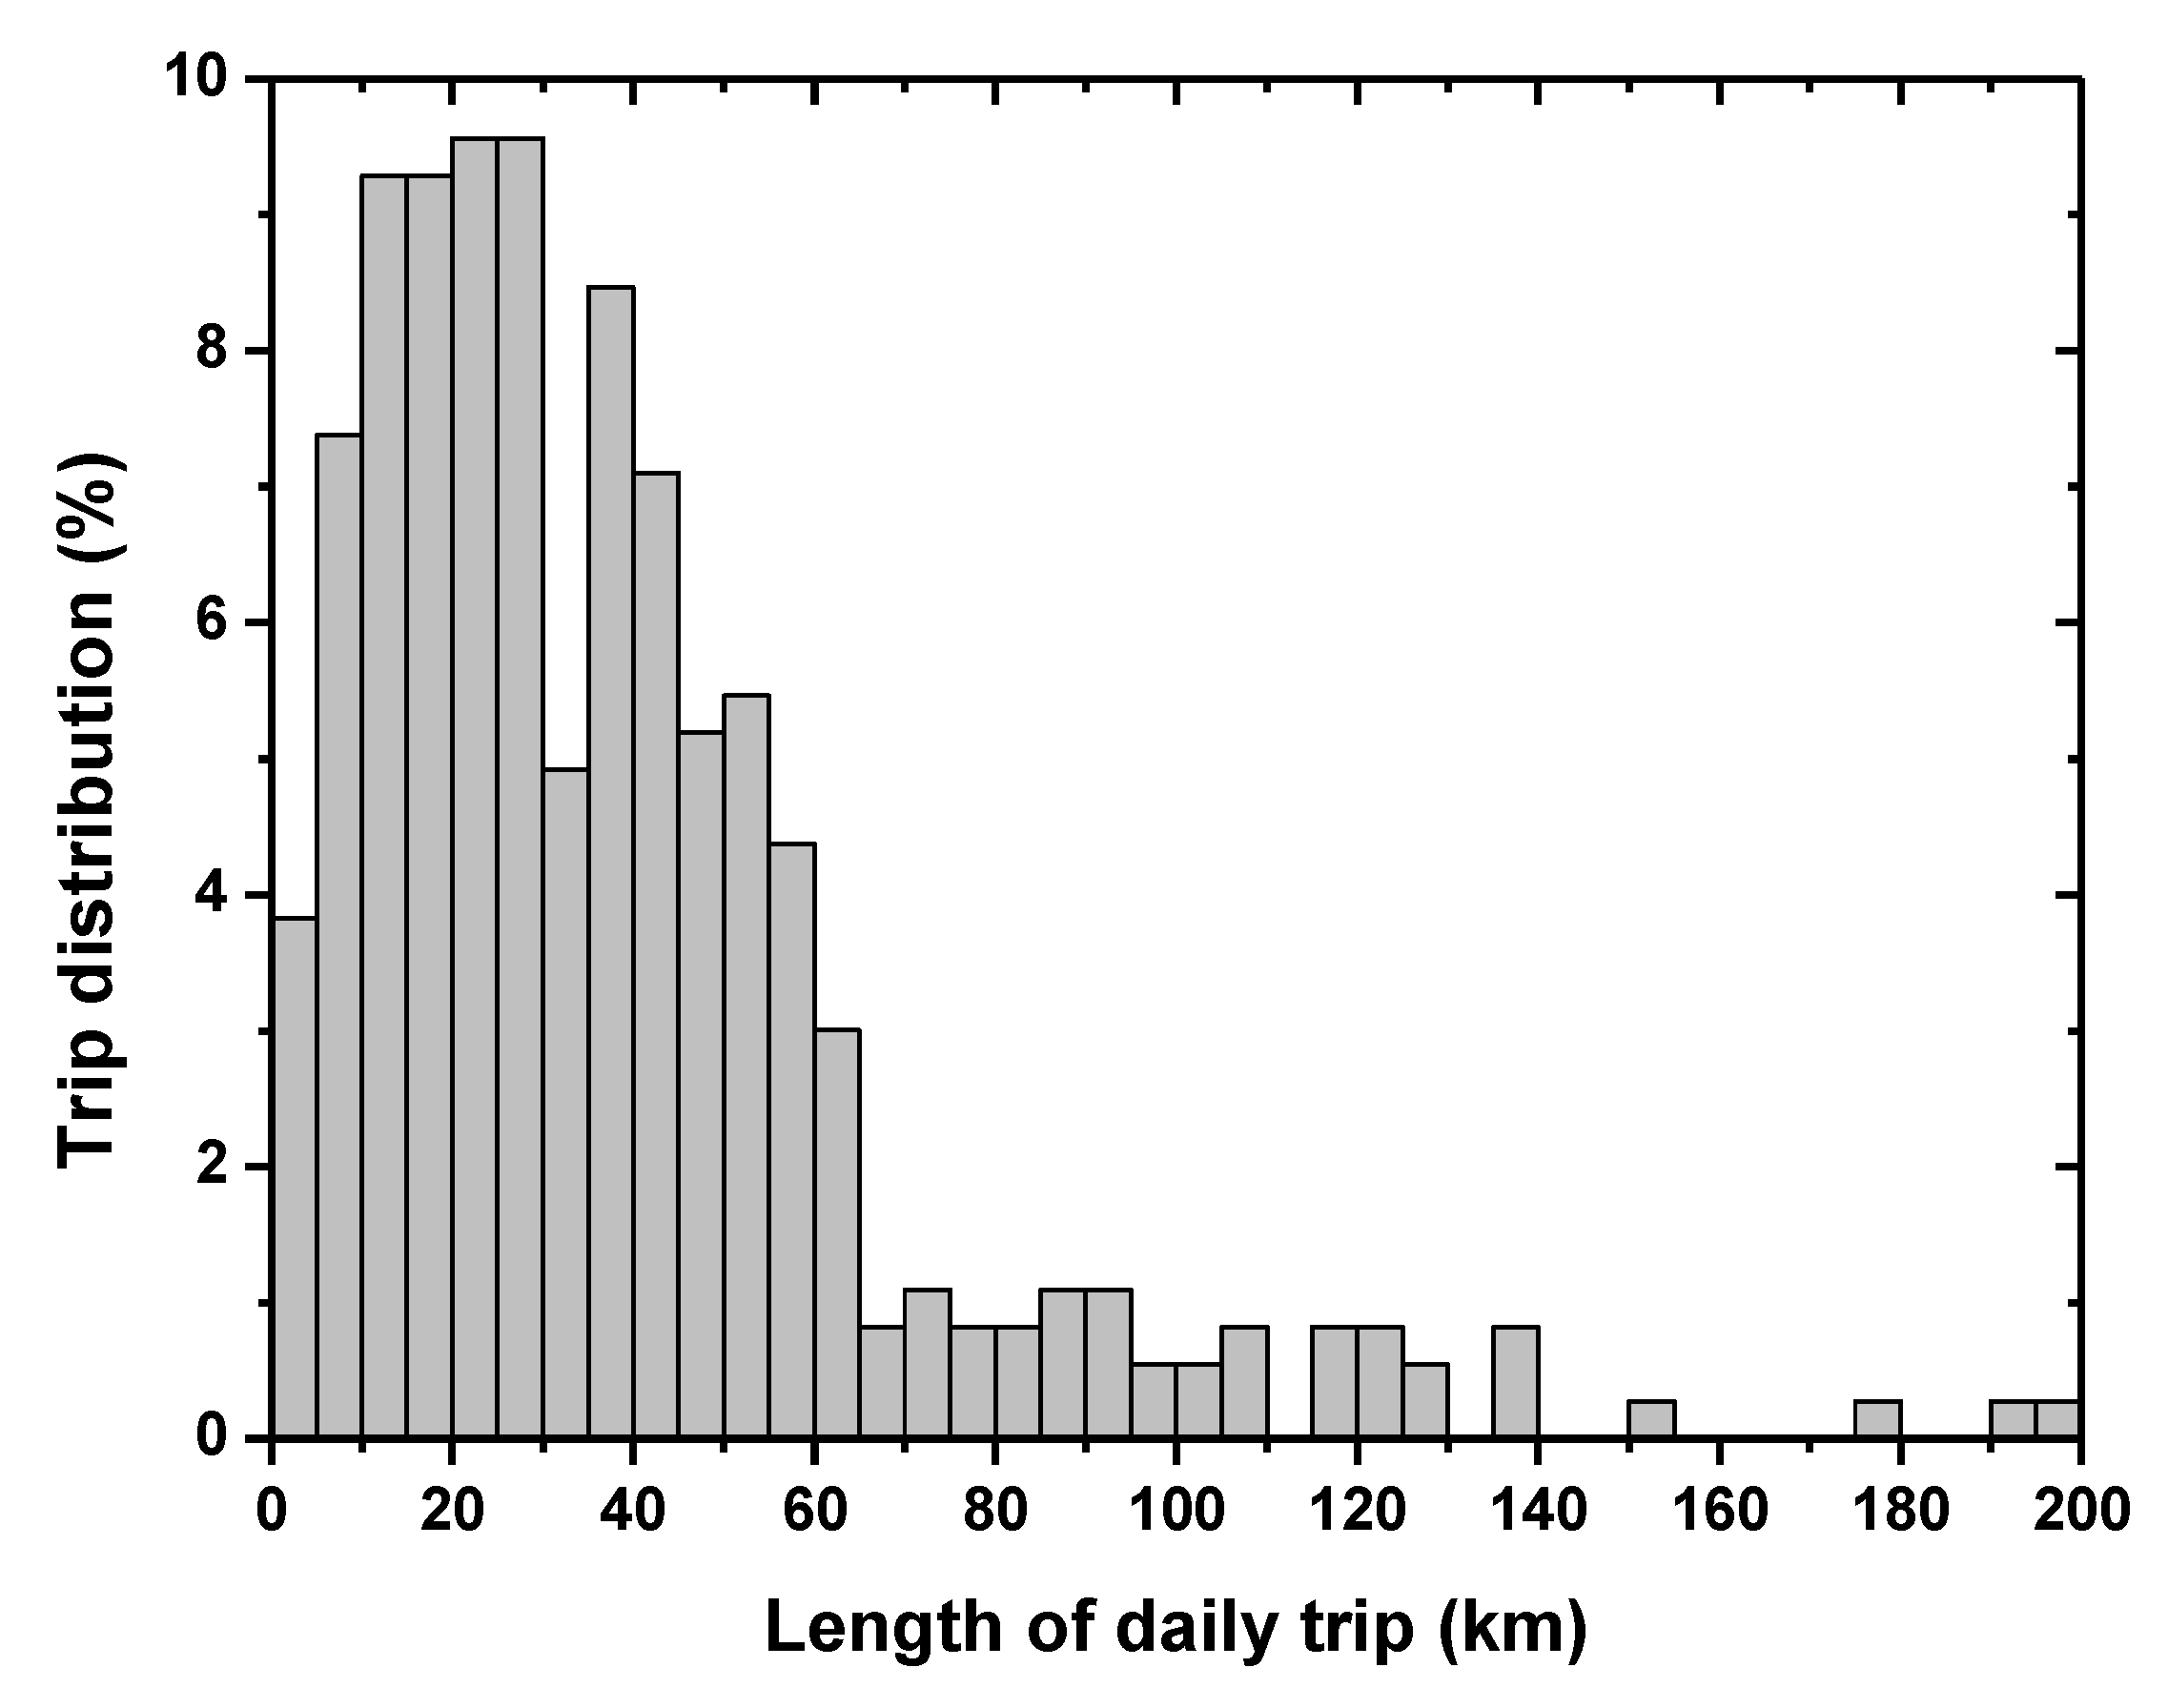
As previously mentioned, it can be noticed (Figure 2) that, on average, majority of drivers travelled around 30–40 km daily. This is in agreement with the previous study [27] and such a distance can be covered using the electric energy supply of a PHEV [6,9]. However, the distribution is quite large and a significant part of the drivers travelled up to 60 km per day. Finally, since this study also included travel performed during weekends, it can be noticed that longer trips were performed (more than 100 km) and this justified the use of a range extender since the autonomy of the battery was no longer sufficient. During this experimental study, the longest distance performed per day was 441 km.
Since, as shown by Figure 1, an important part of the trips is constrained, it should be possible to identify usual trips for each driver. This is the first step to optimize the energy use. To this end, a normalized cross-correlation factor, σ (equation 1), was determined for each driver considering daily repetition based on the vehicle position during the trip. In this equation, which compares two trips (f and g), x,y and u,v correspond to the coordinate (x,u: latitude and y,v: longitude) giving the vehicle position for the two respectively compared trips f and g. In order to be compared, the length of trip f has to be greater than the length of trip g. f u , v ¯ is the average position of f ( x , y ) in the region covered by u and v.
σ   = x , y [ f ( x , y ) f u , v ¯ ] [ g ( x u , y v )   g ¯ ] x , y [ f ( x , y ) f u , v ¯ ] 2 x , y [ g ( x u , y v )   g ¯ ] 2  
Trips are considered identical if σ is greater than 0.9. This level for the cross-correlation factor is chosen since the car location may differ from one trip to another for example due to different available parking spots, as previously mentioned by Pasaoglu et al. [32] and two identical trips cannot be perfectly reproducible. Overall, the minimum and maximum distances between the departure or arrival points were respectively 1.5 m and 312 m. A difference was noticed between rural and urban areas since the maximum distance was greater in urban areas (312 m vs. 256 m for departure point and 151 m vs. 50 m for arrival points). This is probably due to the use of public or private parking place. Thus, for all different trips, it is possible to calculate the number of occurrences and evaluate the predictability of the trips.
For each starting point, the predictability is defined as the proportion of identical or similar trips (σ > 0.9) in the total number of trips starting from this point.
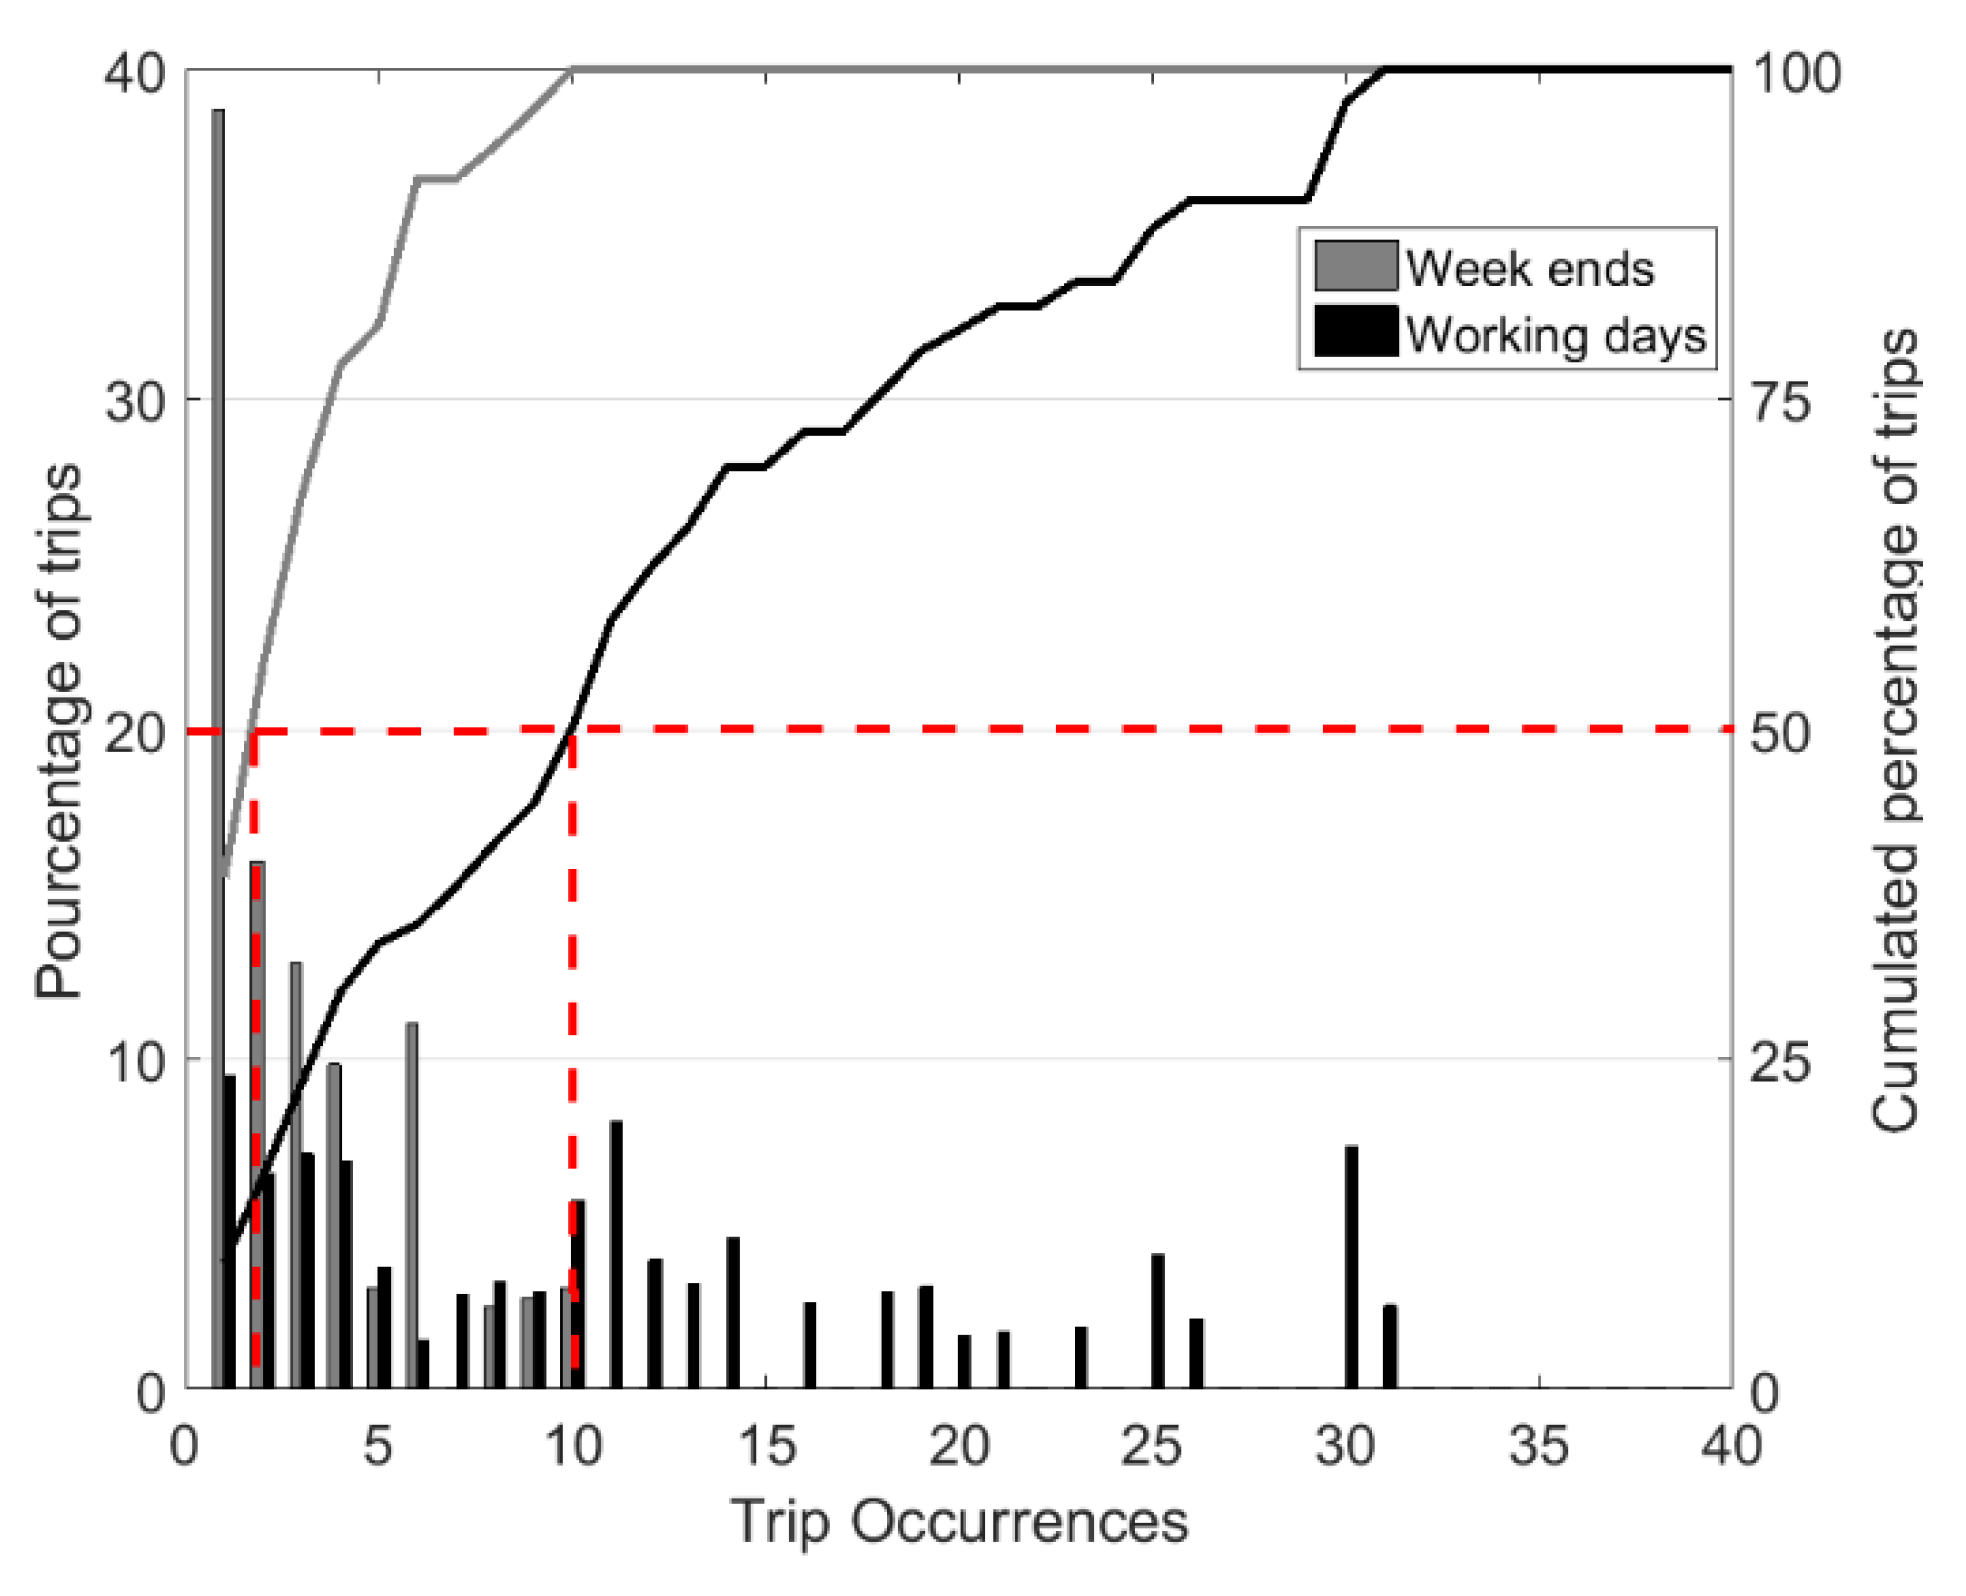
Since mobility is mostly constrained, a distinction is performed between working days and weekends when analyzing the results and identifying repetition of trips. First, the distinction shows that more than 75% (1563 trips out of 2013 trips) of the trips were performed during working days. A further analysis (Figure 3) revealed that, on working days, a majority of trips shows more than 10 repetition whereas on weekends, 50% of the trips were performed only once. Considering working days, 75% of the trips were repeated more than 5 times. Hence, this allows the identification of similarities, as presented in Table 4 for a selection of typical drivers and all the database. Overall, the correlation factor was greater than 82% during working days. However, some discrepancies appeared between a driver’s behavior since, for example, the trips performed by the woman between 40 and 50 (Table 4) were more numerous, had a limited distance and had a higher number of destinations. A deeper analysis shows that most trips were performed in urban areas and the driver may have used different itineraries to avoid traffic jams. This strongly reduced the possibility to identify similar trips and the predictability fell down to 60%.
Due to a reduced number of trips and repetitions during the weekend, prediction was also more difficult and the predictability dropped below 25%.

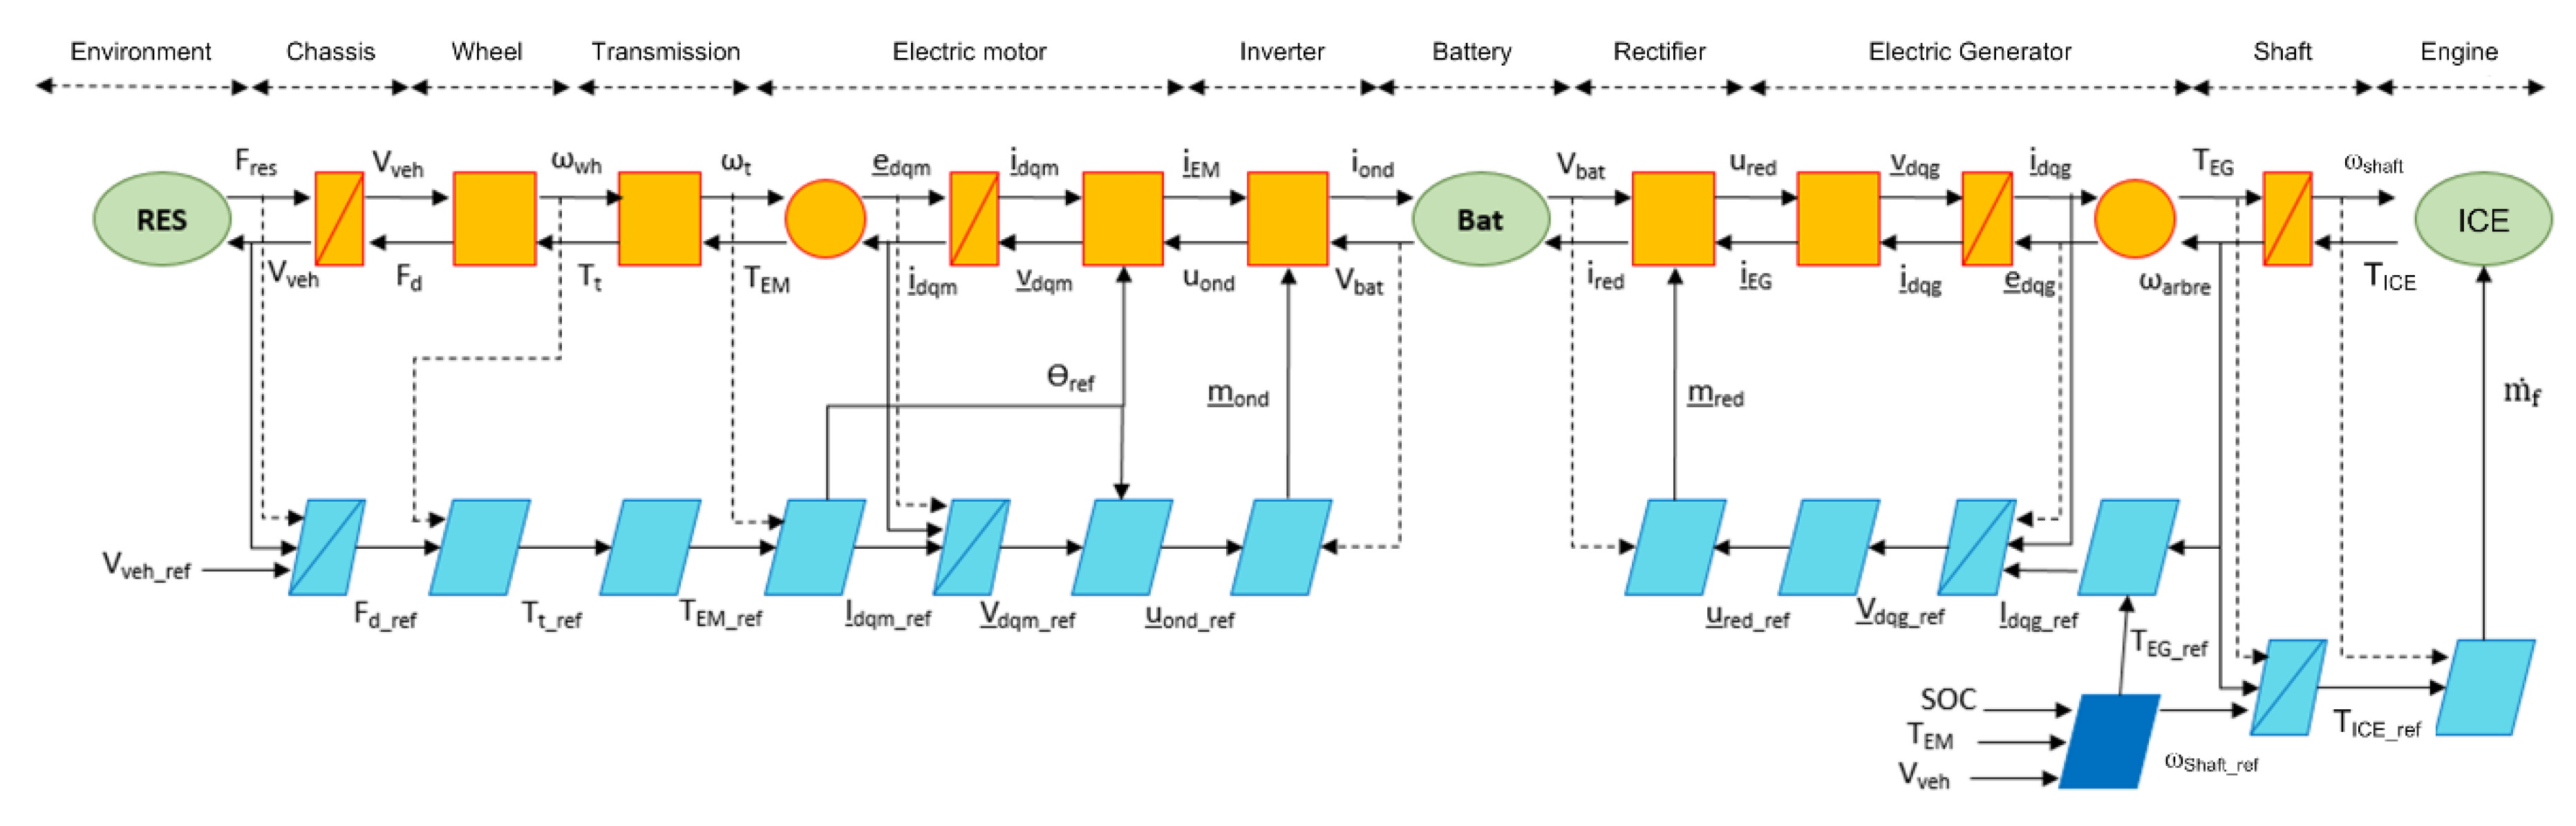
2.4. Evaluation of the Energy Needs

The measurements obtained during the mobility study were used in order to evaluate the energy and power needs using a static model. This static model calculated, based on vehicle characteristics and the vehicle speed, Vvehicle, the forces that were applied on the vehicle due to Equation (2) where Fdrag is the drag force, Finertia the force needed to accelerate the vehicle due to its weight (no slope) and Frolling the rolling resistance force. These forces are compensated by the powertrain power, Ppowertrain. With regard to the PHEV aspect, in the static model, the vehicle is equipped with a Li-ion battery and the energy management is a simple rule-based strategy (charge depleting mode until SOC = 20% followed by the charge sustaining mode). The internal combustion engine is modeled by the simple equation proposed by Asus et al. [33]. However, since the study was anonymous and no data were recorded about the vehicle characteristics, three reference vehicles have been chosen: a city car, a sedan and a SUV whose characteristics are presented in Table 5.
P p o w e r t r a i n = F p o w e r t r a i n · V v e h i c l e = ( F d r a g + F i n e r t i a + F r o l l i n g ) · V v e h i c l e
Each vehicle performed all the 2013 recorded speed cycles and 19,000 km. Based on the static model, it is possible to compute the energy needed to perform each cycle and, due to the date information of cycle, to add all the energy needed during one day and calculate the overall daily energy needs. 
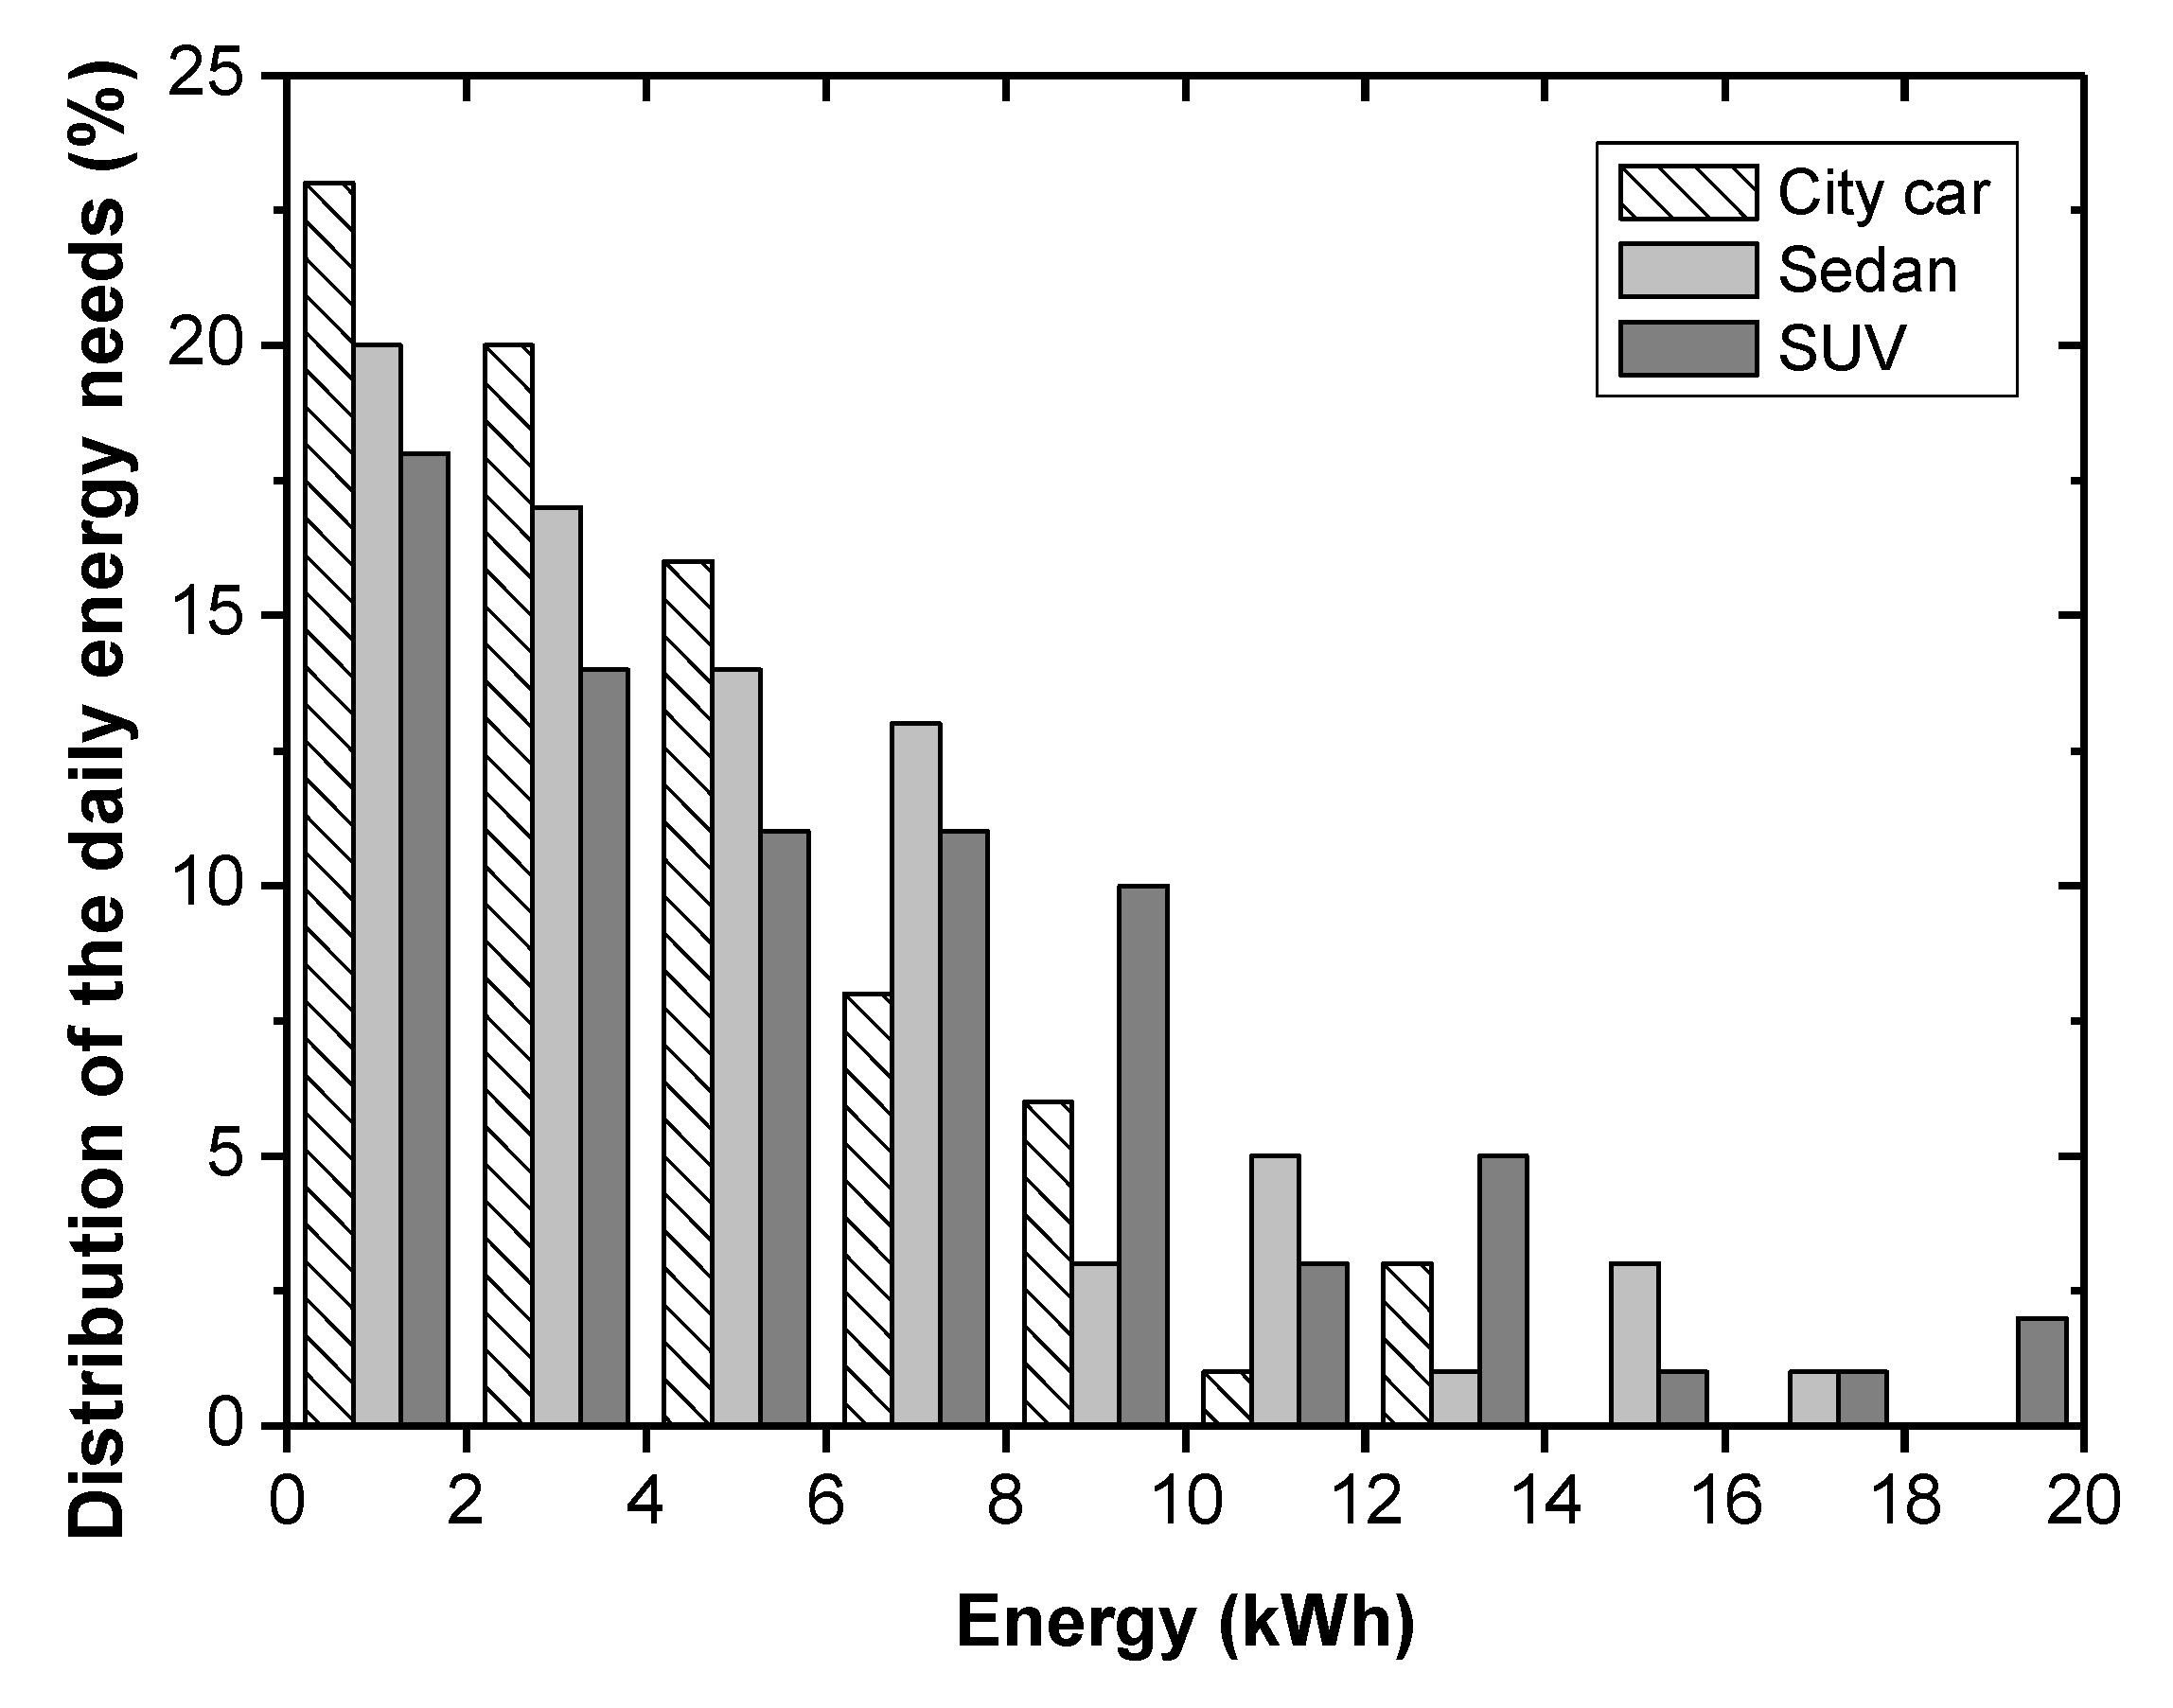
Figure 4 presents the energy distribution that is required to perform the trips on a daily basis for the three types of vehicles. For a city car, the results show that 95% of the daily energy needs would be covered by a 10 kWh battery, whereas a SUV requires at 14 kWh to cover 95% of the usual daily energy needs.
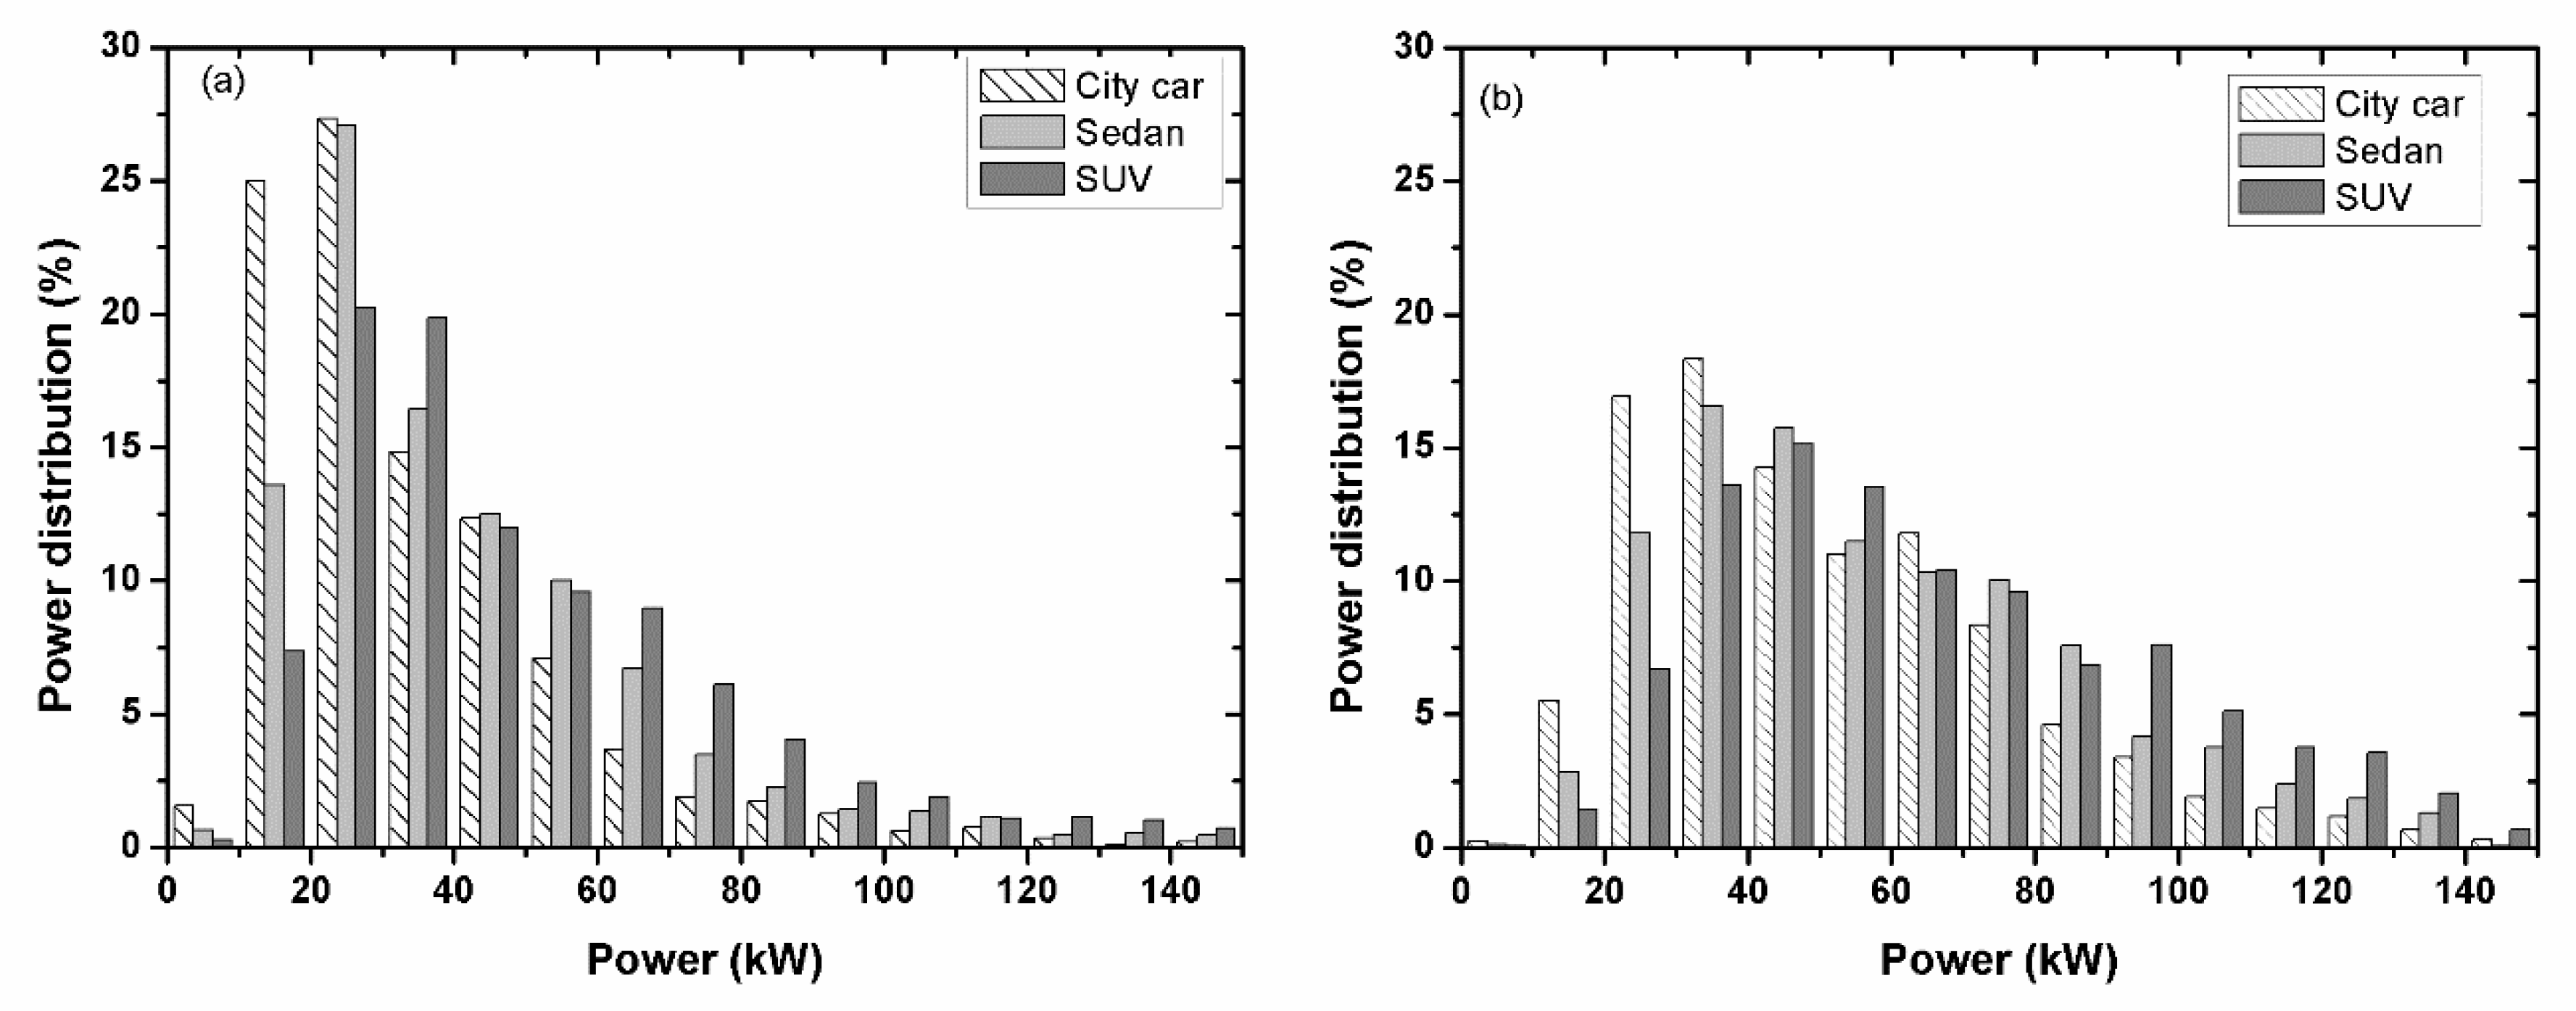
With regard to the power requirements, a 100 kW powertrain would be sufficient to cover 95% of the power needed (Figure 5a). Of course, these values were impacted by the type of car used and the driver behavior during the experimental campaign. However, it can notice that a 50 kW powertrain covered 83% of the needs for a city car. As expected, the energy and power needs increase with the size of the car due to greater car weight and aerodynamic resistance.
In the case of an electric car equipped with a 40 kWh battery (Figure 5b), the power requirements were increased due to the weight of the battery, which was approximately 300 kg. Hence, in order to cover the same proportion, an 80 kW powertrain was needed to cover 86% of the power requirements of a city car and a 120 kW was required to 95% of the needs. However, such a battery electric vehicle would present a greater electric autonomy as evaluated along the WLTC cycle (
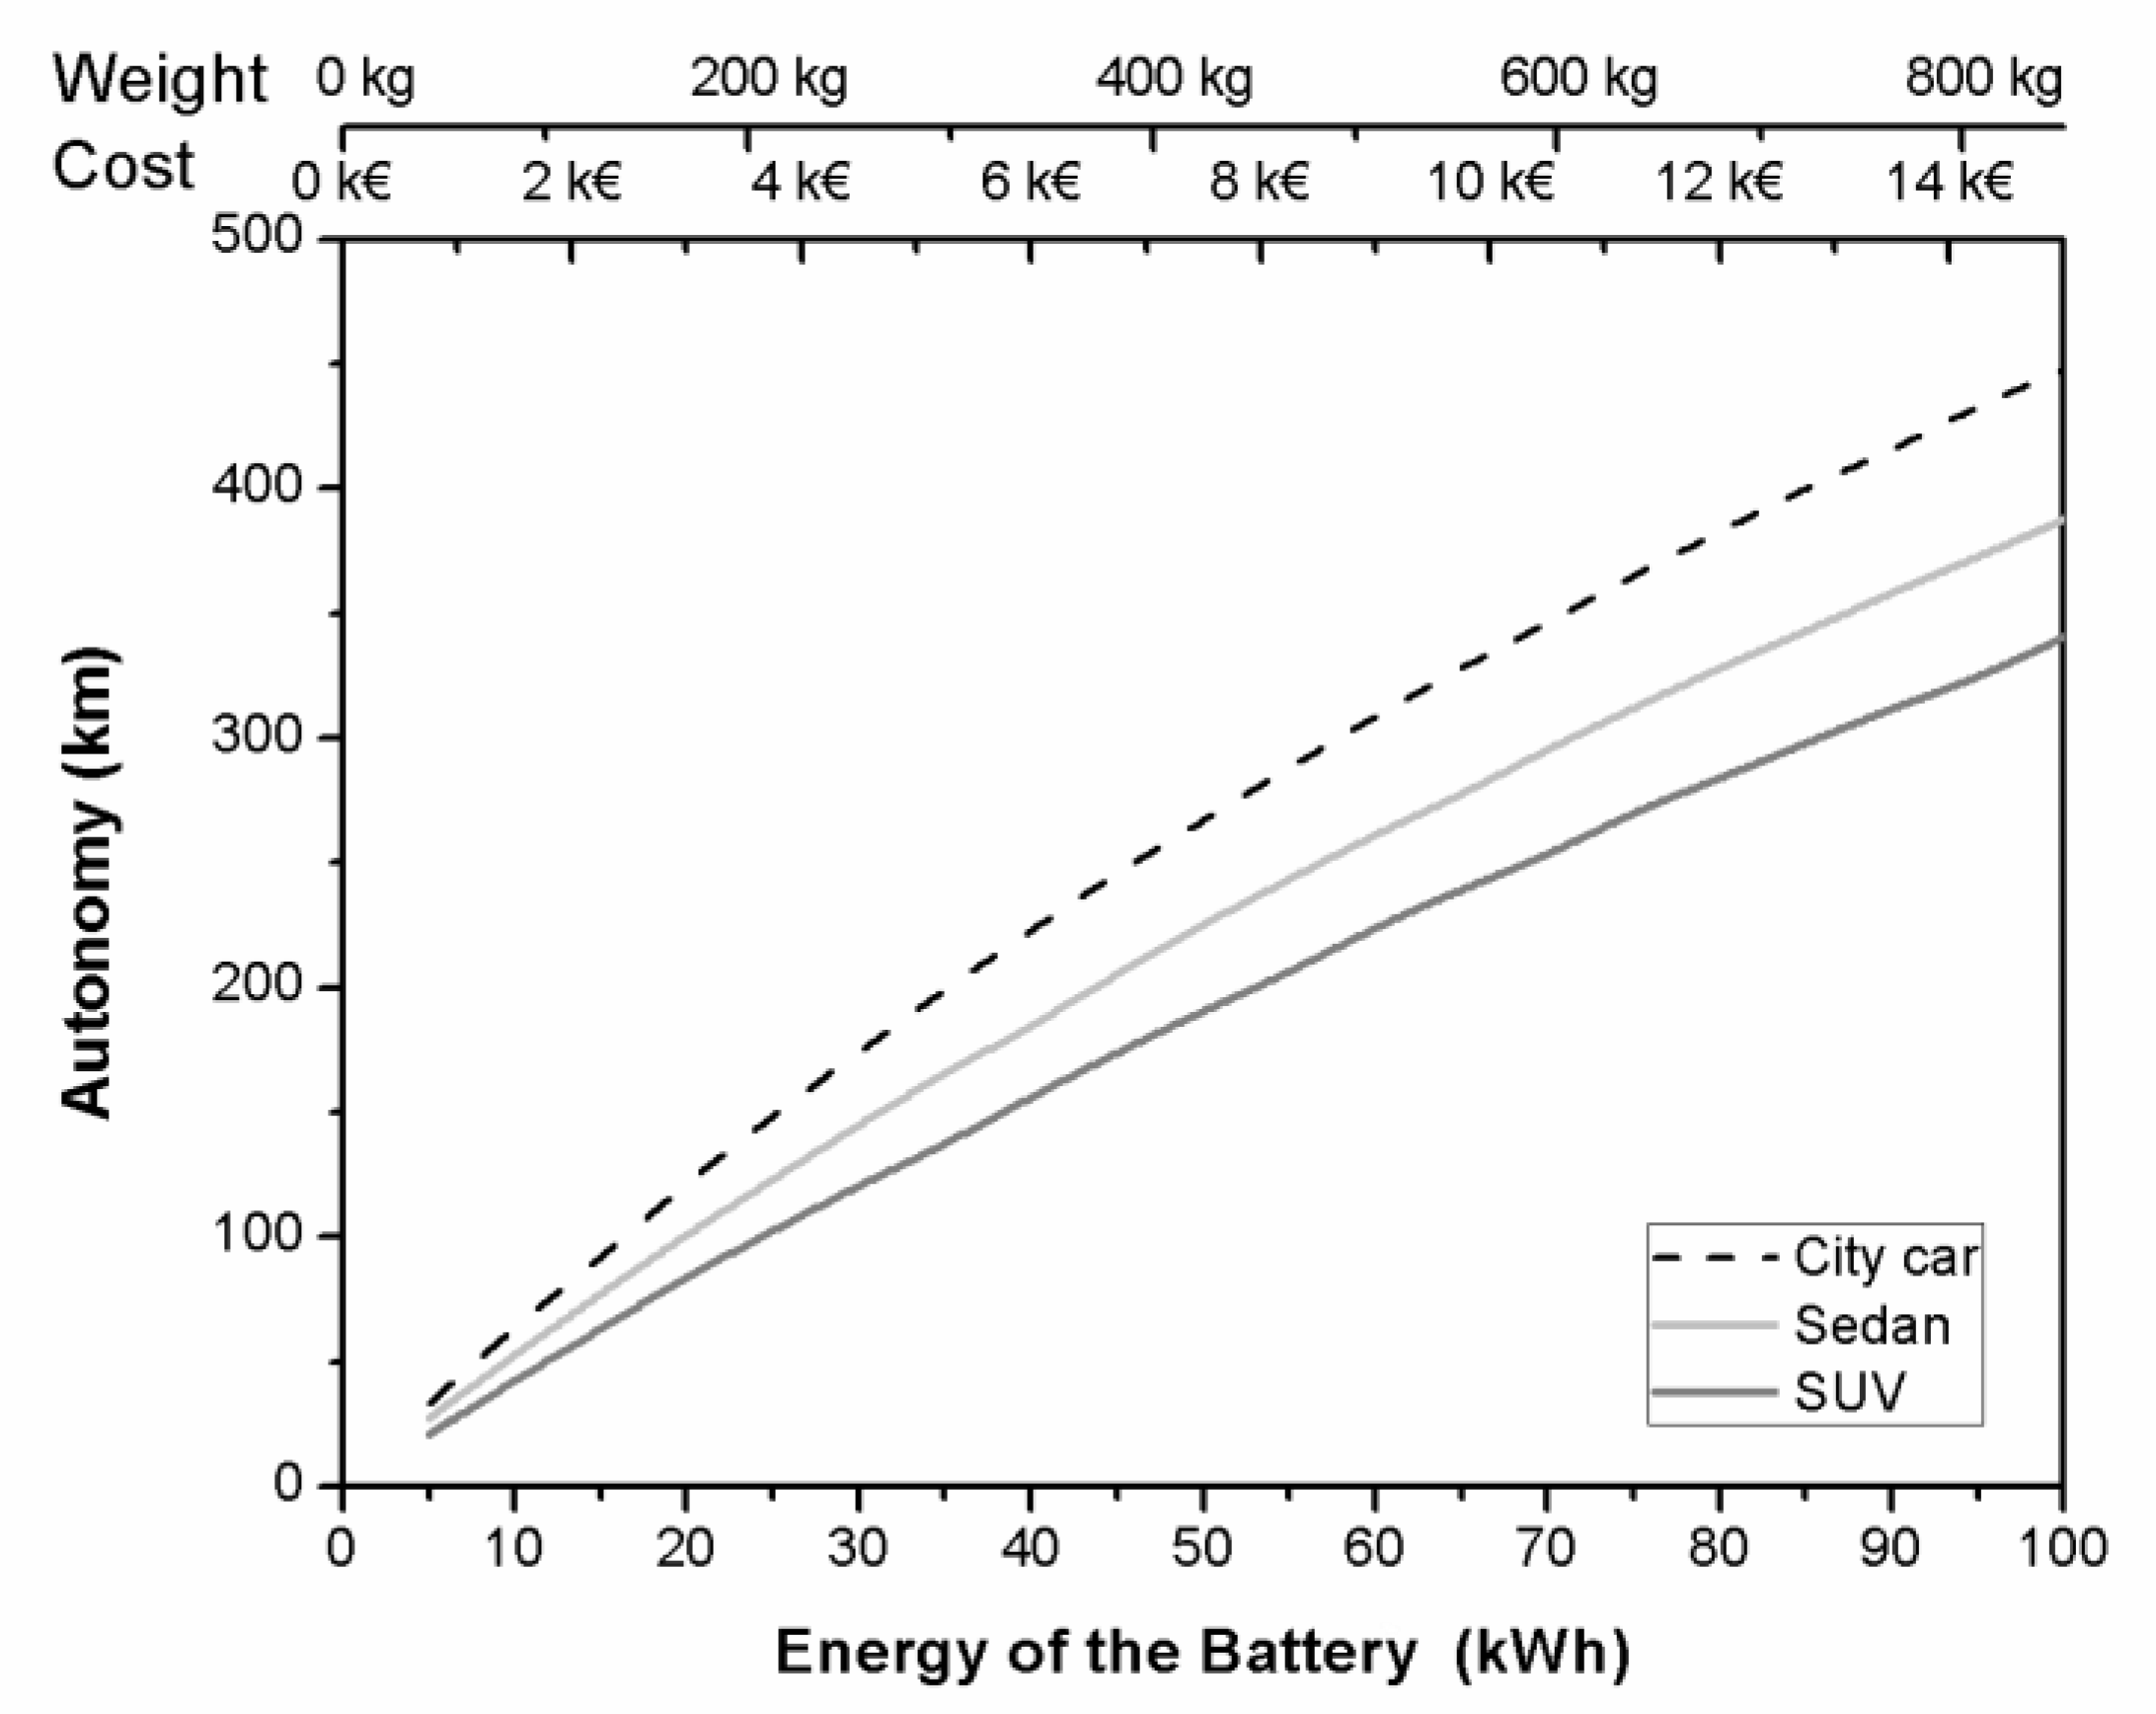
Figure 6). The cost of the battery also increased (specific energy 120 Wh/kg, cost: 150 €/kWh). Therefore, in order to reduce the power requirements and the weight, it is more efficient to reduce the size of the battery and use a PHEV with an adaptive energy management.

3. Energy Management Based on Speed Cycle Prediction

The important objective of energy management of a PHEV is to meet the energy needs in a best way respecting real time constrains. This requires the knowledge of the driving cycles. As shown above a huge part of the trips were predictable. Those predictions could then be used to anticipate the energy needs during those common trips after accurately predicting the coming speed profile (see Section 3.1) and the calculation of the energy and power needs during the selected cycle based on a vehicle model (see Section 3.2). These elements were used to present a real time capable energy management (see Section 3.3). Results (see Section 3.4) show that the optimality could be as high as 98%.

3.1. Cycle Prediction

Based on their repetition, trips are sorted and stored as a function of the destination. Thus, it is possible, from a particular starting point and depending on the day, not only to identify potential destinations but also to identify the best energy distribution for this trip. First, depending on the day and the origin point, the trip presenting the highest likelihood was selected. It corresponds to the trip that is performed with the highest frequency (Figure 7). Second, each trip necessitates a characteristic speed cycle, which includes the driver behavior. Creating a speed cycle by averaging of the different occurrence of the speed cycle cannot be used. Such a methodology artificially smooths the speed fluctuations and removes the driver behavior. Additionally, the use of a Markov chain process based on acceleration characteristics of the driver around the mean speed profile, similar to Souffran et al. [34], was tested but eliminated since the resulting speed cycle presents a higher speed fluctuation frequency than the real speed cycle and is not similar to a real speed cycle. The third way is to use a recorded real speed cycle, which has to be representative of all the recorded speed cycles stored for each trip. To find this most representative speed cycle among the stored ones, a cross-correlation is performed between all the cycles based on the velocity profile. The cross-correlation equation is analogous to Equation (1) but instead of comparing positions, the cross-correlation was performed based on speed profile as a function of time. Dynamic programming is realized offline on this real speed cycle in order to identify the most efficient energy distribution. After each new occurrence of a trip, the new speed cycle is compared to previously stored cycles using the cross-correlation and stored if its cross-correlation level is high enough. In order to converge to a highly representative speed cycle and reduce the influence of stochastic traffic issues (traffic jams, accident and road work), only the ten cycles with the highest cross-correlation criteria are kept.

3.2. Vehicle Model

The dynamic vehicle model of the PHEV used in this study was based on Energetic Macroscopic Representation (EMR). This representation has been developed based on the action/reaction rule between connected elements. It is widely used for hybrid vehicle and energy systems [35,36,37] due to its Inversion Based Control (IBC), which allows the development of control strategies for complex systems such as PHEV [38]. The model has been previously validated for the series hybrid electric racing car Noao (Figure 7) developed and tested in Magny-Cours [39] and whose characteristics are presented in Table 6. As the study was only concentrating on the use profile, no information about the vehicles used during the study was recorded. Moreover, due to the limited implementation in the market it is unlikely that a driver participating in the study used a PHEV. Therefore, the following investigation was done on the basis of the Noao vehicle. However, it could be adapted quite easily to any other kind of series hybrid plug-in hybrid vehicle by adapting the vehicle parameters.
Due to the different blocks (Figure 8), all the different components of the powertrain (thermal and electrical) were modeled. In order to respect the speed cycle, the vehicle had to overcome all the applied efforts (aerodynamics, inertia and friction), which were used to calculate energy and power needs. Thus, the model calculated the fuel mass flow rate and the state-of-charge (SOC) of the battery.
The electric engine and the generator were permanent magnet synchronous machines and were modeled in order to perform an optimal control including internal friction losses and iron losses. The battery voltage, Vbat, was calculated from the voltage of a single cell in open-circuit, VOC, thanks to the exemplary empiric Equation (3) proposed by Erdinc et al. [40] for lithium-ion batteries and takes into account the state-of charge, SOC, and Joule losses calculated from the internal resistance, Rint, and the battery intensity, ibat (Equation (4))
V o c = 1.031 e 35   S O C + 3.685 + 0.2156   S O C 0.1178   S O C 2 + 0.321   S O C 3
V b a t = n c e l l ( V o c R i n t · i b a t )
The mass flow rate of fuel, m ˙ f u e l , is linked to the torque delivered by the engine, TICE, due to the very simple Equation (5) proposed by Asus et al. [33], which takes into account the indicated efficiency of the engine, ηi, the lower heating value of the fuel, LHV, the friction losses, Pfr, and the engine speed, ω (Equation (5)).
T I C E = η i   m ˙ f u e l   L H V P f r ω .
First, to validate the model, the rule-based energy management of the Noao was used in the dynamic model. The model is able to accurately reproduce the power profile of the electric motor and the fuel consumed by the spark ignition engine. Thus, with regard to the state-of-charge profile over the speed cycle, the maximum error between the real experimentally recorded profile and the numerically modeled profile was below 1%.

3.3. Optimization Strategy

3.3.1. Off-Line Strategy

It is generally understood that the optimum energy management can be achieved using Dynamic Programing (DP) [12,23]. However, this strategy is based on a backward calculation, which needs the a priori knowledge of the entire driving cycle. Both the a priori aspect and the long computing time make it impossible to use DP in real time. Even for off-line calculation, in order to reduce the computation time, the equations modeling the electric engine and the generator are replaced by lookup tables providing the efficiency as a function of the rotating speed and torque. These simplifications of the model did however not introduce noticeable difference with regard to fuel consumption and SOC. Therefore, the optimized energy management along a performed trip is determined off-line a posteriori using Dynamic Programming. It takes into account the trip characteristics (speed cycle, SOC and fuel consumption). In the reminder of the work in order to assess the quality of a control, the DP for each cycle is used as reference.
The algorithm used is based on the one developed by Sundström and Guzzella [41], which is modified in order to minimize the cost function, J, corresponding to the mass of fuel used for the trip (Equation (6)) It is calculated based on the mass flow rate of fuel, m ˙ f u e l , during the time-step Ts. The state variable in this study corresponds to the SOC (Equation (7)) and the input variable to be adjusted is the power distribution, which corresponds to the ratio between the power delivered by the internal combustion engine and the total power needed.
J = 0 N 1 m ˙ f u e l   T s
S O C k + 1 = S O C k + V b a t V b a t 2 4   P b a t   R i n t 2   R i n t   Q
Pbat corresponds to the power (in W) delivered by the battery, which has a capacity, Q, (in Ah).
The results for a selection of five similar speed cycles corresponding to five different occurrences of the same trip (19.2 km with an average speed of 44 km/h) are presented in Table 7. In order to promote the use of the internal combustion engine and avoid a cycle performed only using the battery, the starting SOC was reduced down to 0.54. Thus, the goal is to reach destination with the lowest SOC considering that a charging infrastructure will be available. As such, the final SOC was 0.37. Now the question occurs if the energy management identified for the most representative speed cycles (i.e., cycle 5 determined by cross-correlation) can be applied successfully for all occurrences of the same trip. Therefore, the energy distribution determined using DP for the most representative speed cycle was applied directly on the other occurrences of this trip. The resulting fuel consumption was up to 7% higher than the optimal fuel consumption obtained due to DP. The example presented in Table 7 for a trip is representative of the whole database since the same procedure applied to all trips with at least double occurrence the database results in an average increase of the fuel consumption by 5.8%. Therefore, applying the DP results from another speed cycle did not lead to the optimal energy management and an adaptive real time strategy is needed.

3.3.2. Real Time Strategy

One promising approach for real-time control is based on Model Predictive Control (MPC), which uses an explicit model and a prediction of the future in order to generate a control, minimizing a cost function [42,43]. The potential of MPC has been demonstrated for the energy management of hybrid vehicles [44,45] and other energy management applications [46,47,48]. The energy management strategy is highly dependent on environmental parameters such as traffic or weather. Therefore, the speed cycle is commonly cut in time steps in order to obtain a prediction horizon over a foreseeable window and optimize the strategy over this window [49,50]. The novel real-time energy management strategy is combining the DP results of the most representative cycle and the MPC. Therefore, it minimizes the difference between (i) the actual fuel consumption achieved with the energy distribution selected at time t and (ii) the optimal energy distribution over the most representative cycle determined due to the DP of the reference cycle. Then, the energy management is calculated over the prediction horizon. An optimality factor, OF, compares the fuel consumption obtained using the presented strategy with the minimum fuel consumption computed off-line due to DP (Equation (8)).
O F =   D P   F u e l   c o n s u m p t i o n     O p t i m i s e d   F u e l   c o n s u m p t i o n
As previously discussed by Debert et al. [51], the length of the prediction window has an impact on the optimization strategy and a trade-off between the optimality, the computing time and the adaptation to new events has to be taken into account. To evaluate its impact, the duration of the prediction window has been changed from 10 s up to the entire cycle duration, which corresponds to the direct use of the dynamic programming strategy and the optimality factor has been calculated (Table 8). The speed cycle used for this study (Figure 9) includes an urban part (up to t = 60 s), an extra-urban part (between 60 and 135 s) and a motorway part (between 135 and 470 s). A window with a length of 60 s gives a reasonable optimality factor and has been chosen for the strategy. This length is greater than the duration previously used by Debert et al. [51] but seems reasonable since the trip is predicted with good confidence. A greater length would lead to longer computation time and would prevent the use of this strategy in real time.

3.3.3. Strategy Implementation

Figure 10 presents a flow chart that details the different steps of the use of this novel real-time strategy. The first part (in red) corresponds to the prediction of the forthcoming cycle as presented in Section 3.3.1. The second part (in blue) presents the practical application of the pre-determined strategy due to the use of the MPC during the trip. Finally, at the end of the trip, the database was updated based on the newly performed speed cycle.
The goal of the strategy is to forecast which will be the energy needs during the forthcoming cycle in order to adapt and optimize the energy distribution. Typically, the energy management is able to promote the use of the electric motor in order to reduce the SOC prior to a forecasted regenerative braking, as applied by Li et al. on buses [45]. Thus, the available kinetic energy and/or potential energy can be stored in the battery.
With regard to the implementation, the energy management will need some time in order to create the database and store the potential trips. Once the database is filled with enough occurrences, based on the starting point position, it will be possible to forecast with a high level of confidence the forthcoming speed cycle. However, in order to limit the size of data storage and reduce the impact of perturbed speed cycles for each trip, only the ten cycles with the highest correlation factor were kept as stated in Section 3.1.

3.4. Results

The novel real-time strategy based on a combination of the DP of the reference cycle and a MPC using the actual cycle was applied on all trips with more than one occurrence in the database. As an example, the reference cycle of a trip is presented in Figure 8, corresponding to cycle 5 in Table 7. The results applying the novel control strategy to all trips recorded in the database are presented in Figure 11. In conclusion, it can be seen that an optimality factor of 0.95 was reached for all trips of the database recorded during week days and more the 50% of the trips present an optimality factor greater than 0.98.
However, probably the biggest shortcoming of the proposed energy management strategy is the fact that the speed cycle that was predicted may not be correct. In fact, many different trips might exist from the same starting point. In this case, once the deviation is detected a new selection of possible trips is performed in order to select the trip with the next highest probability and the associated energy distribution calculated by DP. As the actual energy distribution might not correspond to the optimum at the beginning of the trip, this leads to a decrease of the optimality factor (Figure 12). However, even if in this case the energy management strategy was not optimized it still stayed robust and the PHEV could finish its trip securely.
Finally, it has to be studied what happens when some unpredicted speed changes occur during the trip due to perturbed traffic. In this case a perturbation resulting in a speed reduction from 110 to 90 km/h (Figure 9) was studied. In such a case the optimality factor will be reduced. However, the energy management strategy might be adapted in the future for example due to the integration of road signs recognition and/or Intelligent Traffic System (ITS).

4. Conclusions and Perspectives

As revealed by an extensive experimental mobility study including 40 drivers during 4 months during which more than 19,000 km were performed, mobility is mostly constrained during working days. The experimental study also revealed that, on a daily basis, each driver performed three trips covering a total distance of 40 km. Such a distance could be covered using the battery of a plug-in series hybrid vehicle. In addition, a 10 kWh battery would be sufficient to cover 95% of the driver’s needs. From this analysis, it is possible to predict the journey based on drivers habits recognition and apply an optimization strategy in order to reduce fuel consumption. Thus, a novel energy management strategy based on MPC and DP for the predicted trip has been developed for a plug-in series hybrid vehicle. It includes the prediction of the journey based on a cross correlation calculation and a cycle prediction based on the selection of the journey with the highest occurrence number from the location of the current starting point and the DP result of this trip.
Based on an existing dynamic vehicle model, which includes the modeling of the internal combustion engine and the electric powertrain (from battery to electric engine and generator). The proposed strategy for the energy management is applied and tested. It proves to be efficient and allows one to reach a fuel consumption only 5% higher than the optimal fuel consumption calculated due to DP. This optimality depends on the window length for the prediction and the correct prediction of the speed cycle. A reduced window length or a cycle change results in a decrease of the optimality.
In order to improve the prediction, it could be useful to take into account calendar data like day of week or starting time and to compare the instantaneous car location to the previously stored starting position. In this case, the prediction can be improved. Additionally, it could be useful to integrate road signs recognition and/or Intelligent Traffic System (ITS). Finally, this optimization strategy only focuses on fuel consumption and does not consider the pollutant emissions. A more global optimization tool should take them into account in order to find the best trade-off between fuel consumption and pollutant emissions.

Author Contributions

L.J. developed the experimental device and the optimization strategy as part of his PhD work supervised by R.D.S., D.C., A.K. and L.L.M. All the authors discussed the documents results. A.K. and D.C. wrote and edited the manuscript. All authors have read and agreed to the published version of the manuscript.

Funding

This research received no external funding.

Acknowledgments

The authors want to acknowledge all the volunteers who participated to the mobility investigation and the Burgundy Council for the financial support via ID-Motion laboratory.

Conflicts of Interest

The authors declare no conflict of interest.

References

  1. Devloo, T.; Leemput, N.; Member, G.S.; Roy Geth, F.; Driesen, J.; Member, S. Component Improvements in the Electrification of Passenger Vehicles Drivetrains. In Proceedings of the 2013 IEEE Transportation Electrification Conference and Expo (ITEC), Detroit, MI, USA, 16–19 June 2013. [Google Scholar]
  2. Barkenbus, J. Our electric automotive future: CO2 savings through a disruptive technology. Policy Soc. 2009, 27, 399–410. [Google Scholar] [CrossRef]
  3. Petris, C.D.; Giglio, V.; Police, G.; Police, G. Can Hybrid Vehicles Reduce the Pollutant Emission in Urban Environments? SAE Technical Paper 1993, 930046. [Google Scholar]
  4. Demirdöven, N.; Deutch, J. Hybrid cars now, fuel cell cars later. Science 2004, 305, 974–976. [Google Scholar] [CrossRef] [Green Version]
  5. Katrašnik, T. Hybridization of powertrain and downsizing of IC engine—A way to reduce fuel consumption and pollutant emissions—Part 1. Energy Convers. Manag. 2007, 48, 1411–1423. [Google Scholar] [CrossRef]
  6. Wirasingha, S.G.; Schofield, N.; Emadi, A. Plug-in hybrid electric vehicle developments in the US: Trends, barriers, and economic feasibility. In Proceedings of the 2008 IEEE Vehicle Power Propulsion Conference, Harbin, China, 3–5 September 2008; pp. 1–8. [Google Scholar] [CrossRef]
  7. Ericsson, E. Independent driving pattern factors and their influence on fuel-use and exhaust emission factors. Transp. Res. Part D 2001, 6, 325–345. [Google Scholar] [CrossRef]
  8. Ericsson, E. Variability in urban driving patterns. Transp. Res. Part D 2000, 5, 337–354. [Google Scholar] [CrossRef]
  9. Khan, M.; Kockelma, K.M. Predicting the market potential of plug-in electric vehicles using multiday GPS data. Energy Policy 2012, 46, 225–233. [Google Scholar] [CrossRef] [Green Version]
  10. Mehar, S.; Senouci, S.M.; Remy, G. EV-planning: Electric vehicle itinerary planning. In Proceedings of the Smart Communications in Network Technologies (SaCoNeT), 2013 International Conference, Paris, France, 17–19 June 2013; pp. 1–5. [Google Scholar] [CrossRef]
  11. Gong, Q.; Li, Y.; Peng, Z.R. Trip Based Power Management of Plug-in Hybrid Electric Vehicle with Two-Scale Dynamic Programming. In Proceedings of the IEEE Vehicle Power and Propulsion Conference, Arlington, TX, USA, 9–12 September 2007; pp. 12–19. [Google Scholar]
  12. Wirasingha, S.G.; Emadi, A. Classification and Review of Control Strategies for Plug-In Hybrid Electric Vehicles. IEEE Trans. Veh. Technol. 2011, 60, 111–122. [Google Scholar] [CrossRef]
  13. Larsson, V.; Mårdh, L.J.; Egardt, B.; Karlsson, S. Commuter Route Optimized Energy Management of Hybrid Electric Vehicles. IEEE Trans. Intell. Transp. Syst. 2014, 15, 1145–1154. [Google Scholar] [CrossRef]
  14. Karden, E.; Ploumen, S.; Fricke, B.; Miller, T.; Snyder, K. Energy storage devices for future hybrid electric vehicles. J. Power Sources 2007, 168, 2–11. [Google Scholar] [CrossRef]
  15. Li, M.; Xu, H.; Li, W.; Liu, Y.; Li, F.; Hu, Y.; Liu, L. The structure and control method of hybrid power source for electric vehicle. Energy 2016, 112, 1273–1285. [Google Scholar] [CrossRef]
  16. Lee, S.; Kim, J. Implementation methodology of powertrain for series-hybrid military vehicles applications equipped with hybrid energy storage. Energy 2017, 120, 229–240. [Google Scholar] [CrossRef]
  17. Borhan, H.; Vahidi, A.; Phillips, A.M.; Kuang, M.L.; Kolmanovsky, I.V.; Cairano, S.D. MPC-Based Energy Management of a Power-Split Hybrid Electric Vehicle. IEEE Trans. Control Syst. Technol. 2012, 20, 593–603. [Google Scholar] [CrossRef]
  18. Du, J.; Chen, J.; Song, Z.; Gao, M.; Ouyang, M. Design method of a power management strategy for variable battery capacities range-extended electric vehicles to improve energy efficiency and cost-effectiveness. Energy 2017, 121, 32–42. [Google Scholar] [CrossRef]
  19. Shen, P.; Zhao, Z.; Zhan, X.; Li, J. Particle swarm optimization of driving torque demand decision based on fuel economy for plug-in hybrid electric vehicle. Energy 2017, 123, 89–107. [Google Scholar] [CrossRef]
  20. Moura, S.J.; Fathy, H.K.; Callaway, D.S.; Stein, J.L. A Stochastic Optimal Control Approach for Power Management in Plug-In Hybrid Electric Vehicles. IEEE Trans. Control Syst. Technol. 2011, 19, 545–555. [Google Scholar] [CrossRef] [Green Version]
  21. Vinot, E.; Trigui, R. Optimal energy management of HEVs with hybrid storage system. Energy Convers. Manag. 2013, 76, 437–452. [Google Scholar] [CrossRef] [Green Version]
  22. Zhang, P.; Yan, F.; Du, C. A comprehensive analysis of energy management strategies for hybrid electric vehicles based on bibliometrics. Renew. Sustain. Energy Rev. 2015, 48, 88–104. [Google Scholar] [CrossRef]
  23. Chrenko, D.; Gan, S.; Gutenkunst, C.; Kriesten, R.; Moyne, L.L. Novel Classification of Control Strategies for Hybrid Electric Vehicles. In Proceedings of the 2015 IEEE Vehicle Power Propulsion Conference, Montreal, Canada, 19–22 October 2015; pp. 1–6. [Google Scholar] [CrossRef]
  24. Wang, H.; Huang, Y.; Khajepour, A.; He, H.; Cao, D. A novel energy management for hybrid off-road vehicles without future driving cycles as a priori. Energy 2007, 133, 929–940. [Google Scholar] [CrossRef]
  25. Shen, P.; Zhiguo, Z.; Xiaowen, Z.; Jingwei, L.; Iuyi, G. Optimal energy management strategy for a plug-in hybrid electric commercial vehicle based on velocity prediction. Energy 2018, 155, 838–852. [Google Scholar] [CrossRef]
  26. Liu, T.; Wang, B.; Yang, C. Online Markov Chain-based energy management for a hybrid tracked vehicle with speedy Q-learning. Energy 2018, 160, 544–555. [Google Scholar] [CrossRef]
  27. Armoogum, J.; Bouffard-Savary, É.; Caenen, Y.; Couderc, C.; Courel, J.; Delisle, F.; Duprat, P.; Fouin, L.; François, D.; Gascon, M.-O. La Mobilité des Français, Panorama Issu de l’Enquête Nationale Transports et Déplacements 2008; Ministère de l’écologie: Paris, France, 2010. [Google Scholar]
  28. Sanguinetti, A.; Kurani, K.; Davies, J. The many reasons your mileage may vary: Toward a unifying typology of eco-driving behaviors. Transp. Res. Part D Transp. Environ. 2017, 52, 73–84. [Google Scholar] [CrossRef]
  29. Birrell, S.; Taylor, J.; McGordon, A.; Son, J.; Jennings, P. Analysis of three independent real-world driving studies : A data driven and expert analysis approach to determining parameters affecting fuel economy. Transp. Res. Part D 2014, 33, 74–86. [Google Scholar] [CrossRef]
  30. Chrenko, D.; Garcia Diez, I.; Moyne, L.L. Artificial Driving cycles for the evaluation of energetic needs for electric vehicles. In Proceedings of the iTEC, Dearborn, IL, USA, 18–20 June 2012. [Google Scholar] [CrossRef]
  31. INSEE. Population en 2008; INSEE: Paris, France, 2011. [Google Scholar]
  32. Pasaoglu, G.; Fiorello, D.; Martino, A.; Scarcella, G.; Alemanno, A.; Zubaryeva, C.; Thiel, C.; European Commission. Joint Research Centre. Institute for Energy and Transport. In Driving and Parking Patterns of European Car Drivers : A Mobility Survey; Publications Office of the European Union: Brussels, Belgium, 2012; ISBN 9789279277399. [Google Scholar]
  33. Asus, Z.; Chrenko, D.; Aglzim, E.H.; Kéromnès, A.; Moyne, L.L. Simple method of estimating consumption of internal combustion engine for hybrid application. In Proceedings of the 2012 IEEE Transportation Electrification Conference and Expo, ITEC 2012, Dearborn, MI, USA, 18–20 June 2012; IEEE: New York, NY, USA, 2012; pp. 1–6, ISBN 978-1-4673-1408-4. [Google Scholar] [CrossRef]
  34. Souffran, G.; Miegeville, L.; Guerin, P. Simulation of real-world vehicle missions using a stochastic Markov model for optimal design purposes. In Proceedings of the 2011 IEEE Vehicle Power and Propulsion Conference, Chicago, IL, USA, 6–9 September 2011; pp. 1–6, ISBN 978-1-61284-248-6. [Google Scholar] [CrossRef]
  35. Horrein, L.; Bouscayrol, A.; Cheng, Y.; Fassi, M.E. Dynamical and quasi-static multi-physical models of a diesel internal combustion engine using Energetic Macroscopic Representation. Energy Convers. Manag. 2015, 91, 280–291. [Google Scholar] [CrossRef]
  36. Agbli, K.S.; Hissel, D.; Sorrentino, M.; Chauvet, F.; Pouget, J. Reverse engineering of a railcar prototype via energetic macroscopic representation approach. Energy Convers. Manag. 2016, 112, 61–80. [Google Scholar] [CrossRef]
  37. Horrein, L.; Bouscayrol, A.; Cheng, Y.; Dumand, C.; Colin, G.; Chamaillard, Y. Influence of the heating system on the fuel consumption of a hybrid electric vehicle. Energy Convers. Manag. 2016, 129, 250–261. [Google Scholar] [CrossRef]
  38. Jin, L.; Wang, W. The control strategy and cost analysis for series Plug-in hybrid electric vehicle. In Proceedings of the 2010 2nd International Conference Advanced Computer Control, Shenyang, China, 27–29 March 2010; pp. 350–354. [Google Scholar] [CrossRef]
  39. Asus, Z.; Chrenko, D.; Aglzim, E.-H.; Kebairi, A.; Keromnes, A.; Le-Moyne, L. Model and Control Strategy Simulation of a Racing Series Hybrid Car. In Proceedings of the IEEE Vehicular Power and Propulsion Conference (VPPC), Coimbra, Portugal, 27–30 October2014; pp. 1–6. [Google Scholar] [CrossRef]
  40. Erdinc, O.; Vural, B.; Uzunoglu, M. A dynamic lithium-ion battery model considering the effects of temperature and capacity fading. In Proceedings of the 2009 International Conference on Clean Electrical Power, Capri, Italy, 9–11 June 2009; pp. 383–386, ISBN 978-1-4244-2543-3. [Google Scholar] [CrossRef]
  41. Sundstrom, O.; Guzzella, L. A generic dynamic programming Matlab function. In Proceedings of the 2009 IEEE International Conference on Control Applications(CCA) and Intelligent control (ISIC), St. Petersburg, Russia, 8–10 July 2009; pp. 1625–1630, ISBN 978-1-4244-4601-8. [Google Scholar] [CrossRef]
  42. Camacho, E.F.; Bordons, C. Model Predictive Control; Springer: Berlin/Heidelberg, Germany, 2007; ISBN 9781852336943. [Google Scholar]
  43. Serrao, L.; Onori, S.; Rizzoni, G. A Comparative Analysis of Energy Management Strategies for Hybrid Electric Vehicles. J. Dyn. Syst. Meas. Control 2011, 133, 031012. [Google Scholar] [CrossRef] [Green Version]
  44. Ripaccioli, G.; Bemporad, A.; Assadian, F.; Dextreit, C.; Cairano, S.D.; Kolmanovsky, I.V. Hybrid Modeling, Identification, and Predictive Control: An Application to Hybrid Electric Vehicle Energy Management; Springer: Berlin/Heidelberg, Germany, 2009; pp. 321–335. [Google Scholar] [CrossRef]
  45. Li, L.; Zhang, Y.; Yang, C.; Yan, B.; Marina Martinez, C. Model predictive control-based efficient energy recovery control strategy for regenerative braking system of hybrid electric bus. Energy Convers. Manag. 2016, 111, 299–314. [Google Scholar] [CrossRef]
  46. Mayer, B.; Killian, M.; Kozek, M. Management of hybrid energy supply systems in buildings using mixed-integer model predictive control. Energy Convers. Manag. 2015, 98, 470–483. [Google Scholar] [CrossRef]
  47. Bruni, G.; Cordiner, S.; Mulone, V.; Rocco, V.; Spagnolo, F. A study on the energy management in domestic micro-grids based on Model Predictive Control strategies. Energy Convers. Manag. 2015, 102, 50–58. [Google Scholar] [CrossRef]
  48. Rodrigues, E.M.G.; Godina, R.; Pouresmaeil, E.; Ferreira, J.R.; Catalão, J.P.S. Domestic appliances energy optimization with model predictive control. Energy Convers. Manag. 2017, 142, 402–413. [Google Scholar] [CrossRef]
  49. Back, M.; Simons, M.; Kirschbaum, F.; Krebs, V. Predictive Control of Drivetrains. In Proceedings of the 15th IFAC World Congress, Barcelona, Spain, 21–26 July 2002; pp. 241–246. [Google Scholar]
  50. Kermani, S.; Delprat, S.; Guerra, T.M.; Trigui, R.; Jeanneret, B. Predictive energy management for hybrid vehicle. Control Eng. Pract. 2012, 20, 408–420. [Google Scholar] [CrossRef]
  51. Debert, M.; Colin, G.; Chamaillard, Y.; Guzzella, L.; Ketfi-Cherif, A.; Bellicaud, B.; Kefti-Cherif, A.; Bellicaud, B. Predictive energy management for hybrid electric vehicles—Prediction horizon and battery capacity sensitivity. IFAC Proc. Vol. 2010, 43, 270–275. [Google Scholar] [CrossRef] [Green Version]
Figure 1. Distribution of local displacement motive on working days in France (adapted from [27]).
Energies 13 02954 g001
Figure 2. Daily distance distribution for the drivers in the present study.
Energies 13 02954 g002
Figure 3. Repetition of trips.
Energies 13 02954 g003
Figure 4. Distribution of the daily energy needs.
Energies 13 02954 g004
Figure 5. Distribution of the maximum power needs (a): without battery and (b): with a 40 kWh battery).
Energies 13 02954 g005
Figure 6. Impact of the embedded energy of the battery on the autonomy, weight and cost.
Energies 13 02954 g006
Figure 7. Noao series hybrid race car.
Energies 13 02954 g007
Figure 8. Energetic Macroscopic Representation (EMR) model of the vehicle.
Energies 13 02954 g008
Figure 9. Speed cycle used for the impact of the window length (blue solid line) and speed cycle with speed limit change (red dashed line).
Energies 13 02954 g009
Figure 10. Optimization strategy flow chart (red: prediction; blue: real-time strategy due to Model Predictive Control (MPC); green: update and DP calculation performed off-line).
Energies 13 02954 g010
Figure 11. Distribution of the optimality factor over the database.
Energies 13 02954 g011
Figure 12. Impact of prediction modifications on the optimality factor.
Energies 13 02954 g012
Table 1. Comparison between Nièvre and average French rural areas [27].
DailyRef. [13]This Study
Trips3.152.95
Distance (km)2940.8
Duration (min)4961
Average speed (km/h)3539.2
Table 2. Selection of tested driver by age and sex (male/female).
Age GroupPercentage by AgeDistribution (M/F)INSEE Data
20–3018%4/318.7%
30–4025%5/524.7%
40–5029%6/529,0%
50–6026%6/525.2%
60–702%0/12.4%
overall 21/1953% (M)/47% (F)
Table 3. Data acquisition system specifications.
FunctionComponent
PlatformArduino
Position sensorGPS MT3339—accuracy: ±3 m
Speed sensorGPS MT3339
Acceleration sensorInertial unit MPU9250
Acquisition Frequency10 Hz
Data StorageSD card 32 Go
EnergyBattery pack 27 Ah—7.4 V
Table 4. Comparison of driving habits of 4 typical drivers during working days and weekends and overall database results.
Working DaysWeekends
Number of TripsAverage Distance PredictabilityNumber of TripsAverage Distance Predictability
W 20/305315 km87%2119 km28%
M 30/40709.9 km90%1312.0 km36%
W 40/50807.5 km60%2110.6 km10%
M 50/60355.6 km80%4104 km17%
Overall database15638.9 km82%45011.4 km24%
Table 5. Vehicles characteristics.
City CarSedanSUV
Weight (kg)105013001600
Front surface (m2)1.82.22.8
Drag coefficient0.30.30.35
Engine displacement (cm3)150020002000
Fuel tank capacity (L)455560
Table 6. NOAO characteristics.
Vehicle Weight990 kg
Frontal area2 m2
Drag coefficient0.35
Wheel friction coefficient0.012
Internal combustion engine3 cylinders, displacement 1.0 L, direct injection
Generator characteristics54 kW at 4500 rpm, 120 Nm
Electric engine characteristics280 kW, 800 Nm
Battery pack3 Li-ion batteries, 520 V and 39 Ah
Table 7. Impact of Dynamic Programming (DP) strategy on fuel consumption.
Cycle Number12345
Correlation factor σ (speed)0.9830.9790.9760.9811
DP Fuel consumption (L)0.730.640.610.730.70
Cycle 5 strategy (L)0.790.670.650.770.70
Fuel consumption increase (%)7.54.46.15.2/
Table 8. Impact of the window length on the optimality factor.
Duration of Prediction Window10 s20 s30 s40 s50 s60 s120 s
Optimality factor (OF)0.920.9340.9510.9600.9710.9870.991

