“Leaky Bucket” of Kazakhstan’s Power Grid: Losses and Inefficient Distribution of Electric Power

 ,
,  ,
,  ,
,  and
and 
Abstract
1. Introduction
2. Materials and Methods
3. Results
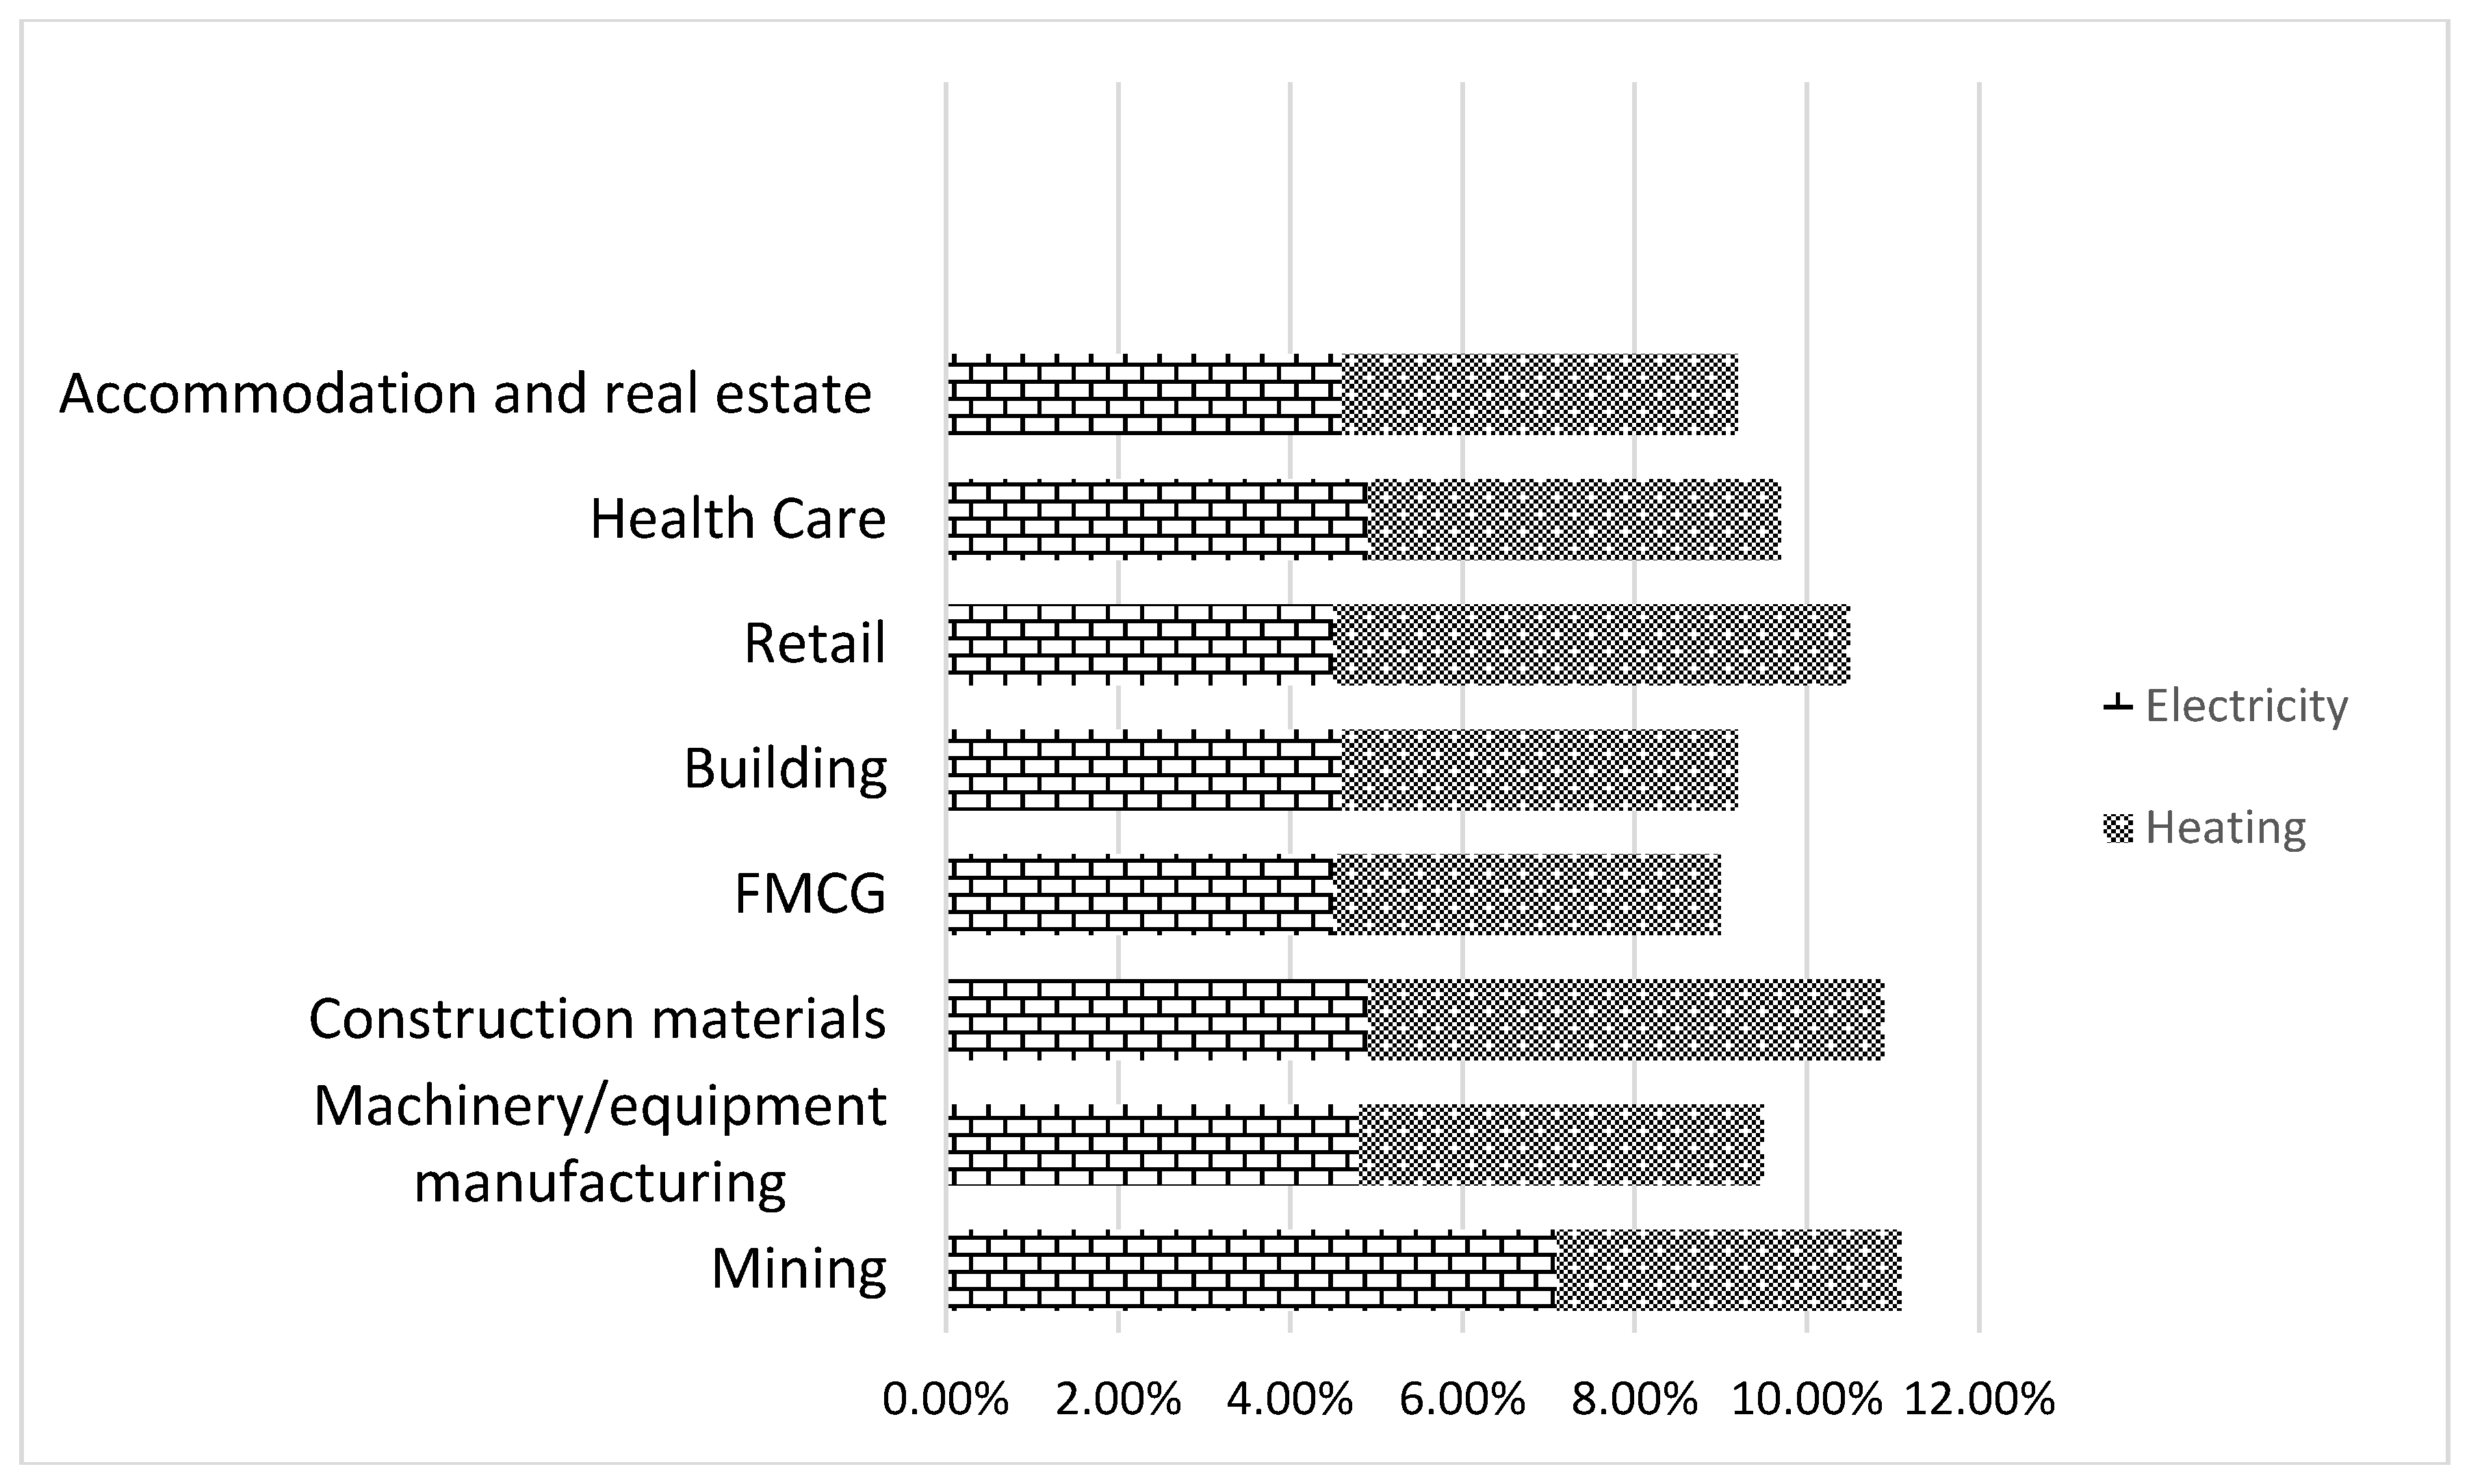
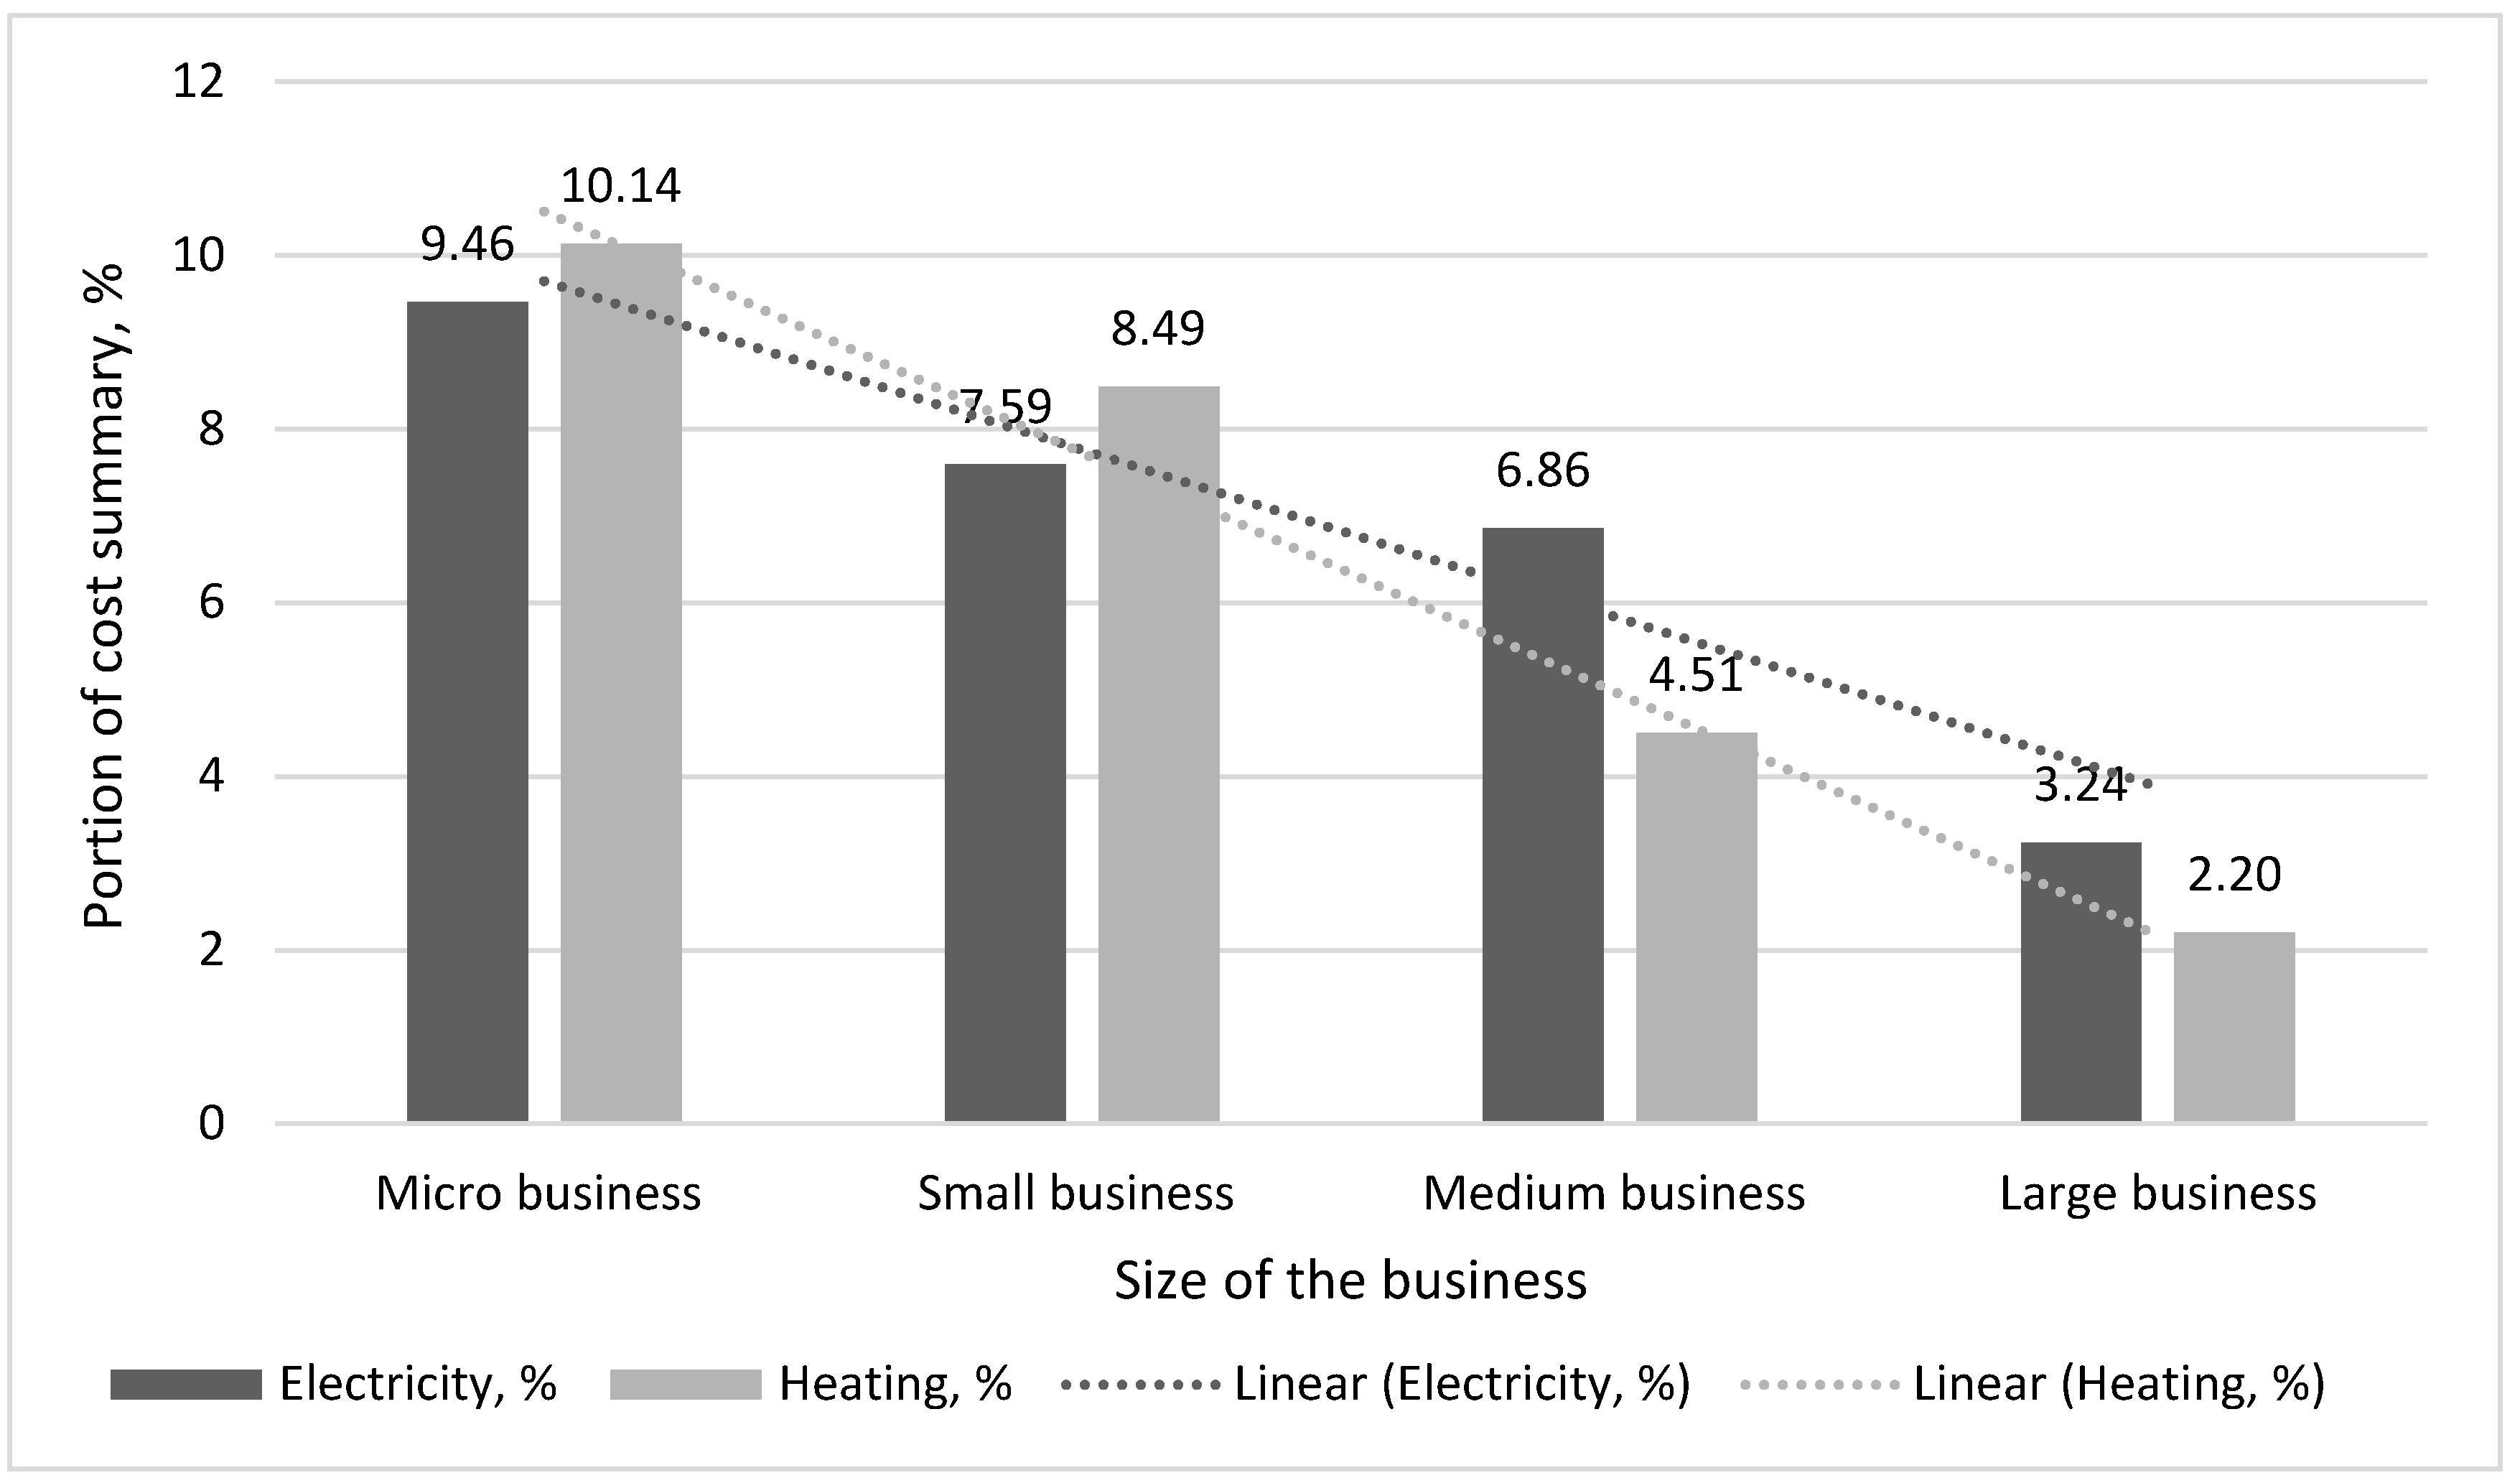
3.1. Common National Trends in Business Cost Analysis
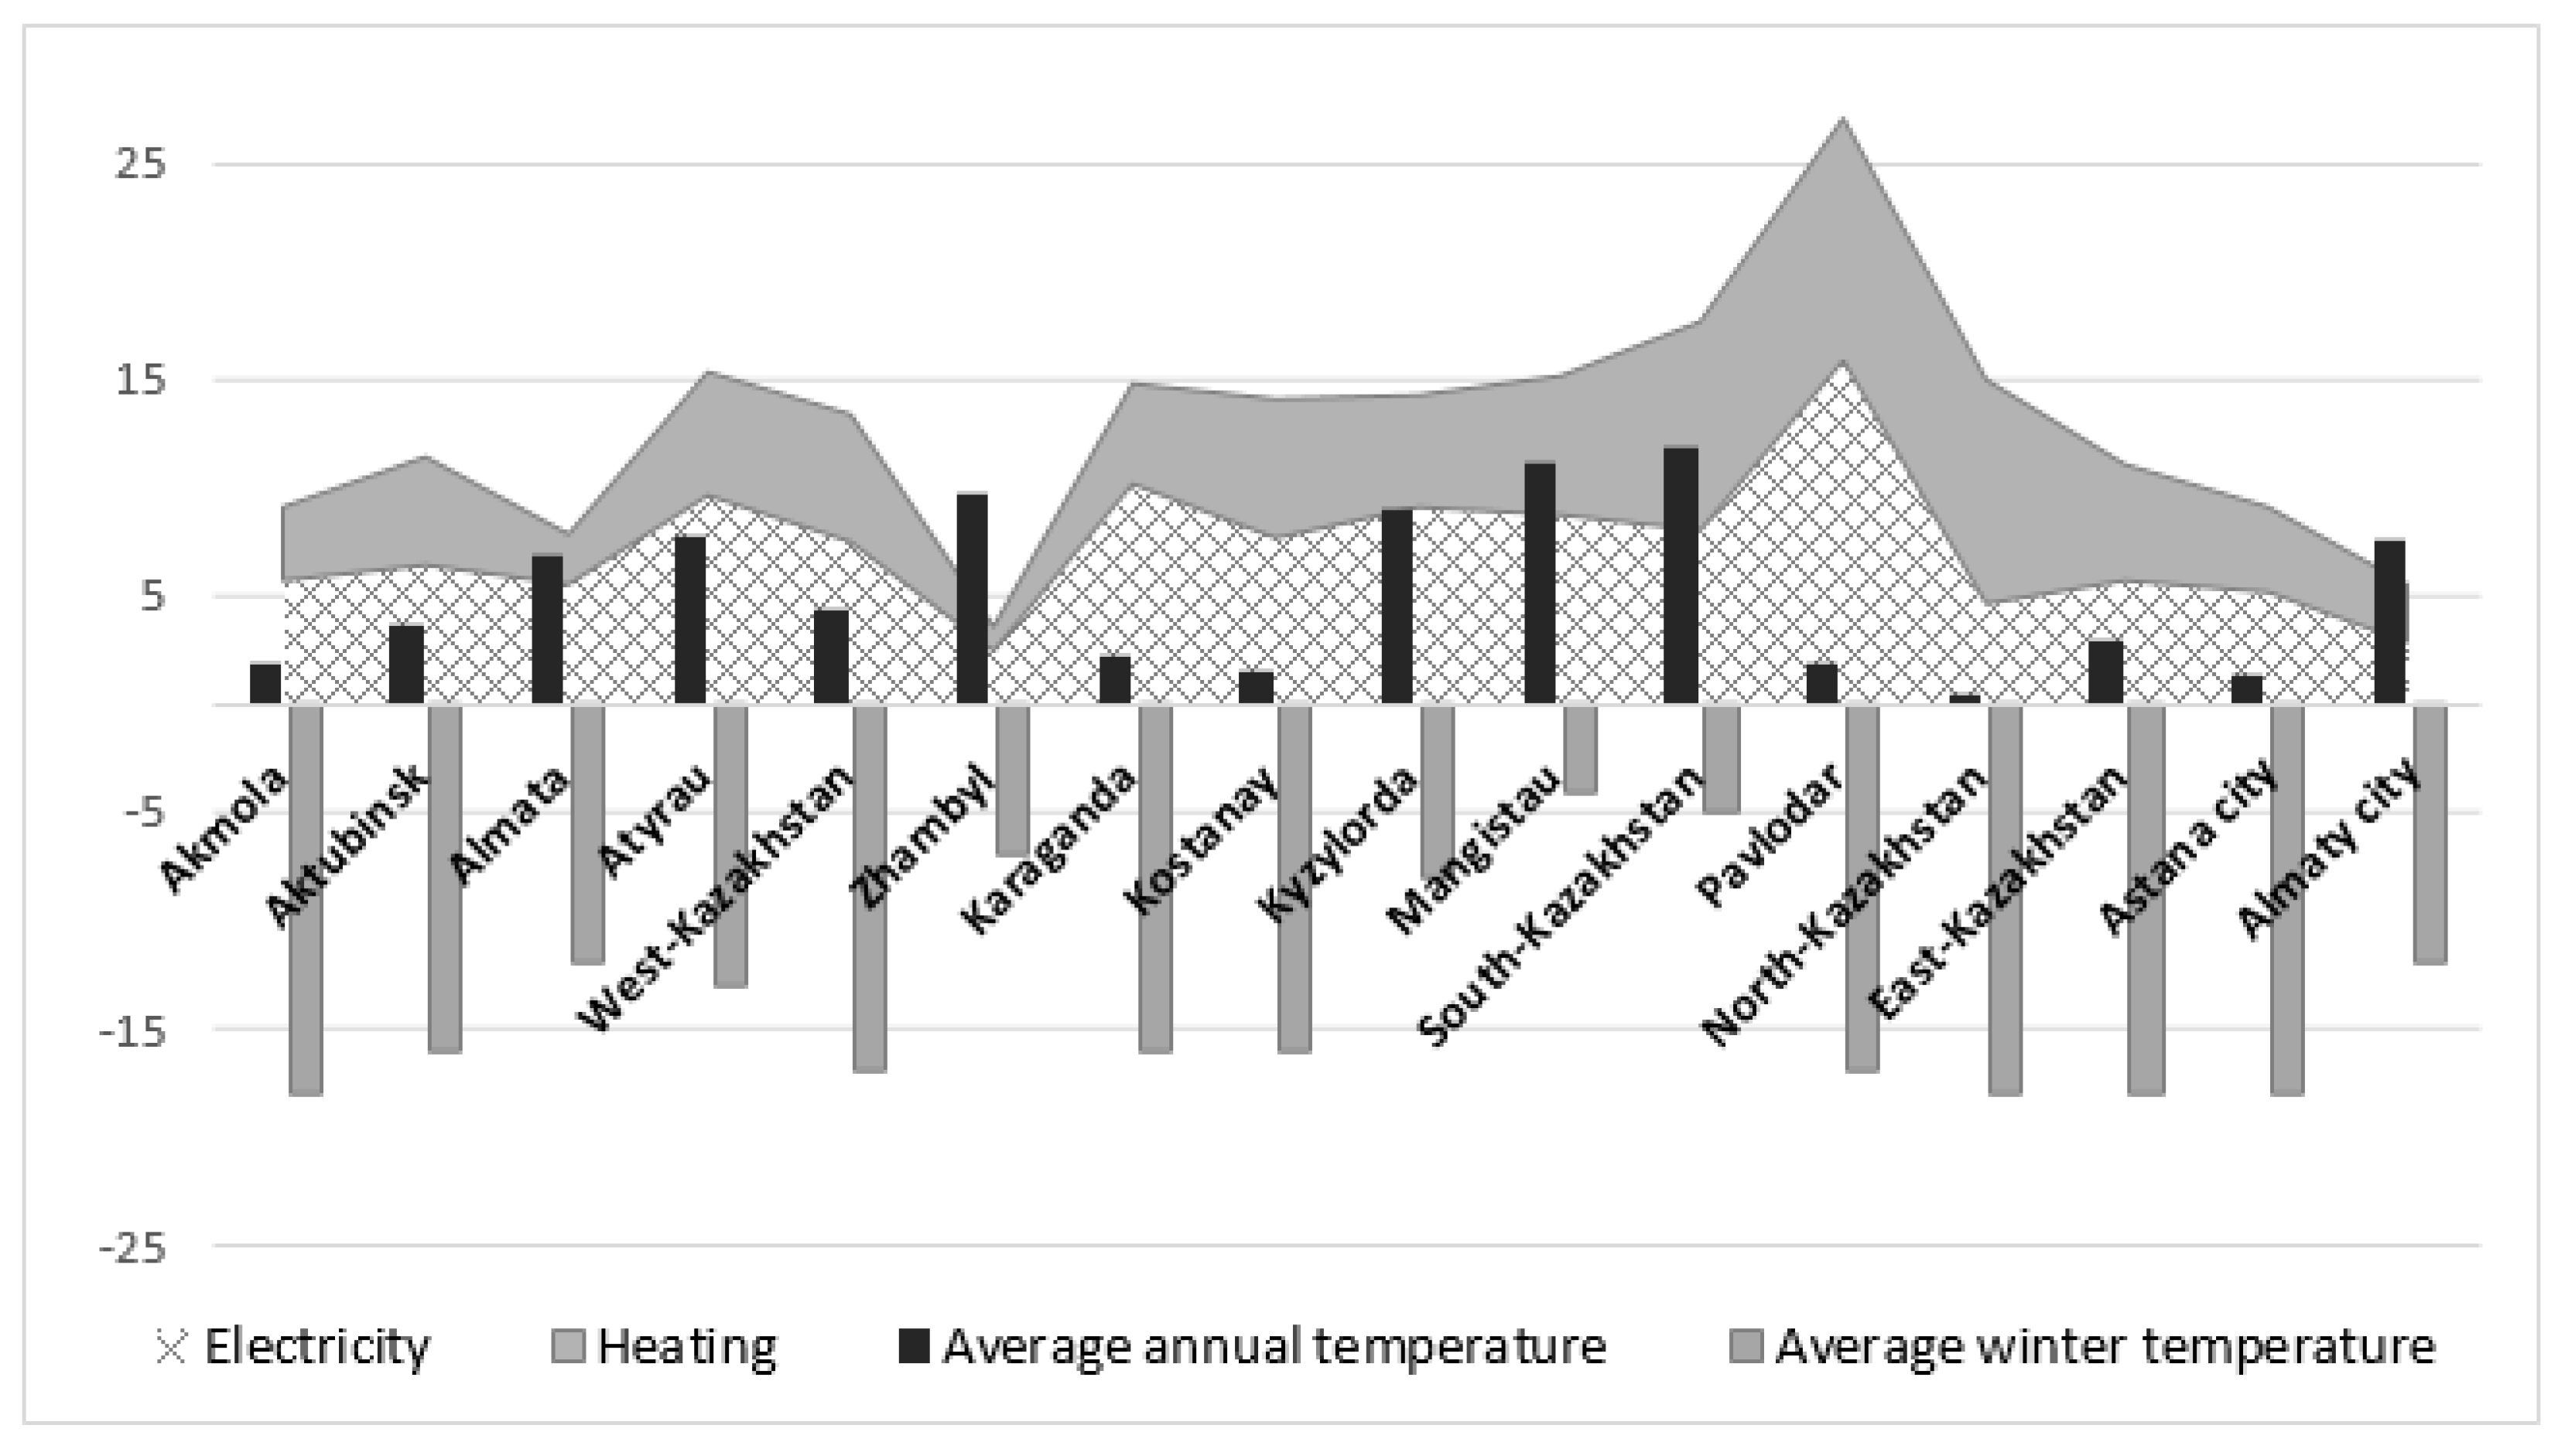
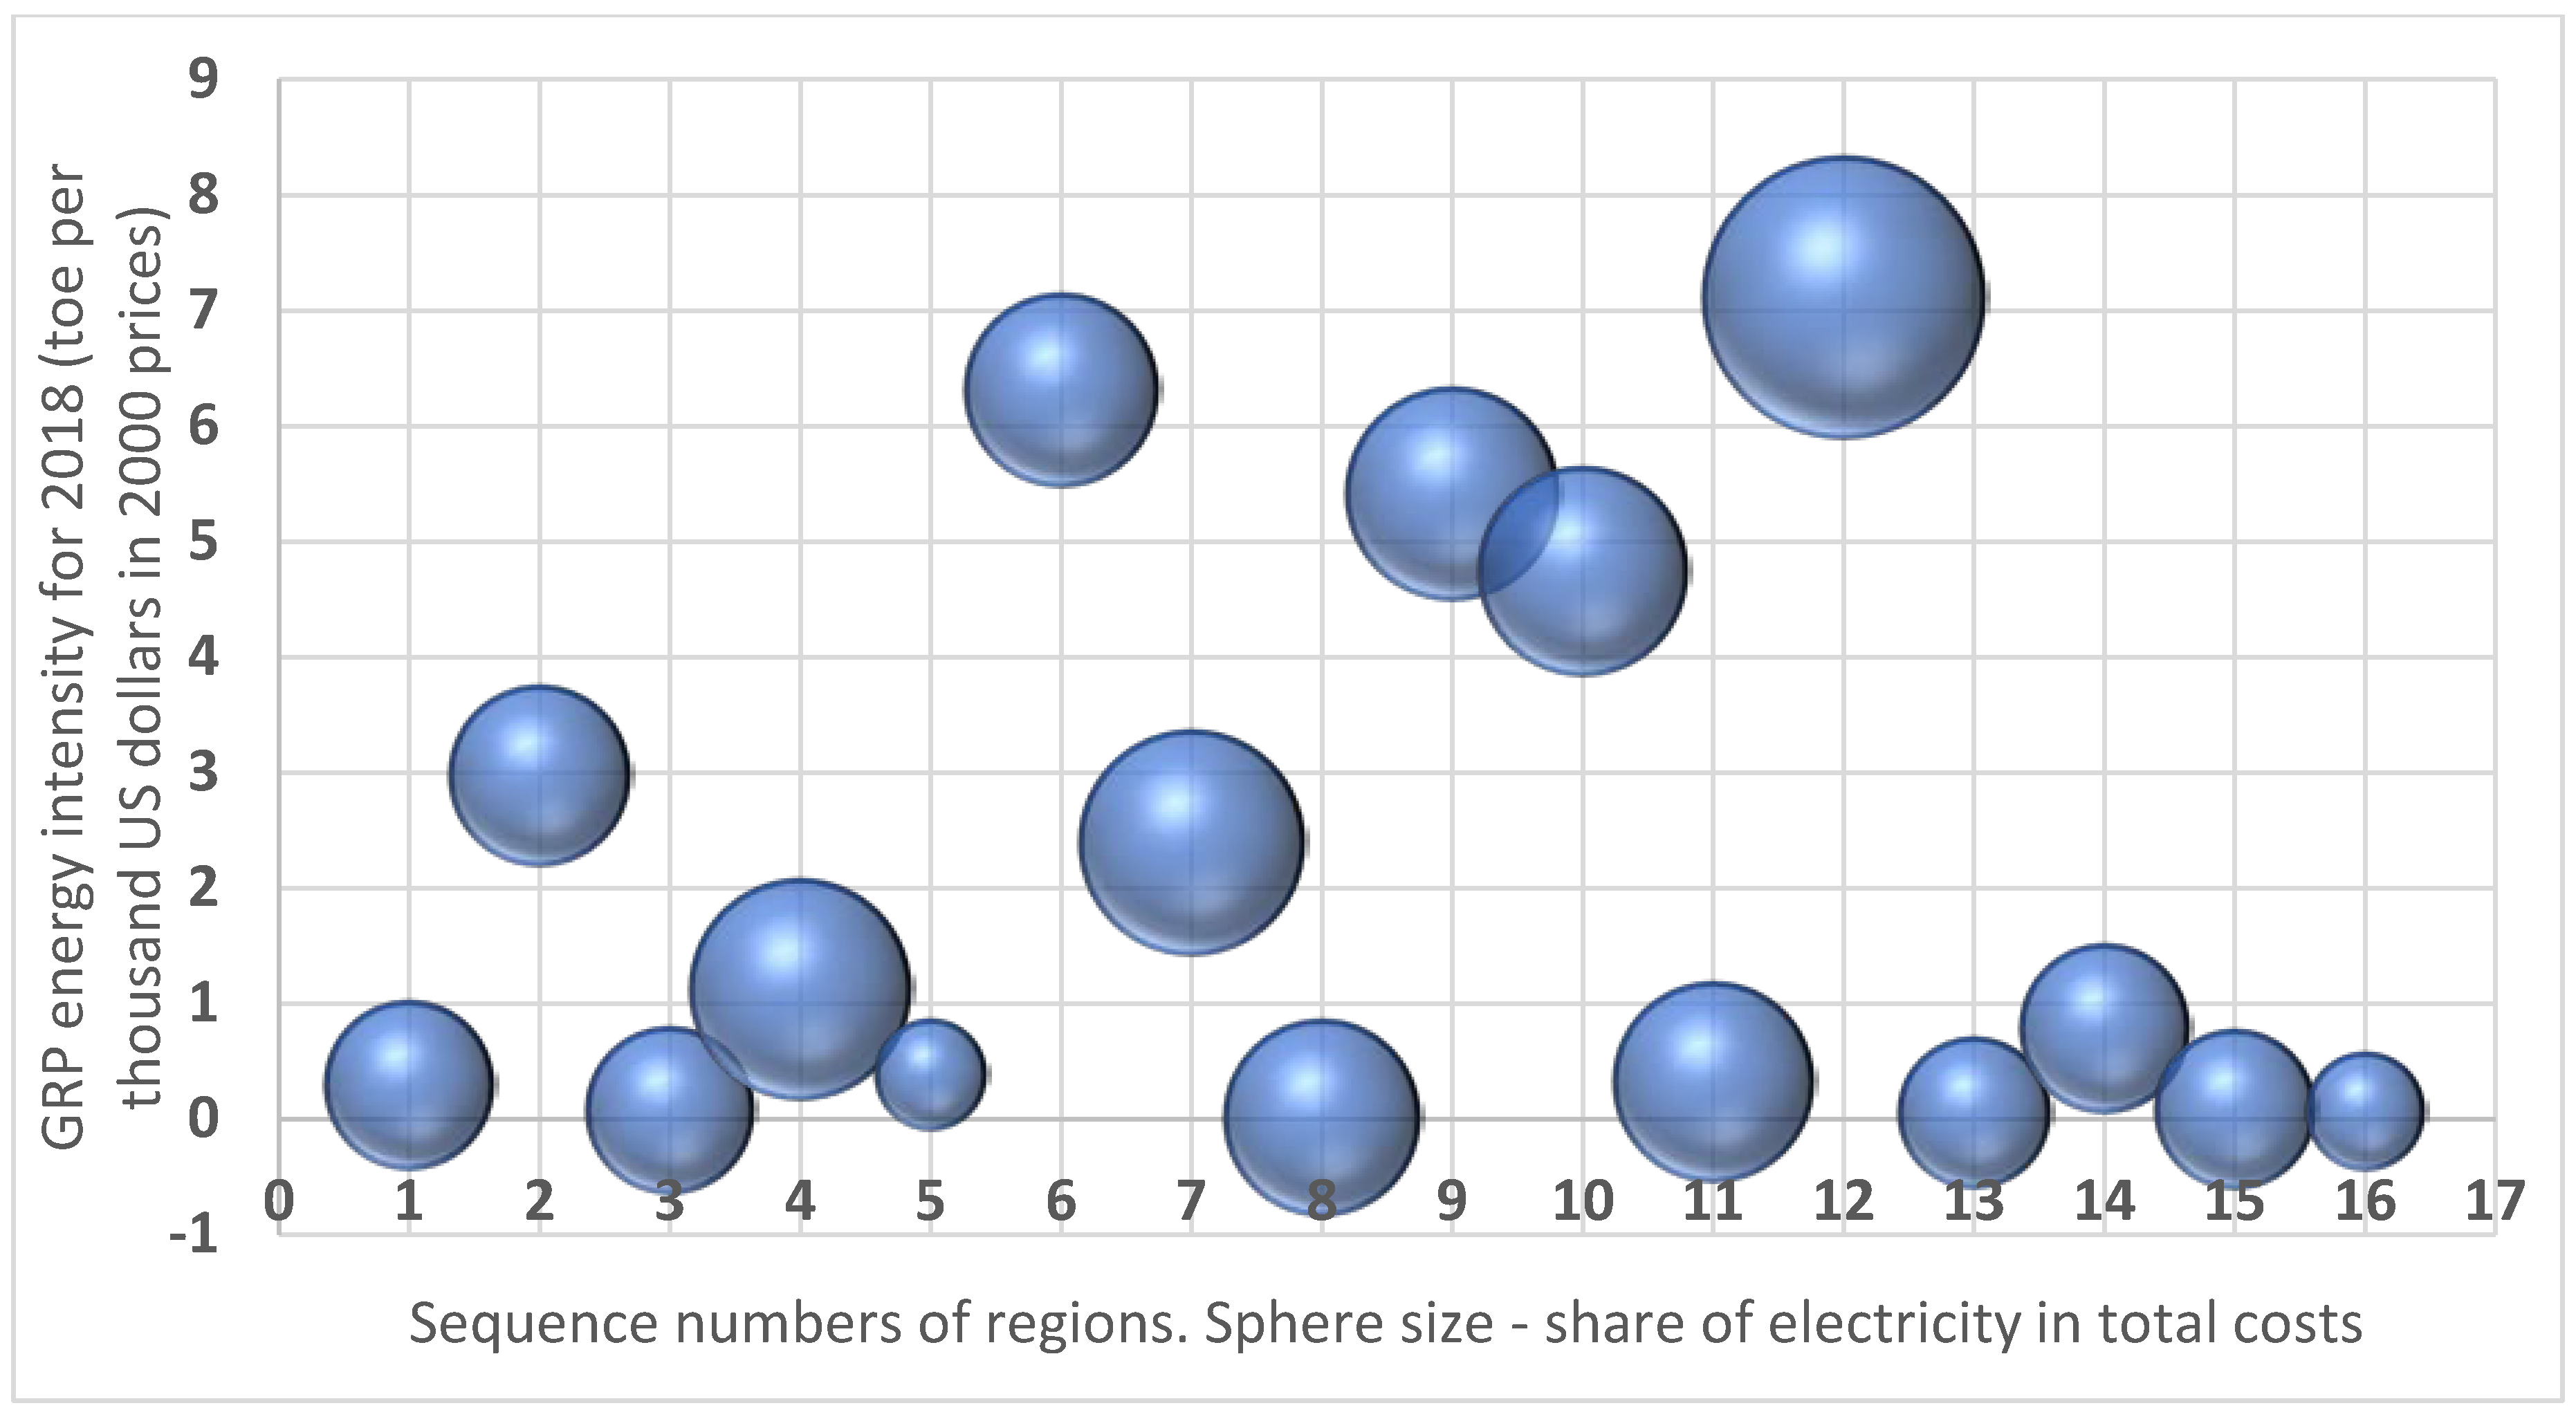
3.2. Regional Patterns of Costs for Electric Power and Heat Supply
- The desert climate in summer requires intensive air conditioning and cooling in offices and in public facilities.
- These regions have the highest administrative barriers, with widespread bribery on the part of NMHs.
3.3. The Price of Energy Barrier for Business
4. Discussion
- Improve the quality of electric power and optimize the structure of the regional economy.
- Promote energy saving and enhance the technical level of local enterprises.
- Promote the general development and strengthening regional coordination.
Author Contributions
Funding
Conflicts of Interest
References
- Zhang, Y.M.; Ana Maria, M.; Behnke, R.; Kushanova, A.; Iskhakova, A.; Liu, F. Synthesis Report: Unlocking Energy Efficiency Potentials in Cities in Kazakhstan (English); World Bank Group: Washington, DC, USA, 2018; Available online: http://documents.worldbank.org/curated/en/267161521612788850/Synthesis-report-unlocking-energy-efficiency-potentials-in-cities-in-Kazakhstan (accessed on 4 April 2020).
- Kumar, S.; Fujii, H.; Managi, S. Substitute or complement? Assessing renewable and nonrenewable energy in OECD countries. Appl. Econ. 2015, 4714, 1438–1459. [Google Scholar] [CrossRef]
- Karatayev, M.; Clarke, M.L. A review of current energy systems and green energy potential in Kazakhstan. Renew. Sustain. Energy Rev. 2016, 55, 491–504. [Google Scholar] [CrossRef]
- Kazmaganbetova, M.; Suleimenov, B.; Ayashev, K.; Kerimray, A. Sectoral structure and energy use in Kazakhstan’s regions. In Proceedings of the 4th IET Clean Energy and Technology Conference, CEAT 2016, Kuala Lumpur, Malaysia, 14–15 Novembre 2016. [Google Scholar]
- Sineviciene, L.; Sotnyk, I.; Kubatko, O. Determinants of energy efficiency and energy consumption of Eastern Europe post-communist economies. Energy Environ. 2017, 28, 870–884. [Google Scholar] [CrossRef]
- Sikora, J.; Niemiec, M.; Szeląg-Sikora, A.; Gródek-Szostak, Z.; Kuboń, M.; Komorowska, M. The Impact of a Controlled-Release Fertilizer on Greenhouse Gas Emissions and the Efficiency of the Production of Chinese Cabbage. Energies 2020, 13, 2063. [Google Scholar] [CrossRef]
- Madani, D.H.; Sarsenov, I. Kazakhstan: Adjusting to Lower Oil Prices; Challenging Times Ahead—Biannual Economic Update (Fall 2015) (English); Kazakhstan economic update; World Bank Group: Washington, DC, USA, 2015; Available online: http://documents.worldbank.org/curated/en/619601467991052702/Kazakhstan-adjusting-to-lower-oil-prices-challenging-times-ahead-biannual-economic-update-Fall-2015 (accessed on 2 April 2020).
- Campisi, D.; Gitto, S.; Morea, D. Economic feasibility of energy efficiency improvements in street lighting systems in Rome. J. Clean. Prod. 2018, 175, 190–198. [Google Scholar] [CrossRef]
- Nazarbayev, N.A. The Strategy for Development of the Republic of Kazakhstan until the Year 2030. Available online: http://www.akorda.kz/en/official_documents/strategies_and_programs (accessed on 1 May 2020).
- Okun, A. Equality and Efficiency, the Big Tradeoff; Brookings Institute: Washington, DC, USA, 1975. [Google Scholar]
- El Iysaouy, L.; El Idrissi, N.E.; Tvaronavičienė, M.; Lahbabi, M.; Oumnad, A. Towards energy efficiency: Case of Morocco. Insights Reg. Dev. 2019, 1, 259–271. [Google Scholar] [CrossRef]
- Tyo, A.; Jazykbayeva, B.; Ten, T.; Kogay, G.; Spanova, B. Development tendencies of heat and energy resources: Evidence of Kazakhstan. Entrep. Sustain. Issues 2019, 7, 1514–1524. [Google Scholar] [CrossRef]
- Dudin, M.N.; Frolova, E.E.; Protopopova, O.V.; Andrey Alievich Mamedov, A.A.; Odintsov, S.V. Study of innovative technologies in the energy industry: Nontraditional and renewable energy sources. Entrep. Sustain. Issues 2019, 6, 1704–1713. [Google Scholar] [CrossRef]
- Andriushchenko, K.; Buriachenko, A.; Rozhko, O.; Lavruk, O.; Skok, P.; Hlushchenko, Y.; Muzychka, Y.; Slavina, N.; Buchynska, O.; Kondarevych, V. Peculiarities of sustainable development of enterprises in the context of digital transformation. Entrep. Sustain. Issues 2020, 7, 2255–2270. [Google Scholar] [CrossRef]
- Sarma, U.; Karnitis, G.; Zuters, J.; Karnitis, E. District heating networks: Enhancement of the efficiency. Insights Reg. Dev. 2019, 1, 200–213. [Google Scholar] [CrossRef]
- Pechancová, V.; Hrbáčková, L.; Dvorský, J.; Chromjaková, F.; Stojanovic, A. Environmental management systems: An effective tool of corporate sustainability. Entrep. Sustain. Issues 2019, 7, 825–841. [Google Scholar] [CrossRef]
- Rogalev, A.; Komarov, I.; Kindra, V.; Zlyvk, O. Entrepreneurial assessment of sustainable development technologies for power energy sector. Enterp. Sustain. Issues 2018, 6, 429–445. [Google Scholar] [CrossRef]
- Zou, Y.; Lu, Y. Analysis on the regional characteristics of energy utilization efficiency in China based on the space Autoregressive Model. Appl. Stat. 2005, 10, 67–71. (In Chinese) [Google Scholar]
- Gao, Z.; Wang, Y. Regional Division of Energy Productivity in China and Analysis on Impact Factors. J. Quant. Tech. Econ. 2006, 46, 57. (In Chinese) [Google Scholar]
- Chehabeddine, M.; Tvaronavičienė, M. Securing regional development. Insights Reg. Dev. 2020, 2, 430–442. [Google Scholar] [CrossRef]
- Shi, D.; Wu, L.; Fu, X.; Wu, B. Regional Energy Efficiency Differences in China and Its Causes Study—Stochastic frontier production function-based variation decomposition. Manag. World 2008, 2, 35–43. (In Chinese) [Google Scholar]
- Campisi, D.; Gitto, S.; Morea, D. An evaluation of energy and economic efficiency in residential buildings sector: A multi-criteria analisys on an Italian case study. Int. J. Energy Econ. Policy 2018, 8, 185. [Google Scholar]
- Petrenko, Y.; Pizikov, S.; Mukaliev, N.; Mukazhan, A. Impact of Production and Transaction Costs on Companies’ Performance According Assessments of Experts. Entrep. Sustain. Issues 2018, 6, 398–410. [Google Scholar] [CrossRef]
- International Standard Cost Model Manual—OECD.org. Available online: http://www.oecd.org/gov/regulatory-policy/34227698.pdf (accessed on 15 January 2020).
- Stam, E. Entrepreneurial ecosystems and regional policy: A sympathetic critique. Eur. Plan. Stud. 2015, 23, 1759–1769. [Google Scholar] [CrossRef]
- Stam, F.C.; Spigel, B. Entrepreneurial ecosystems. USE Discussion Paper Ser. 2016, 13, 16–19. [Google Scholar]
- Capital. In Kazakhstan have been registered almost 440000 small firms. Available online: https://kapital.kz/business/84686/v-kazakhstane-zaregistrirovano-pochti-440-tysyach-malykh-kompaniy.html (accessed on 2 March 2020).
- Song, M.; Chen, Y.; An, Q. Spatial econometric analysis of factors influencing regional energy efficiency in China. Environ. Sci. Pollut. Res. 2018, 25, 13745–13759. [Google Scholar] [CrossRef] [PubMed]
- Viholainen, J.; Luoranen, M.; Väisänen, S.; Niskanen, A.; Horttanainen, M.; Soukka, R. Regional level approach for increasing energy efficiency. Appl. Energy 2016, 163, 295–303. [Google Scholar] [CrossRef]
- Li, M.-J.; He, Y.-L.; Tao, W.-Q. Modeling a hybrid methodology for evaluating and forecasting regional energy efficiency in China. Appl. Energy 2017, 185, 1769–1777. [Google Scholar] [CrossRef]
- Aldayarov, M.; Dobozi, I.; Nikolakakis, T. Stuck in Transition: Reform Experiences and Challenges Ahead in the Kazakhstan Power Sector (English); Directions in Development—Energy and Mining; World Bank Group: Washington, DC, USA, 2017; Available online: http://documents.worldbank.org/curated/en/104181488537871278/Stuck-in-transition-reform-experiences-and-challenges-ahead-in-the-Kazakhstan-power-sector (accessed on 15 March 2020).
- Speech by President Kassym-Zhomart Tokaev at a Meeting of the State Commission on the State of Emergency. Available online: http://www.akorda.kz/ru/speeches/internal_political_affairs/in_speeches_and_addresses/vystuplenie-prezidenta-kasym-zhomarta-tokaeva-na-zasedi-po-chrezvychainomu-polozheniyu (accessed on 15 March 2020).
- World Bank. Kazakhstan—Systematic Country Diagnostic: A New Growth Model. for Building a Secure Middle Class. (English); World Bank Group: Washington, DC, USA, 2018; Available online: http://documents.worldbank.org/curated/en/664531525455037169/Kazakhstan-Systematic-country-diagnostic-a-new-growth-model-for-building-a-secure-middle-class (accessed on 20 March 2020).
- Summary Report: Kazakhstan Energy Week/XII Kazenergy Eurasian Forum «Fueling the Future: Innovation Growth». Available online: http://kazenergyforum.com/wp-content/uploads/files/KEW-2019-summary-report-en.pdf (accessed on 28 March 2020).
- Analytical Research “Promotion of the Electricity Governance Initiative in Kazakhstan”. Available online: https://www.soros.kz/wp-content/uploads/2018/02/research_about_electricity_governance_initiative.pdf (accessed on 23 March 2020).
- Pacudan, R.; De Guzman, E. Impact of energy efficiency policy to productive efficiency of electric power distribution industry in the Philippines. Energy Econ. 2002, 24, 41–54. [Google Scholar] [CrossRef]


| № | Business Size | Number of Respondents | Response Rate, % |
|---|---|---|---|
| 1 | Micro business | 203 | 7% |
| 2 | Small business | 1556 | 57% |
| 3 | Medium business | 787 | 28% |
| 4 | Large business | 235 | 8% |
| Total | 2781 | 100% |
| Share of Item in Total Costs | Micro Business | Small Business | Medium Business | Large Business |
|---|---|---|---|---|
| Electric power | 9.46 | 7.59 | 6.86 | 3.24 |
| Heating | 10.14 | 8.49 | 4.51 | 2.20 |
| № | Costs | 10–40 Thousand KZT | 41–100 Thousand KZT | 101–700 Thousand KZT |
|---|---|---|---|---|
| 1 | Connecting (disconnecting) electrical installations to the power grid for the enterprise | 66 | 20 | 14 |
| 2 | Connecting to the heating network of the thermal power plant | 48 | 30 | 22 |
| 3 | Connection of electric installations to the power grids of NMH companies, according to requirements stated in NMH specifications | 80 | 10 | 10 |
| 4 | Connecting to the heating network of the thermal power plant, according to the technical specifications set by the NMH | 37 | 52 | 11 |
| 5 | Permits from the NMH for works related to changes in the energy metering scheme | 71 | 5 | 24 |
| 6 | Additional verification of the commercial energy meter prior to connection (in case if the consumer has been disconnected for violation of the terms of the power supply contract); | 56 | 31 | 13 |
| 7 | Additional verification of the commercial energy meter prior to connection (in case if the consumer has been disconnected for violation of the terms of the heat supply contract) | 86 | - | 14 |
| 8 | Costs related to losses caused by obtaining information on the availability of free power generation capacities of the NMH | 88 | 12 | - |
| Regions | Akmola | Aktyubinsk | Almaty | Atyrau | West-Kazakhstan | Zhambyl | Karaganda | Kostanay |
| Electricity | 5.7 | 6.5 | 5.6 | 9.7 | 7.5 | 2.5 | 10.1 | 7.7 |
| Heating | 3.4 | 5.0 | 2.3 | 5.7 | 5.9 | 1.0 | 4.8 | 6.4 |
| Average annual t° | 1.8 | 3.6 | 6.9 | 7.7 | 4.4 | 9.7 | 2.3 | 1.6 |
| Average t° of winter period | −18 | −16 | −12 | −13 | −17 | −7 | −16 | −16 |
| Regions | Kyzylorda | Mangistau | South-Kazakhstan | Pavlodar | North-Kazakhstan | East-Kazakhstan | Astana city | Almaty city |
| Electricity | 9.1 | 8.7 | 8.0 | 15.9 | 4.6 | 5.7 | 5.1 | 2.8 |
| Heating | 5.1 | 6.4 | 9.6 | 11.2 | 10.4 | 5.3 | 4.0 | 2.7 |
| Average annual t° | 9 | 11.1 | 11.9 | 1.9 | 0.5 | 3 | 1.40 | 7.6 |
| Average t° in winter | −8 | −4 | −5 | −17 | − | − | −18 | −12 |
| Regions | Number of NMH | Electric Energy | Deviation from the Mean | Squares of the Deviations | Product of the Deviations | ||
|---|---|---|---|---|---|---|---|
| x | y | dx | dy | dx2 | dy2 | dx dy | |
| Akmola | 6 | 5.7 | −1.25 | −1.50 | 1.56 | 2.25 | 1.88 |
| Aktyubinsk | 3 | 6.5 | −4.25 | −0.70 | 18.06 | 0.49 | 2.98 |
| Almaty | 17 | 5.6 | 9.75 | −1.60 | 95.06 | 2.56 | −15.60 |
| Atyrau | 5 | 9.7 | −2.25 | 2.50 | 5.06 | 6.25 | −5.63 |
| Zhambyl | 1 | 2.5 | −6.25 | −4.70 | 39.06 | 22.09 | 29.38 |
| West-Kazakhstan | 4 | 7.5 | −3.25 | 0.30 | 10.56 | 0.09 | −0.97 |
| Karaganda | 7 | 10.1 | −0.25 | 2.90 | 0.06 | 8.41 | −0.73 |
| Kostanay | 4 | 7.7 | −3.25 | 0.50 | 10.56 | 0.25 | −1.63 |
| Kyzylorda | 2 | 9.1 | −5.25 | 1.90 | 27.56 | 3.61 | −9.98 |
| Kyzylorda | 4 | 8.7 | −3.25 | 1.50 | 10.56 | 2.25 | −4.88 |
| South-Kazakhstan | 3 | 8.0 | −4.25 | 0.80 | 18.06 | 0.64 | −3.40 |
| Pavlodar | 4 | 15.9 | −3.25 | 8.70 | 10.56 | 75.69 | −28.28 |
| North-Kazakhstan | 8 | 4.6 | 0.75 | −2.60 | 0.56 | 6.76 | −1.95 |
| East-Kazakhstan | 6 | 5.7 | −1.25 | −1.50 | 1.56 | 2.25 | 1.88 |
| Astana city | 20 | 5.1 | 12.75 | −2.10 | 162.56 | 4.41 | −26.78 |
| Almaty city | 22 | 2.8 | 14.75 | −4.40 | 217.56 | 19.36 | −64.90 |
| Amount | 116 | 115.2 | 629.0 | 157.4 | −128.6 | ||
| Mean | 7.25 | 7.20 | |||||
| Correlation coefficient | 0.5 | ||||||
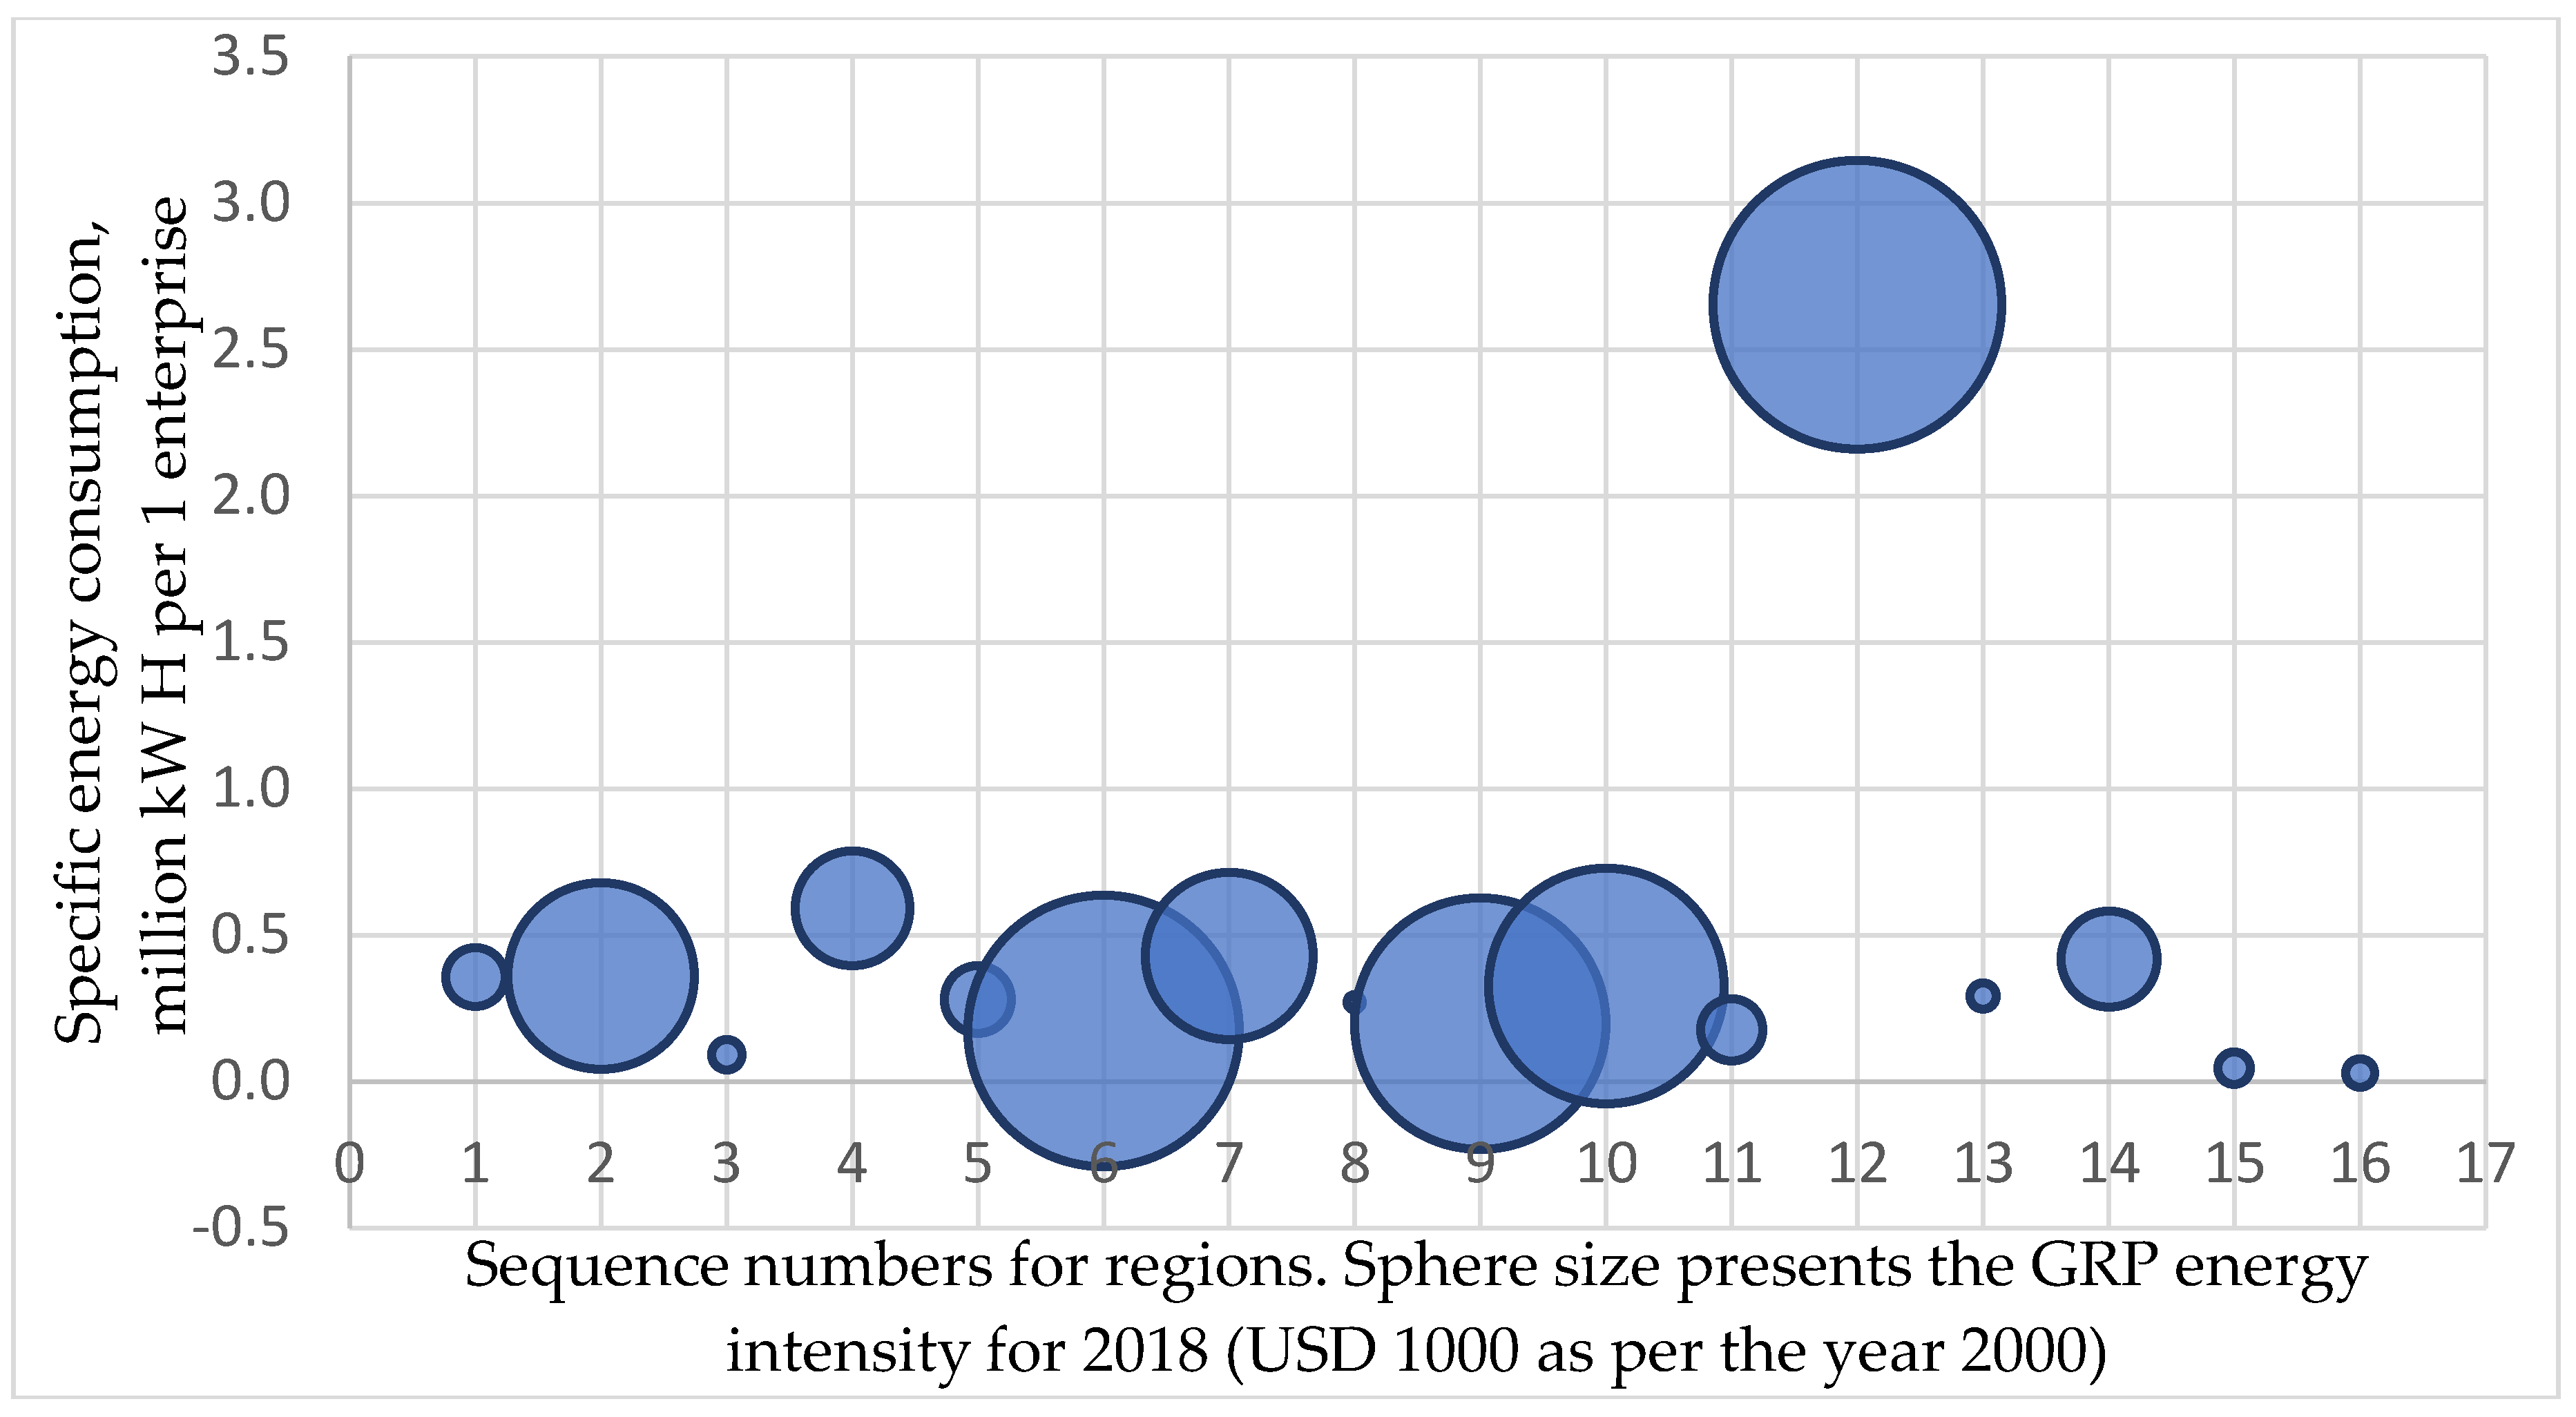
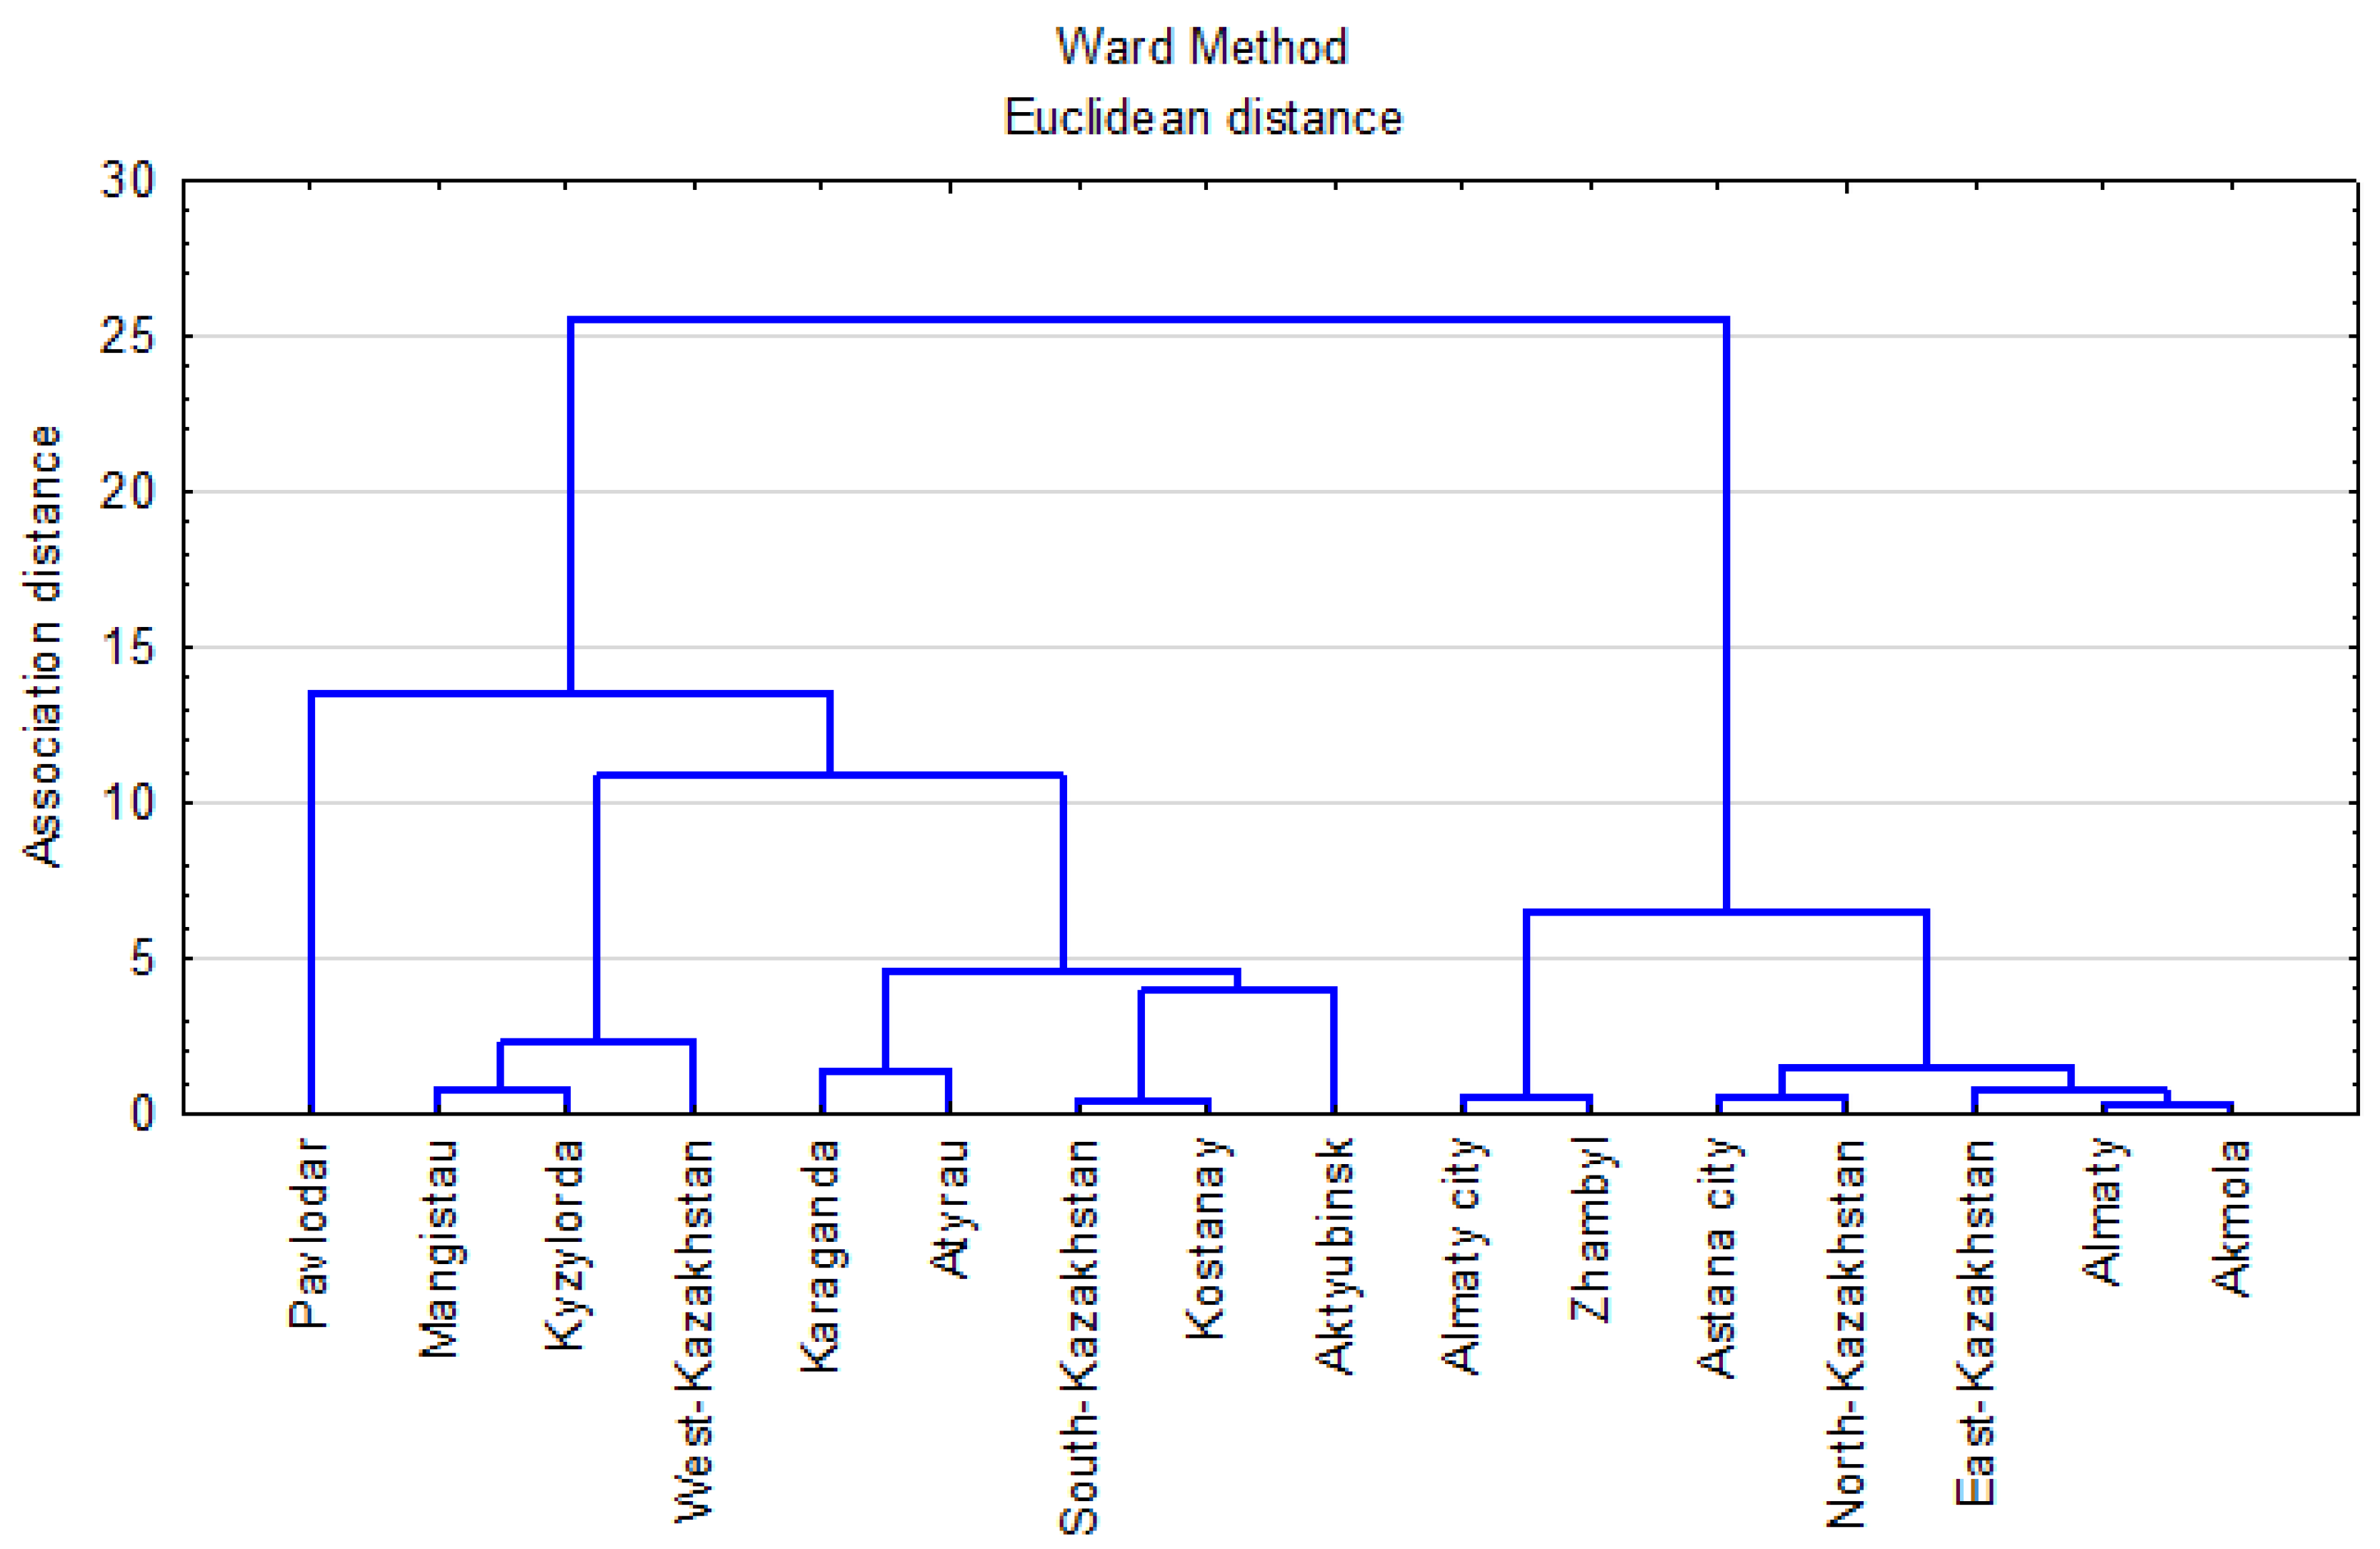
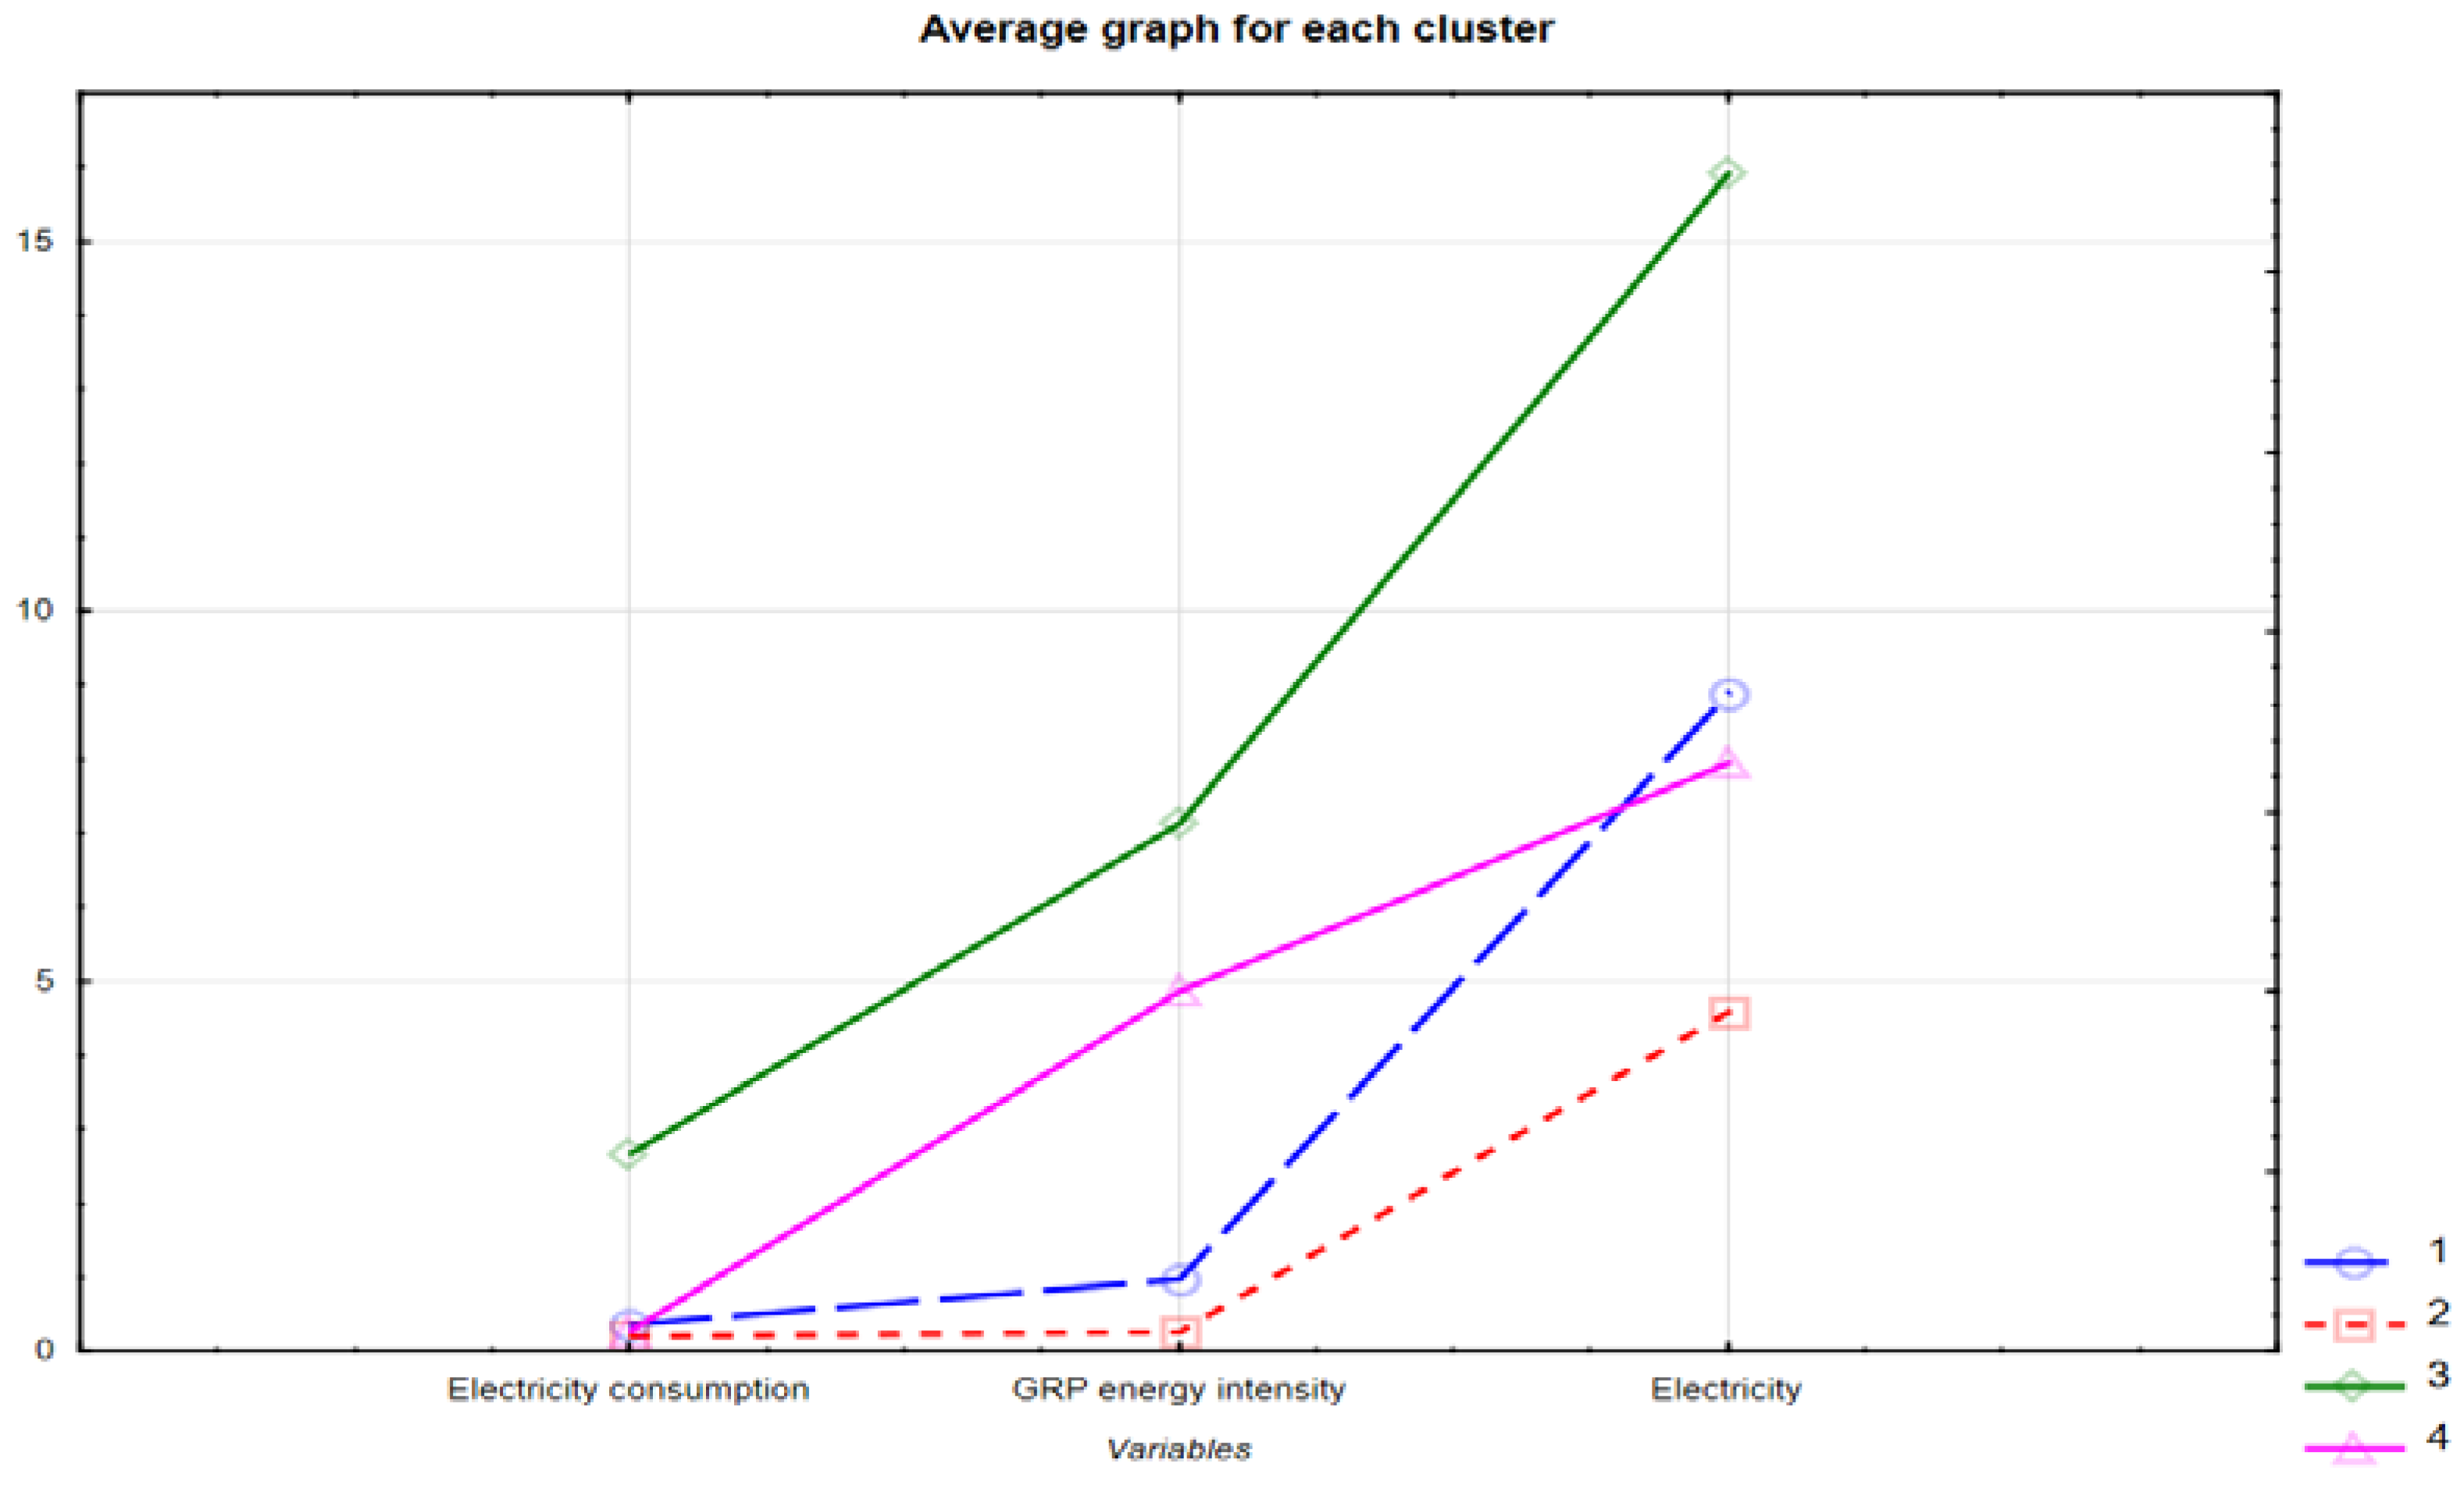
| Indicator | Cluster 1 | Cluster 2 | Cluster 3 | Cluster 4 |
|---|---|---|---|---|
| Electric energy consumption | 0.366858 | 0.216713 | 2.65252 | 0.264953 |
| GRP energy intensity | 0.970000 | 0.254286 | 7.12000 | 4.867500 |
| Electric power costs | 8.875000 | 4.571429 | 15.90000 | 7.950000 |
| № | Transaction Costs | Response Rate, % |
|---|---|---|
| 1 | Fines | 32% |
| 2 | Permits from the state monopolists and quasi-state sector, as well as regular controls | 25% |
| 3 | Access to BVI loans | 24% |
| 4 | Legal costs | 23% |
| 5 | Bribes for public officers | 16% |
| 6 | Bribes for second-tier bank representatives | 13% |
| 7 | Bribes for the representatives of the natural monopolists (NMH) | 9% |
| № | Transaction Costs for Heat and Electric Power | Share in Cost Structure, % | Recommendations | Volume of Costs Reduced, mln KZT |
|---|---|---|---|---|
| 1 | Connection (disconnection) of electrical installations to the power grid | 5.55 | Cut back by 50% | 40,921.7 |
| 2 | Connection to the heating networks of the energy supplier (power producer); | 8.0 | Cut back by 50% | 25,450.5 |
| 3 | Permits from the NMH for changing the energy metering scheme; | 6.26 | Cancel | 123,903.8 |
| 4 | Additional verification of the device of commercial metering of electric power prior to connection (if the consumer has been disconnected for violation of the power supply contract); | 8.3 | Cut back by 50% | 25,450.5 |
| 9 | Additional verification of the unit of commercial heating meters prior to connection (in case if the consumer has been disconnected for violation of the terms of the heating supply contract); | 5.58 | Cut back by 50% | 30,317.4 |
| 10 | Obtaining information on the free capacities of NMH (information costs on electric power and heating supply) | 5.9 | Cancel | 8930.0 |
© 2020 by the authors. Licensee MDPI, Basel, Switzerland. This article is an open access article distributed under the terms and conditions of the Creative Commons Attribution (CC BY) license (http://creativecommons.org/licenses/by/4.0/).
Share and Cite
Velinov, E.; Petrenko, Y.; Vechkinzova, E.; Denisov, I.; Ochoa Siguencia, L.; Gródek-Szostak, Z. “Leaky Bucket” of Kazakhstan’s Power Grid: Losses and Inefficient Distribution of Electric Power. Energies 2020, 13, 2947. https://doi.org/10.3390/en13112947
Velinov E, Petrenko Y, Vechkinzova E, Denisov I, Ochoa Siguencia L, Gródek-Szostak Z. “Leaky Bucket” of Kazakhstan’s Power Grid: Losses and Inefficient Distribution of Electric Power. Energies. 2020; 13(11):2947. https://doi.org/10.3390/en13112947
Chicago/Turabian StyleVelinov, Emil, Yelena Petrenko, Elena Vechkinzova, Igor Denisov, Luis Ochoa Siguencia, and Zofia Gródek-Szostak. 2020. "“Leaky Bucket” of Kazakhstan’s Power Grid: Losses and Inefficient Distribution of Electric Power" Energies 13, no. 11: 2947. https://doi.org/10.3390/en13112947
APA StyleVelinov, E., Petrenko, Y., Vechkinzova, E., Denisov, I., Ochoa Siguencia, L., & Gródek-Szostak, Z. (2020). “Leaky Bucket” of Kazakhstan’s Power Grid: Losses and Inefficient Distribution of Electric Power. Energies, 13(11), 2947. https://doi.org/10.3390/en13112947