Abstract
To improve the security of smart grids (SGs) by finding the system vulnerability, this paper investigates the sparse attack vectors’ construction method for malicious false data injection attack (FDIA). The drawbacks of the existing attack vector construction methods include avoiding discussing the feasible region and validity of the attack vector. For the above drawbacks, this paper has three main contributions: (1) To construct the appropriate attack evading bad data detection (BDD), the feasible region of the attack vector is proved by projection transformation theory. The acquisition of the feasible region can help the defender to formulate the defense strategy; (2) an effective attack is proposed and the constraint of effectiveness is obtained using norm theory; (3) the domain of the state variations caused by the attack vector in the feasible region is calculated, while the singular value decomposition method is adopted. Finally, an attack vector is constructed based on -norm using OMP algorithms in the feasible domain. Simulation results confirm the feasibility and effectiveness of the proposed technique.
1. Introduction
The heavy usage of non-renewable fossil fuels is the primary contributor to the greenhouse effect by releasing carbon dioxide [1]. Zaidi et al. reveal that non-renewable energy is the main contributor to pollution by analyzing renewable and non-renewable energy consumption [2]. Awan et al. highlight that industrialization increases the demand for renewable energy resources and decreases sustainability of greenhouse gas emissions [3]. With the emergence of environmental problems and the consumption of non-renewable energy, the application of renewable energy such as wind and solar energy is more and more important [4]. Shady et al. highlight in [5] that the establishment of SGs is very important to improve the efficiency and security of energy supply. SGs would help in reducing energy consumption during peak load, and in reducing emissions of pollutants. However, a large number of instruments and equipment with network communication in new energy are applied in SGs. Due to the lack of adequate protection measures, the risk of network attack on SGs is greatly increased; access to distributed and renewable energy resources brings great uncertainty to the cyber security of SGs [6]. In 2003, a computer network at Davis–Besse nuclear power plant was penetrated. In 2010, the nuclear power plant in Iran was penetrated by Stuxnet [7]. In December 2015, malicious software called “Black Energy” penetrated the national grid of Ukraine, causing serious damage to the supervisory control and data acquisition (SCADA) system [8]. In January 2016, Israel’s electricity authority suffered a serious cyber attack, in which ransom ware was distributed by mail to trick its staff into executing malicious code, causing the associated computers to be shut down for two days. Cyber security of smart grids is becoming an increasingly important issue [9,10].
Through analysis, it is not difficult to find that the main process attacked is as follows. First, adversaries implant virus software by hacking into the target host. Then, the adversaries continuously steal the data and constructs the appropriate attack based on the acquired data. After that, the constructed attack implanted in the available data and uploads to the control station. Finally, the control station is misled by the attacked data and makes a series of wrong operations, which causes the system to crash. Moreover, because some transport protocols as the IEC TR 61850-90-2 are short of integrity protection or provided but can be omitted when requiring very low latency [11]. Potential adversaries can even modify measurements by modifying the transmitted bits.
Similarly, the SCADA system is the important data acquisition and monitoring component in the power grid [12]. It is responsible for collecting measurements from sensors and monitoring the operation of the current grids. State estimation techniques are used to detect and weed out bad data in the SCADA system [13]. While few power companies will disclose the details of their grid to the public, it is proposed in [14] that the attackers can combine satellite images and the existing transmission system map to collect information of the target power system to identify the topology of the power grids. Moreover, the attackers can determine the actual value of the network parameters through the characteristics of the transmission line. The node admittance matrix within 1% of the margin of error has been estimated [15]. In particular, once the adversaries know the configuration of the grids, the false data injection attack (FDIA) can bypass the existing detection techniques. The fundamental reason is that the existing bad data detection (BBD) techniques rely usually on the Chi-square detection mechanism, yet it is not reliable [16]. Specifically, it is proposed in [16] that even if the result of the state estimator is changed by FDIA, the BDD alarm is not triggered as long as the residual increment is within the threshold.
This paper primarily studies false data injection attacks against the SGs state estimation. The purpose of the idea is not to destroy the power grids, but to reveal the mechanism of the attack and digging the system vulnerability. In [17], Li et al. consider that the cyber attack problem is significant since one needs to understand the behavior of an attacker to give effective defensive measures. Similar views emerge in [18], they point out that studying potential attack mechanisms helps assess the vulnerability and security weaknesses of SGs. Therefore, the research of the attack is significant to the protection of the system.
The FDIA exploits the vulnerabilities of the BDD scheme, resulting in major harm to the power grids [19]. For the FDIA, there are two issues research topics: The construction of false data attack vectors [16,20,21] and attack detection and defense [22,23,24]. In particular, the construction of the FDIA attack vector can reveal the vulnerability of the state estimation, which will help the development of security defense.
False data injection attack was firstly proposed by Liu et al. in 2009 [16] where they constructed the attack vector by limiting it as the linear combination of the column vectors of the measurement matrix. Moreover, they put forward that the attack vector can be constructed as long as the attackers can tamper with a certain number of sensors. In [21,25,26], the principle was inherited. In those methods, the attack residual has no change compared with no attack. Therefore the attack can easily pass the residual detection mechanism. Then in [27], to reduce the cost of the attack, the sparseness of an attack vector was studied, whereby setting some specific element of the attack vector to be 1, the problem of designing an attack vector was transformed into -norm optimization problem. Furthermore, Teixeira et al. [28] transformed the -norm optimization problem into a general p-norm problem based on the constraint, and a general construction method of FDIA method with specific target constraints was proposed. Next, the mathematical optimizer CPLEX or Gurobi was used to solve the construction problem of attack vectors [29]. In the above methods, because of limiting attack as the linear combination of the column vectors of the measurement matrix, the sparseness of attacks is difficult to be improved, and the risks and costs associated with attacks are greatly increased. Different from the above model, the residual increment caused by the attack is ensured within the threshold and a construction method of attack vectors based on ADMM is proposed in [30]. The attack vector design relaxed.
While the above methods can find the attack vector, the sparseness and effectiveness of attack vectors are difficult to be satisfied simultaneously. Moreover, the existing methods also do not provide a feasible domain of attack vector. In conclusion, there are three problems:
- To pass BDD, what is the range of attack vector?
- What extent can an attack be called effective attacks?
- How to design the sparse attack vectors within the feasible domain to achieve the desired attack effect?
Aiming at these problems, this paper investigates the feasible region of attack vector and a novel sparse attack vector construction method is presented. The main contributions are:
- According to the state estimation technique, the feasible region of attack vector is obtained using linear algebra.
- The constraint of the effectiveness of attack is derived based on whether it can cause the operator to misbehave.
- The state estimation variations domain is proposed based on the feasible region of the attack vector.
Furthermore, the greatest contribution considered by the authors should be the discussion of the attack vector range in this paper.
2. Formulate Problem
Power system state estimation can be used for inference the operation state by the available measurements of various meters in the power grid [16]. The available measurements include bus real power and reactive power injection, and branch real power and reactive power flow. The measurement model of the AC power flow is described as
where is denoted as measurement vector; is the system state vector; is the Gaussian measurement noise caused by environmental factors and measuring instrument, and is the functional dependency between measurements and state variables.
When the weighted least squares (WLS) algorithm is used in the model, the system state can be inferred from the following optimization problem
Here, the state estimation based on the DC model can be used, the details of the DC power flow measurement model are as follows:
where is denoted measurement vector, including active powers and reactive powers, is the voltage phase angle of each node, is the Gaussian measurement noise caused by environmental factors and measuring instrument, H is the measurement matrix which depends on the topology of network and line parameters.
The system state can be inferred from the following optimization problem
where and is the variance of measurement noise associated with the i-th meter [28]. If the matrix is invertible, the solution of Equation (4) can be written as
Let vector is the measurement estimation residual. Since the noise vector satisfies Gaussian distribution, satisfies the Chi-square distribution with a degree of freedom . Then the binary hypothesis test is established as BBD, this is the Chi-square detection. When the confidence level is , the binary hypothesis test can be expressed as
- Hypothesis : , there is no bad data and is true.
- Hypothesis : , there is a bad data and is true.
However, Even if the result of the state estimator is changed by FDIA, the BDD alarm is not triggered only if the residual increment is within the threshold. The FDIA for the state estimation exploits the vulnerabilities of the Chi-square detector.
Figure 1 illustrates the FDIA frame. If the target’s topology and line parameters are obtained by the attackers, they may capture measurement z through invading advanced parts such as phase measurement units (PMUs)/remote terminal units (RTUs). Then, the adversaries use z to construct an attack a. After that, a is injected into measurement and makes z become . Next, will be transmitted to the SCADA system via the communication network. In SCADA system, the WLS state estimation algorithm is employed to estimate the system state and identify bad data. Once is not detected by BDD, it will be used for system power flow calculation and scheduling.
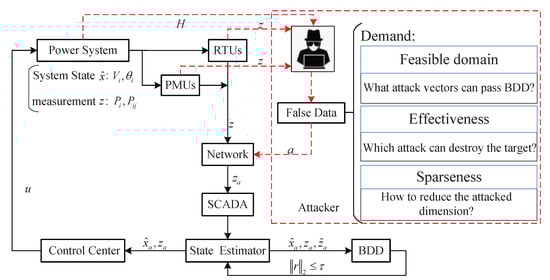
Figure 1.
A false data attack frame.
Remark 1.
The SCADA system collects the measurements from the remotes, which may cause packet data random sequence false, loss and other situations because of transmission through the network. The construction of attack vectors is the main focus in this paper, so where network communication is in an ideal situation.
The Chi-square detector is a residual detector centered on measurement and estimated residual. The successful FDIA depends on that the attack vector can pass BDD and the result of the attack is effective. The construction of the attack vector is the key for attackers. Therefore, this paper focuses on the feasible and effective domains of attack vectors and the state variation domains caused by attack vectors using linear algebra.
Remark 2.
The research on the feasible domain of attack vector can not only facilitate the attacker but also be significant to the defender. If the defenders know the feasible domain, they can reduce the feasible domain to improve the security. The discussion on effectiveness has the same effect.
3. Construction of Sparse Attack Vector
3.1. Feasible Domain of Attack Vector
Definition 1.
When the attack vector , the alarm is not triggered. The range is defined as the feasible domain of attack vector a.
The feasible domain of attack vector is not delved into in the existing research. It will be proved that the attack vector is only selected from a subset of in the existing methods, which leads to a sparseness of attack vectors. In this subsection, the research of will be a great guide to the design of the attack vector.
Definition 2
([31]). In the finite-dimensional space, a square matrix P is called a projection matrix if it is equal to its square, i.e., .
Lemma 1
([31]). Let be a finite dimensional vector space and the matrix P be a projection on . If the subspaces L and M are the range and kernel of P, respectively, P has the following properties: Every vector can be decomposed uniquely as with and , where , and .
Lemma 2.
Let , then B is a projection matrix and is a projection matrix too.
The calculation of Lemma 2 is shown below.
According to Definition 2, B is a projection matrix. Since
substituting Equation (6) into Equation (7), we have
Thus square matrix is also a projection matrix.
Theorem 1.
includes projection subspace and kernel subspace of projection transformation matrix .
Proof of Theorem 1.
Let be the measurement contained the attack vector. can be written as
Let as the attacked estimate. When there exists the attack, can be written as
where c is the perturbation of the state caused by a. When , according to the Equation (5),
Let as the attacked measurement estimate. Because of , the attacked residual can be expressed as
From Equations (9)–(11), is rewritten as
when there is no an attack, normal measurement can pass through the detector because of . Hence, if attempt to pass the Chi-square detector, a must satisfy
Let by using (5), Equation (14) can be rewritten as
Since B is an m-dimensional square matrix,
Lemma 2 states that is a projection transformation matrix in space, and , where the subspaces L and M are the range and kernel of , respectively. According to the nature of the idempotent matrix, can be expressed as
where and . Using Lemma 1, it follows that
The projection transformation projects the vector from the original space to the projection subspace L. Combining Equations (16) and (18), the feasible domain of the attack vector can be obtained as
in the subspace M,
Therefore, Equation (19) shows that is a sphere in the projection subspace L of the projection transformation. The feasible domain in the subspace M can be calculated from Equation (20) and the is any. □
Remark 3.
Not all of the injected into the measurement z can pass the BDD because of the existence of the BDD mechanism. The feasible domain in space consists of and :
- 1.
- where is a sphere in the projection subspace L of the projection transformation matrix and the centre of sphere is ,the radius is τ.
- 2.
- where is any in the kernel subspace M of the projection transformation matrix .
The proposed in this paper is a sufficient and necessary condition. Furthermore, it covers all feasible domains of perfect attack vectors and imperfect attack vectors.
Corollary 1.
The sphere is a subset of .
Remark 4.
When designing an attack vector, the attacker must ensure that the attack vector is within the feasible domain. Therefore, an attacker prefers the feasible domain to be as large as possible. However, relates to the threshold of τ. From the view of power system security, τ should be as small as possible. A small τ limits the scope of the attack.
Further, it will be proved that the attack vector is only selected from the kernel space in the methods of . Because the selection is so small, which leads to the sparseness of attack vectors is greatly limited.
Theorem 2.
The column vectors of measurement matrix H belong to the kernel space of the projection transformation matrix .
Proof of Theorem 2.
According to matrix theory, there is
and because , so
Combining Equations (21) and (22), is always true, so the column vectors of measurement matrix H belong to the kernel space of . □
Remark 5.
In the constraint , a is a linear combination of the columns of H, so a is one member of the vector space of the columns of H. According to Theorem 2, the vector space of the columns belongs to the kernel space of . Hence, the design scheme of is based on kernel space, which is only a subset of the feasible domain proposed in this paper.
3.2. Lower Bound of the Attack Vector
As seen in the previous section, the feasible domain of a is discussed. The question of attack vector range is answered. However, apart from the feasible domain, another main issue is the effectiveness when the attack constructed. In this subsection, the effectiveness of attacks will be investigated. We propose that the criterion of causing operator’s wrong action is taken as the index of effective attack and the constraint of an effective attack is suggested.
When the operators find the estimated state deviated from their expected without considering the existence of an attack, they take actions such as adjusting the generator output or changing loads. These actions based on incorrect state variables may harm the normal operation of SGs. Thus, only attacks that can harm the power grid operation will be called effective attacks.
Definition 3.
An effective attack can make the state estimated deviate from its given normal operating range for the power grid.
For example, a harmful attack is an attack which causes the voltage deviation exceeds 5% of the nominal. Next, the constraints on the attack vector will be derived for such an effective attack. Suppose that each state deviation is less than during normal operation. Therefore, by Definition 3, the potential attackers need to design attack a so that the maximum state variable more than . Equation (11) shows that the state variation caused by the attack is c. Combined with Definition 3,
where is the maximum. According to Equation (11), Equation (23) can be re-written as
Noting , Equation (24) can be re-written as
combined with Equation (25) can be derived as
where is the induced norm, also known as the spectral norm of the matrix A.
According to the definition of the spectral norm of the matrix, , where is the largest eigenvalue of matrix . So Equation (26) can be re-written as
Remark 6.
To induce the operator’s mistake, the attack vector designed must meet certain conditions. As shown in Equation (27), which condition distinguishes the effectiveness of the attack vector and indicates the system’s tolerance to noise.
3.3. The Range of State Estimate Variable
When the attackers make an attack, they need to specify an expected state variable at first. The attackers construct a to implements such a state variable. Therefore, it is very essential to understand the range of c and select in the domain. An attacker can construct the desired attack vector result from picking a suitable value within this domain. However, if an attack is in the range of Corollary 1 in Section 3.1, what is the domain of state variables in the state space? In this subsection, we study the topic. This is a map from attack domain to result domain. As an attacker, this is the knowledge to have before constructing an attack.
Lemma 3
([31]). Let D be a real m-by-n matrix and . Then the image set of unit sphere surface in under linear transformation has the following properties:
- 1.
- If , the image set in is an ellipsoid surface, in basis P which can be expressed as
- 2.
- If , the image set in is an ellipsoid, in basis P which can be expressed as
where P is the left singular matrix of D and is the singular value of matrix D.
As seen in Section 3.1, the feasible domain of a is derived. The question of attack vector range is answered. A subset of a is determined in Corollary 1, which is a solid sphere whit the centre of sphere and the radius .
Let . Combining with Corollary 1, can be re-written as
Equation (30) shows that column vector y is constrained to a unit sphere and the attack vector a expressed as
Because , combining Equations (11) and (31), state variations caused by an attack can be written as
Since , Equation (32) can be re-written as
The singular value decomposition of matrix A can be express as
Lemma 3 shows that in the image set of y is an ellipsoid, Using the columns of U as a set of basis, the ellipsoid can be written as
Equation (35) can be re-written as
where is a diagonal matrix whose elements are the singular values of matrix A.
Equation (36) shows the range of state change under attack. An attacker can select a specific in the range to construct an attack vector when they make an FDIA. However, since the representation of the state is under the natural basis E, it is necessary to convert the coordinate representation of U into the representation of the natural basis E. Since the matrix U is a unitary matrix, the basis transformation matrix can convert the coordinates under the basis U into coordinates under the basis E. The coordinates of the image set of y with E as the basis can be expressed as
Remark 7.
If attack vector satisfies Corollary 1, its effect on state is limited.
3.4. Sparse Attack Vector Construction Based on Norm
In this subsection, c is selected with the restriction of Equation (37) as derived in Section 3.3. Attackers also needs to consider that it is unrealistic to tamper with the measurements on a large scale. This will not only increase the cost but also increase the possibility of being detected. Therefore, the sparseness of the attack vector is chosen as the objective function, the design problem is transformed into an optimization problem of -norm.
Since , after the desired state variable is determined as the attackers, if they have access to all the measuring instruments, the current measurements will construct the attack vector to meet the attacks’ needs. To reduce the cost and risk of the attack, the attackers tend to the modified measurement as little as possible, i.e., the attack vector should be as sparse as possible. Therefore, the attacker’s requirements can be described as
There are other constraints when the effectiveness (see Section 3.2) and the feasibility (see Section 3.1) of the attack vector are considered. The feasible domain is concerned in Section 3.2 and Equation (27) can be taken as the effectiveness constraint of attack vector. The construction problem of sparse effective attack vectors can be expressed as Equation (38). Hence, when designing an attack vector a and take into account the feasible domain (see Section 3.1) and the effectiveness (see Section 3.2). This changes Equation (38) to Equation (39) below:
Equation (39) represents a constrained -norm optimization problem, which is a non-convex optimization. Compare with the methods in [25,26,27], the constraint in this method on attack vectors are relaxed, which can improve the sparseness of attack vectors. Compare with the literature [30], the effectiveness of the attack in this method is explicitly specified. Moreover, the variable domain of the state is proposed in this method, which gives the attacker a reference when carrying out an attack. Since the above model is the -norm optimization problem, the greedy algorithm can be used to solve it. In this paper, the OMP algorithm is used to solve the problem. The OMP algorithm is often used in the study of compressed sensing, and it described in the literature [32]. The OMP algorithm pseudo-code (Algorithm 1) is given below.
| Algorithm 1 OMP algorithm for sparse constrained a |
| Require: Expected state variation , dictionary A, sparseness k. |
| Ensure: Sparse attack vector a. |
| 1: Initial solution , initial residual , , initial . |
| 2: repeat |
| 3: (Sweep) |
| 4: (Find new minimizer) |
| 5: If , else break; |
| 6: (Update provisional solution) |
| 7: (Update provisional solution) |
| 8: (Update residual) |
| 9: |
| 10: until |
The attackers implement an attack that can be expressed as follows. First, adversaries implant virus software by hacking into the target host. Then, the adversaries continuously steal measurement z. After that, adversaries can construct the appropriate attack vector a using this method based on the stolen measurements. Then, the constructed attack is implanted in the available measurement and uploaded to the control station. Finally, the control station will be misled by the attacked data and makes a series of wrong operations, which will cause the system to crash.
4. Simulations Study
To verify its feasibility and effectiveness, the proposed new sparse attack strategy is tested on the Institute of Electrical and Electronic Engineers (IEEE) 14-bus system and a coastal distribution network. After the measurement z captured, there are four steps for designing:
- Step 1: Determine which is the feasible domain of the attack vector. (see Section 3.1).
- Step 2: The state variation domain can be calculated by (see Section 3.3).
- Step 3: Select in the state variation domain as the expected variation.
- Step 4: Construct an attack vector using the Algorithm 1.
4.1. Case 1:IEEE 14-bus System
Figure 2 is the one-line diagram of the IEEE 14-bus system. Node 1 is the reference node. Assuming the system is fully measurable. For the system, there are 54 measurements, and . are the active power of the bus, are the inflow nodes branch power and are the outflow nodes branch power. The measurement is subject to the Gaussian distribution noise . The full measurement matrix .
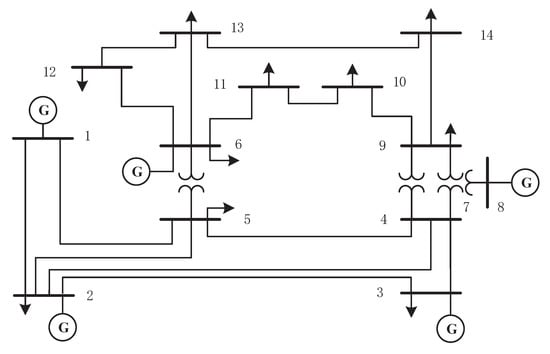
Figure 2.
Institute of Electrical and Electronic Engineers (IEEE) 14-bus system structure.
The degrees of freedom of the Chi-square detector is . According to the Chi-square distribution table, the BDD detection threshold is when the significance level is 0.05.
The domain can be calculated after the measurement z is knowing to the attacks. Figure 3 is the range of state variation (see Section 3.3) under the basis U, it needs to be transformed into the range under the basis E. Since the state variable is a high-dimensional vector, it cannot be completely presented in two-dimensional coordinates. In Figure 3, the red cycles are the center of the state variable and the triangles are intersection point with each axis coordinate.
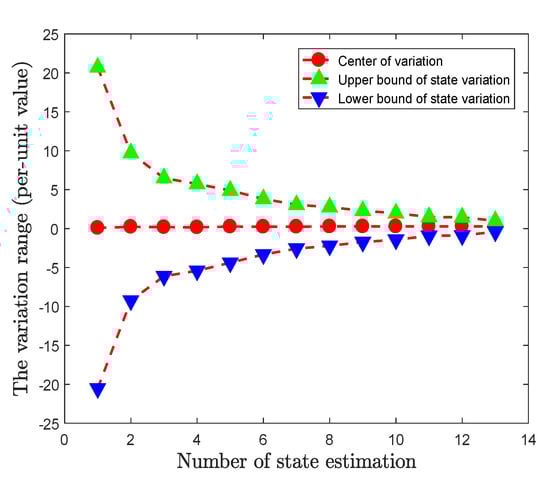
Figure 3.
The range of states variation under the basis U.
To verify the effectiveness of the proposed method, a specific state variation is chosen as
Figure 4 shows the influence of on the state estimation results, where the state estimation will deviate greatly from the real estimation results.
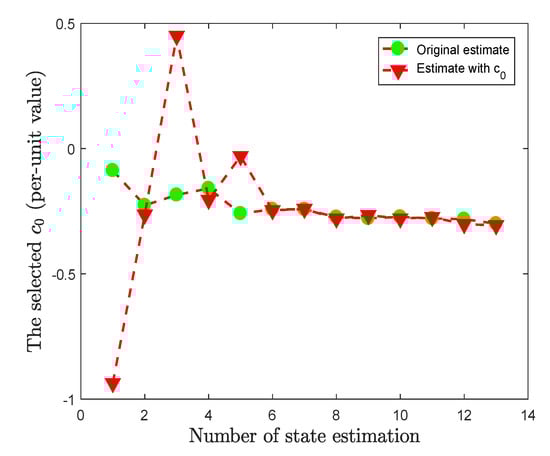
Figure 4.
The effect of the selected on the each state estimation.
Table 1 shows the attacked measurement indexes selected under different sparseness k, which k is the total number of under attack. It is observed that is an important measurement since it is always in the index list to be attacked. Therefore, as a defender, it is important to secure from being attacked. Avoided as much as possible from attackers.

Table 1.
Measurement indexes of attack selection under different sparseness.
Figure 5 is the attack vectors with two values of the sparseness k. The horizontal axis represents the measurement indexes and the vertical axis is the value of injected data.
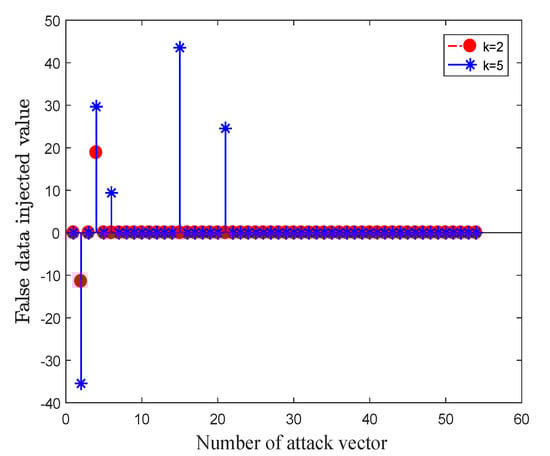
Figure 5.
The attack vectors generated by the algorithm when the sparseness and .
There are different effects variations on state estimation with different sparse attack vectors. Figure 6 shows the attack vector’s effects with different sparse a. Figure 6 shows that when , the selected a has been able to achieve the main effect on state estimation. Moreover, with the continuous increase of sparseness, the effect generated by a keeps approaching the expected . When 13, the effect basically approximates .
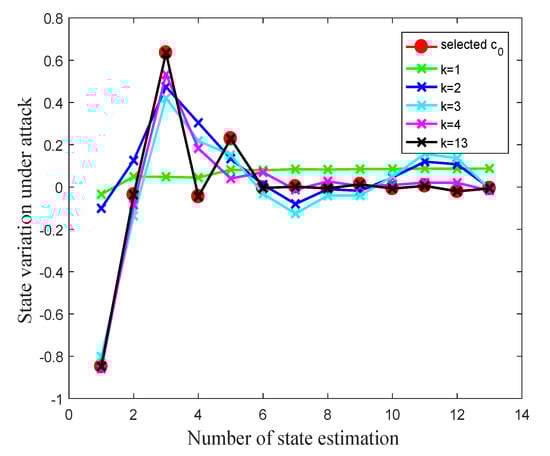
Figure 6.
The amount of variation caused by attacks under different sparseness.
Therefore, an attacker can choose different sparseness a base on their demands. If an attacker expects state variation controlled accurately, they can also choose a as sparse as possible. Or, if only the main variations required, an extreme sparse a can be chosen.
The residual detection is shown in Figure 7. Residual detection results show that the proposed algorithm can trace a sufficiently sparse attack vector a in the feasible domain and the residual caused by a is less than the threshold. Figure 8 is the results of state estimation after different sparseness a injected into measurement, shows the attacks’ effectiveness are satisfied.
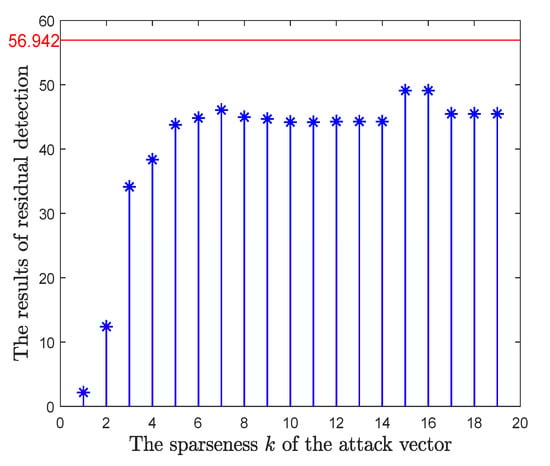
Figure 7.
The results of residual detection in different sparseness a.
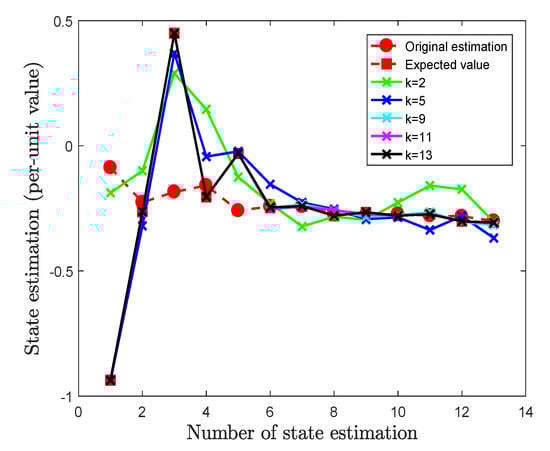
Figure 8.
The effect on state estimation under different sparseness a.
4.2. Case 2: Coastal Distribution Network
To further verify the feasibility and effectiveness, another simulation experiment is the actual coastal distribution network system. The coastal distribution network system topology is shown as the Figure 9 [33].
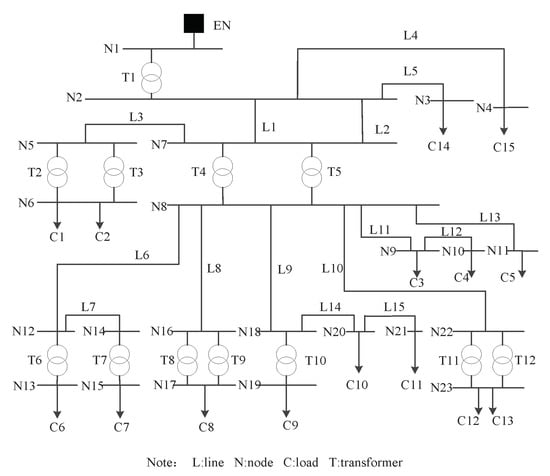
Figure 9.
Coastal distribution network system topology.
The distribution network system consists of 23 nodes, 12 transformers, and 15 transmission lines. The corresponding voltage levels are shown in Table 2, Table 3 and Table 4. The distribution network system includes 22 branches, 67 measurements and 22 states, therefore the measurement matrix . The threshold can be determined by the Chi-square distribution table.
Table 2.
Transformers voltage level.
Table 3.
Transmission lines voltage level.
Table 4.
Nodes voltage level.
When the effectiveness is considered, the expected state variation is chosen as
The state variation is outside , therefore the control center will adjust the generator output or load. After is determined, the proposed algorithm can be used to construct the attack vector a. The attack vectors selected under the sparseness are shown in Table 5:
Table 5.
Sparse attack vector.
The attack vectors injected into the corresponding measurement indexes, the results of the Chi-square test is shown in Table 6:
Table 6.
The results of Chi-square detection.
Figure 10 shows that the effect of state estimator under attacking and simulation results show that the proposed method is correct and effective. Moreover, the proposed method guarantees the attack vectors’ sparseness.
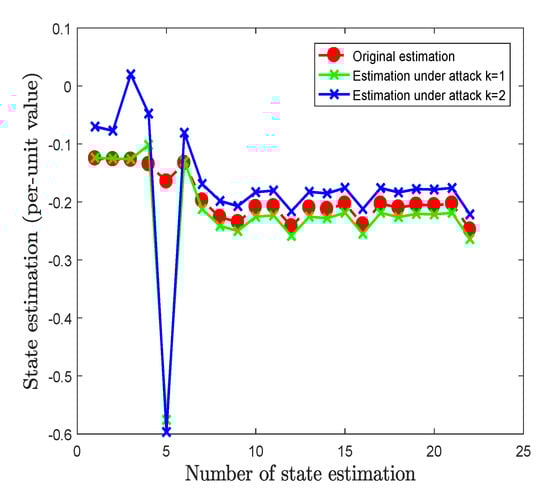
Figure 10.
State estimation result under attack.
4.3. Discussion
It can be seen from the results of Cases 1 and 2 that the generated attack vector can achieve the effect of the attacker without triggering the BDD alarm. In terms of the sparseness, this method is shown in Figure 6 that the generated attack has been able to achieve the main effect on state estimation when . This indicates that up to 96% sparseness has been able to achieve the main effect, and the attackers simply needs to tamper with the results of two sensors, and the costs and risks are greatly reduced. Moreover, with the continuous increase of nonzero elements, the effect generated by attack keeps approaching the expected. However, the method proposed in this paper requires the attackers to have access to all the meters, it is valuable to develop method to reduce this demand in the future.
5. Conclusions
To help to improve SGs security and more effective defense against attacks, the FDIA attack vector design method in SGs is studied. From the point of the attackers, to construct sparser and effective attack vectors, the feasible region of attack vectors based on the vulnerability of the Chi-square detector is derived. Then, the attack vector validity constraint is proposed when the selected attack vectors could impact on the system. Next, the domain of the state variations caused by the attack vector in the feasible region is calculated. This provides the basis for the attacker to select the appropriate target state variable. Finally, an attack vector is constructed based on -norm using OMP algorithms in the feasible region. The method proposed in this paper can improve the sparseness of attack and reduce the risks and costs. Moreover, the attack vector feasible region and state variable domain derived can also provide theoretical support for other design methods. However, the theory still needs to have access to all the instruments. It will be meaningful to reduce this requirement in future research. Furthermore, it is meritorious to propose a new false data attack detection method in the future.
Author Contributions
Conceptualization, M.X. and D.D.; Formal analysis, M.X., D.D. and T.Y.; Funding acquisition, M.F. and X.L.; Investigation, M.X. and X.L.; Methodology, M.X., D.D. and X.L.; Project administration, M.F.; Resources, D.D. and M.F.; Supervision, D.D., M.F., X.L. and T.Y.; Validation, M.X.; Writing–original draft, M.X., D.D., M.F., X.L, T.Y.; All the authors discussed the results and contributed to the final manuscript. All authors have read and agreed to the published version of the manuscript.
Funding
This research is funded by the National Natural Science Foundation of China (No. 61633016 and No. 61773253), the National Key Research and Development Program of China (No. 2019YFB1405500), the Key Project of Science and Technology Commission of Shanghai Municipality (No. 19500712300, No. 19510750300, and No. 16010500300), and the 111 Project (No. D18003).
Conflicts of Interest
The authors declare no conflict of interest.
Abbreviations
The following abbreviations are used in this manuscript:
| FDIA | false data injection attack |
| SGs | smart grids |
| BDD | bad data detection |
| OMP | orthogonal matching pursuit |
| SCADA | supervisory control and data acquisition |
| AC | alternating current |
| DC | direct current |
| ADMM | alternating direction method of multipliers |
| WLS | weighted least squares |
| PMUs | phase measurement units |
| RTUs | remote terminal units |
| IEEE | Institute of Electrical and Electronic Engineers |
References
- Vural, G. Renewable and non-renewable energy-growth nexus: A panel data application for the selected Sub-Saharan African countries. Resour. Policy 2020, 65, 101568. [Google Scholar] [CrossRef]
- Zaidi, S.A.H.; Danish; Hou, F.; Mirza, F.M. The role of renewable and non-renewable energy consumption in CO2 emissions: A disaggregate analysis of Pakistan. Environ. Sci. Pollut. Res. 2018, 25, 31616–31629. [Google Scholar] [CrossRef] [PubMed]
- Awan, U.; Kraslawski, A.; Huiskonen, J. Governing Interfirm Relationships for Social Sustainability: The Relationship between Governance Mechanisms, Sustainable Collaboration, and Cultural Intelligence. Sustainability 2018, 10, 4473. [Google Scholar] [CrossRef]
- Aziz, I.T.; Jin, H.; Abdulqadder, I.H.; Alturfi, S.M.; Alobaidi, W.H.; Flaih, F.M.F. T(2)S(2)G: A Novel Two-Tier Secure Smart Grid Architecture to Protect Network Measurements. Energies 2019, 12, 2555. [Google Scholar] [CrossRef]
- Refaat, S.S.; Mohamed, A. Smart management system for improving the reliability and availability of substations in smart grid with distributed generation. J. Eng.-JOE 2019, 4236–4240. [Google Scholar] [CrossRef]
- Habib, H.F.; Lashway, C.R.; Mohammed, O.A. A Review of Communication Failure Impacts on Adaptive Microgrid Protection Schemes and the Use of Energy Storage as a Contingency. IEEE Trans. Ind. Appl. 2018, 54, 1194–1207. [Google Scholar] [CrossRef]
- Liang, G.; Zhao, J.; Luo, F.; Weller, S.R.; Dong, Z.Y. A review of false data injection attacks against modern power systems. IEEE Trans. Smart Grid 2016, 8, 1630–1638. [Google Scholar] [CrossRef]
- Wu, Y.K.; Chang, S.M.; Hu, Y.L. Literature review of power system blackouts. Energy Procedia 2017, 141, 428–431. [Google Scholar] [CrossRef]
- Zhong, H.; Du, D.; Li, C.; Li, X. A novel sparse false data injection attack method in smart grids with incomplete power network information. Complexity 2018, 2018, 8503825. [Google Scholar] [CrossRef]
- Li, X.; Zhong, H.; Sun, Q.; Chen, K. A Novel construction method for false data injection attacks based on fast regression algorithm. Chin. J. Sci. Instrum. 2018, 39, 179–189. [Google Scholar]
- Jolfaei, A.; Kant, K. A Lightweight Integrity Protection Scheme for Low Latency Smart Grid Applications. Comput. Secur. 2018, 86, 471–483. [Google Scholar] [CrossRef]
- Knapp, E.; Broad, J. Industrial Network Security: Securing Critical Infrastructure Networks for Smart Grid, SCADA, and Other Industrial Control Systems; Elsevier: Amsterdam, The Netherlands, 2014. [Google Scholar]
- Xia, S.; Zhang, Q.; Jing, J.; Ding, Z.; Yu, J.; Chen, B.; Wu, H. Distributed State Estimation of Multi-region Power System based on Consensus Theory. Energies 2019, 12, 900. [Google Scholar] [CrossRef]
- Rivera, J.; Leimhofer, J.; Jacobsen, H.A. OpenGridMap: Towards automatic power grid simulation model generation from crowdsourced data. Comput. Sci.-Res. Dev. 2017, 32, 13–23. [Google Scholar] [CrossRef]
- Sivanagaraju, G.; Chakrabarti, S.; Srivastava, S.C. Uncertainty in transmission line parameters: Estimation and impact on line current differential protection. IEEE Trans. Instrum. Meas. 2013, 63, 1496–1504. [Google Scholar] [CrossRef]
- Liu, Y.; Ning, P.; Reiter, M.K. False data injection attacks against state estimation in electric power grids. ACM Trans. Inf. Syst. Secur. 2011, 14, 1–33. [Google Scholar] [CrossRef]
- Fangfei Li, Y.T. False Data Injection Attack for Cyber-Physical Systems With Resource Constraint. IEEE Trans. Cybern. 2020, 50, 729–738. [Google Scholar]
- Lu, A.Y.; Yang, G.H. False Data Injection Attacks against State Estimation in the presence of Sensor Failures. Inf. Sci. 2020, 508, 92–104. [Google Scholar] [CrossRef]
- Li, Z.; Shahidehpour, M.; Alabdulwahab, A.; Abusorrah, A. Bilevel model for analyzing coordinated cyber-physical attacks on power systems. IEEE Trans. Smart Grid 2015, 7, 2260–2272. [Google Scholar] [CrossRef]
- Yu, Z.H.; Chin, W.L. Blind false data injection attack using PCA approximation method in smart grid. IEEE Trans. Smart Grid 2015, 6, 1219–1226. [Google Scholar] [CrossRef]
- Kim, T.T.; Poor, H.V. Strategic protection against data injection attacks on power grids. IEEE Trans. Smart Grid 2011, 2, 326–333. [Google Scholar] [CrossRef]
- He, Y.; Mendis, G.J.; Wei, J. Real-time detection of false data injection attacks in smart grid: A deep learning-based intelligent mechanism. IEEE Trans. Smart Grid 2017, 8, 2505–2516. [Google Scholar] [CrossRef]
- Ganjkhani, M.; Fallah, S.N.; Badakhshan, S.; Shamshirband, S.; Chau, K.W. A Novel Detection Algorithm to Identify False Data Injection Attacks on Power System State Estimation. Energies 2019, 12, 2209. [Google Scholar] [CrossRef]
- Jie, X.; Wang, H.; Fei, M.; Du, D.; Sun, Q.; Yang, T. Anomaly behavior detection and reliability assessment of control systems based on association rules. Int. J. Crit. Infrastruct. Prot. 2018, 22, 90–99. [Google Scholar] [CrossRef]
- Yang, Q.; Yang, J.; Yu, W.; An, D.; Zhang, N.; Zhao, W. On false data-injection attacks against power system state estimation: Modeling and countermeasures. IEEE Trans. Parallel Distrib. Syst. 2013, 25, 717–729. [Google Scholar] [CrossRef]
- Kosut, O.; Jia, L.; Thomas, R.J.; Tong, L. Malicious data attacks on the smart grid. IEEE Trans. Smart Grid 2011, 2, 645–658. [Google Scholar] [CrossRef]
- Sandberg, H.; Teixeira, A.; Johansson, K.H. On security indices for state estimators in power networks. In Proceedings of the First Workshop on Secure Control Systems (SCS), Stockholm, Sweden, 12 April 2010. [Google Scholar]
- Teixeira, A.; Dán, G.; Sandberg, H.; Johansson, K.H. A cyber security study of a SCADA energy management system: Stealthy deception attacks on the state estimator. IFAC Proc. Vol. 2011, 44, 11271–11277. [Google Scholar] [CrossRef]
- Sou, K.C.; Sandberg, H.; Johansson, K.H. Computing critical k-tuples in power networks. IEEE Trans. Power Syst. 2012, 27, 1511–1520. [Google Scholar] [CrossRef]
- Du, D.; Li, X.; Li, W.; Chen, R.; Fei, M.; Wu, L. ADMM-based distributed state estimation of smart grid under data deception and denial of service attacks. IEEE Trans. Syst. Man Cybern. Syst. 2019, 49, 1698–1711. [Google Scholar] [CrossRef]
- Bhatia, R. Matrix Analysis; Springer: New York, NYm, USA, 1997. [Google Scholar]
- Elsheikh, A.H.; Wheeler, M.F.; Hoteit, I. Sparse calibration of subsurface flow models using nonlinear orthogonal matching pursuit and an iterative stochastic ensemble method. Adv. Water Resour. 2013, 56, 14–26. [Google Scholar] [CrossRef]
- Lj, V.; Strugar; Katic, V.A.; Milanovic, J.V. Generic Model of Coastal Distribution Network for Power System Harmonics Studies. J. Przegląd Elektrotechniczny 2013, 89, 149–155. [Google Scholar]
© 2020 by the authors. Licensee MDPI, Basel, Switzerland. This article is an open access article distributed under the terms and conditions of the Creative Commons Attribution (CC BY) license (http://creativecommons.org/licenses/by/4.0/).