Article

Design of a Passive Downdraught Evaporative Cooling Windcatcher (PDEC-WC) System for Greenhouses in Hot Climates

1
Unité de Recherche Energétique et Environnement, Ecole Nationale d’Ingénieurs de Tunis, Université de Tunis El Manar, 1002 Tunis, Tunisia
2
Department of Architecture and Built Environment, University of Nottingham, Nottingham NG7 2RD, UK
*
Author to whom correspondence should be addressed.
Energies 2020, 13(11), 2934; https://doi.org/10.3390/en13112934
Submission received: 12 April 2020 / Revised: 26 May 2020 / Accepted: 1 June 2020 / Published: 8 June 2020
(This article belongs to the Section G: Energy and Buildings)

Abstract

:
A windcatcher is a wind-driven natural ventilation system that catches the prevailing wind to bring fresh airflow into the building and remove existing stale air. This technology recently regained attention and is increasingly being employed in buildings for passive ventilation and cooling. The combination of windcatchers and evaporative cooling has the potential to reduce the amount of energy required to ventilate and cool a greenhouse in warm and hot climates. This study examined a greenhouse incorporated with a passive downdraught evaporative cooling windcatcher (PDEC-WC) system using Computational Fluid Dynamics (CFD), validated with experimental data. Different hot ambient conditions of temperature (30–45 °C) and relative humidity (15–45%) were considered. The study explored the influence of different spray heights, layouts, cone angles and mass flow rates on indoor temperature and humidity. The average error between measurements and simulated results was 5.4% for the greenhouse model and 4.6% for the evaporative spray model. Based on the results and set conditions, the system was able to reduce the air temperature by up to 13.3 °C and to increase relative humidity by 54%. The study also assessed the influence of neighbouring structures or other greenhouses that influence the flow distribution at the ventilation openings. The study showed that the windcatcher ventilation system provided higher airflow rates as compared to cross-flow ventilation when other structures surrounded the greenhouse.

Graphical Abstract

1. Introduction

The operations of greenhouses are a significant part of agriculture in many countries. The proper design and maintenance of greenhouses are necessary to ensure that they do not consume much energy and that the operation remains profitable. In hot climates, greenhouse growing can be a challenge, and the requirement to provide a conducive environment for plant growth and production is essential. During hot summer conditions, natural or forced ventilation and cooling systems are used to ensure that the greenhouse indoor temperature does not rise too high above the required temperature levels and protect the crops. Although conventional mechanical cooling or air-conditioning equipment can be employed, a greenhouse is subject to high solar loads and typically poorly insulated, and hence it would be too expensive to install and operate in a greenhouse in such conditions. Additionally, it would further contribute to rising carbon dioxide emissions and negatively affect energy supplies [1]. Currently, evaporative cooling technologies are widely used for temperature control in greenhouses in hot climates and have been the focus of several studies [2].
Wind-driven ventilation techniques such as windcatchers are increasingly being employed in buildings for passive ventilation and cooling [3]. Several studies have also incorporated windcatchers into greenhouses [4]. Windcatchers are traditional architectural features that originated from the Middle East centuries ago. Windcatchers can aid wind-driven ventilation by directing and increasing airflow through spaces [5]. The main advantage of windcatchers is that they capture wind at higher altitude or roof level as compared to low-level vents or windows, as shown in Figure 1. Hence, they can provide higher airflow rates, especially in large indoor spaces such as classrooms, storage facilities, factories and potentially greenhouses. Additionally, since the openings of windcatchers are located at higher levels, airflow will be less affected by neighbouring structures such as other buildings or greenhouses. Furthermore, windcatchers have low maintenance costs because they have no moving parts [6,7,8]. The combination of evaporative cooling and windcatcher natural ventilation strategies has the potential to reduce the energy requirements of greenhouses in terms of ventilation and cooling and also provide a conducive environment for plant growth and production.
Several research efforts [8,9,10,11,12,13,14] have focused on investigating the performance of windcatchers for building applications, but there are limited studies that have investigated windcatchers for a greenhouse, while even fewer studies have attempted to incorporate passive downdraught evaporative cooling and windcatchers into the greenhouse design to enhance the cooling performance. Hence, the present work aims to investigate the performance of a greenhouse outfitted with a passive downdraught evaporative cooling windcatcher (PDEC-WC) system using Computational Fluid Dynamics (CFD). A numerical model of the PDEC-WC was developed with eight evaporative cooling water spray nozzles. The type of spray used in this study was a hollow cone-shape. The simulations were conducted using ANSYS Fluent v18.1 and validated with experimental data. The study explored the influence of varying the nozzle pressure drop, water spray mass flow rate and nozzle cone angle on the airflow temperature, velocity and relative humidity distribution inside the greenhouse. Four different heights and six configurations of the evaporative cooling water spray nozzles (three parallel and three staggered) were considered in the study. Furthermore, the study also assessed the influence of neighbouring structures or other greenhouses.

2. Literature Review

The ventilation and thermal performance of windcatchers have been the subject of numerous numerical [9,10] and experimental studies [11,12]. Hughes et al. [5] carried out a detailed review of the recent developments of windcatchers and their integration into the built environment. The review evaluated the different parameters that influence the ventilation performance of windcatchers such as the form, size, height, positioning, number of openings, louvres and dampers. The review highlighted the limitations of windcatchers, in particular, modern or commercial roof-mounted windcatchers, which cannot condition the supply airflow and depend on the external climatic conditions.
This limits the application of windcatchers in areas with unfavourable climates and may require the integration of other cooling methods such as evaporative cooling technologies. In their next study [9], the authors attempted to address this limitation by incorporating cylindrical heat transfer devices within the channels of a uni-directional windcatcher. The authors developed a numerical model of the windcatcher using CFD and validated their results against data from previous research. The study also compared the ventilation and thermal performance of the windcatcher with heat transfer devices with an evaporative cooling spray system.
Noroozi and Veneris [11] also investigated a windcatcher with evaporative cooling but, instead, employed wetted curtains and blades within the windcatcher’s channel. The work developed a laboratory-scale prototype of the uni-directional windcatcher and tested it under real outdoor conditions. The experimental tests evaluated the influence of the wind conditions, the height of the device and different modes of the cooling pads. The results showed that the proposed system was able to reduce the temperature by up to 14.6 °C. A theoretical model was also established to validate the results of the experiments. Similarly, Khani et al. [12] also carried out theoretical modelling and a field experiment to evaluate the ventilation and thermal performance of a windcatcher integrated with evaporative cooling surfaces. In their work, they proposed a modular design of the windcatcher with wetted straws located on the openings of the windcatcher. Under hot and dry conditions, the results of the experiments showed that cooling of up to 10 °C was achieved.
Zaki et al. [13] focused on the natural ventilation performance of a two-sided windcatcher using numerical modelling and wind tunnel testing. Unlike previous work, the study carried out the tests in an atmospheric boundary layer (ABL) wind tunnel with both the building and windcatcher located inside the test section. The work highlighted the importance of testing the full building in the wind flow instead of just the windcatcher, which was commonly done in previous studies [14,15]. This is essential when there are vents or openings located in the low-pressure zones, i.e., the leeward side of the building. The study also highlighted that the k-epsilon turbulence model provided reasonably accurate results.
Recently, Calautit et al. [16] also implemented an ABL wind profile in their simulation of a windcatcher incorporating cylindrical heat transfer devices with fins. The study focused on the capabilities of the system in providing good indoor environment quality (IEQ) in hot climates. A computational model was also developed using CFD, which was validated using scaled wind tunnel tests. The results showed that the windcatcher with cooling devices was able to provide an adequate supply of fresh airflow into the space. The work also highlighted the influence of the supply inlet position on the indoor thermal distribution.
To optimise the natural ventilation performance of windcatchers, Varela-Boydo and Moya [17] proposed a new design including inlet extensions to increase the amount of captured airflow. ANSYS Fluent was used to simulate the flow fields, and the results were compared against the results of the wind tunnel tests. The study showed that the inlet extensions could modify the pressure distribution around the windcatcher, which could help to improve the supply airflow.
Several researchers studied the ventilation and cooling performance of naturally ventilated and evaporatively cooled greenhouses in hot climates by experiments and numerical modelling. Franco et al. [18] investigated cooling pads that are commonly used in greenhouses located in the Mediterranean area. The pads were made of stacked sheets of corrugated cellulose sheets attached at alternating angles to create plenty of opening area for air to pass through and for that air to be in contact with wet surface areas. A CFD model was developed using ANSYS CFX and validated with experiments. The results showed that the evaporative cooling pad pressure drop increased with the flow rate of water. Similarly, Bartzanas et al. [19] also used CFD modelling to investigate a greenhouse cooled with an evaporative cooling pad system. The greenhouse was a plastic tunnel type with curved sidewalls, and the model included a tomato crop of 1.5 m height. The numerical modelling was validated with experimental data, and the difference between the results was below 4%.
Our review [20] on greenhouse design and cooling technologies in hot climates provided a detailed overview of different evaporative cooling and natural ventilation strategies for greenhouses. We reported that there are limited studies that have investigated the use of windcatchers for greenhouses, while even fewer studies have attempted to incorporate passive downdraught evaporative cooling and windcatchers into the greenhouse design to enhance the cooling performance. Furthermore, no studies have investigated the impact of neighbouring buildings on the natural ventilation performance of greenhouses with windcatchers [20].

3. Methods

3.1. CFD Theory

The CFD simulations were carried out using ANSYS v18.1 (ANSYS, Inc., Canonsburg, PA, USA) and 3D steady Reynolds -Averaged Navier–Stokes (RANS) equations. The simulation was carried out in the same computational domain in which both the outdoor and indoor airflow were modelled. The standard k-epsilon turbulence model is adopted to account for the natural ventilation flow patterns. The k-epsilon turbulence model is widely used in the modelling of windcatchers [5], evaporative cooling [5,20] and greenhouses [20]. Additionally, a Semi-Implicit Method for Pressure-Linked Equations velocity-pressure coupling algorithm was employed in the steady-state simulation. For both the convection and viscous terms of the governing equations, second-order discretisation schemes were used. The governing equations are not included here but available in the theory guide [21].

3.2. Computational Domain

Figure 2 shows the computational domain of the naturally ventilated greenhouse. The domain was based on the numerical model and experimental tests of Chu et al. [22]. The inlet boundary distance was 4.5H (H is the greenhouse height = 4 m from the greenhouse), and the outlet boundary was positioned 10H behind the greenhouse. The side and top walls were 5H away from the greenhouse. The top and side surfaces of the domain were set as symmetry. The blockage ratio of the greenhouse was 4.90%.

3.3. Design Geometry and Configurations

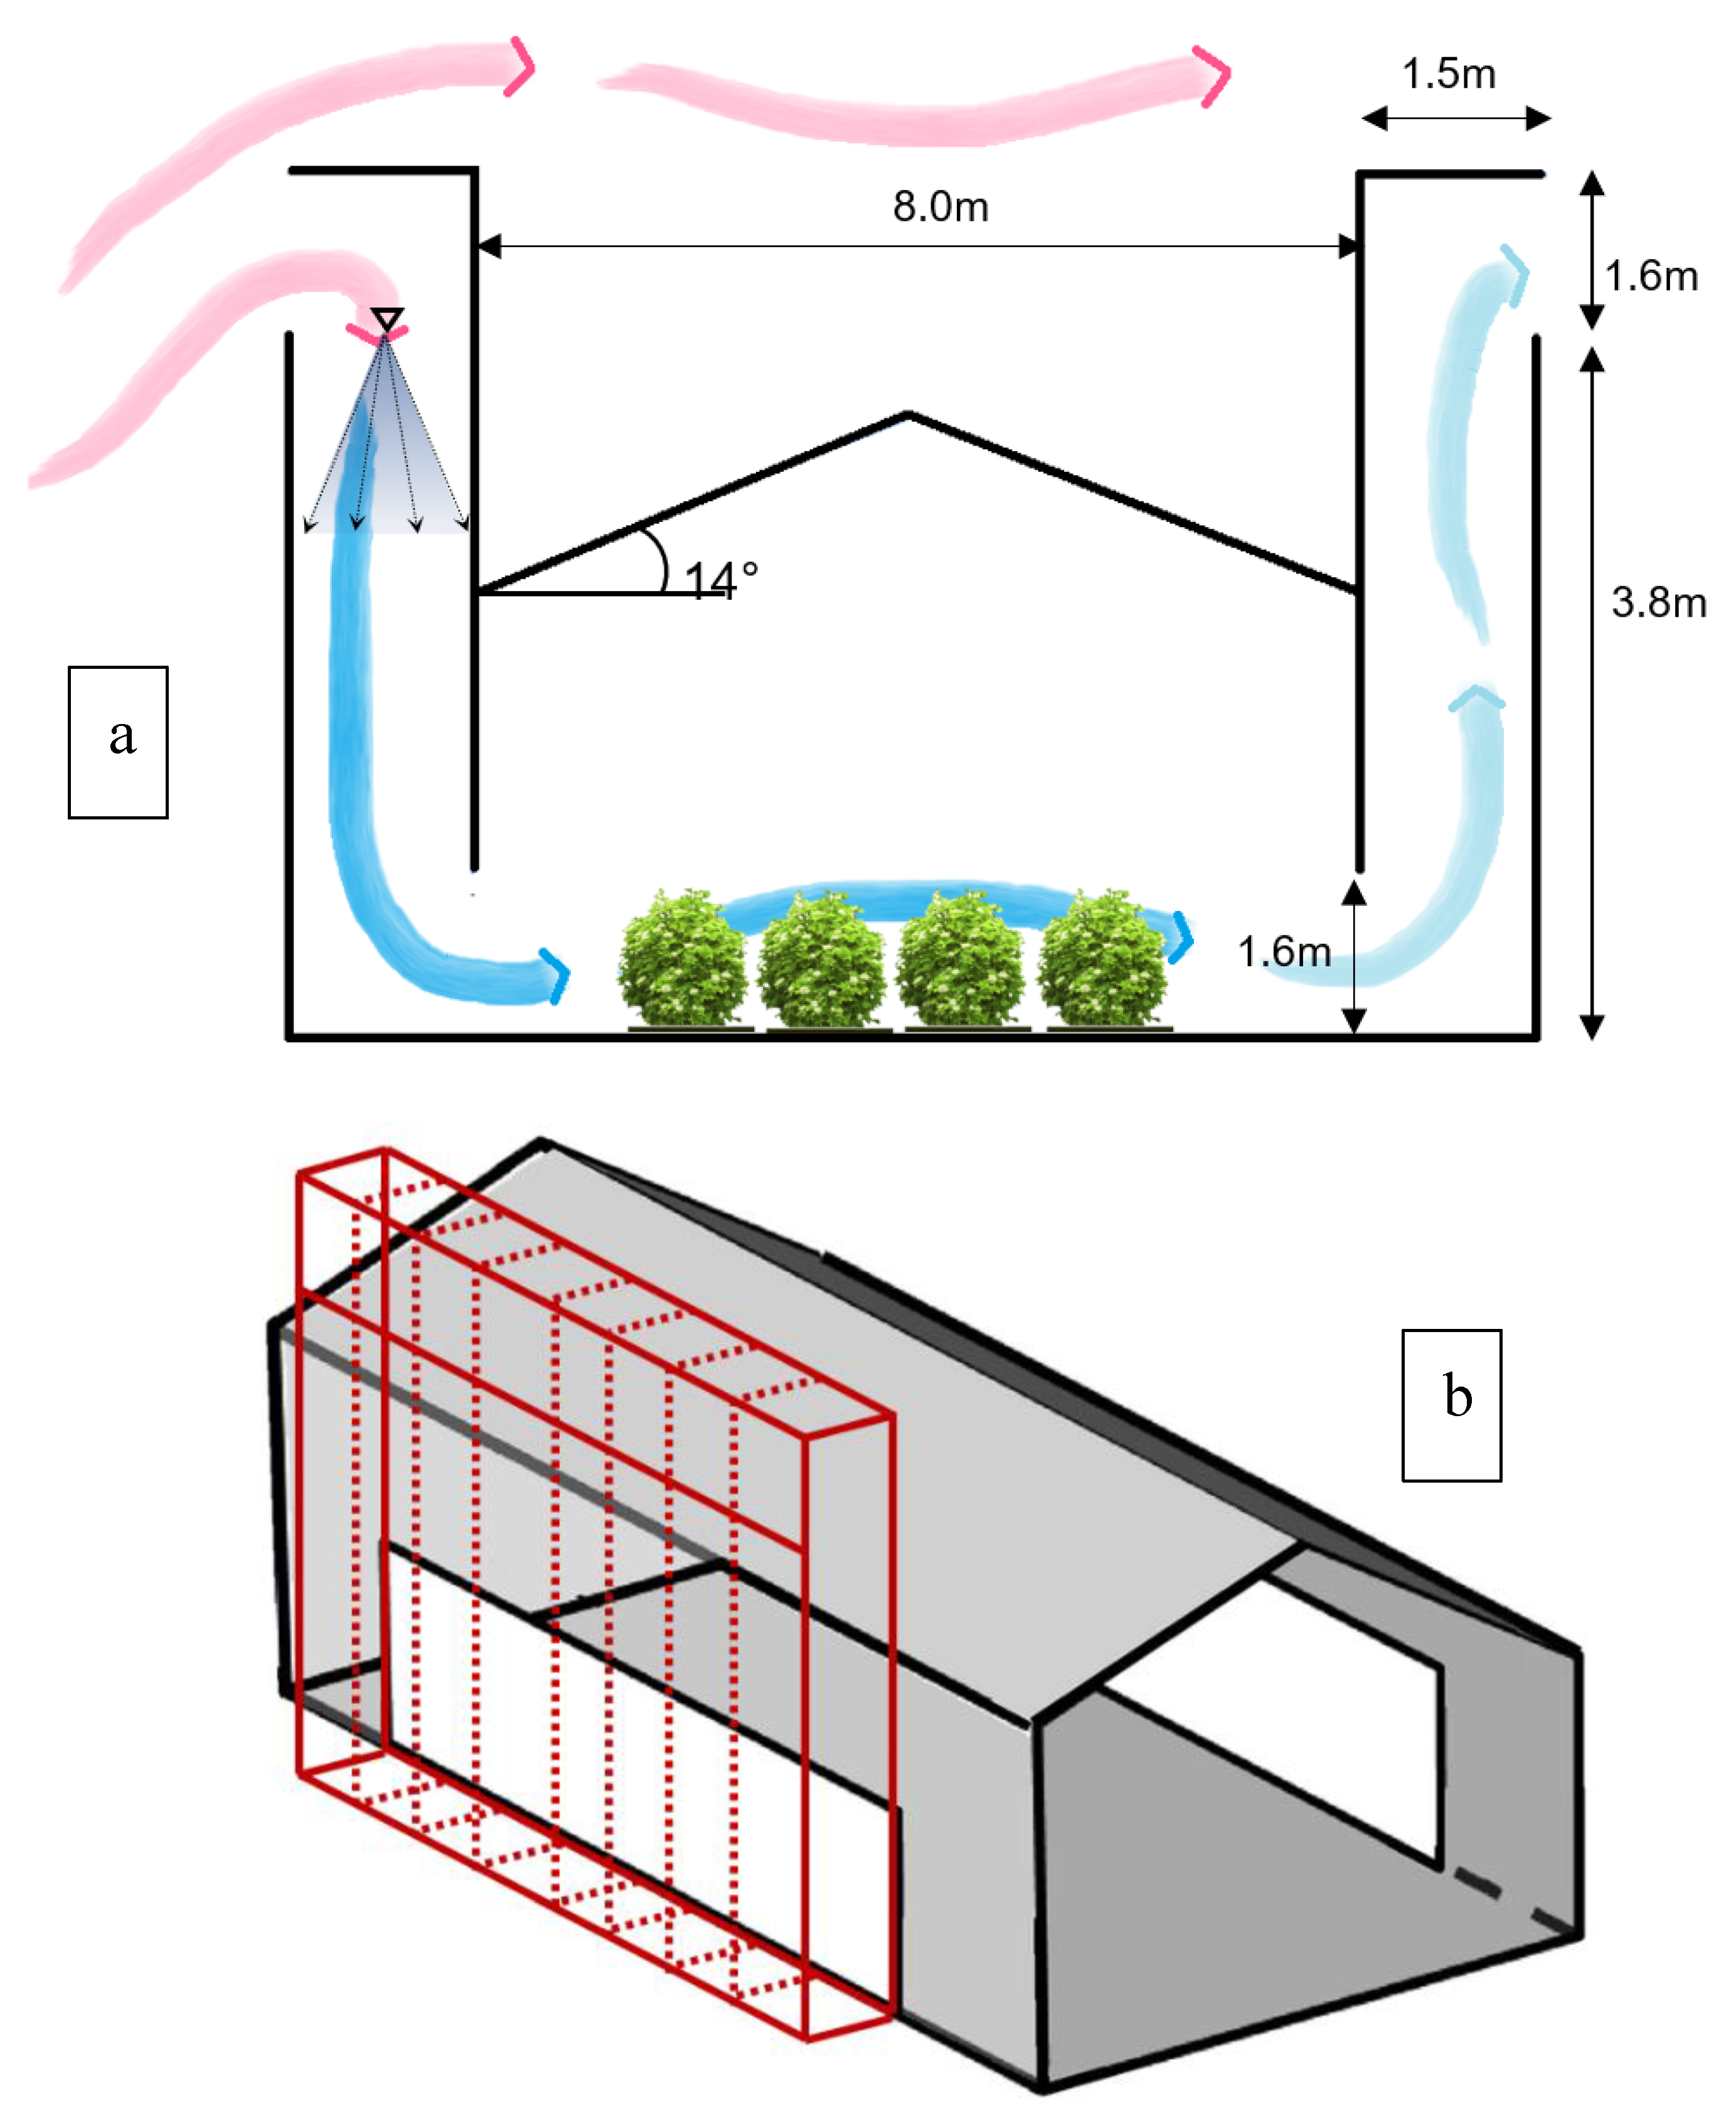
For the benchmark model, a standard naturally ventilated greenhouse was modelled with the following dimensions: 20 m length, 8 m width and 4 m height (Figure 2). The slope of the roof was 14°. The greenhouse was crossflow-ventilated by the central windward and leeward ventilation openings of 12 × 1.6 m2. Three-dimensional windcatcher models were connected to the greenhouse central windward and leeward wall openings, maintaining the size of the openings. The dimensions of the windcatchers were 12 m length, 1.5 m width and 5.44 m height. The opening height of the windcatcher was 1.6 m (Figure 3a). It should be noted that the windcatcher width of 1.5 m was selected considering geometric similarity to the design used in a previous study [23]. Since the size of the validated model domain was in the shape of cuboid and the windcatcher with eight evaporative water spray nozzles was used as the baseline model, the windcatcher was vertically divided into eight sub-domains (see Figure 3b), where the vertical cross-section of each domain was 1.5 × 1.5 m2. Compared with the computational domain used in the previous work [23] of 0.585 m × 0.585 m, the scale ratio of each sub-domain to the domain used in the previously validated model was 2.56.
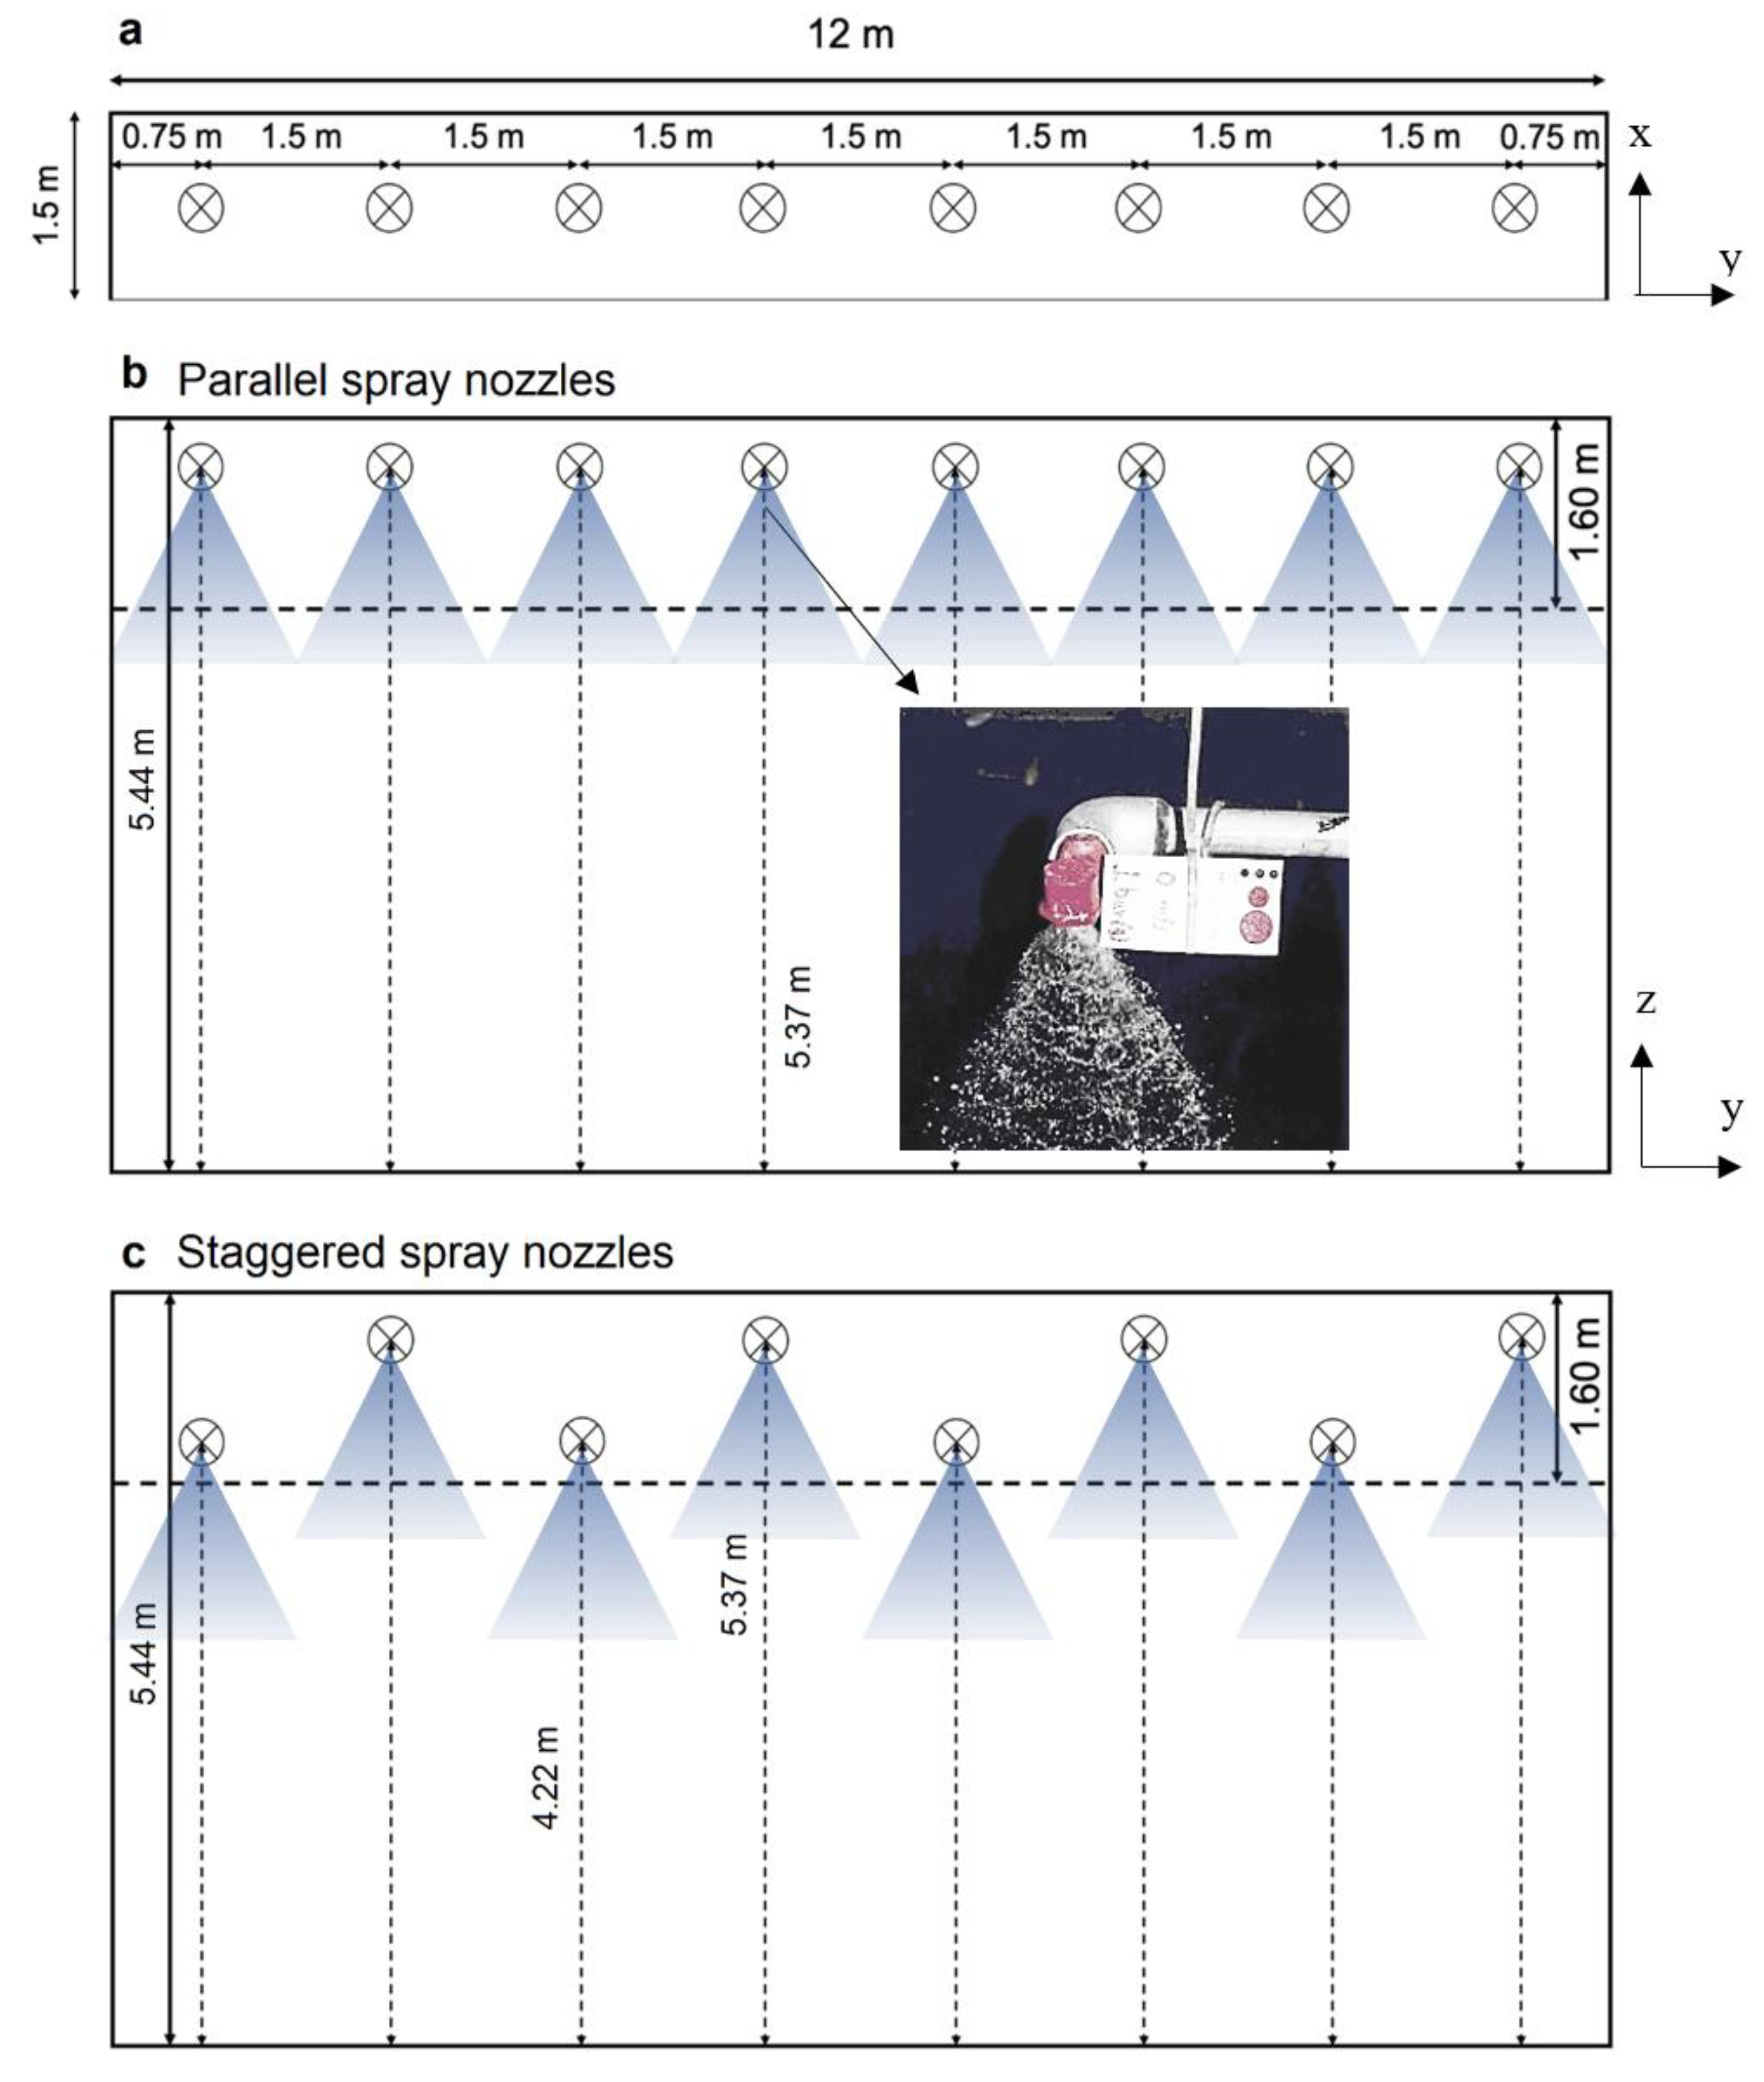
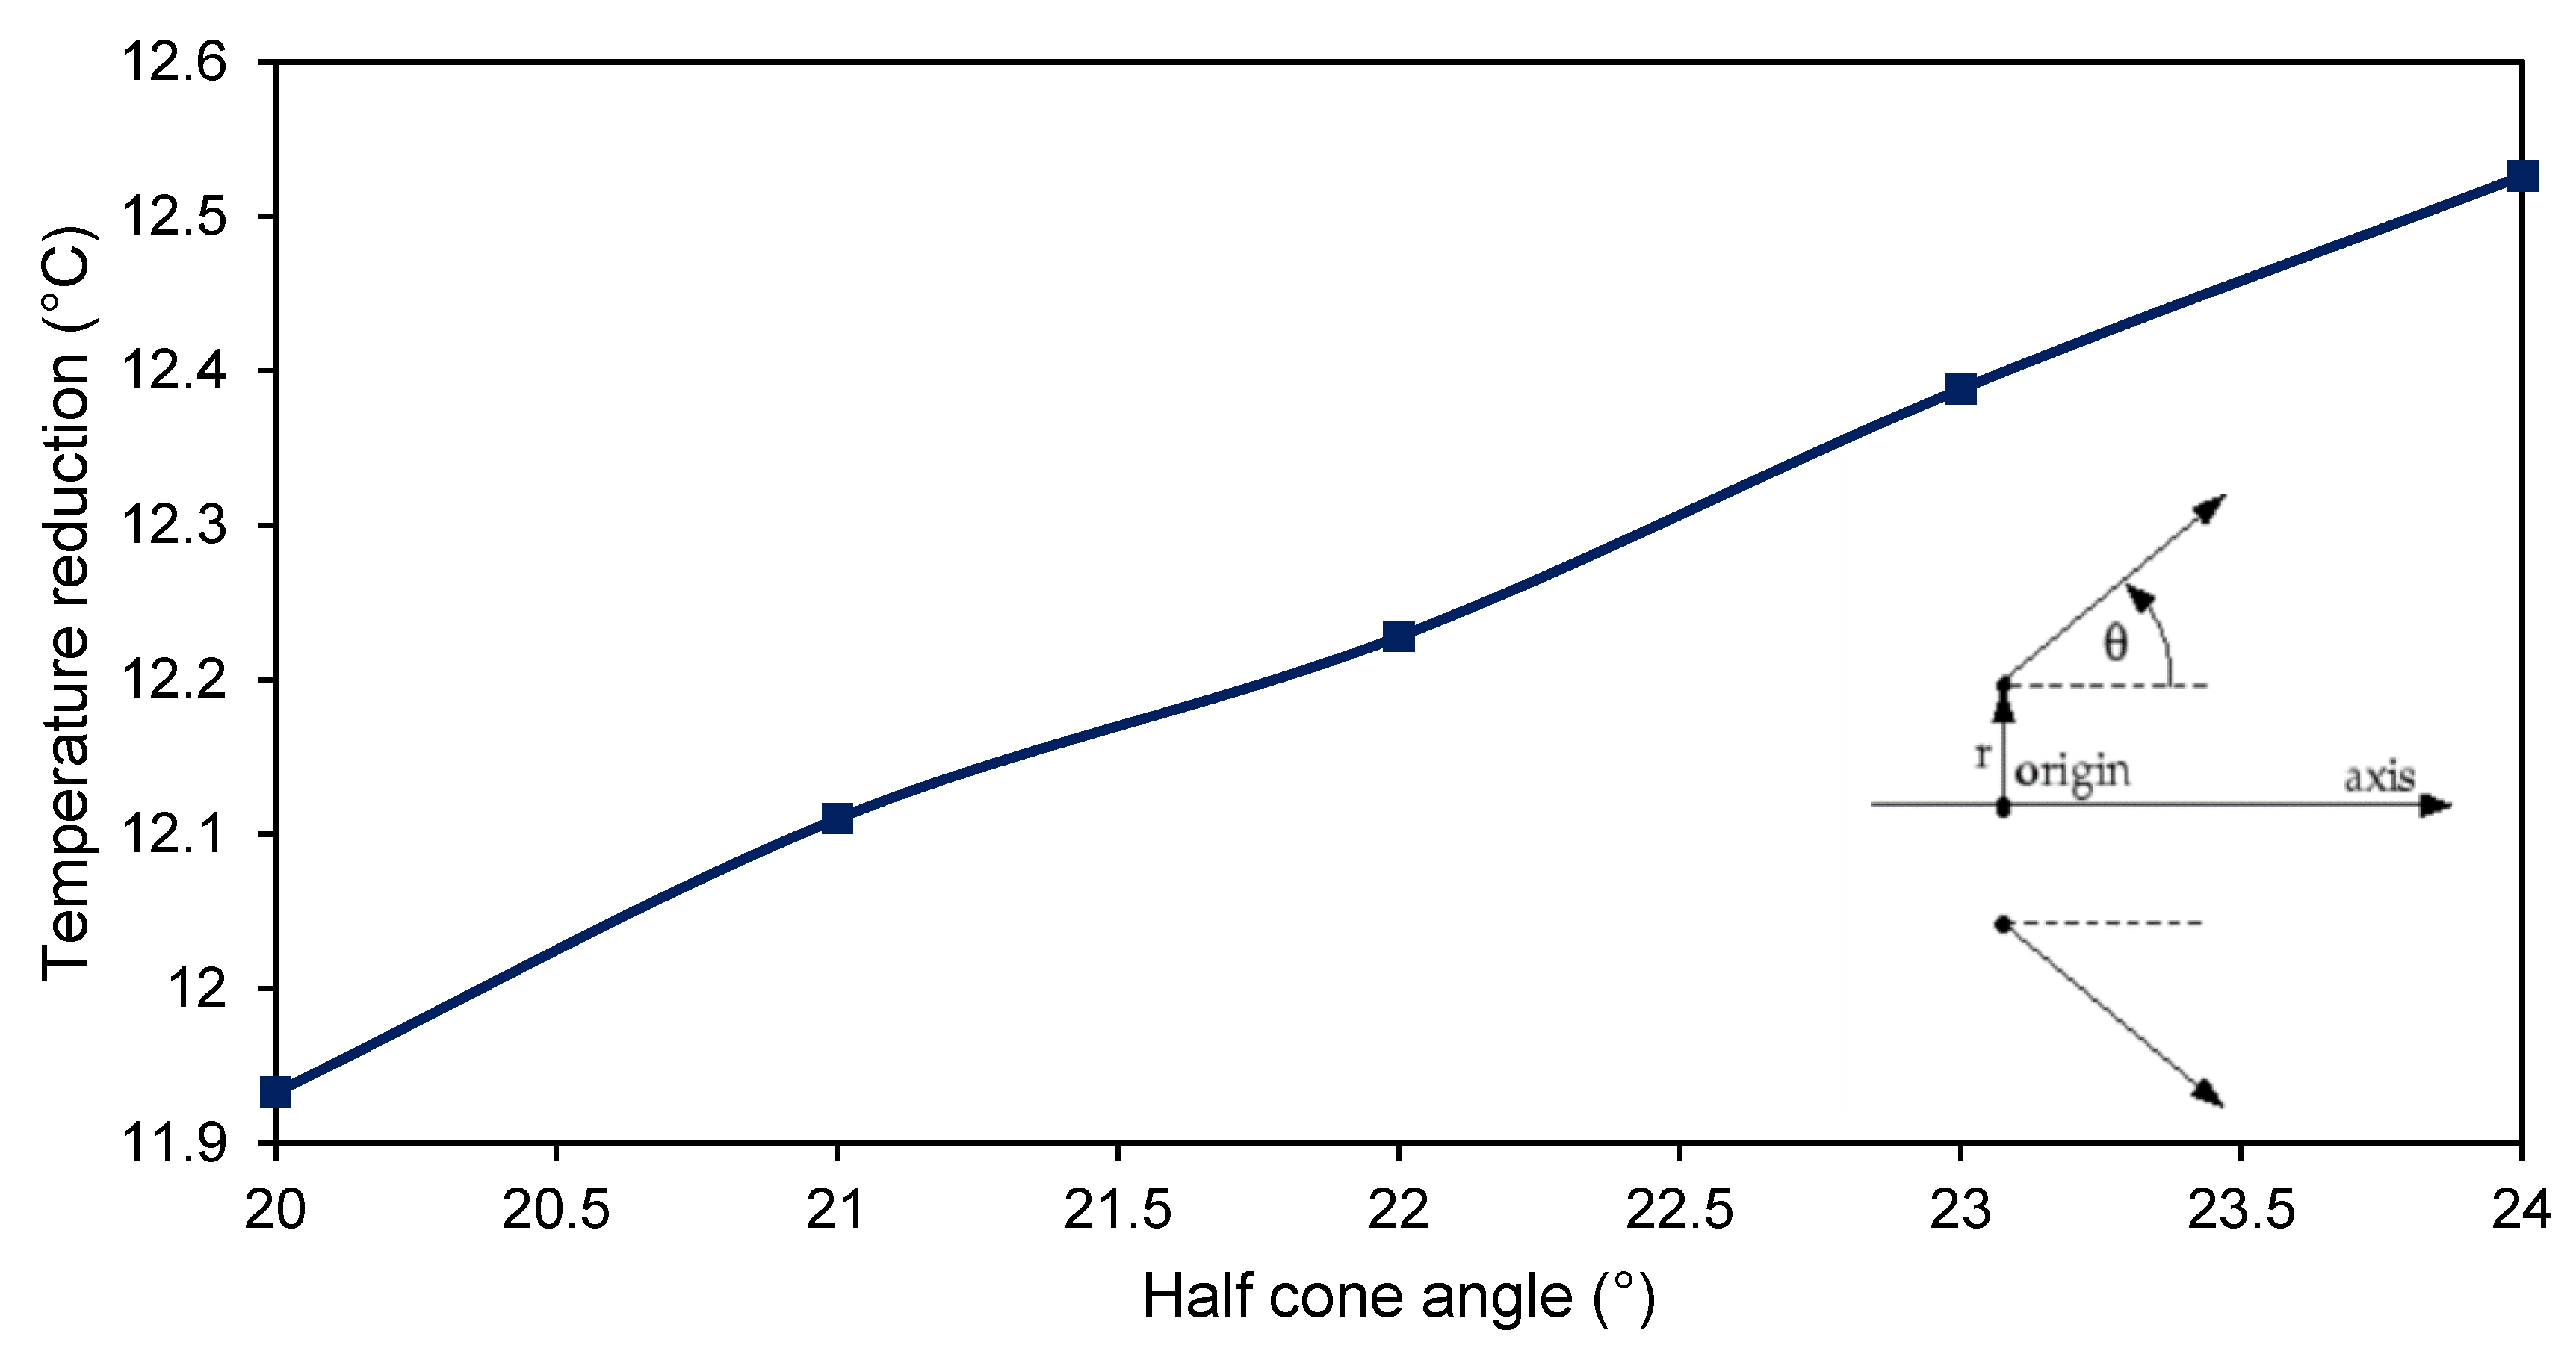
To enhance the cooling performance of the windcatcher and study the influence of the layout of the nozzles, eight evaporative water spray nozzles were positioned at the height of 5.37 m in a horizontal array on the y-direction centreline of the windcatcher (Figure 4). The number of nozzles was then reduced to six and four nozzles to assess its influence on cooling performance. For the case of eight evaporative water spray nozzles, the interval between every two neighbouring nozzles was 1.5 m and the distance between the nozzles nearest the walls and the walls was 0.75 m. Meanwhile, for the case of four evaporative water spray nozzles, the interval between every two neighbouring nozzles was 3 m and the distance between the nozzles nearest the walls and the walls was 1.5 m, as shown in Figure 4. All the nozzles were oriented vertically downwards. The type of the nozzle used in this study was hollow cone-shaped, and the diameter of the discharge hole of the nozzle sprays was 4 mm (Figure 5). The employed hollow cone spray model is available in ANSYS Fluent 18.1. The half-cone angle modelled for the nozzle was 18° [23]. It should be noted that exact value of the spray angle was not detailed in [24], which led to the further evaluation of the impact of various nozzle spray half cone angles by [23]. To investigate the effect of nozzle height, three additional models were created with nozzles positioned at 5.00 m, 4.61 m and 4.22 m.
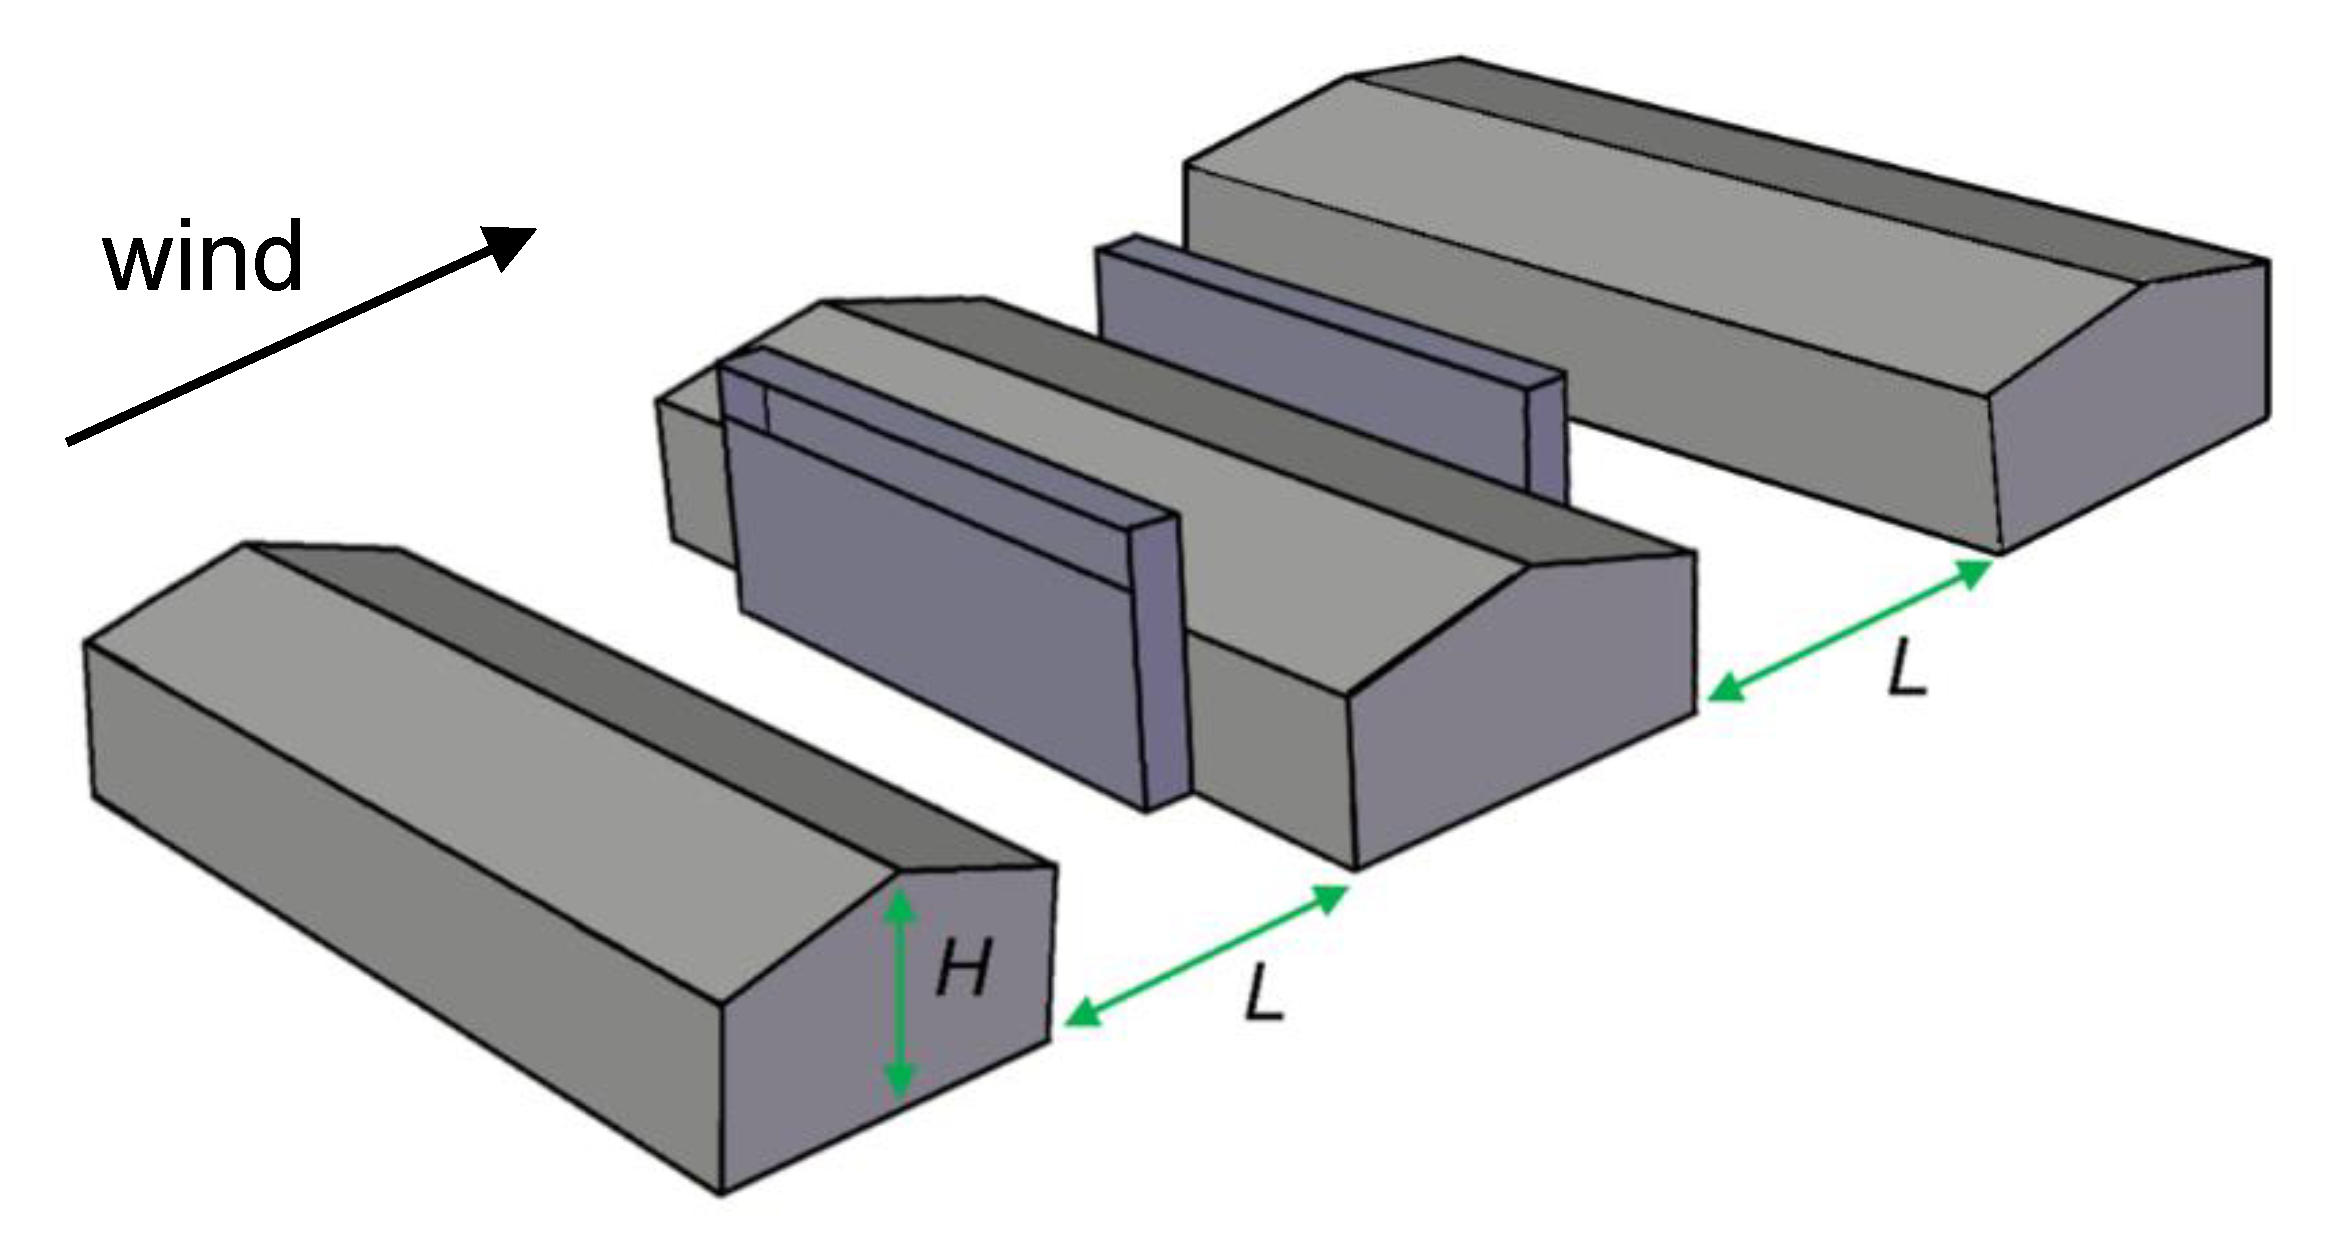
In practice, a typical greenhouse would be surrounded by other structures or greenhouses, which can influence the wind patterns and the natural ventilation performance of the greenhouse (Figure 6). To assess the influence of neighbouring structures and highlight the capability of the proposed system, two greenhouses were added to the windward and leeward sides of the cross-flow and windcatcher ventilated greenhouse models to analyse the effect of surrounding structures on air distribution inside the greenhouse. The distance between the greenhouses (not including the width of the windcatcher) was varied between 4 and 12 metres (H–3H). Table 1 summarises the different simulated configurations.

3.4. Ambient Conditions and Spray Properties

The simulations were carried out with an ambient temperature of 40 °C and relative humidity of 24.5% to simulate typical hot and dry weather conditions. The wind velocity was 4.4 m/s at windcatcher roof height (UHWC). The nozzle gauge pressure was varied between 1 bar and 7.5 bar and the half cone angle between 20° and 24°. The water spray flow rate and temperature were varied between 0.1 and 0.25 m/s, and 20.2 and 35.2 °C, respectively. Finally, various spray heights were simulated (5.37, 5.00, 4.61 and 4.22 m). The greenhouse average temperature and relative humidity were calculated at a height of z = 0.8 m, which corresponded to half of the height of the crop canopy.

3.5. Mesh and Sensitivity Analysis

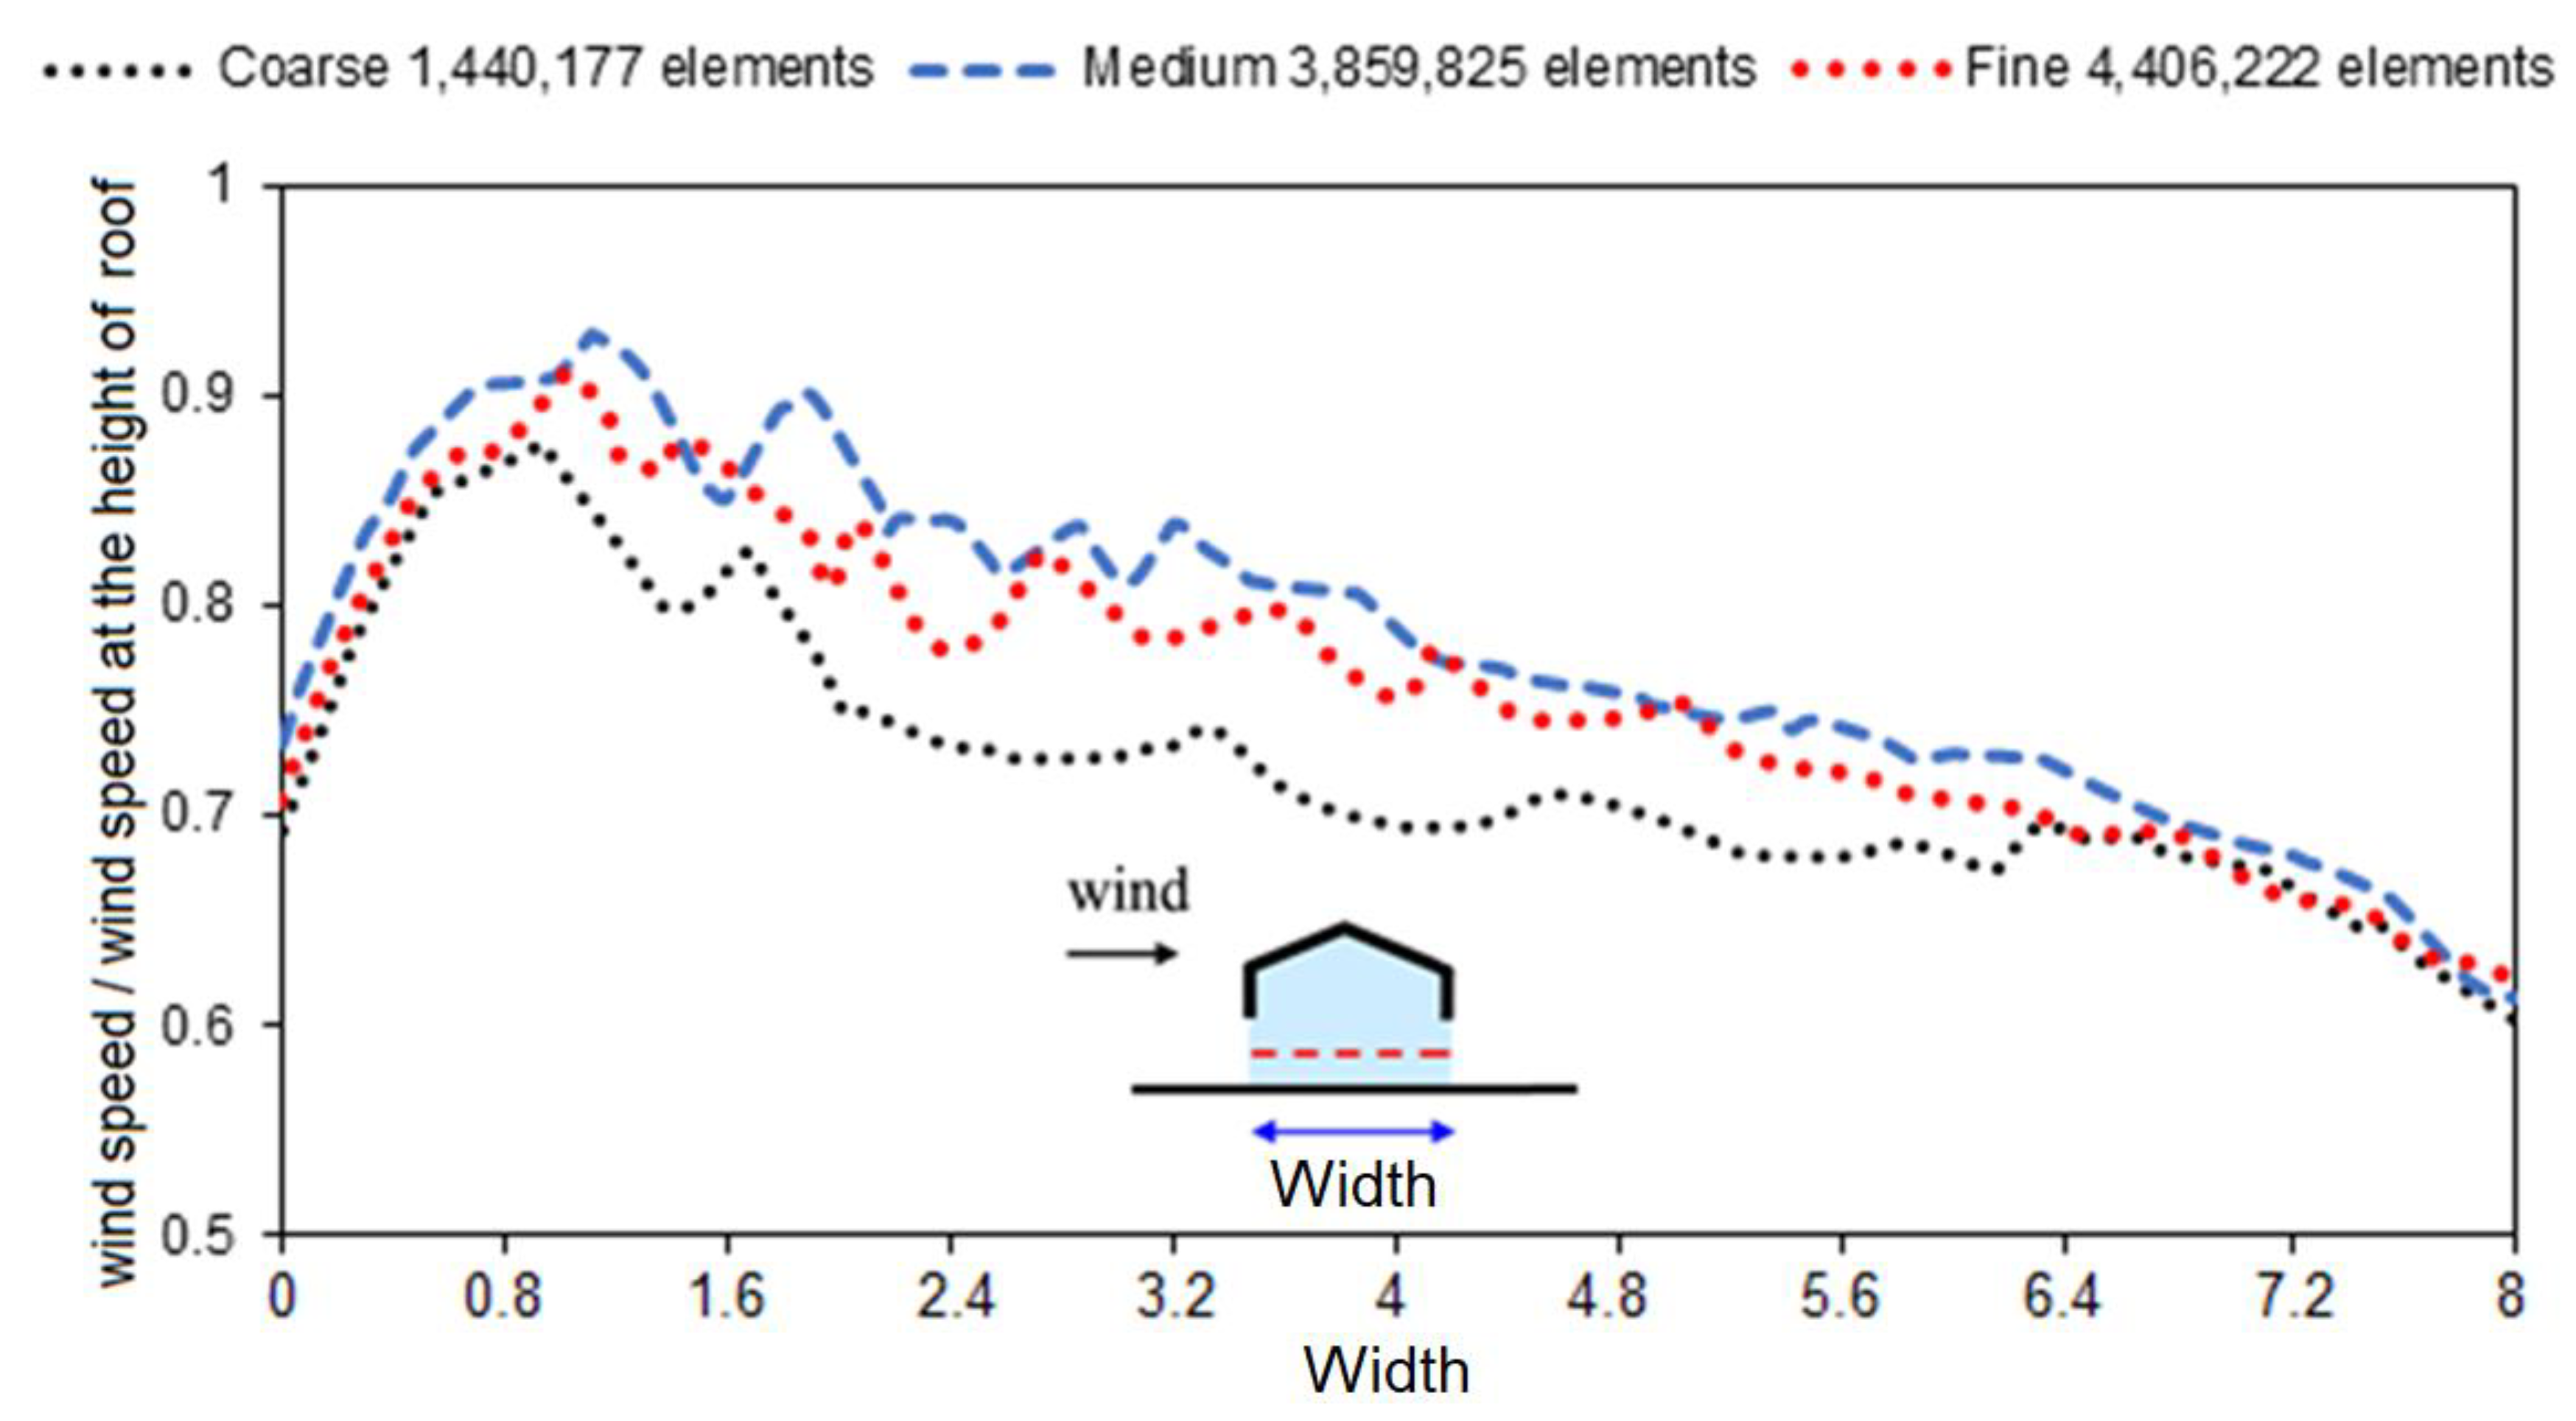
The computational domain was meshed using unstructured mesh. The mesh around the greenhouse openings and windcatcher was refined to make sure that the flow field was correctly captured in the simulations. In order to verify the model and ensure that the results were independent of the size of the mesh, a sensitivity analysis was carried out. This involved the simulation of the same model with three different sizes of mesh: a coarse mesh with 1,440,177 elements, a medium mesh with 3,859,825 elements and a fine mesh with 4,406,222 elements. Figure 7 shows the simulation results of the airflow velocity across a line drawn in the greenhouse, comparing the different mesh sizes. The results show that the difference in the velocity along the horizontal line between the fine and coarse mesh was 9.07%, while it was 2.72% between the fine and the medium mesh. Then, the medium mesh was retained for this study and used for the calculations.

3.6. Boundary Conditions

For the greenhouse, the walls and the bottom boundary were specified as no-slip boundary conditions. For the calculation domain, the top and two lateral boundaries were set as the free-slip boundary condition. The vertical profiles of mean wind speed from the wind tunnel experiment of Chu et al. [22] were used to define the inlet boundary conditions for CFD simulation. The outlet boundary was set to 0 Pa.
For the evaporative cooling system, the mass flow rate and temperature of the water spray streams for each spray nozzle were 12.5 l / min and 35.2 °C [23]. The pressure difference between the supply water pipe and the spray nozzle Δ P was 3 bar. The sheet velocity U 0 , used for initializing the velocity of the spray streams, was calculated by C v ( 2 Δ P / ρ w ) 0.5 where the nozzle coefficient C v given by Sureshkumar et al. [24] was set as 0.9 and ρ w is the density of water. As a result, the calculated sheet velocity U 0 was 22.05 m/s. The number of droplet streams for each nozzle was 300, and the Rosin–Rammler model [25] was used to model the droplet size distribution. Based on the parameter settings of the model by Montazeri et al. [23], it was assumed that 20 droplet diameters were injected from every stream to the windcatcher. The mean diameter was 369 μ m , and the minimum and maximum droplet diameters were 74 μ m and 518 μ m , respectively. The spread parameter was taken as 3.67. In terms of estimating the drag coefficients being exerted on the droplets, the spherical drag law [21] was applied as follows:
C D = a 1 + a 2 R e + a 3 R e 2
where a 1 , a 2 and a 3 are constants over ranges of R e [26]. Table 2 summarises the applied spray and droplet settings.

4. Results and Discussion

4.1. Validation of the Greenhouse Model

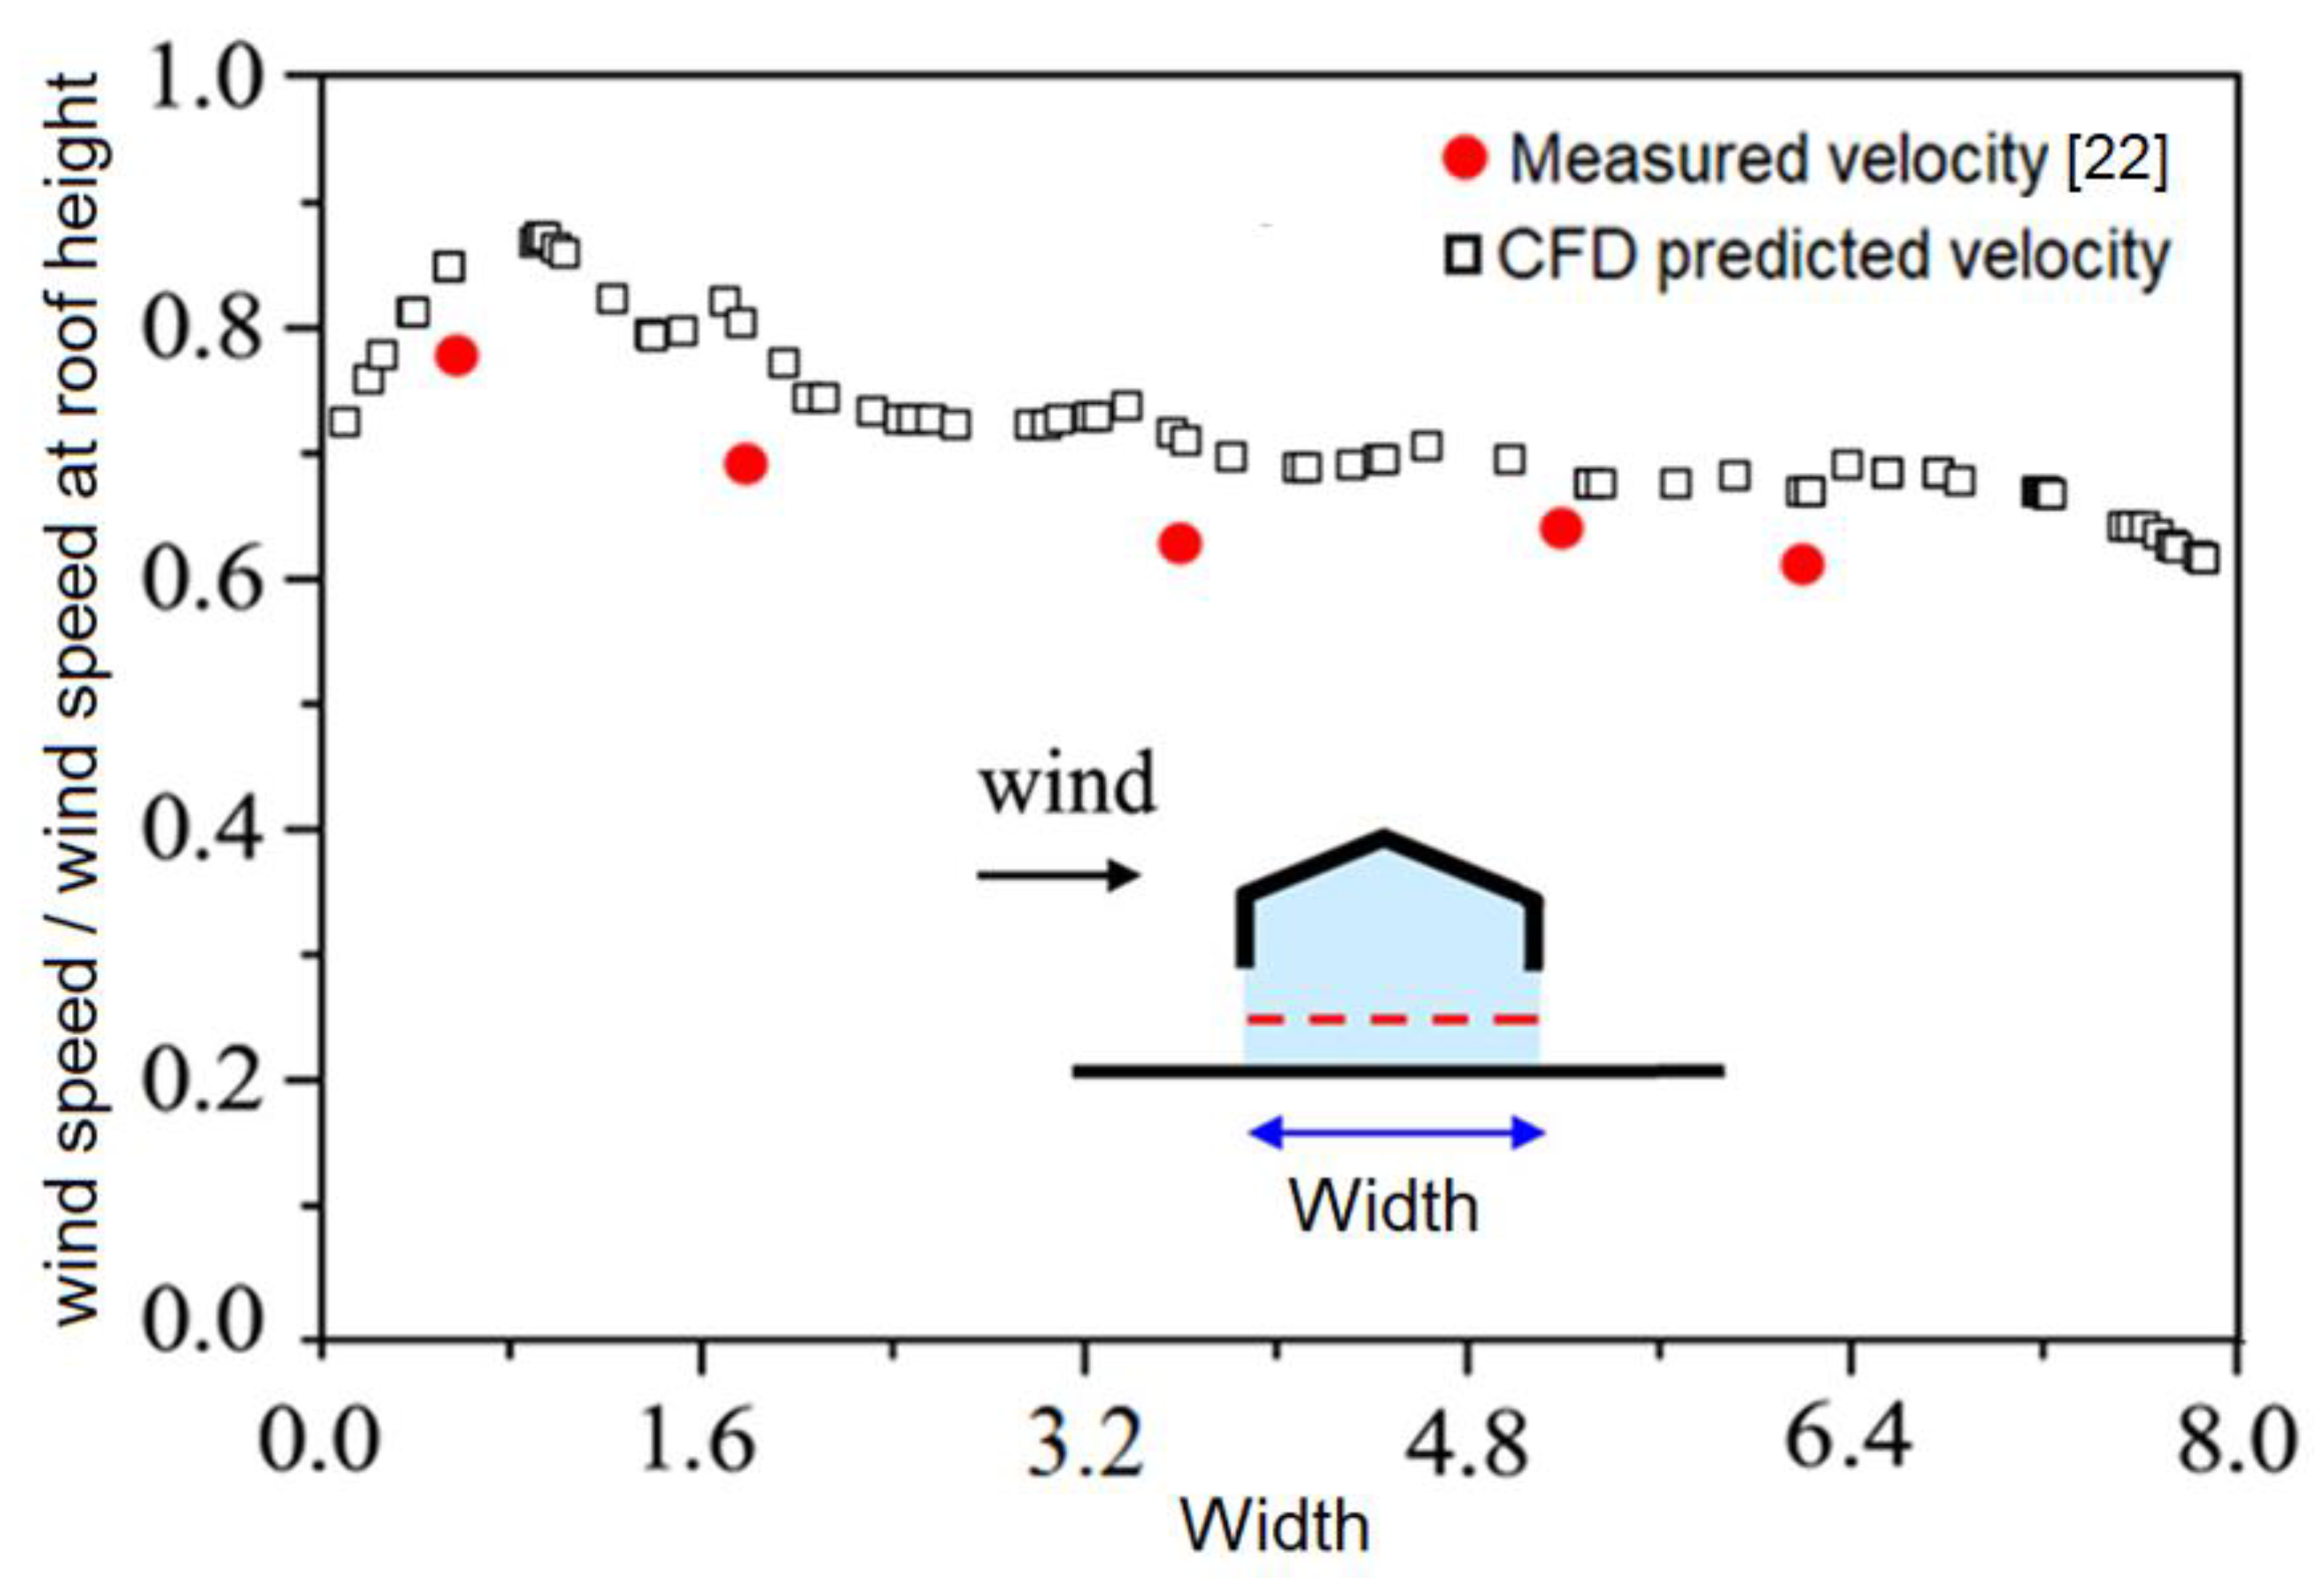
The measured and CFD-predicted results of the airflow velocity inside the cross-flow-ventilated greenhouse are presented in Figure 8. The wind tunnel experiment was conducted in an open wind tunnel [22] with an 18.5 m long, 3.0 m wide and 2.1 m high test section. A 1:20 scale model of the greenhouse was employed. As shown, the airflow velocity is the highest near the opening and gradually decreases as the air exits on the leeward side. The CFD model consistently overestimated the measured values, and this could be a combination of several factors including the k-epsilon turbulence model limitations and experimental uncertainties. In addition, there are several parameters not mentioned in the work of [22] such as the ground surface in the wind tunnel, which was made of artificial grass (based on the images provided). Overall, the CFD results showed good agreement with the measurements of Chu et al. [22]. The average discrepancy between the measurements and predicted results was 5.4%. Although the large eddy simulation (LES) model can provide more accurate results, the present work adopted the k-ε model to reduce the computation time [22].

4.2. Validation of the Water Spray System

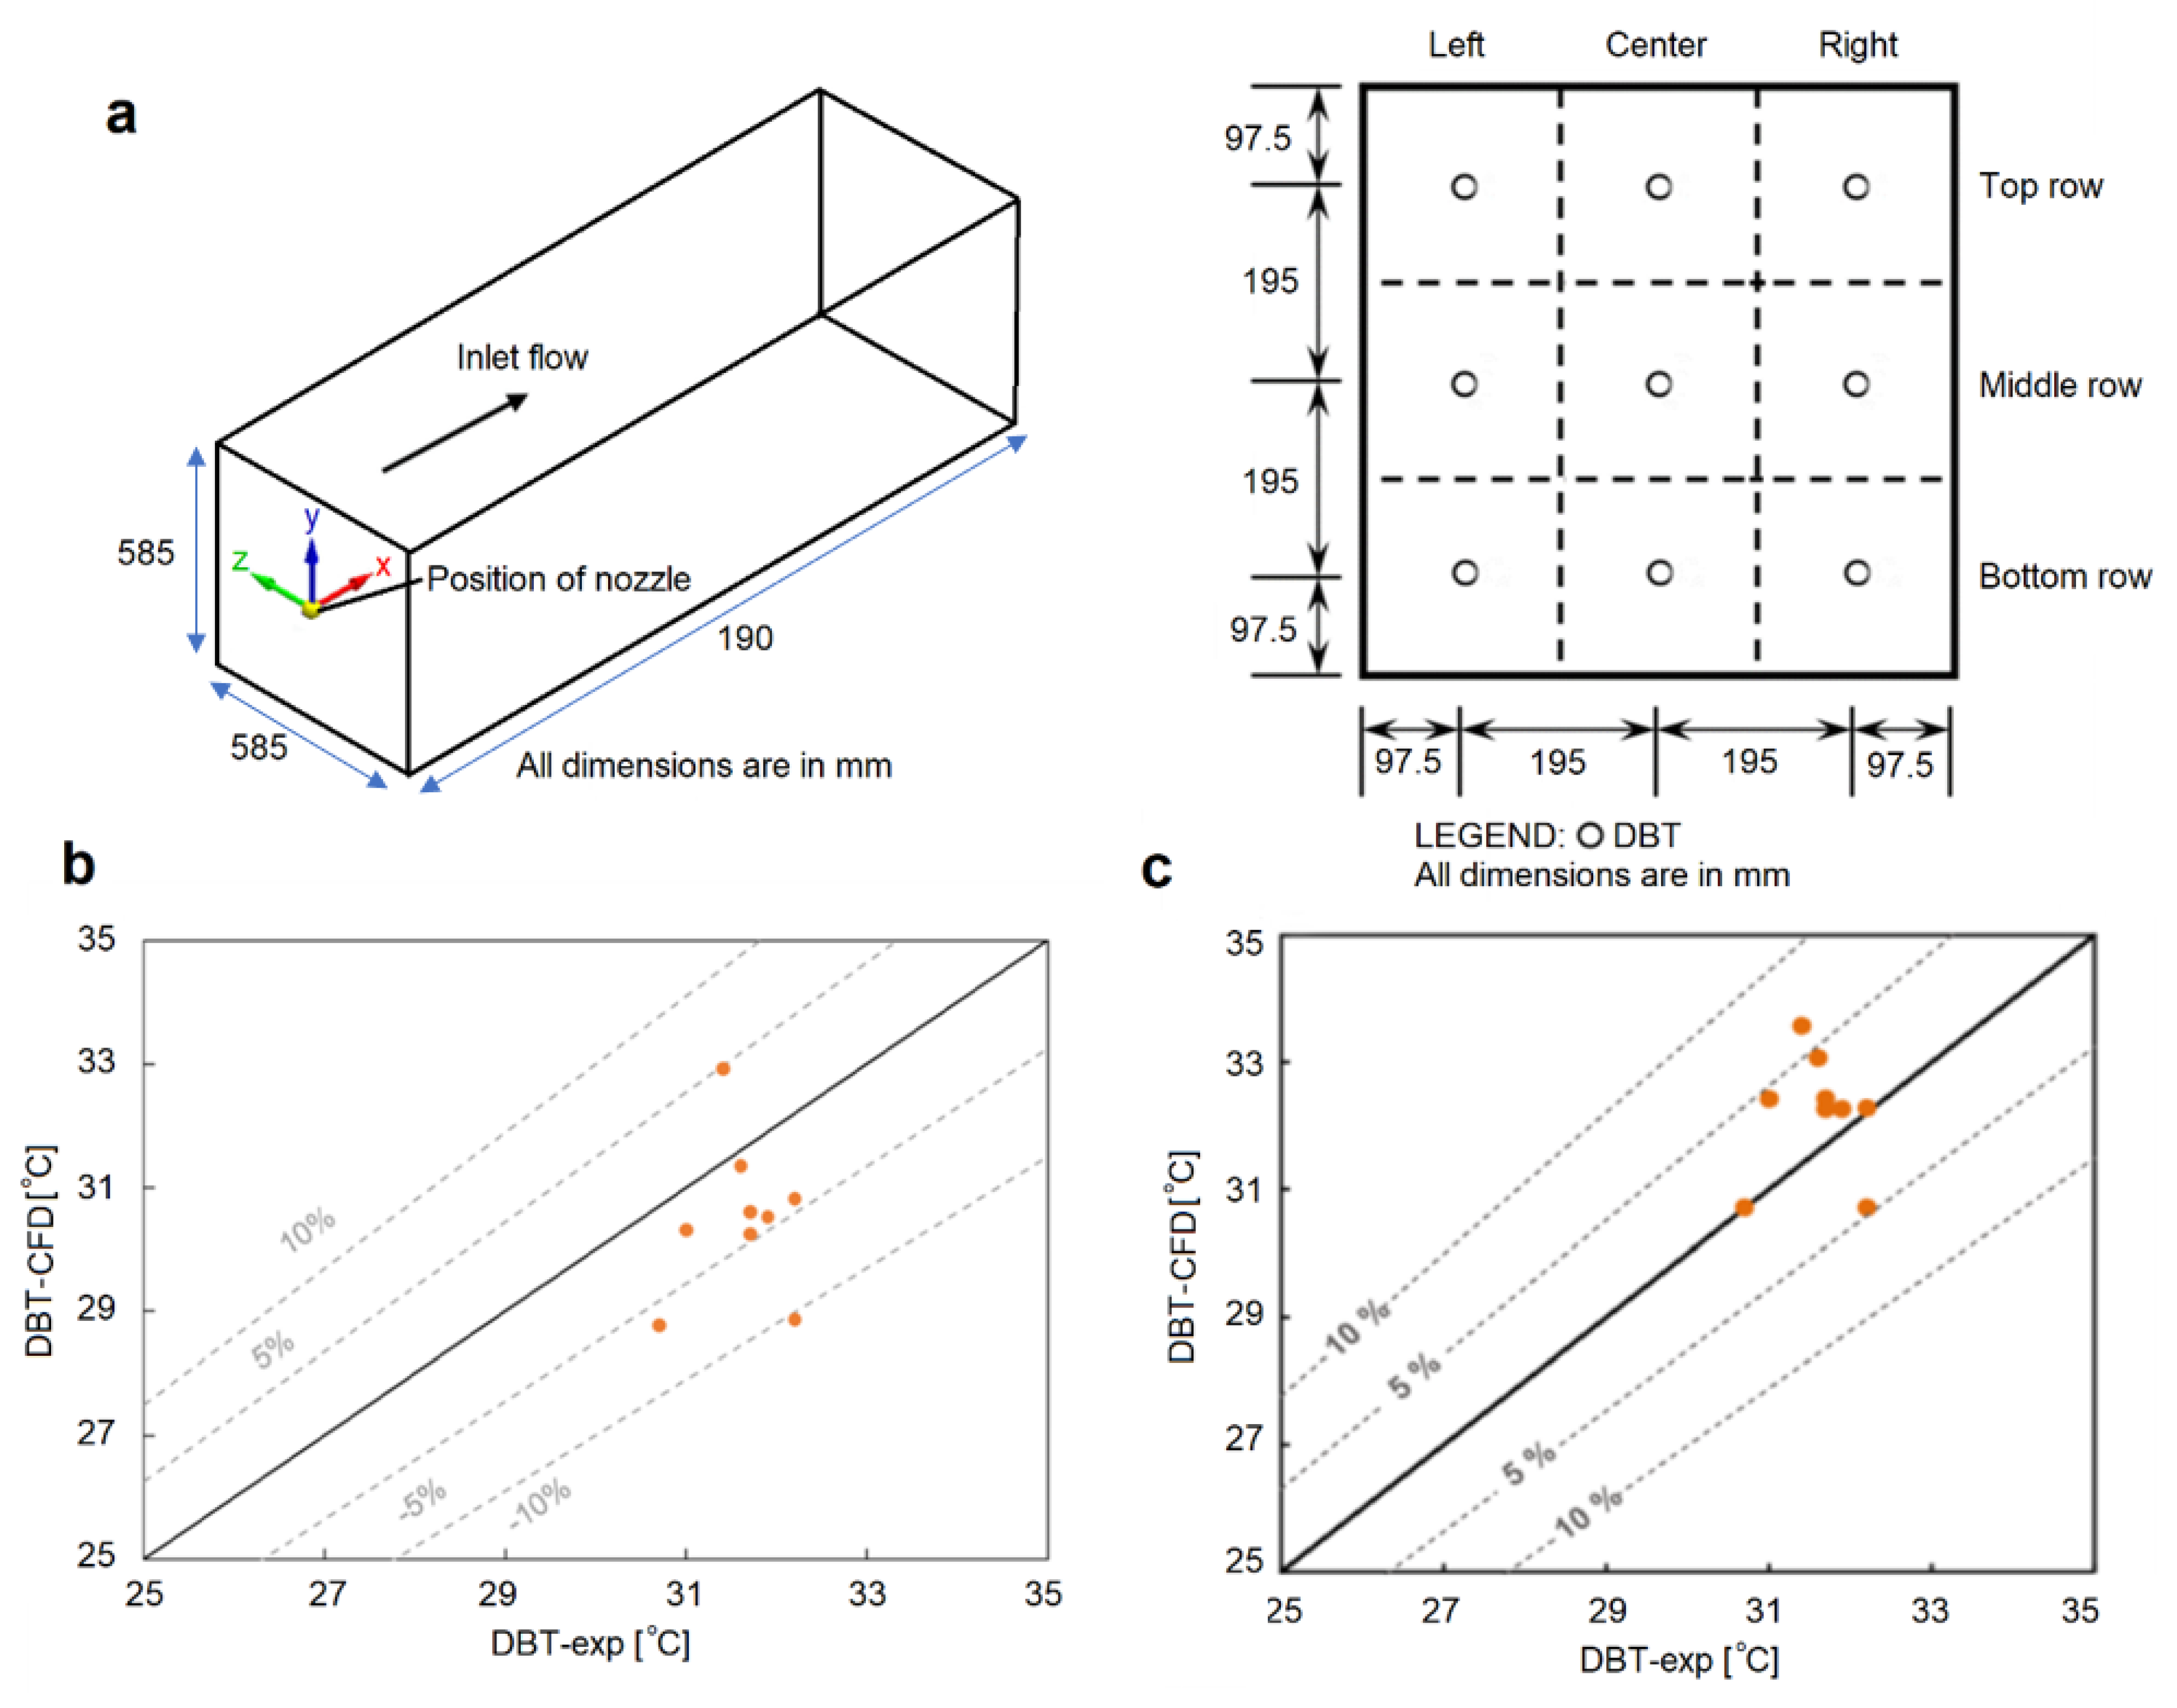
A validation for an individual water spray nozzle model was implemented based on the experimental measurements of Sureshkumar et al. [24] and the numerical results of Montazeri et al. [23]. The nozzle was tested in a computation domain of 0.585 m × 0.585 m × 1.9 m representing the wind-tunnel test section. The characteristics of droplets and the spray nozzle were defined the same as those used in the PDEC-WC model. A velocity probe with a hot bulb of tip diameter of 4 mm (Testo 452) installed upstream of the spray nozzle was used to measure the airstream velocity. The dry-bulb temperatures (DBTs) were measured at nine measurement points (at the centre of the 3 × 3 grids) using 18 thermocouples (two thermocouples per measurement point) at the outlet plane (Figure 9a) and compared with the experimental results from Sureshkumar et al. [24]. Figure 9b presents the error between the experimental measurements and the current CFD results. Figure 9b shows that the local maximum deviation was 10% and the deviations for most of the points were within 5%. The mean absolute error was calculated as 4.6%, which demonstrates a good agreement between the two methods. Additionally, the comparison graph plotted for the current study (Figure 9b) was compared with that in the previous work (Figure 9c). The local maximum deviation for the previous work was approximately 7%, and the errors for the remaining points are within 5%, which was similar to the results of the current work. However, the distribution of the data points was completely different between the two graphs. Our CFD model generally underestimates the temperature values (Figure 9b).

4.3. Impact of Crops on Airflow Characteristics

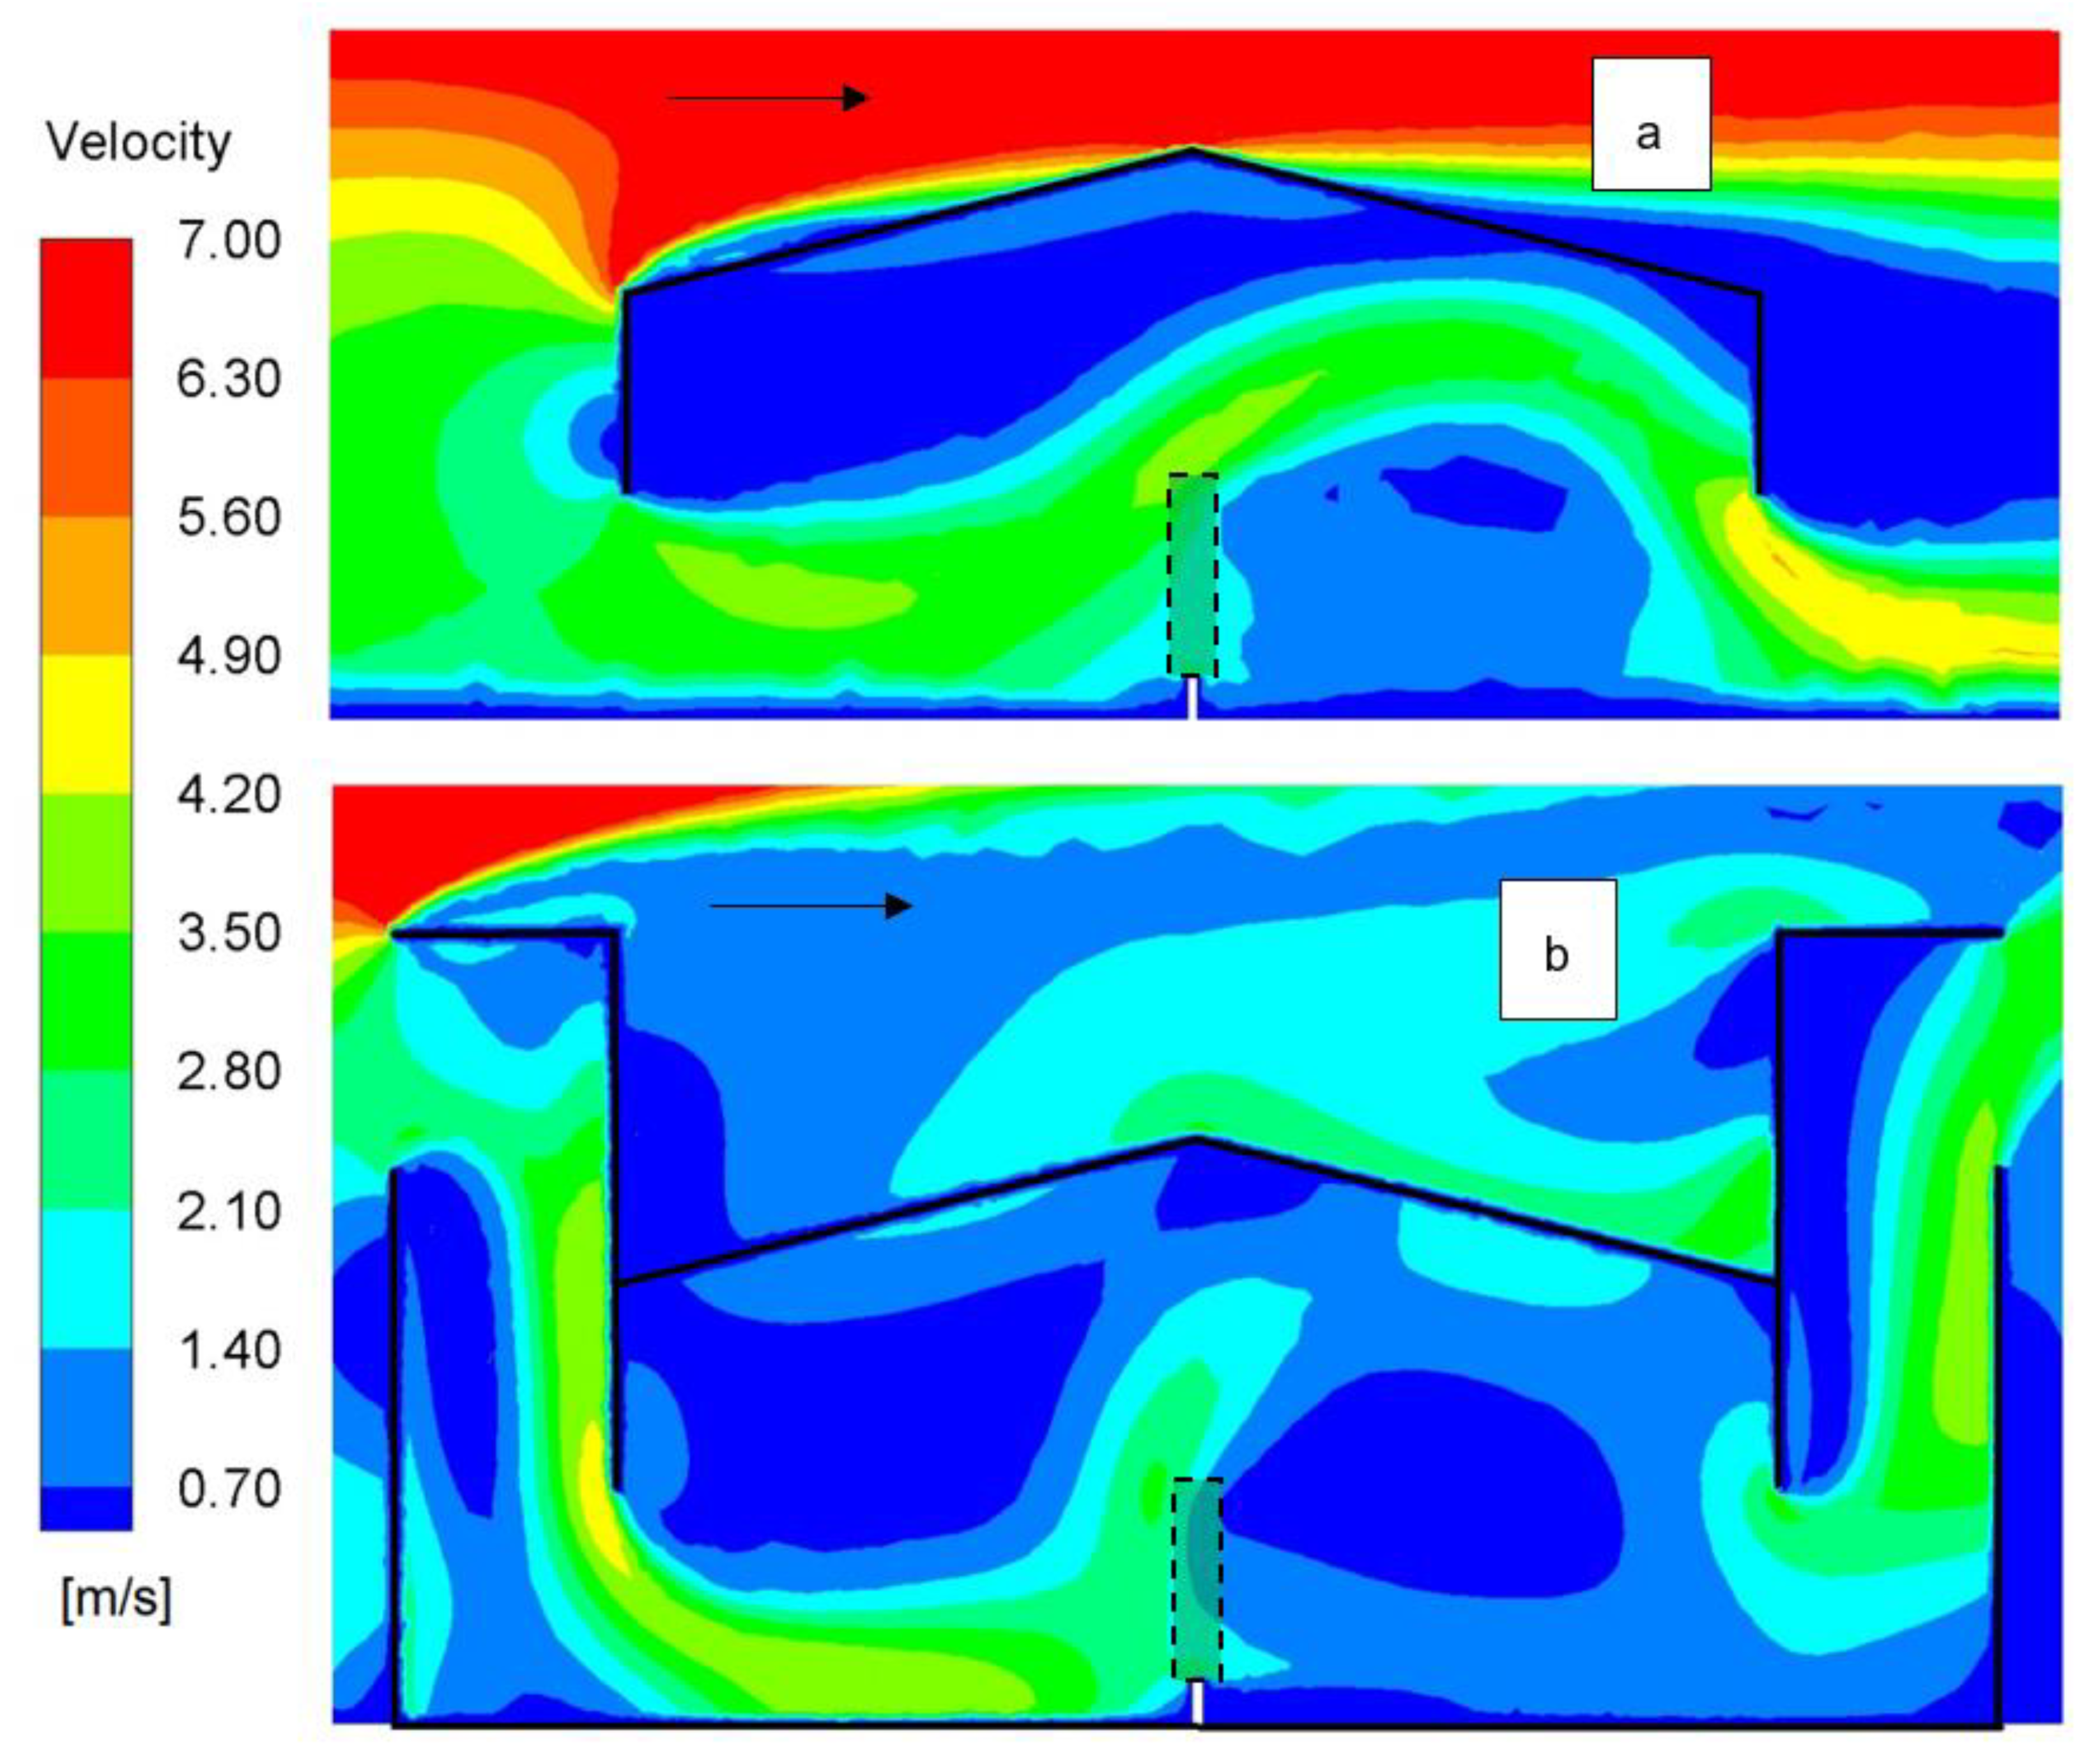
To study the impact of vegetation in the greenhouse on the airflow distribution and the vegetation’s obstructive effect on the airflow, a single row of plants was simulated in the centre of the greenhouse model. Like any other ventilation strategy, it is important to assess if any blockage in the flow path (in this case, crops) will impede the airflow into the space. The height of the vegetation was 1.6 m; the length, 12 m; and the width, 0.4 m [22]. The crop was modelled as a porous region, and the method is fully detailed in [22]. The row of simulated plants was placed parallel to the windward and leeward walls of the greenhouse and normal to the wind direction. Figure 10 compares the air velocity contours at the midplane of the greenhouse with the vegetation model and with crossflow ventilation and with windcatchers.
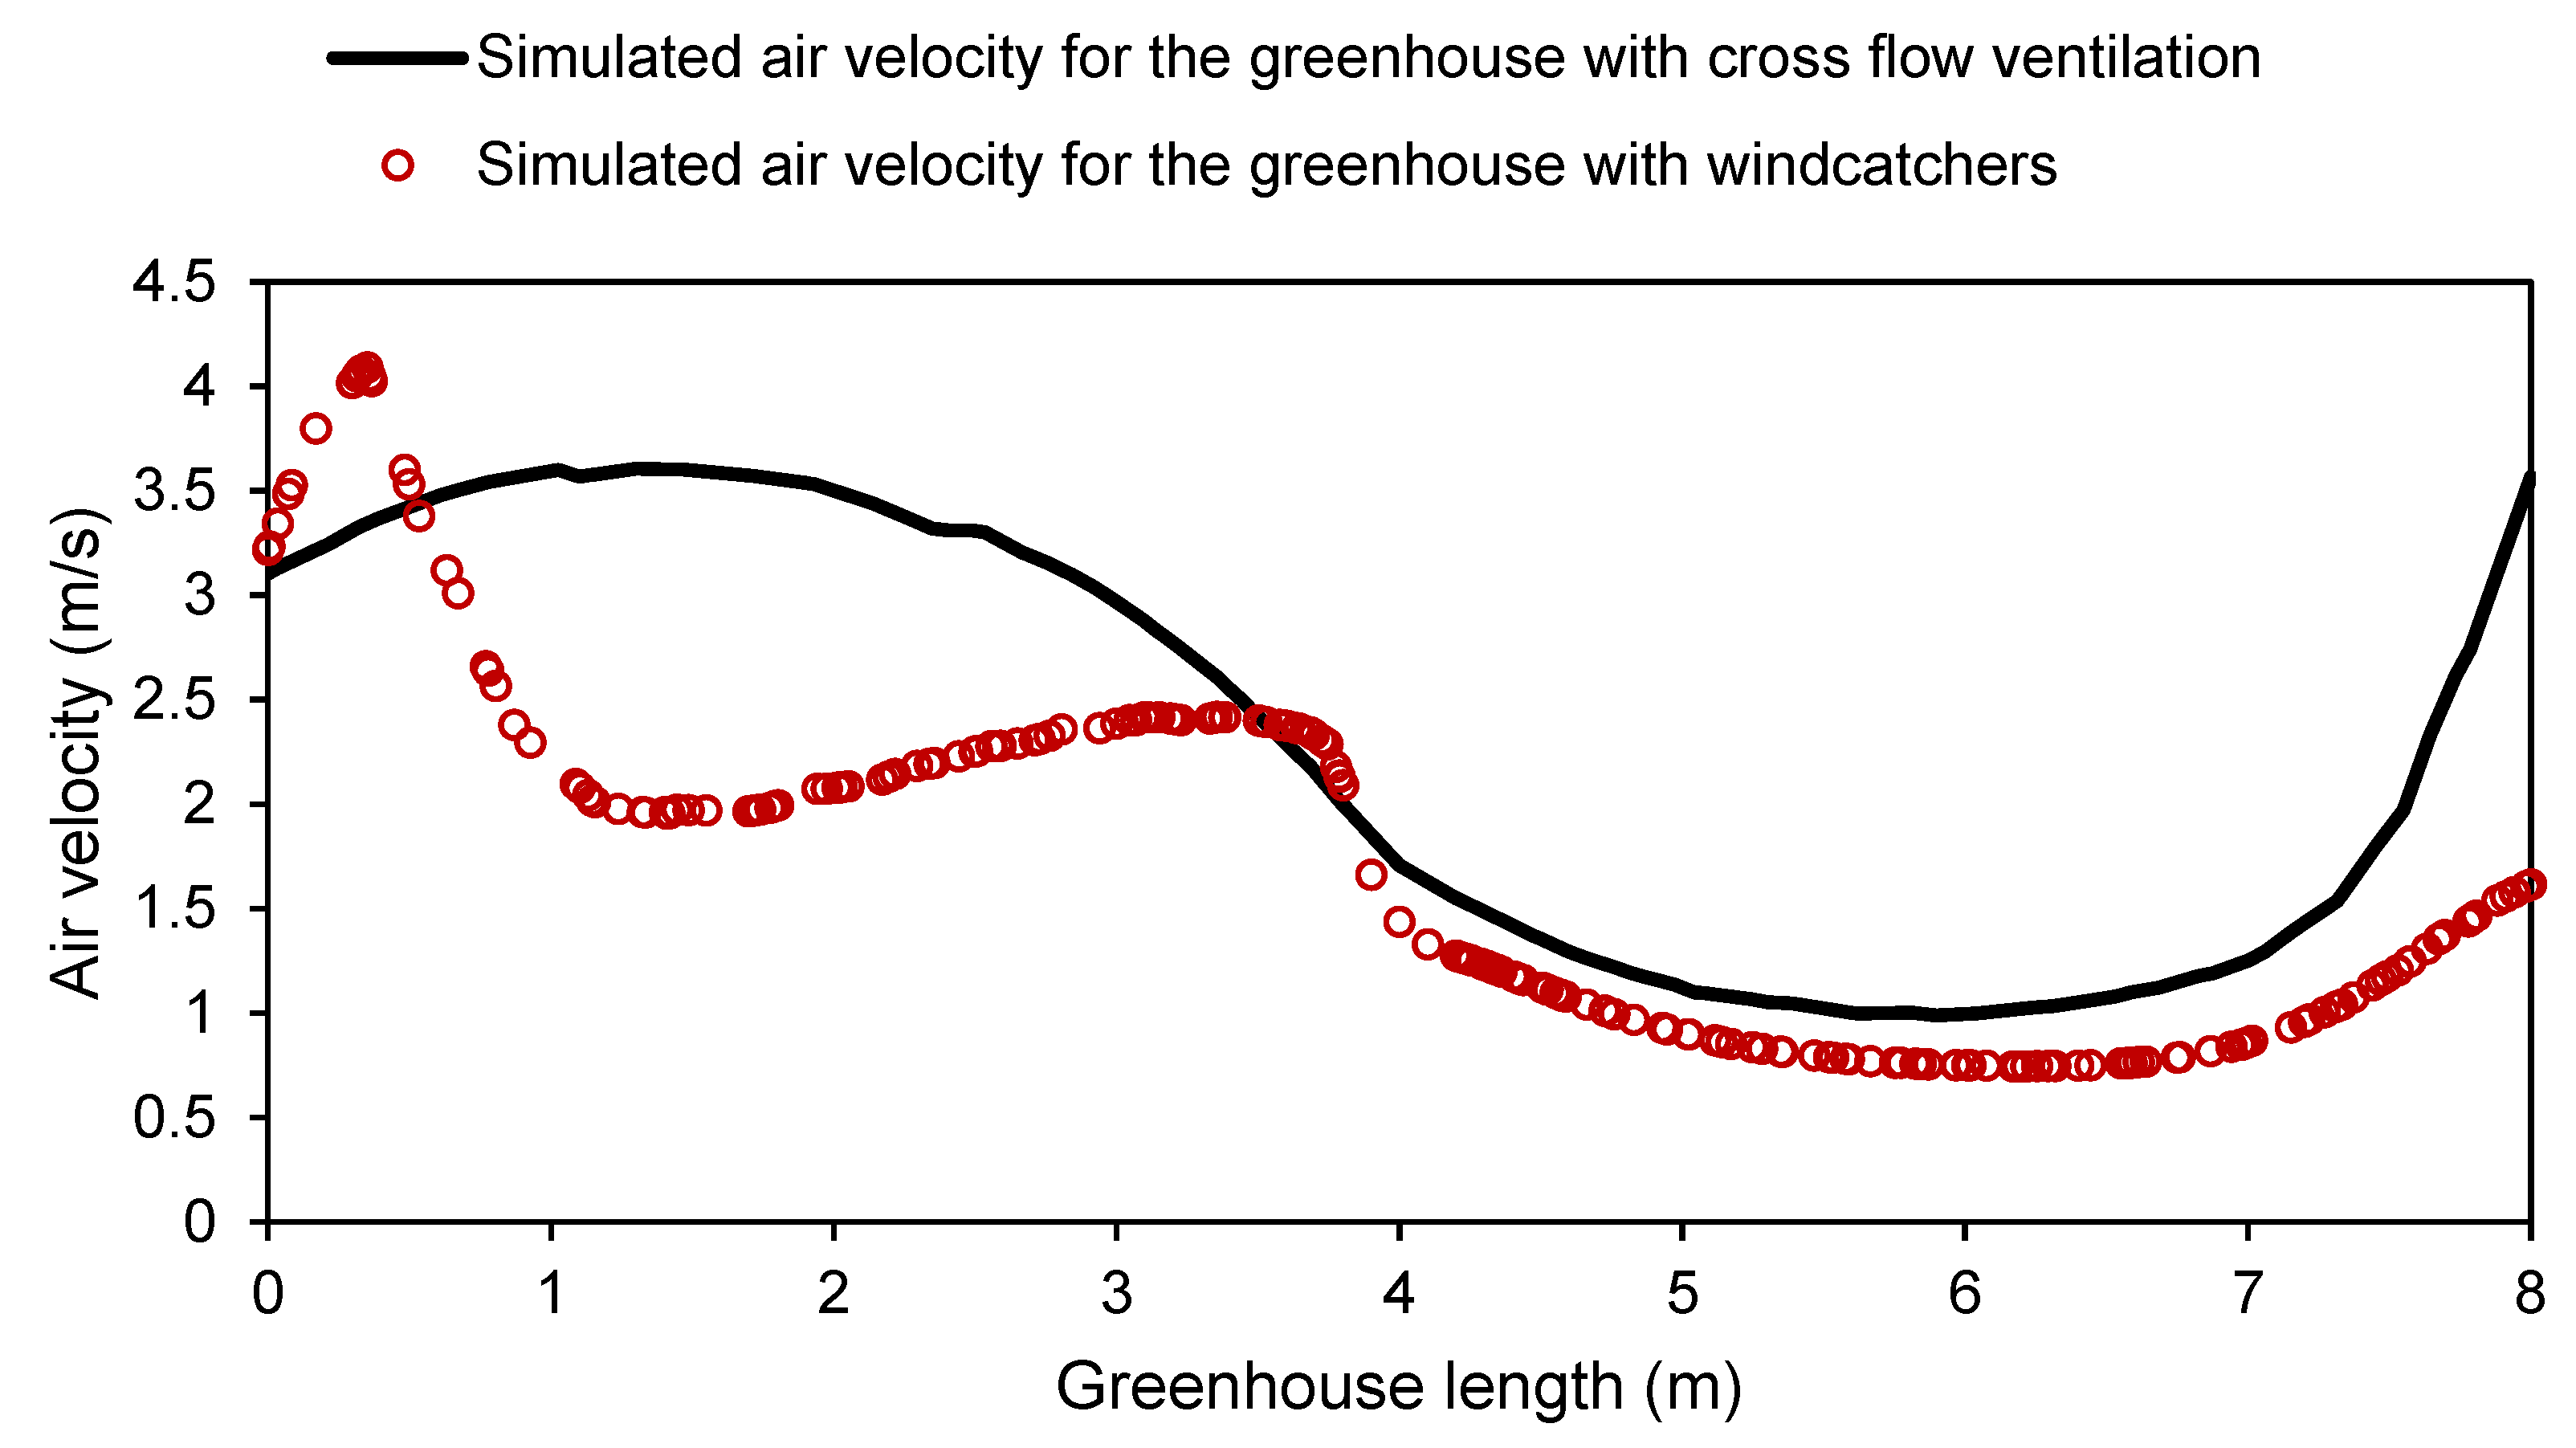
Simulating vegetation in the greenhouse led to a reduction in air velocity downstream from the vegetation, and the airflow was deflected upwards above the vegetation. It can also be observed that the addition of the vegetation did not completely impede the air supply rate into the greenhouse with cross-flow and windcatcher ventilation. The air velocity downstream from the vegetation dropped to 0–1.5 m/s and gradually increased as it approached the leeward opening due to the leeward suction pressure (Figure 11). Based on the study of [22], the addition of more vegetation, i.e., adding three rows of vegetation, can reduce the ventilation rate by up to 62% of that of a greenhouse without vegetation. Hence, future work should focus on evaluating the influence of different arrangements of vegetation on the ventilation performance of the PDEC-WC. It should be noted that we only assessed the influence of vegetation in this section and we did not include the vegetation in the greenhouse models presented in the following sections.

4.4. Impact of Outdoor Air Temperature

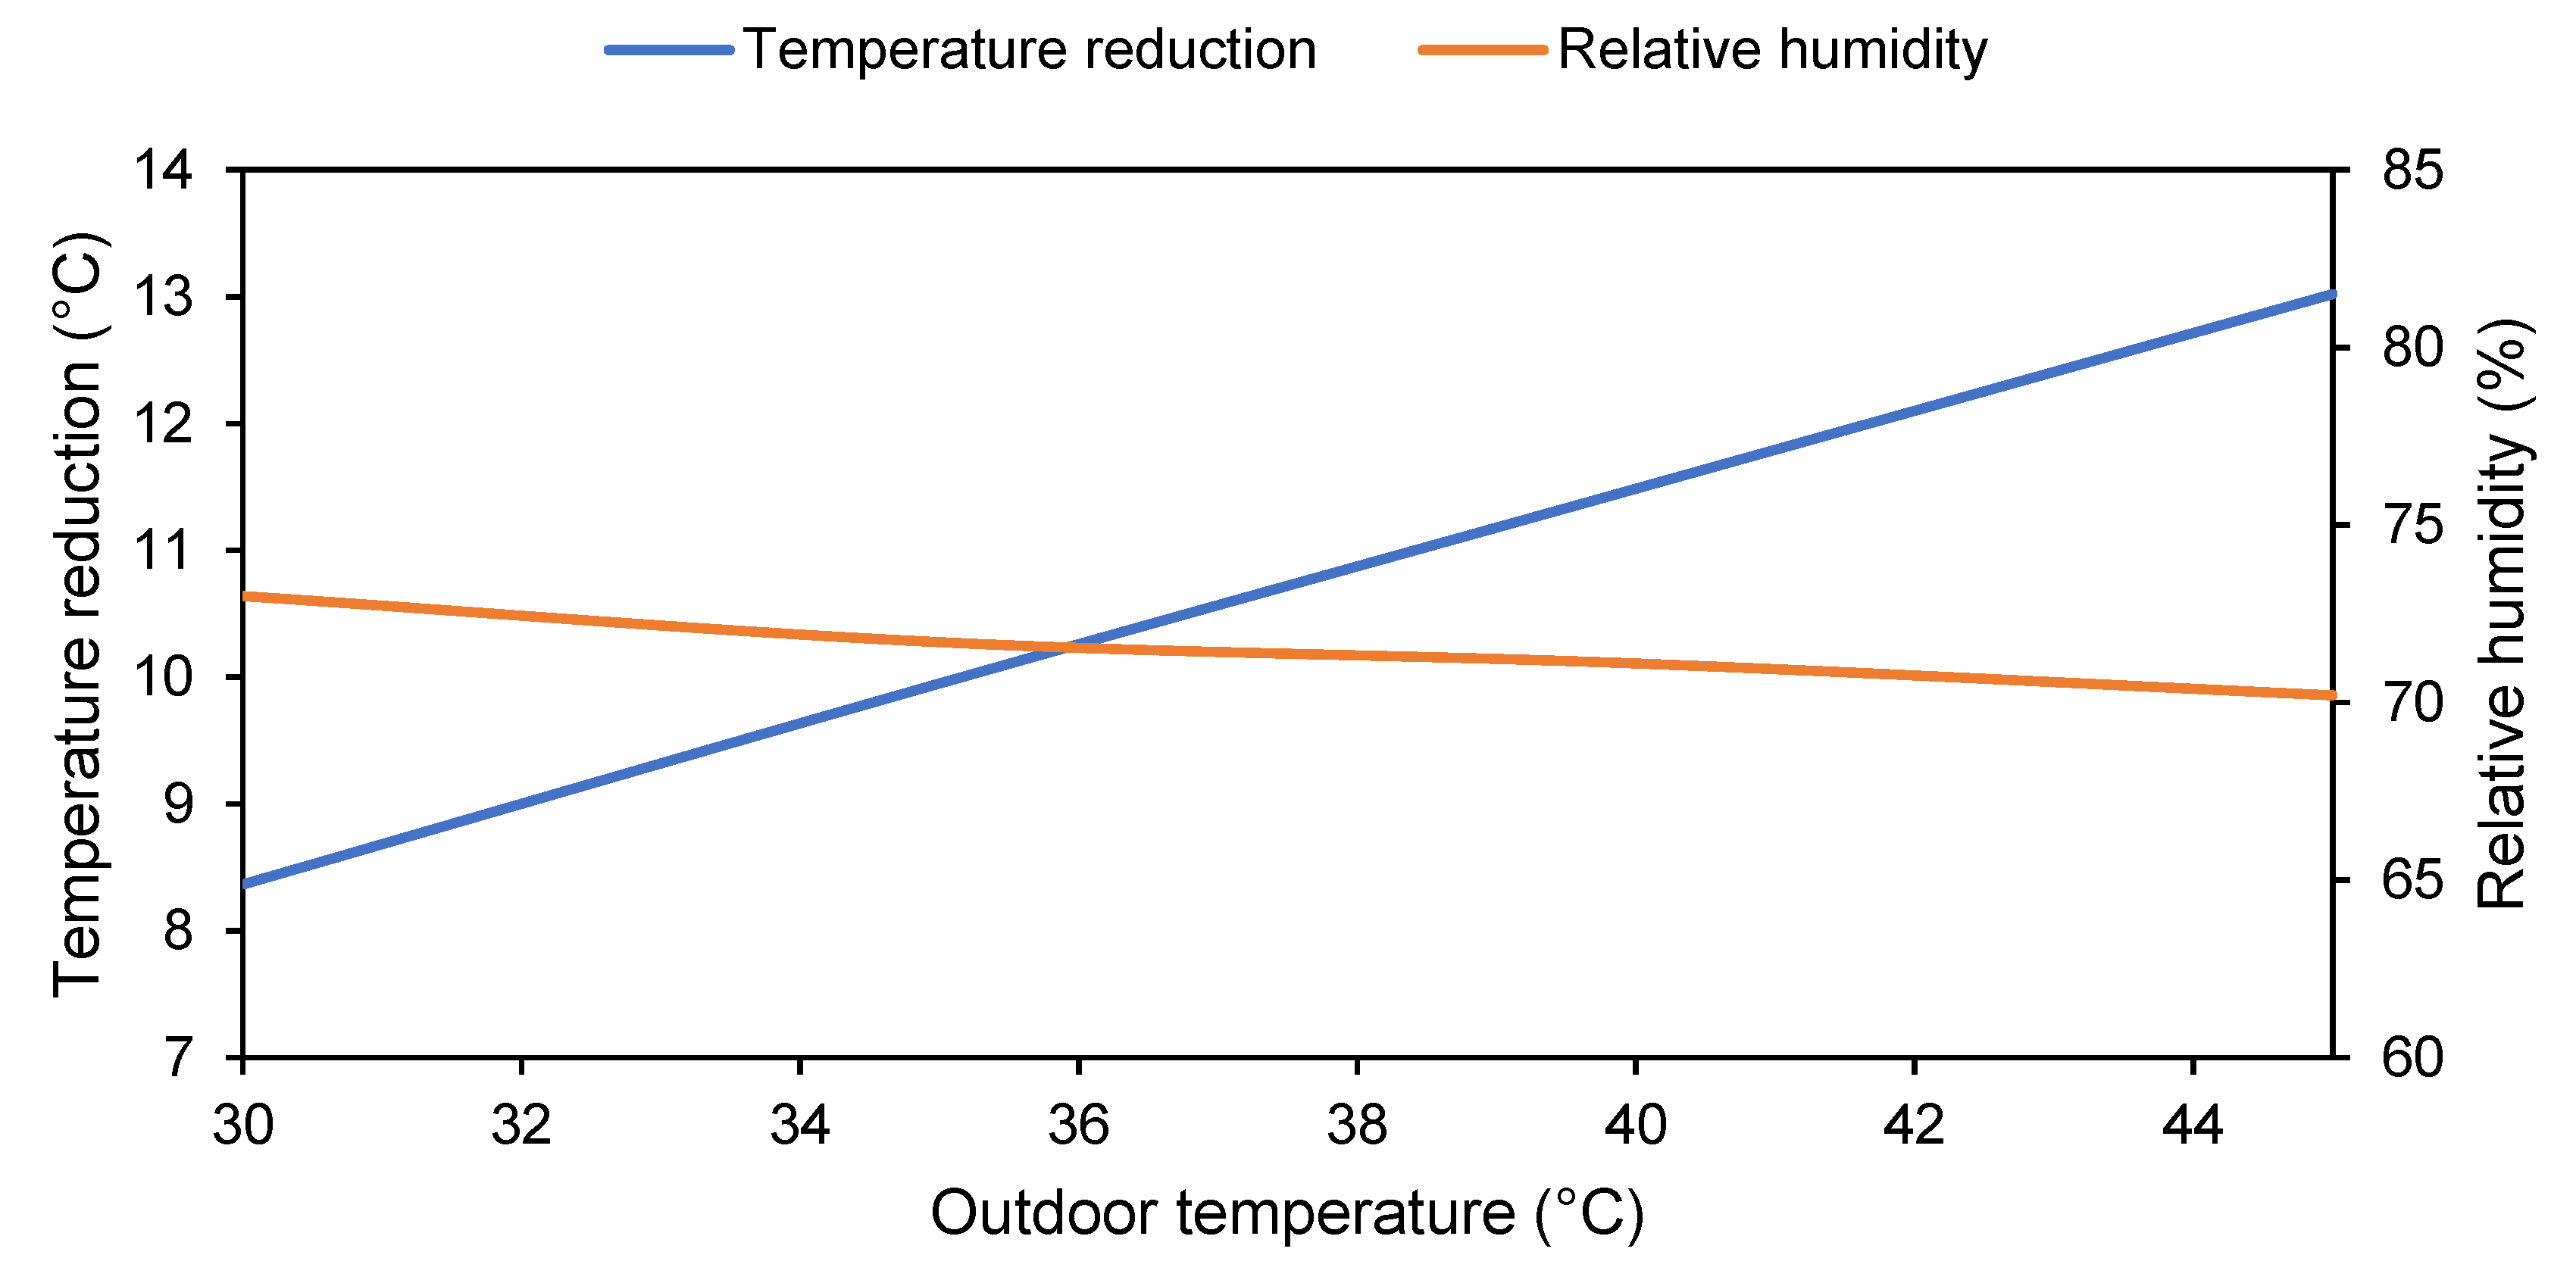
Figure 12 shows the influence of the variation of the ambient temperature (30–45 °C) on the average temperature reduction and relative humidity in the greenhouse when the outdoor relative humidity was maintained at 24.5% and the wind velocity, at 4.4 m/s at windcatcher roof height. The mass flow rate and temperature of the water spray streams for each spray nozzle (eight nozzles) were 12.5 l / min and 35.2 °C. As shown in Figure 12, the temperature reduction achieved by the greenhouse with PDEC-WC increases with ambient air temperature. At 45 °C, a maximum temperature reduction of 13 °C was achieved. This is expected for direct evaporative cooling as hot and dry air has a greater heat transfer potential. This is one of the advantages of evaporative coolers over mechanical cooling systems since the mechanical cooling performance decreases when the ambient temperature increases. The greenhouse relative humidity slightly decreased from 73% to 70% as the ambient air temperature increased from 30 to 45 °C. The greenhouse average temperature and relative humidity were calculated at a height of z = 0.8 m, which corresponds to half of the height of the crop canopy.

4.5. Impact of Outdoor Relative Humidity

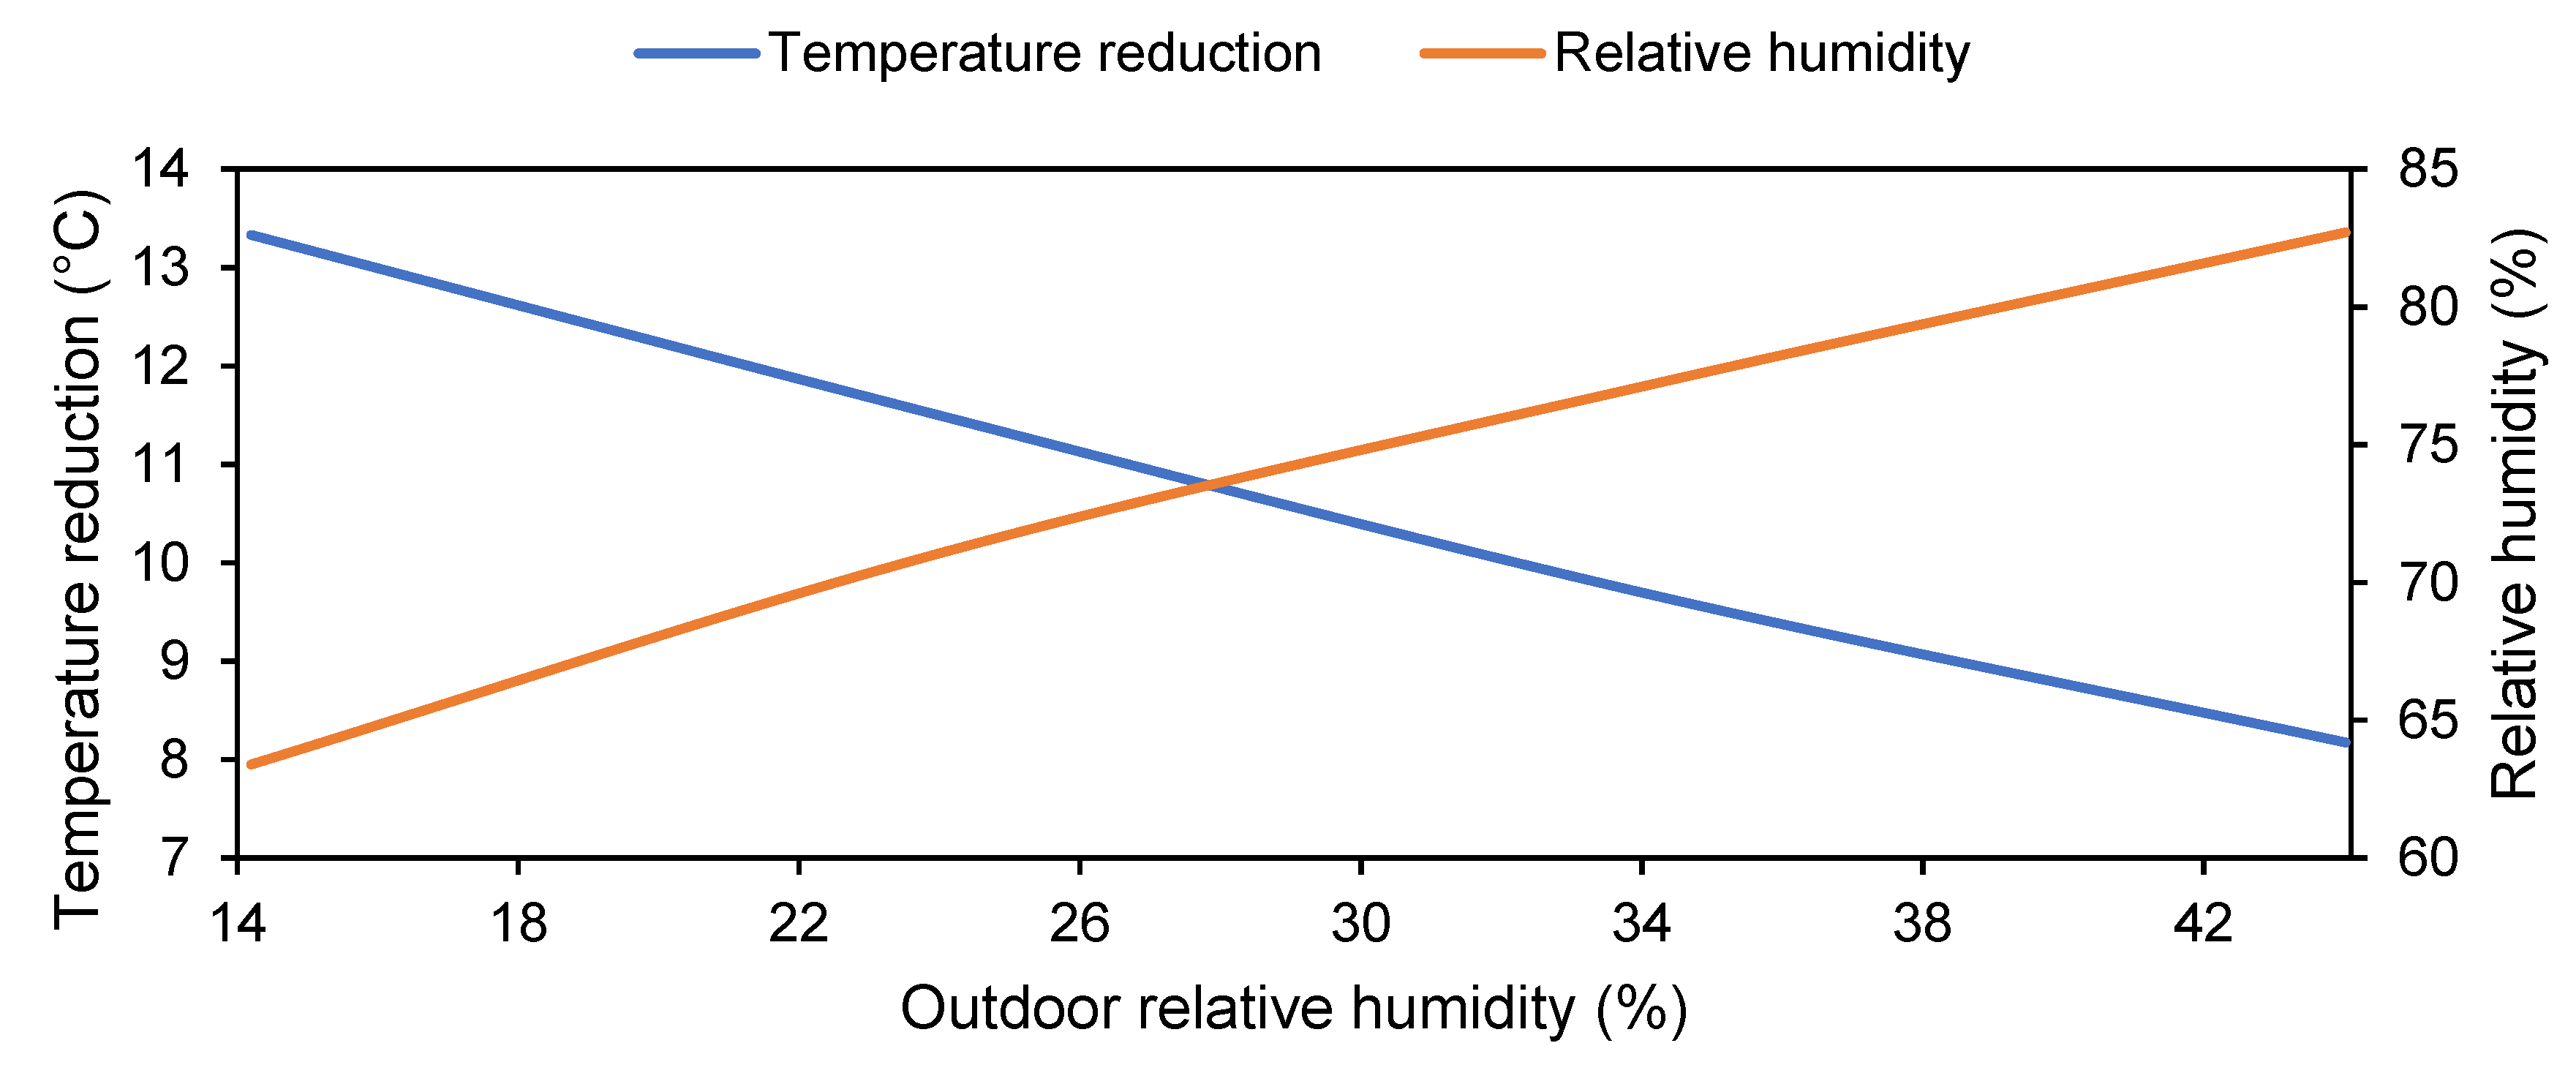
Figure 13 shows the impact of the variation of the outdoor relative humidity (14.6–44.4%) on the average temperature reduction and relative humidity in the greenhouse when the outdoor air temperature was maintained at 40 °C and the wind velocity, at 4.4 m/s at windcatcher roof height. The mass flow rate and temperature of the water spray streams for each spray nozzle (eight nozzles) were 12.5 l / min and 35.2 °C. As can be seen, the performance of the evaporative spray cooler decreases as the ambient air relative humidity increases. This is expected for direct evaporative cooling as dryer air has a greater moisture absorption potential. Therefore, it is recommended to operate the PDEC-WC system at outdoor relative humidity levels of less than 50% [27]. The maximum predicted temperature reduction (13.3 °C) was obtained at the lowest simulated outdoor relative humidity (14.6%). Meanwhile, the greenhouse relative humidity increased by up to 20% as the outdoor relative humidity increased from 14.6% to 44.4%.

4.6. Impact of Inlet Nozzle Gauge Pressure

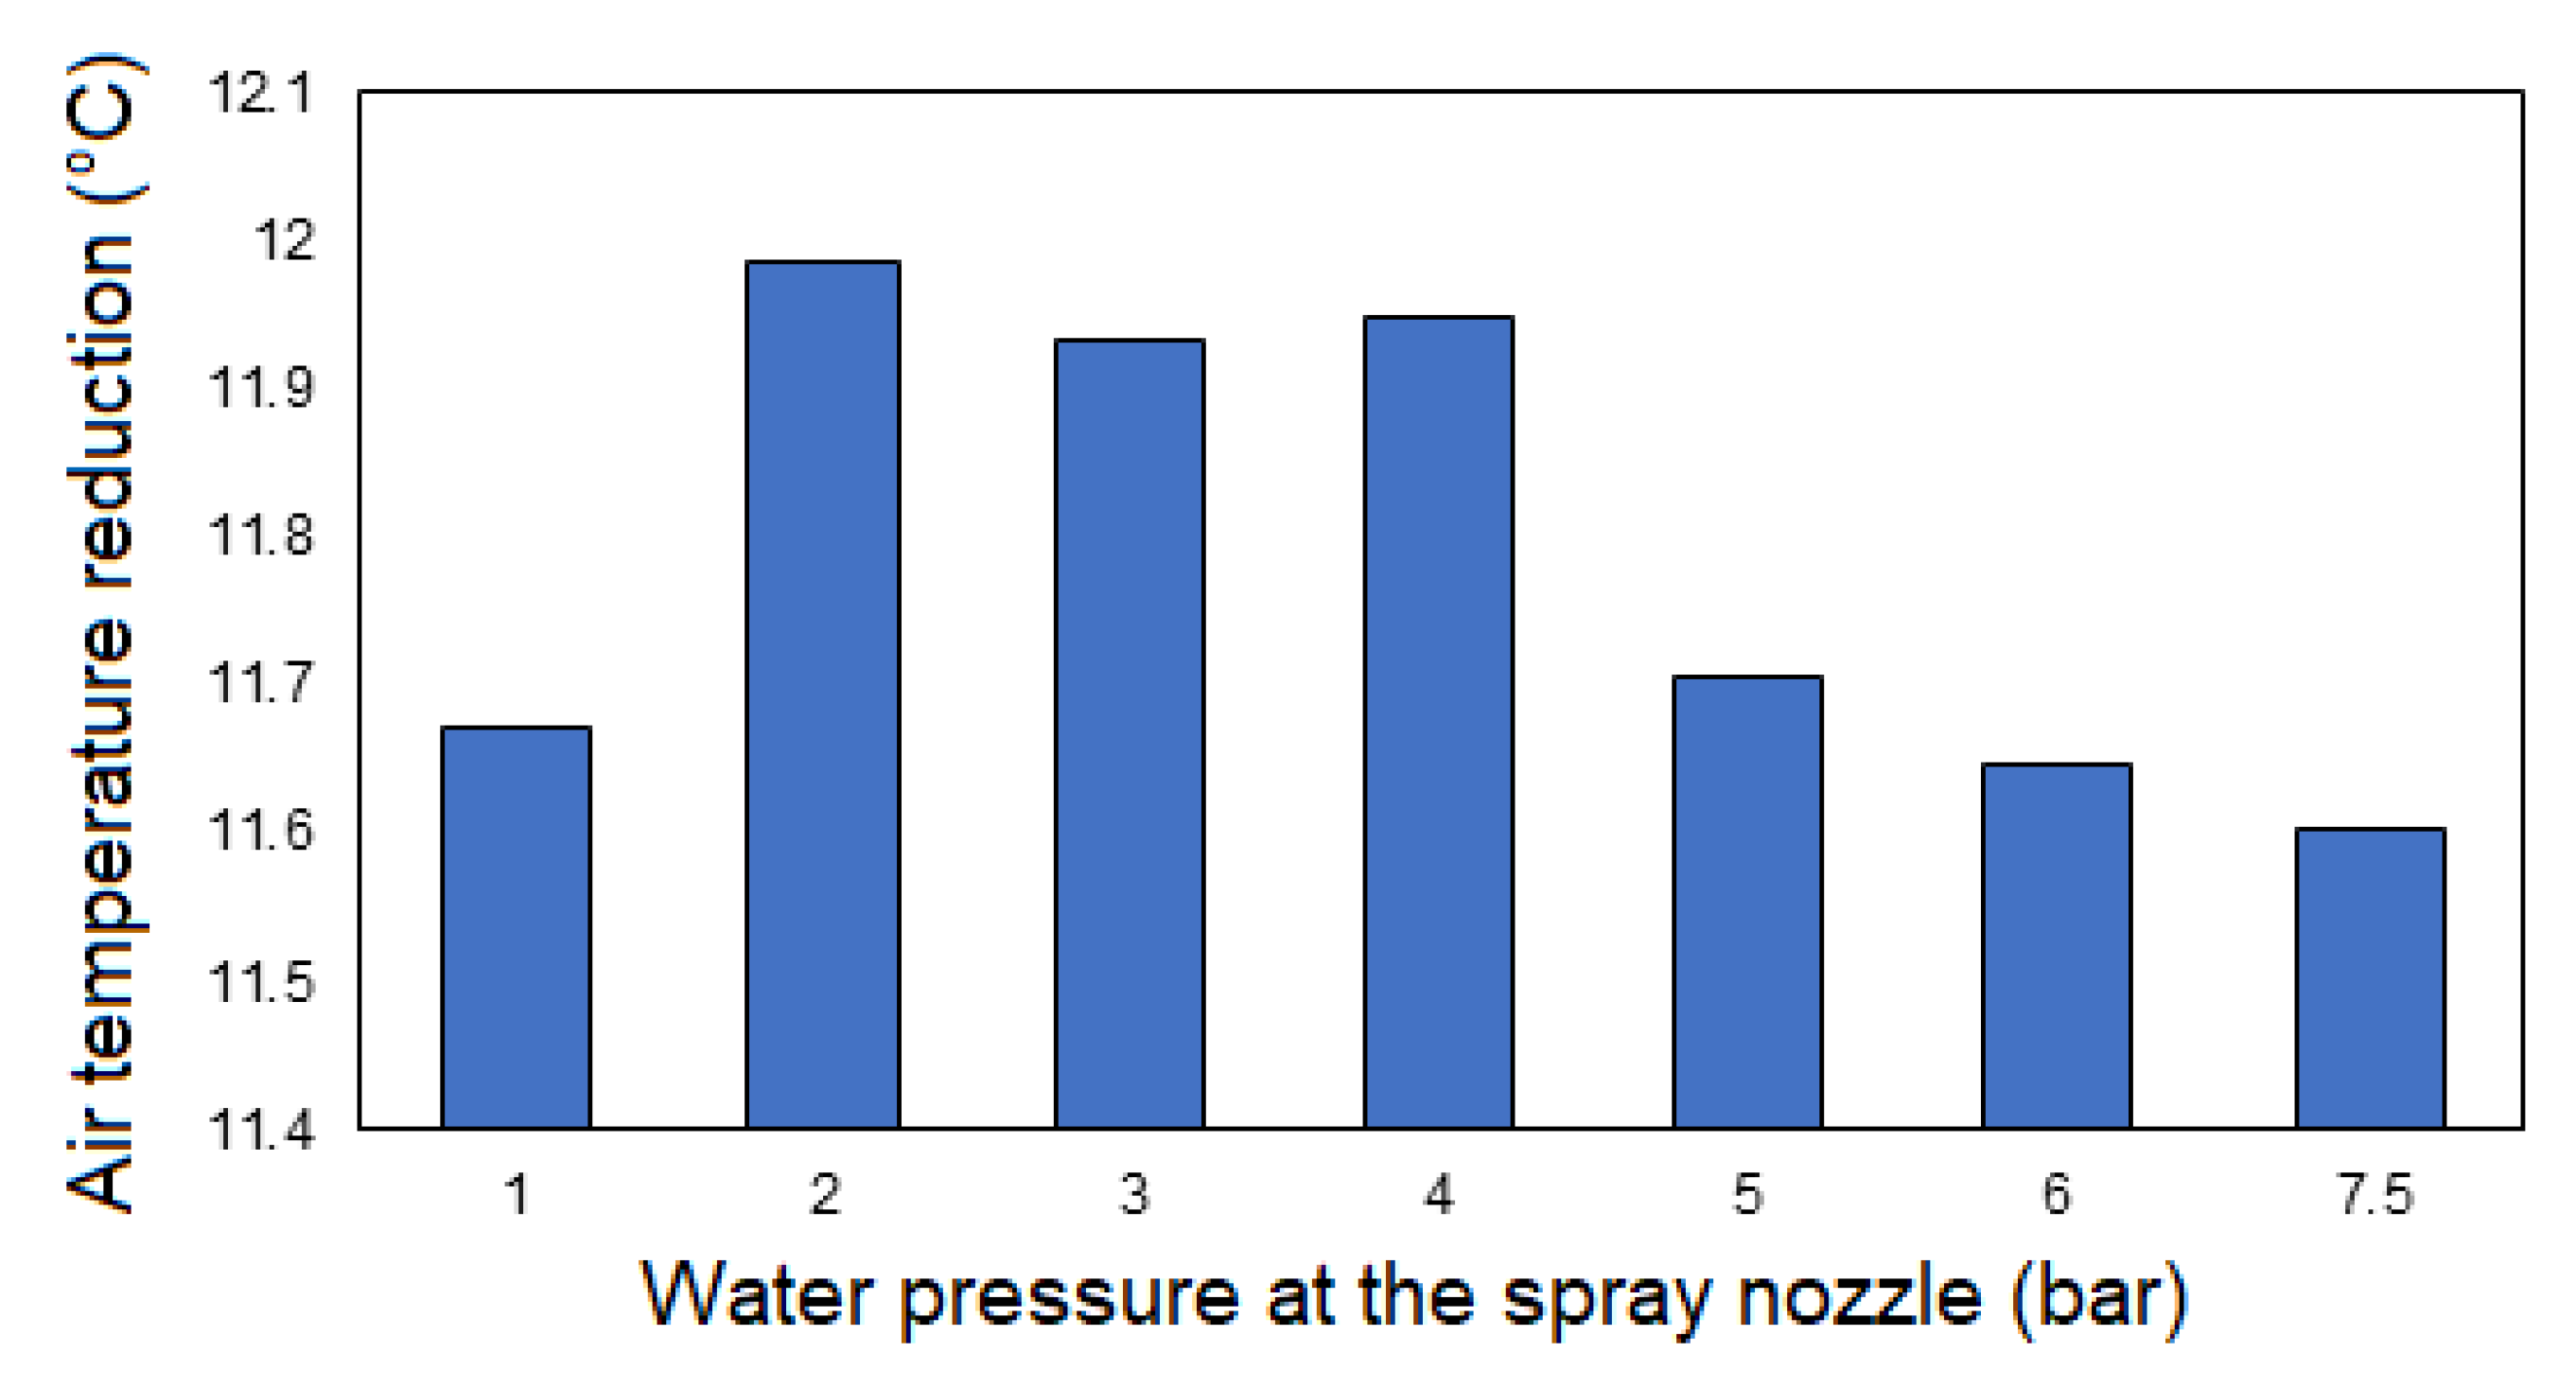
The PDEC-WC system nozzles were supplied individually with pressurized water from a pump system and water tank. The spray nozzles help distribute water into the incoming supply airflow of the PDEC-WC, resulting in a large contact surface area between the water and air, which improves evaporation by producing very small droplets. The size of the droplets produced was influenced by several parameters including the type of the nozzle and the liquid pressure. Figure 14 shows the impact of the inlet nozzle gauge pressure from 1 bar (12.73 m/s) to 7.5 bar (35 m/s) on the reduction of the average air temperature inside the greenhouse. The simulations were carried out with an ambient temperature of 40 °C and relative humidity of 24.5% with a wind velocity of 4.4 m/s at windcatcher roof height. The mass flow rate and temperature of the water spray streams for each spray nozzle (eight nozzles) were 12.5 l / min and 35.2 °C. As observed, increasing the inlet nozzle pressure from 1 bar up to 5 bars resulted in slightly higher cooling, which was similar to the observations by Montazeri et al. [23]; however, a drop in cooling was observed after increasing the nozzle pressure more than 4 bars. Although increasing the water pressure was advantageous, an optimum balance between cooling performance and pumping power requirement is essential when designing a water spray-based evaporative cooling system. Figure 14 shows there was no advantage of increasing the water pressure beyond 2 bar.

4.7. Impact of the Height of Nozzles

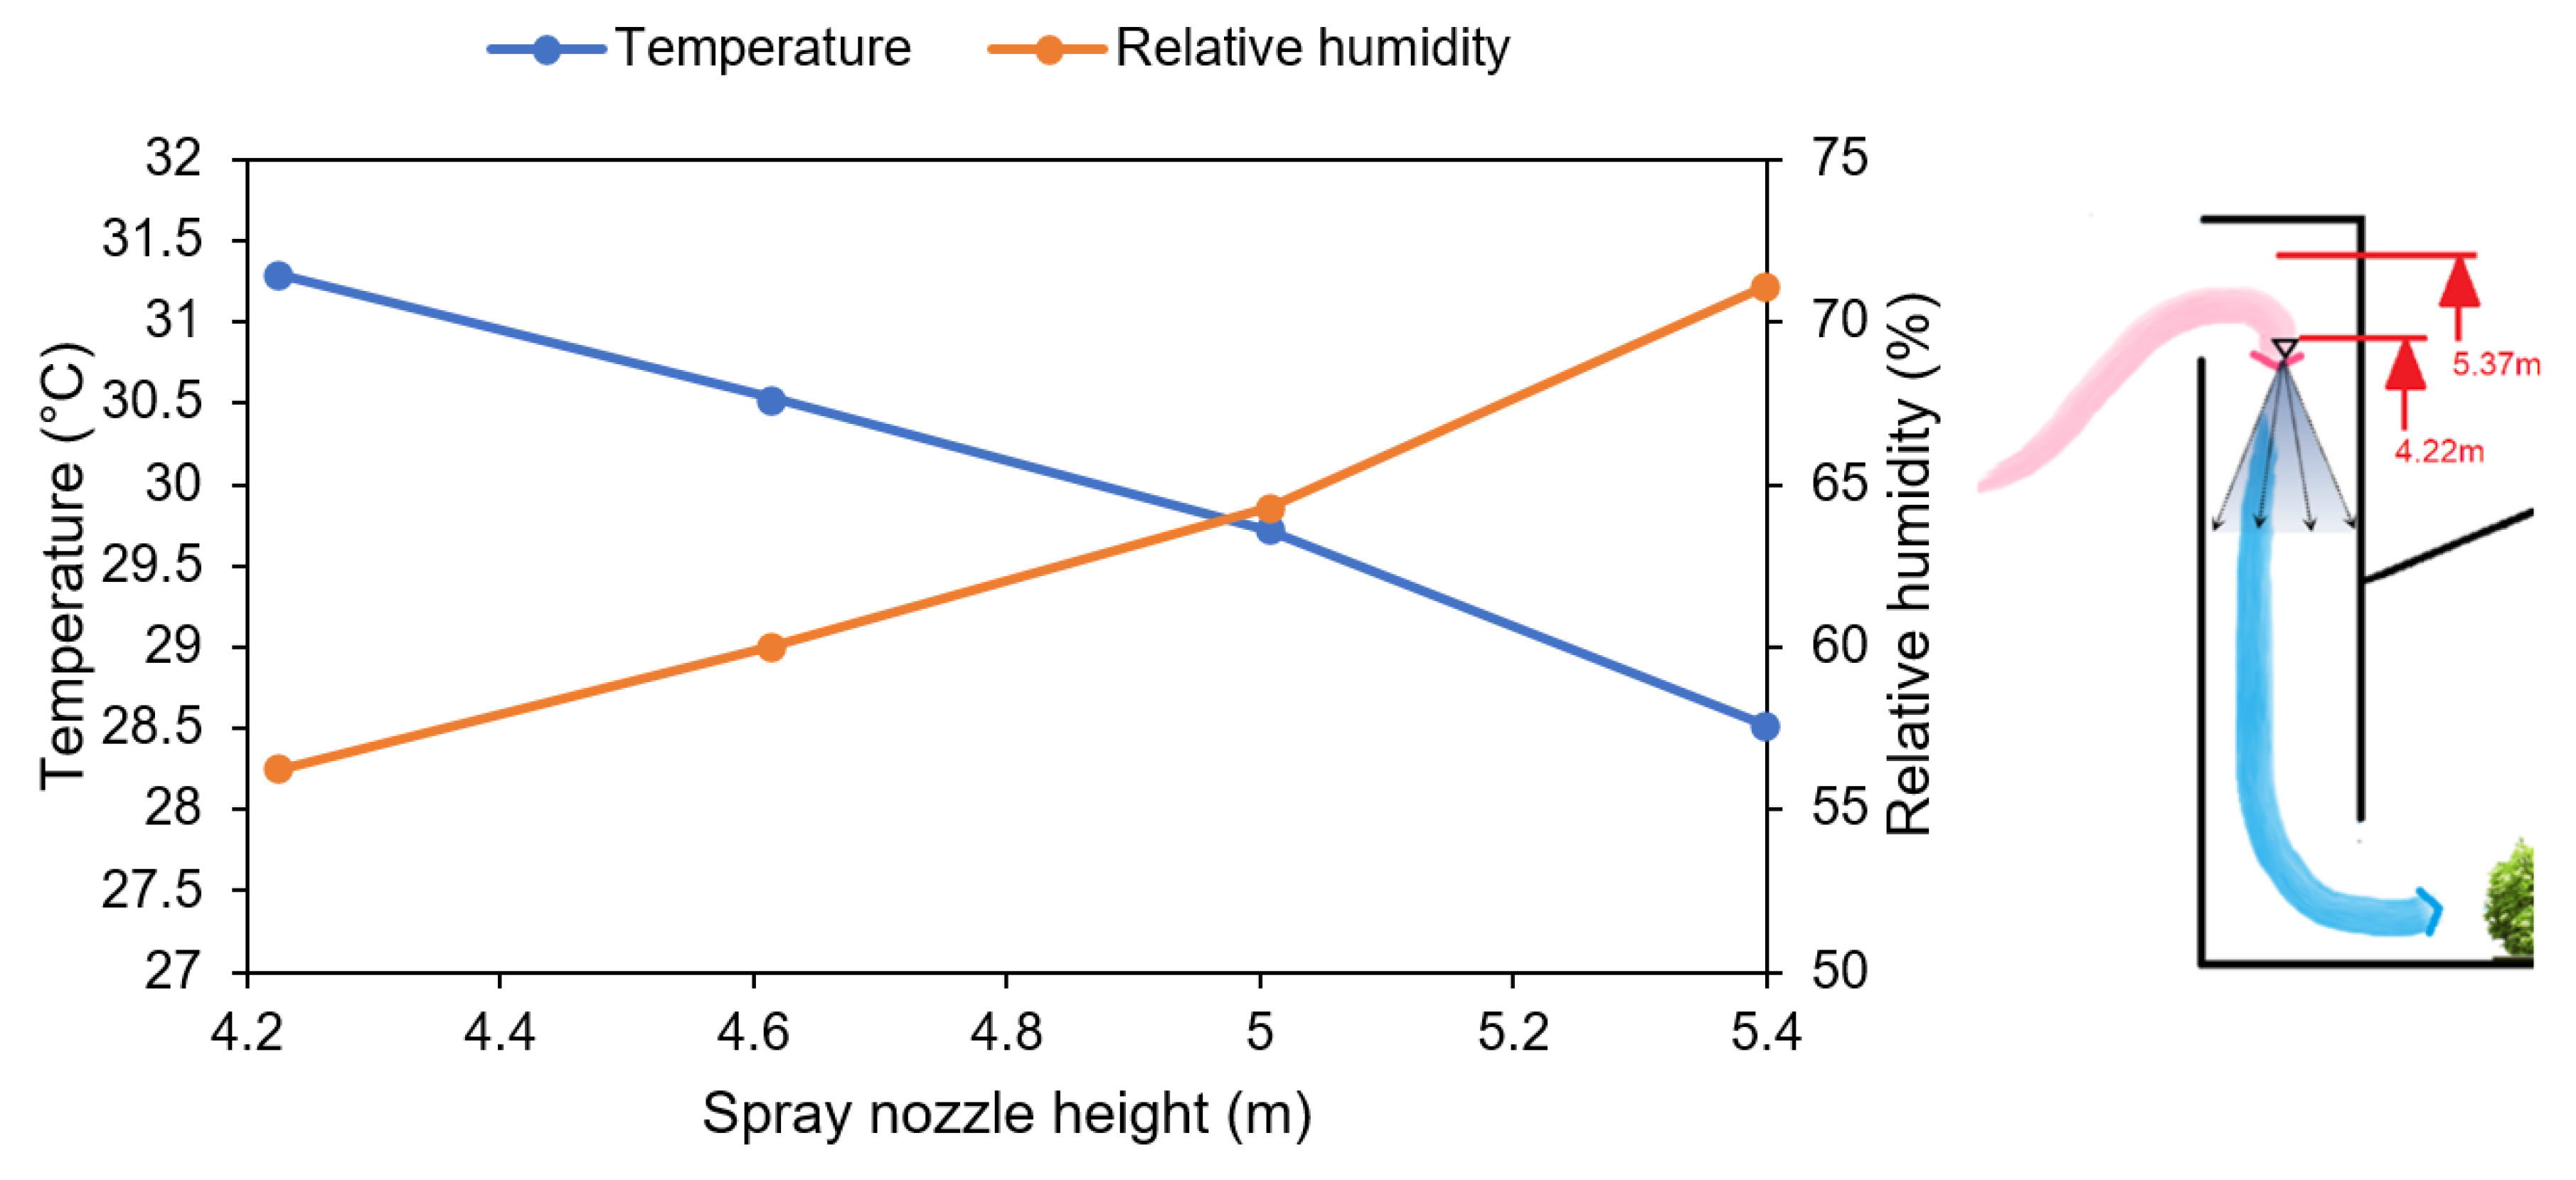
The height of the tower and the opening of windcatchers can significantly influence its ventilation performance. Traditionally, the height and structure of windcatchers are influenced by the climate of the region that it is used in. In general, higher windcatcher openings will be beneficial, especially if the building that is being ventilated is surrounded by neighbouring structures or situated in urban areas. Hence, for a windcatcher with PDEC, another parameter that should be considered is the height of the spray nozzles inside the tower to assess the influence on the thermal performance. It should be noted that due to the observed airflow patterns within the supply windcatcher channel (see Figure 10b), which showed that there is a large recirculation flow (low airflow speed) in the lower-left section of the windcatcher channel, we decided to locate the nozzles in the upper section to avoid the recirculation region. Figure 15 shows the impact of the variation of the spray nozzle height on the average temperature reduction and relative humidity in the greenhouse when the outdoor air temperature was maintained at 40 °C; the relative humidity, at 24.5%; and the wind velocity, at 4.4 m/s at windcatcher roof height. It should be noted that the height of the windcatcher was maintained in this study and only the position of the nozzle was varied. The mass flow rate and temperature of the water spray streams for each spray nozzle (eight nozzles) were 12.5 l / min and 35.2 °C, respectively. As observed, increasing the nozzle height produced increased cooling and moisture addition. As the spray nozzle height increases, the distance between the water spray nozzle and greenhouse supply opening increases, which leads to increased heat transfer between the water and air. This parameter can help improve the achieved cooling and minimise the incomplete evaporation of the droplets. The maximum temperature drop (11.5 °C) was obtained with a spray nozzle height of 5.37 m. Similarly, the longer contact time between water and air caused more mass transfer between the water and air. The greenhouse relative humidity increased by 15% as the spray nozzle height was increased by 1.15 m. Similarly, increasing the height of the spray nozzle was advantageous; however, a balance between cooling performance and pumping power requirements was also essential.

4.8. Impact of the Layout of Nozzles

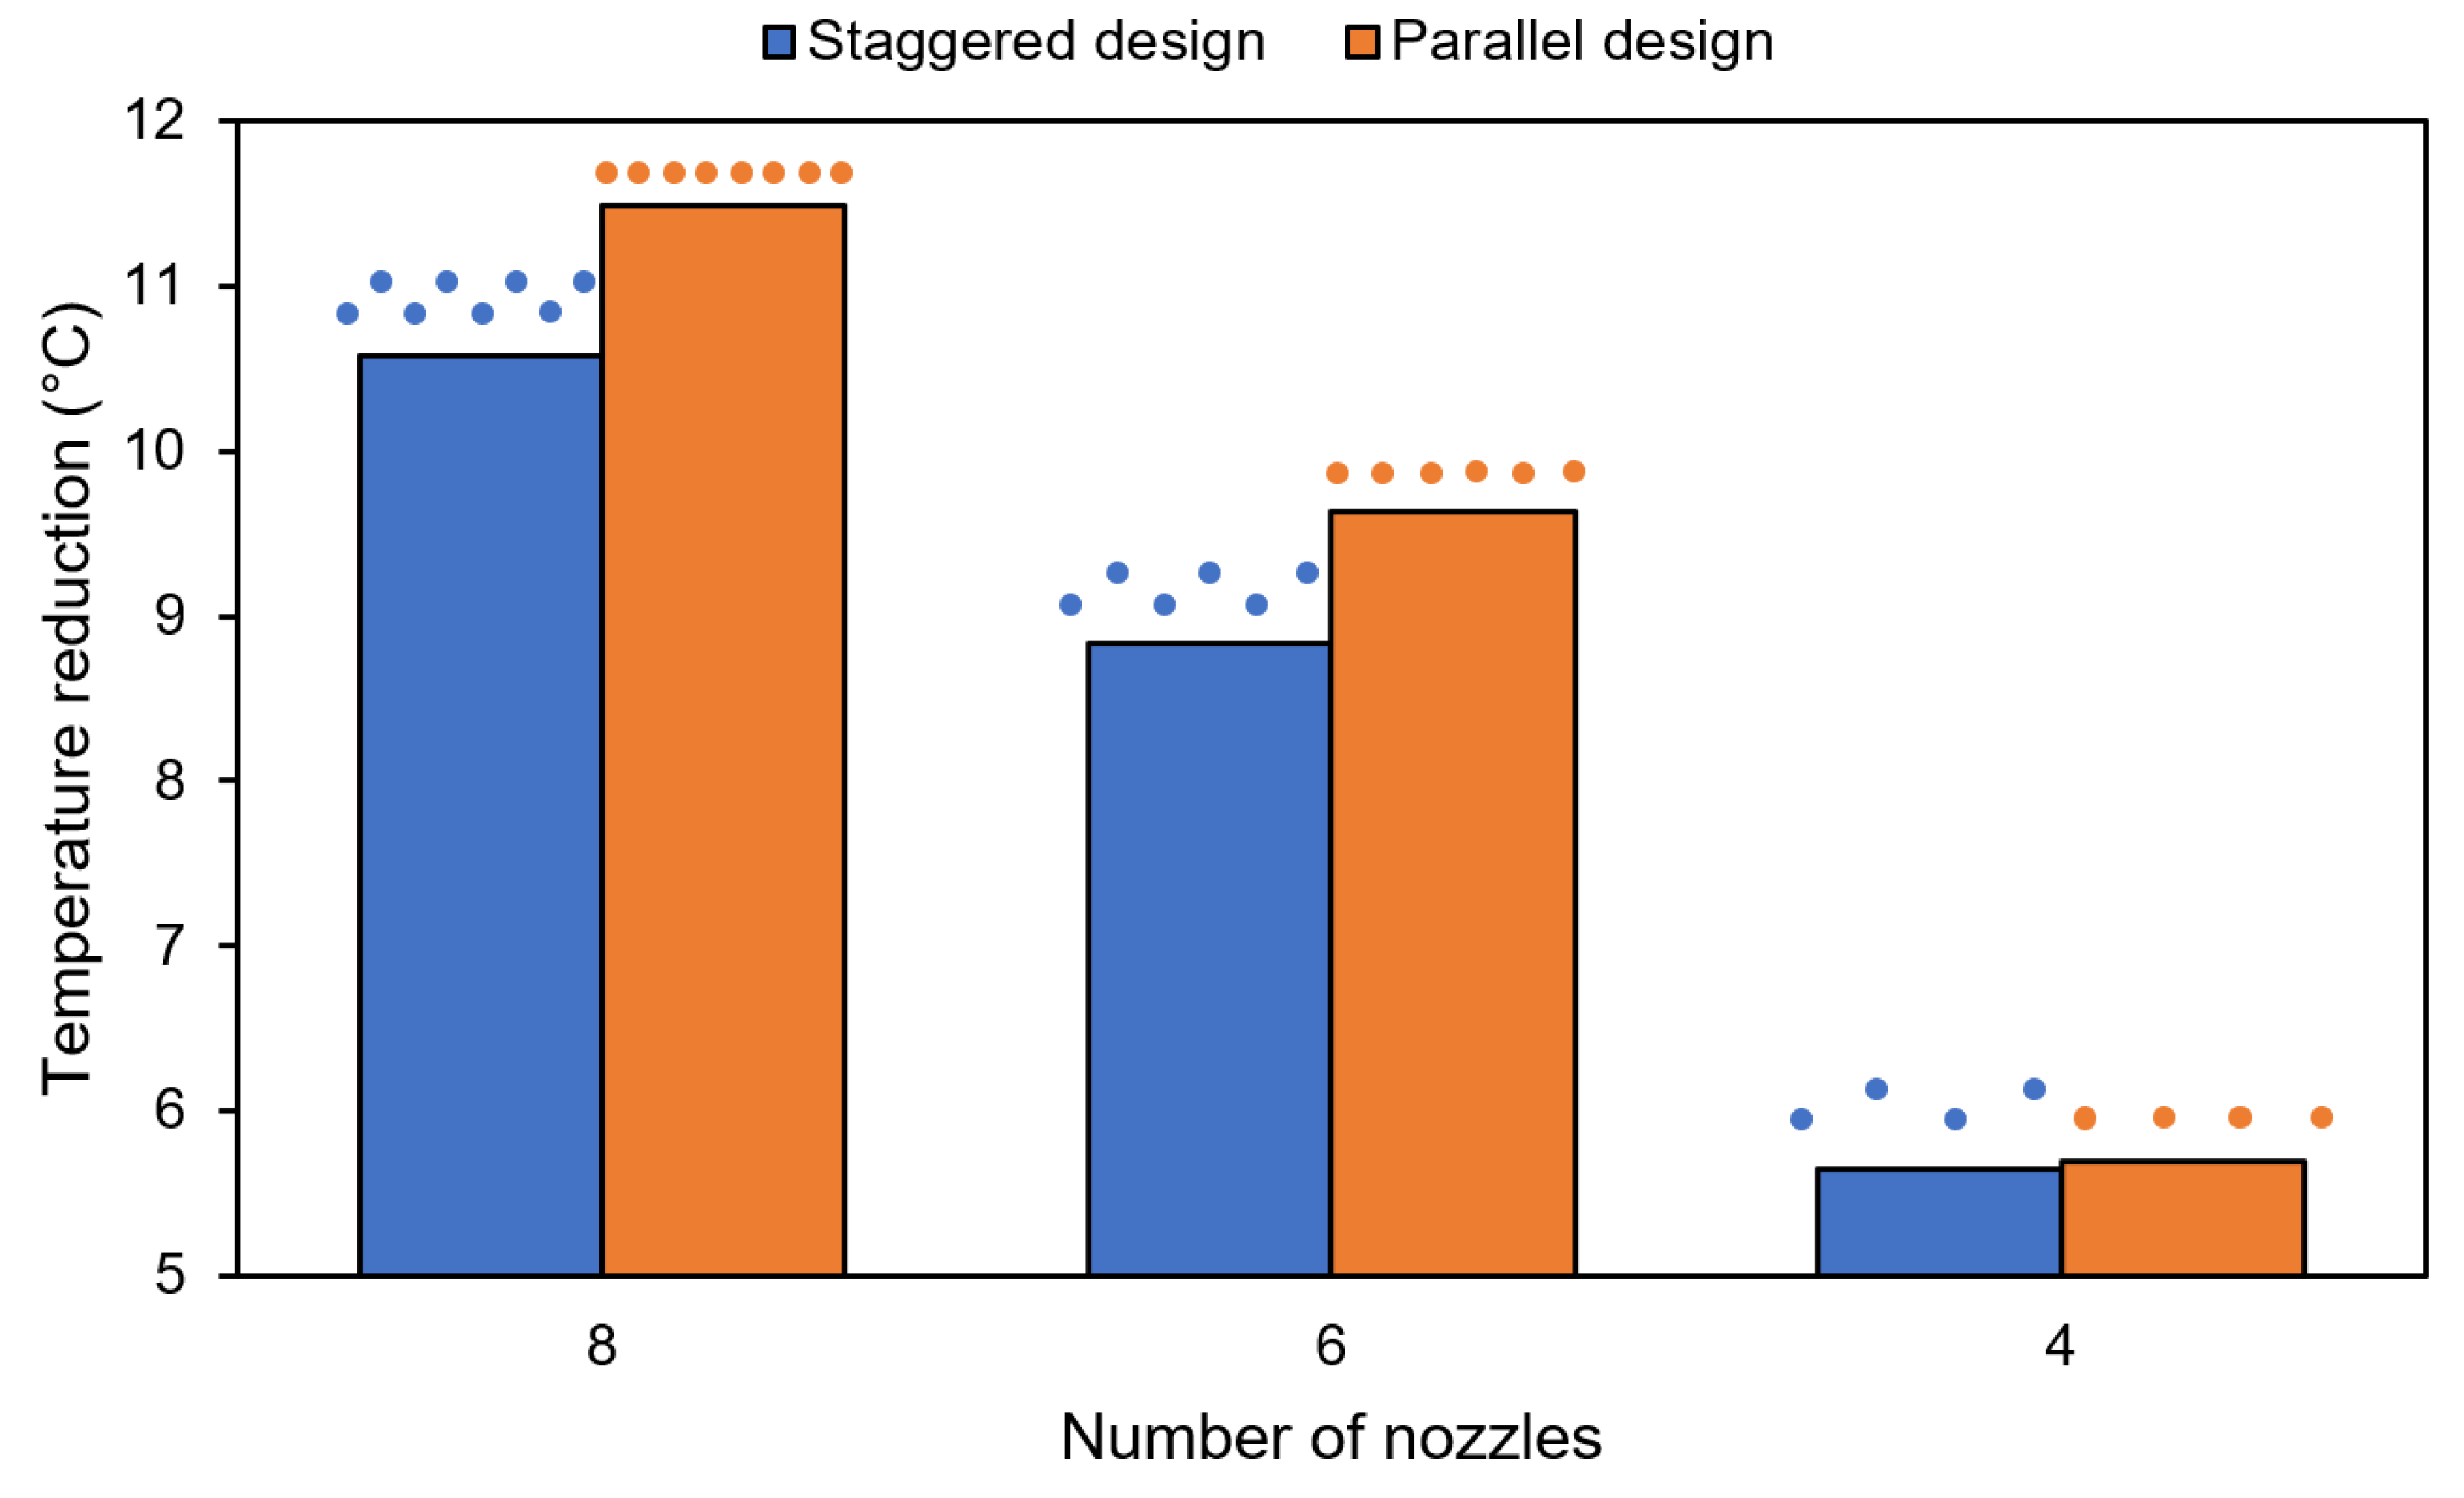
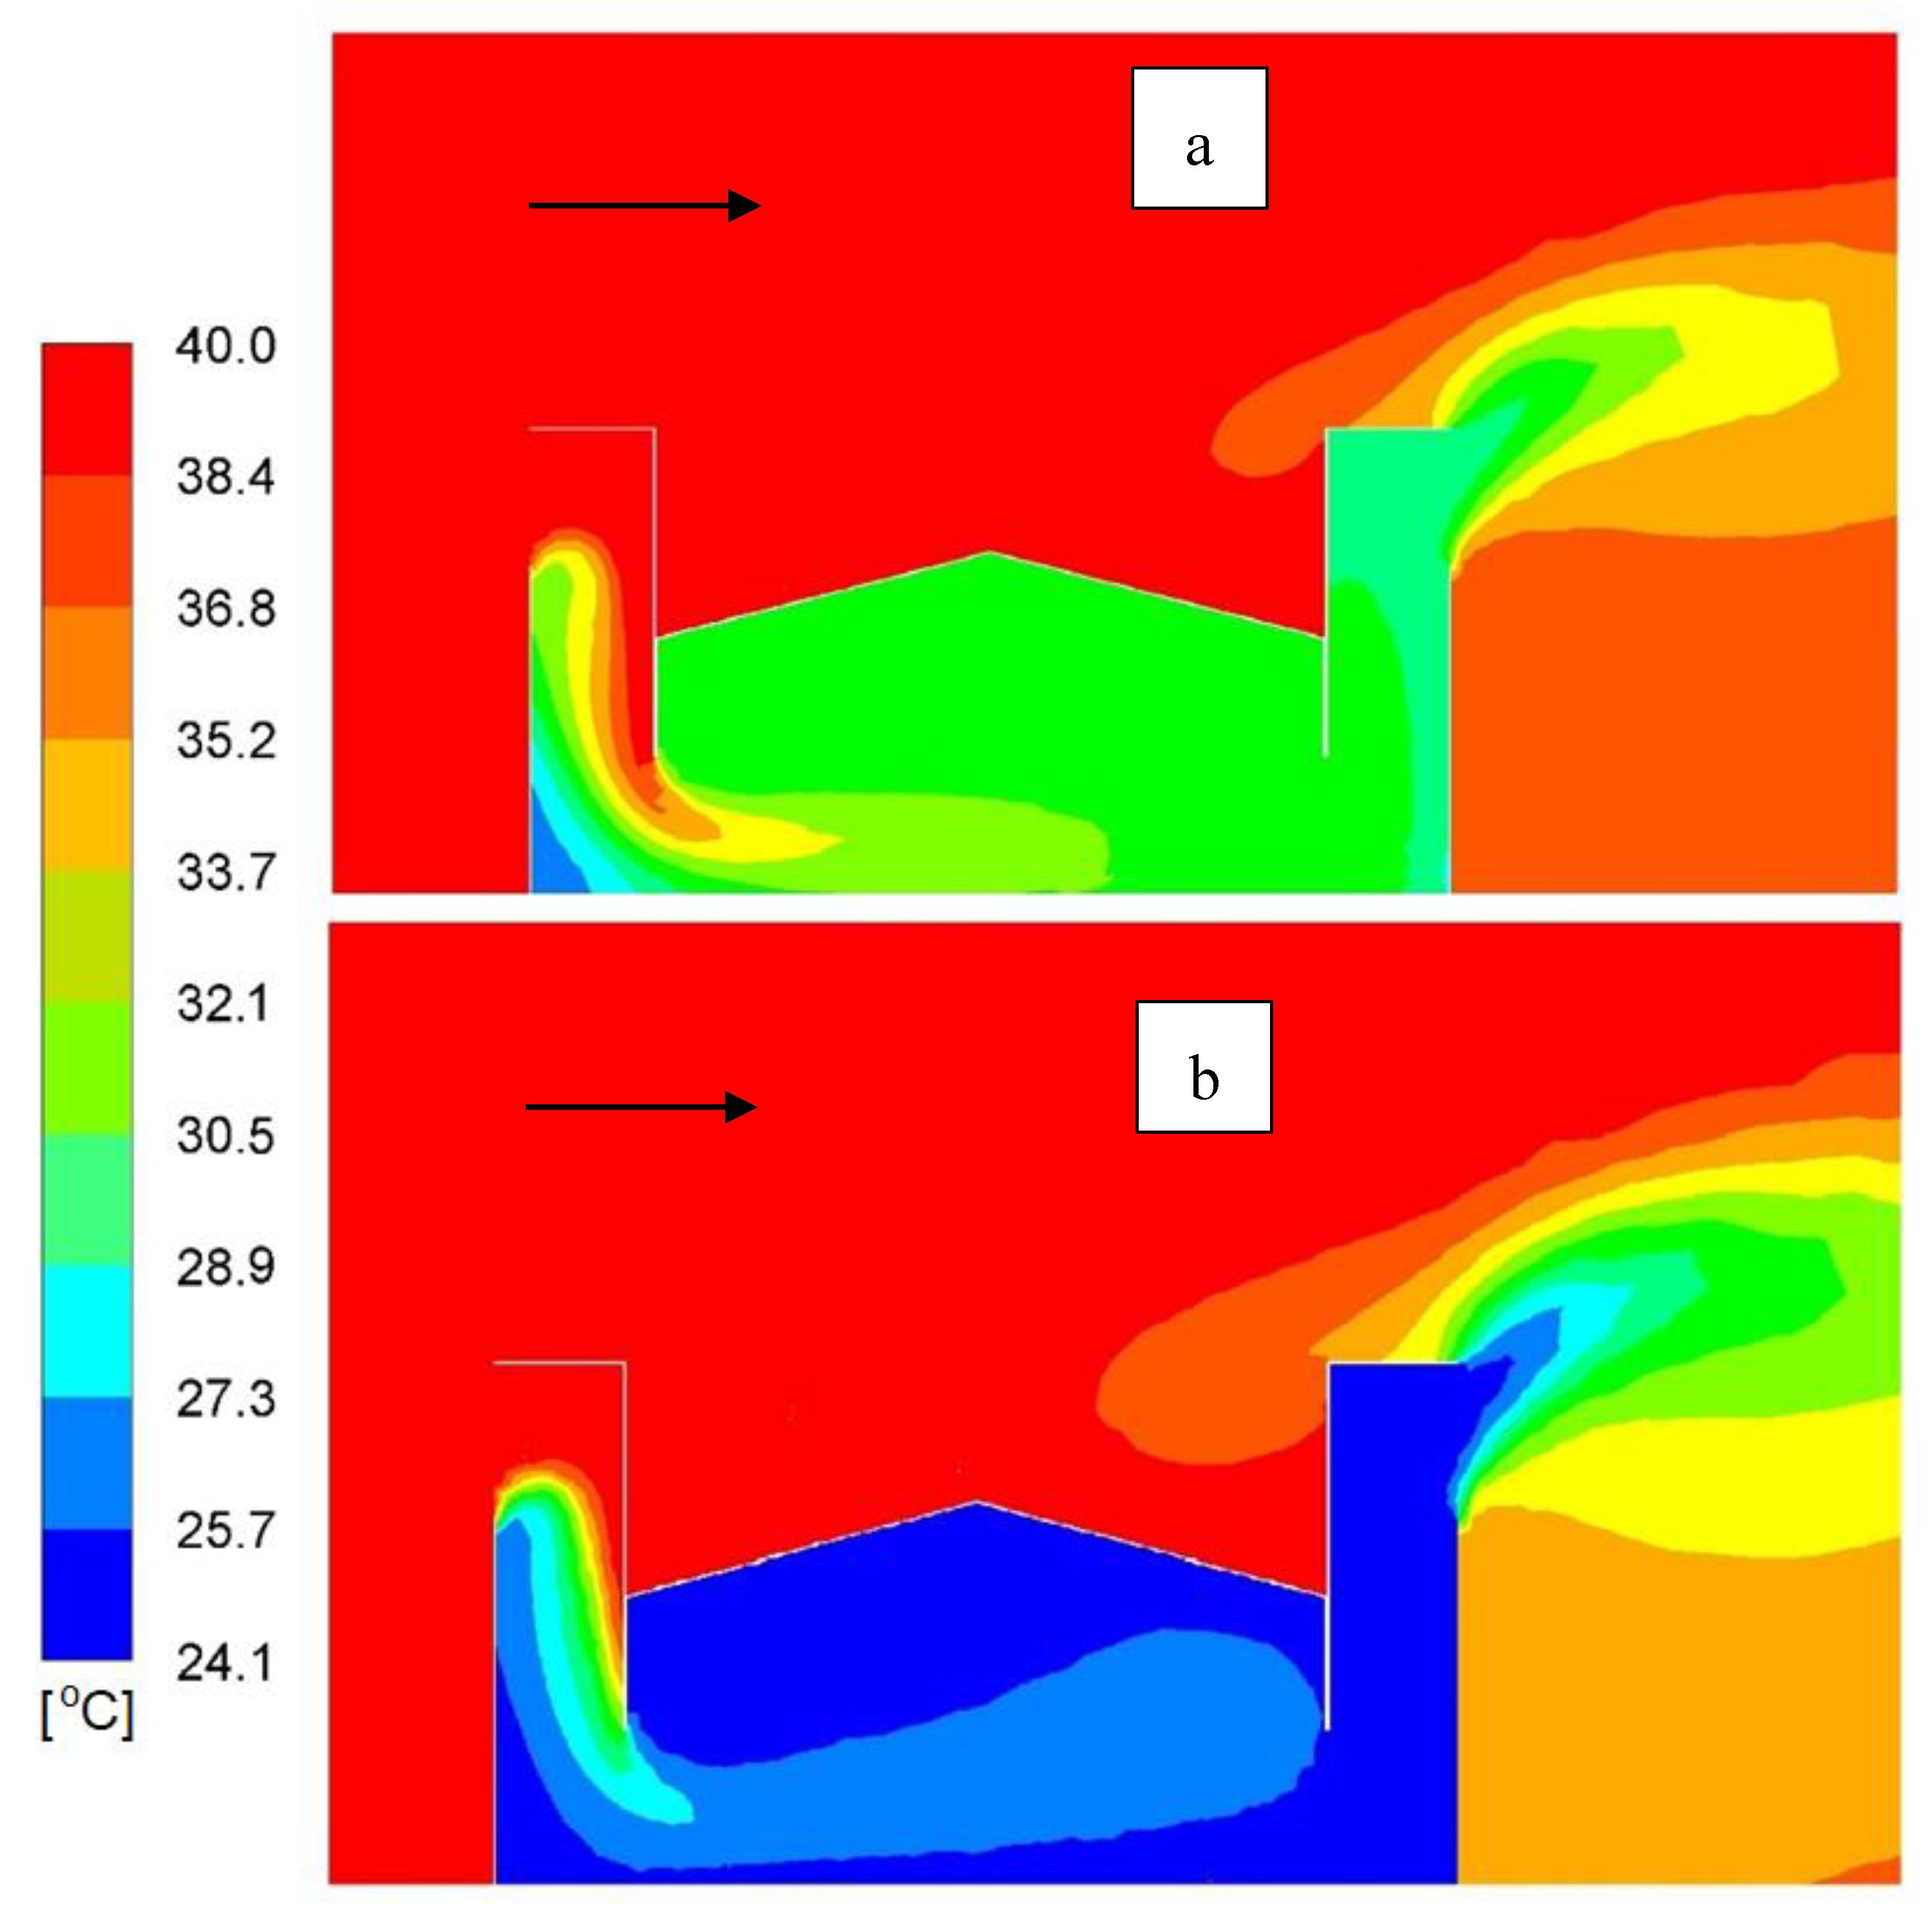
Figure 16 compares the temperature reduction for the parallel and staggered configuration with four, six and eight evaporative spray nozzles. The simulations were carried out with an ambient temperature of 40 °C and relative humidity of 24.5% with a wind velocity of 4.4 m/s at windcatcher roof height. The mass flow rate and temperature of the water spray streams for each spray nozzle (eight nozzles) were 12.5 l / min and 35.2 °C. As observed, the parallel nozzle configuration provided slightly higher temperature reduction than the staggered configuration. Increasing the number of nozzles from four to six had a significant impact on the cooling achieved, up to a 3.9 °C increase in cooling for the parallel configuration. The increase from six to eight nozzles only resulted in a 1.85 °C increase in cooling for the parallel design and 1.75 °C for the staggered configuration. This is confirmed by Figure 17 displaying temperature contours at a midplane of the greenhouse with four and eight parallel evaporative spray nozzles. Depending on the crops in the greenhouse, a lower number of nozzles can be used, resulting in reduced water consumption and design costs.
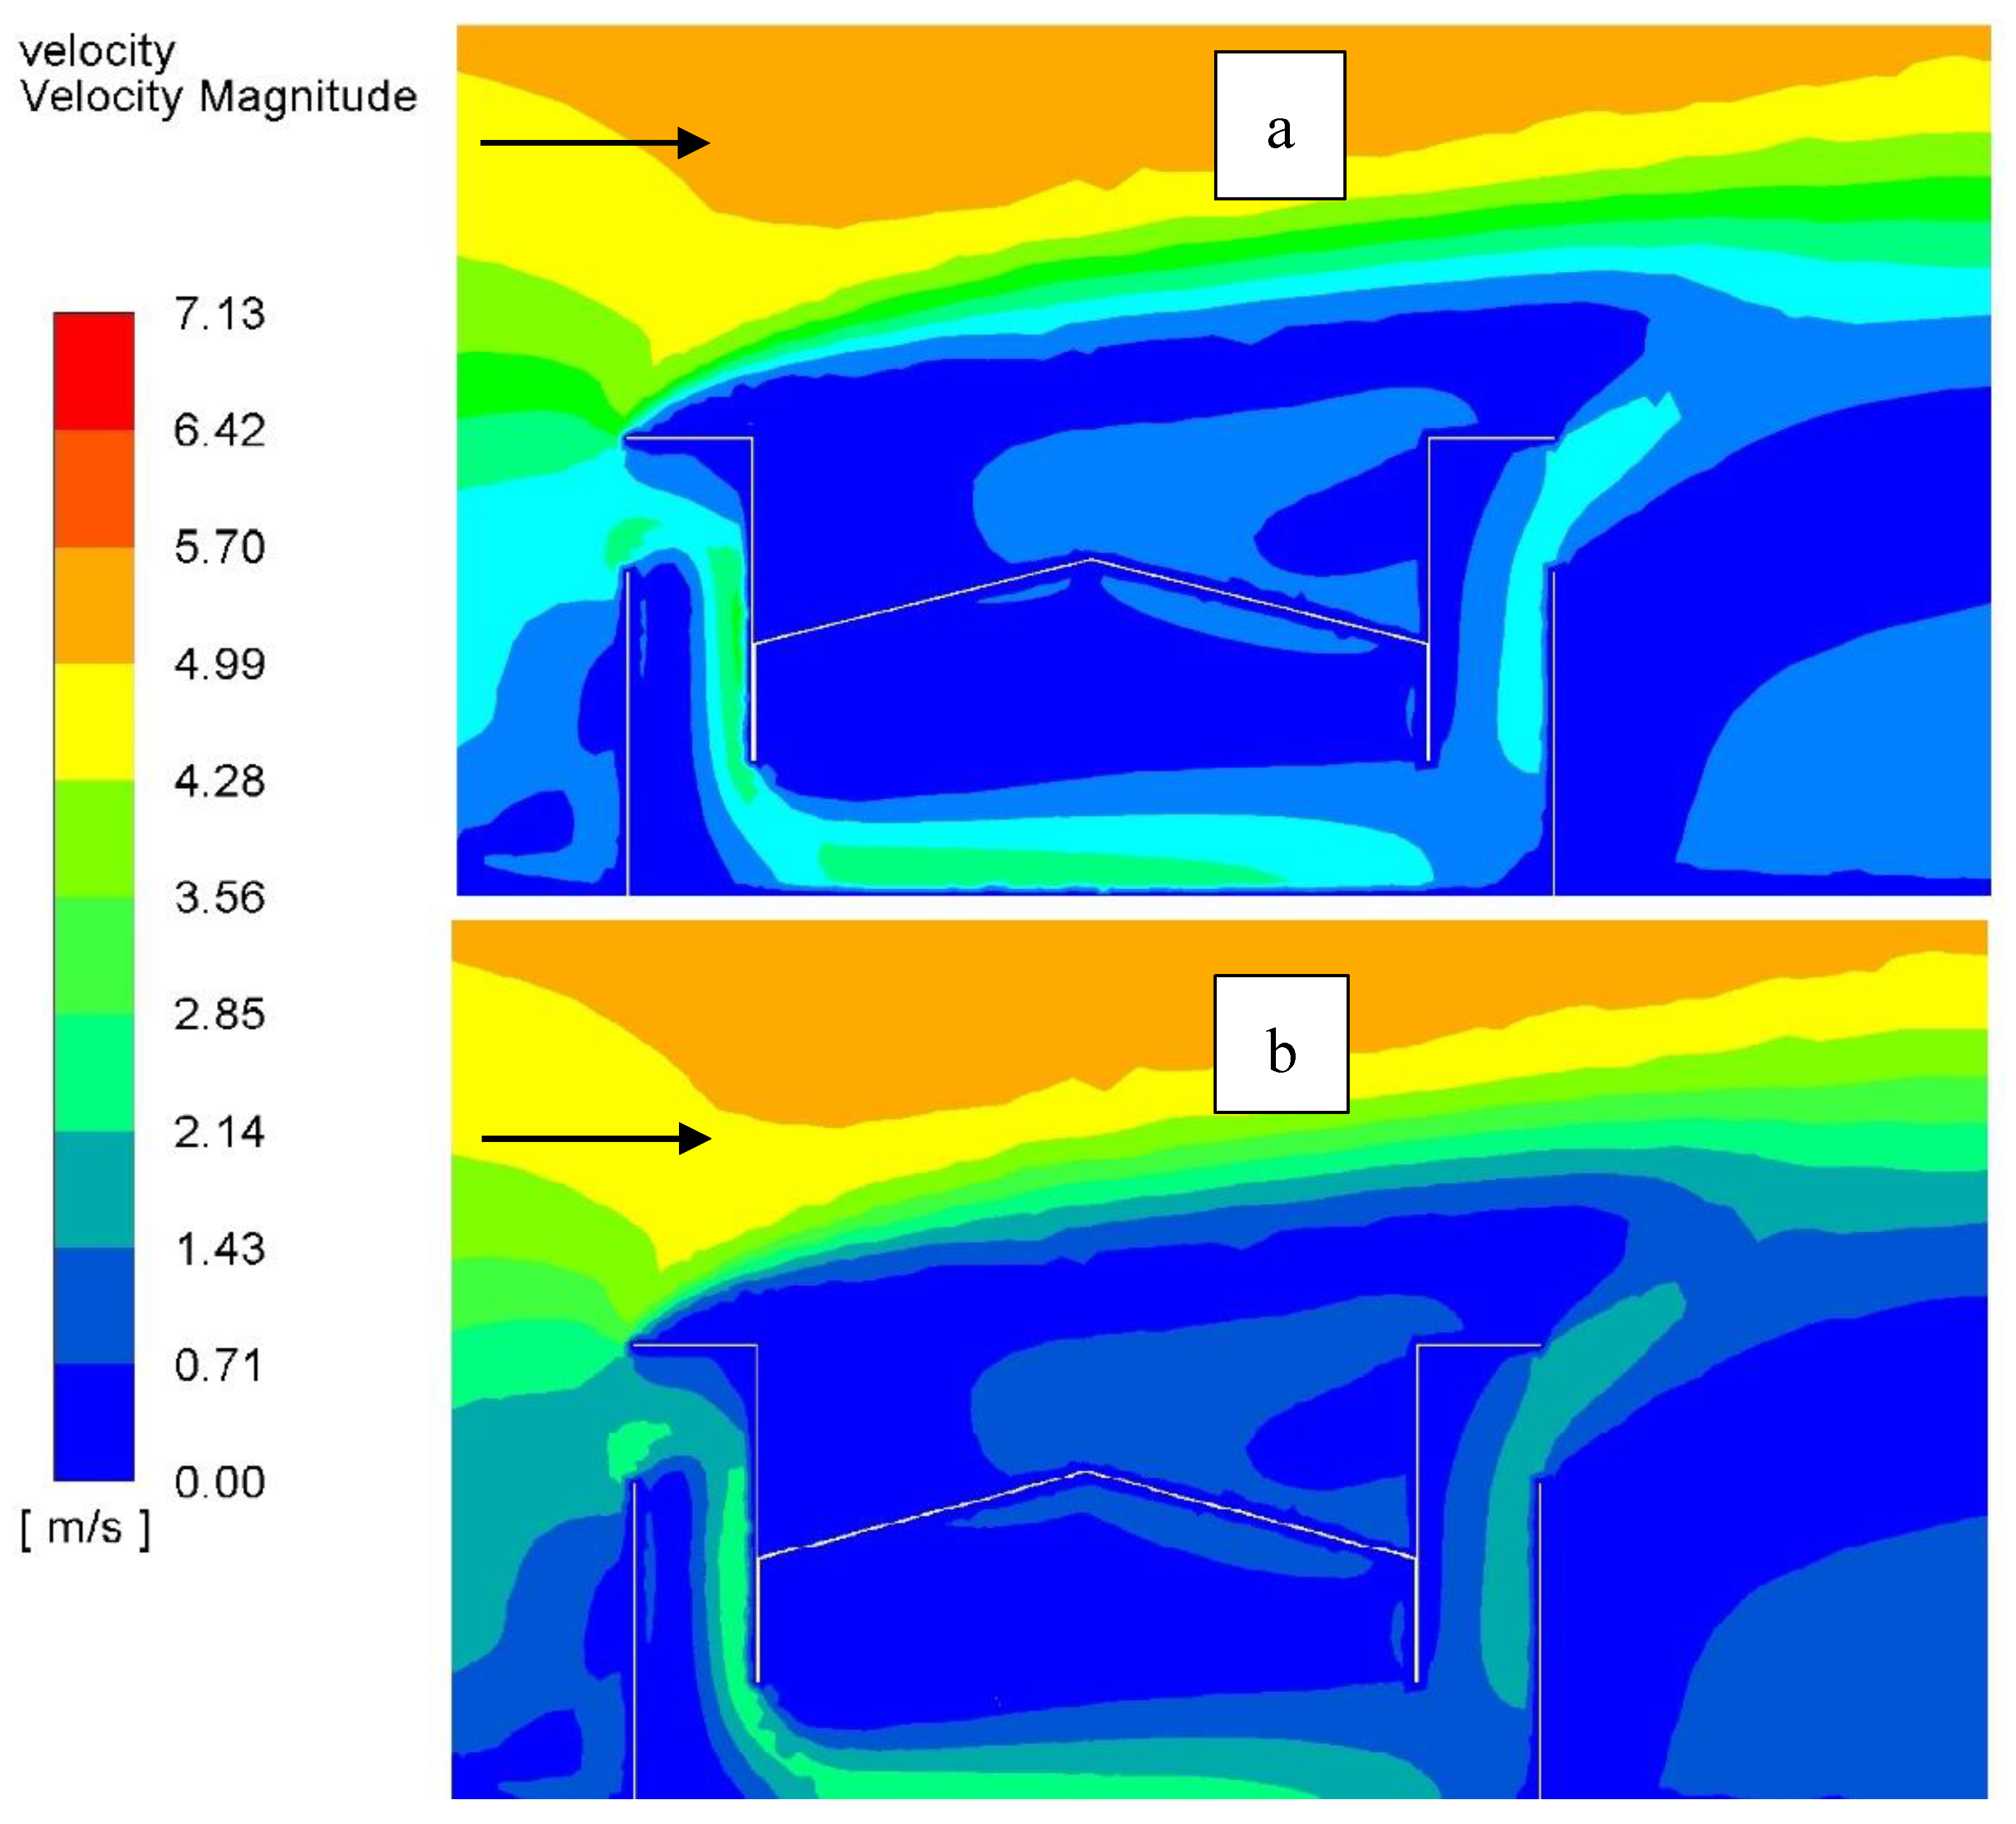
Figure 18 compares the air velocity contours at the midplane of the greenhouse obtained with four and eight parallel evaporative spray nozzles. As shown in the figure, the air entering the inlet windcatcher was accelerated and channelled downwards to where the maximum wind speed reached approximately 2.85 m/s, at the point air entered the greenhouse. The flow then separated at the lower edge of the opening. Consequently, a recirculation zone emerged inside the windcatcher. The air velocity was decreased as it approached the exhaust or outlet greenhouse opening. It can also be observed that the eight-spray nozzle configuration provided slightly lower airspeed at the greenhouse opening level than the four-spray nozzle configuration. This can be attributed to the air obstruction caused by more evaporative sprays.
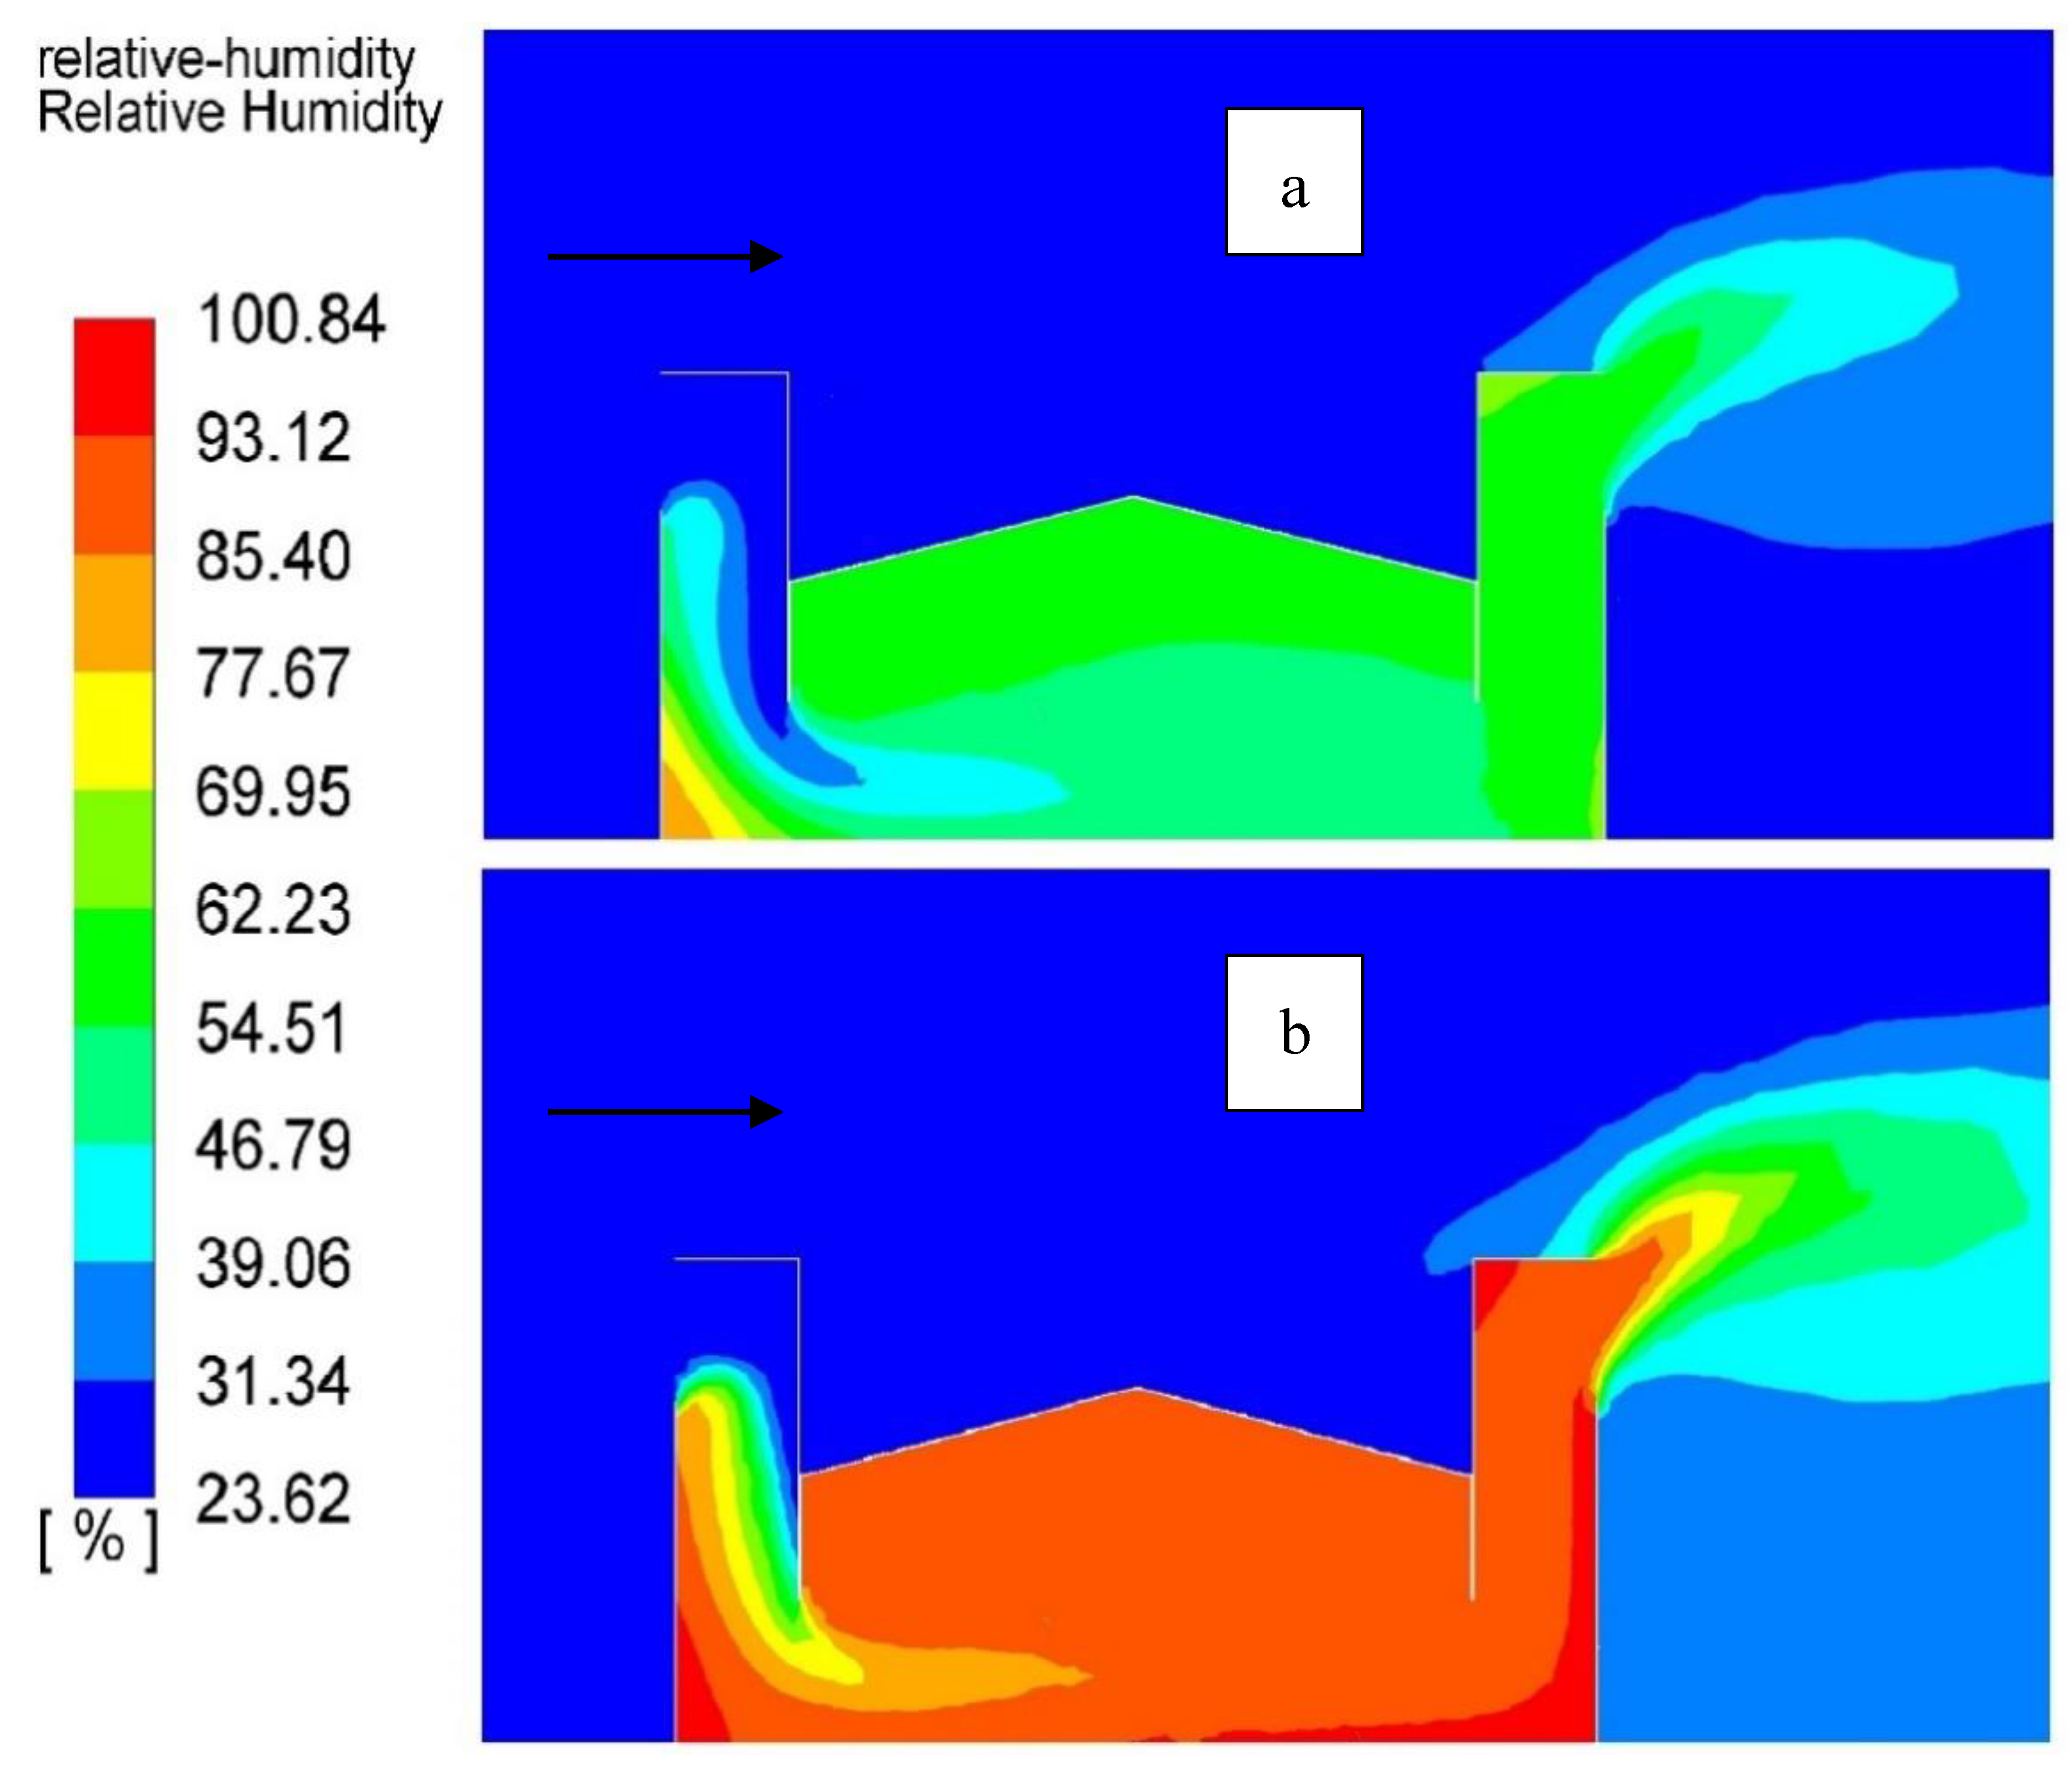
Figure 19 compares the air relative humidity contours at the midplane of the greenhouse obtained with four and eight parallel evaporative spray nozzles. Clearly, the addition of four nozzles led to increased (up to 40%) moisture levels in the greenhouse. As the air velocity was lower with more evaporative spray nozzles, there was more contact time between the spray water and air, which lead to more mass transfer between the water and air. It was also observed that the air reached saturation (100% of relative humidity) in the recirculation zones where velocity was low. Overall, the parallel eight-spray nozzle design provided the highest temperature reduction (11.5 °C) but also a higher relative humidity increase (46.6%).

4.9. Impact of the Nozzle Half Cone Angle

The nozzle cone angle and type can influence the size of the droplets produced and the contact surface between the droplets and incoming airflow and hence can influence the cooling performance of the PDEC-WC. Figure 20 shows the impact of the spray nozzle half cone angle (20° to 24°) on the reduction in the average air temperature inside the greenhouse. The simulations were carried out with an ambient temperature of 40 °C and relative humidity of 24.5% with a wind velocity of 4.4 m/s at windcatcher roof height. The mass flow rate and temperature of water spray streams for each spray nozzle (eight nozzles) were 12.5 l / min and 35.2 °C, respectively. As observed, a greater half cone angle increased the temperature reduction. The half cone angle influences the distance below the nozzle when the spray cones starts to overlap. For example, for the half cone angle of 20°, the spray cones overlap at 3.47 m from the ground, while for the half cone angle of 24°, the spray cones overlap at 3.77 m from the ground.

4.10. Impact of the Mass Flow Rate of the Spray Water

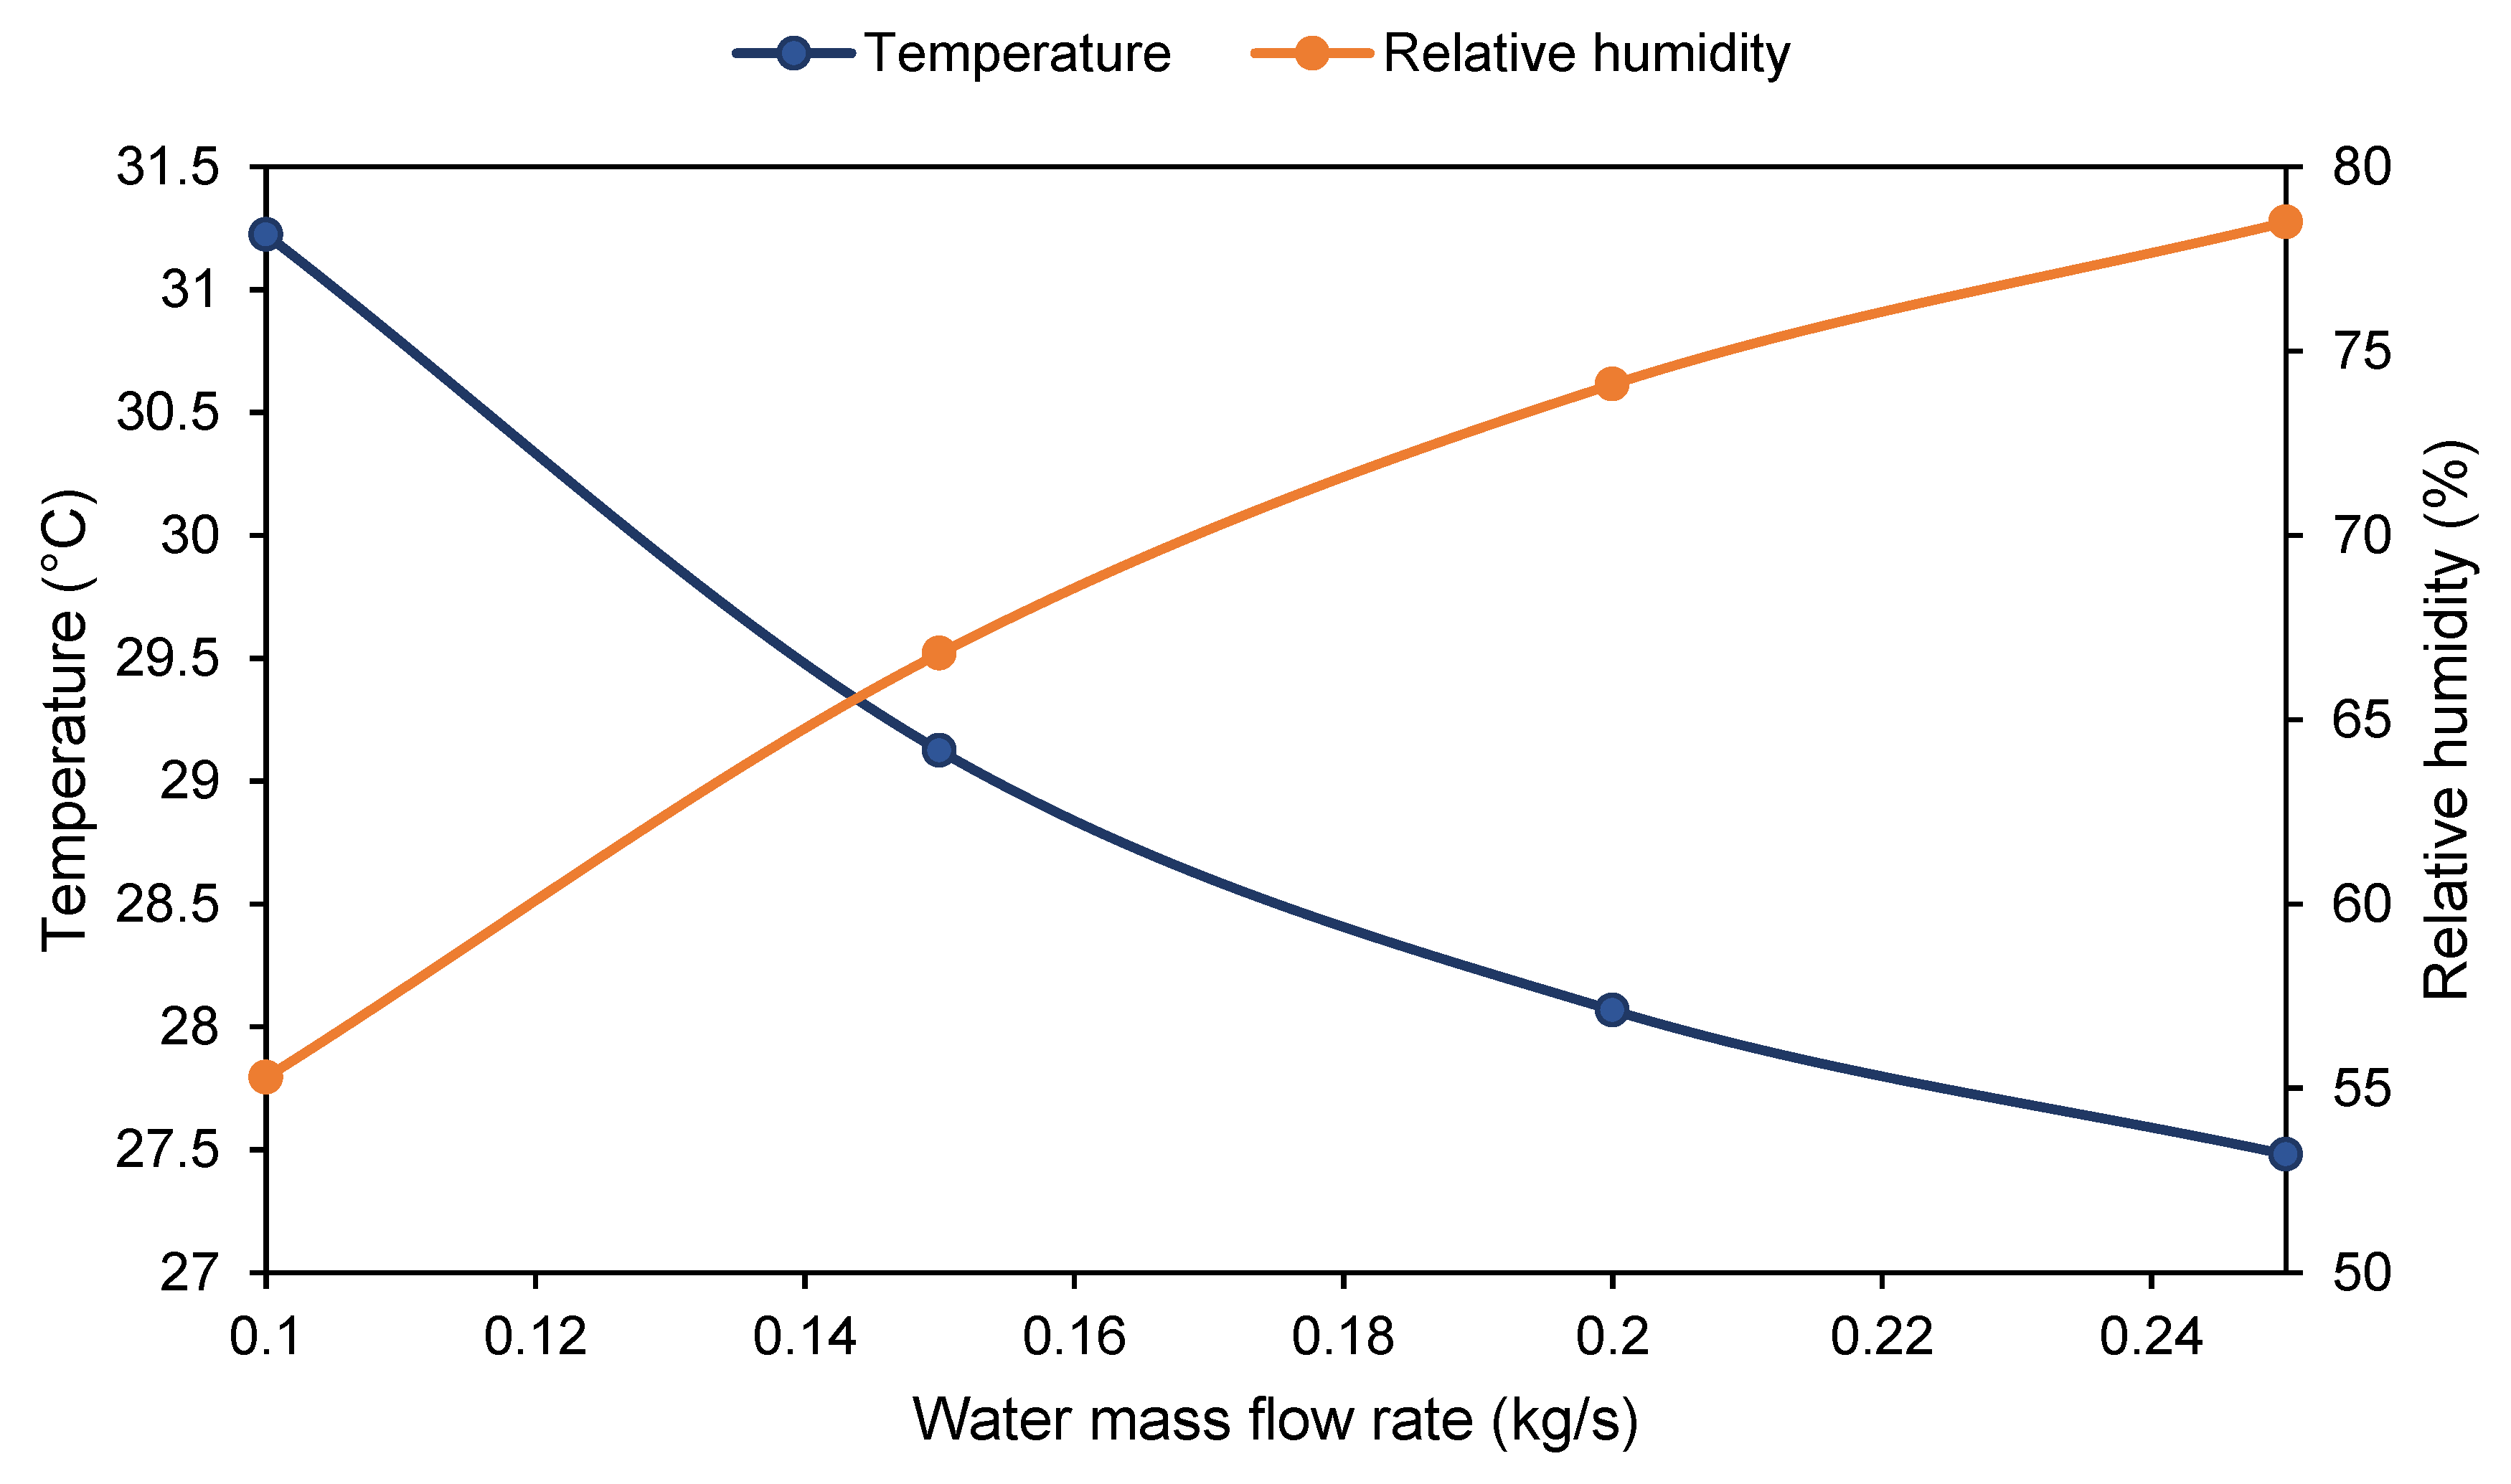
Figure 21 shows the impact of the water mass flow rate on the average air temperature and relative humidity inside the greenhouse. The simulations were carried out with an ambient temperature of 40 °C and relative humidity of 24.5% with a wind velocity of 3.0 m/s at windcatcher roof height. Increasing the mass flow rate from 0.1 to 0.25 kg/s resulted in higher cooling (up to 3.75 °C), which was similar to the observations reported by Montazeri et al. [23] and Sureshkumar et al. [24]. The greenhouse relative humidity increased from 55.3% to 78.5% as the water mass flow rate increased by 0.15 kg/s.

4.11. Impact of the Surrounding Structures

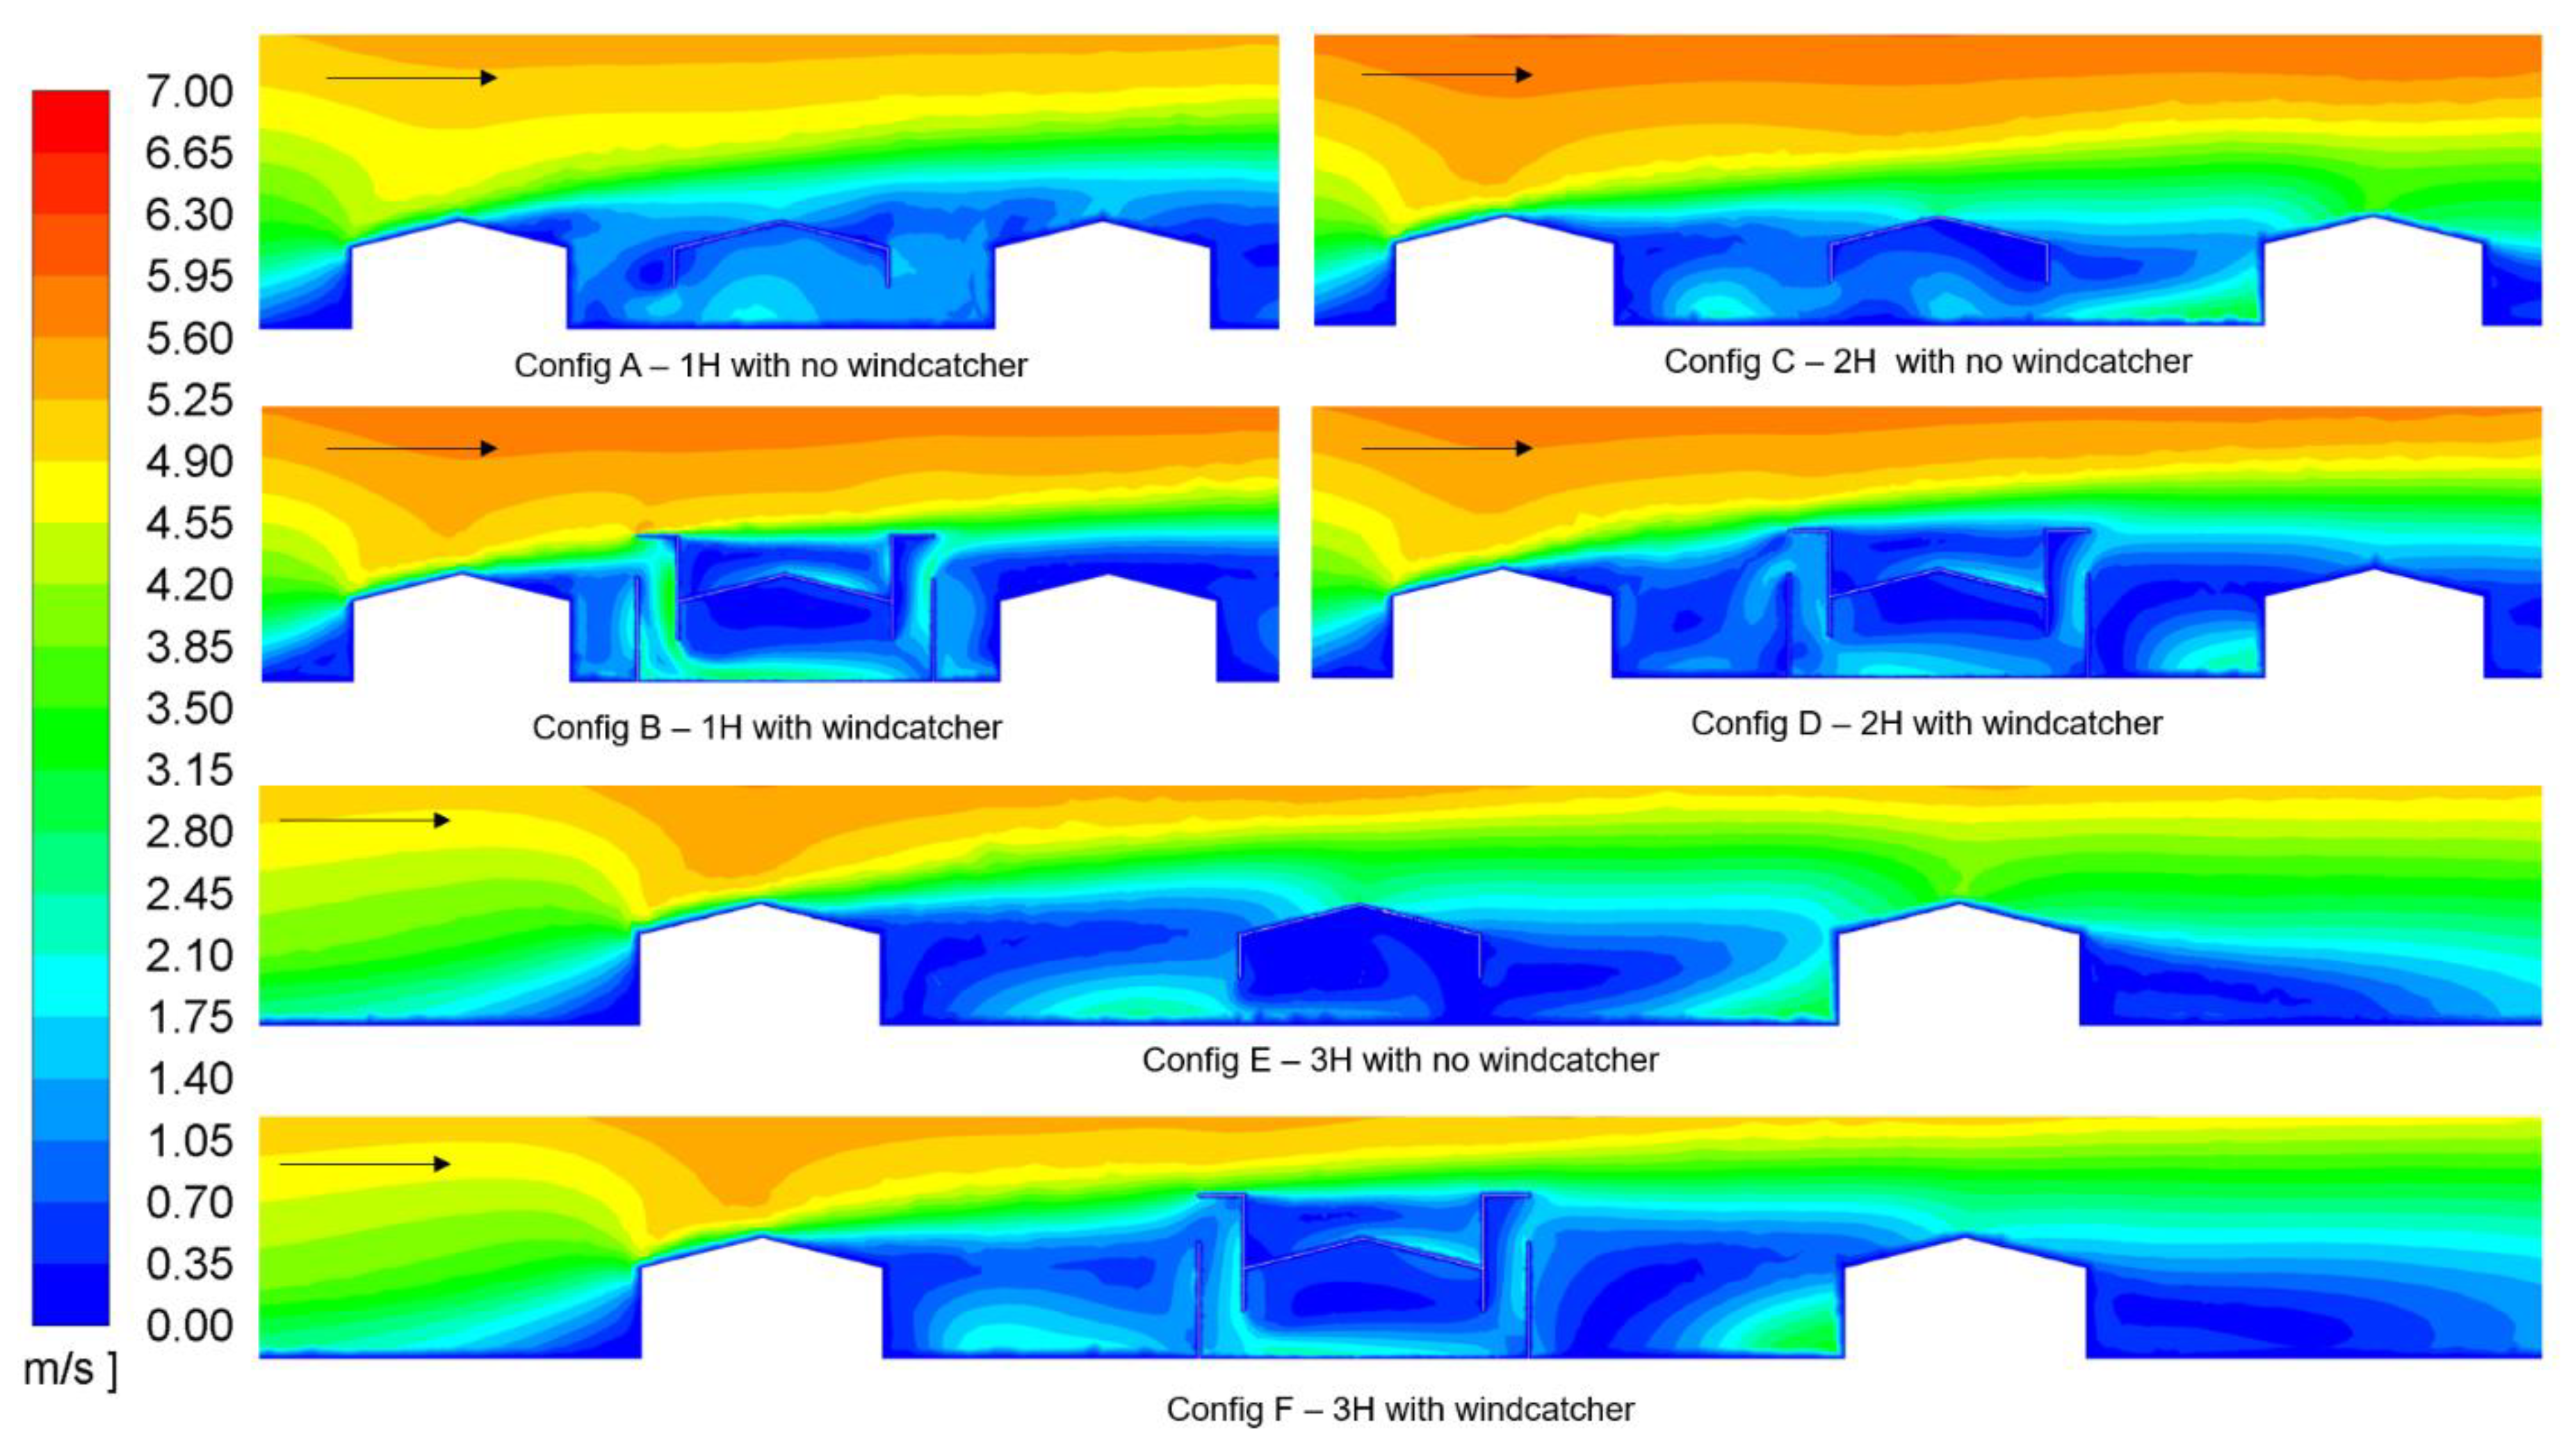
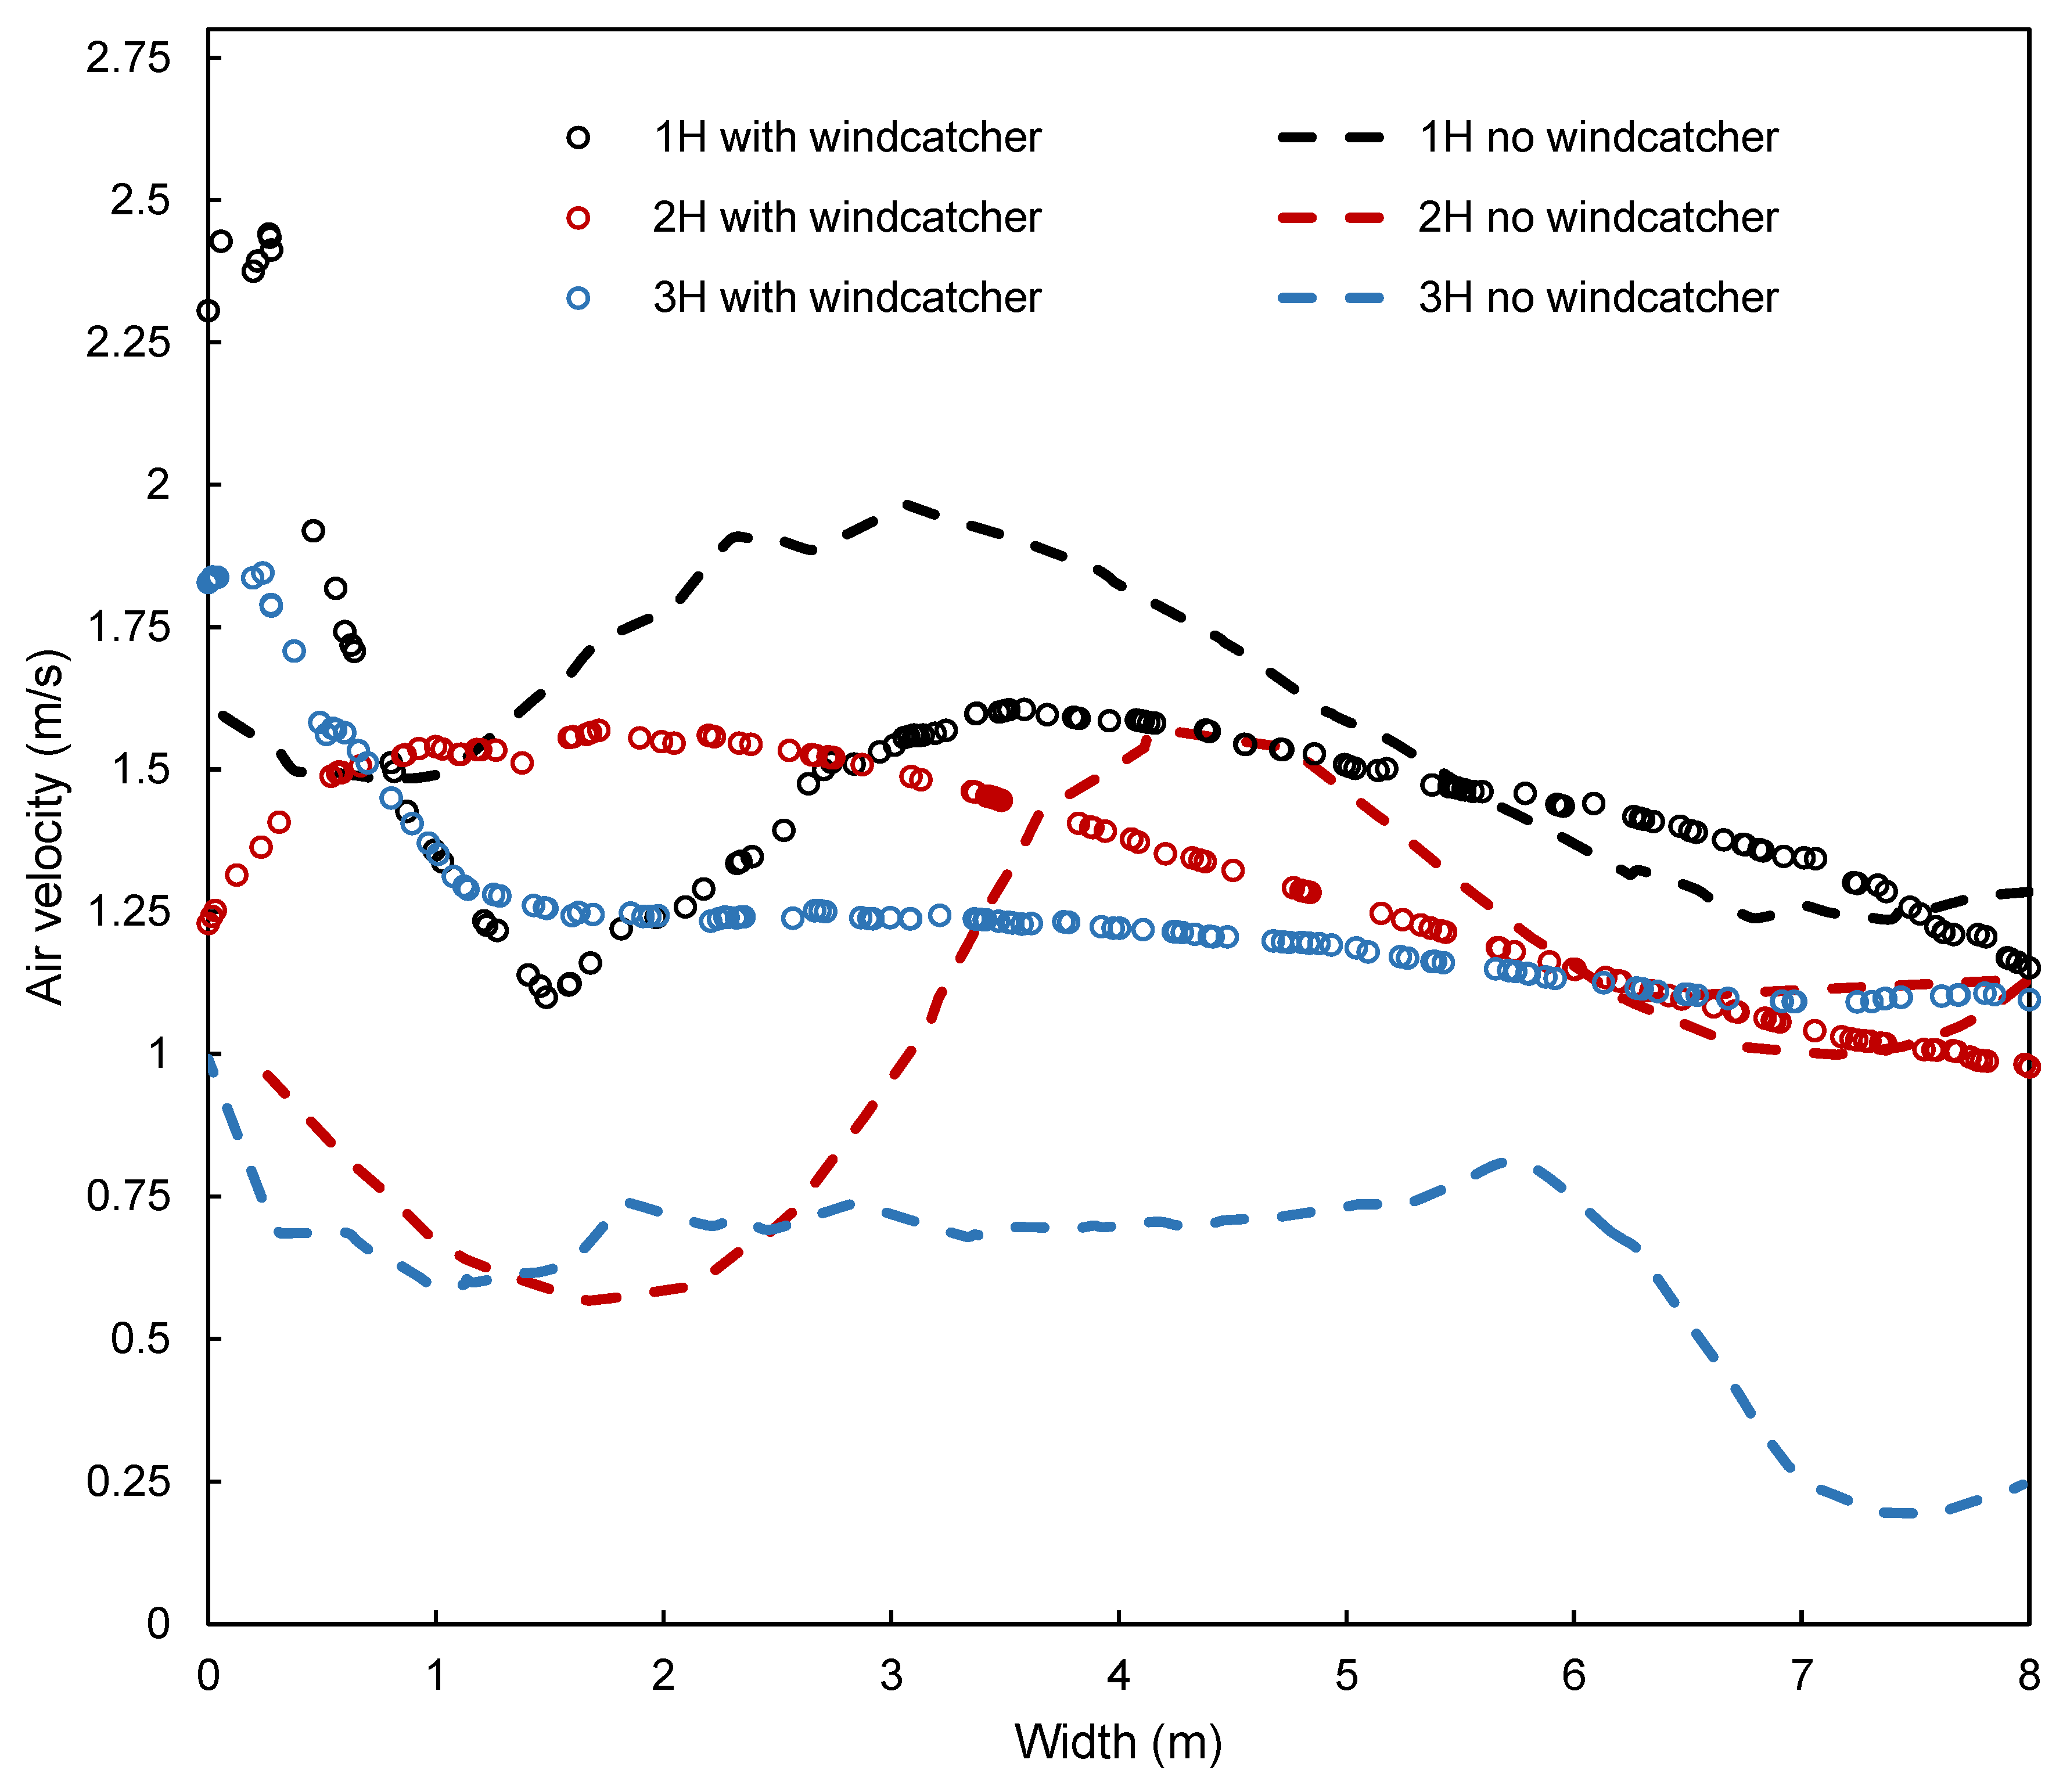
Figure 22 compares the velocity contour plots of a cross-sectional plane in the greenhouse with cross-flow ventilation and windcatcher ventilation, surrounded by structures on the windward and leeward sides. The distance between the greenhouse and structures was varied between 1H and 3H (H = 4 m). As shown in the contour plots for the greenhouse with cross-flow ventilation, the airflow enters the inlet opening on the left and slows down as it moves across to the outlet opening. As expected, large air recirculations were present on the windward side of the structure, which slowed down the air flowing into the greenhouse (Configuration A, C and E). This phenomenon also affected the airflow into the windcatcher; however, the effect was not as significant due to the positioning of the inlet of the windcatcher, which takes advantage of the higher airspeed at higher elevations. The windcatcher height significantly affects its performance, and this should be adjusted depending on the structures surrounding it as well as the local wind conditions. This point also demonstrates the importance of carrying out modelling work during the design stages, allowing for the careful examination of the appropriate design characteristics. When comparing the cross-flow-ventilated greenhouses (Configuration A, C and E), it was observed that increasing the distance between the surrounding structures and greenhouse significantly reduced the airflow into the greenhouse. This can be better observed in Figure 22, which shows that the airspeed across the greenhouse can drop below 0.25 m/s for Configuration E. Similarly, the airspeed across the greenhouse with a windcatcher system was also reduced as the distance between the greenhouse and windward or leeward structures increased from 1H to 2H. However, as mentioned previously, this can be resolved by adjusting the height of the windcatcher to increase the inlet air speed, if necessary. The variation of air velocity along a centre line of the greenhouses is shown in Figure 23. The highest air velocity was obtained for Configuration B (2.44 m/s). The average velocity at a horizontal plane at a height of z = 0.8 m was 1.48, 1.31 and 1.26 m/s for Configuration B, D and F, respectively.

5. Conclusions and Future Work

The potential of a passive downdraught evaporative cooling windcatcher system (PDEC-WC) for greenhouses in hot climates was investigated and presented. A coupled CFD model for a cross-flow-ventilated greenhouse and a passive downdraught evaporative cooling windcatcher system was developed using ANSYS Fluent 18.1, verified using grid sensitivity analysis and validated with experimental data. The average discrepancy between the measured and simulated results was 5.4% for the cross-flow-ventilated greenhouse model (air velocity results) and 4.6% for the evaporative cooling spray model (temperature results). The effects of the spray height, layout, cone angle and mass flow rate on the indoor temperature and humidity were investigated. Different ambient conditions associated with hot and dry weather were considered in the study. The outdoor air temperature was varied between 30 and 45 °C and the relative humidity was varied between 15% and 45%. Based on the specific conditions simulated, the PDEC-WC system can reduce the average air temperature by up to 13.3 °C and increase the relative humidity by 54% in the greenhouse. Evaporative cooling using the water spray nozzle system provided more cooling under hotter and dryer outdoor conditions. The temperature reduction was found to increase with the half cone angle (from 20° to 24°), spray nozzle height (from 4.2 to 5.37 m) and water mass flow rate (from 0.1 to 0.25 kg/s). The work compared the temperature reduction for the PDEC-WC with four, six and eight nozzles arranged in parallel and staggered configurations. Increasing the number of nozzles from four to six nozzles had a significant impact on the cooling achieved: up to a 3.9 °C increase in cooling for the parallel configuration. The increase from six to eight nozzles only resulted in a 1.9 °C increase in cooling for the parallel design and 1.8 °C for the staggered configuration. The study also assessed the influence of neighbouring structures or other greenhouses on the flow distribution in the greenhouse. The study showed that the windcatcher ventilation provided higher airflow rates as compared to cross-flow ventilation when the greenhouse was surrounded by other structures. It should be noted that the neighbouring structures were not ventilated in the present work, but this will be considered in our next study.
Further research is still required to investigate the operational conditions of the PDEC-WC system for greenhouses and further analyse the influence of greenhouse design parameters on its performance including the windcatcher geometry. It is worth noting that the current numerical model is limited to a steady-state analysis, and the simulation of the dynamic operation of the system requires a transient model, which we plan to develop in the future. A complete analysis of the energy-and cost-saving implications of the PDEC-WC system should be undertaken to provide greenhouse growers with accurate detail about the effectiveness of the system. The use of a large eddy simulation (LES) model to examine the ventilation of the greenhouse with a windcatcher system is of further interest. The influence of vegetation on the ventilation rate and cooling performance should be investigated in detail. Further study should also focus on optimising the synchronised operation of the water spray nozzles by designing a control system that can adapt to the indoor requirements and outdoor conditions. The field testing of the system is required to evaluate its performance under real conditions and to validate the computational model. Finally, the wind tunnel testing of the PDEC-WC model in Atmospheric Boundary Layer (ABL) flows is recommended.

Author Contributions

Data curation, M.G.; Formal analysis, M.G. and J.C.; Investigation, M.G.; Methodology, M.G., F.Z. and J.C.; Project administration, K.E.M. and E.N.; Software, M.G. and F.Z.; Supervision, J.C.; Validation, M.G.; Visualization, M.G.; Writing—original draft, M.G., F.Z. and J.C. All authors have read and agreed to the published version of the manuscript.

Funding

This research was funded by the University of Tunis El Manar.

Acknowledgments

The authors would like to thank the support of the Department of Architecture and Built Environment for providing the computational facility.

Conflicts of Interest

The authors declare no conflict of interest.

References

  1. Du, K.; Calautit, J.; Wang, Z.; Wu, Y.; Liu, H. A review of the applications of phase change materials in cooling, heating and power generation in different temperature ranges. Appl. Energy 2018, 220, 242–273. [Google Scholar] [CrossRef]
  2. Boukhanouf, R.; Amer, O.; Ibrahim, H.; Calautit, J. Design and performance analysis of a regenerative evaporative cooler for cooling of buildings in arid climates. Build. Environ. 2018, 142, 1–10. [Google Scholar] [CrossRef]
  3. Chou, S.K.; Chua, K.J.; Ho, J.C.; Ooi, C.L. On the study of an energy-efficient greenhouse for heating, cooling and dehumidification applications. Appl. Energy 2004, 77, 355–373. [Google Scholar] [CrossRef]
  4. IEA. Worldwide Trends in Energy Use and Efficiency: Key Insights from IEA Indicator Analysis; OECD/IEA: Paris, France, 2008. [Google Scholar]
  5. Hughes, B.R.; Calautit, J.K.; Ghani, S.A. The development of commercial wind towers for natural ventilation: A review. Appl. Energy 2012, 92, 606–627. [Google Scholar] [CrossRef]
  6. Jomehzadeh, F.; Nejat, P.; Calautit, J.K.; Yusof, M.B.M.; Zaki, S.A. A review on windcatcher for passive cooling and natural ventilation in buildings, Part 1: Indoor air quality and thermal comfort assessment. Renew. Sustain. Energy Rev. 2017, 70, 736–756. [Google Scholar] [CrossRef]
  7. Nejat, P.; Jomehzadeh, F.; Hussen, H.M.; Calautit, J.K.; Abd Majid, M.Z. Application of wind as a renewable energy source for passive cooling through windcatchers integrated with wing walls. Energies 2018, 11, 2536. [Google Scholar] [CrossRef] [Green Version]
  8. Hughes, B.R.; Cheuk-Ming, M. A study of wind and buoyancy driven flows through commercial wind towers. Energy Build. 2011, 43, 1784–1791. [Google Scholar] [CrossRef]
  9. Nejat, P.; Calautit, J.K.; Majid, M.Z.A.; Hughes, B.R.; Zeynali, I.; Jomehzadeh, F. Evaluation of a two-sided windcatcher integrated with wing wall (as a new design) and comparison with a conventional windcatcher. Energy Build. 2016, 126, 287–300. [Google Scholar] [CrossRef] [Green Version]
  10. Khani, S.M.R.; Bahadori, M.N.; Dehghani-Sanij, A.; Nourbakhsh, A. Performance evaluation of a modular design of wind tower with wetted surfaces. Energies 2017, 10, 845. [Google Scholar] [CrossRef] [Green Version]
  11. Noroozi, A.; Veneris, Y.S. Thermal assessment of a novel combine evaporative cooling wind catcher. Energies 2018, 11, 442. [Google Scholar] [CrossRef] [Green Version]
  12. Zaki, A.; Richards, P.; Sharma, R. Analysis of airflow inside a two-sided wind catcher building. J. Wind Eng. Ind. Aerod. 2019, 190, 71–82. [Google Scholar] [CrossRef]
  13. Calautit, J.K.; Hughes, B.R. Measurement and prediction of the indoor airflow in a room ventilated with a commercial wind tower. Energy Build. 2014, 84, 367–377. [Google Scholar] [CrossRef]
  14. Calautit, J.K.; Hughes, B.R. Wind tunnel and CFD study of the natural ventilation performance of a commercial multi-directional wind tower. Build. Environ. 2014, 80, 71–83. [Google Scholar] [CrossRef] [Green Version]
  15. Calautit, J.K.; Wenbin Tien, P.; Wei, S.; Calautit, K.; Hughes, B.R. Numerical and experimental investigation of the indoor air quality and thermal comfort performance of a low energy cooling windcatcher with heat pipes and extended surfaces. Renew. Energy 2020, 145, 744–756. [Google Scholar] [CrossRef]
  16. Varela-Boydo, C.A.; Moya, S.L. Inlet extensions for wind towers to improve natural ventilation in buildings. Sustain. Cities Soc. 2020, 53, 101933. [Google Scholar] [CrossRef]
  17. Franco, A.; Valera, D.L.; Pena, A.; Perez, A.M. Aerodynamic analysis and CFD simulation of several cellulose evaporative cooling pads used in Mediterranean greenhouses. Comput. Electron. Agric. 2011, 76, 218–230. [Google Scholar] [CrossRef]
  18. Bartzanas, T.; Fidaros, D.; Baxevanou, C.; Kittas, C. Climate distribution in a fan and pad evaporative cooled greenhouse: A CFD approach. Acta Hortic. 2013, 1008, 185–190. [Google Scholar] [CrossRef]
  19. Speetjens, S.L.; Van der Walle, T.; Janssen, H.J.J.; Gieling, T.H.; Van Straten, G.; Stigter, J.D. Watergy, towards a closed greenhouse in semi-arid regions-experiment with a heat exchanger. Acta Hortic. 2005, 691, 845–852. [Google Scholar] [CrossRef] [Green Version]
  20. Ghoulem, M.; Moueddeb, K.; Nehdi, E.; Boukhanouf, R.; Calautit, J.K. Greenhouse design and cooling technologies for sustainable food cultivation in hot climates: Review of current practice and future status. Biosyst. Eng. 2019, 183, 121–150. [Google Scholar] [CrossRef]
  21. ANSYS, Inc. Fluent User’s Guide 18.2. Available online: https://www.sharcnet.ca/Software/Ansys/18.2.2/en-us/help/flu_ug/flu_ug.html (accessed on 21 February 2020).
  22. Chu, C.R.; Lan, T.W.; Tasi, R.K.; Wu, T.R.; Yang, C.K. Wind-Driven natural ventilation of greenhouses with vegetation. Biosyst. Eng. 2017, 164, 221–234. [Google Scholar] [CrossRef]
  23. Montazeri, H.; Blocken, B.; Hensen, J.L.M. Evaporative cooling by water spray systems: CFD simulation, experimental validation and sensitivity analysis. Build. Environ. 2015, 83, 129–141. [Google Scholar] [CrossRef]
  24. Sureshkumar, R.; Kale, S.R.; Dhar, P.L. Heat and mass transfer processes between a water spray and ambient air-I. Experimental data. Appl. Therm. Eng. 2008, 28, 349–360. [Google Scholar] [CrossRef]
  25. Rosin, P.; Rammler, E. The laws governing the fineness of powdered coal. J. Inst. Fuel 1933, 31, 29–36. [Google Scholar]
  26. Morsi, S.A.; Alexander, A.J. An investigation of particle trajectories in two-phase flow systems. J. Fluid Mech. 1972, 55, 193–208. [Google Scholar] [CrossRef]
  27. Amer, O.; Boukhanouf, R.; Ibrahim, H.G. A review of evaporative cooling technologies. Int. J. Environ. Sci. Dev. 2015, 6, 111–117. [Google Scholar] [CrossRef] [Green Version]
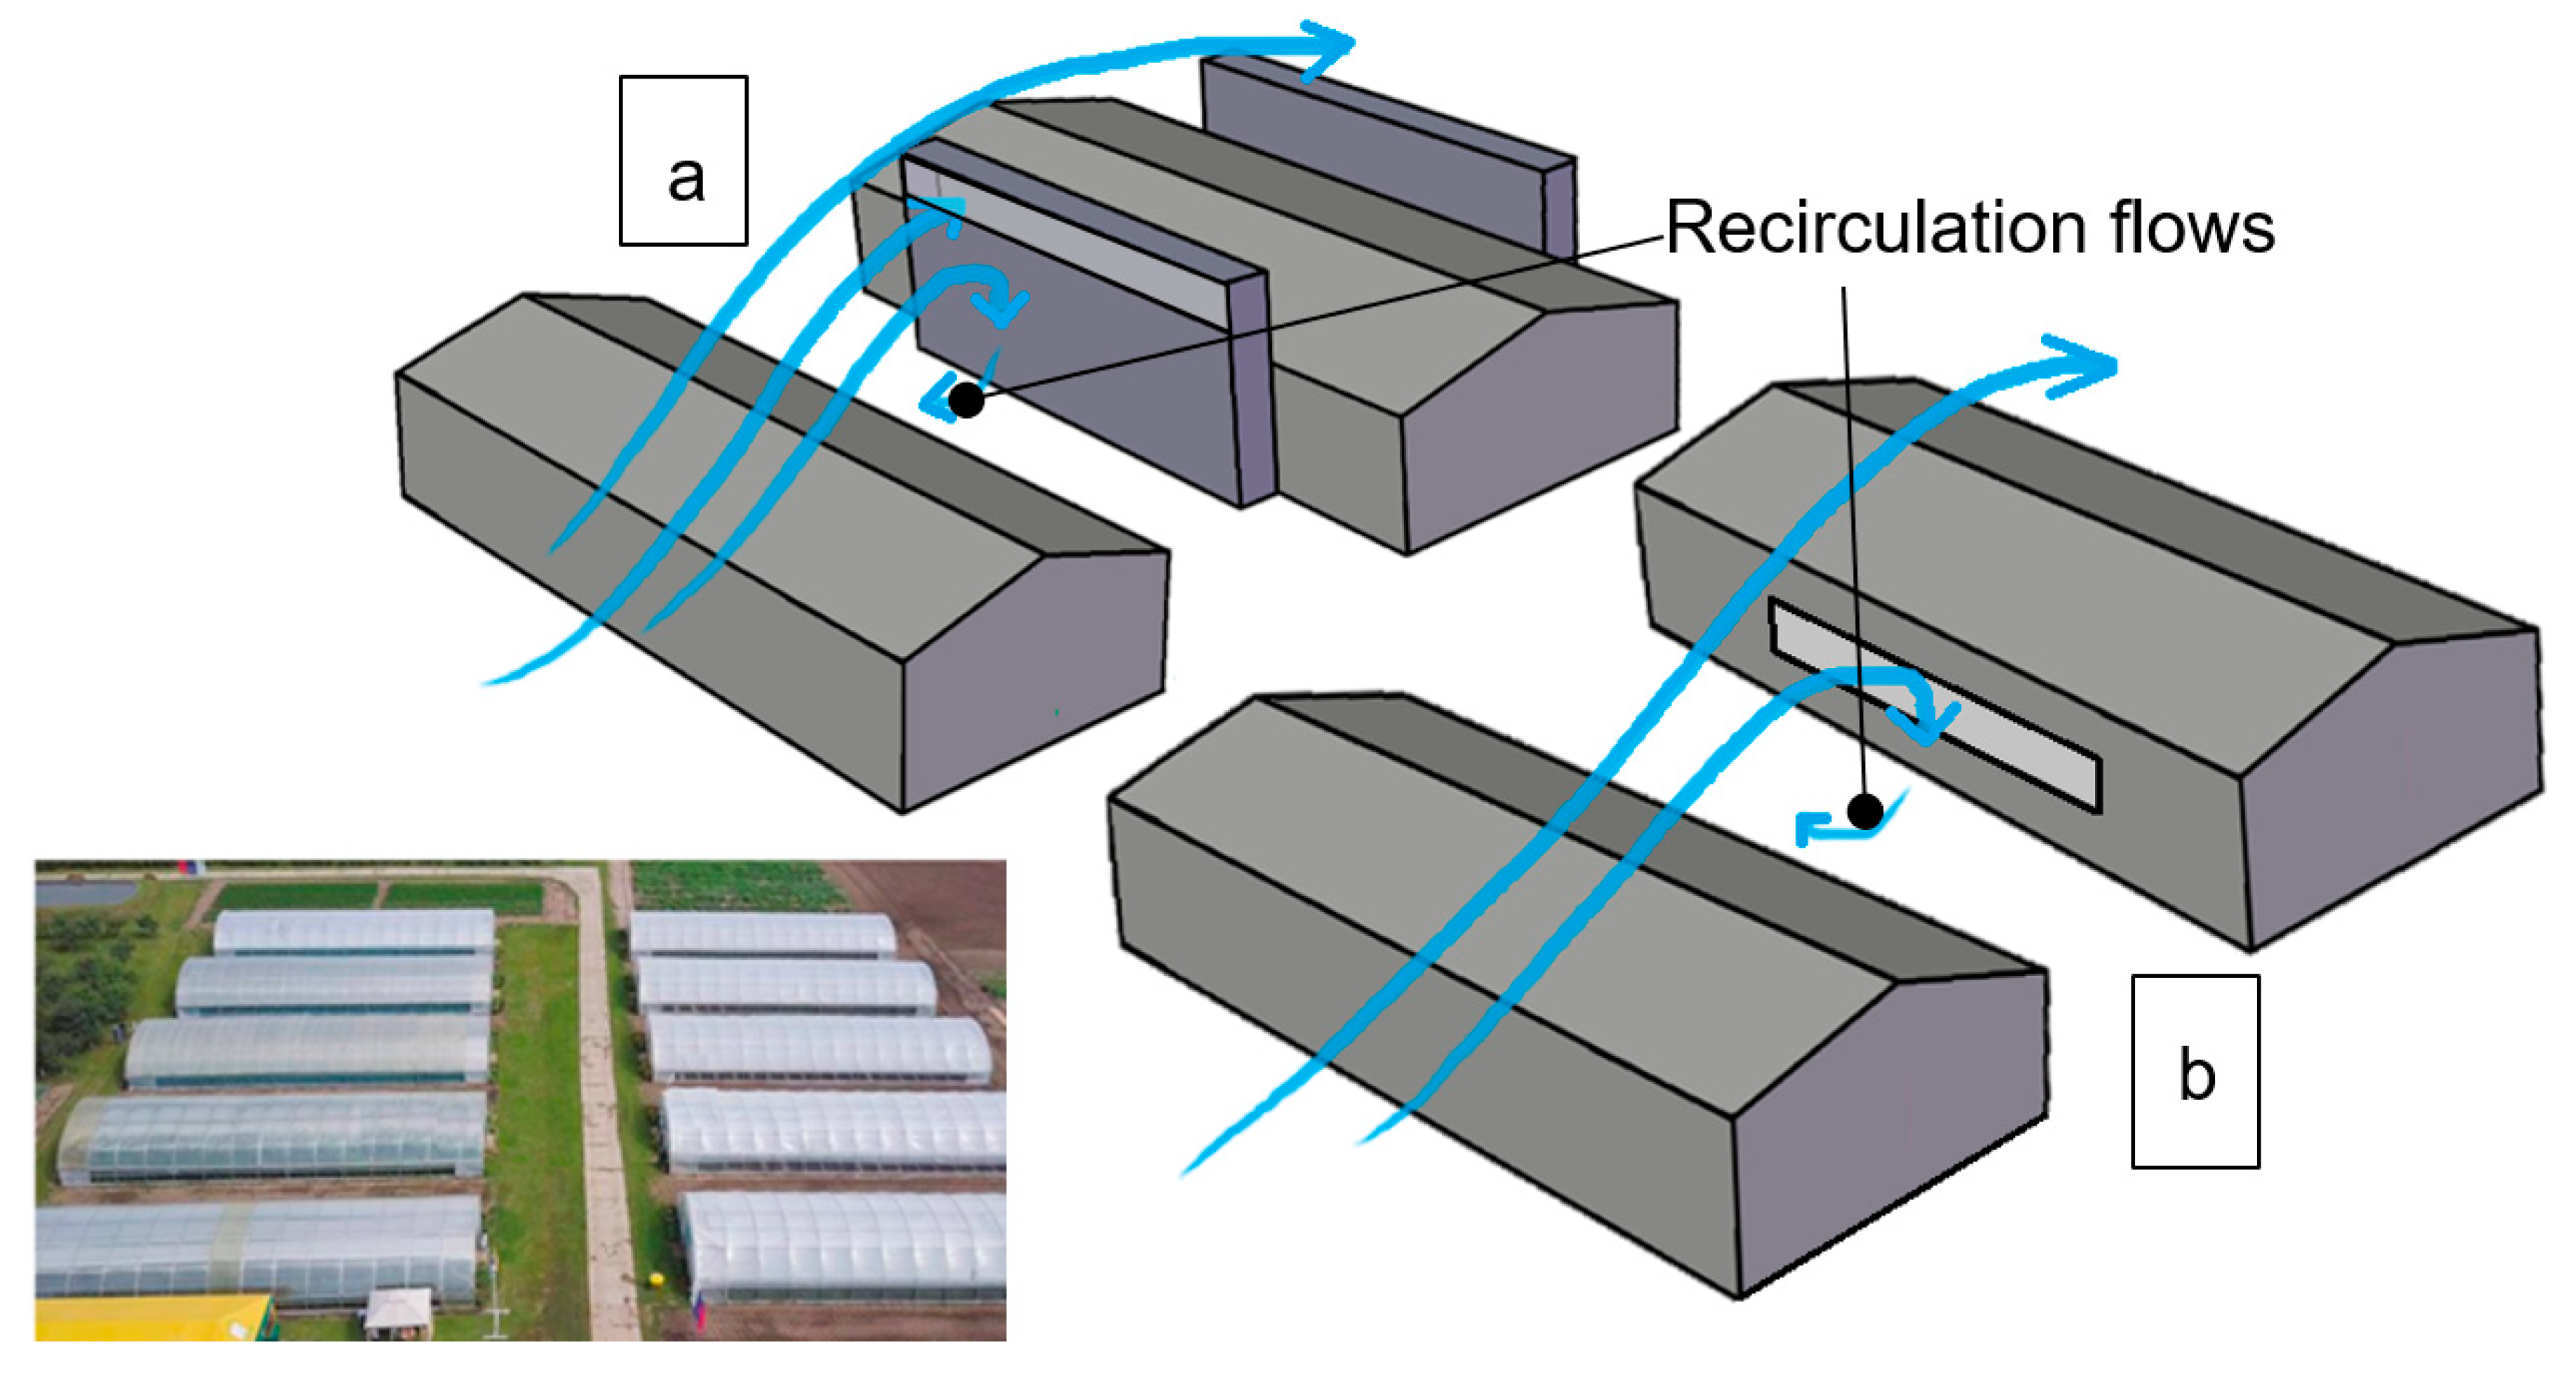
Figure 1. Schematic of a greenhouses with (a) windcatcher and (b) lower level openings surrounded by neighbouring greenhouses.
Energies 13 02934 g001
Figure 2. Computational domain for the simulation of the naturally ventilated greenhouse.
Energies 13 02934 g002
Figure 3. (a) Cross-sectional view of the greenhouse with windcatchers showing the dimensions; (b) The subdivision of the windcatcher into eight vertical domains.
Energies 13 02934 g003
Figure 4. (a) Top view of the eight jet spray nozzle layout; (b) Front view of the eight jet spray nozzle parallel layout; (c) Front view of the eight jet spray nozzle staggered layout.
Energies 13 02934 g004
Figure 5. (a) The structure of the hollow cone spray nozzle used in the experiment of [24]; (b) Hollow cone half-angle = θ as defined in ANSYS Fluent 18.1.
Energies 13 02934 g005
Figure 6. Distance between the greenhouse with a passive downdraught evaporative cooling windcatcher (PDEC-WC) and neighbouring structures.
Energies 13 02934 g006
Figure 7. Simulated results of air velocity along a horizontal centre line of the empty greenhouse model (no crops) at a height of 0.8 m for the grid sensitivity analysis.
Energies 13 02934 g007
Figure 8. Comparison between measurement [22] and Computational Fluid Dynamics (CFD) prediction of streamwise air velocity along the centreline of the greenhouse openings.
Energies 13 02934 g008
Figure 9. (a) Dry-bulb temperature measurement locations on the outlet plane [24]; (b) Comparison between experimental measurements [24] and current CFD results for dry bulb temperatures (DBTs); (c) Comparison between experimental measurements [24] and previous CFD results [23] for dry bulb temperatures (DBTs).
Energies 13 02934 g009
Figure 10. Simulated air velocity contours at the midplane of the greenhouse with a row of plants at the centre: (a) with cross-flow ventilation and (b) with windcatchers.
Energies 13 02934 g010
Figure 11. Air velocity along a horizontal centre line of the opening at a height of z = 0.8 m with cross-flow ventilation and with windcatchers.
Energies 13 02934 g011
Figure 12. The influence of varying outdoor temperatures on the temperature reduction and indoor relative humidity (ambient relative humidity = 24.4%, UHWC = 4.4 m/s at windcatcher roof height).
Energies 13 02934 g012
Figure 13. The influence of varying ambient relative humidity on the temperature reduction and indoor relative humidity (outdoor T = 40 °C, UHWC = 4.4 m/s at windcatcher roof height).
Energies 13 02934 g013
Figure 14. The influence of the water pressure at the spray nozzle on the temperature reduction (outdoor T = 40 °C, RH = 24.5%, UHWC = 4.4 m/s).
Energies 13 02934 g014
Figure 15. The influence of spray nozzle height on the temperature reduction and indoor relative humidity (outdoor T = 40 °C, RH = 24.5%, UHWC = 4.4 m/s).
Energies 13 02934 g015
Figure 16. Comparison of the impact of the number and arrangement of nozzles on the cooling performance (ambient T = 40 °C, RH = 24.5%, UHWC = 4.4 m/s).
Energies 13 02934 g016
Figure 17. (a) Temperature contours at the midplane of the greenhouse using a windcatcher system with four parallel spray nozzles. (b) Temperature contour at the midplane of the greenhouse using a windcatcher system with eight parallel spray nozzles (ambient T = 40 °C, RH = 24.5%, UHWC = 4.4 m/s).
Energies 13 02934 g017
Figure 18. (a) Velocity contour at the midplane of the greenhouse—four parallel sprays. (b) Velocity contour at the midplane of the greenhouse—eight parallel sprays (ambient T = 40 °C, RH = 24.5%, UHWC = 4.4 m/s).
Energies 13 02934 g018
Figure 19. (a) Relative humidity contour at the midplane of the greenhouse—four parallel spray nozzles; (b) Relative humidity contour at the midplane of the greenhouse—eight parallel spray nozzles (ambient T = 40 °C, RH = 24.5%, UHWC = 4.4 m/s).
Energies 13 02934 g019
Figure 20. The influence of the spray nozzle half cone angle (θ) on the temperature reduction (ambient T = 40 °C, RH = 24.5%, UHWC = 4.4 m/s).
Energies 13 02934 g020
Figure 21. The influence of the water mass flow rate on the temperature reduction (ambient T = 40 °C, RH = 24.5%, UHWC = 4.4 m/s).
Energies 13 02934 g021
Figure 22. Velocity contours at the midplane of the greenhouse with cross-flow or windcatcher ventilation (UH = 4.4 m/s).
Energies 13 02934 g022
Figure 23. Simulated air velocity along the centre line of the greenhouse at height z = 0.8 m for the greenhouse with cross-flow or windcatcher ventilation (UH = 4.4 m/s).
Energies 13 02934 g023
Table 1. Simulated configurations of the greenhouse with neighbouring structures.
ConfigurationVentilationL
ACrossflowH
BWindcatcherH
CCrossflow2H
DWindcatcher2H
ECrossflow3H
FWindcatcher3H
Table 2. Spray and droplet characteristics settings.
Spray Settings
Mass flow rate of water spray streams12.50 l / min
Temperature of water spray streams35.2 °C
Pressure difference between the supply water pipe and the spray nozzle Δ P 3 bars
Sheet velocity U 0 22.05 m/s
Droplet Settings
Number of droplet streams for each nozzle300
Droplet size distribution model Rosin–Rammler model
Number of diameters for each droplet stream20
Mean diameter369 μ m
Spread parameter3.67
Minimum and maximum diameter 74 μ m ,   518 μ m