1. Introduction
We are living in a very exciting period because global energy systems are going through a major transformation. One of the main reasons for it is the climate shift which has made it necessary to shift from non-renewable resources to renewable resources in order to build a low-carbon, climate-safe future. In recent years, the demand of renewable energy systems has increased. After the 2015, United Nations Climate Change Conference (COP21) agreement in Paris, many countries have issued a statement regarding the ban on the use of the internal combustion engines (ICE) [
1]. For example, in 2018, Denmark announced that it will ban the sale of new cars with ICE by 2030 and hopes to have one million electric and hybrid cars on the roads by then [
2]. Electric vehicles (EV) will play a major part in smart grids with a high penetration of renewables [
3,
4,
5]. The number of EVs and fuel cell vehicles has been on the rise in the past few years. It is also predicted that by 2020 the total cost of a personal use EV could be the same as an ICE [
6,
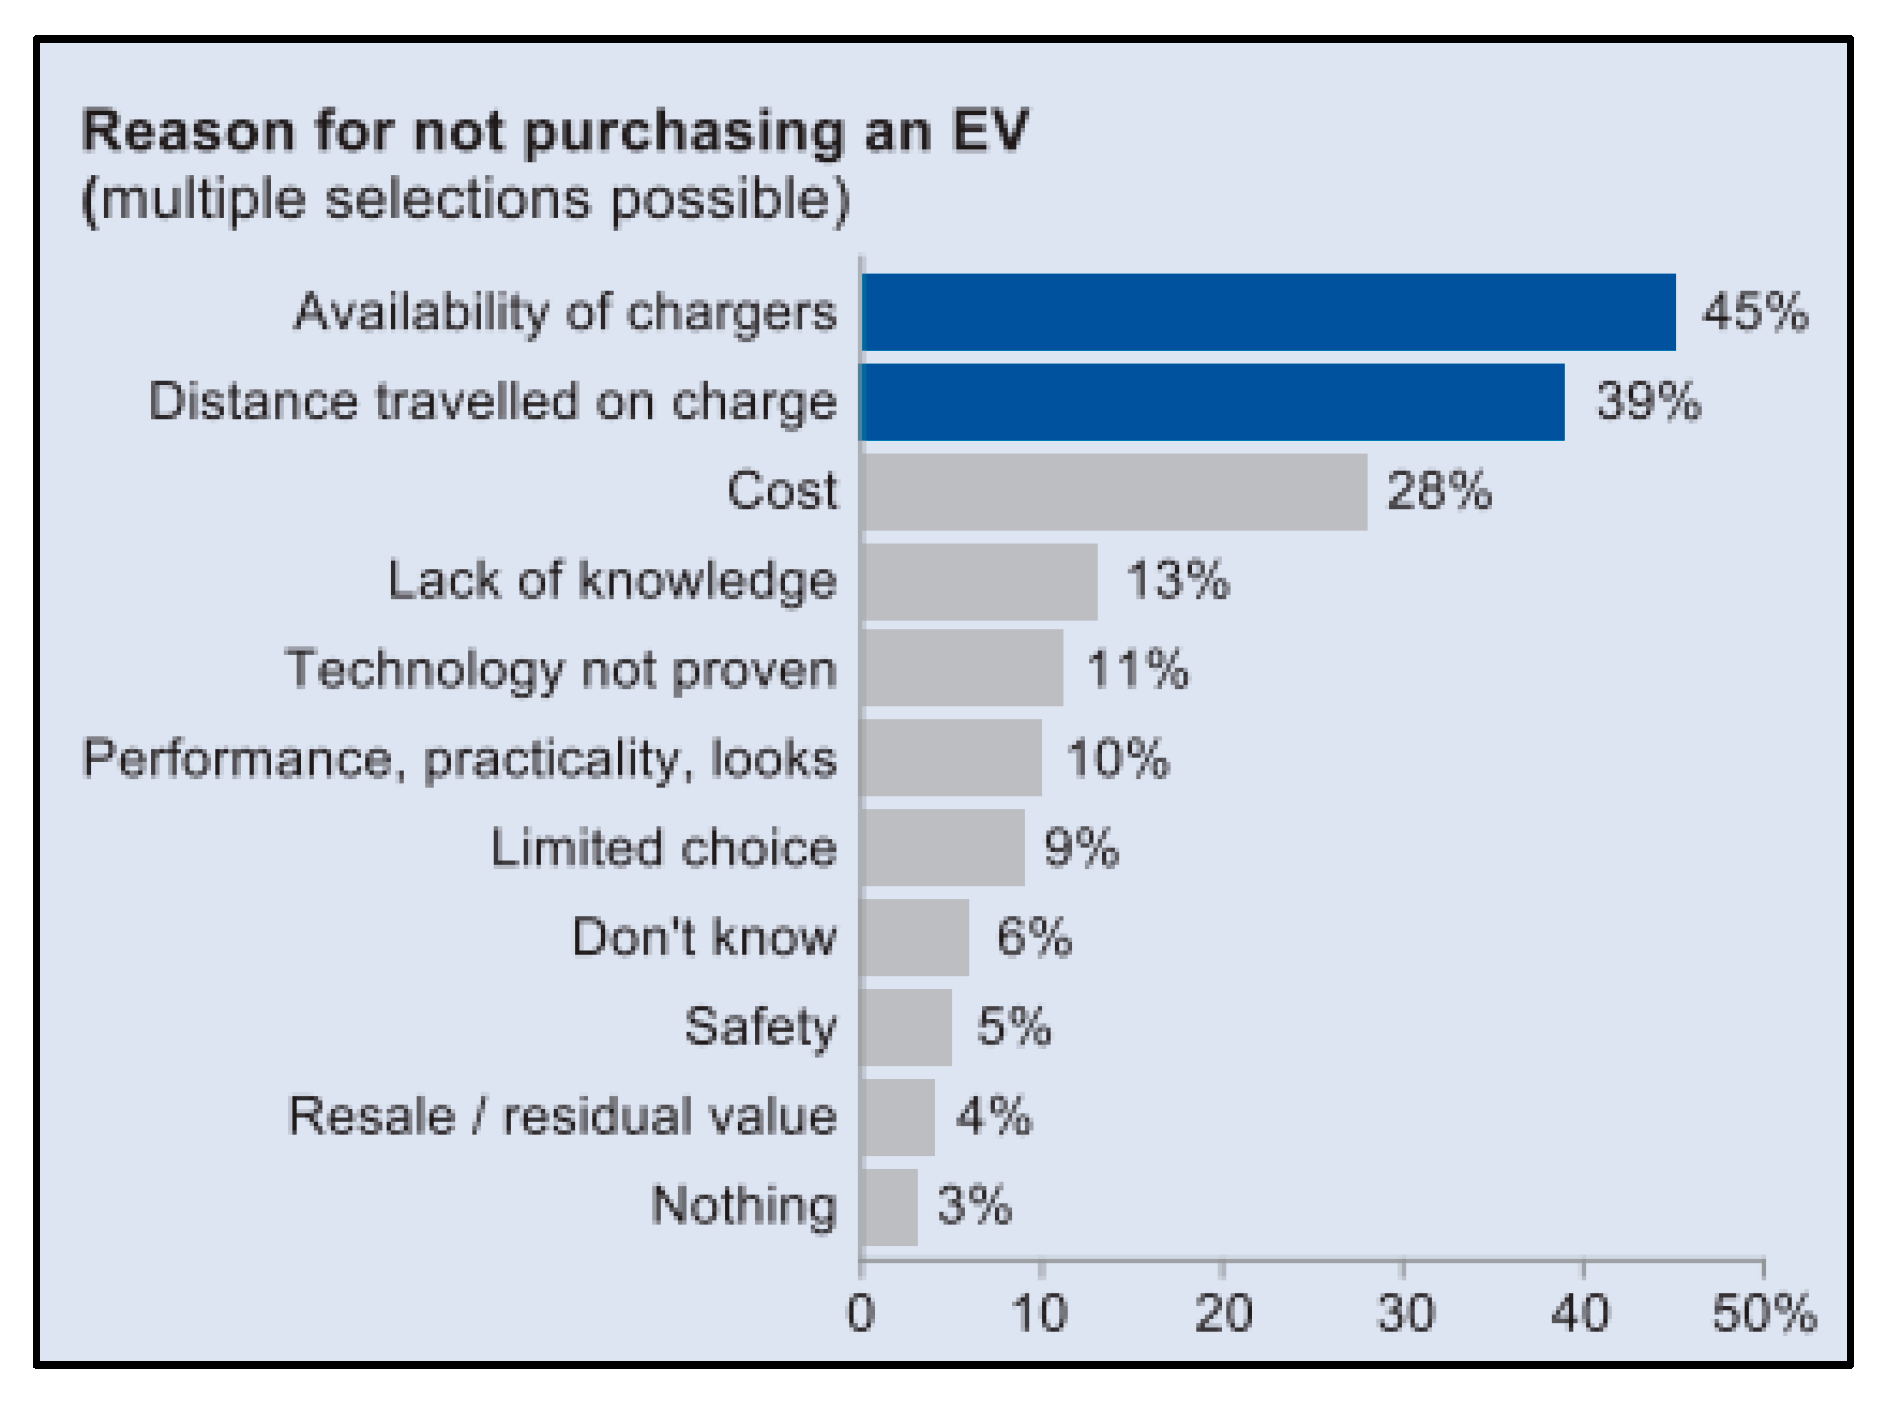
7]. However, even if the cost of the EVs goes down in the future, shortage of available charging stations and limited distance travelled on a single charge are the major reasons impeding the purchase of these EVs, as seen in
Figure 1 [
1]. Hence, it is quite important to develop an optimal design for an integrated charging station which is able to meet the needs.
Denmark has a well-established natural gas grid, and here hydrogen and biogas can play a complementary role in terms of providing stored, renewable energy in large quantities to the Danish energy system. Furthermore, the European Union has provided funding of EUR 40 million for the production of 600 hydrogen buses, of which one-third will be provided to Denmark [
8]. With this green transition development of hydrogen refueling stations is quite imperative. Simultaneously, fuel cell electric vehicles (FCEV) are receiving more focus and stronger support. The charging solutions for both battery electric vehicles (BEVs) and FCEVs are developed and operated independently as they are often seen as two competitive technologies. These two types of charging stations can be integrated into a one-stop charging station, acting as an interface to an integrated energy system, which includes electricity, transportation, and gas. This one-stop charging station will cater to both the BEVs and FCEVs. These circumstances make Denmark an ideal place to demonstrate the power-to-gas solutions.
To transform DTU-Risø campus into 100% renewable campus in the coming years, a case study was conducted by using a fleet of battery-operated electric cars. Adding to this, an integrated charging station for both electric and fuel cell vehicles will bring it one step closer to achieving the aim. To achieve this goal, an example will be set up for other campuses/community to convert into a climate-friendly future integrated energy system with high penetration of renewable energy sources (RESs). The main contribution of this paper is to find an optimal solution for the charging of fuel cell electric vehicles and battery-operated vehicles by answering the following questions:
What is the minimum capacity of the renewable energy required to meet the load demand?
What is the minimum cost of the system to achieve the charging demand of a particular region?
Will the increase in the capacity of the renewables help in decreasing the cost of the system?
Which renewable configuration (grid connectivity or off-grid) provides the most economical solution?
Will developing an integrated energy system for both fuel cell vehicles and battery-operated vehicles be more cost-effective as compared to the stand-alone systems?
So far, many researchers people have used the hybrid optimization model for electric renewables (HOMER) software to find an optimal solution for an electrical load with combinations of different energy sources for producing energy. For example, Edwin Moses in his research used HOMER to find an optimal solution for providing energy to a small village. In this paper the author used wind turbines, Photovoltaics (PV) and bio-diesel generator for producing energy for an electrical load for a small remote rural village. The optimal solution included the use of a hybrid system consisting of solar PV and a bio-diesel generator for producing energy for the village [
9]. David Restrepo used the HOMER simulation for a scenario-based optimization. His work consisted of analysis of two different scenarios with the same load requirements for a location in Medellin, Columbia. The first case considered renewable energy sources and a diesel generator but in a stand-alone configuration. The second case also considered renewable sources but in grid-tied configuration. Both cases showed that PVs are significant contributions for power generation [
10].
The work done by previous researchers showed that a multi scenario-based analysis with different source of renewables to obtain an optimal solution can be done. However, it does not include a charging station as they just use HOMER for power generation and a maximum of two scenario-based optimization analysis. The analysis in this paper takes advantage of two different models-HOMER and heavy-duty refueling station analysis model (HDRSAM), which were integrated to find an optimal solution for a one-stop charging station. The major differences which are included in this paper are the use of different types of loads—hydrogen load and electrical load; use of hundred percent renewables for energy production. Different design scenarios with different system connection setup and use of different types of wind turbines sets the research in this paper aside from the previous work done.
The rest of the paper is structured as follows: The system setup description is briefly introduced in
Section 2.
Section 3 presents the simulation tools used to analyze and design the system. The economic and technical results are described and discussed in
Section 4. Finally, a conclusion is drawn in
Section 5, followed by the discussion on future research.
2. System Setup Description
The investigated system included three types of charging stations: hydrogen refueling station, electrical charging station, and an integrated station with a charging load demand representing the load profile. The charging demand was for one fuel cell bus and fifteen battery-operated electric cars. The hybrid optimization model for electric renewables (HOMER) developed by the National Renewable Energy Laboratory was the tool used for simulation and optimization for energy production in the study case [
11] HOMER has a large inbuilt database of different components, such as photovoltaics, wind turbines, hydro, reformers, batteries, electrolyzer, hydrogen tank, grid, boilers, thermal load controllers, generators, etc. Analysis with HOMER requires information on resources, economic constraints, and control methods. It also requires inputs on component types, their numbers, costs, efficiency, longevity, etc. To find the optimal system set up different configurations of components that the system should have, were optimized. All these configurations were simulated, the infeasible ones were discarded and only the feasible ones are presented, the system with the lowest total net present cost being the optimal system configuration. HOMER only takes into account the energy production and not the charging station part. To integrate the charging station part in the analysis, a heavy-duty refueling station analysis model (HDRSAM) was used to analyses the charging station for the fuel cell bus by optimization to find out the least cost refueling configuration from various refueling station combinations and demand profiles [
12]. It included the data on station configuration, component technologies and cost of interest to government agencies and industry stakeholders. It was assumed that a specific charging station for the battery-operated cars was not required and was treated only as an electric load. The use of these two models was done to get a multi integrated system that included the whole well to wheel process. The final cost of the system was found by adding the optimal solutions from the two case analyses. The system design flowchart is shown in the
Figure 2 The design criteria for finding the optimal solution for charging stations are defined below.
- -
All the electricity came from local renewables, and no electricity was bought from the grid.
- -
Excess electricity could be sold back to the grid in grid-connected systems.
Further, the inputs required for the analysis were the charging demand (hydrogen load and the electrical load profiles), components specifications, and the available local energy sources. These inputs were then used in the design of models HOMER and HRSADM to obtain an optimal solution.
2.1. Locations and Local RESs
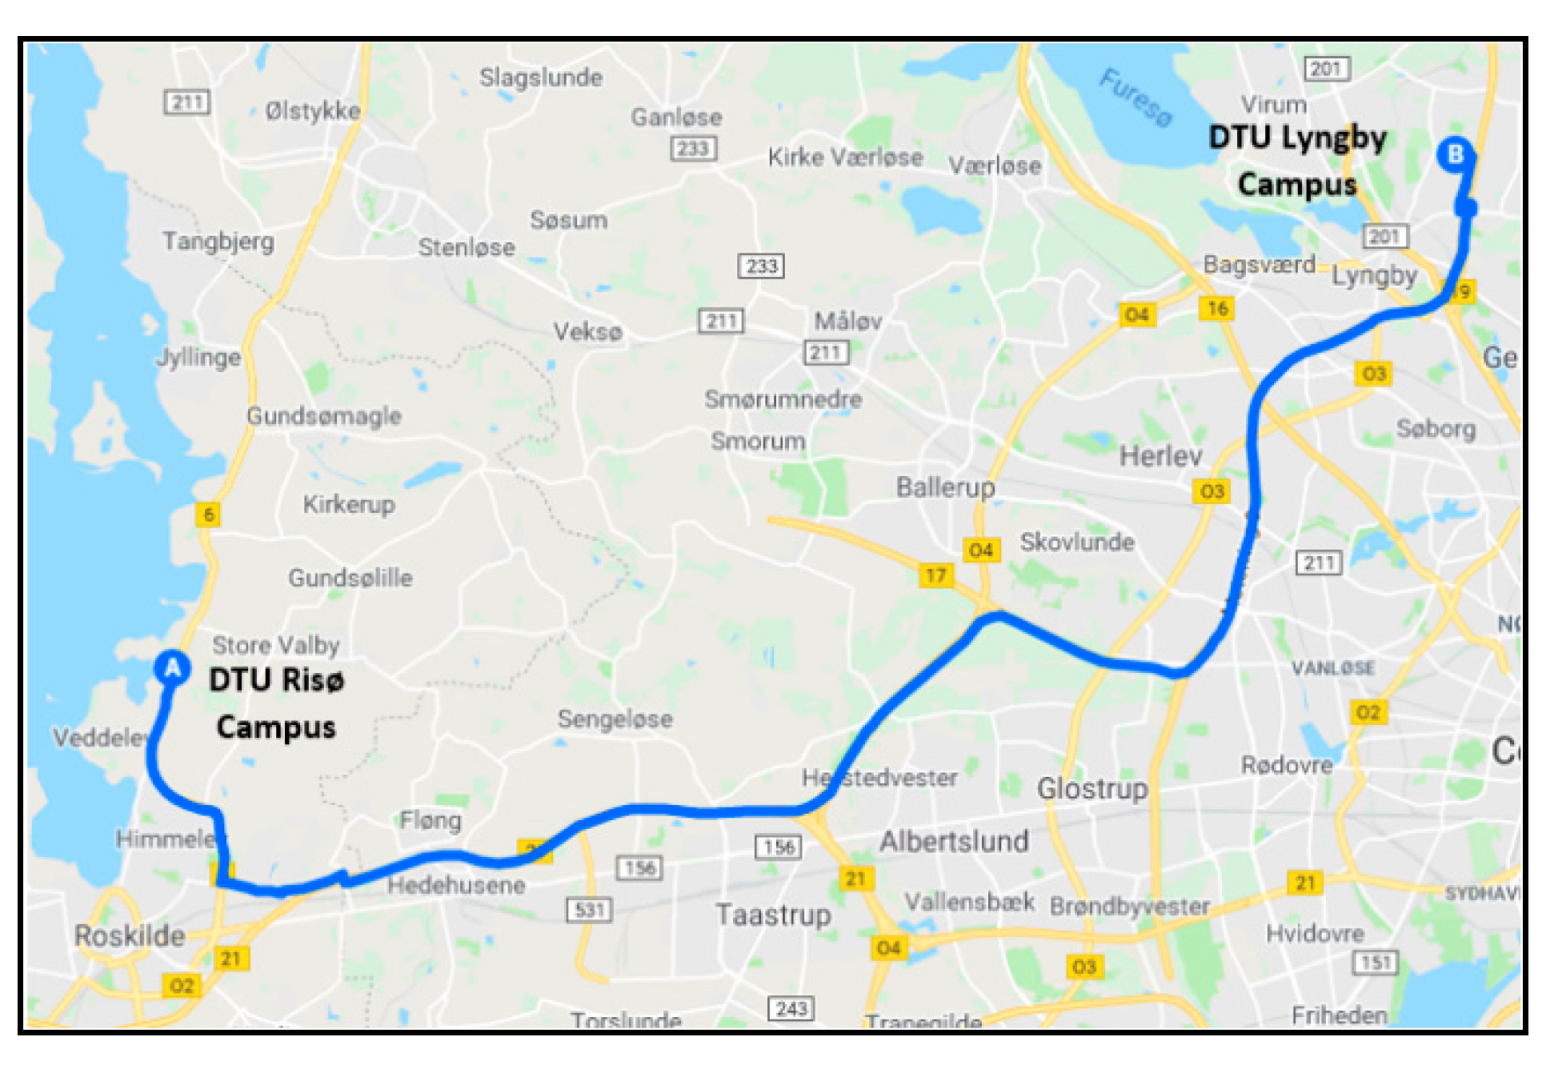
The Danish Technical University (DTU)-Risø campus is located near Roskilde in Denmark (55°41′32.03″ N 12°05′52.21″ E) and the DTU-Lyngby campus is about 14 km north of Copenhagen (55°46′20.96″ N 12°30′06.32″ E). The driving distance between these two campuses is around 42 km, as shown in
Figure 3.
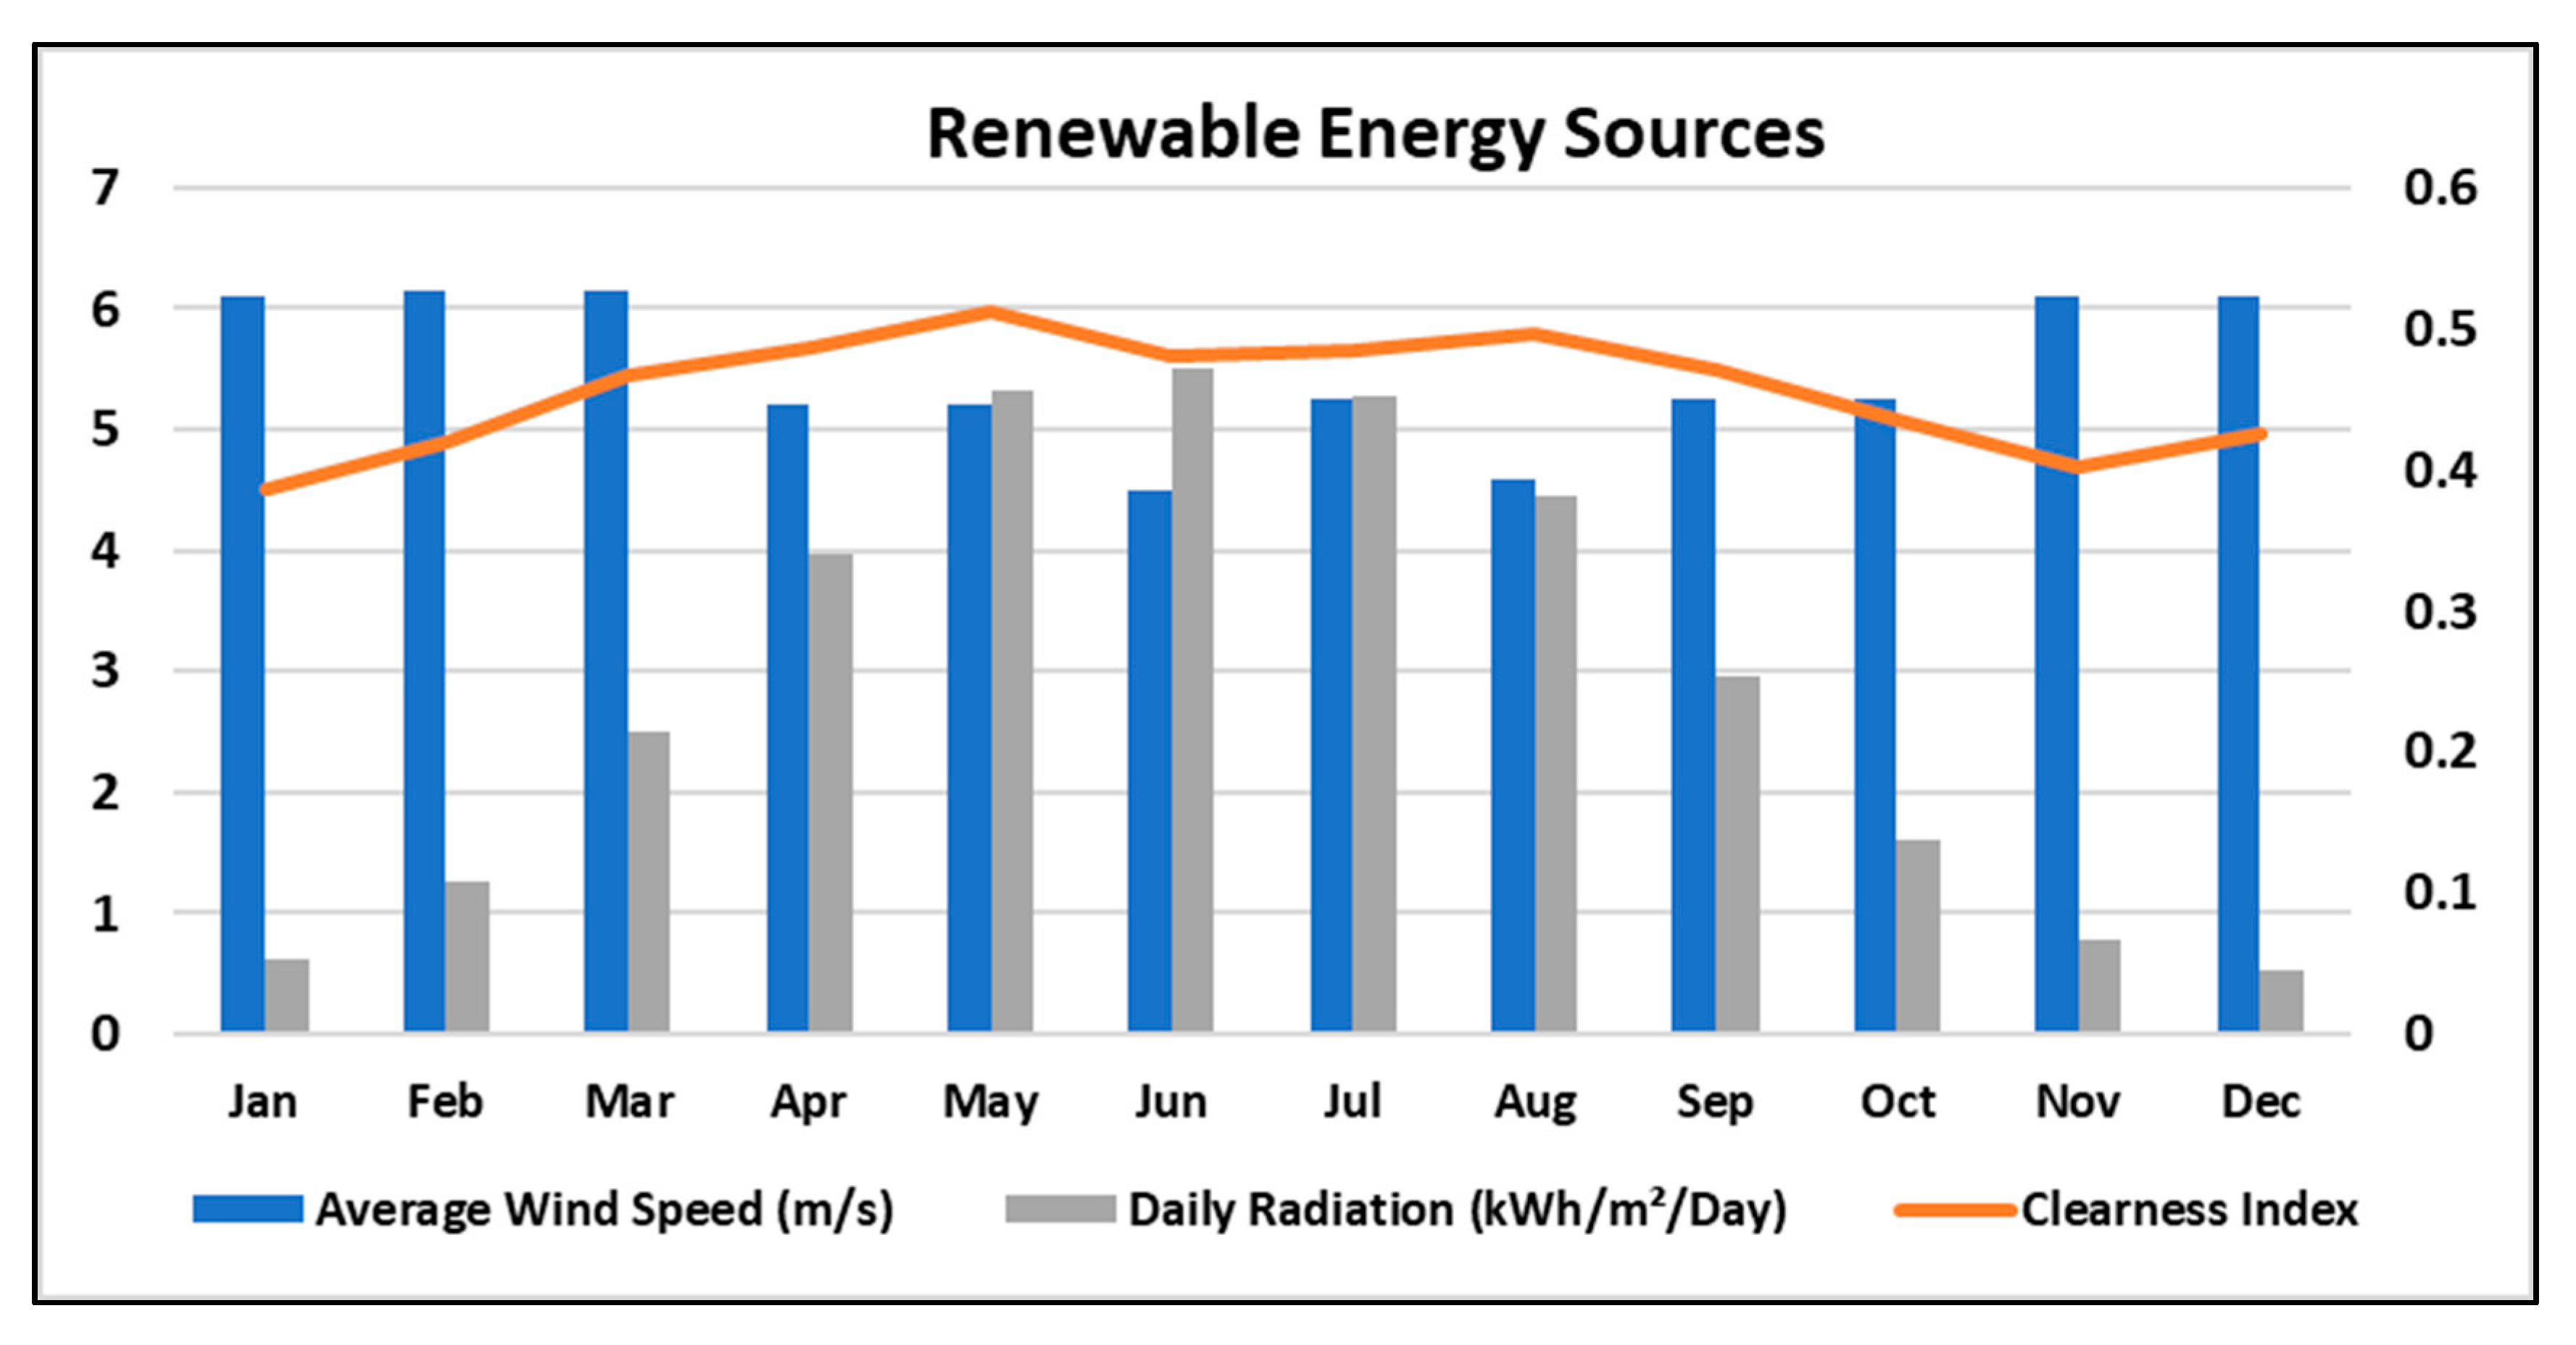
The shuttle bus/cars service ran between the two campuses during the day time. The electric cars were used by small groups of students and staff travelling within the Risø campus and also between the two campuses. The monthly average RESs generation data (left axis) and clearness index (right axis) are shown in the
Figure 4. The average wind speed for the location is 5.49 m/s and the solar global horizontal irradiance is 2.9 kWh/m
2. The average clearness index (0-cloudy, 1-Sunny) is 0.455. In HOMER the clearness index is defined as a measure of the clearness of the atmosphere. It is the fraction of the solar radiation that is transmitted through the atmosphere to strike the surface of the Earth. It is a dimensionless number between 0 and 1. The clearness index has a high value under clear, sunny conditions, and a low value under cloudy conditions [
11].
2.2. Load Profile
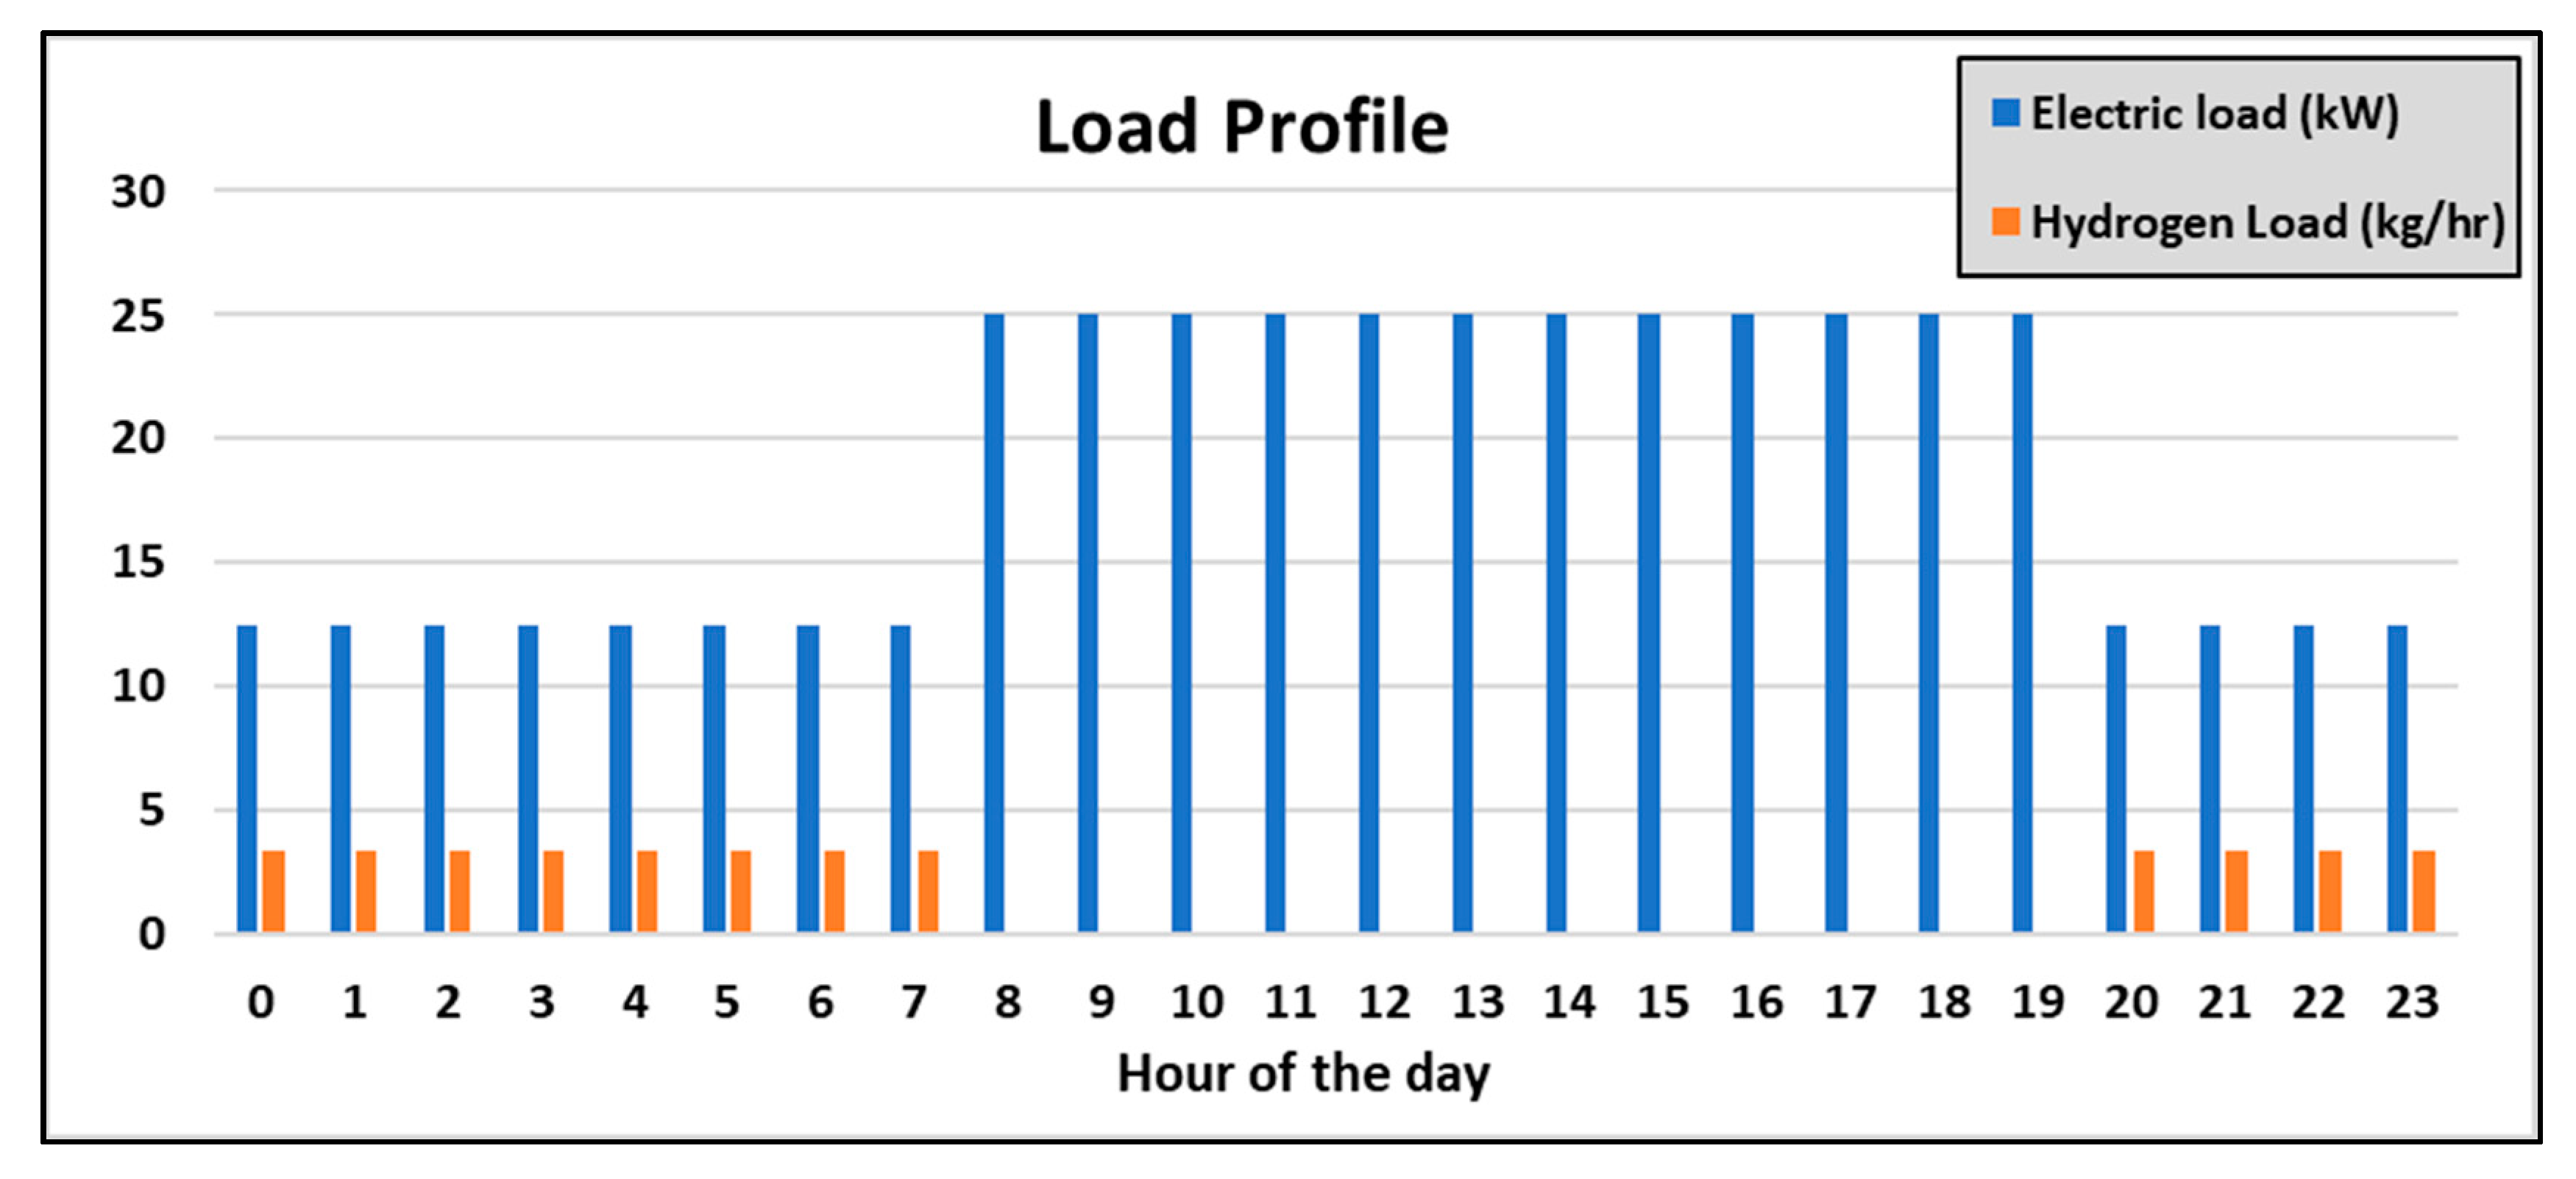
A typical fuel cell bus takes 40 kgs of hydrogen and can travel 440 km with a full tank [
13]. The fuel cell bus was used between the two campuses and made five round trips through the day and the charging of the fuel cell bus took place over the night from 20:00 to 08:00 so that it could be used during the day. The load profile of 40 kg/day was spread equally between the twelve hours giving an average load of 3.33 kg/h.
While each battery-operated car had battery energy of 30 kWh/day, the total electrical load was 450 kWh/day for 15 EVs. It was also assumed that the charging was DC system type charging. Five cars were charged during the night from 20:00 to 08:00, and ten cars were charged during the day time from 08:00 to 20:00. During night time, the load of five cars was spread equally over twelve hours giving us the average load of 12.5 kW. While during the day time the load of ten cars was spread equally over twelve hours giving the average of 25 kW. The average load for the whole day was 18.75 kW. The hourly load profiles of one day are shown in the
Figure 5.
3. System Analysis Using HOMER Software and HDRSAM Model
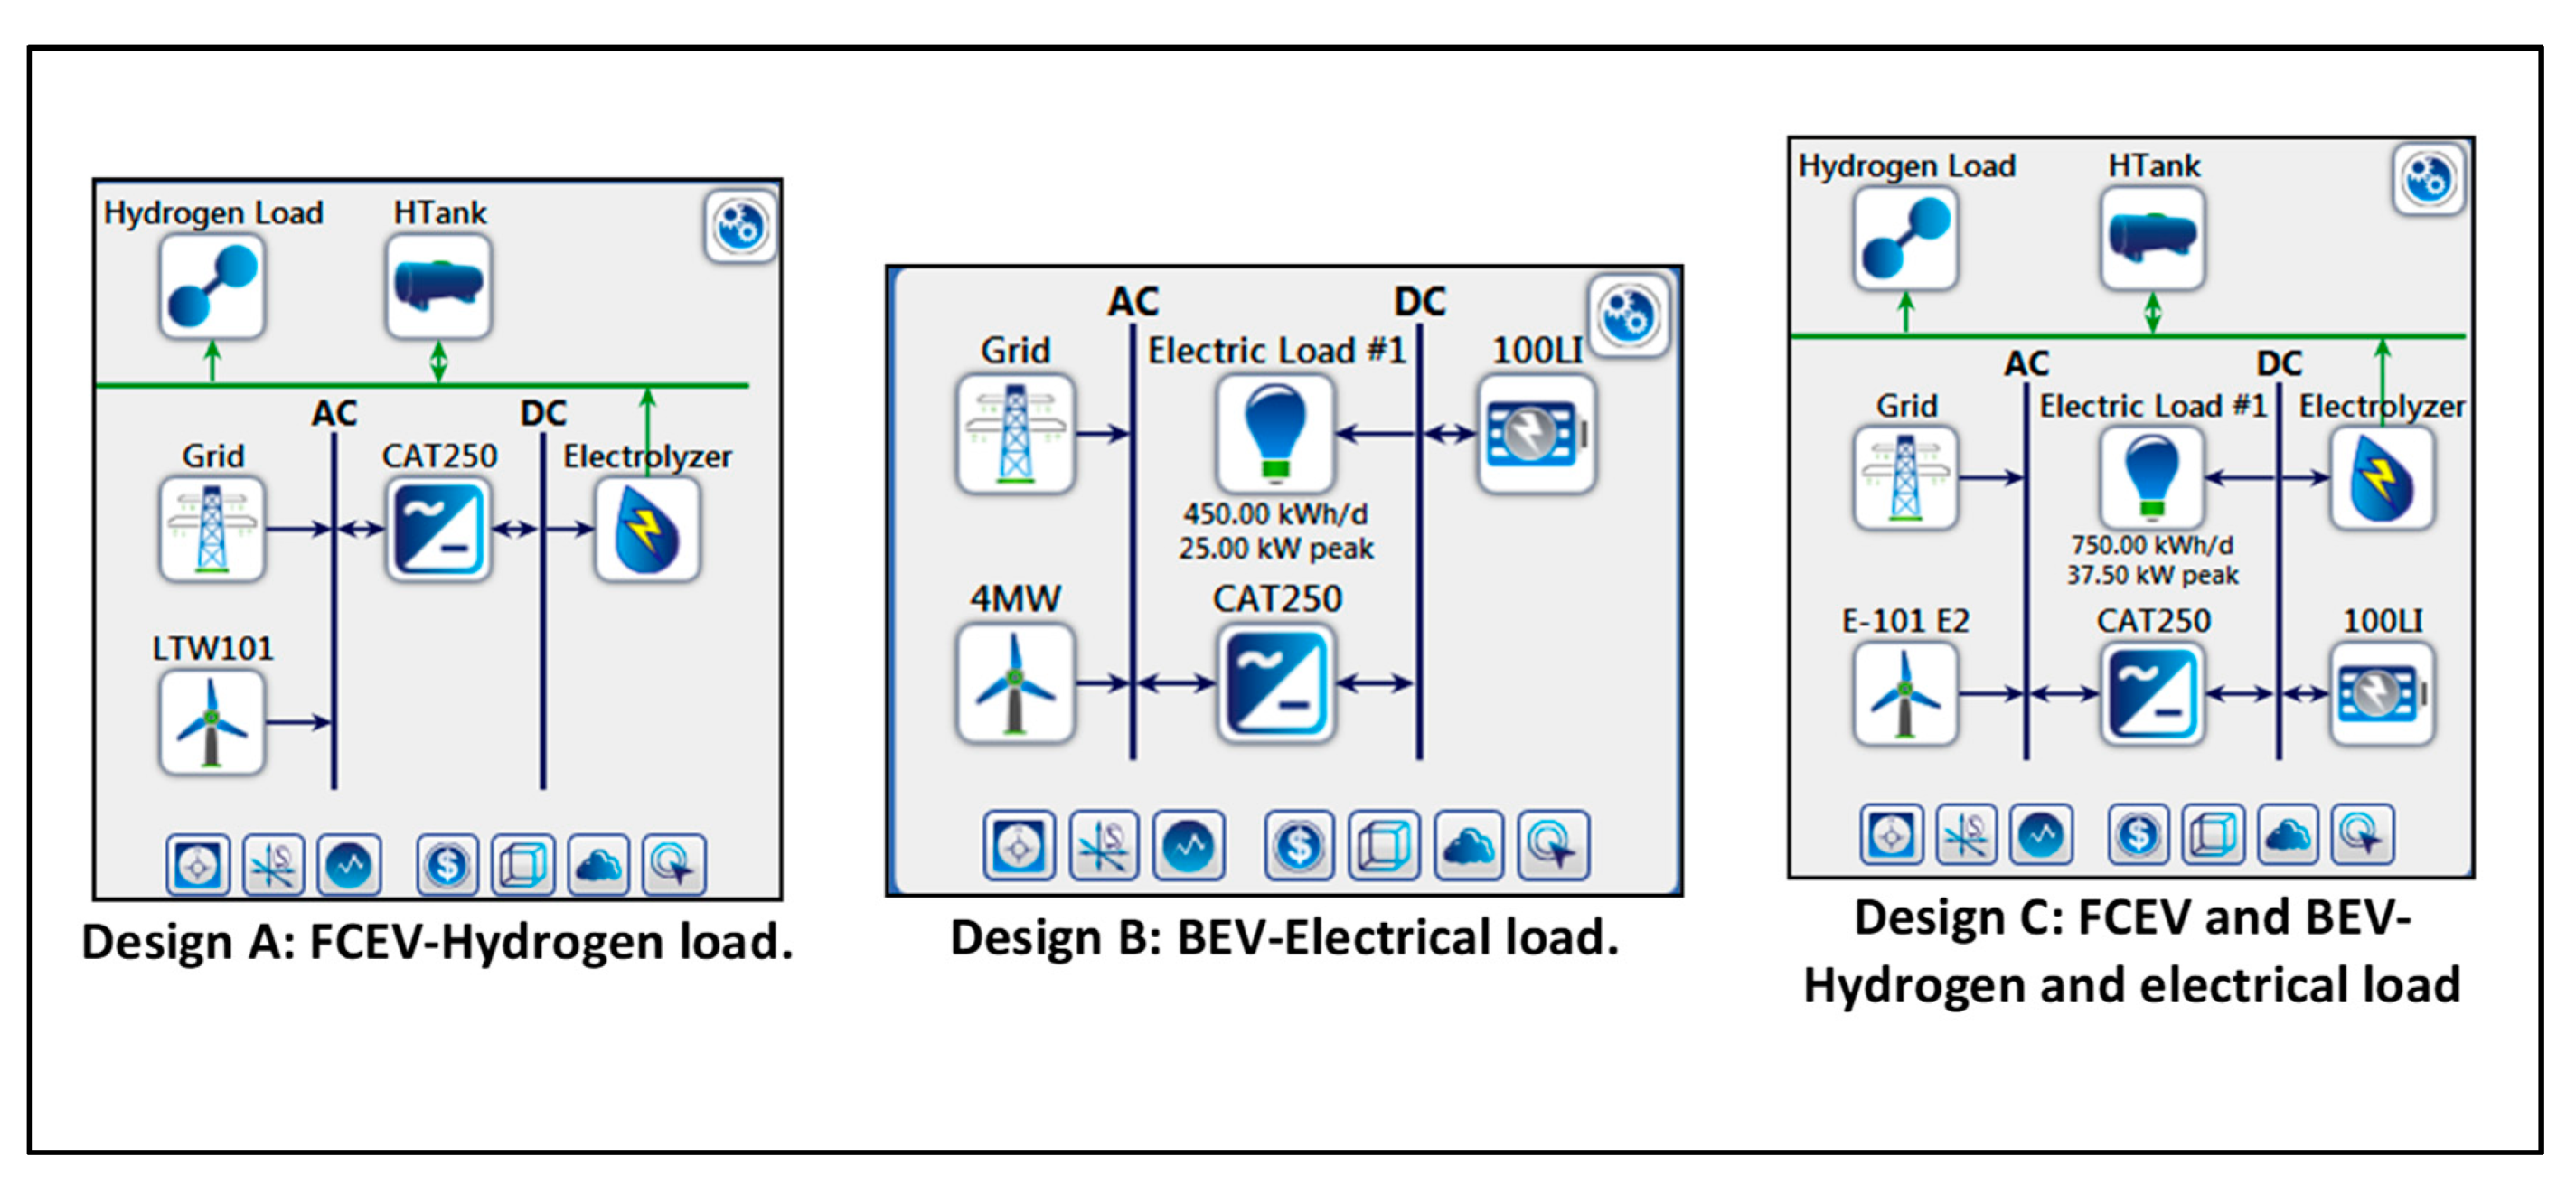
Using HOMER software, the analysis at DTU-Risø campus was conducted for three design scenarios–design A (hydrogen load for a fuel cell bus), design B (electrical load for battery-operated electric cars), and design C (both hydrogen and electrical load for electrical cars and fuel cell bus). Design C is basically an integrated one-stop charging station which caters to both the BEVs and FCEVs. Each design further had two system configurations: grid-connected and stand-alone/off-grid.
The basic configuration for the three designs is shown
Figure 6. In all the designs, wind energy was considered to be the primary source of energy. An electrolyzer driven by RES (wind in this case) was used for hydrogen production to fulfil the hydrogen load for a fuel cell bus. A hydrogen tank was used for storing the excess hydrogen. When the energy produced by the wind was not enough to fulfil the required hydrogen load, hydrogen from the tank was used. In case of grid connection configuration, a grid was present to which the excess electricity could be sold. In the off-grid system, the grid component was not used. Other components of the system were a power electronic converter to convert the current from AC to DC and a generic Li-ion battery for energy storage.
3.1. Component Specifications
3.1.1. Wind Turbine
Seven wind turbines selected for system analysis are listed in the
Table 1. Wind turbines ranging from 500 kW to 1500 kW were investigated. The lifetime for each wind turbine was considered to be 25 years for each scenario. The wind turbines in our analysis had an alternating electrical bus connection. The onshore wind installation cost in Denmark is
$1.6 million per MW, while the operation and maintenance cost are around
$35 per kW [
14].
3.1.2. Electrolyzer and Hydrogen Storage
The size of the electrolyzer used in the analysis varied from 100 kW to 600 kW. The efficiency of the electrolyzer was 85% and the lifetime was considered to be 15 years. The capital cost of the electrolyzer used in our study was
$368 per kW, and the replacement cost was taken as 50% of capital cost,
$184 per kW, and the operational and maintenance cost was 10% of capital cost,
$35 per kW [
15]. The size of the hydrogen tank varied from 100 kg to 400 kg. The capital cost of the hydrogen tank was taken to be
$623 per kg, the replacement cost was the same as the capital cost, and the operational and maintenance cost was taken to be 5% of the capital cost
$35 per kg [
16].
3.1.3. Battery Storage System and Power Converter
A Li-ion battery of capacity 100 kWh, with a nominal capacity of 167 Ampere-hour (Ah), round trip efficiency of 90% was used for electricity storage in design B and C. The capital cost of the battery per quantity was considered to be
$15,000, the replacement cost was also the same as the capital cost, and the operation and maintenance cost was estimated at
$1000 per battery per year [
6].
In addition, a caterpillar bidirectional power converter CATBDP250 was used. The size of the convertor varied from 250 kW to 750 kW. The lifetime and efficiency of this converter were estimated at twenty-five years and 96%, respectively. The capital cost of the convertor was
$94 per kW, the replacement cost was the same as the capital cost and the operational and maintenance cost was
$10 per kW [
17].
3.1.4. Grid
A simple model of the grid was used; this operation mode allows specifying a constant power price, sellback price and sale capacity. For an off-grid system, this system is not added. The price for the electricity for the industry in Denmark for the year 2017 was 0.095
$/kWh, while the grid sellback price was taken 0.045
$/kWh [
18]. The cost of all the components is listed in the
Table 2.
The total net present cost of the system is the present value of all the costs the system incurs over its lifetime. The project lifetime was taken to be twenty-five years, while the nominal discount rate and the inflation rate were kept at 8% and 2%, respectively. The cost of the system included all the capital cost, replacement cost, Operation & Maintenance(O&M) cost, fuel cost, emission cost, cost of buying power from the grid. It also included the earnings from selling of the excess energy if a grid connection was present. This was the main economic output, the value by which it ranked all the system configurations in the optimized results. The net present cost or the life cycle cost of individual components was calculated and then of the system as a whole. The nominal cost of each component was calculated by adding the capital cost, replacement cost, salvage cost, O&M cost, and the fuel cost. Salvage cost is the residual value of the power system components at the end of the project lifetime. The salvage cost is different for each component. This amount is subtracted from the sum of the capital cost, replacement cost, and O&M cost to get the total cost of each component. HOMER multiples the nominal cost with the discount factor for each year and then sums all the cost for each year, to get the discounted total for each component. The discount factor and the salvage cost were calculated by HOMER [
11].
3.2. Optimization Variables
By using of HOMER, all possible combinations of system types can be investigated in a single run, and then sorts the systems according to the optimization variable of choice. The search space in HOMER helped us to define the capacity or the quantities of the various components used. HOMER uses these values to simulate all of the system configurations which are feasible. HOMER simulates every configuration in the search space and only shows the feasible solutions. The feasible solutions are then presented from the lowest to highest net cost of the system. Optimization variables used in the analysis included the number of wind turbines and number of batteries, electrolyzer capacity (kW), converter capacity (kW), and hydrogen tank (kg), which were the key optimized values to answer the research questions in the
Section 1.
3.3. Sensitivity Variables
A sensitivity analysis can be performed by inputting multiple values for a particular input variable. HOMER repeats the optimization process for each of value assigned to the variables. Three sensitivity variables (capacity shortage, maximum unmet hydrogen load factor, and renewable fraction) were used in the analysis. Capacity shortage is the shortfall that occurs between the required operating capacity and the actual operating amount that the system can provide. HOMER considers any system that experiences unmet load as infeasible, only if a system is able to meet the demand, the system is termed as feasible. The default value of the capacity shortage was zero but was varied from zero percent to 100% in the analysis. This parameter was only for the battery-operated vehicles which were represented by the electrical load. Similarly, for fuel cell bus another factor called unmet hydrogen load was taken into account, the same principle as capacity shortage implied for this, but for fuel cell buses represented as hydrogen load. The default value for this parameter was zero, but was varied from zero to 100% to check how much of the hydrogen load could be fulfilled by a particular type of renewable. The renewable energy fraction was varied from 98% to 100%; however, as discussed in the research question and the design criterion that all the energy came from renewable energy sources making the renewable energy fraction fixed to 100%. This also took into account that no energy was being bought from the grid. The optimal solution will be the one where the capacity shortage is zero percent, unmet hydrogen load is zero percent, and the renewable fraction is hundred percent. By doing this, it ensures that all the energy is from the renewables. The sensitivity analysis will help in determining whether a scenario is able to fulfill a load profile or not. If not, then by what percentage was the load profile not fulfilled for both capacity shortage and hydrogen unmet load.
3.4. HDRSAM Analysis
The HDRSAM model was used for the fuel cell bus refueling analysis. The number of years for analysis, amount of hydrogen per vehicle and the discount rate were kept the same as in HOMER. The schedule for refueling the busses was also kept same as that of the load profile used in HOMER. In this way, HDRSAM could be integrated into the HOMER model simulation by adding a new module function of refueling analysis. The charging of the bus took place during the night. Two types of station options were present—a gaseous hydrogen station and a liquid hydrogen station. For our analysis only the gaseous hydrogen station was considered. While the dispensing option varied from 350 or 700 bar cascade dispensing, 700 bar booster compressor, 350 or 700 bar vaporization or compression and 350 bar cryo-pump dispensing, the production volume of the components varied from high, medium to low. Overall, there were more than hundreds of input parameters in the HDRSAM model. They were kept to their default value for our analysis.
A total of 18 scenarios were analyzed with variation in hydrogen delivery option (tube trailer or pipeline delivery), production volume (low, mid or high), hydrogen dispensing option (cascade dispensing or booster compressor dispensing), and hydrogen dispensing option (350 bar or 700 bar). The general economic assumptions are listed in the
Table 3. It was assumed that the station started in 2019, with a one-year construction period. The fueling rate was taken as the default value of 1.8 Kg/min. It was also assumed that the station was utilized as 100% of its capacity through the year.
The model outputs were three key economic figures, the cost of the hydrogen, station capital cost, and time to positive return on investment. The hydrogen cost that is presented here was only for owning and operating the station. The components whose cost was included in the system were dispenser, storage, compressor/pump, refrigeration, electrical, controls, and others.
4. Simulation Results and Discussion
4.1. HOMER Analysis Results
A total of 42 scenarios were analyzed using HOMER. Seven different wind turbines (WT) with capacity ranging from 0.5 MW to 1.5 MW were used in each design, A, B, and C, each presenting different load profiles with two systems grid and off-grid, as shown in
Figure 7.
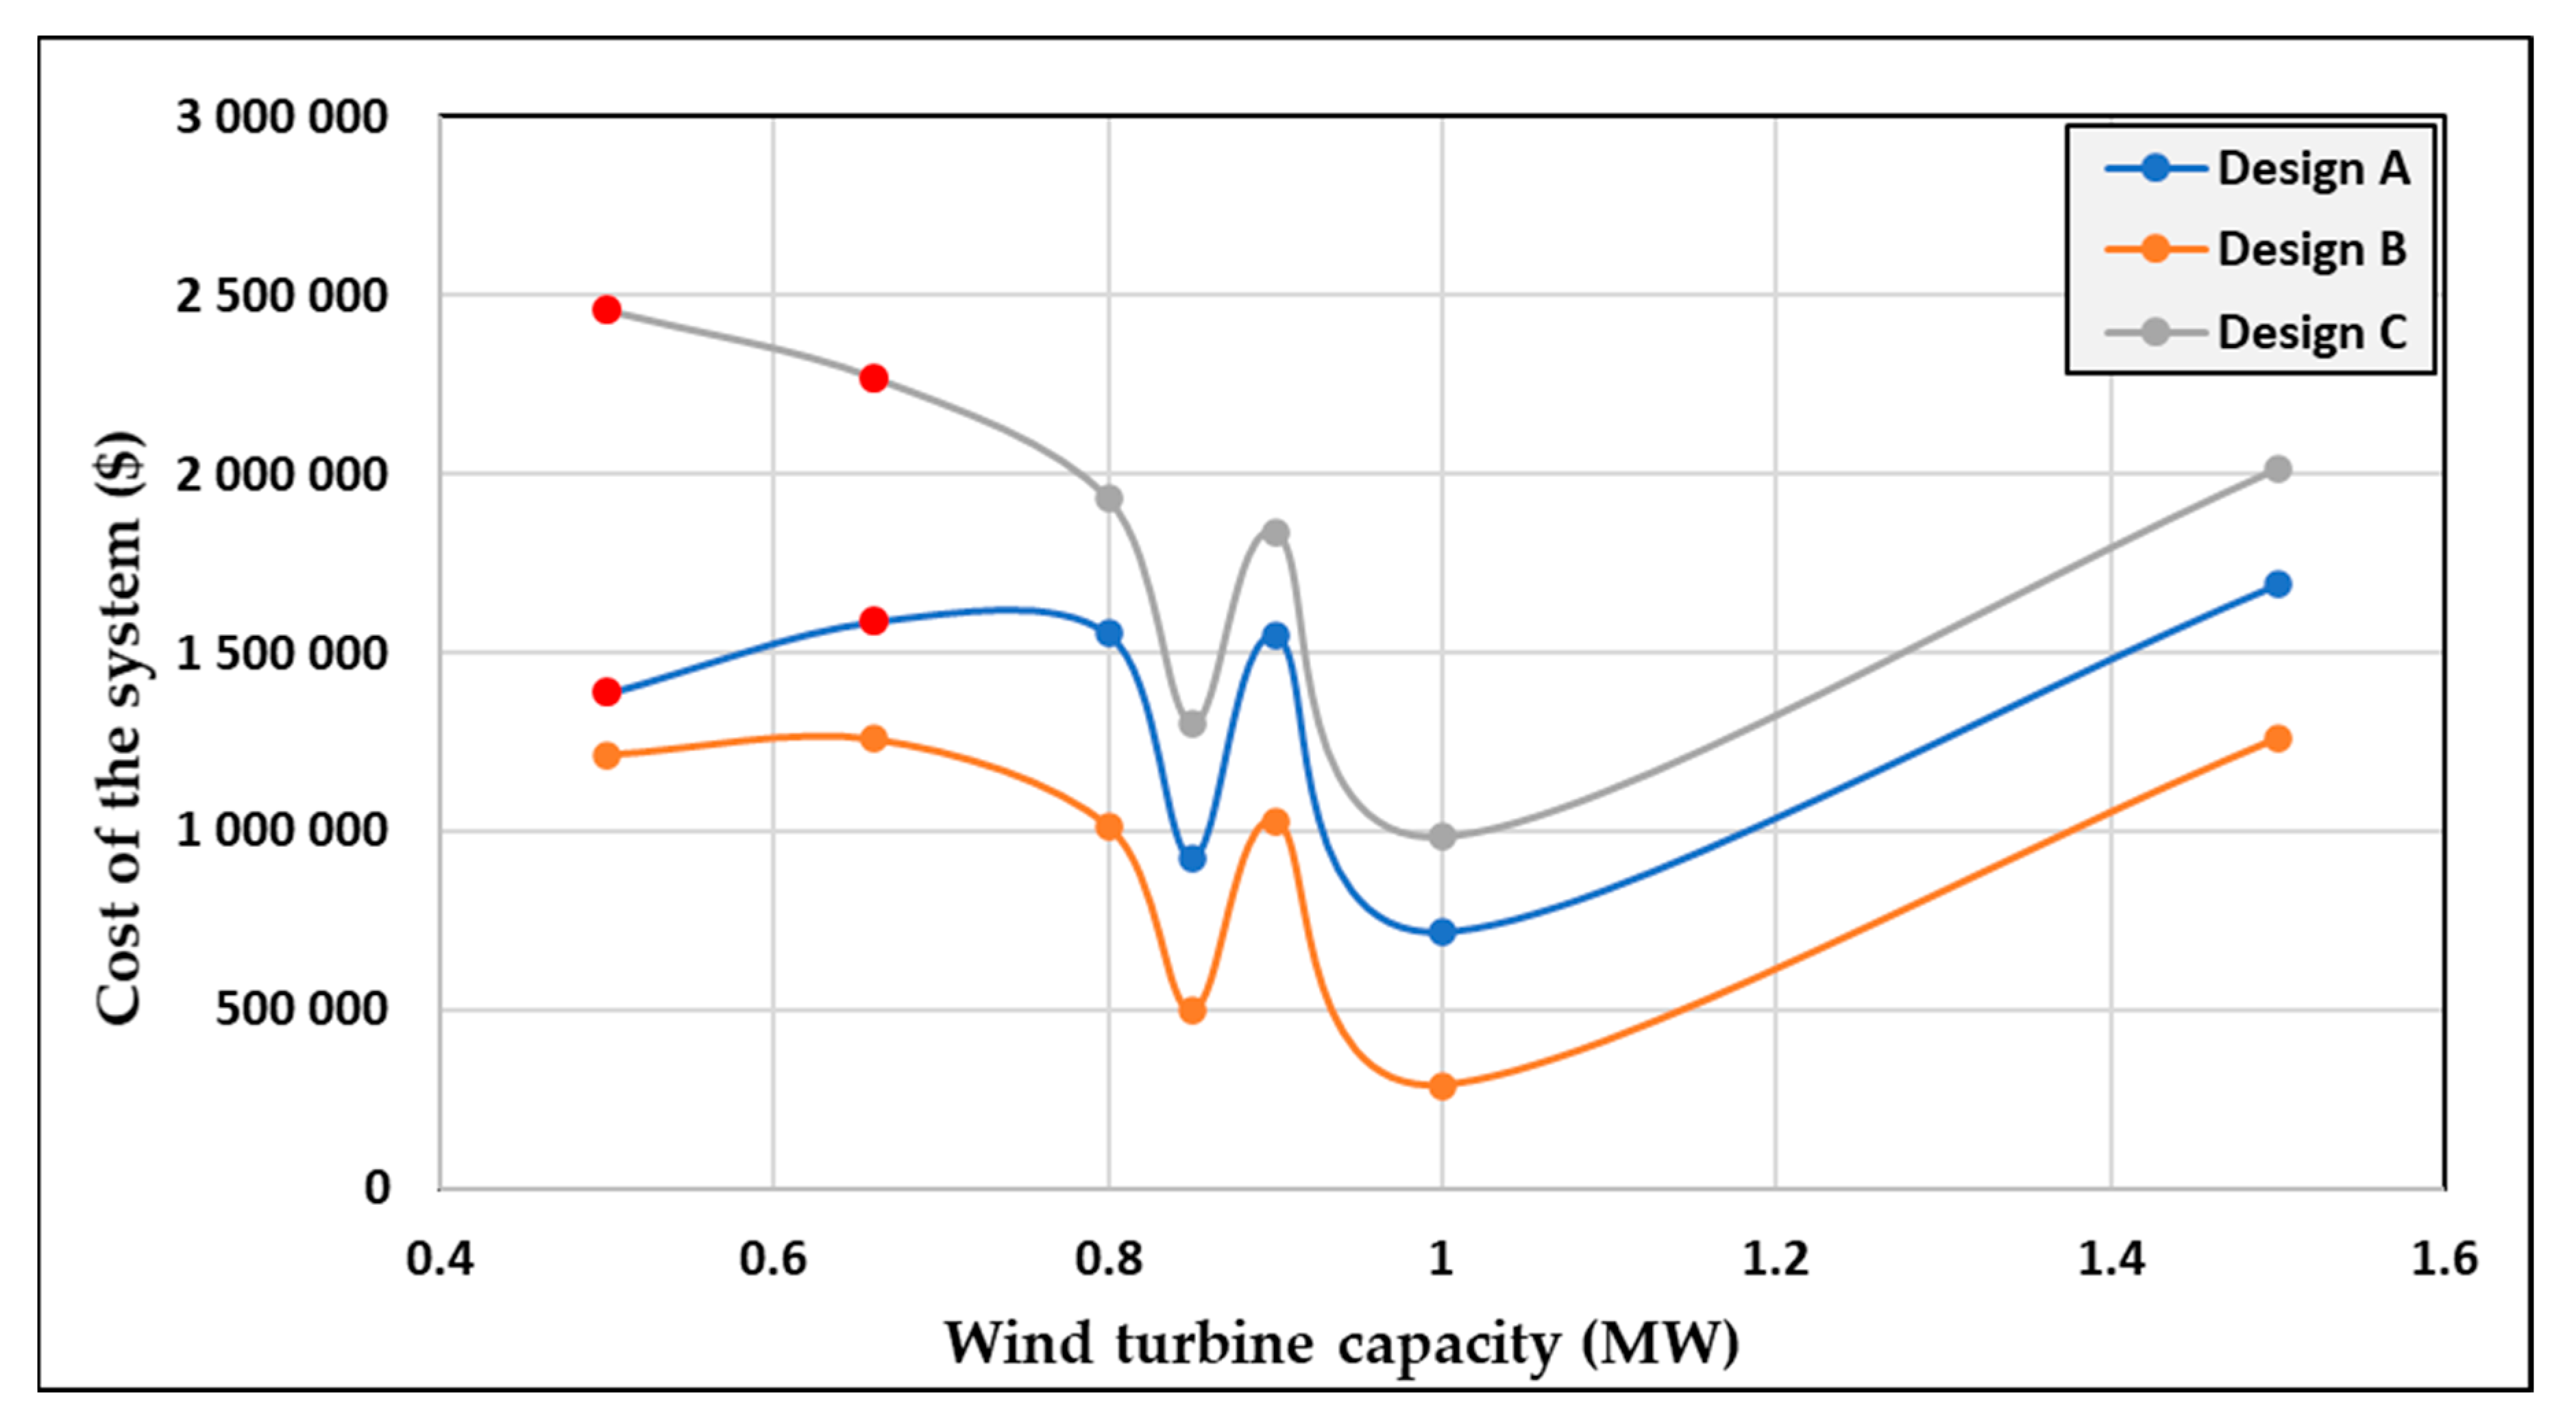
A comparison of design A, B, and C for the grid-connected systems is shown in the
Figure 8. The general trend of increasing system cost with increasing wind turbine capacity can be observed. However, the remaining variation of the system cost can be explained by other factors, such as the grid connectivity and the annual energy production, which was dependent on the wind turbine type. The red dots on the curves in
Figure 8 indicate that the load profile was not being fulfilled by the renewable sources and required additional energy from the grid to fulfill the load profile. For the design A, 0.5 MW and 0.66 MW wind turbine, the hydrogen unmet load was 20% and 5%, respectively. Similarly, for design C, 0.5 MW and 0.66 MW wind turbines, the electrical load was met but the hydrogen unmet load was 25% and 10%, respectively. As these scenarios did not fulfill the load profile, they were considered infeasible.
For the scenarios where the demand was being fulfilled, the irregularity of the cost peak for the 0.9 MW wind turbine can be explained by the fact that the 0.9 MW wind turbine produced less energy and hence, less payback from the grid, raising the overall cost of the system. Since all scenarios were grid connected, the excess electricity could be completely sold back to the grid, which helped reduce the overall system cost. This trend can be clearly seen at the decreasing cost between the 0.8 MW and 0.85 MW wind turbine and between the 0.9 MW and 1 MW wind turbine.
The answers to the research questions listed in
Section 1 can be obtained from
Figure 8. It can be observed that for design A and C, 0.8 MW wind turbine system was sufficient to fulfil the load profile. However, the optimal solution was found by using a 1 MW wind turbine system. For design B, a 0.5 MW turbine system was sufficient to fulfil the load profile. However, the optimal solution was found by using a 1 MW turbine system. The optimal solution for all the designs was provided by a 1 MW turbine system. The cost for design A, B, and C was
$719,422,
$289,161, and
$986,065, respectively. It can be seen that the cost of the system decreased as well as increased when going from 0.5 MW to 1.5 MW, depending on the energy produced by the wind turbine. It also showed that the increase in the capacity of the renewables could help in decreasing the cost of the systems for the grid-connected setup. For the optimal design, the net system cost of design C was 2.23% less than the combined cost of the design A and design B.
The
Figure 9 shows the comparison of the three designs when the systems did not have a grid connection. It can also be seen that the system cost for all three designs almost increased linearly with increasing size of the wind turbine. Since there was no grid connection, no excess electricity could be sold.
The red dot in the
Figure 9 indicates the scenarios where the load profile (charging demand) was not fulfilled by the renewable sources and hence, was not the optimal solution. The unmet load percentage for these scenarios was the same as in grid connection. The irregularity between the cost of the system for 0.8 MW WT and 0.85 MW WT for design A and C is because of the size of the hydrogen tank which was required. For design A, a 200 kg hydrogen tank was required for the 0.8 MW WT system, and a 100 kg hydrogen tank was required for the 0.85 MW WT system. For design C, a 300 kg hydrogen tank was required for the 0.8 MW WT system, and a 200 Kg hydrogen tank was required for the 0.85 MW WT system. It can be seen from the results of the designs A and C that the load profiles (charging demand) could be fulfilled by using 0.8 MW WT. However, the optimal solution was given by the use of a 0.85 MW WT, while the optimal solution for design B was given by use of the system with capacity of 0.5 MW WT. The optimal cost system of design A, B, and C was
$2,141,395,
$1,512,511, and
$2,381,317, respectively. For the optimal design, the net system cost of design C was 34.8% less than the combined cost of the design A and design B.
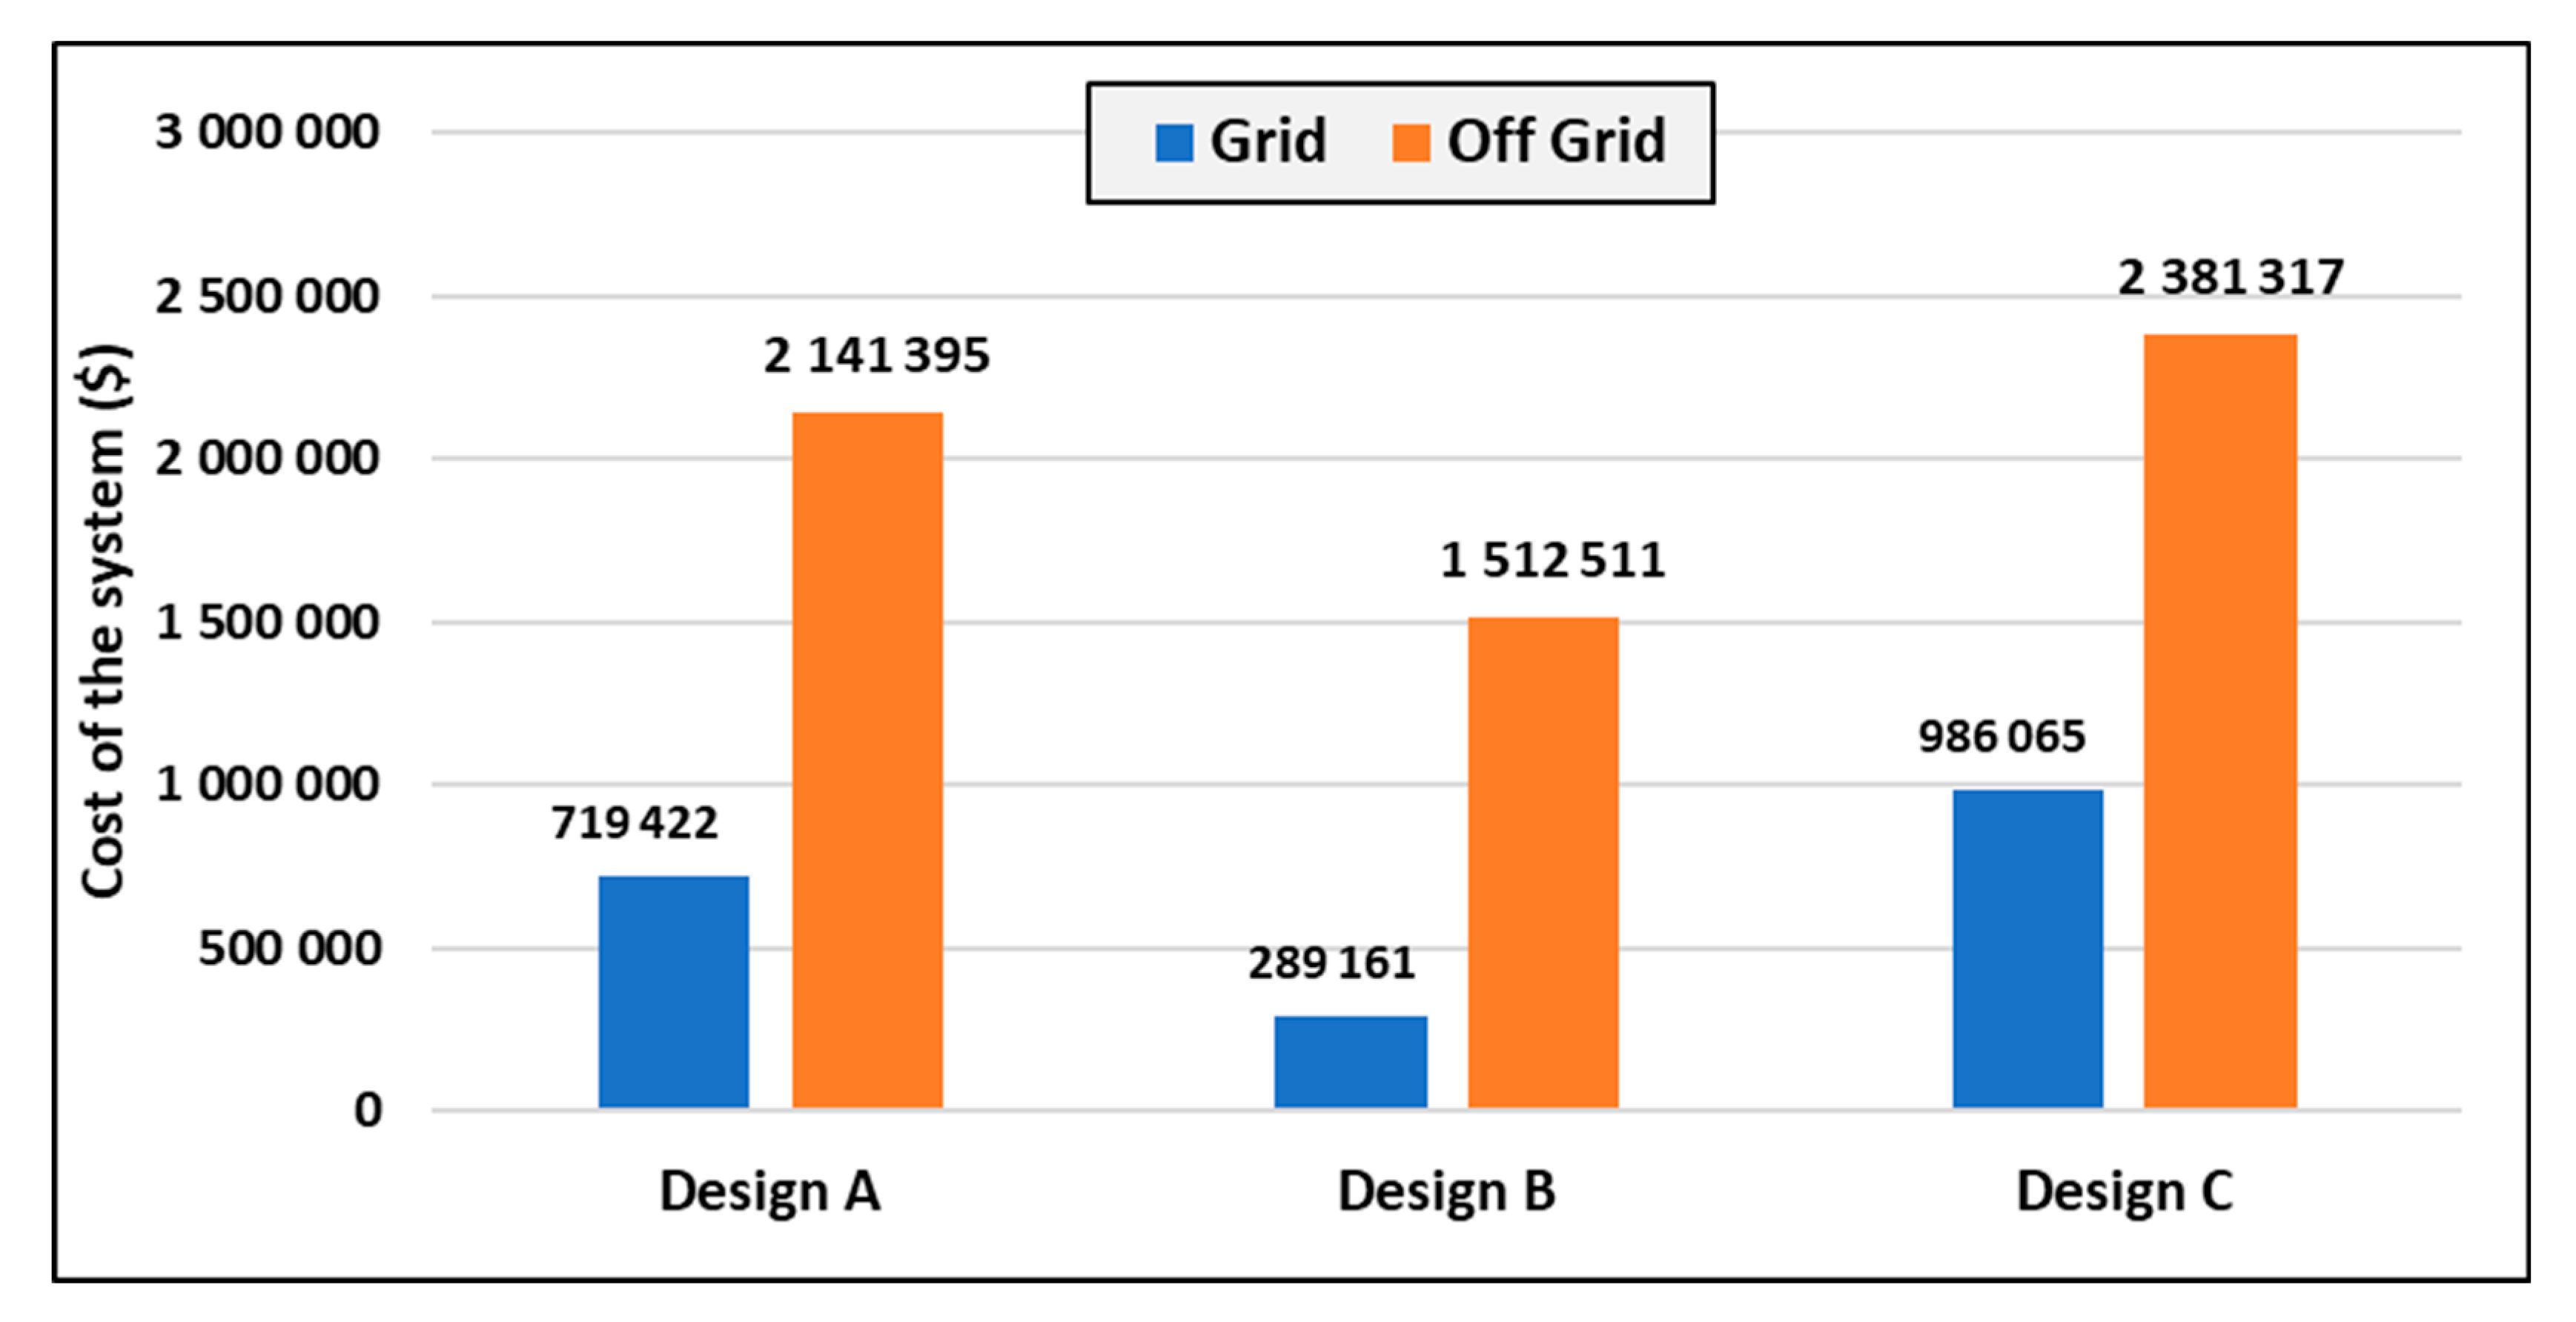
A comparison between the grid connection and off-grid connection system for the optimal scenario is illustrated in
Figure 10. It can be seen that in all three designs having a grid-connected system was significantly more feasible than an off-grid connection system, which can answer the 4th research question listed in
Section 1The off-grid system for design A, B and C was 2.97, 5.23, and 2.41 times higher than grid-connected systems. It can also be observed that the cost of the grid-connected system for design C was less than the combined sum of the designs A and design B, hence making it an optimal design solution.
4.2. Results of HDRSAM
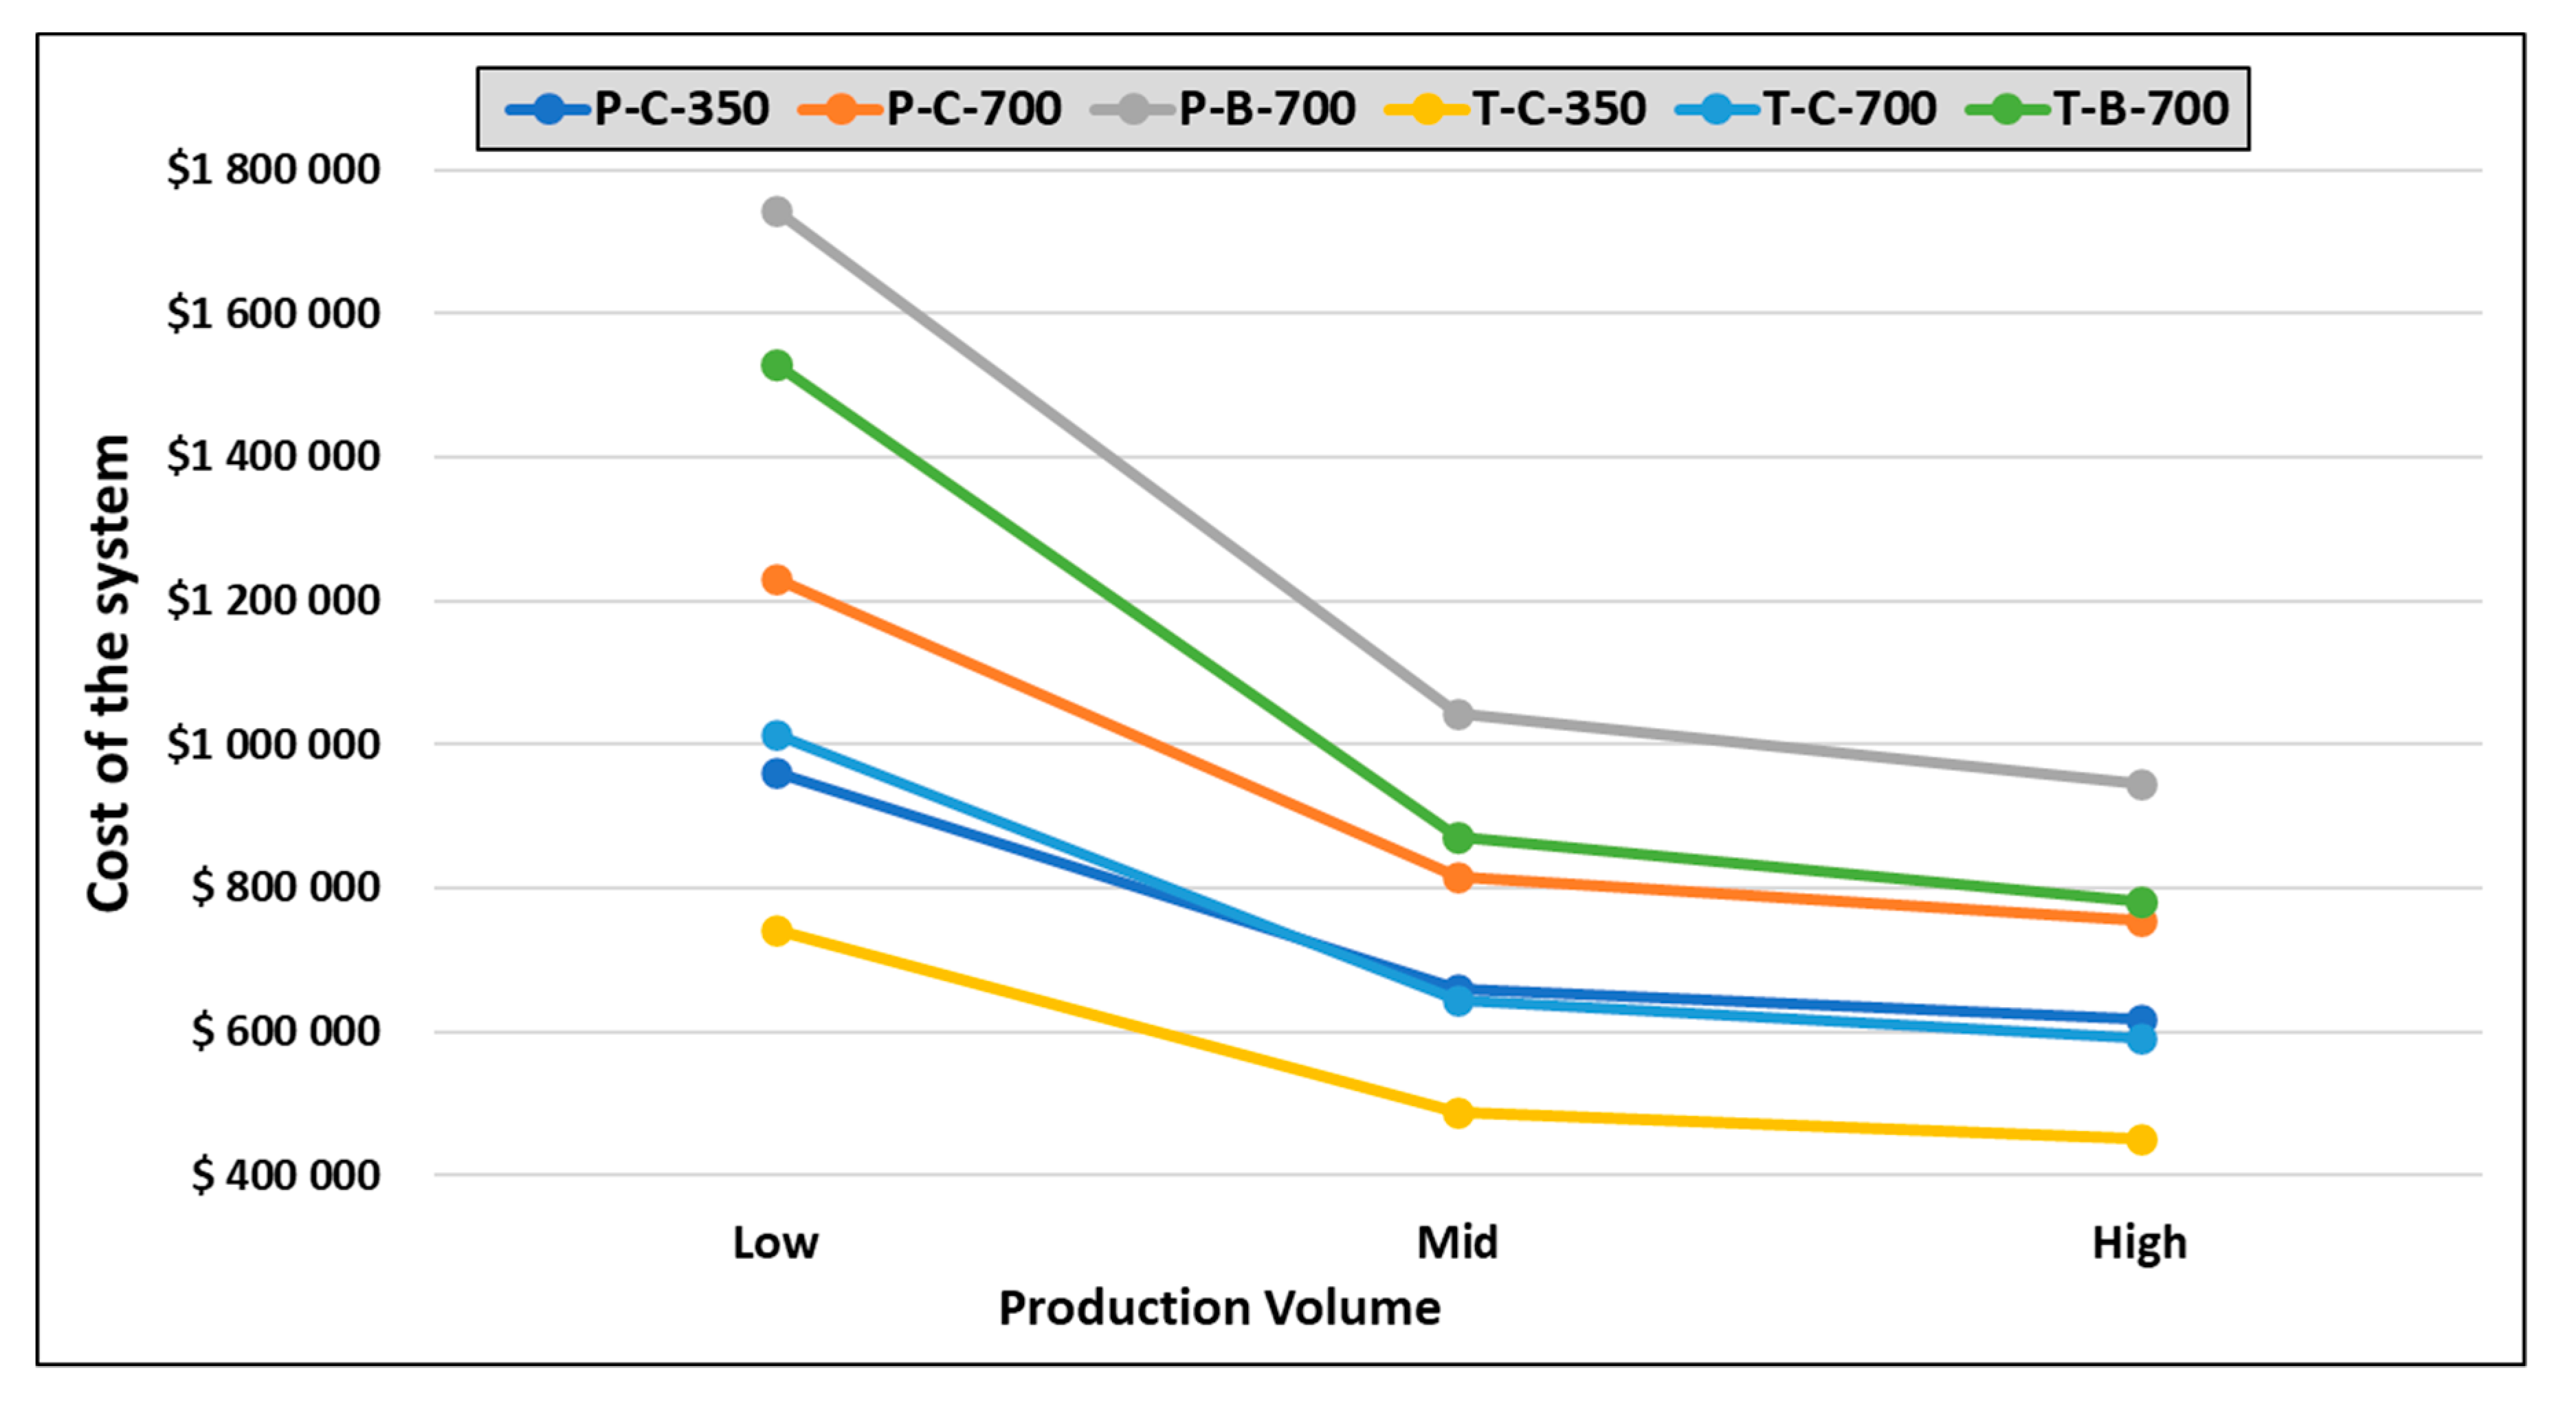
The HDRSAM analysis was performed for getting an estimate cost of the charging station for fuel cell busses. Eighteen scenarios were analyzed and the total investment cost is shown in
Figure 11. The results were divided into groups of three, where the cost of the system decreased when the production volume of the components changed from low, mid to high. This trend was followed across all the scenarios. It can be seen that the optimal solution design consisted of tube trailer as hydrogen delivery option with cascade dispensing option at 350 bar with high production volume. The cost of the system was
$452,148.
The whole well to wheel process cost was calculated by adding the cost of the optimal solution from HOMER and HDRSAM. The optimal solution form HOMER was of design C grid-connected system ($2,381,317) and for HDRSAM, the optimal solution cost was $452,148. The overall cost of the system was $2,833,465. The charging station comprised only 15.95% of the total cost of the system, while the remaining cost was for the production of energy. Hence, developing an integrated energy system for both fuel cell vehicles and battery-operated vehicles is more cost effective than an individual stand-alone system.
4.3. Carbon Dioxide Emissions’ Reduction
Transportation is one of the biggest contributors of greenhouse gas emissions, generating almost 27% of the emissions [
19]. For a diesel-powered bus during combustion, the carbon dioxide emission is 1290 gms/km [
17]. While for a fuel cell bus during the combustion, no emissions are made. While for cars the emissions are 120 gms/km [
20]. An estimate carbon dioxide emissions reduction was calculated. By using the battery-operated vehicles and fuel cell electric vehicles a total of 373,307.4 kg of CO
2 emissions could be prevented annually at the DTU-Risø campus.
5. Conclusions
To make the whole Danish energy system independent of fossil fuels in 2050, the one-stop charging station for EV and fuel cell cars was studied, and it showed the goal for 100% renewable campus for DTU-Risø is quite achievable. Location plays quite an important role in determining where a charging station is developed. It influences the average wind speed and the global horizontal irradiance which are used in determining the annual wind and solar energy production. Wind resource in Denmark bear a better potential as compared to solar resources. According to HOMER analysis, a grid connected system is always better option than an off-grid system for achieving an economical optimal design solution. It ensures that the excess electricity produced is not wasted and can be used for other purposes, such as for providing electricity to local end-users. It also helps in reducing the cost of the system because of the payback from the grid. The minimum renewable capacity of 0.8 MW for design A and design C and 0.5 MW for design B is required to fulfill the charging load profiles for a grid connected system, and the costs of these systems were $1,552,331, $1,215,106, and $1,929,283 for design A, B, and C, respectively. However, it can also be seen with the increase in the capacity of the renewables a lower cost of these system can be achieved. The optimal solution was a grid connected 1 MW WT system for all three designs, A, B, and C. The cost of these systems being $719,422, $289,161, and $986,065 for design A, B, and C, respectively. Even though the difference in the cost of design C and the combined cost of design A and design B was quite small, an integrated system for both BEV and FCEV is an optimal design solution. From the HDRSAM analysis, it can be seen that the optimal solution design consisted of tube trailer as the hydrogen delivery option with cascade dispensing option at 350 bar with high production volume. The cost of the system was $452,148. The whole well-to-wheel process cost was calculated by adding the cost of the optimal solution from HOMER and HDRSAM. The cost of the whole system from producing the energy and to delivering the energy was $2,833,465. A charging station comprised only about 15% of the whole system. It can be concluded that a renewable energy system with a grid connection for an integrated multi energy system can be a feasible solution from both technical and economical point of view for one-stop charging stations.
When the target of one stop charging station is met, it will offer the global EV industry and its associated energy sectors, a more renewable-based, cost-effective, user-friendly, and grid-friendly energy charging infrastructure solution. With the integration of these two types of charging stations, a reduction in the infrastructure and operation expenses, with grid support for distribution and transmission, will offer the users a one-stop charging station for both battery charging and hydrogen refueling. Further studies should focus on developing a robust, optimal multi-objective and multi-stage decision strategies for controlling and managing multi-energy processes associated with the one-stop charging stations.
Author Contributions
Conceptualization, S.B., S.Y. and J.X.; Methodology, S.B. and S.Y.; Software, Simulation; Simulation, S.B.; Data curation, S.B.; Writing—original draft, S.B.; Resources and Supervision, S.Y. and Y.Z.; Writing—review and editing, Y.Z. and L.M.-P.; Project administration and Funding acquisition, Y.Z. Review, J.X. All authors have read and agreed to the published version of the manuscript.
Funding
This work is supported by the Proactive Energy Management Systems for Power-to-Heat and Power-to-Gas Solutions (PRESS) project granted by the Danish Agency for Science and Higher Education (No. 8073-00026B).) and by the Enhancing wind power integration through optimal use of cross-sectoral flexibility in an integrated multi-energy system (EPIMES) project granted by the Danish Innovation Funding (No. 5185-00005A).
Acknowledgments
I would like to thank the administration and the technical group at the Technical University of Denmark for their support.
Conflicts of Interest
The authors declare no conflict of interest.
References
- World Economic Forum. Electric Vehicles for Smarter Cities: The Future of Energy and Mobility; World Economic Forum: Koroni, Switzerland, 2018. [Google Scholar]
- Morgan, S. Euractiv. 03 October 2018. Available online: https://www.euractiv.com/section/electric-cars/news/denmark-to-ban-petrol-and-diesel-car-sales-by-2030/ (accessed on 10 January 2019).
- Un-Noor, F.; Padmanaban, S.; Mihet-Popa, L.; Mollah, M.N.; Hossain, E. A comprehensive study of key electric vehicle (EV) components, technologies, challenges, impacts, and future direction of development. Energies 2017, 10, 1217. [Google Scholar] [CrossRef]
- Tan, K.M.; Ramachandaramurthy, V.K.; Yong, J.Y.; Padmanaban, S.; Mihet-Popa, L.; Blaabjerg, F. Minimization of load variance in power grids—Investigation on optimal vehicle-to-grid scheduling. Energies 2017, 10, 1880. [Google Scholar] [CrossRef]
- Camacho, O.M.F.; Mihet-Popa, L.; Mihet-Popal, L. Fast charging and smart charging tests for electric vehicles batteries using renewable energy. Oil Gas Sci. Technol. Rev. IFP Energ. Nouv. 2014, 71, 13. [Google Scholar] [CrossRef]
- Berckmans, G.; Messagie, M.; Smekens, J.; Omar, N.; Vanhaverbeke, L.; Van Mierlo, J. Cost projection of state of the art lithium-ion batteries for electric vehicles up to 2030. Energies 2017, 10, 1314. [Google Scholar] [CrossRef]
- Popa, L.M.; Saponara, S. Toward green vehicles digitalization for the nextgeneration of connected and electrifiedtransport systems. Energies 2018, 11, 3124. [Google Scholar] [CrossRef]
- 200 New Hydrogen Buses to Denmark, State of Green. 04 October 2018. Available online: https://stateofgreen.com/en/partners/state-of-green/news/200-new-hydrogen-buses-to-denmark-fosters-sustainable-transportation/ (accessed on 5 December 2018).
- Kumari, J.; Subathra, P.; Moses, J.E.; Shruthi, D. Economic analysis of hybrid energy system for rural electrification using HOMER. In Proceedings of the 2017 International Conference on Innovations in Electrical, Electronics, Instrumentation and Media Technology (ICEEIMT), Coimbatore, India, 3–4 February 2017; pp. 151–156. [Google Scholar]
- Restrepo, D.; Restrepo, B.; Grisales, L.T. Microgrid analysis using homer: A case study. DYNA 2018, 85, 129–134. [Google Scholar] [CrossRef]
- Energy, H. Homer Pro, Homer Energy. Available online: https://www.homerenergy.com/products/pro/docs/latest/index.html (accessed on 5 August 2018).
- Laboratory, A.N. Heavy-Duty Refueling Station Analysis Model (HDRSAM), Argonne National Laboratory. Available online: https://hdsam.es.anl.gov/index.php?content=hdrsam (accessed on 8 August 2018).
- Lozanovski, A.; Whitehouse, N.; Ko, N.; Whitehouse, S. sustainability assessment of fuel cell buses in public transport. Sustainability 2018, 10, 1480. [Google Scholar] [CrossRef]
- International Renewable Energy Agency. Renewable Power Generation Costs in 2017; International Renewable Energy Agency: Abu Dhabi, UAE, 2018. [Google Scholar]
- DOE Technical Targets for Hydrogen Production from Electrolysis. Available online: https://www.energy.gov/eere/fuelcells/doe-technical-targets-hydrogen-production-electrolysis (accessed on 10 May 2018).
- Steward, D.; Saur, G.; Penev, M.; Ramsden, T. Lifecycle Cost Analysis of Hydrogen Versus Other Technologies for Electrical Energy Storage; NREL: Golden, CO, USA, 2009.
- Li, W.; He, K.; Wang, Y. Cost comparison of AC and DC collector grid for integration of large-scale PV power plants. J. Eng. 2017, 2017, 795–800. [Google Scholar] [CrossRef]
- Denmark: Industrial Prices of Electricity 2008–2018, Satista. Available online: https://www.statista.com/statistics/595800/electricity-industry-price-denmark/ (accessed on 14 May 2018).
- Todts, W. CO2 Emissions from Cars: Facts; European Federation for Transport and Environment AISBL: Brussels, Belgium, 2018. [Google Scholar]
- Cockroft, C.J.; Owen, A.D. Hydrogen Fuel Cell Buses: An Economic Assessment; Murdoch University and University of New South Wales: Perth, Sydney, Australia, 2008. [Google Scholar]
© 2020 by the authors. Licensee MDPI, Basel, Switzerland. This article is an open access article distributed under the terms and conditions of the Creative Commons Attribution (CC BY) license (http://creativecommons.org/licenses/by/4.0/).


