Article

CFD Analysis of the Fuel–Air Mixture Formation Process in Passive Prechambers for Use in a High-Pressure Direct Injection (HPDI) Two-Stroke Engine

Department of Industrial Engineering (DIEF), Università degli Studi di Firenze, via di Santa Marta 3, 50139 Firenze, Italy
*
Author to whom correspondence should be addressed.
Energies 2020, 13(11), 2846; https://doi.org/10.3390/en13112846
Submission received: 28 April 2020 / Revised: 25 May 2020 / Accepted: 29 May 2020 / Published: 3 June 2020
(This article belongs to the Section E: Electric Vehicles)

Abstract

:
The research on two-stroke engines has been focused lately on the development of direct injection systems for reducing the emissions of hydrocarbons by minimizing the fuel short-circuiting. Low temperature combustion (LTC) may be the next step to further improve emissions and fuel consumption; however, LTC requires unconventional ignition systems. Jet ignition, i.e., the use of prechambers to accelerate the combustion process, turned out to be an effective way to perform LTC. The present work aims at proving the feasibility of adopting passive prechambers in a high-pressure, direct injection, two-stroke engine through non-reactive computational fluid dynamics analyses. The goal of the analysis is the evaluation of the prechamber performance in terms of both scavenging efficiency of burnt gases and fuel/air mixture formation inside the prechamber volume itself, in order to guarantee the mixture ignitability. Two prechamber geometries, featuring different aspect ratios and orifice numbers, were investigated. The analyses were replicated for two different locations of the injection and for three operating conditions of the engine in terms of revolution speed and load. Upon examination of the results, the effectiveness of both prechambers was found to be strongly dependent on the injection setup.

1. Introduction

The position of two-stroke (2S) engines has been declining lately in automotive and motorbike applications due to the high values of both fuel consumption and unburnt hydrocarbons (UHCs) emissions. These issues arise from the scavenging process, which leads to the short circuit of fuel and lube oil, especially in non-tuned conditions, and to a high cycle-to-cycle variation at low loads [1,2]. However, high power density, light weight, low maintenance requirements, low complexity, and high reliability are typical features of 2S engines, which make them still well-suited for all those applications where the reduction of size and cost is crucial, e.g., hybrid propulsion, motorsport, and power tools. Gasoline direct injection (GDI) has the potential to solve short circuit issues, since it allows the introduction of the fuel separately from the scavenging air. Thus, the whole amount of injected fuel can potentially be trapped in the cylinder, while only fresh air is lost through the exhaust port during the scavenging process. Some of the authors have carried out several studies on a 300 cm3 prototype showing the potential of direct injection strategies for a 2S engine, both from a numerical and an experimental point of view. The use of a low-pressure direct injection (LPDI) system allowed them to achieve a consistent reduction of both UHC emissions [3] and brake-specific fuel consumption (BSFC) [4], although insufficient fuel vaporization and fuel–air mixing may be found especially at intermediate rotating speed, which reduce the engine performance [4]. Thus, care should be taken regarding the injection timing [5] and the injector pressure [6] in order to minimize these issues. High-pressure direct injection (HPDI) solutions allow achieving an extremely fast vaporization with a more stratified charge [7] showing the potential of further improving UHC emissions [8], in spite of an increase of cost and complexity of the system.
The sustainability of 2S engines may be further improved by adopting low temperature combustion techniques (LTC), which are studied massively in the automotive field because of the continuous development of the European legislation on pollutant emissions and the introduction of the WLTP (Worldwide Harmonized Light Vehicle Test Procedure) approval protocol [9]. The LTC concept is based on the self-ignition of a premixed, ultra-lean, air–fuel mixture in order to reduce in-cylinder peak pressure and temperature. By doing so, it is possible to reduce the fuel consumption and the emissions of nitric oxides (NOx), as well as particulate matter (PM). However, LTC suffers from ignition instability, cycle-to-cycle variation, and in some cases, from the increase of carbon monoxide (CO) and UHC emissions [10]. Different ignition concepts have been then developed to avoid these issues [11].
Jet ignition (JI), also known as torch ignition (TI), is a very promising ignition technology to be used in LTC engines. JI makes use of a prechamber, i.e., an additional small combustion chamber in which the combustion starts, to generate hot turbulent jets capable of improving the combustion process inside the main chamber. The prechamber is located on the cylinder head and communicates with the main combustion chamber through one or more small orifices. The sparkplug ignites the mixture inside the prechamber, generating a flame front that propagates until it reaches the orifices. The hot turbulent jets exiting from the orifices in turn generate turbulent phenomena of heat and mass transfer inside the main chamber. As a result, a faster the combustion process is obtained, thus increasing the system efficiency, and reducing the unburnt products. An additional benefit is the increased capability of igniting fuel-lean mixtures inside the main combustion chamber.
There are mainly two ways to perform JI, which differ in the process of mixture preparation inside the prechamber. In the simplest case, namely “passive” prechamber, the fuel enters the prechamber coming from the combustion chamber (Figure 1a).
In the automotive field, this technology has been widely investigated in indirect-injection engines from several manufacturers, e.g., Toyota [12,13], Robert Bosch GmbH [14], Ford [15,16], and Suzuki [17]. Literature studies claimed that the combustion duration can be more than halved depending on prechamber shape and geometrical features [18], as a consequence of the drastic increase of the heat release rate (HRR) [17]. Single-orifice setups were found to be effective in reducing the 0–10% mass of fuel burnt (MFB) duration, while multiple orifices showed a higher decrease of the 10–90% MFB duration [18,19]. Bigger volumes and smaller orifices were found to improve the momentum of turbulent jets, which increases the ignition induction period, causing the combustion in the main chamber to be more explosive [20]. In particular, it was found that high-speed flame jets spouting into the main chamber cannot propagate to the mixture downstream of the orifice, as flame quenching occurs [12], and ignition in the combustion chamber takes place due to the increase of in-cylinder turbulence and the high quantities of hydrogen, OH-radicals, and other partially burnt substances contained in the hot jets, which serve as a core for the subsequent chain reactions [20]. Details on the ignition process can be found in [20], in which four different ignition mechanisms were classified depending on the strength of turbulent jets. Studies have also shown benefits in terms of NOx [13,15], UHC [14,15], and CO [21,22] emissions, as a result of the improved combustion efficiency, which may lead to the decrease of the brake-specific fuel consumption [14,22].
However, the improvement of the combustion process and the increase of the peak pressure do not necessarily result in higher IMEP values, as the introduction of the prechamber may increase the clearance volume [21]. Excessive thermal losses may occur, due to the impingement of jets on cylinder and piston walls [18] or even the in-cylinder pressure may decrease too early in the expansion phase as a result of the lamination losses across orifices [17]. Furthermore, even if the higher turbulence and the slower flow field in the prechamber slightly extend the lean flammability limit [12,23], passive prechambers showed a too high cycle-to-cycle variation in PFI fuel-lean engines [22].
In order to increase the lean flammability limit, in-cylinder GDI strategies can be used to achieve different fuel-to-air ratios inside the prechamber and the main chamber. In fact, through GDI it is possible to obtain a rich mixture inside the prechamber, while keeping the mixture inside the cylinder very lean. Multiple injections [24] and/or a proper piston bowl shape [25,26,27] may be used to achieve this goal. The use of GDI systems reduces cycle-to-cycle variation and allows one to increase the air-to-fuel ratio in the combustion chamber, reducing further NOx and fuel consumption [27,28]. Since the setup of GDI solutions for passive prechambers is difficult and time-consuming, “active” (or “stratified”) prechambers have been developed. Active prechambers are equipped with a dedicated fueling system, which can be a valve, as proposed by Honda [29] and General Motors [30], or an injector, as proposed instead by Volkswagen [31], Porsche [32], and more recently by MAHLE [33,34,35,36]. Figure 1b shows the conceptual drawing of an active prechamber fueled by a dedicated injector. The concept of the active prechamber was born to further improve the engine operating range toward ultra-fuel-lean mixtures, achieving a stable combustion process up to lambda values higher than two [34], a 20% higher fuel economy than conventional SI engines [35], and extending knock limit when using low-octane fuels [37], even if it implies a significant increase of cost and system complexity.
Although JI has been widely studied in four-stroke (4S) engines, only few works are available concerning 2S ones. In particular, the passive prechamber was studied for a small carburetor 2S engine [17], while the use of GDI solutions was evaluated only in active prechambers [38,39]; conversely, to the best of authors’ knowledge, the use of passive prechambers in GDI 2S engines has not been considered so far. This is probably due to the lack of GDI systems for 2S engines on the market, which have gained interest only in the last few years.
The adoption of passive prechambers may be beneficial for 2S direct-injection engines without increasing the system complexity; however, the injection system must be carefully designed to obtain an adequate fuel distribution inside the two chambers. Furthermore, a suitable scavenge of the prechamber volume must be ensured to avoid misfiring. The present work thereby is aimed at investigating the preliminary design of passive prechambers to be used in a 300 cm3 HPDI crank-scavenged 2S engine. Unsteady three-dimensional computational fluid dynamics (CFD) simulations were carried out to analyze the flow field inside the prechamber for two geometrical configurations in three engine operating conditions. The simulations involved the analysis of the scavenging and compression phases to evaluate the capability of achieving a low trapped residuals fraction inside the prechamber, as well as the capability of filling the prechamber with fresh air and fuel. The combustion process is not investigated since the reliability of a CFD simulation in predicting the complex chemical reactions of a JI combustion process, without a robust set of experimental data for validation, is very poor. Notwithstanding this aspect, the adopted approach allows evaluating the effect of both the direct injection strategy and the preliminary sizing of the prechamber on achieving a proper mixture formation inside the prechamber. Therefore, the uniformity, the air-to-fuel ratio of the mixture, and the residuals fraction inside the prechamber were estimated and discussed, since they represent the major issues regarding the actual ignitability of the fresh charge for these passive devices.

2. Materials and Methods

The design of prechambers for JI systems includes multiple degrees of freedom. The first variable is the fueling system, i.e., the strategy for introducing the fuel in the prechamber. Since main advantages of 2S engines are simplicity and low cost, the passive prechamber architecture was chosen for the present study. In passive prechambers, the fuel-filling process inside the prechamber strictly depends on the injector location and orientation, the injection pressure, and the in-cylinder flow field. The flow field has also a significant influence on the prechamber scavenging; thus, it must be carefully understood before designing the prechamber. Once the ignitability of the mixture inside the prechamber is checked, the design has to take care of the ignition process in the combustion chamber in order to increase the combustion efficiency.
The section is organized as follows. After a brief description of the test case engine, guidelines for the design of prechambers to be used in 2S engines are presented. Then, the two prechambers developed and investigated in this work are described. Finally, the numerical model used for the CFD analysis is presented.

2.1. Test Case

The test case is a Betamotor 300 cm3 2S crankcase scavenged engine in the HPDI prototype version [7,8]. The engine is characterized by five transfer ports and three exhaust ports. The lateral transfer ducts have a 90° orientation with respect to the engine symmetry plane, the two intermediate ducts have a 45° orientation, and the central duct is on the opposite side of the exhaust manifold. The engine is provided with a sliding valve which reduces the exhaust timing at low rotation speed.
The HPDI engine was developed starting from the existing carburetor version. The specifications of the original engine are summarized in Table 1.

2.2. Design Criteria

Many guidelines for the design of passive prechambers in indirect injection 4S engines can be found in the literature. Mathematical formulations for choosing the volume and flow passage area in single-orifice prechambers are available in [12,15]. Other information can be extrapolated from studies concerning the influence of prechamber characteristics on the combustion process, e.g., prechamber volume [20,40], shape [21,41], direction [42], flow passage area [23,43], and number of orifices [18,40]; even data about the influence of sparkplug position are available [12,23]. Furthermore, few guidelines concerning passive prechamber design and injector setup for use in GDI 4S engines can be deduced looking at the results achieved using spray-guided [24] and wall-guided [25,26,27] strategies. However, the background for passive prechambers applied to gasoline 2S engines is very limited [17].
Since the aim of this paper is to prove the applicability of a passive prechamber in a HPDI 2S engine, a guideline for the design methodology adopted for the development of the prechamber was carried out, inspired by both literature studies on JI GDI systems and considerations on the flow field in 2S engines.

2.2.1. Injection Strategy

Since the injection strategy affects both the prechamber shape and the size of orifices, its main features must be carefully evaluated and assessed during the design stage. Since the main target of the prechamber design is to ensure the ignitability of the fuel–air mixture in the prechamber itself, the mixture in the prechamber volume should be close to stoichiometric conditions. In addition, the fuel–air mixture in the dead volume should be homogenous in order to avoid pollutant emissions and to improve the combustion efficiency. The GDI injector is the same used in [7], where the effect of injector positioning and injection timing on the spray vaporization, mixture homogenization, and fuel short-circuit was analyzed. It was shown that an injection pressure of 100 bar allows a fast vaporization of the fuel droplets and a suitable level of mixing if the direction of the spray cone is against the loop scavenging current of the fresh charge. In this way, the air entering the cylinder from the transfer ports drives and spreads the fuel droplets thanks to its tumble motion.
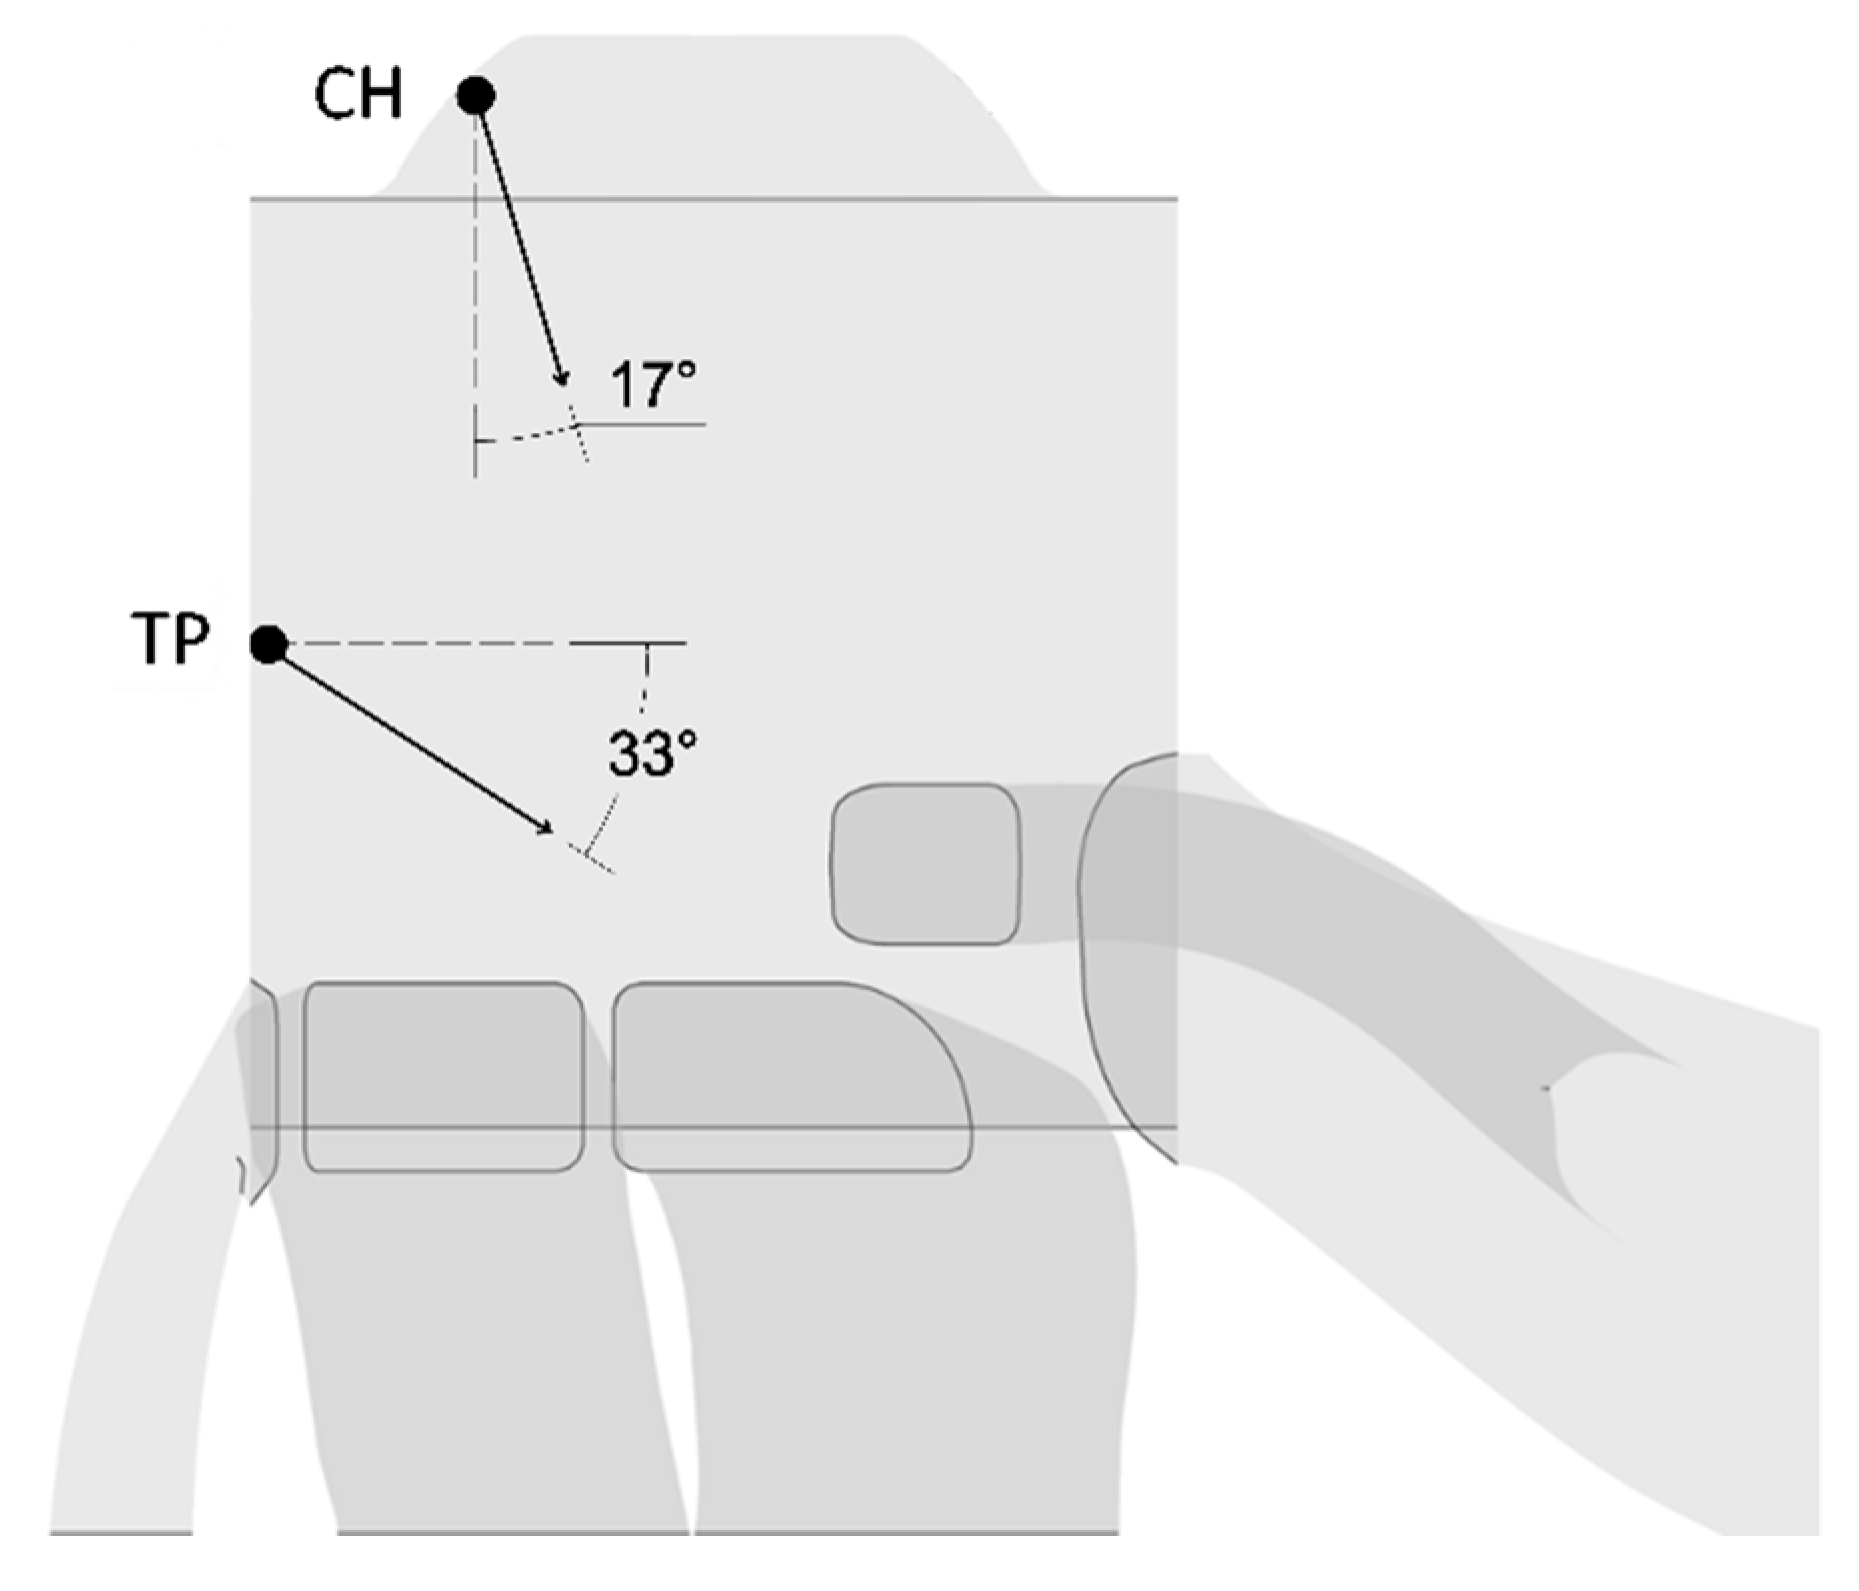
In this study, two different injection positions (and spray directions) were considered (Figure 2):
  • Cylinder head position (CH): the injector is placed on the lateral side of the cylinder head, opposite the exhaust side, and the injector axis is directed downward with an angle of 17° with respect to the vertical plane. This configuration has shown good results in terms of homogenization and fuel short circuit in the HPDI engine [7].
  • Transfer port position (TP): the injector is placed above the fifth transfer port and the injector axis is directed downward with an angle of 33° with respect to the horizontal plane. This configuration was the result of the optimization study performed for the same engine equipped with an LPDI system reported in [5].

2.2.2. Prechamber Position

Literature studies have demonstrated the possibility of achieving a reduction of the combustion duration, an increase of the engine IMEP, and a decrease of the BSFC by installing the prechamber on the center of the cylinder head [42]. Another advantage of the central position is the simplicity of the layout. In fact, small prechambers can be directly installed in the sparkplug hole. For these reasons, the coaxial position was chosen by the authors for the present analysis.

2.2.3. Prechamber Shape

The shape of the prechamber mainly depends on its volume, since big volumes usually imply elongated shapes. Elongated shapes bring the prechamber head to protrude out from the cylinder head or inside the combustion chamber. In the first case, the prechamber may suffer from exhaust gas trapping and overheating issues; furthermore, cylinder modifications are required in order to not reduce the volumetric compression ratio. In the second case, the piston bowl must be properly designed to accommodate the prechamber bottom as shown in [25,26,27]; in GDI engines an ignitable fuel–air mixture can be easily achieved inside the prechamber, even if it may lead to the non-desirable formation of a liquid film on the prechamber wall. Conversely, prechambers with a low height-to-diameter ratio do not require unconventional piston bowls or cylinder modifications and seem to facilitate the scavenging process, especially when using multiple orifices [24,28]. The prechamber scavenging can be further improved in 2S engines if the tumble vortex is properly exploited. Thus, low height-to-diameter ratios were selected by the authors. In order to investigate the effect of this parameter on the charge motions inside the prechamber, two values of height-to-diameter ratio were chosen: 0.74 and 0.43.

2.2.4. Prechamber Volume

The amount of fuel that can be collected in the prechamber depends on its volume (VP), which in turn determines the energy and the momentum of the hot exiting jets. The higher the amount of fuel inside the prechamber, the higher the effectiveness of the ignition process inside the main chamber [20,28], resulting in a higher HRR and a higher peak pressure [17]. This aspect is crucial in order to ignite a lean mixture. However, the fuel inside the prechamber only partially contributes to the pressure force acting on the piston surface as the burnt mixture is laminated across orifices before entering the combustion chamber, thus too big prechambers may increase fuel consumption. In fact, literature studies have shown an increase in peak pressure but a downward shift of the expansion curve in the P-V diagram, resulting in a lower IMEP [17].
Table 2 resumes the volume of the gasoline-fueled passive prechambers known to the authors. The values of VP are also reported as a percentage of the combustion chamber volume (VC) and of the displacement (VD).
Starting from the observation of the designs adopted in previous studies, the authors hypothesized a volume VP of 0.5 cm3, corresponding to VP/VC of 1.75% and VP/VD of 0.17%, which was thought to be a good trade-off between ignition effectiveness and fuel consumption.

2.2.5. Number and Location of Orifices

In small prechambers, the use of multiple orifices allows the prechamber to be scavenged similarly to the cylinder of 2S engines [28]. On the contrary, prechambers communicating to the combustion chamber through an open duct are scavenged only from the vacuum effect of the expansion stroke.
In 2S engines, the use of small prechambers with at least two orifices facing the transfer and the exhaust ports, respectively, may lead the in-cylinder tumble vortex to enter the prechamber and to displace the exhaust gas. Since the flow field is strongly three-dimensional [7], the use of a high number of orifices may lead to a better exploitation of the in-cylinder charge, for both scavenging and fuel filling processes. Moreover, the use of a high number of orifices results in a smaller 10–90% MFB duration, with a reduction of the heat losses (avoiding the impingement of turbulent jets on piston surface) [18,19] and an extended lean flammability limit [45]. Contrary to wall-guided injection strategies [25,26,27], a central orifice is not required for the prechamber fueling since the air-guided method exploits the in-cylinder tumble motion.
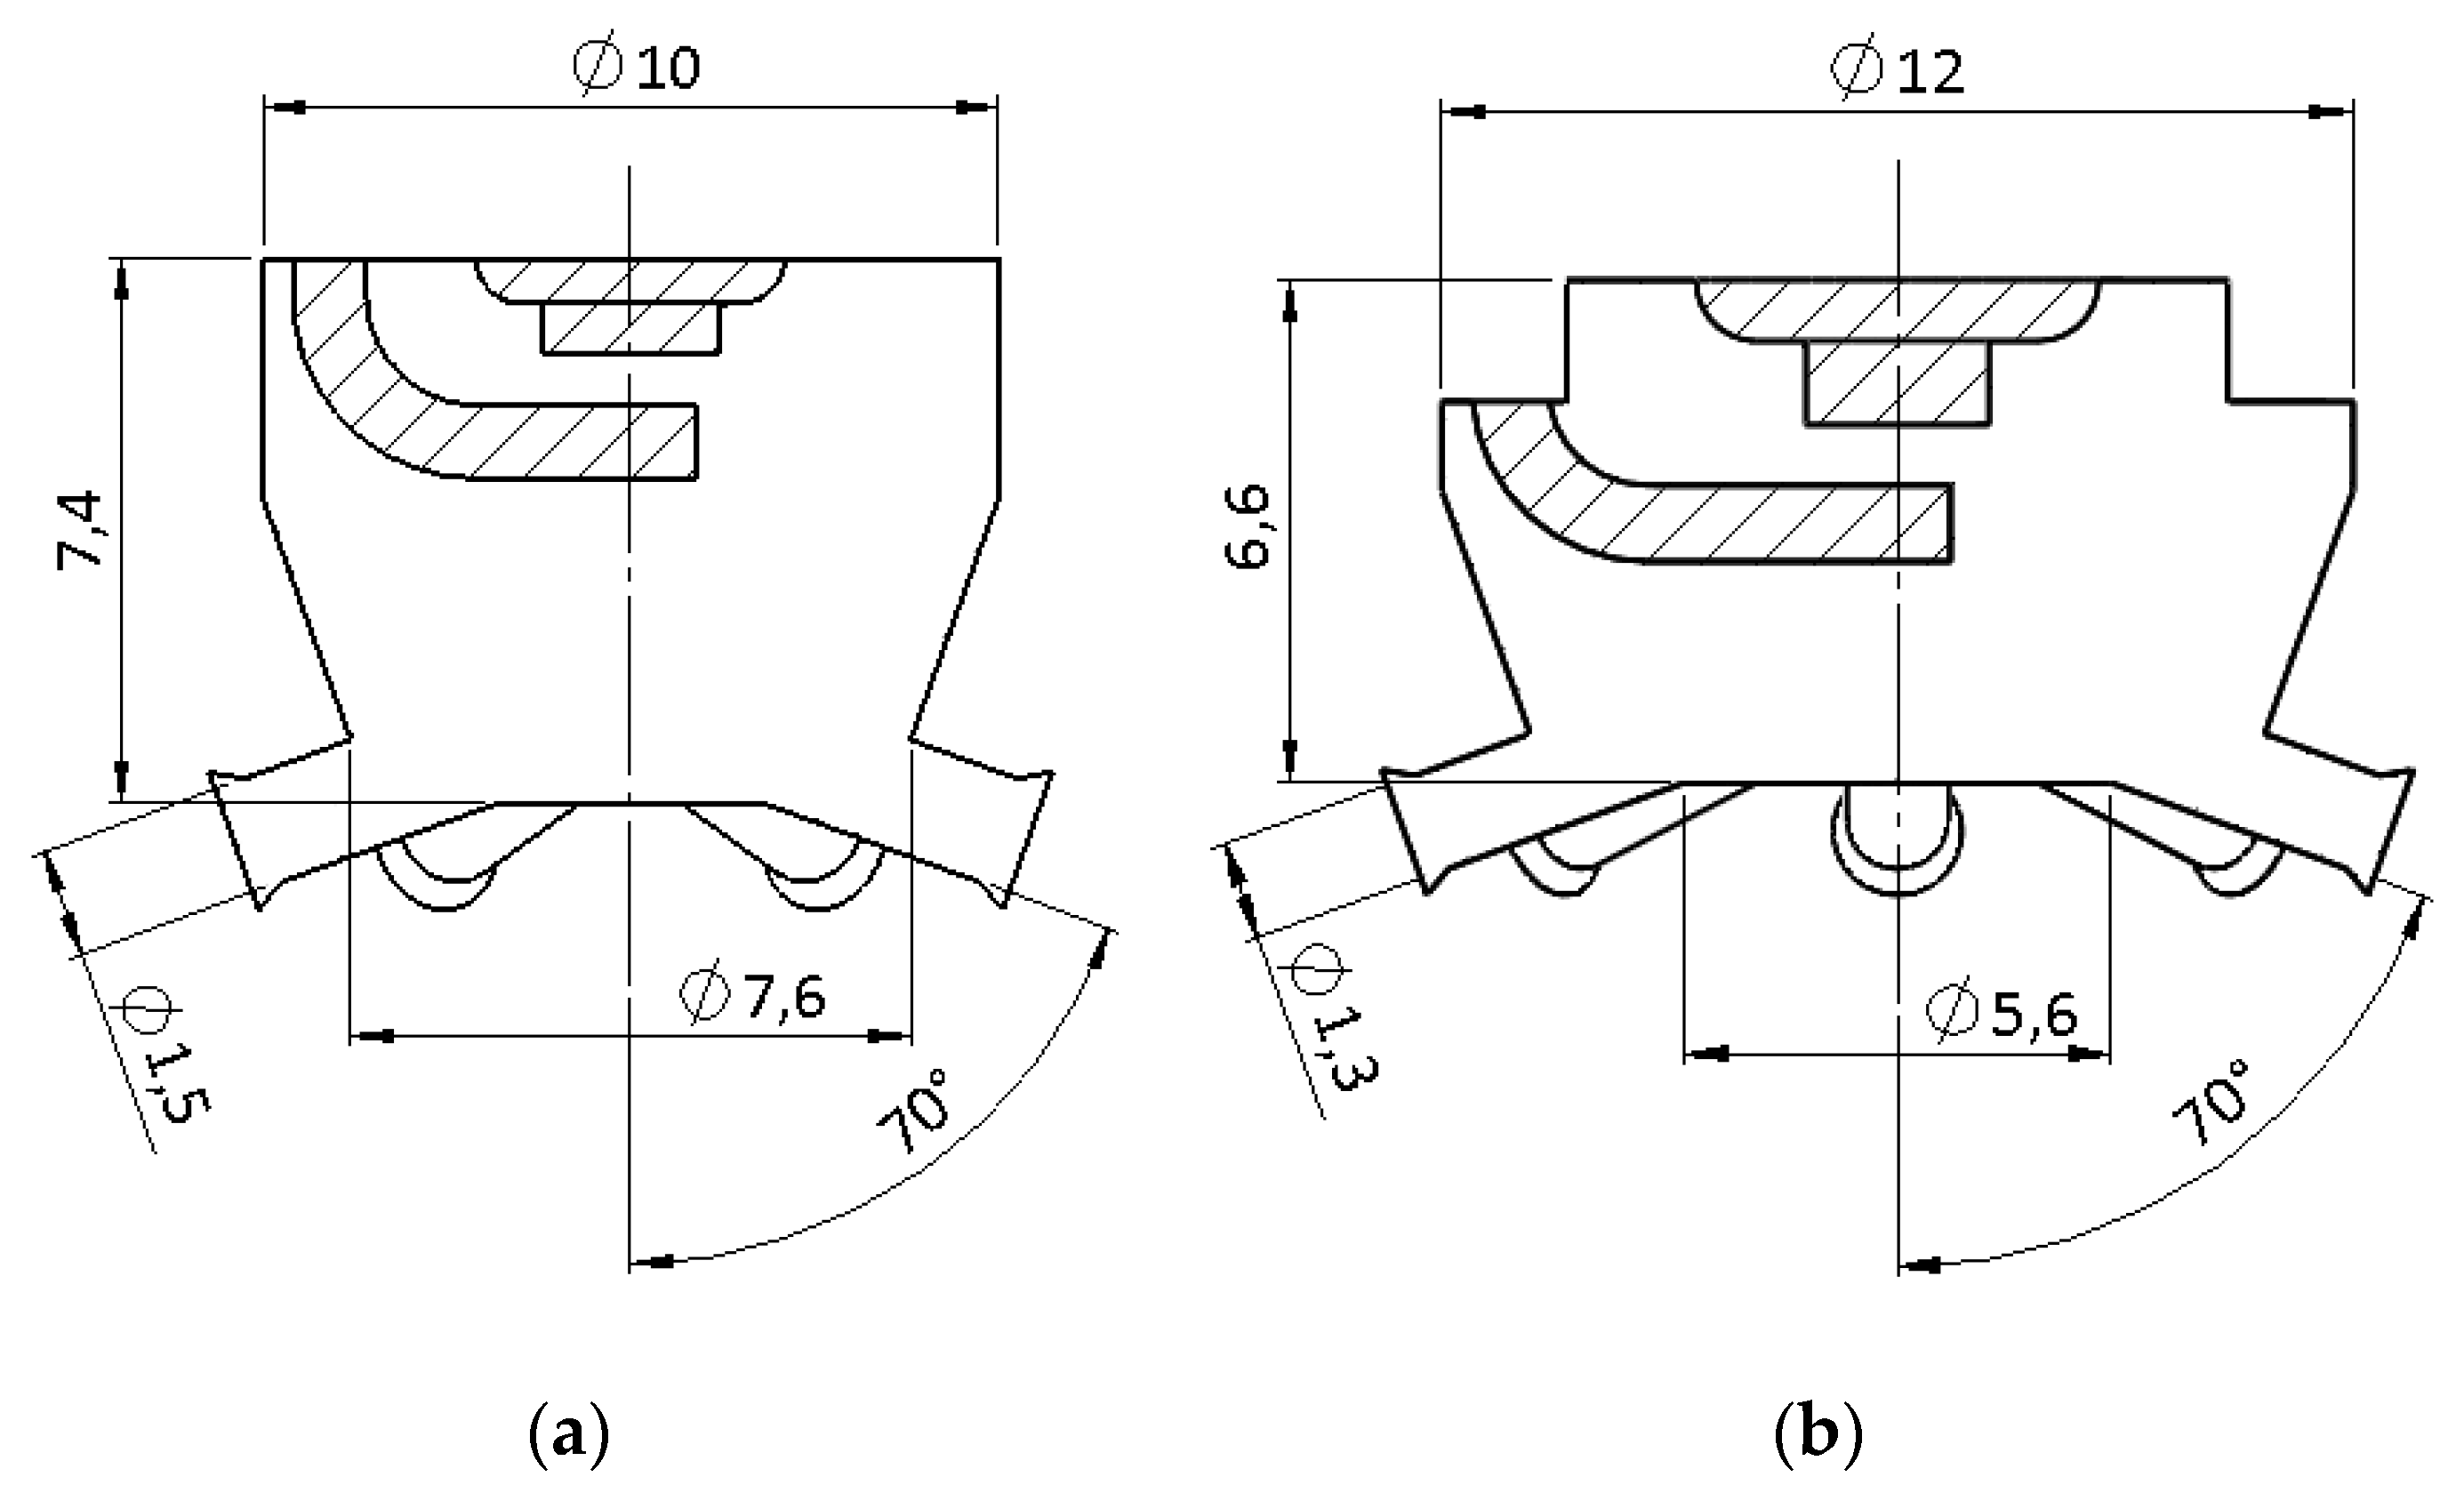
According to this background, the authors adopted multiple orifices. To evaluate the differences in the inlet of the injected fuel into the prechamber and the effects of different number of orifices on the scavenging process, the two prechambers were designed with six orifices (PN6) and eight orifices (PN8), respectively.

2.2.6. Slope of Orifices

Literature studies have shown that angled orifices perform better than coaxial ones since they lead to a higher HRR [45], a higher combustion efficiency, and to lower CO and UHC emissions [40]. The higher the angle between the orifices and the cylinder axis, the higher the positive effects. This is true until the thermal losses due to the impingement of the jets on the cylinder wall become excessive.
Furthermore, in motorsport engines, in which the transfer channels are vertically tilted, the fresh charge impinges early on the cylinder head assuming a horizontal direction; thus, angled orifices carry better the tumble vortex inside the prechamber. This may improve both the scavenging and the fuel filling processes. For these reasons, the authors chose an orifice inclination of 70° with respect to the cylinder axis.

2.2.7. Flow Passage Area

The flow passage area of orifices determines the ignition physics inside the combustion chamber. Large orifices may lead to the propagation of the flame front in the main chamber, while small orifices to the quenching of flame front and ignition occurs via chemical chain reactions [20]. Literature studies have shown that smaller flow passage areas tend to increase HRR and peak pressure [17,20]. However, too small orifices may lead to a poor prechamber scavenging and may generate fast jets impinging on the piston wall; the interaction between the hot jets and the piston wall increases the heat losses, worsening the ignition process in the main chamber [18] and increasing HC and NOx emissions [15]. Furthermore, the excessive lamination of the ignited fuel across orifices and, thus, the partial exploitation of fuel inside the prechamber to produce useful work on the piston may lead to a too rapid decrease of in-cylinder pressure, reducing the engine IMEP [17].
The momentum of hot jets depends on both the overall flow passage area, SO, and the area of the single orifices. In fact, for the same SO, a higher number of orifices, N, may promote the quenching of the flame front. Thus, it is useful to relate SO to N. Furthermore, it depends on the prechamber volume; thus, it is also useful to relate SO to VP.
Table 3 resumes the overall flow passage area SO of the passive prechambers, fueled with gasoline, known to the authors:
The authors chose a test value of 10.6 mm2, equivalent to a ratio of SO/VP of 0.021 mm−1. This value is obtained by adopting diameters of 1.5 mm and 1.3 mm for the PN6 and PN8 prechambers, respectively.

2.3. Designed Prechambers

The two passive prechambers developed in this work were designed following the aforementioned guidelines. VP and SO were kept constant, while the prechamber aspect ratio, the number of orifices and shape of orifices were varied. The prechambers were designed to allow standard sparkplugs to be screwed in. A M12 × 1.25 sparkplug was considered for the PN6 prechamber and a M14 × 1.25 sparkplug for the PN8 prechamber. The geometrical features of the two prechambers are summarized in Table 4, while the drawings, representing the inner fluid volume, are shown in Figure 3a,b.

2.4. Simulation Setup

This section describes the numerical tools used in the CFD analyses. CFD simulations are performed using the commercial code ANSYS® FLUENT®. A one-dimensional model of the baseline engine was also built using the Ricardo WAVETM modelling software and calibrated according to the experimental results reported in [8] for the HPDI version of the engine and in [4] for the LPDI one.
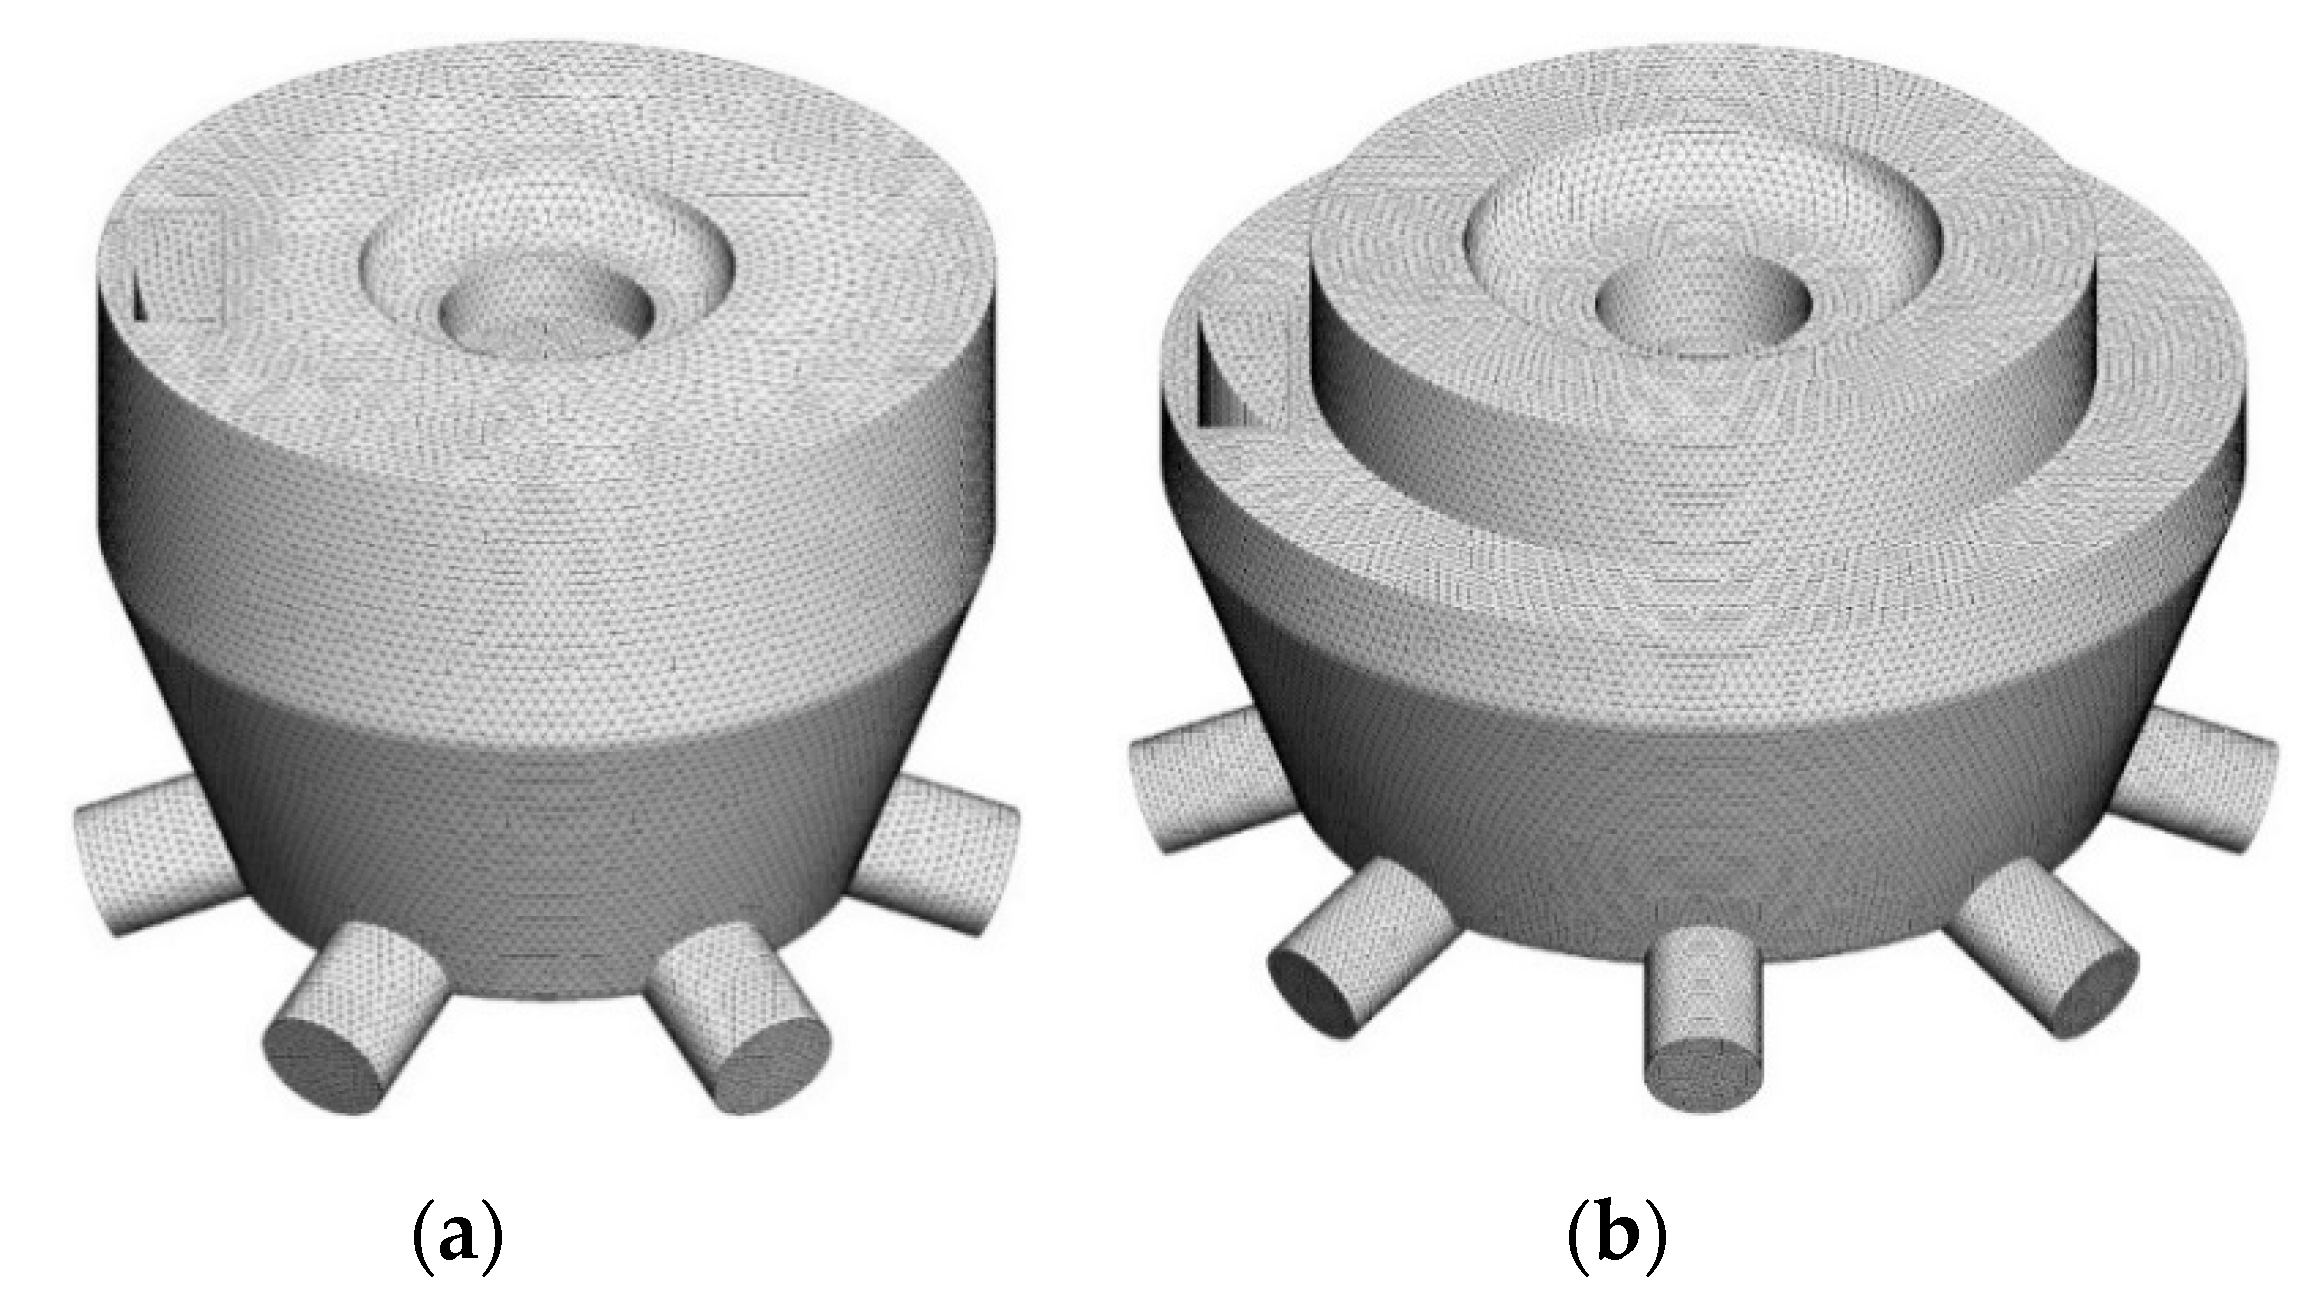
The computational domain of the Betamotor 300 cm3 engine includes the fives transfer ducts, the cylinder, the prechamber, and the exhaust system (Figure 4a,b). An inlet boundary is placed at the crank-side end of each transfer duct, while the outlet boundary is placed at the end of the 90 degree bend exhaust duct. Time-varying temperature and pressure trends, calculated by means of the 1D model, are imposed at these boundaries. The numerical simulations start at the end of the expansion phase before the exhaust ports opening (EPO). Each CFD simulation is composed of three subsequent engine revolutions to achieve a periodic behavior of the solution. The cylinder, the prechamber and the exhaust pipe are initialized with burned gas, while the transfer ducts are initialized with fresh air. Since the combustion is not simulated in the present activity, the initial state inside cylinder and prechamber volumes is re-initialized after each revolution according to the 1D model results. Temperature and pressure values at the end of the combustion process are therefore imposed before EPO, while the fluid composition is imposed as 100% burned gas. A temperature boundary condition of 600 K was set to the solid walls, according to temperature measurements carried out on the HPDI version of the same engine during the experimental campaign [8].
The turbulent flow is described by the time-dependent unsteady Reynolds-averaged Navier–Stokes (U-RANS) equations, and the standard k-ε model is used for turbulence closure. The boundary layer evolution is solved by means of the enhanced wall treatment approach. Numerical settings have been validated by some of the authors in previous papers [1,5,7], in which different solvers (PISO and coupled), turbulence models (standard and RNG k-ε), and angular timesteps (0.1, 0.25, and 0.5 °CA) were tested. Based on the comparison between the numerical and experimental instantaneous pressure trends inside both the cylinder and the exhaust duct, the following setup was chosen. The pressure-velocity coupling is handled by the PISO algorithm. The second-order upwind numerical scheme is used for the spatial discretization of the governing equations. The bounded second order is used for time differencing. The convergence of the simulation is monitored by imposing a value of 10−5 to the residuals of all solved quantities. An angular timestep of 0.25 °CA is used in the first two engine revolutions, while in the third, the timestep is reduced to 0.1 °CA in order to increase the simulation accuracy and stability.
The liquid phase is solved using the Lagrangian approach (discrete phase model, DPM). The spray model reproduces the behavior of the GDI injector at 100 bar. The same assessments of the numerical settings for the spray in [7] are used in this work. Due to the high value of the Weber number (above 100) the Kelvin–Helmholtz and Rayleigh–Taylor model (KHRT) for the secondary breakup of liquid droplets was used. The KHRT model constants were calibrated by comparing the spray evolution in the near-nozzle region in terms of atomization, penetration, and diffusion against experimental measurements performed in a constant-volume vessel by using phase-Doppler anemometry (PDA) with a data acquisition rate of 20 kHz, as described in more detail in [7].
The fluid domain inside exhaust ducts, transfer channels, and combustion chamber is modelled using an unstructured grid composed of tetrahedral elements; a prismatic structured grid is used for the discretization of the cylinder sub-domain to perform mesh motion, handled by deformation and layering. The mesh is generated according to the mesh-sensitivity analysis carried out for the LPDI version of the engine [5,6] in which it was shown that grid-independent results are obtained adopting a mean cell size of 1.0 mm. The introduction of the PN6 and the PN8 prechambers required the re-meshing of the cylinder domain to ensure a gradual transition between elements, while the grid of the transfer and the exhaust ducts was left unchanged.
The fluid inside the prechamber, including the orifices, was modelled using tetrahedral elements. Six thin layers of prismatic elements were applied to the prechamber walls, including orifices, in order to obtain y+ values lower than 10. Table 5 summarizes the characteristics of the mesh used for the PN6 and PN8 prechambers. The mesh of the fluid domain inside the PN6 prechamber accurately reproduces the electrodes of the DR8EA sparkplug (Figure 5a); in the same way, the mesh of the fluid domain inside the PN8 prechamber considers the encumbrance of the BR7ES sparkplug (Figure 5b). It should be noted that the higher number of elements of the PN8 prechamber fluid domain is due to the smaller size of orifices.

2.5. Numerical Test Plan

Three different engine operating conditions were considered for the present study:
  • Engine speed at maximum power, 7500 rpm, at 100% of throttle valve opening (full load). It is useful to evaluate this condition since the physical time available for the injection and then for the fuel–air mixture homogenization is short.
  • Engine speed at maximum power, 7500 rpm, at 30% of throttle valve opening (medium load). In this condition, the in-cylinder flow field is much weaker than that in full load, and it may worsen the mixture formation in combustion chamber and prechamber.
  • Low revolution speed, 2500 rpm, at 10% of throttle valve opening (low load). This condition is critical for two stroke engines, since the incoming air flow is insufficient to scavenge the exhaust gases inside the cylinder.
As already shown in Figure 2, two different injection strategies were simulated: the cylinder head (CH) positioning and the transfer port (TP) positioning. Both injector locations were tested for all of the three engine operating points. Each simulation run took 72 h on an HPC computing node with 24 CPUs.
Since the HPDI system applied to the Betamotor 300 cm3 engine has been previously evaluated by some of the authors, the injector used in this work is the same employed in [7,8]. The mass of injected fuel per cycle was imposed to obtain average stoichiometric conditions in both the cylinder and the prechamber. The choice of the start of injection (SOI) was based on the previous LPDI and HPDI simulations [6,7]. At 7500 rpm and full load, the amount of fuel to be injected per cycle is close to the maximum value and the physical time available for vaporization and homogenization of fuel droplets is small; thus, SOI must be set far in advance with respect to the top dead center (TDC). On the other hand, such advance must be limited since short circuiting issues must be avoided. At medium and low loads, the risk of fuel short circuit is less relevant since a low amount of fuel is injected; however, an advanced injection is still necessary since the slow flow field is not able to promote fuel homogenization. In all of the cases, a best compromise was found by adopting an SOI close to the BDC. Table 6 summarizes the test plan of the simulations for both prechambers.

3. Results and Discussion

This chapter shows the results of the CFD analysis of the Betamotor 300 cm3 engine powered by the PN6 and PN8 prechambers at the tree operating conditions described above.
The first part investigates the flow field behavior and the scavenging process inside both cylinder and prechamber domains. The analysis aims at understanding if the amount and the location of residual gases are consistent with the ignition of the fresh fuel–air mixture. In fact, a high amount of burnt gas inside the prechamber may lead to a high cycle-to-cycle variation or even to misfire. The second part investigates the fuel–air mixture formation process. This analysis aims at estimating the distribution of fuel inside the prechamber, in order to understand if the fuel–air mixture can be ignited by the spark. In addition, the fuel distribution inside the cylinder is evaluated in order to predict if any portion of the cylinder may become excessively fuel lean or fuel rich.

3.1. Analysis of the Flow Field Inside the Prechamber and the Scavenging of Exhaust Gases

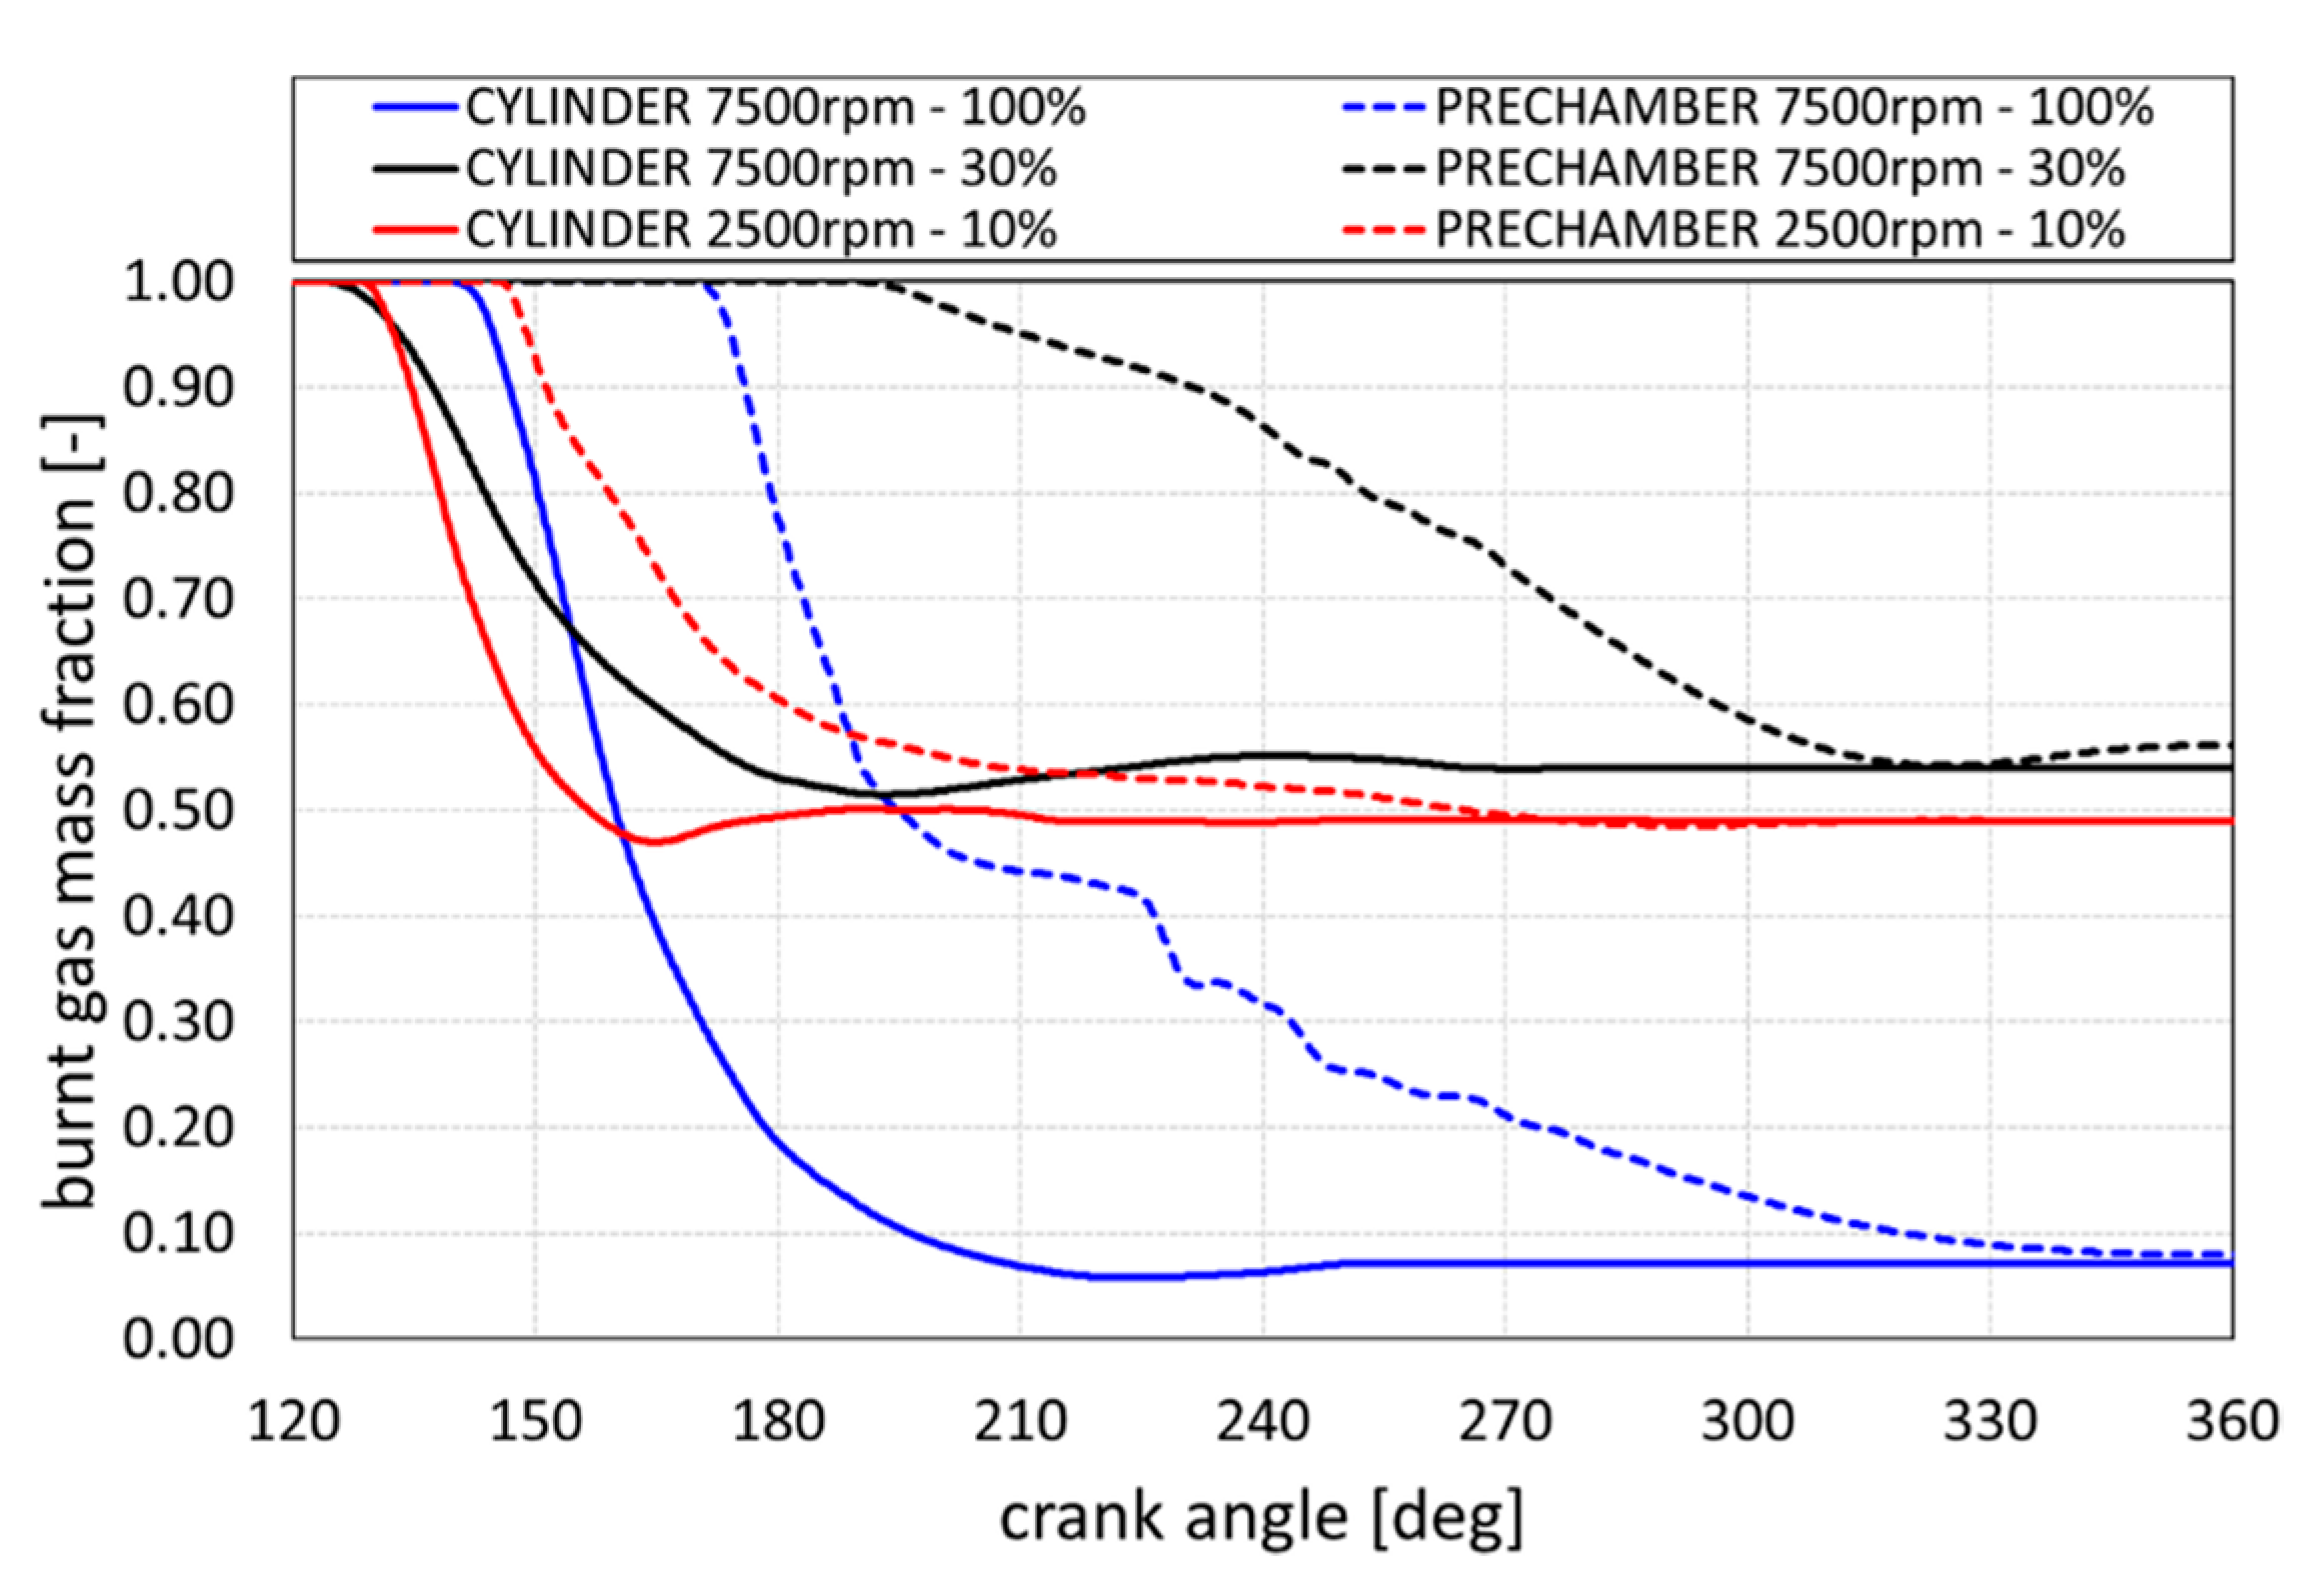
The details of the scavenging process inside both the cylinder and the prechamber are first analyzed for the PN8 prechamber simulations for the three engine operating points. At the end of the analysis, the differences between the two prechambers are quantified. The trends of burned gas mass fraction as a function of the angular position in the three operating conditions are shown in Figure 6. The values are averaged on mass for both the cylinder and the PN8 prechamber volumes. It is worth noting that the scavenging of the prechamber is delayed with respect to the cylinder, because the fresh air mixture takes longer to reach the head of the engine and needs more time to fill the prechamber volume and to displace the exhaust gas.
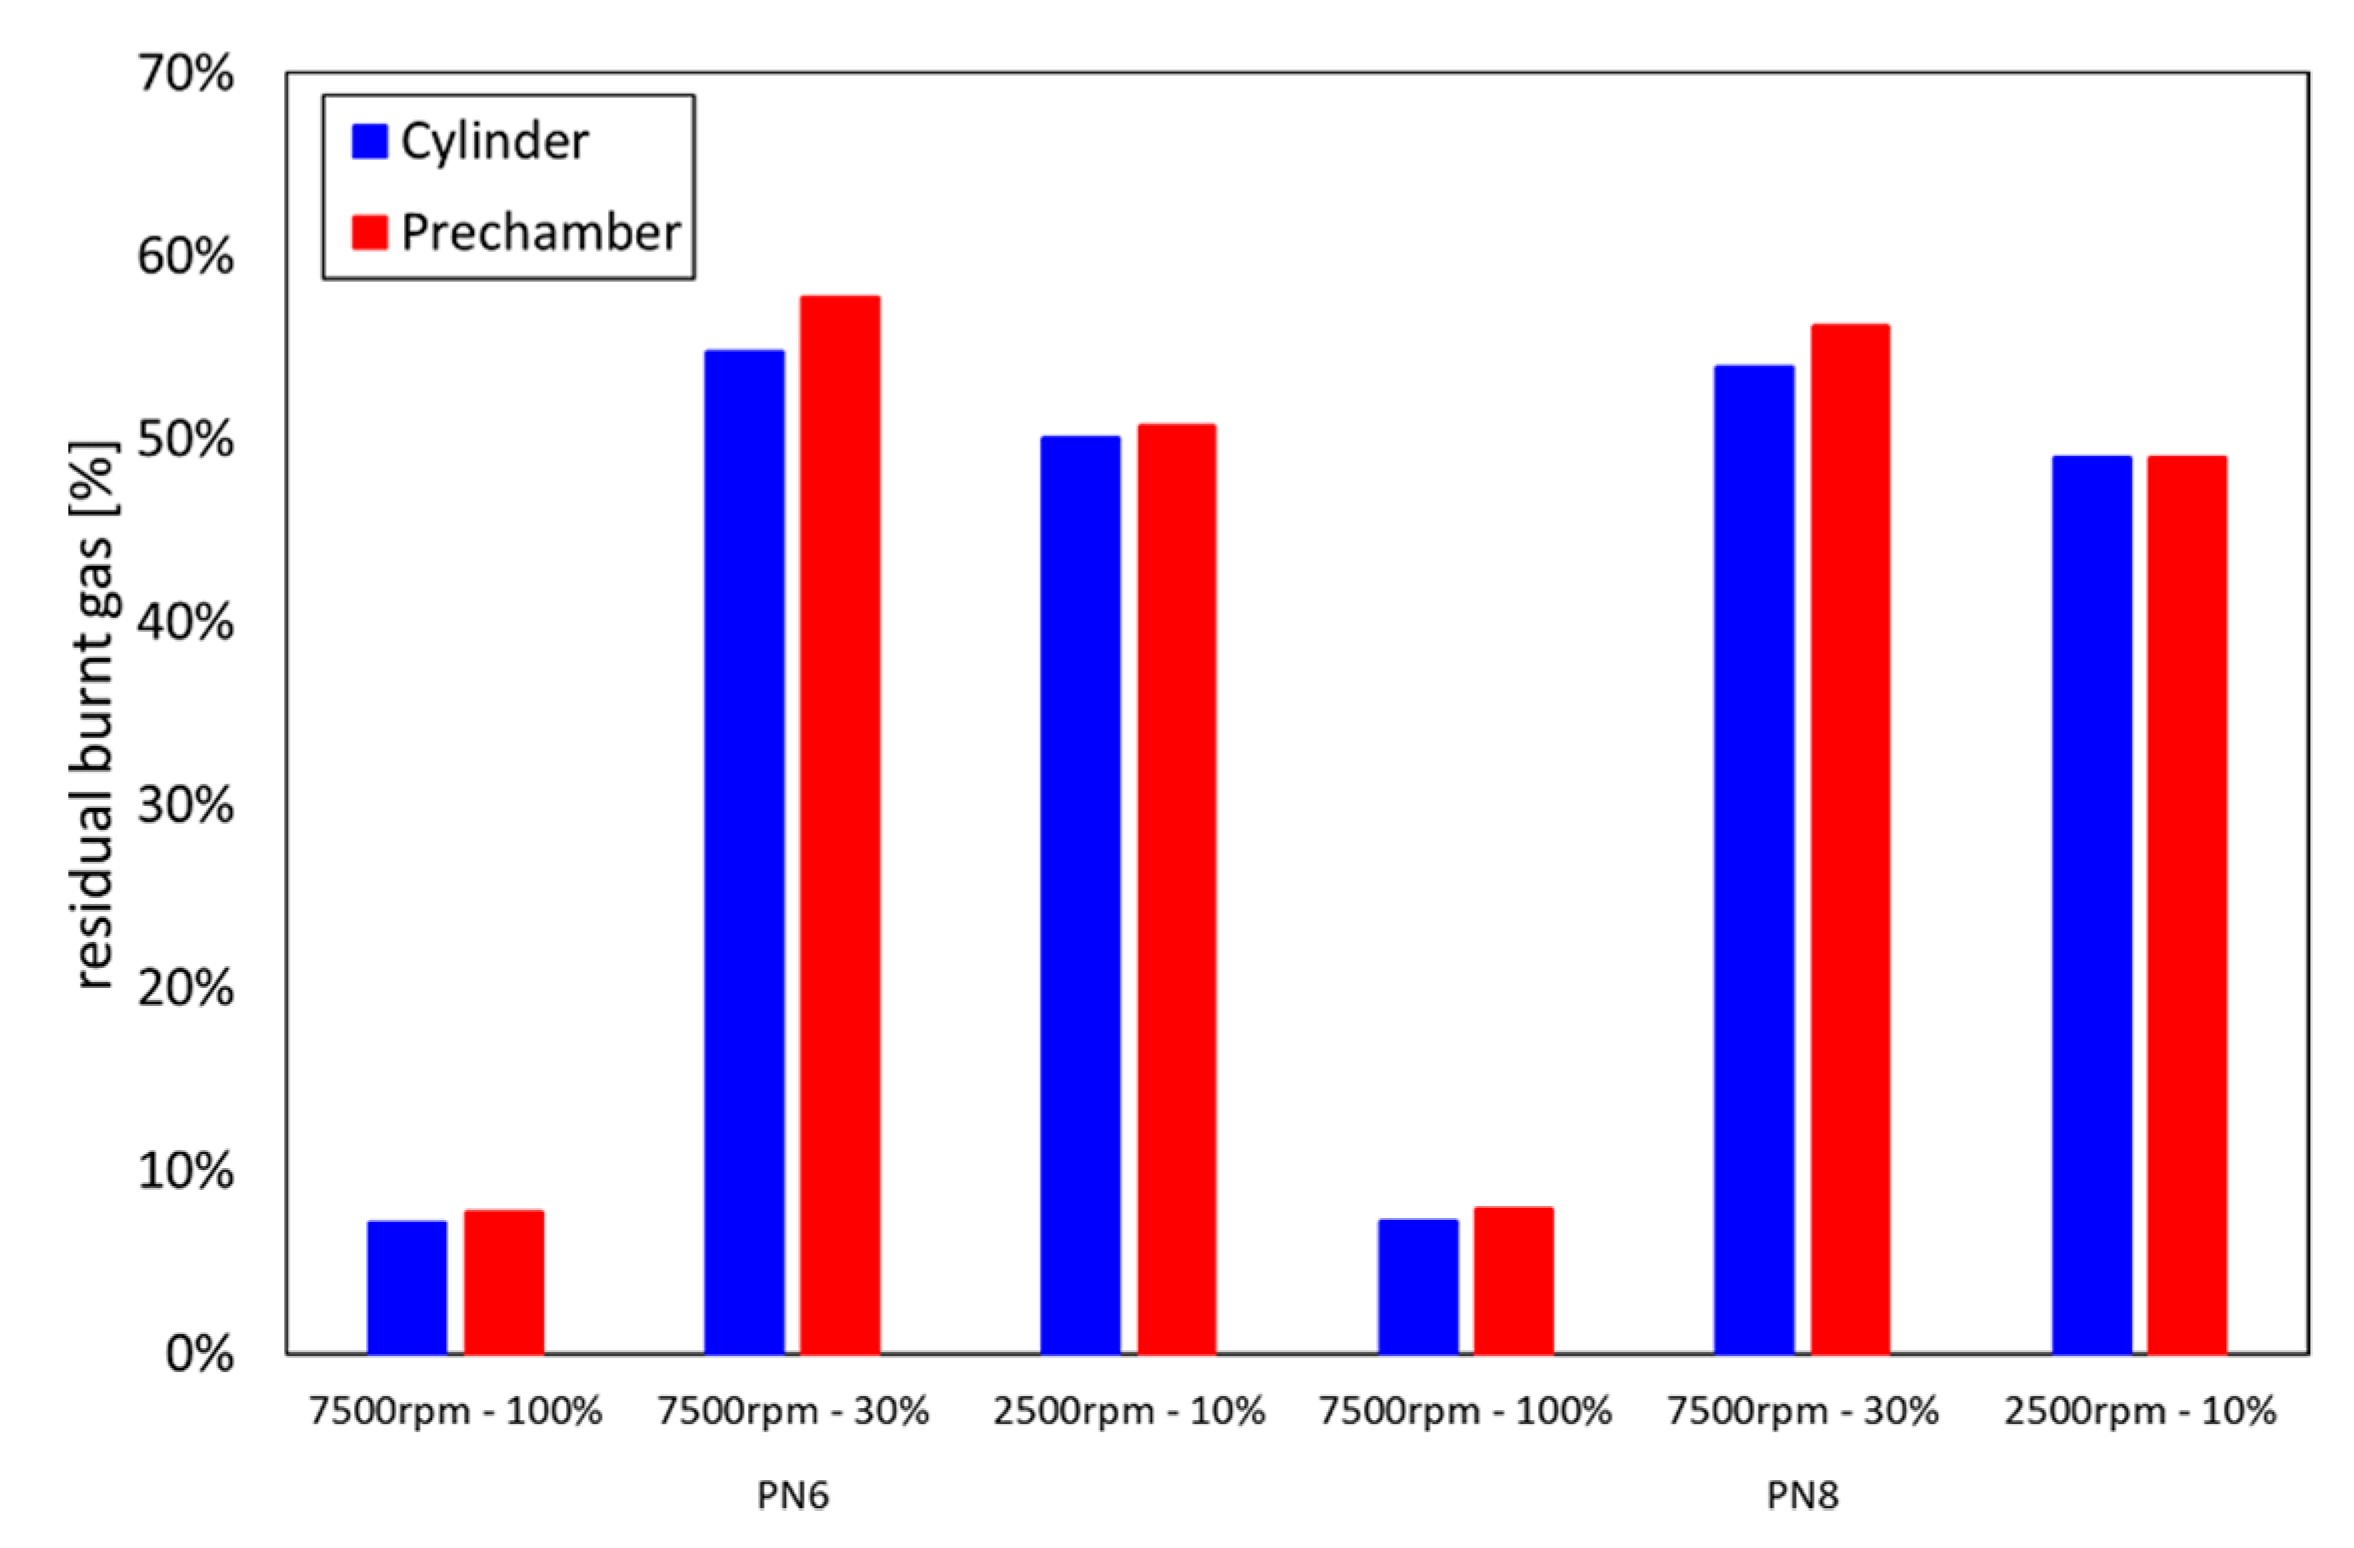
Nevertheless, at the end of the compression phase, the residuals fraction inside the prechamber is almost equal to the in-cylinder one in all the simulated operating engine points simulated, proving that the prechamber design allows a satisfactory scavenge of the burnt gas even at part load. As expected, at 7500 rpm and full load, the burned gas mass fraction is the lowest amongst the three cases, being roughly 7% for both the cylinder and the prechamber. Conversely, at 7500 rpm and 30% of the throttle valve opening, the dynamic effects are characterized by a lower amplitude and the fresh air delivered by the crank-case is lower, thus leading to a substantially higher value of residuals, being roughly 55% for both the cylinder and the prechamber. At 2500 rpm and 10% of the throttle valve opening, despite the very low speed and load condition, the residual gas inside the cylinder and the prechamber is close to 49%. This is due to the closing of the sliding exhaust valve, which changes the exhaust ports timing.
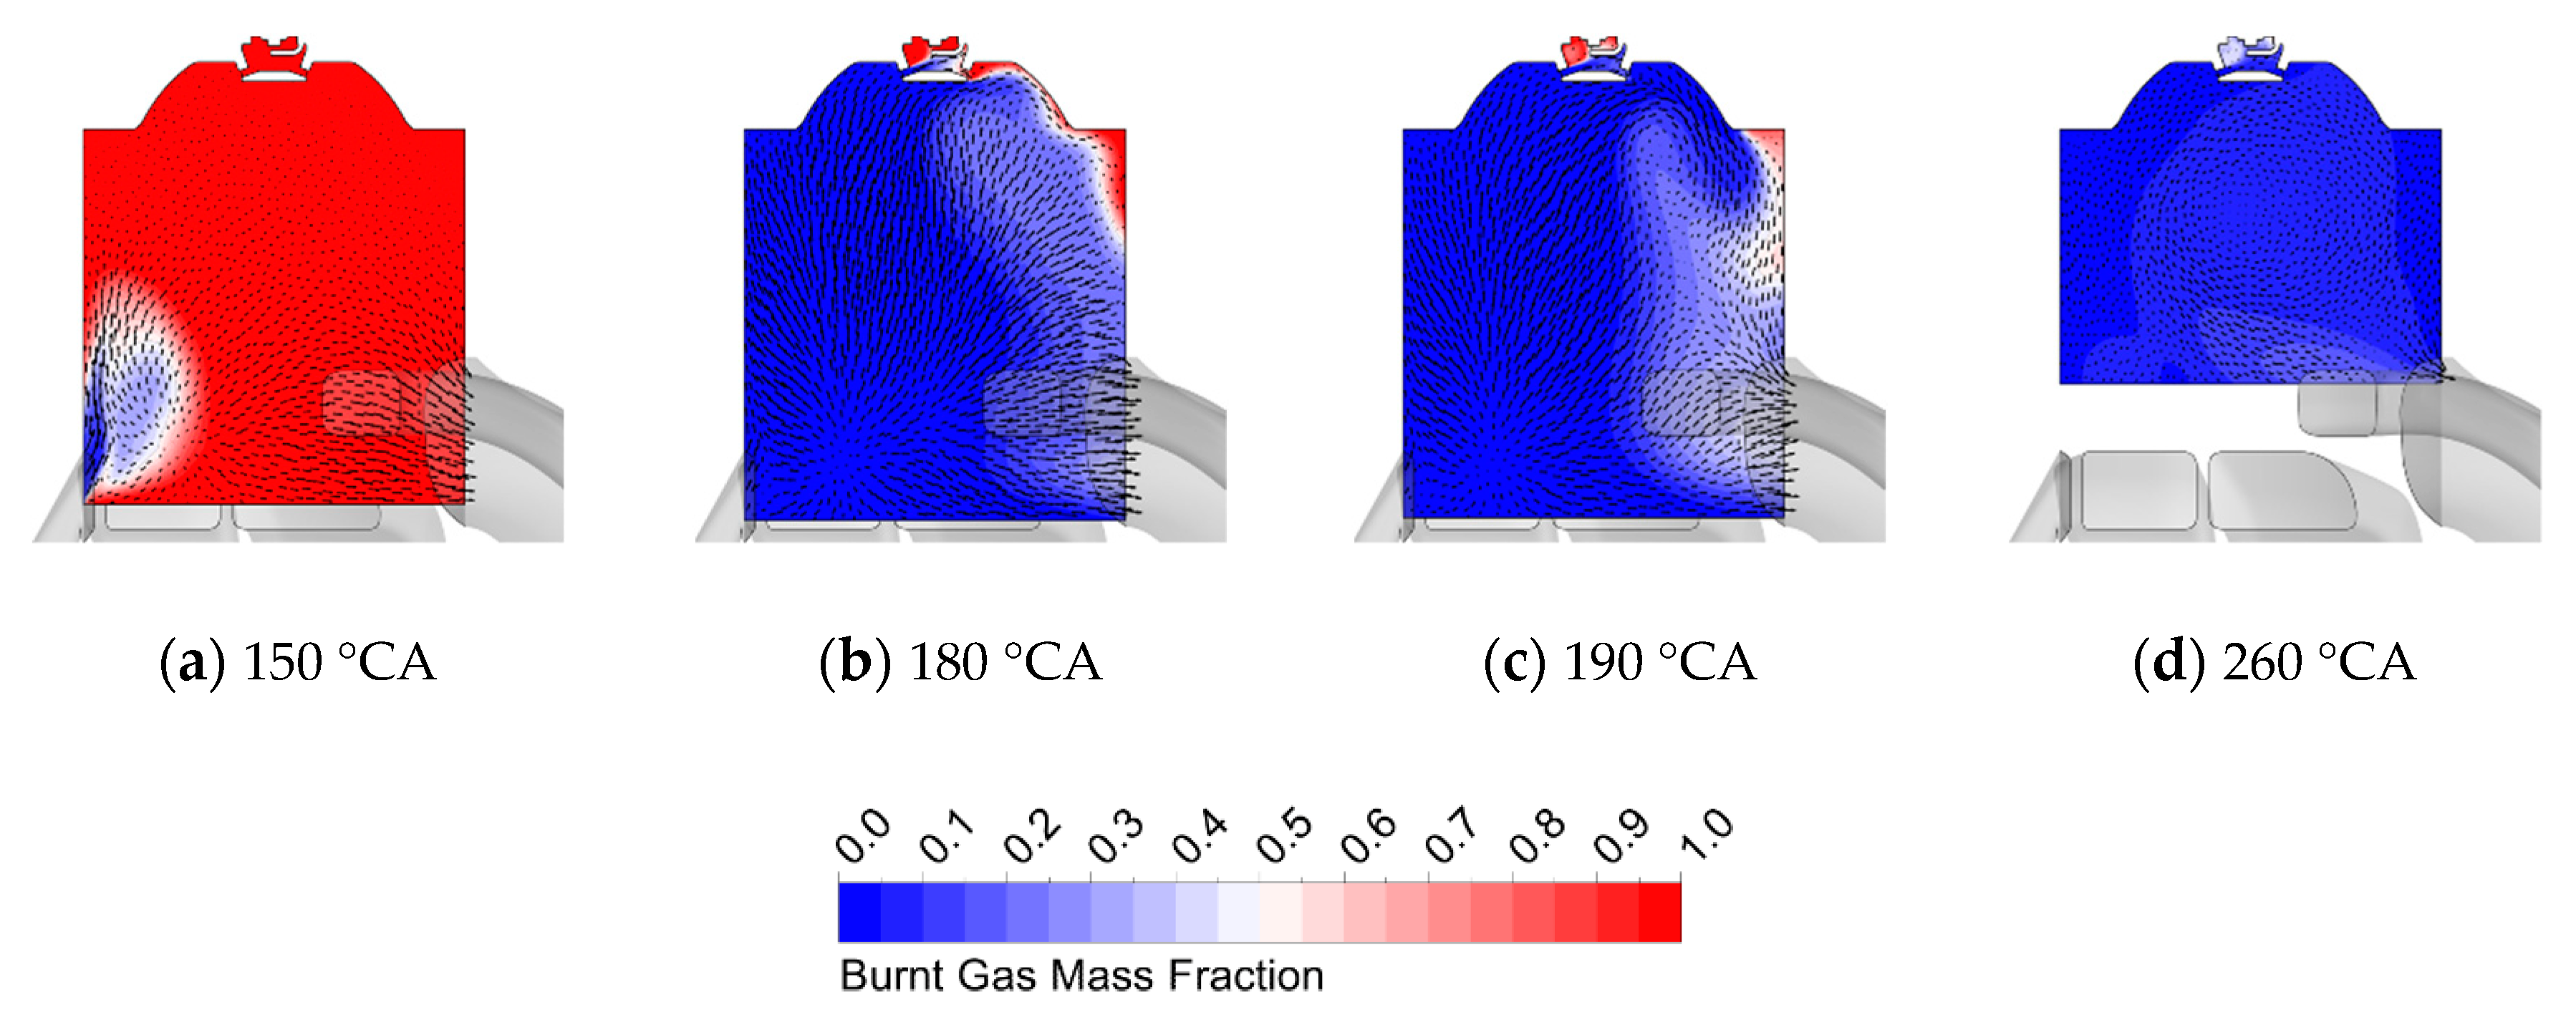
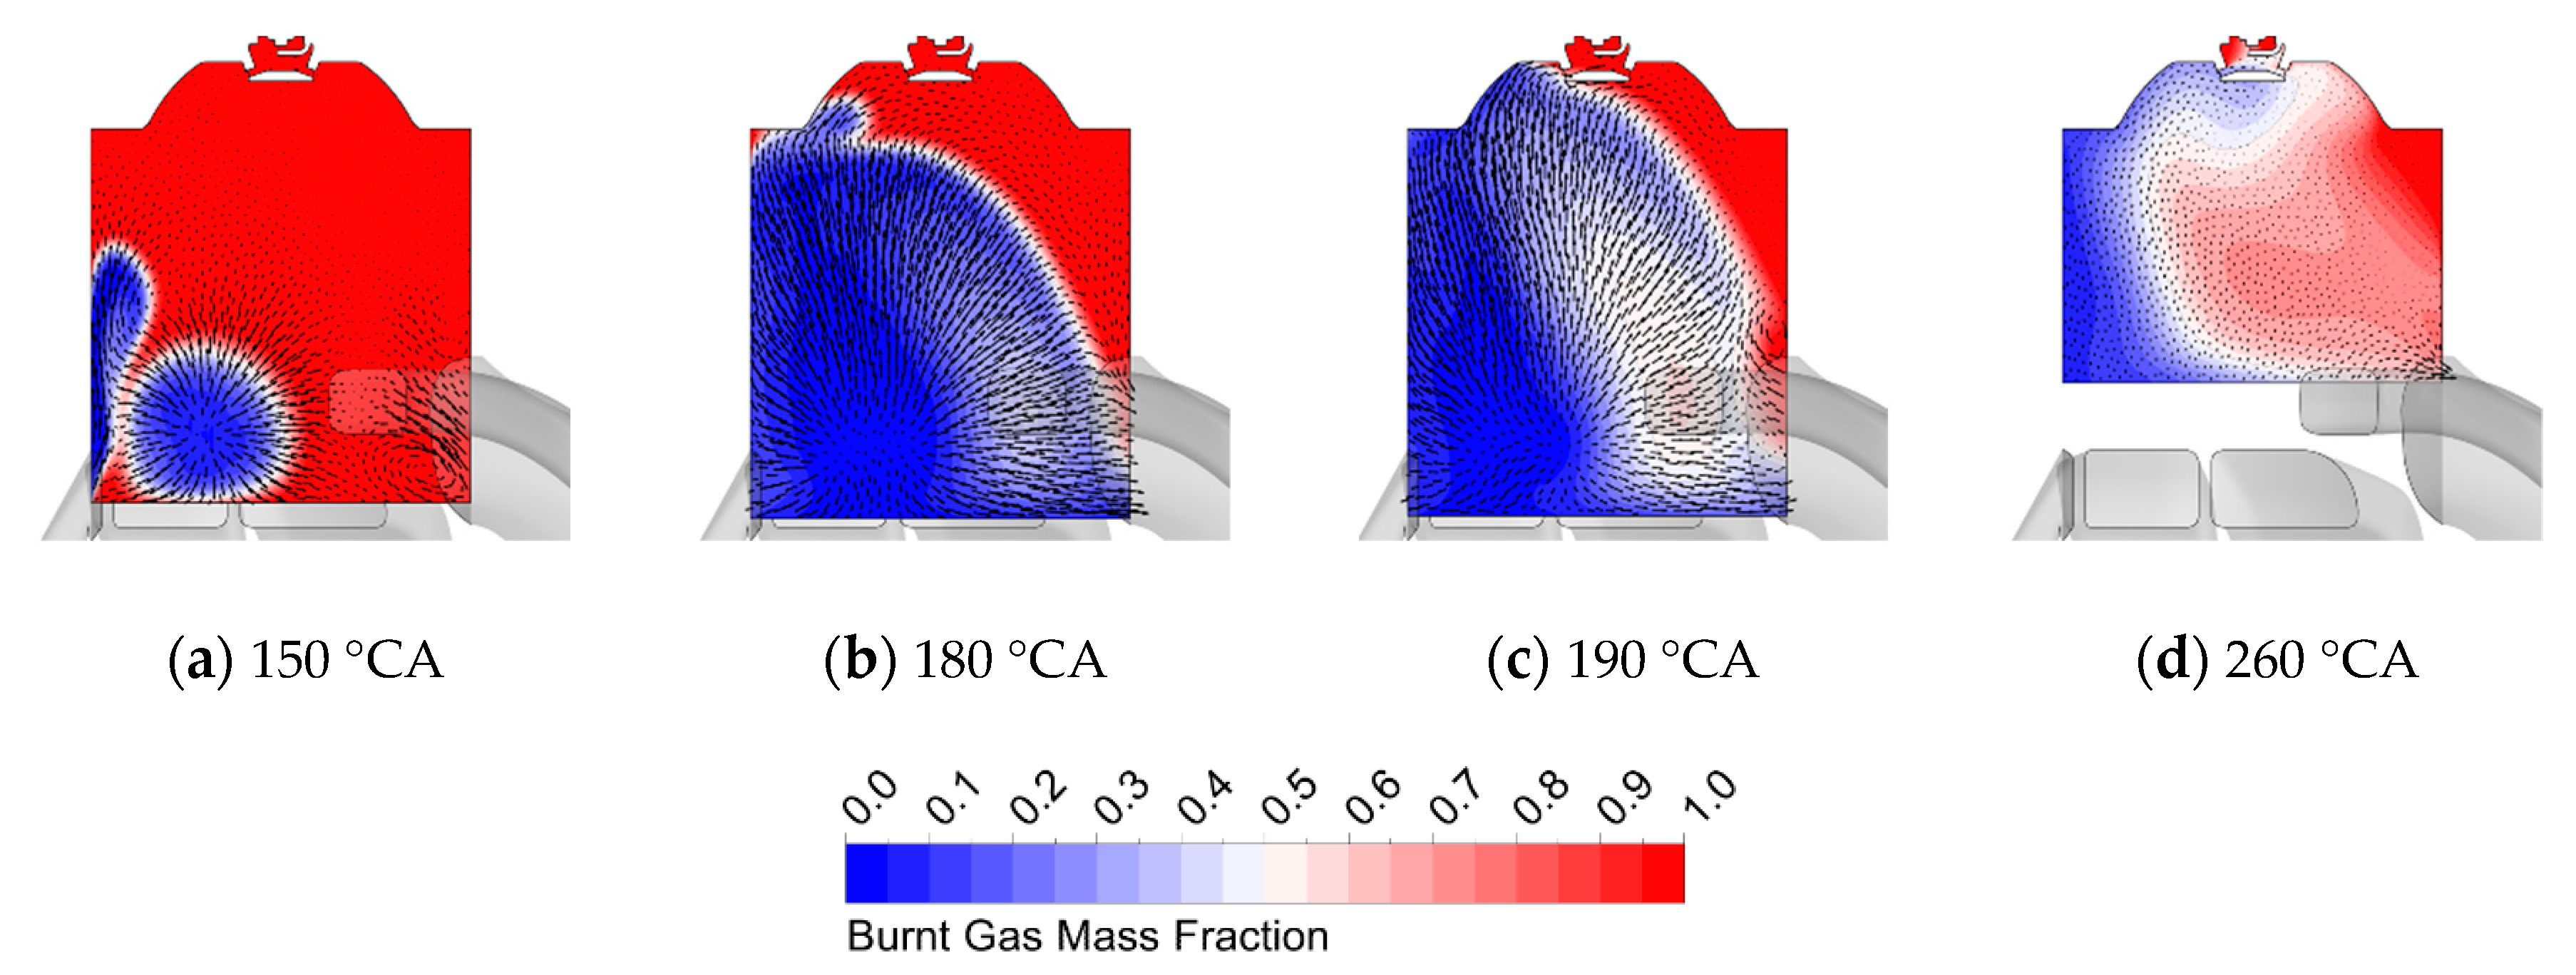
The spatial distribution of the flow field quantities is then analyzed in order to explain in more detail the physical processes affecting the scavenge. Figure 7 reports the contours of burned gas mass fraction and the velocity vectors on a vertical plane inside the cylinder for the first analyzed case at 7500 rpm and full load. When the piston is at the bottom dead center (BDC), the high-momentum fresh air jets coming from the transfer ports penetrates the cylinder volume (Figure 7a), and the burnt gas is displaced toward the exhaust ports (Figure 7b). When entering, the fresh charge velocity reaches values up to 250 m/s, and almost all of the residual gas is discharged around BDC (Figure 7c). At 260 °CA, close to the exhaust port closing (EPC), the backflow of hot gas, due to the dynamic effects, leads to the onset of a clockwise tumble vortex, which lasts for the entire compression stroke (Figure 7d).
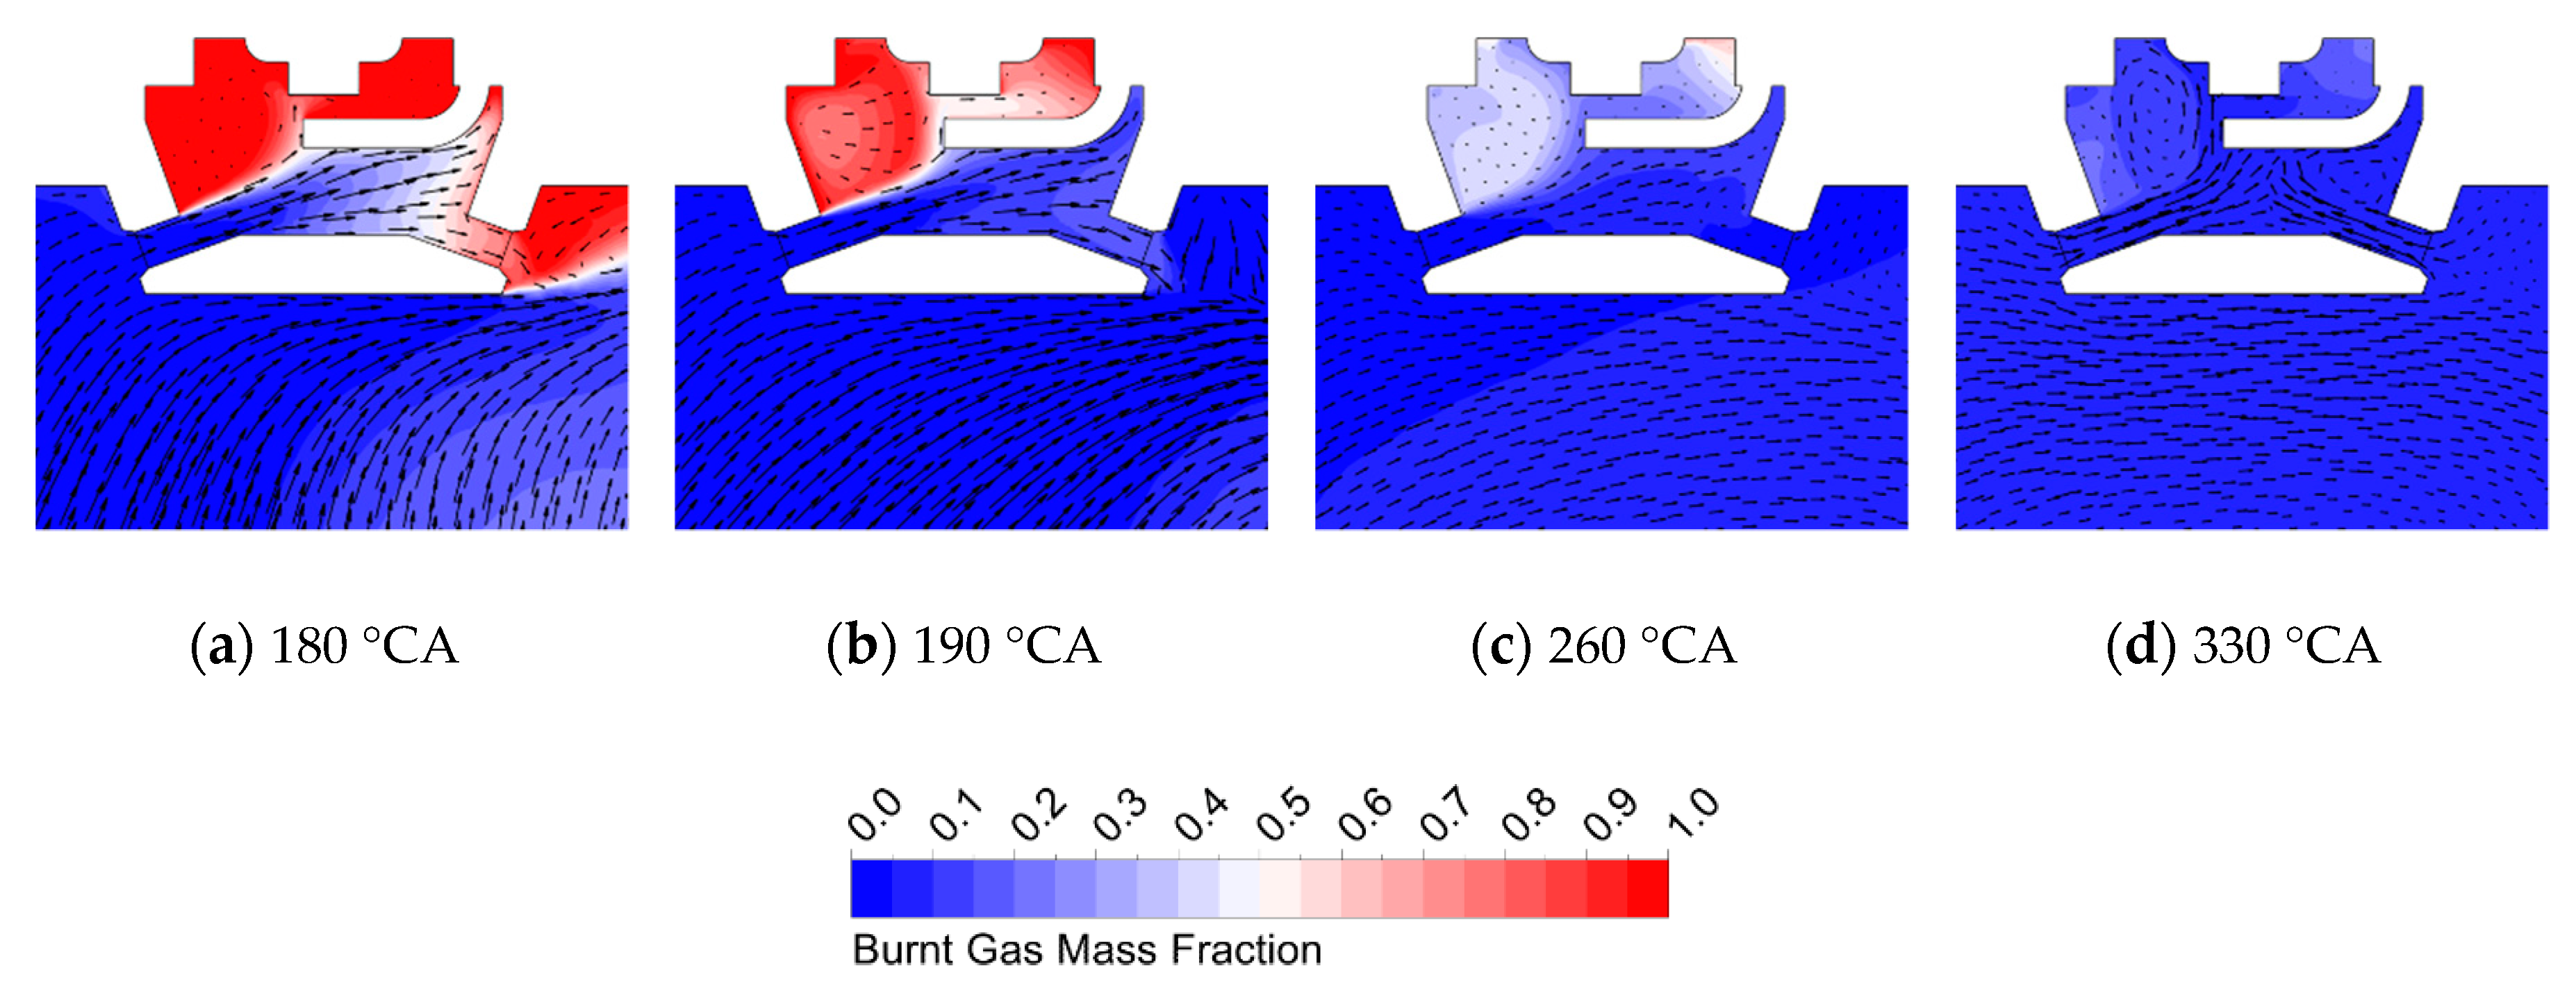
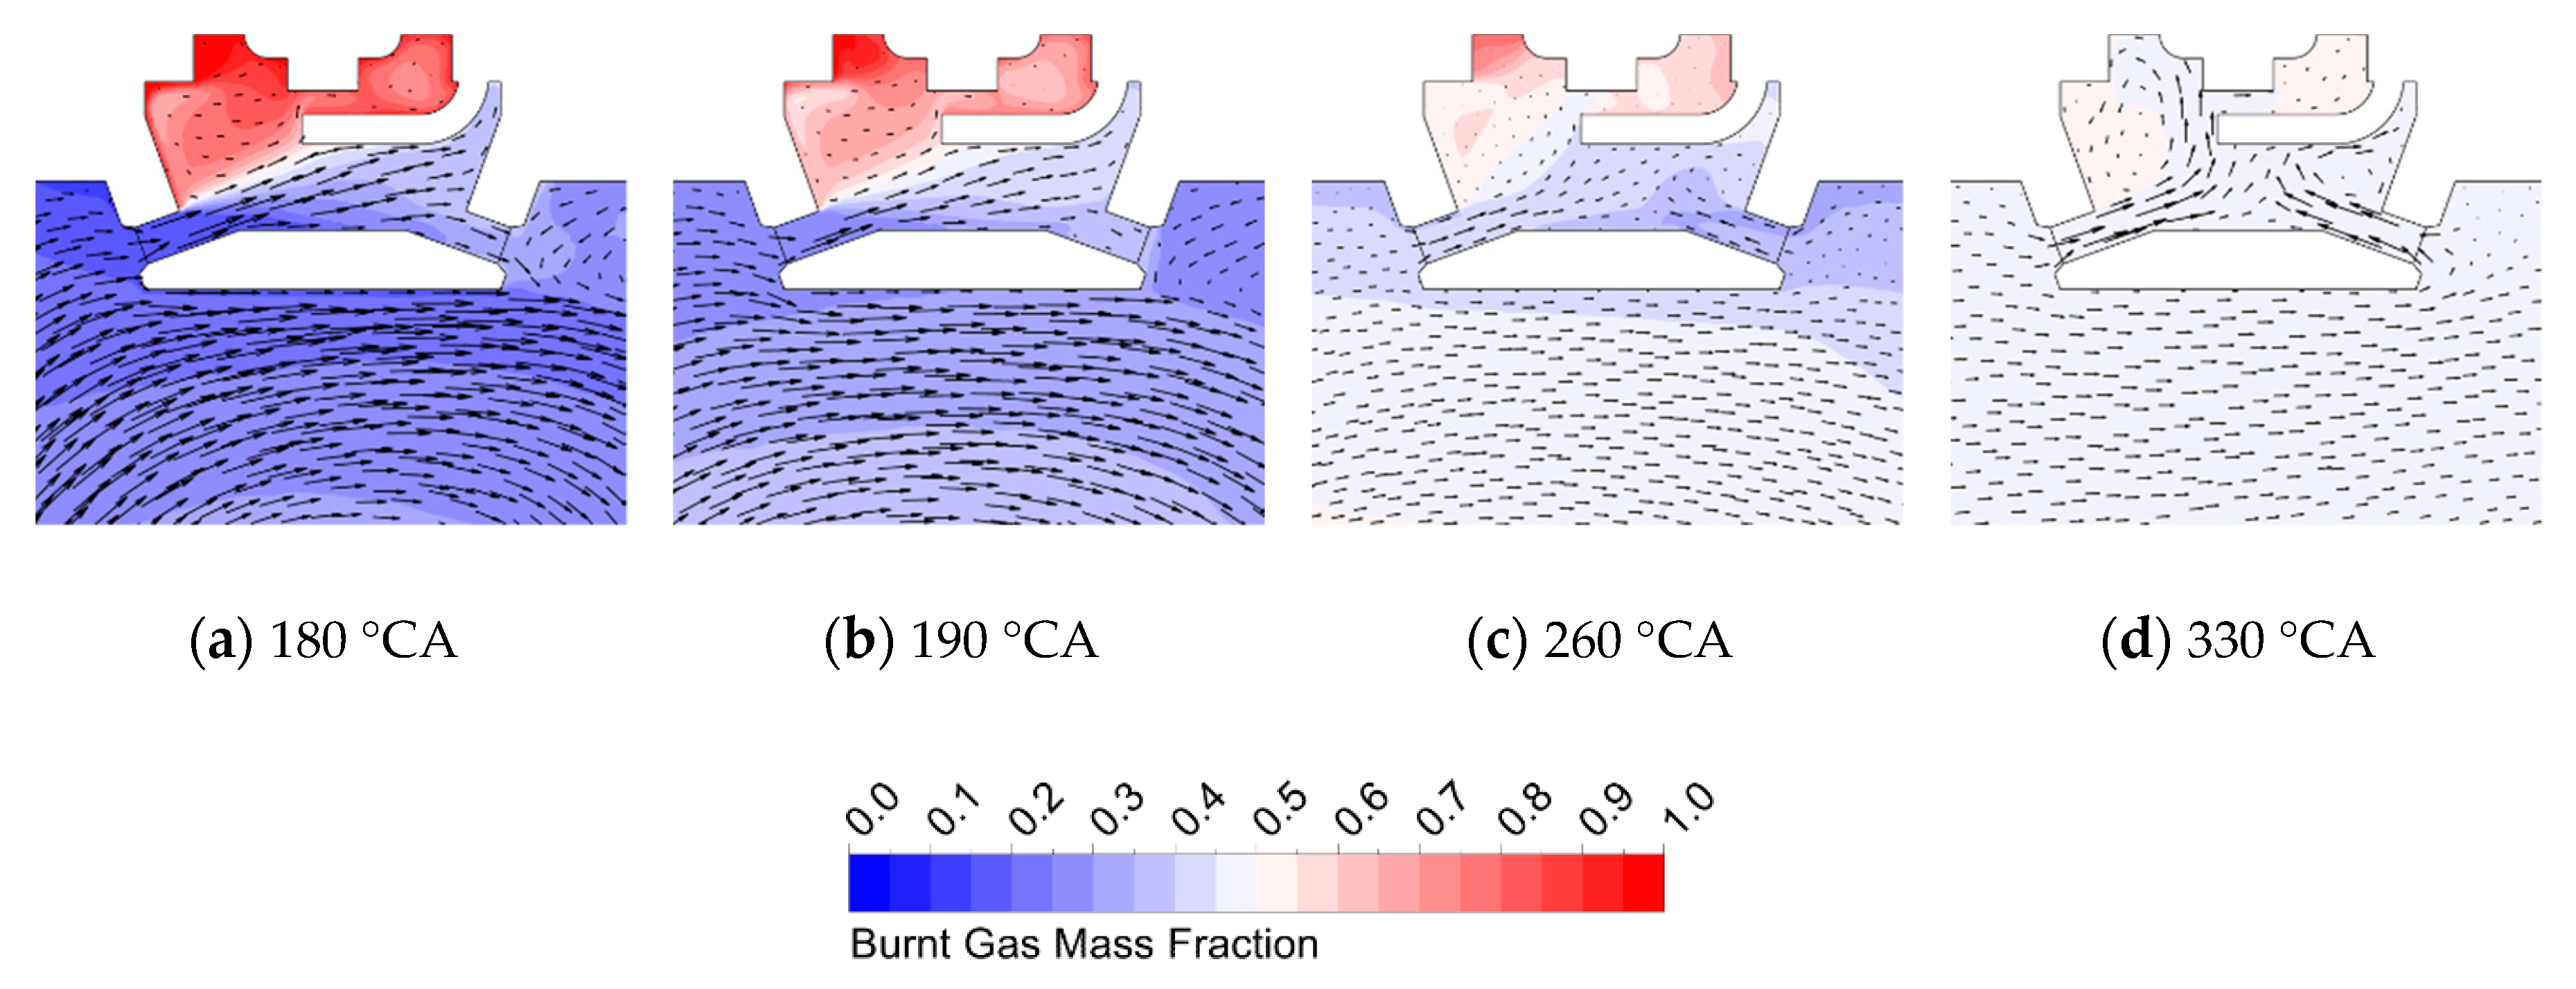
Figure 8 reports the contours of burned gas mass fraction and the relative velocity vectors on a vertical plane inside the prechamber for the case at maximum power. At 180 °CA, the orifices on the transfer side are reached by the upper part of the in-cylinder tumble vortex. The high-momentum flow, which reaches 140 m/s in the orifices on the transfer side, pushes the exhaust gas on the prechamber bottom toward the opposite orifices (Figure 8a). The fresh air–fuel mixture entering the prechamber leads to the formation of a counter-clockwise rotating vortex close to the spark plug electrode, which helps the scavenge of the upper volume of the prechamber (Figure 8b). Moving toward the TDC, the scavenging effect of the tumble vortex continues as it is further pushed into the prechamber from the upward piston motion, gradually becoming less intense (Figure 8c). At 260 °CA, the tumble vortex is no longer able to further clean the prechamber, and the prechamber is filled from both sides due the effect of the piston compression (Figure 8d).
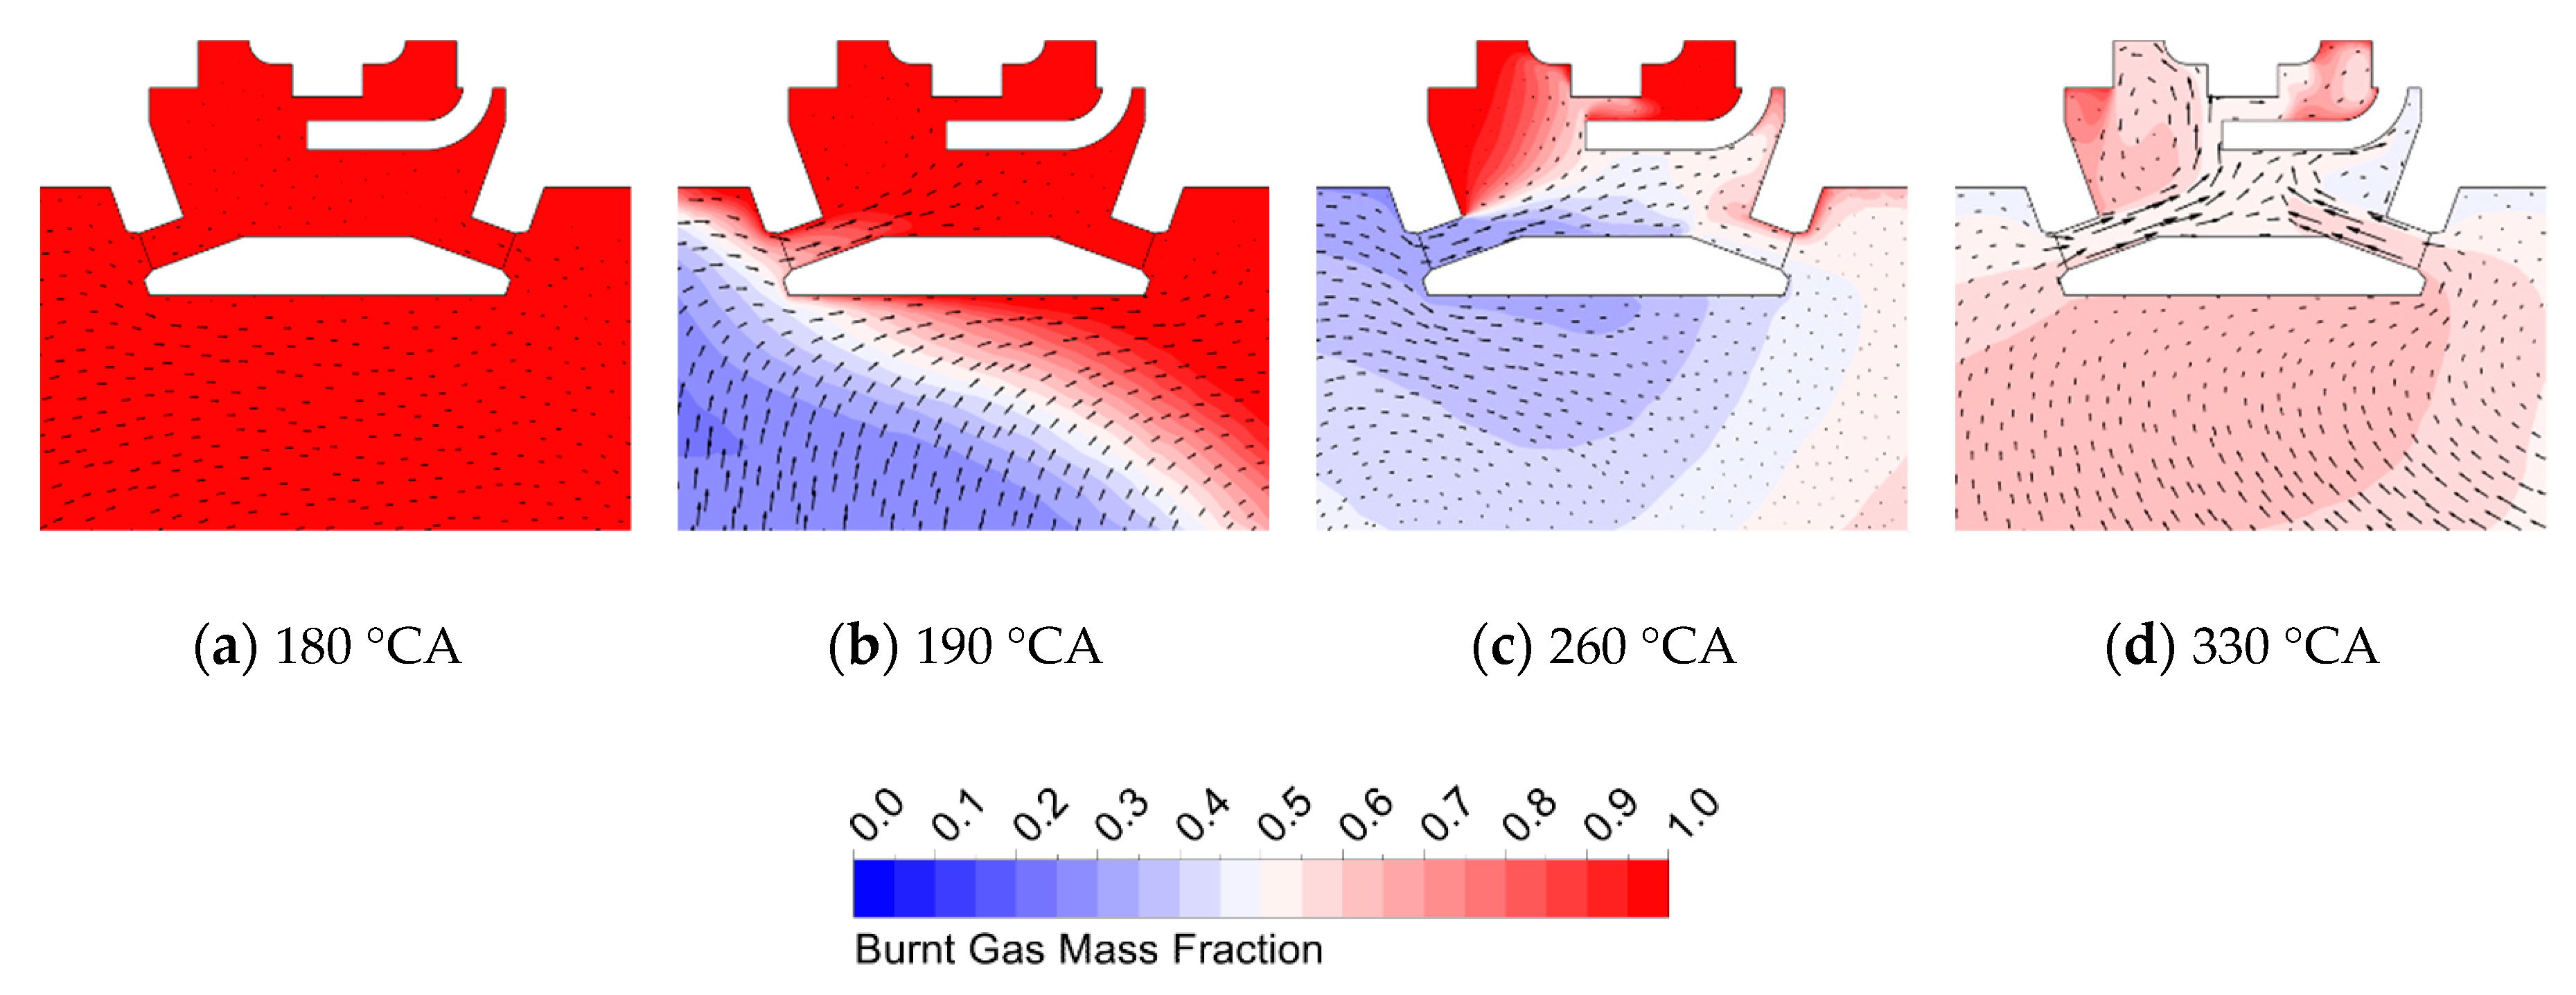
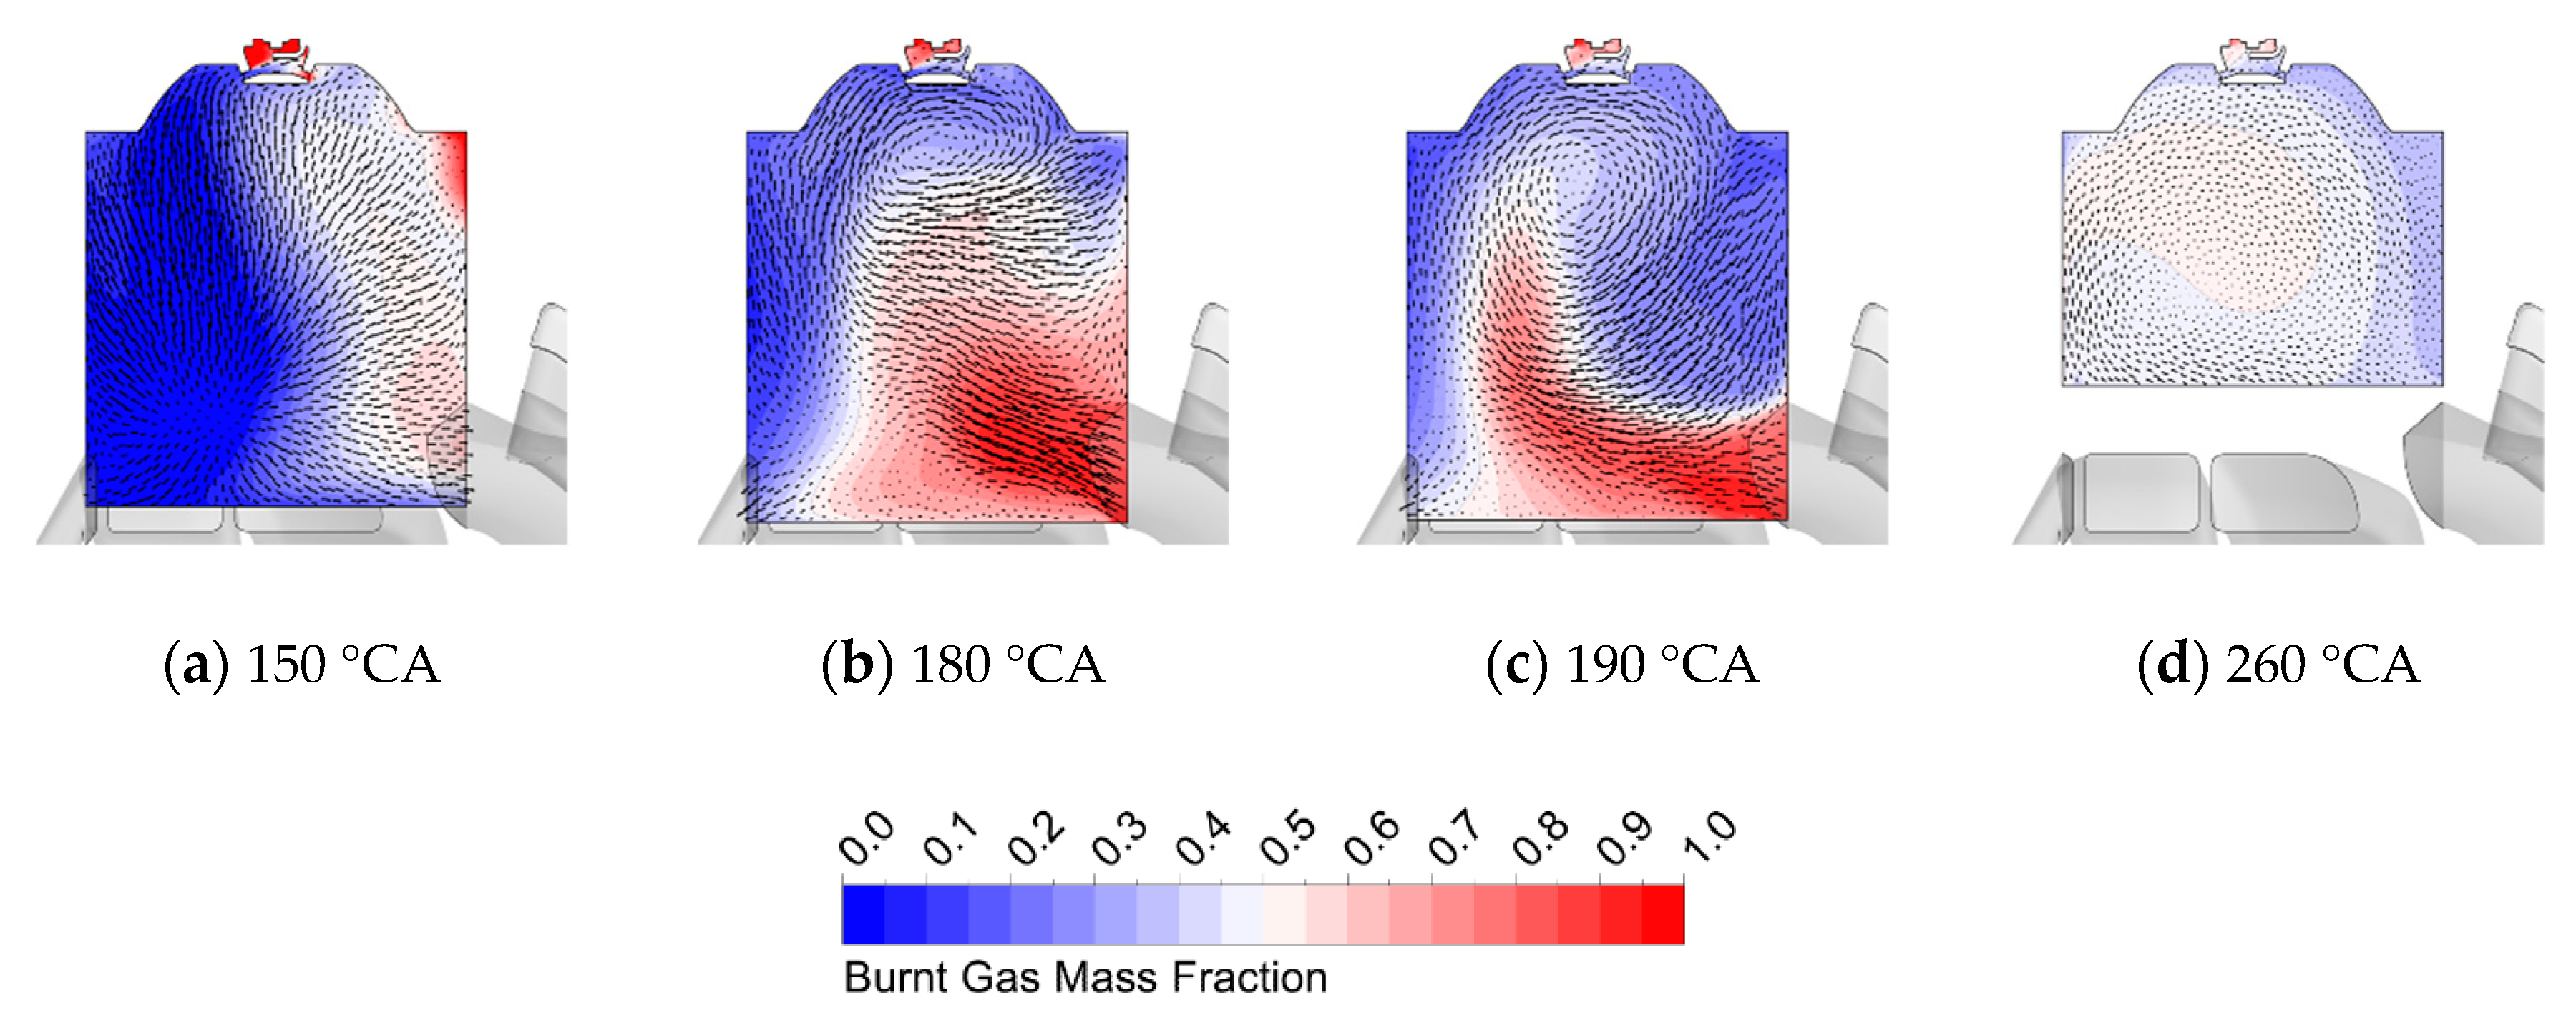
Figure 9 and Figure 10 show the residuals contours and the velocity vectors for the case at 7500 rpm and 30% of throttle valve opening inside the cylinder and the prechamber, respectively. The flow field inside the cylinder behaves differently if compared to full load. During the exhaust phase, a gas recirculation zone is formed at the exhaust port (Figure 9a), making the burnt gas discharge more difficult. The scavenging flow, rising from the transfer ports, is considerably weaker and it is not able to clear the cylinder from the residual gases, which remain trapped in the upper part of the cylinder, on the exhaust side (Figure 9b). At 260 °CA a large amount of burned gas is still present in the cylinder (Figure 9c). Furthermore, the lower amplitude of the exhaust wave does not allow the formation of the clockwise tumble during the compression phase (Figure 9d). As a result, at 180 °CA, the prechamber is still completely filled by residual gases (Figure 10a), and since the scavenging flow is very weak, the burnt gases do not exit from the prechamber until 190 °CA (Figure 10b). However, the fresh air flow does not have sufficient energy to suitably scavenge the exhaust gas, and a considerable amount of residuals remains trapped near the spark plug (Figure 10c). Thus, the exhaust gas is mainly discharged from the prechamber due to the suction effect of the piston during the expansion phase, while the fresh air mainly enters after the EPC, due to the compression. The final result is a high value of mass fraction of burnt gas (MFBG) in the whole prechamber volume (Figure 10d).
Figure 11 and Figure 12 show the residuals contours and the velocity vectors for the case at 2500 rpm and 10% of throttle valve opening inside the cylinder and the prechamber, respectively. Thanks to the longer duration of the scavenging process, due to the low engine speed, the scavenging flow has already cleared a large portion of the cylinder at 150 °CA (Figure 11a). Although the sliding valve is closed, the pressure waves coming from the exhaust port are not properly tuned, and they lead to the reintroduction of residual gases in the cylinder (Figure 11b,c). The onset of the clockwise tumble vortex is still clearly visible, even if the velocity of the fresh flow from the transfer ports does not exceed 90 m/s (Figure 11b). As a result, the tumble vortex reaches the transfer side orifices about 40 °CA before BDC, with a maximum velocity of 75 m/s. At the BDC, the fresh charge has already entered the prechamber and started to displace the residual gas (Figure 12a). Due to the low engine load, the counter-clockwise vortex in the prechamber is not intense enough to clear the upper part of the prechamber, close to the spark plug (Figure 12b). At 260 °CA and during the whole compression, the prechamber is filled from both sides due to the piston motion.
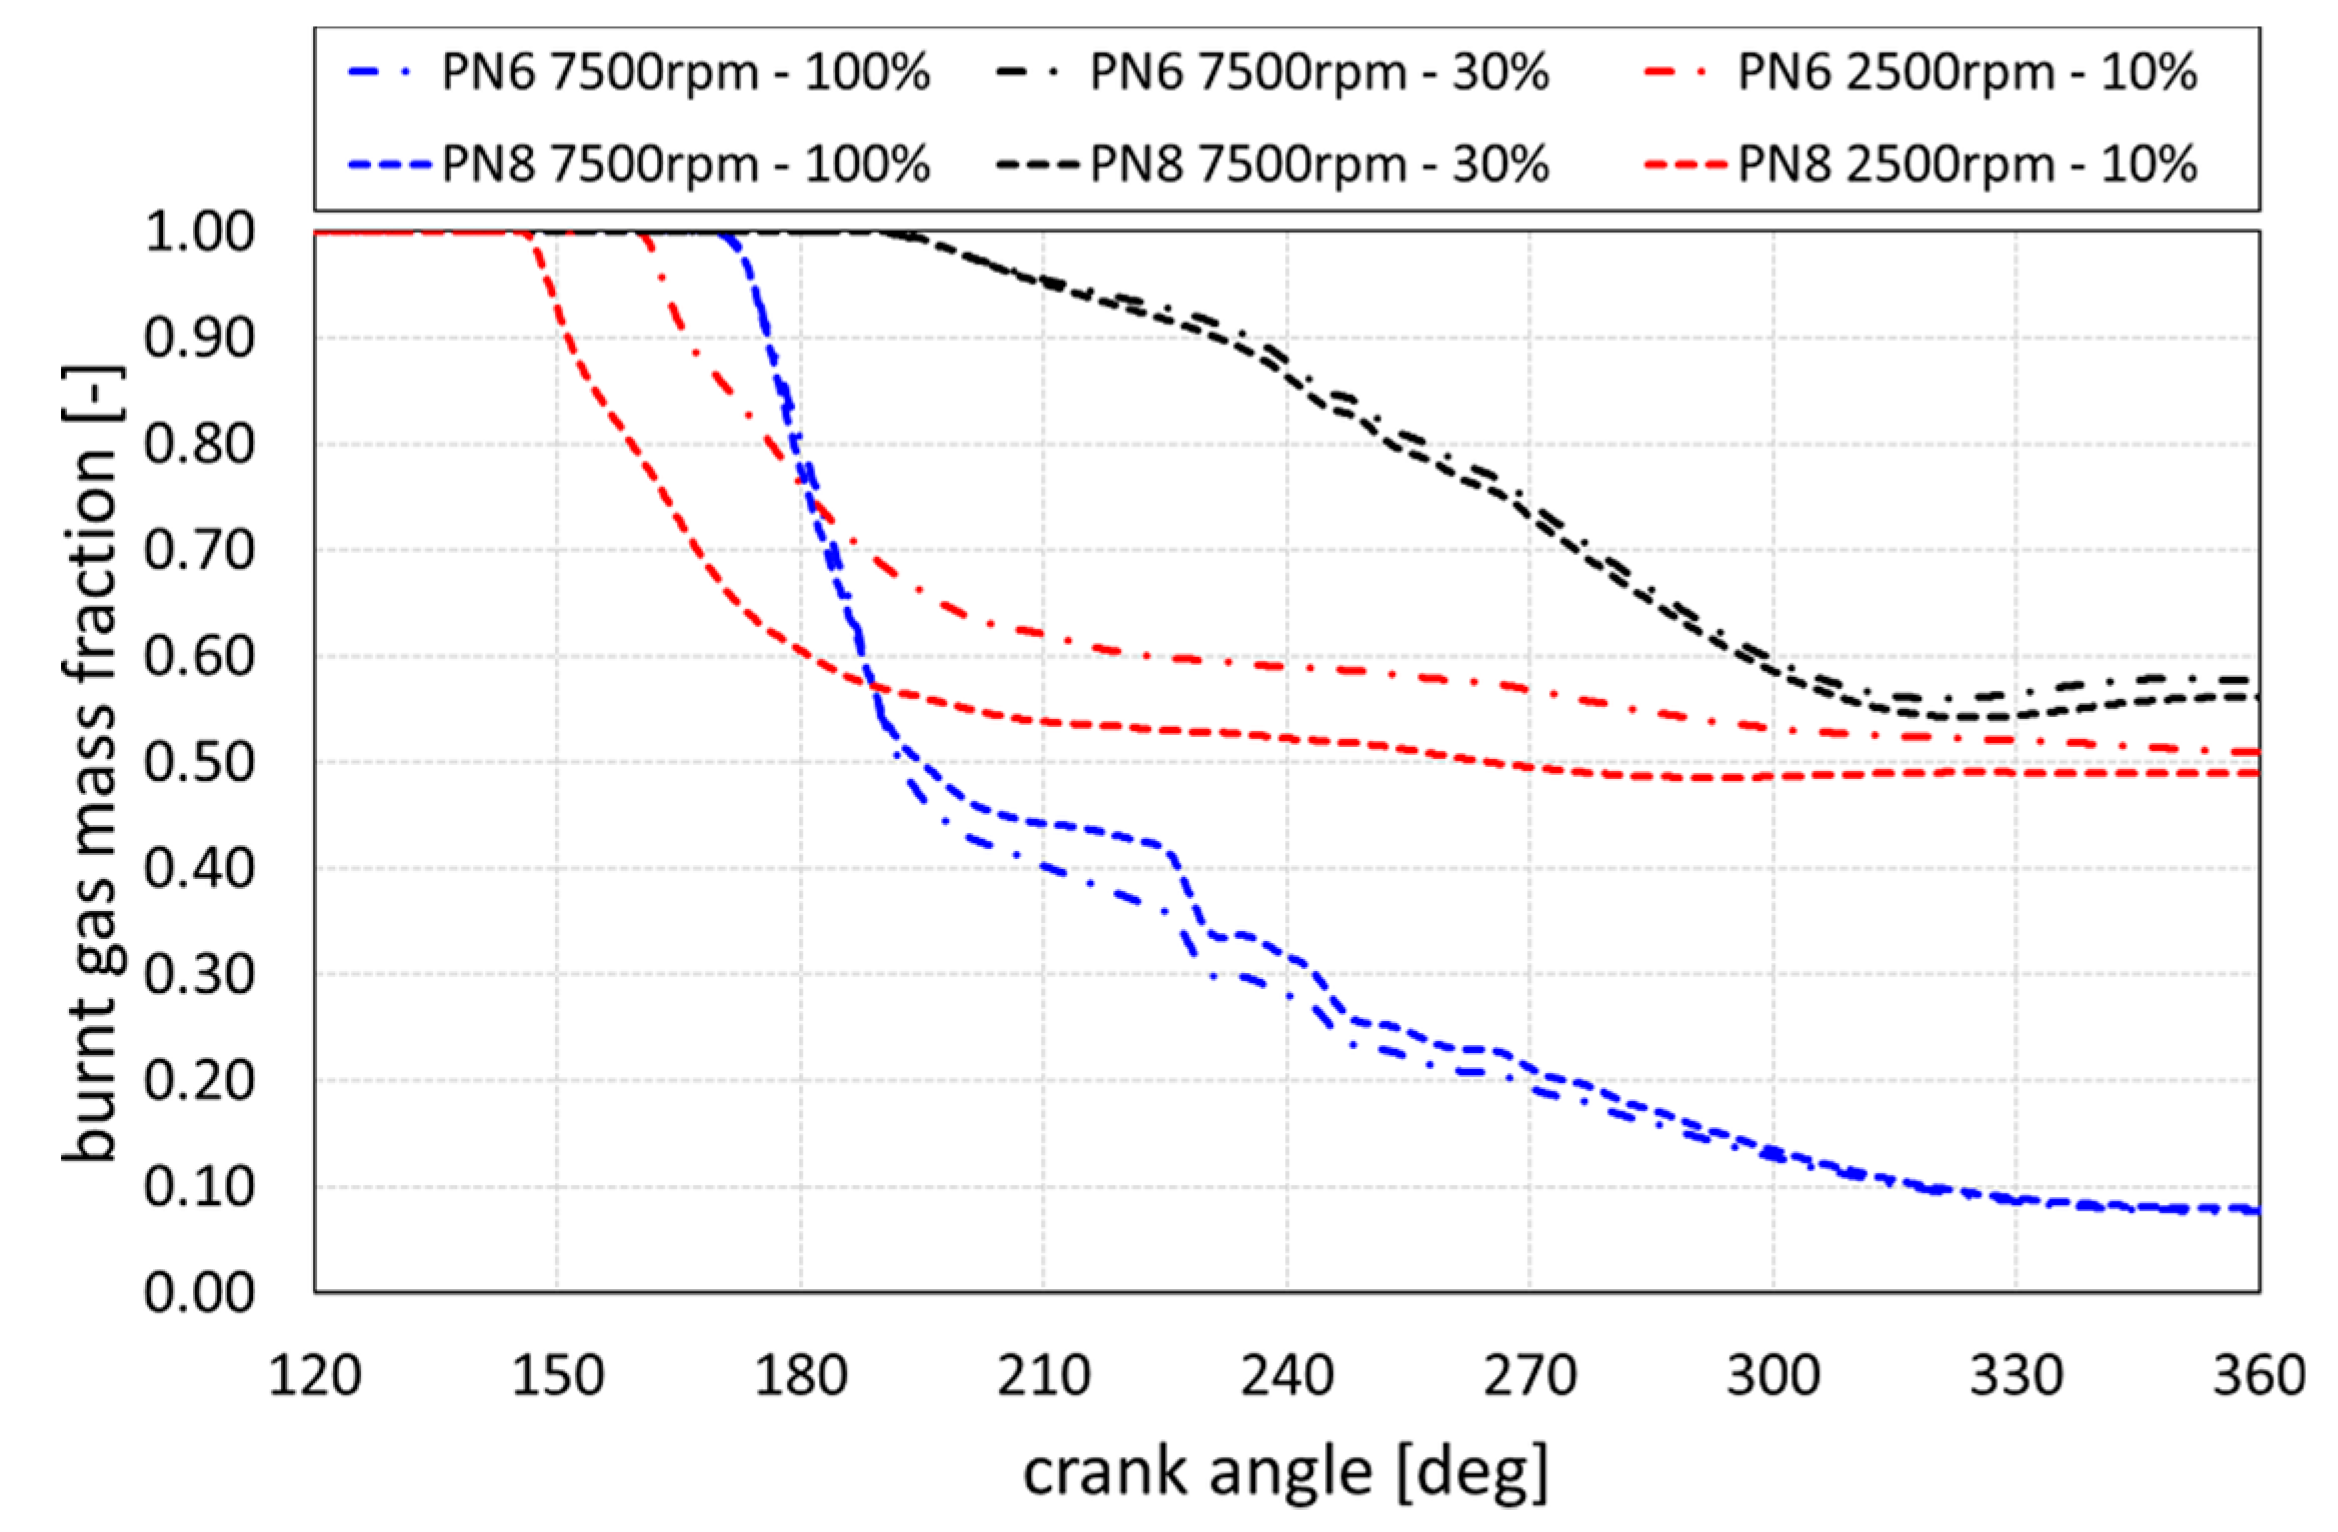
Figure 13 reports the comparison of the trends of burned gas mass fraction between the PN6 and PN8 prechambers. The behavior of the scavenging process is the same for both prechambers during the whole engine cycle, especially when the engine is at 7500 rpm. At 2500 rpm and 10% of throttle valve opening, the scavenging of PN6 is slightly delayed because of the higher height-to-diameter ratio, which leads to a longer the scavenging process. Notwithstanding this, the amount of residual gas at the TDC is very similar between the two prechambers.
In Figure 14, the burned gas mass fraction in the cylinder and prechamber volumes are quantified at the TDC for both PN6 and PN8 configurations. It can be noted that the amount of residual gas in the prechamber is very similar to the amount of residual gases in the cylinder, for all the simulated engine operating conditions. Comparing PN6 and PN8 prechambers, it can be claimed that no significant differences in terms of scavenging process at full load are apparent. Conversely, at partial loads, the smaller height-to-diameter ratio slightly promotes the scavenging of the residual gas. The resulting burned gas mass fraction for the PN8 case is 2.8% lower than the PN6 case at 7500 rpm and 3.9% lower at 2500 rpm.

3.2. Analysis of the Injection Phase

The details of the injection process inside the cylinder are first analyzed from a global point of view for the PN6 prechamber simulations for the three engine points. The global in-cylinder homogenization and the exhaust short circuit are also commented on. Then, a more specific analysis is carried out for the condition inside the two prechambers at TDC, in terms of equivalence ratio and mixture homogenization.
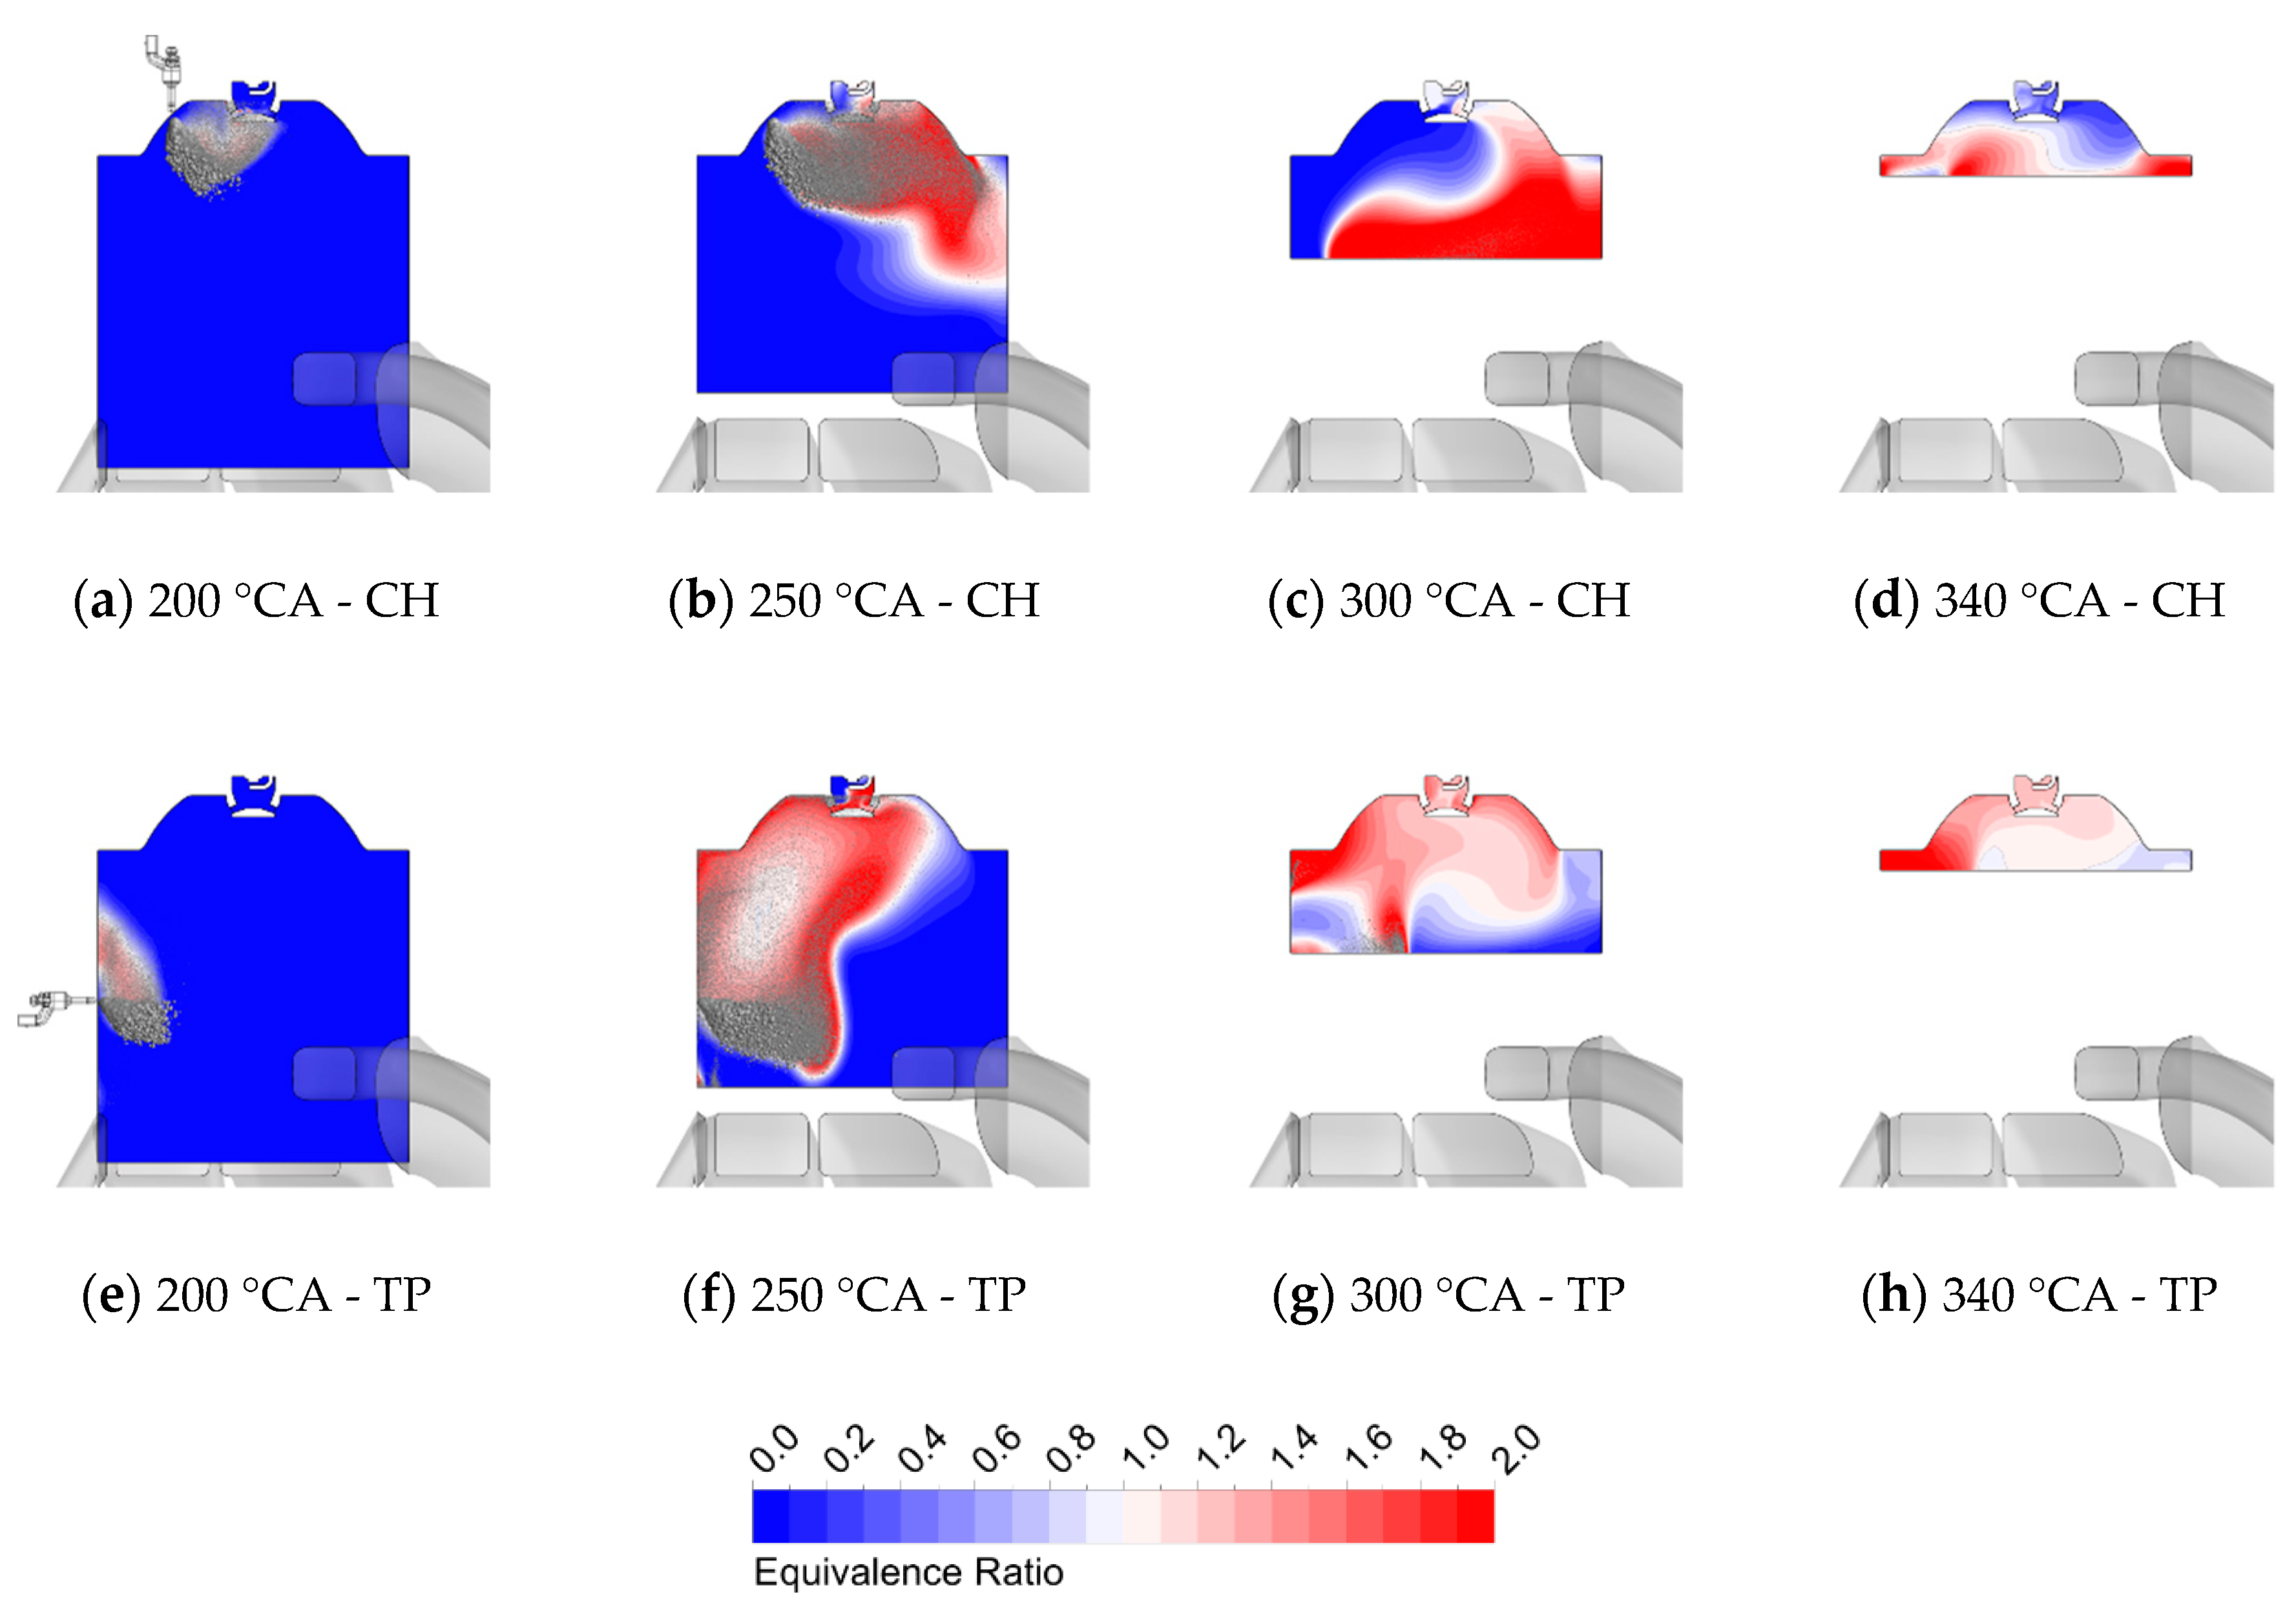
Starting from the in-cylinder analysis at 7500 rpm and full load, Figure 15 reports the comparison between the results of the simulations with the two different injector positionings, i.e., on the cylinder head (CH) and above the fifth transfer port (TP). The results show the contours of equivalence ratio and the liquid droplets distribution only for the PN6 prechamber cases, but they can be generalized for the PN8 results as well.
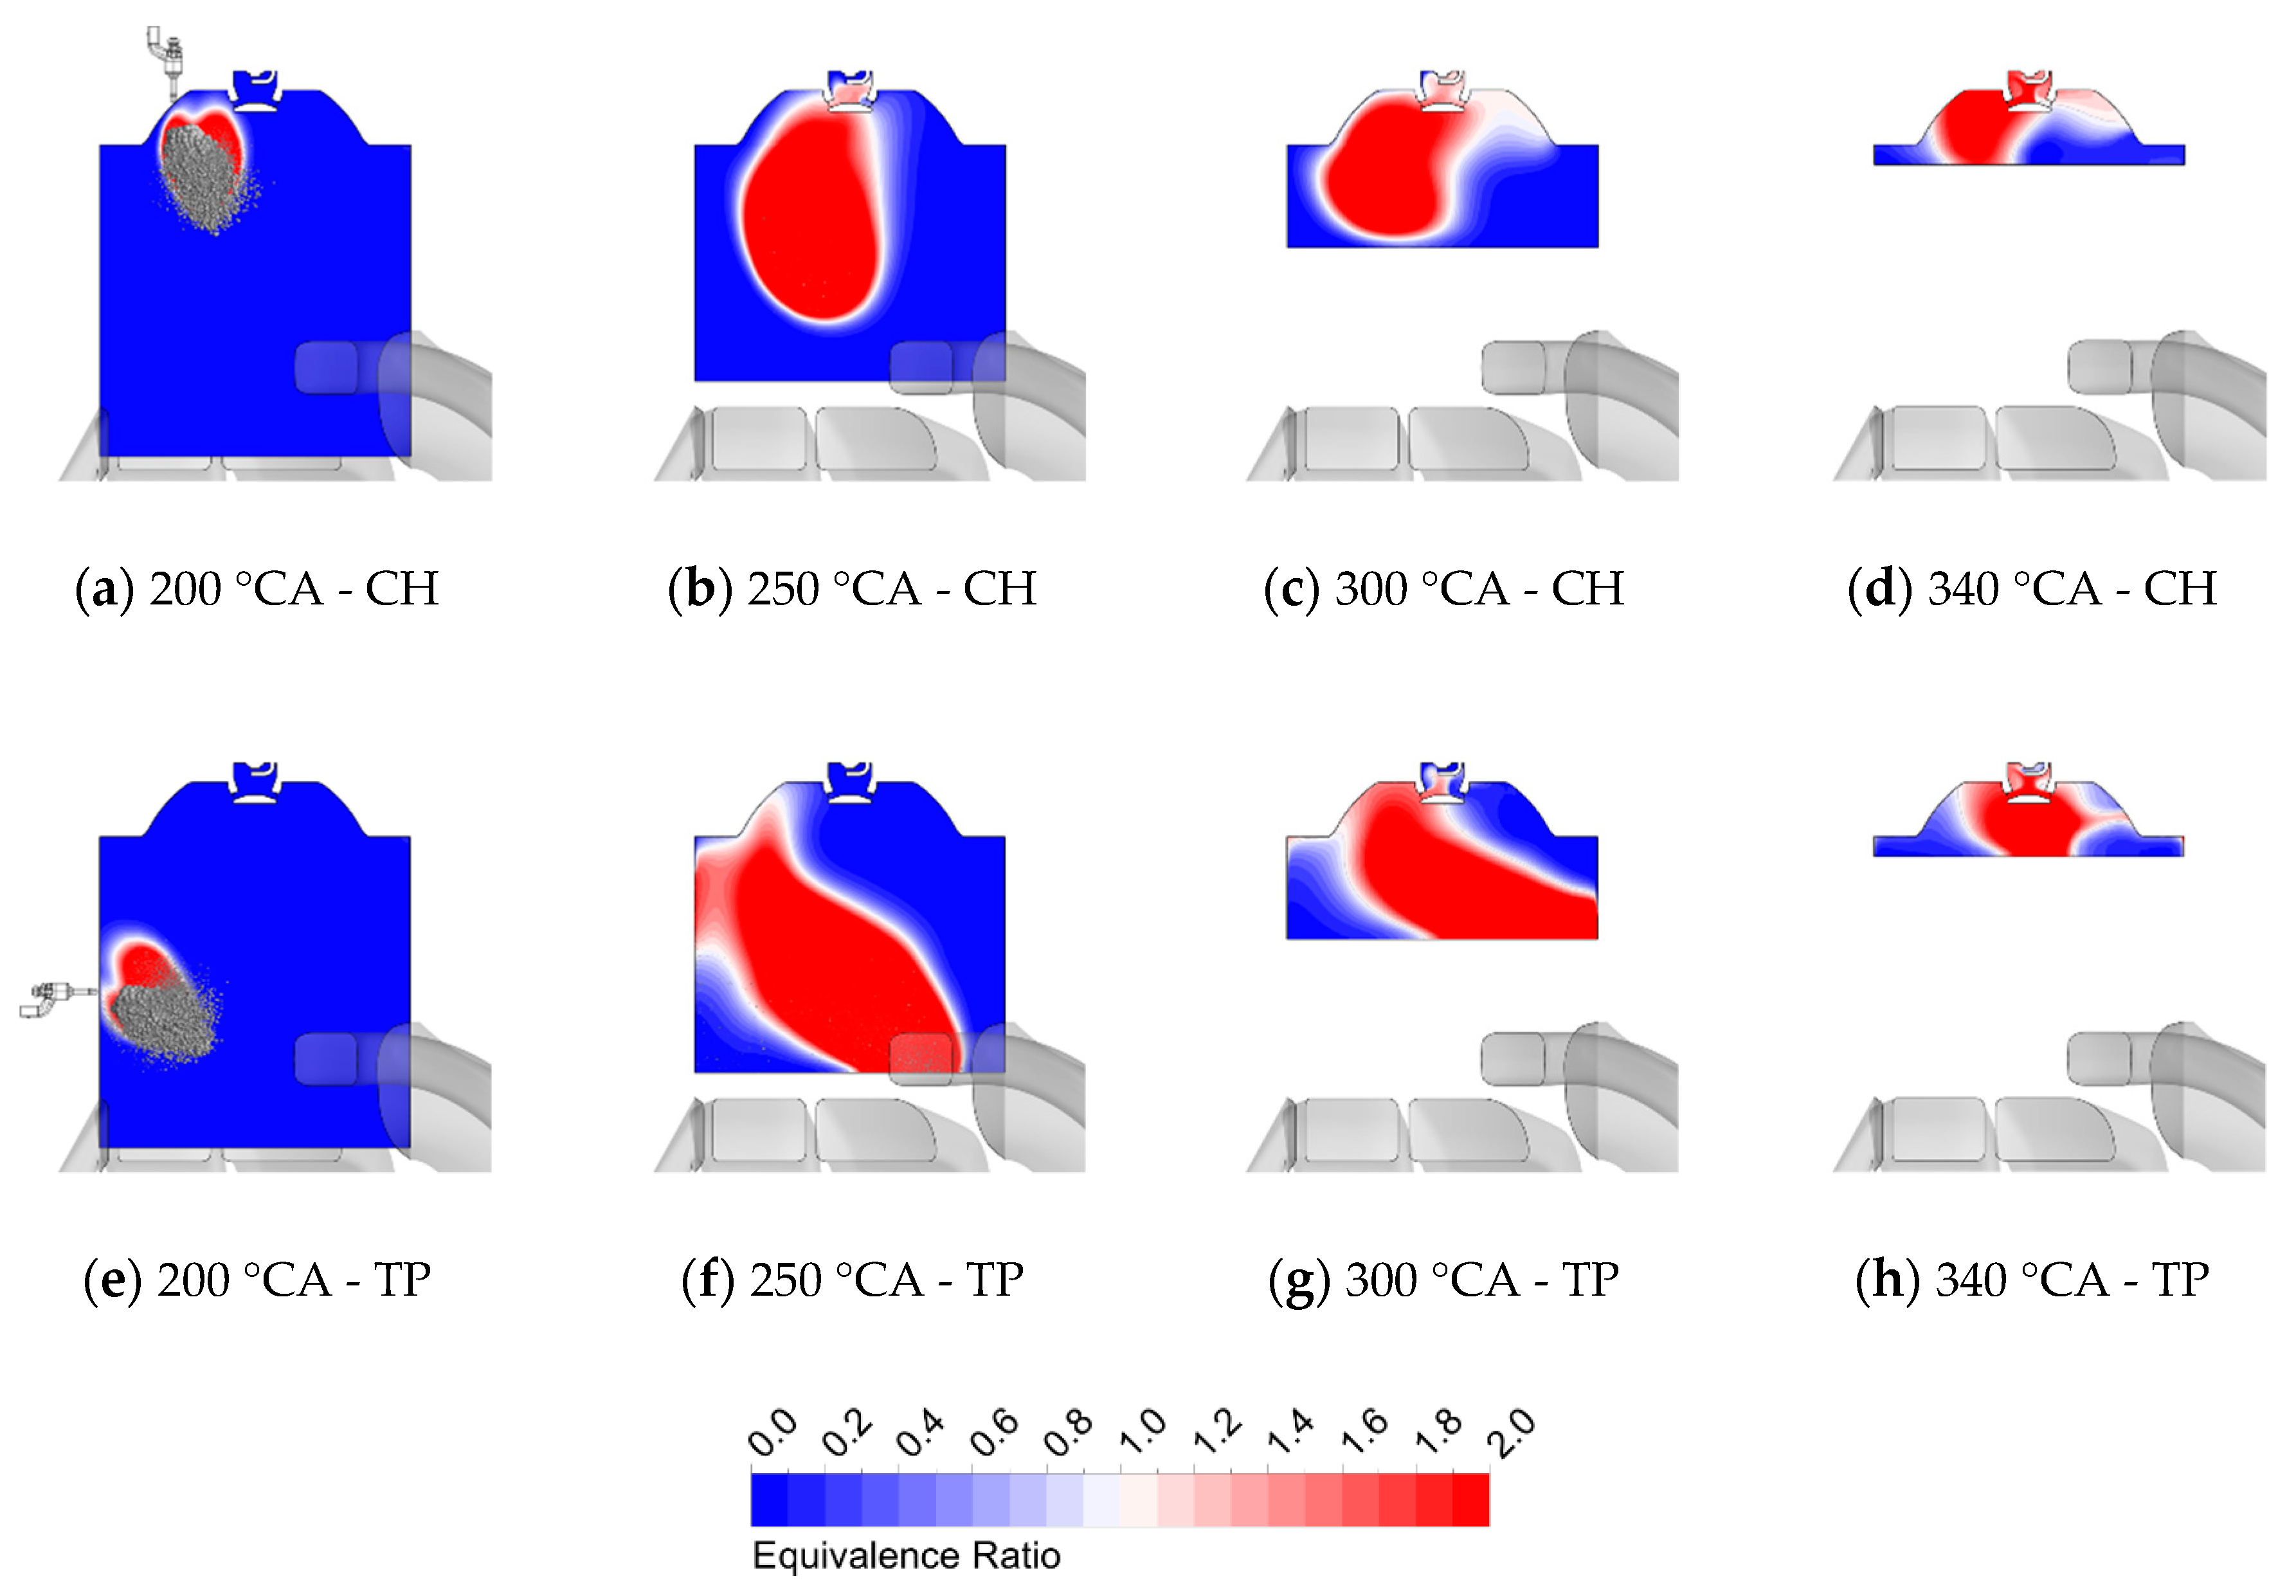
For both simulated injection strategies at 7500 rpm and full load, the fuel spray is not able to follow the direction imposed by the injector angle and to penetrate the high-momentum flow inside the cylinder. The droplets are driven by the tumble vortex towards the head of the cylinder and inside the prechamber (Figure 15b,f). However, most of the fuel inside the prechamber is pushed out from the rotating action of the tumble vortex generated during the compression phase (Figure 15c,g). The fuel vapor impinges on the piston wall and generates a stratified mixture. Using the CH injection strategy, the prechamber has a low quantity of fuel, and the in-cylinder homogenization is poor. A great amount of fuel is distributed above the piston (Figure 15d). Using the TP injection strategy, the fuel vapor reaches the prechamber with a delay with respect to the CH case, because the liquid is injected closer to the transfer ports. Thus, the fuel vapor remains trapped in the upper part of the cylinder head on the transfer side and into the prechamber (Figure 15h), with a more uniform distribution.
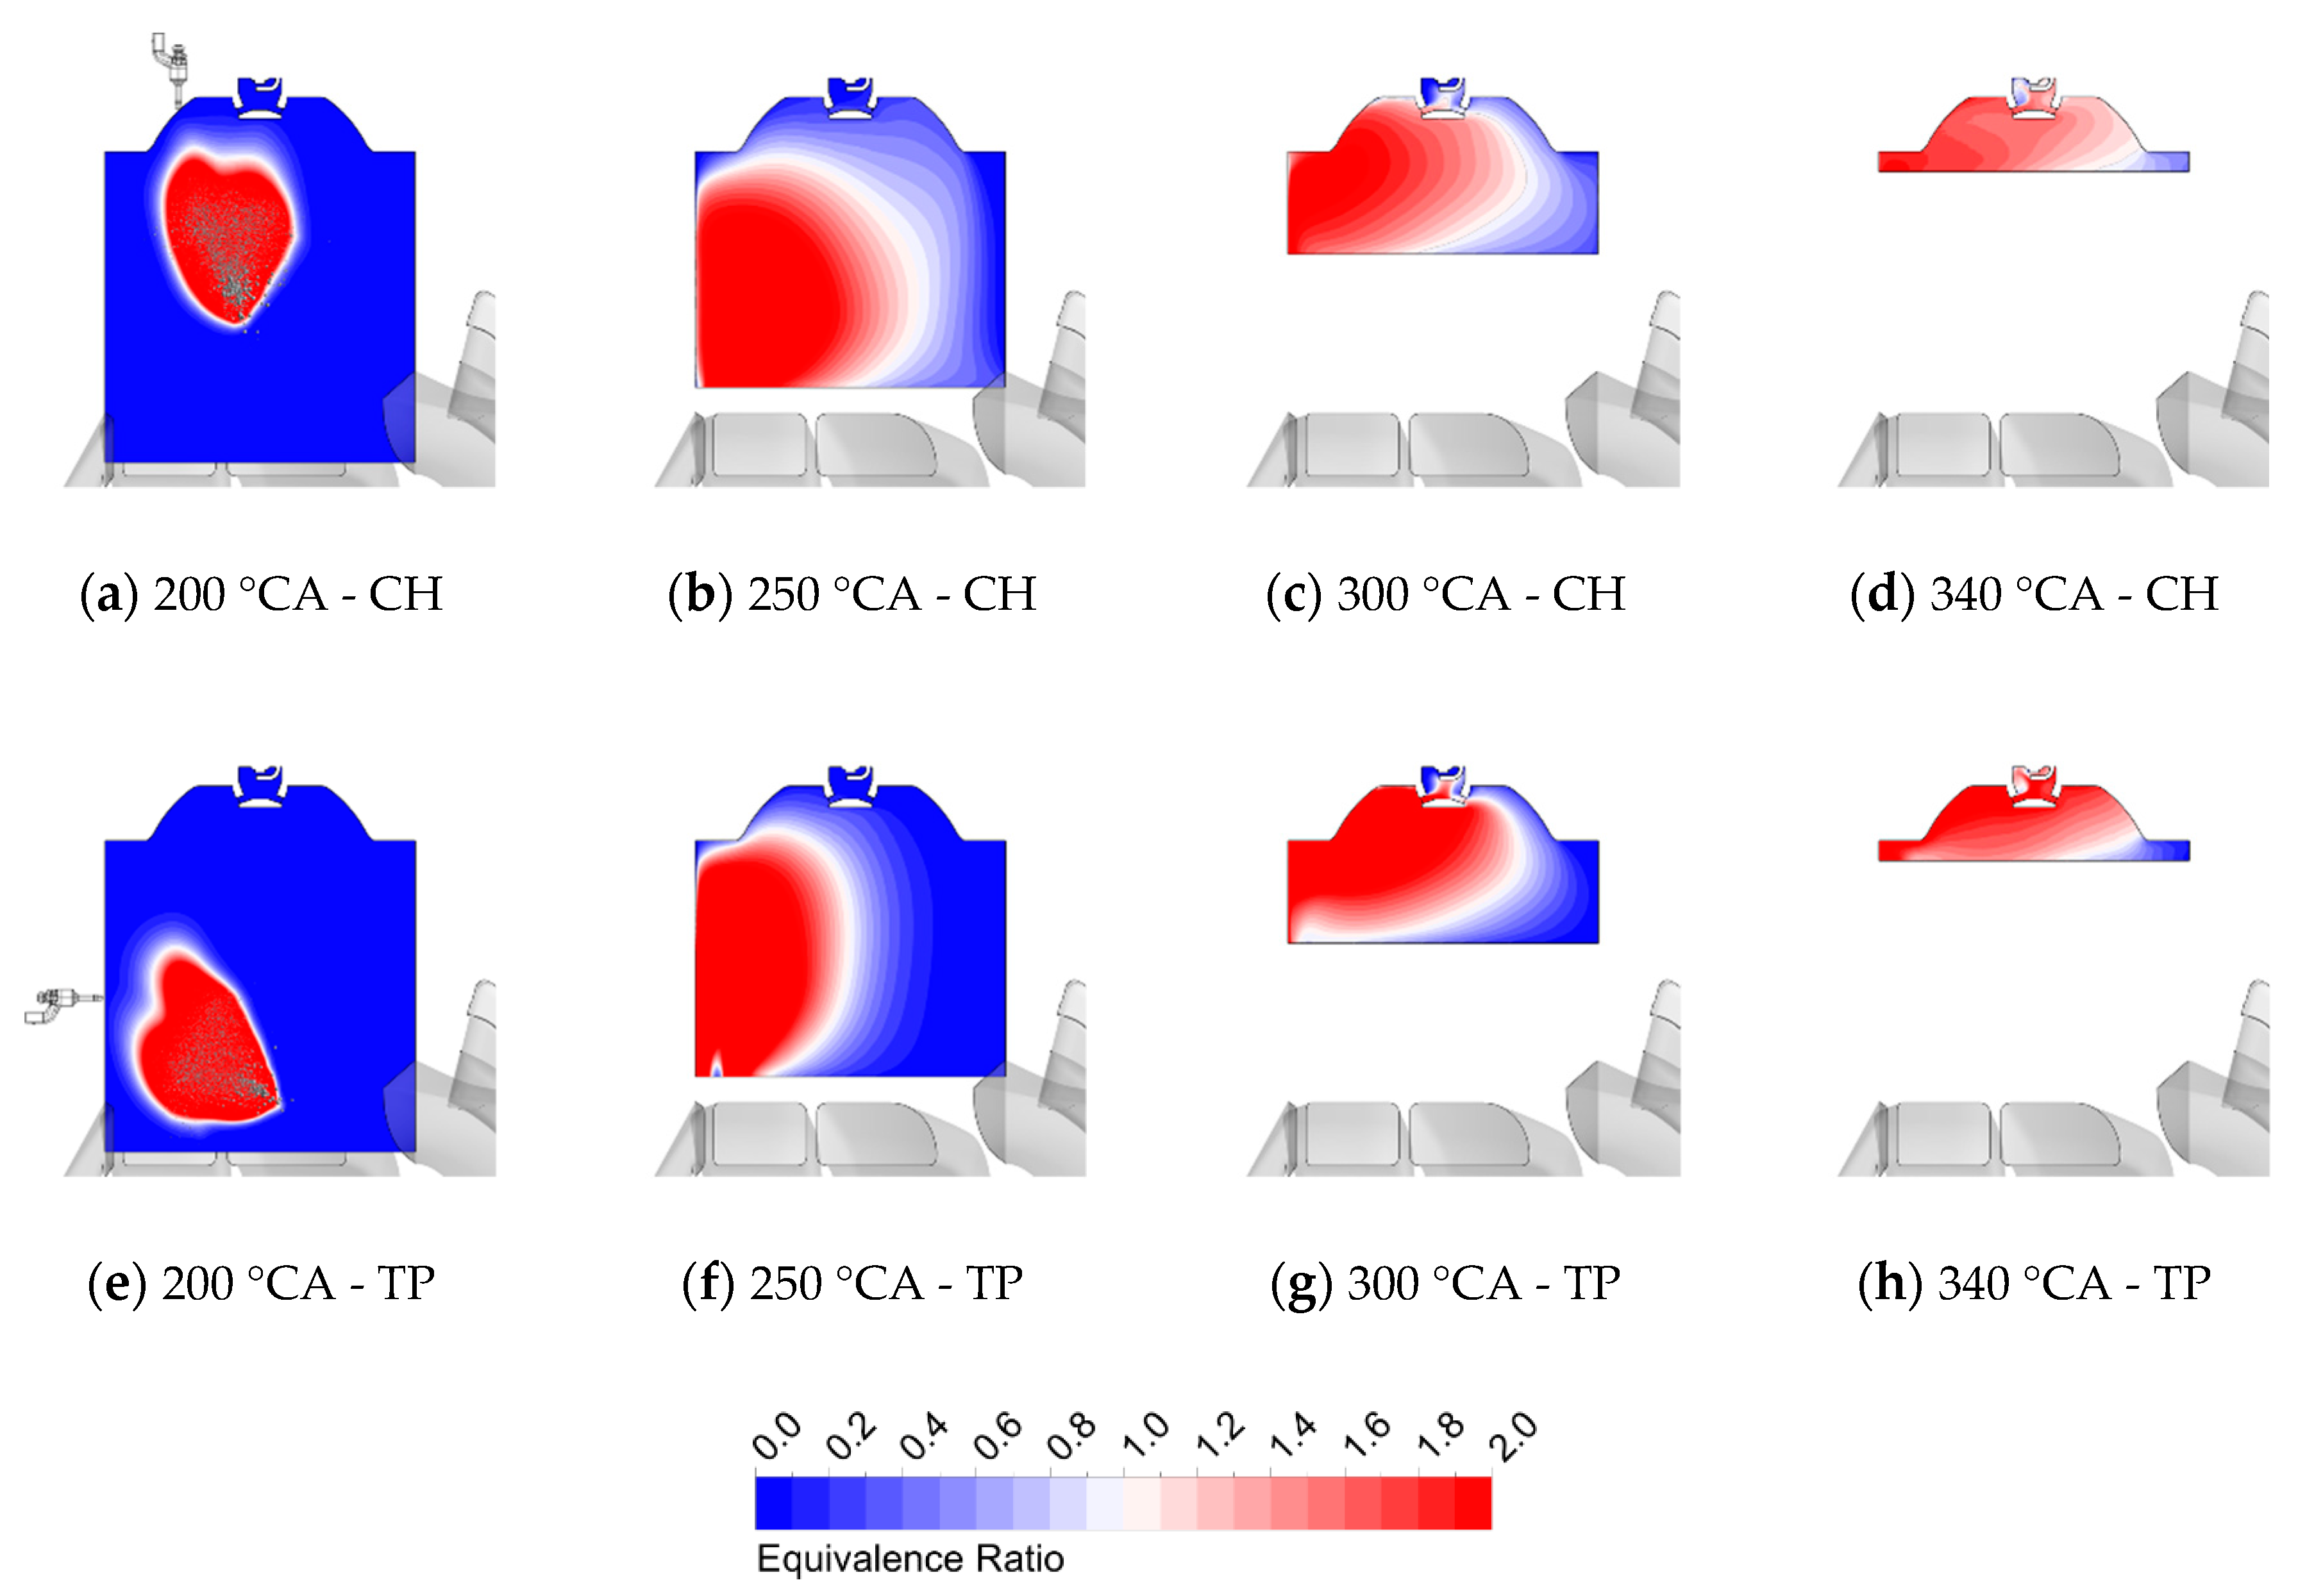
Figure 16 reports the spray behavior at 7500 rpm and 30% of the throttle valve opening with the PN6 prechamber for both injection strategies. The weak tumble vortex is not able to drag the fuel spray and to spread the fuel vapor all over the cylinder volume. The droplets penetrate the in-cylinder flow (Figure 16a,e) and follow the direction towards the center of the cylinder. The concentration of fuel vapor remains localized and is then pushed into the prechamber due to the piston motion toward the TDC (Figure 16c,g). For both injection strategies, the lack of a strong flow field inside the cylinder results in a non-homogenous mixture formation (Figure 16d,h), even if the fuel distribution in case of the TP injection seems to be better distributed (Figure 16h).
In Figure 17, the results of spray behavior for PN6 prechamber at 2500 rpm, and 10% of the throttle valve opening for both injection strategies are presented. The injected fuel mass is the lowest and the injection phase lasts only 5 °CA. Therefore, at 200 °CA the fuel injection is already finished, and the fuel atomization is almost complete. With both injection strategies, the fuel spray penetrates the in-cylinder flow during the first part of the scavenge (Figure 17a,e). When the vaporization is complete, the fuel vapor is pushed back towards the transfer side of the cylinder due to the exhaust backflow (Figure 17b,f). It is worth noting that using the CH injection, the spray results more spread because the liquid is injected in counterflow with respect to the in-cylinder air coming from the transfer ports. During the compression phase, the fuel vapor is spread by the tumble vortex; it fills the prechamber (Figure 17c,g). The weak charge motion is not able to generate an adequate mixing, resulting in fuel-rich regions for both the cylinder and the prechamber (Figure 17d,h).
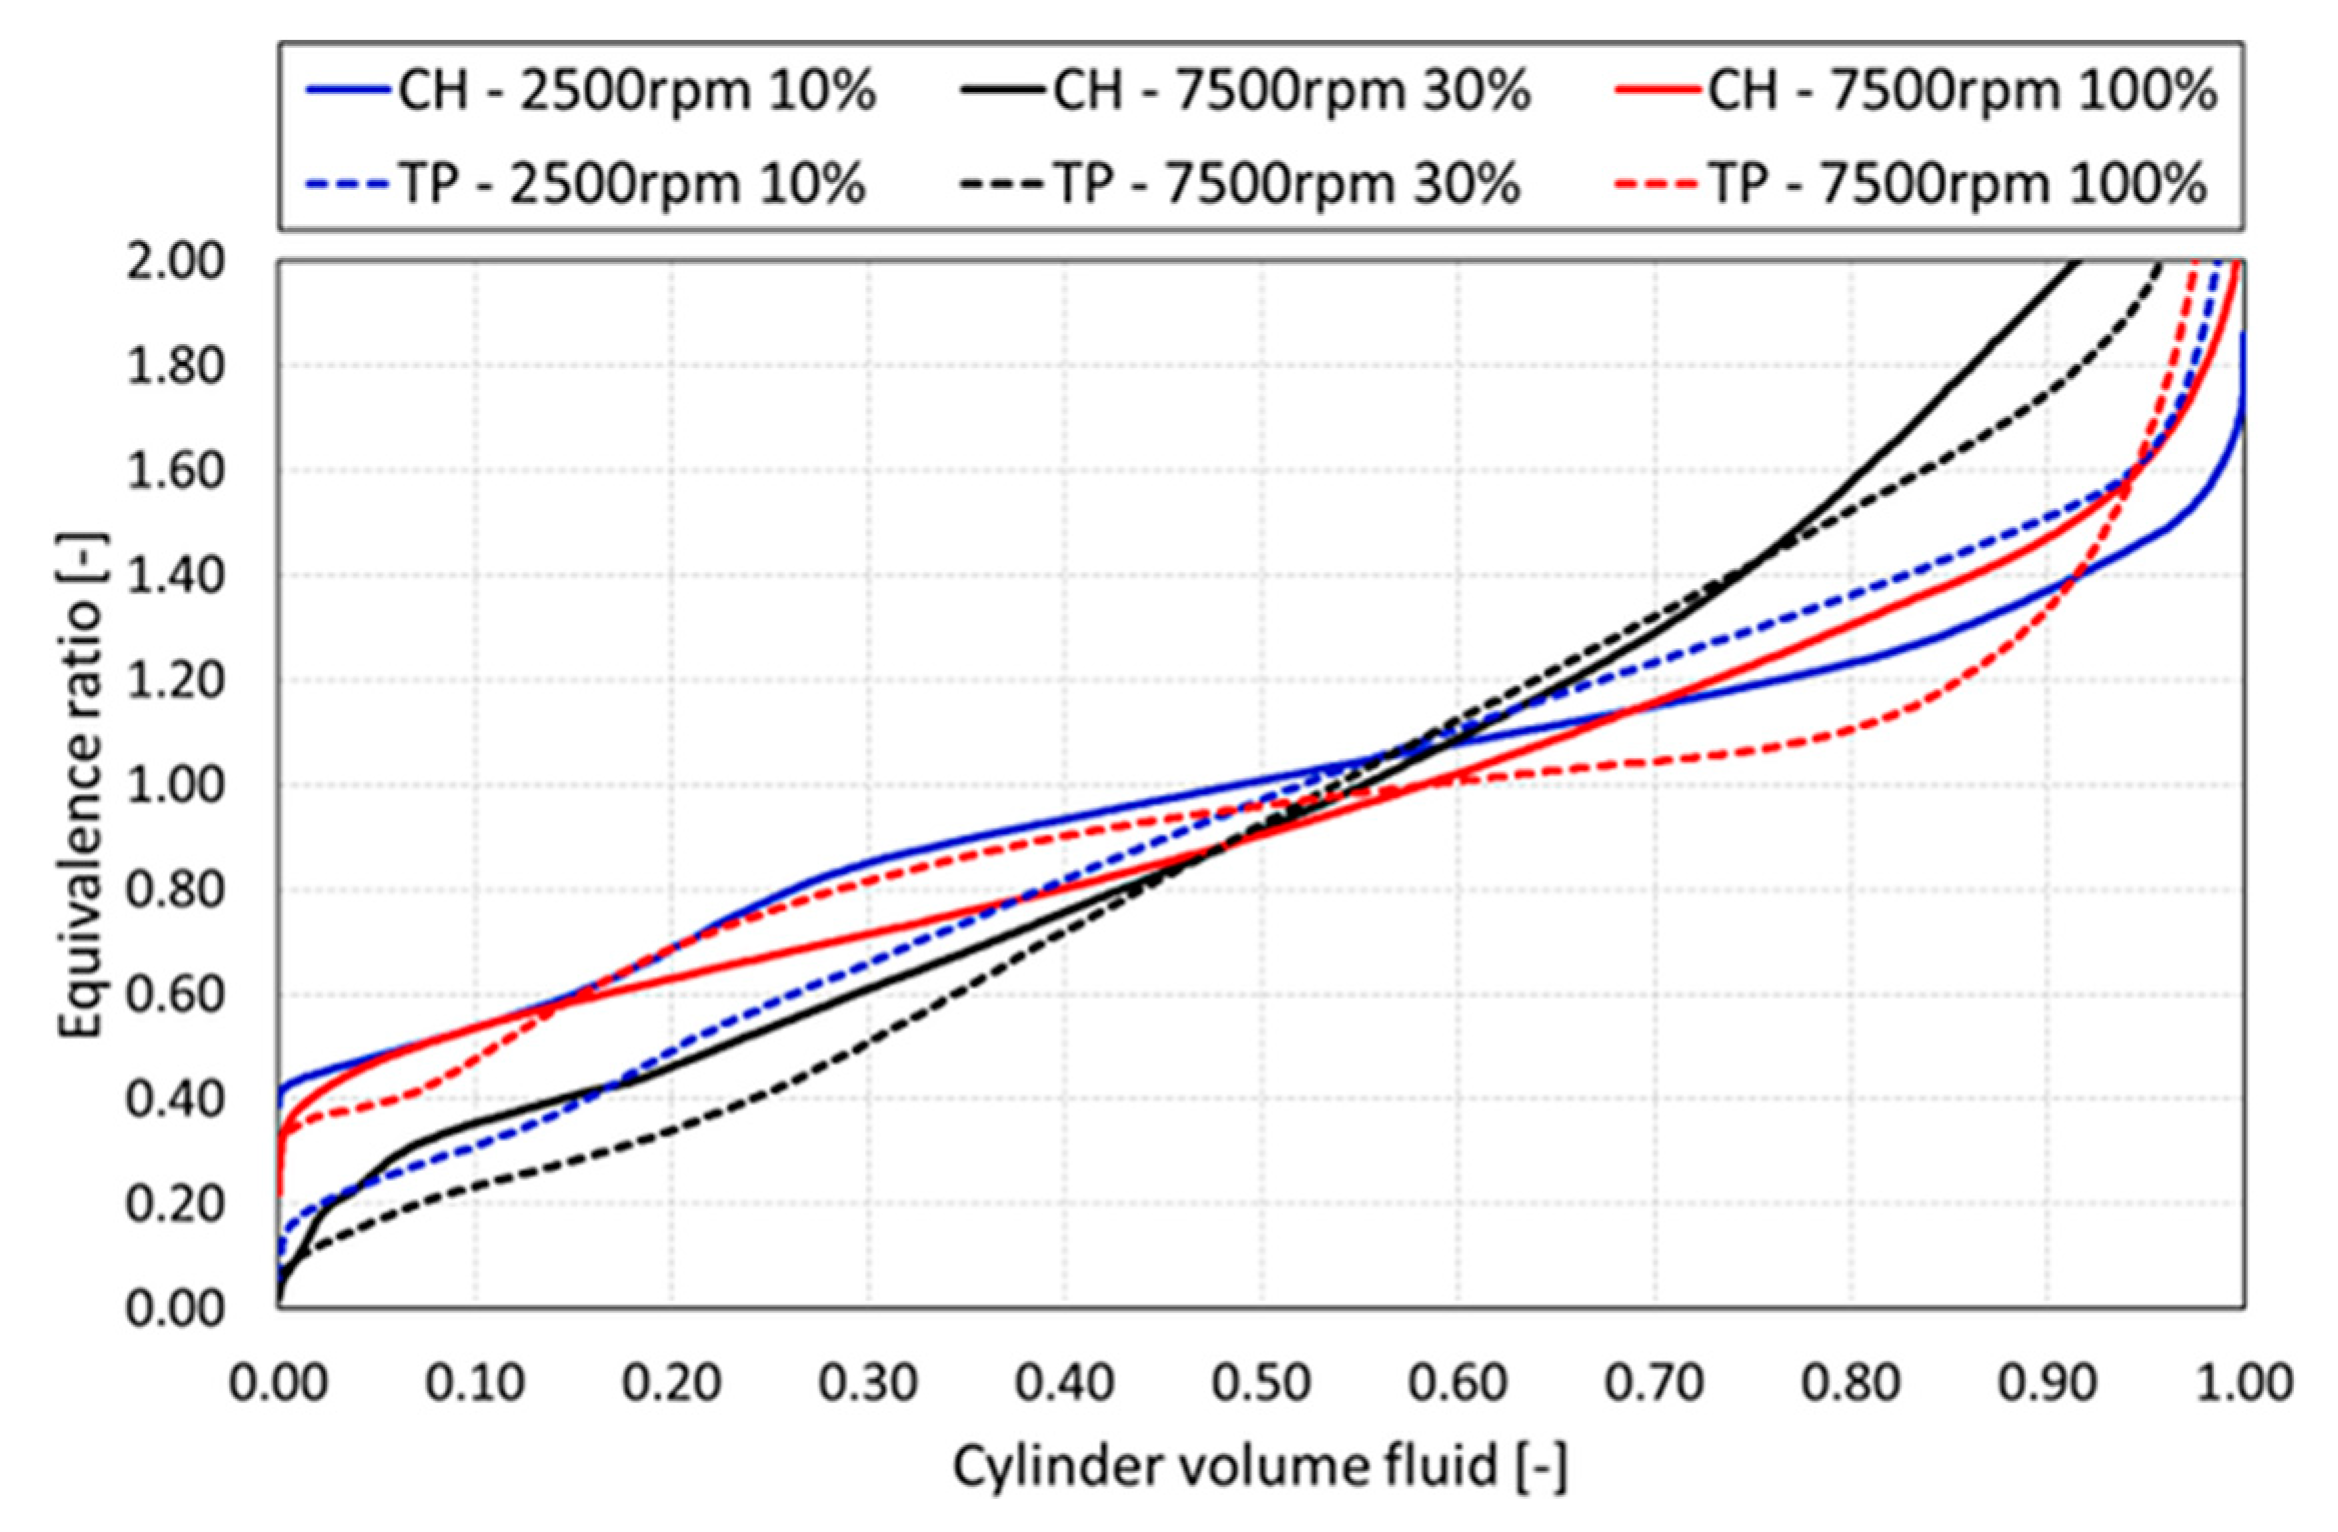
Figure 18 reports the fuel homogenization in the main chamber at TDC for both injection strategies. In all the three engine operating conditions simulated, the homogenization inside the cylinder is not strongly affected by the injection strategy, since they show similar trends. Nevertheless, some differences can be found. The mixture is more uniform at maximum power conditions, since the charge motions are the strongest and the air–fuel mixing is enhanced. Reducing the engine load and the engine speed causes a reduction of in-cylinder air flow and a mistuning of pressure waves, which lead to a worst fuel diffusion and a less homogenous mixture.
As a final analysis of the global spray behavior, the fuel short circuit was also quantified for all of the simulated cases. Figure 19 reports the fuel short circuit using both prechambers in both injection strategies as a function of the engine operating point. In general, the results are very similar for the two prechamber geometries, while they are strongly dependent on the injection location and the working condition. For the engine conditions that are characterized by the presence of a well-structured clockwise tumble motion (i.e., 7500 rpm—100% and 2500 rpm—10%), the fuel short circuit is greater using the CH injection strategy because the fuel is more easily driven towards the exhaust port, while the short circuit is almost absent with the TP injection. An opposite result is achieved for the 7500 rpm—30% case, since the spray penetrates the in-cylinder flow towards the exhaust ports using the TP injection strategy, leading to a 4% loss of fresh fuel.
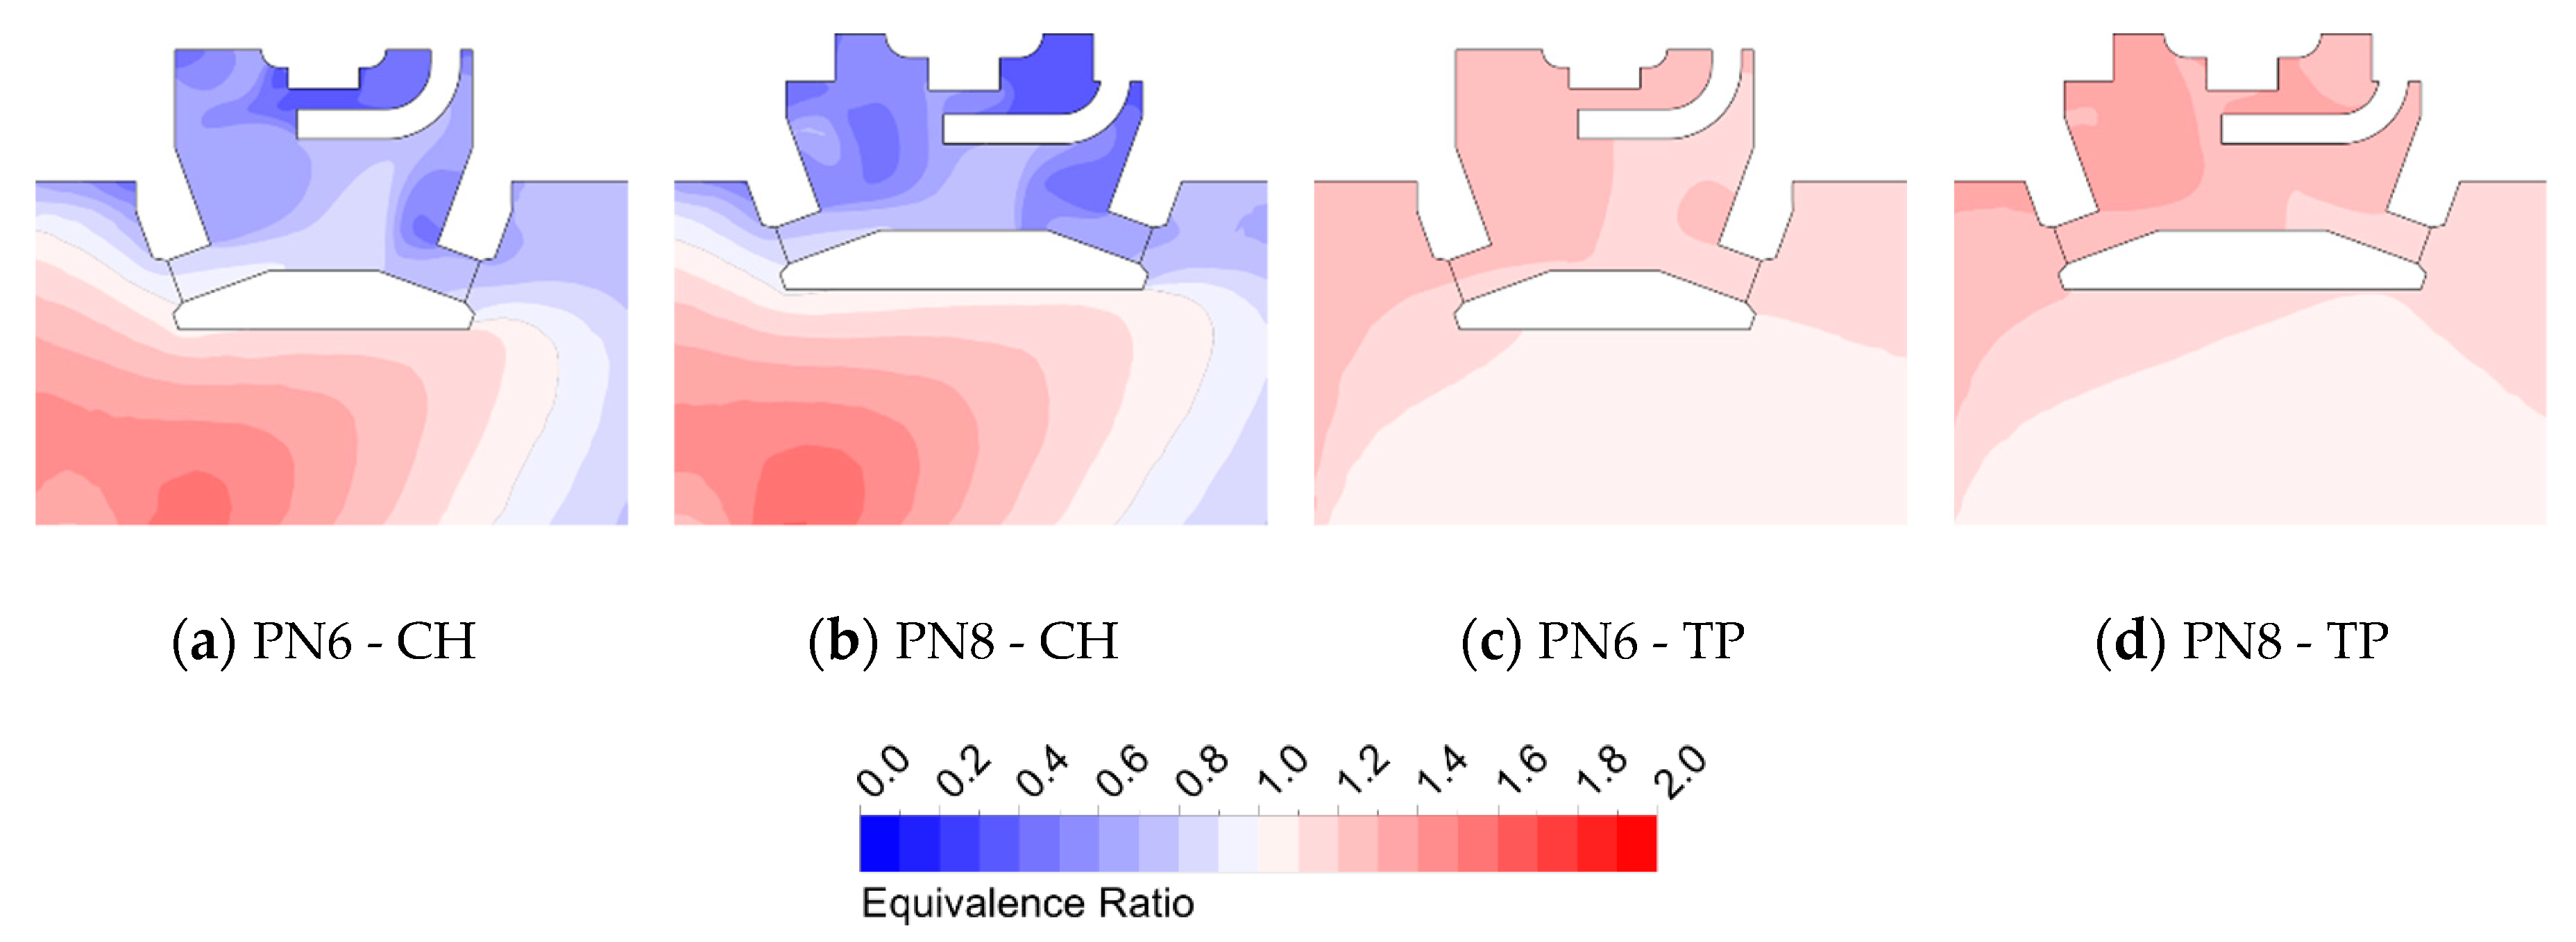
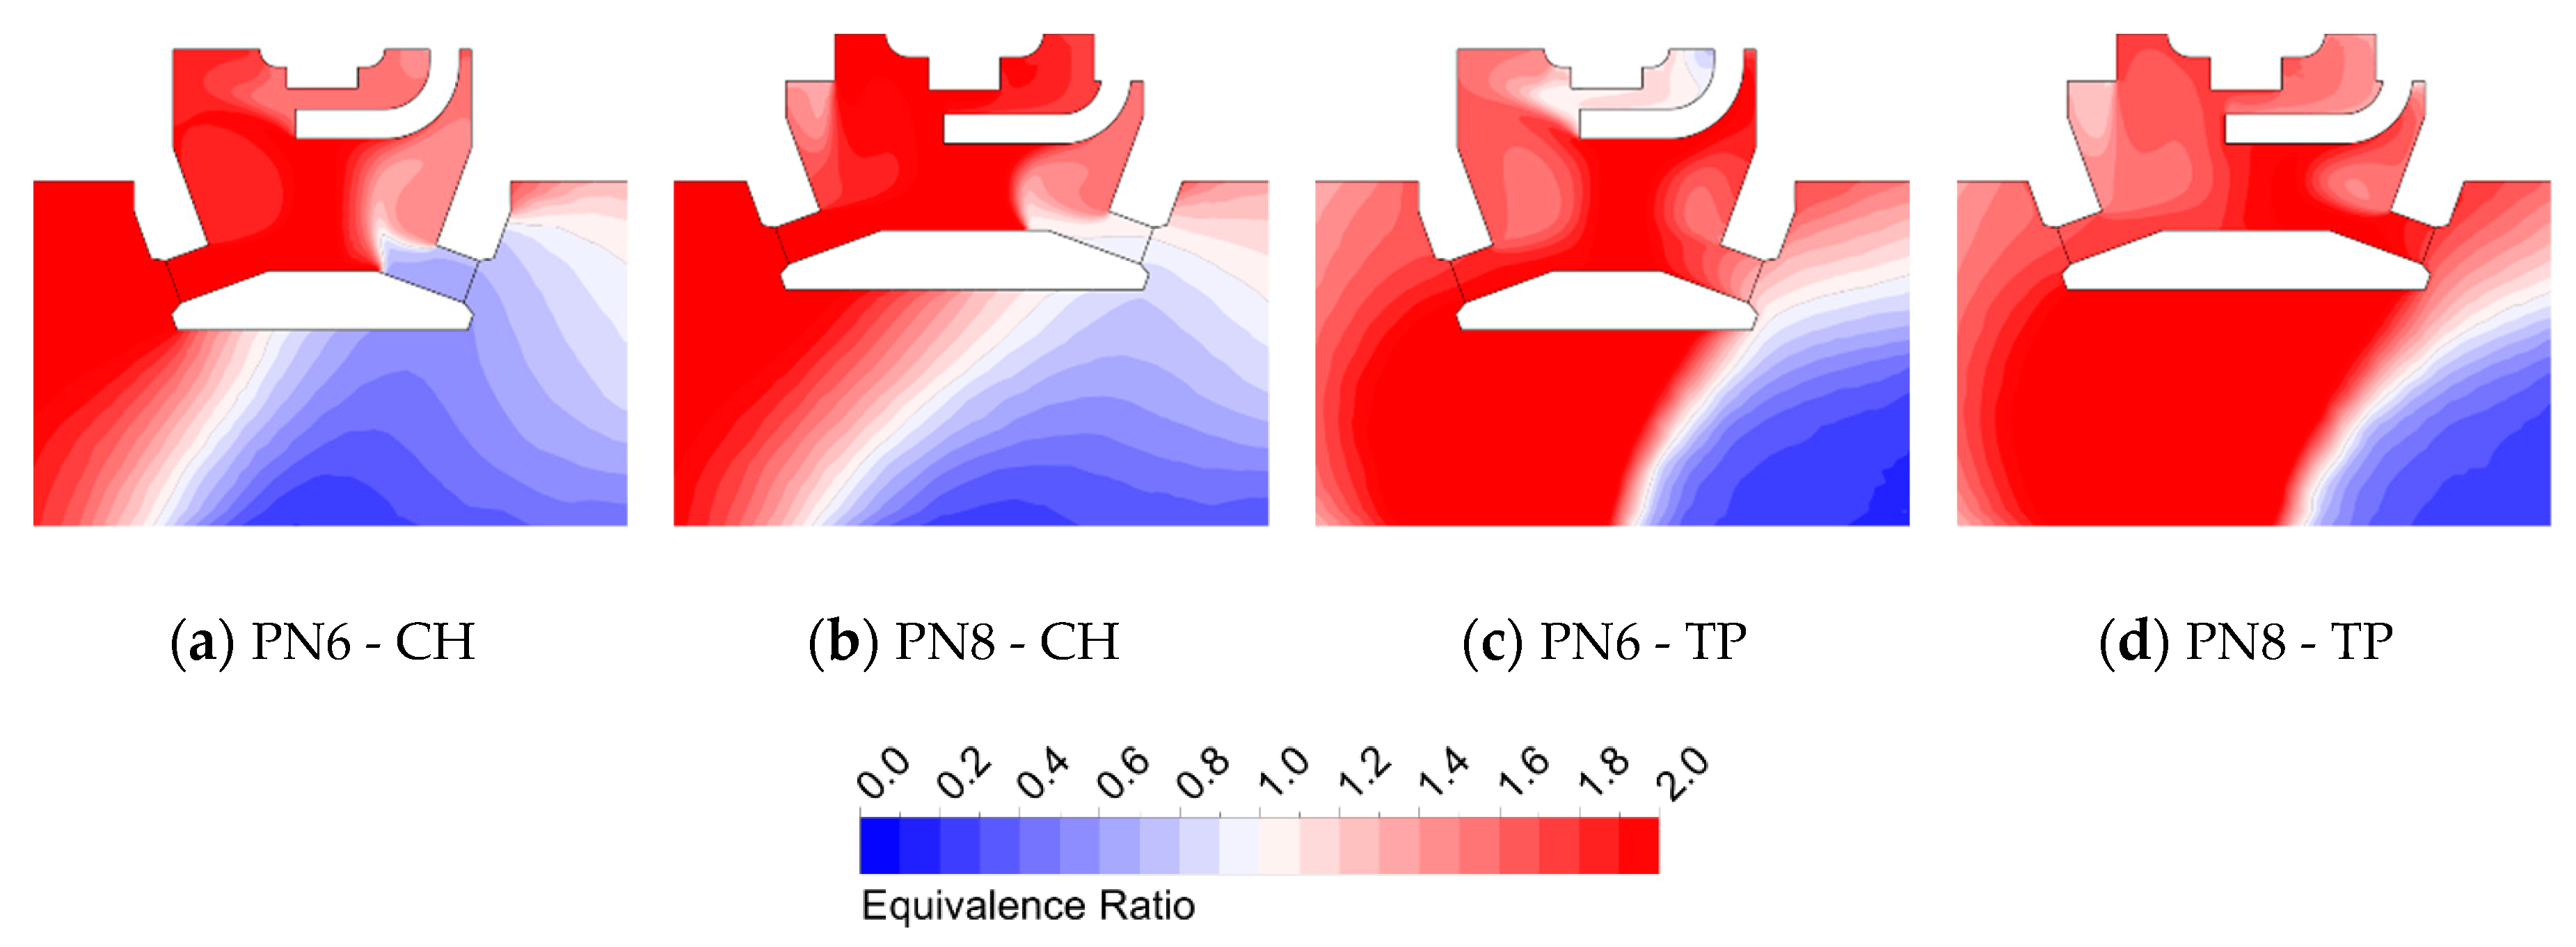
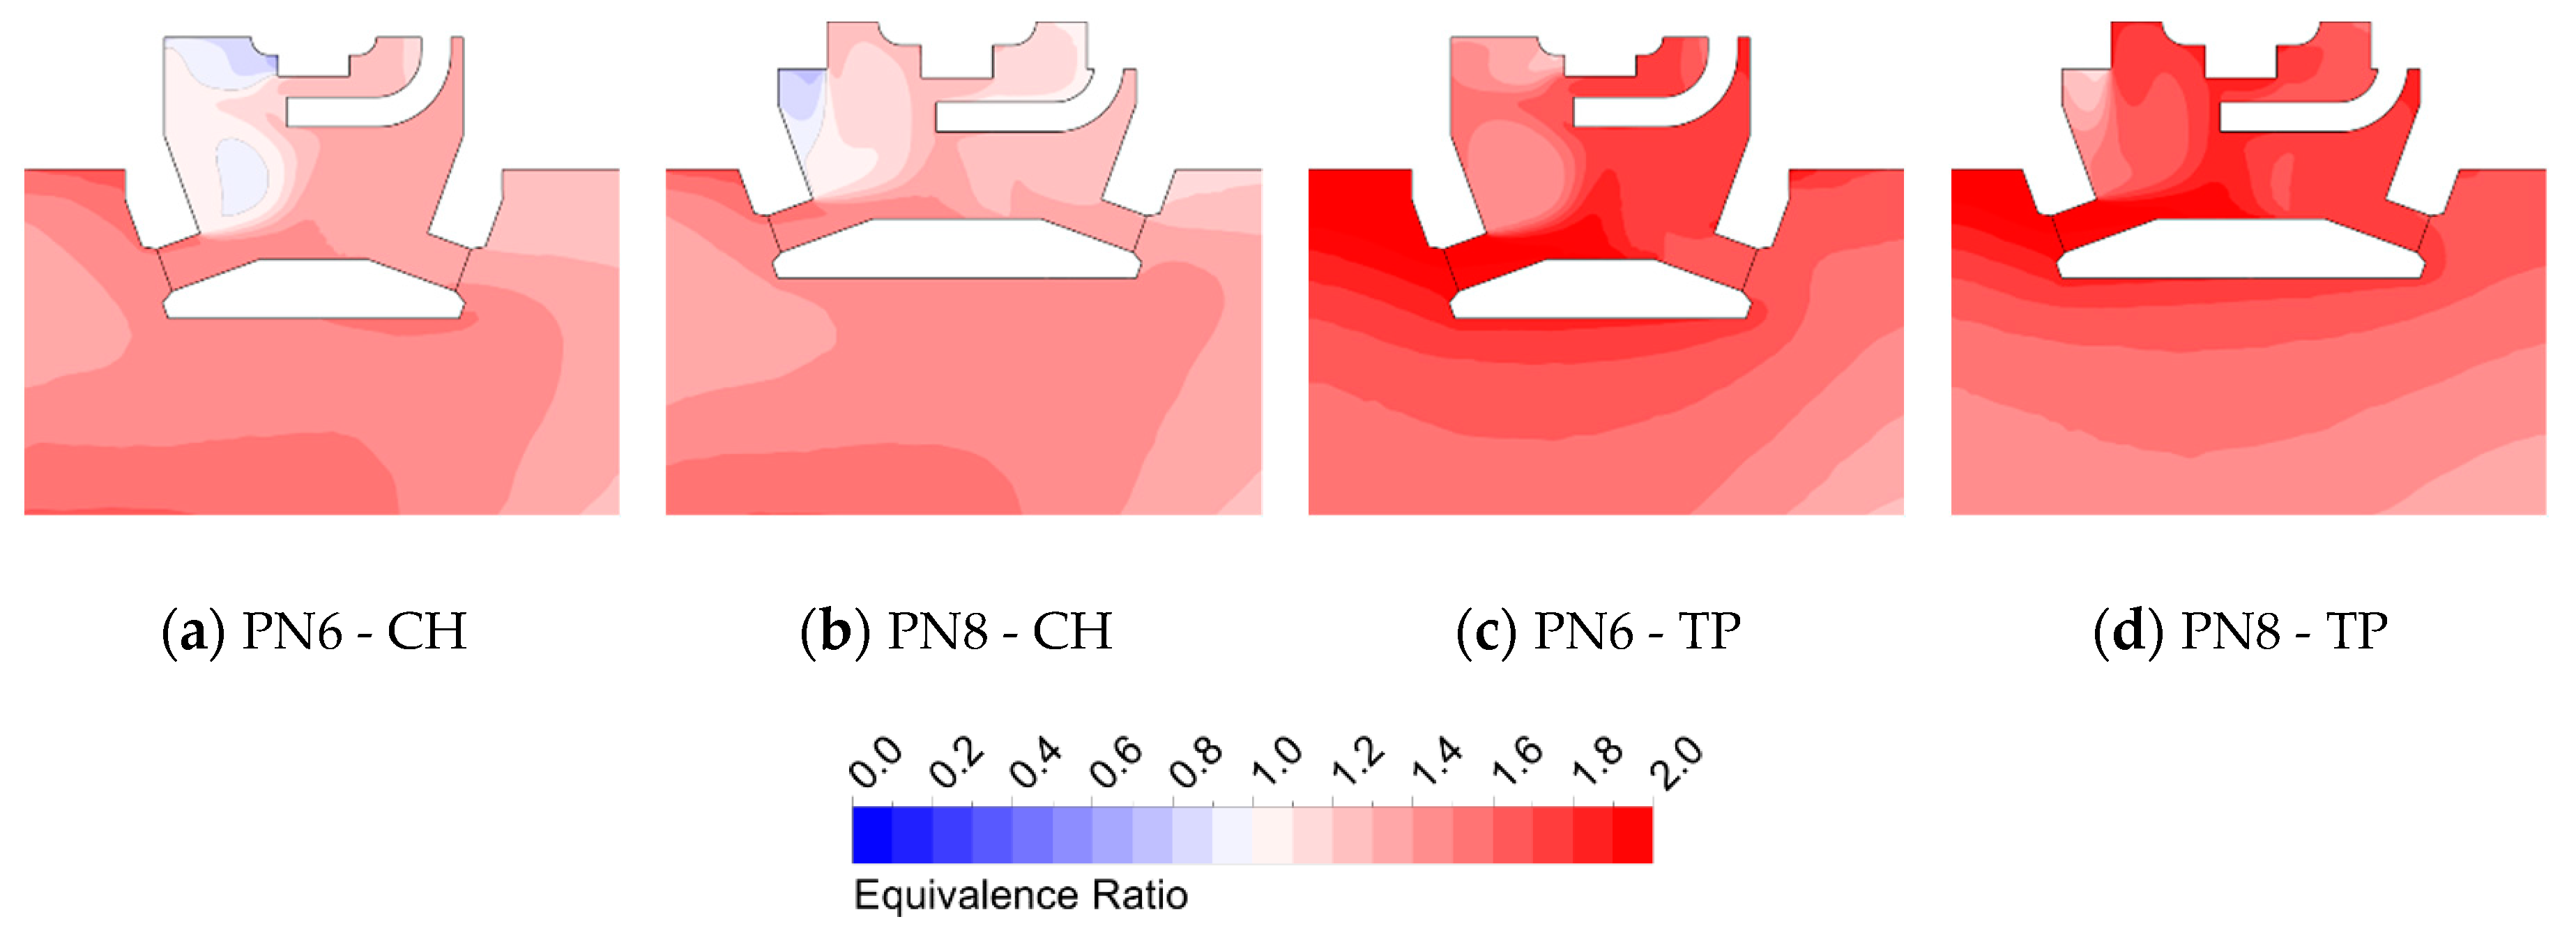
Focusing the attention on the mixture condition in the prechamber volume around the TDC position, Figure 20, Figure 21 and Figure 22 report the comparison of equivalence ratio contours inside the two prechambers for the three selected engine operating conditions. The goal is to evaluate the influence of both the geometrical features of the prechamber and the injection strategy on the fuel filling capability and on the air-fuel mixing occurring inside the prechamber volume. Starting with the case at 7500 rpm and full load (Figure 20), it can be observed that the CH injection strategy is not able to guarantee a suitable fuel trapping inside the prechamber, and a poor fuel mixture is formed (Figure 20a,b). Conversely, the TP injection strategy allows one to obtain a uniform mixture close to the stoichiometric conditions for both prechambers (Figure 20c,d).
The results for the case at 7500 rpm and 30% of the throttle valve opening are shown in Figure 21. In all of the simulated cases, the coupled effect of the injection strategy and the in-cylinder flow field is not able to generate an adequate mixing between fuel and air, resulting in a very rich condition of the mixture trapped in the prechambers.
Finally, Figure 22 reports the equivalence ratio contours at 2500 rpm and 10% of the throttle valve opening. Despite the weak charge motion inside the cylinder, an air–fuel mixture near to the stoichiometric value is formed in the prechamber using the CH injection strategy (Figure 22a,b). Conversely, a rich mixture is obtained with the TP injection strategy (Figure 22c,d). In fact, injecting the fuel against the rising scavenging current enhances the diffusion of the liquid droplets, thus resulting in a greater mixing between fuel and air.
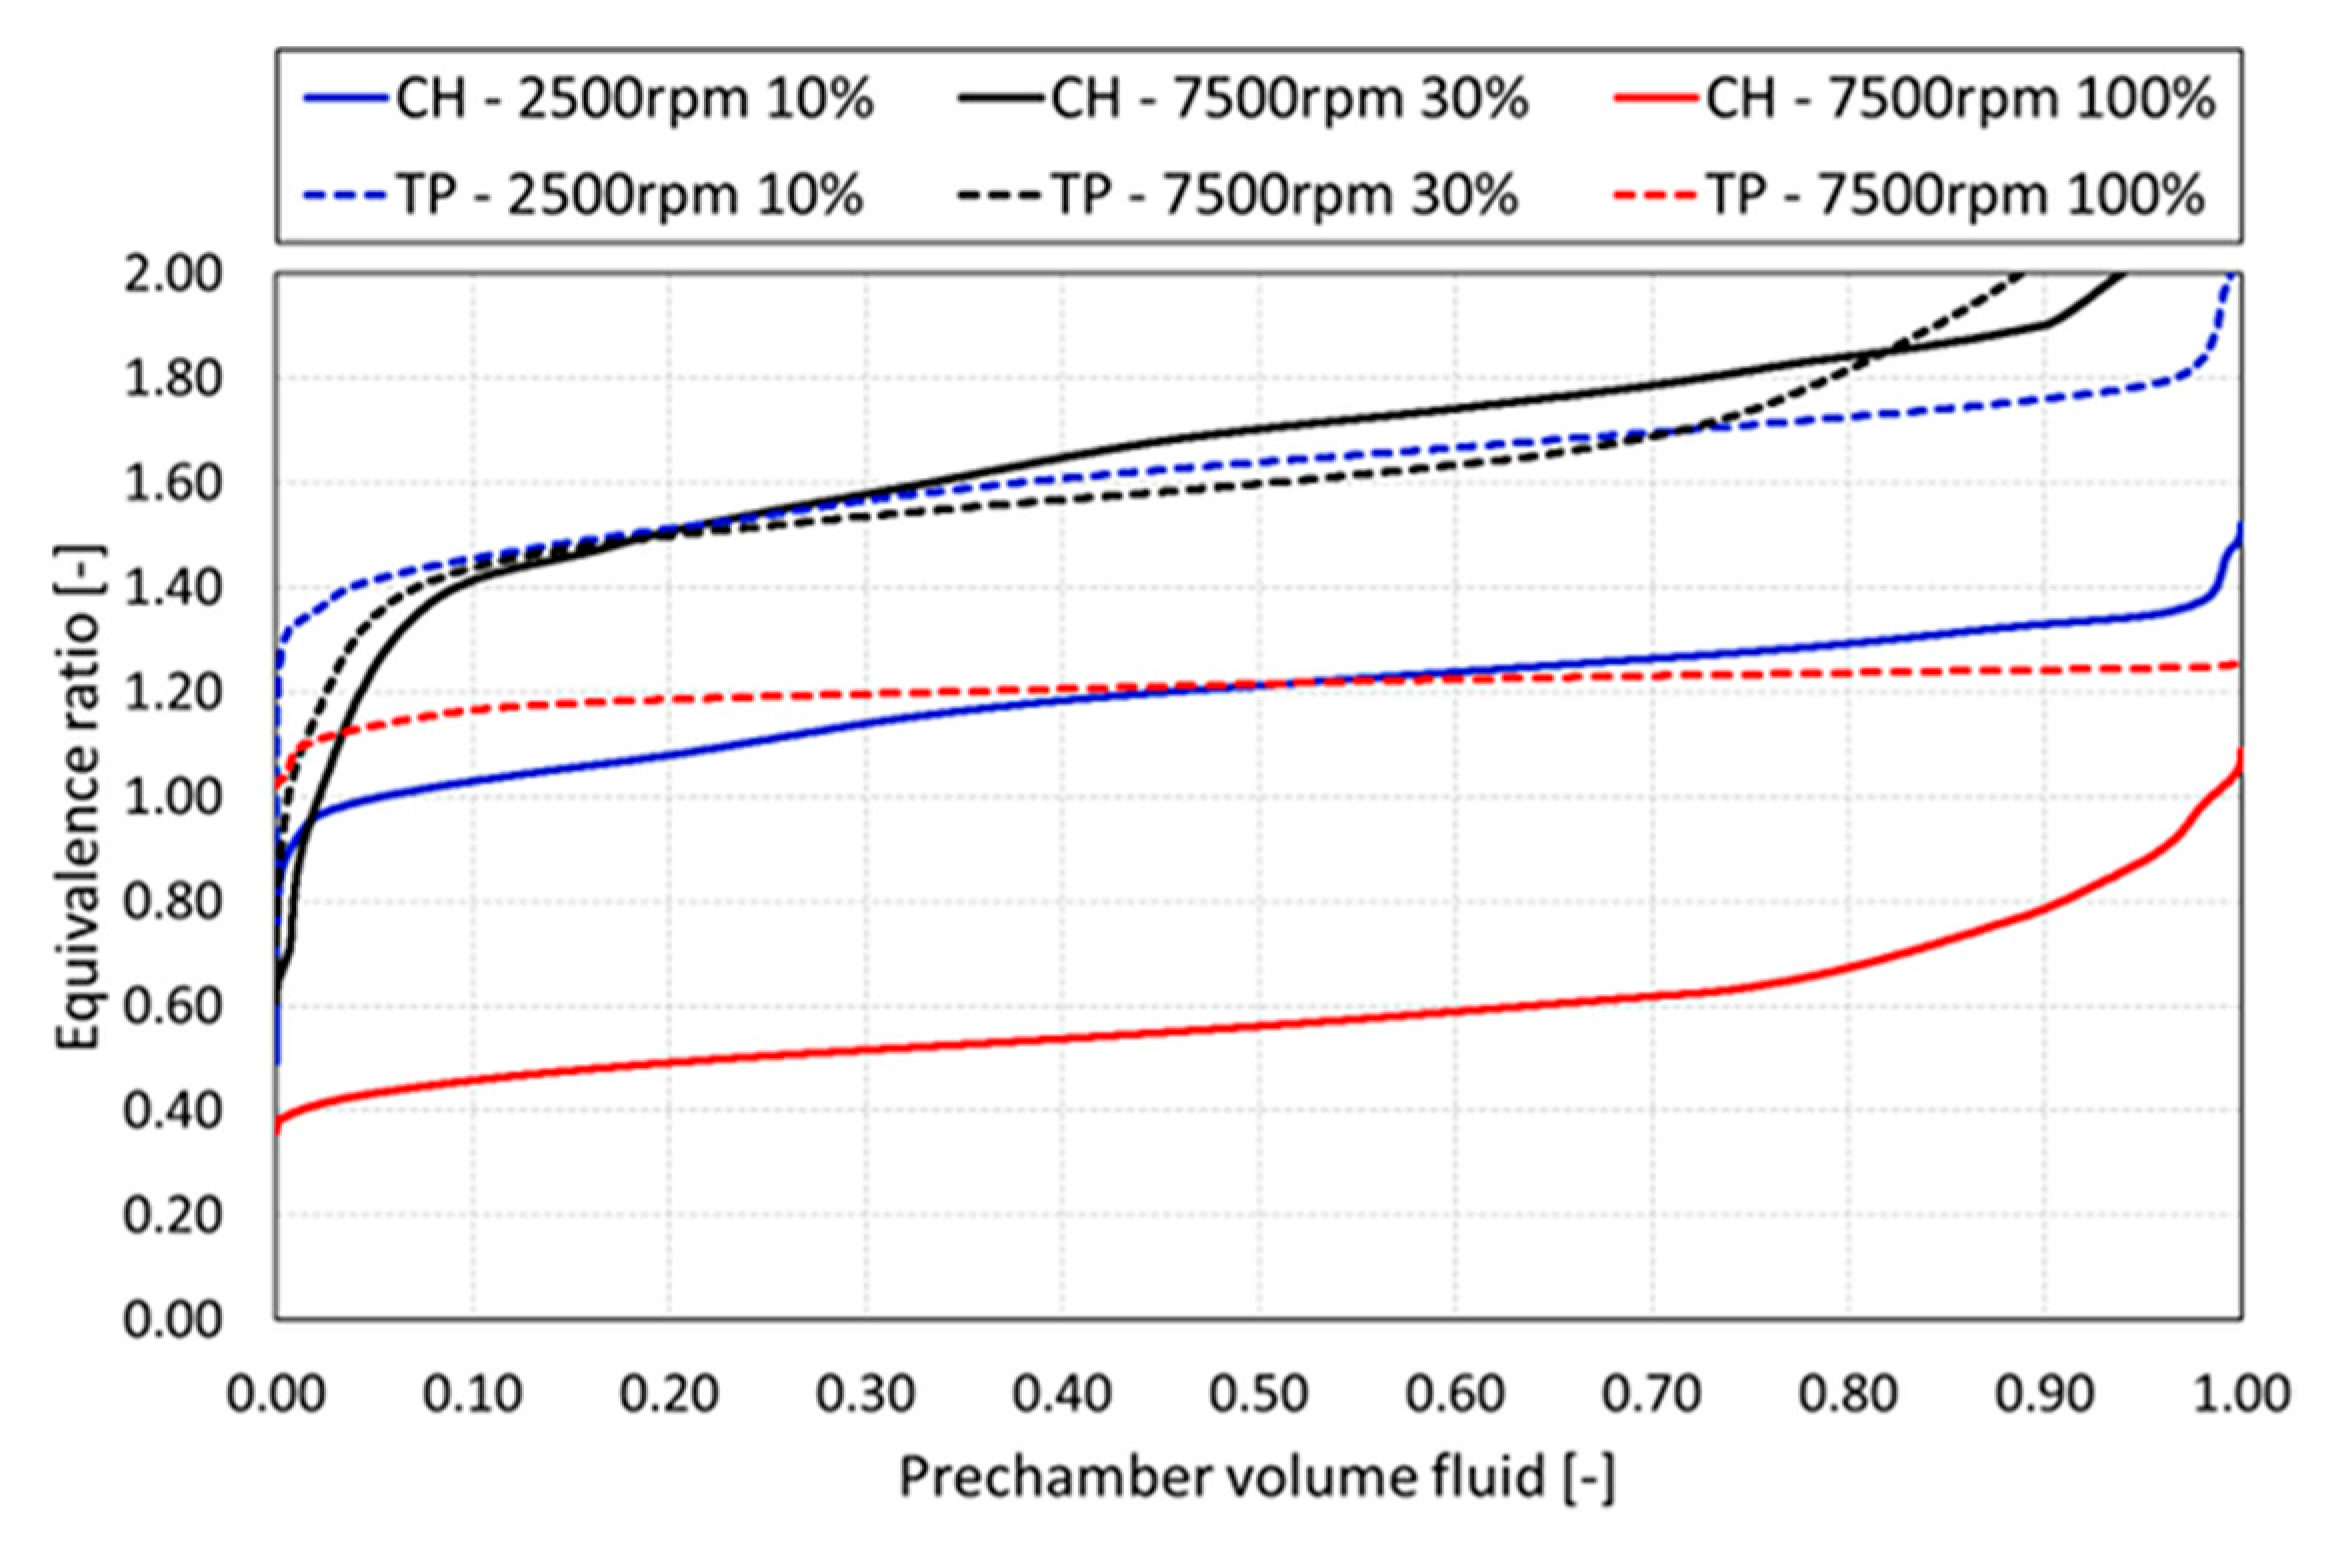
Analogous to the analysis of the mixture condition inside the main chamber, the overall homogenization was also quantified for the prechamber volumes. Starting from the PN6 prechamber, Figure 23 reports the equivalence ratio trends as a function of the prechamber volume for both injection strategies and for all the engine operating points. It is worth noting that using the TP injection allows obtaining a more homogeneous mixture inside the prechamber, especially at 7500 rpm and full load, and a higher equivalence ratio, which is favorable in view of the ignition process.
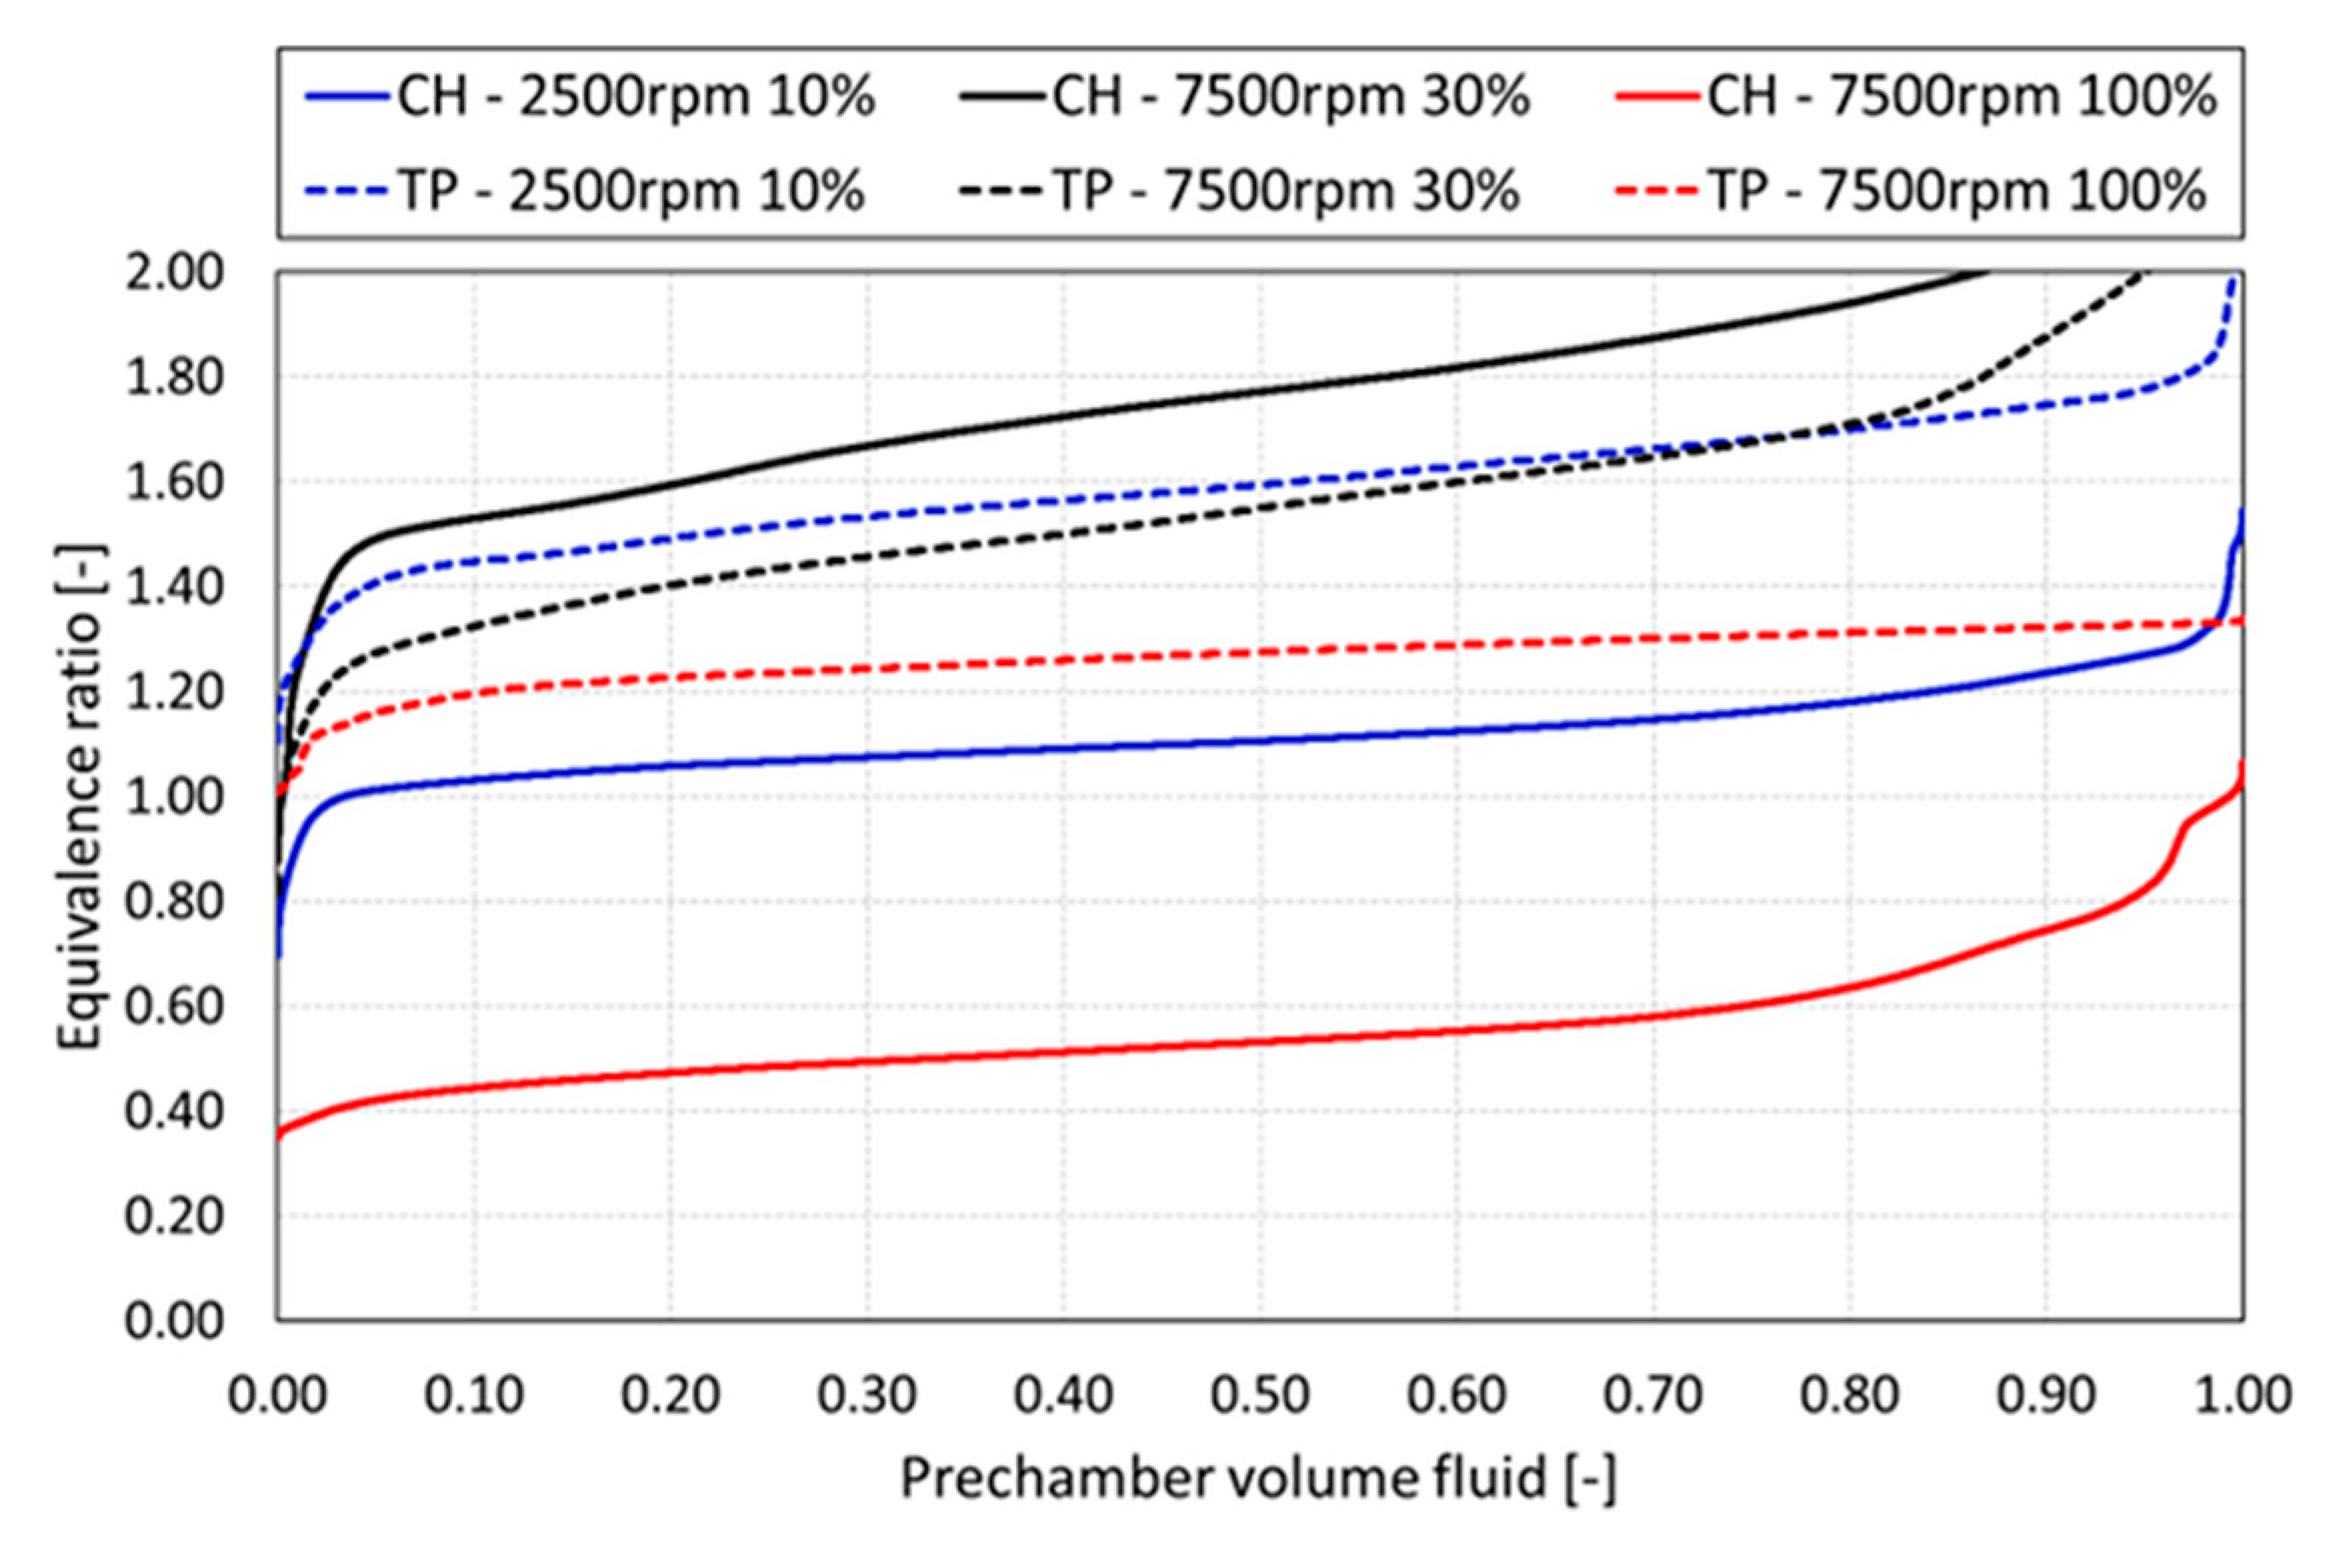
Figure 24 reports the results of the fuel homogenization for the PN8 prechamber. As already seen for prechamber PN6, using the TP injection leads to a more homogeneous mixture, due to the high level of mixing between fuel and air inside the cylinder. This behavior is beneficial for reducing the cycle-to-cycle variation. Furthermore, the average value of the equivalence ratio inside the prechamber is between 1.1 and 1.3 for all the engine operating conditions simulated, thus ensuring the ignitability of the mixture. Conversely, the CH injection strategy leads to a lean mixture inside the prechamber at 7500 rpm and full load and a rich mixture at partial load due to a poor diffusion of liquid fuel in the cylinder. It is worth noting that the equivalence ratio trends of the PN8 geometry are more flat if compared to the ones obtained with the PN6 geometry. The lower height-to-diameter ratio and the higher number of orifices are desirable features for improving the homogenization.
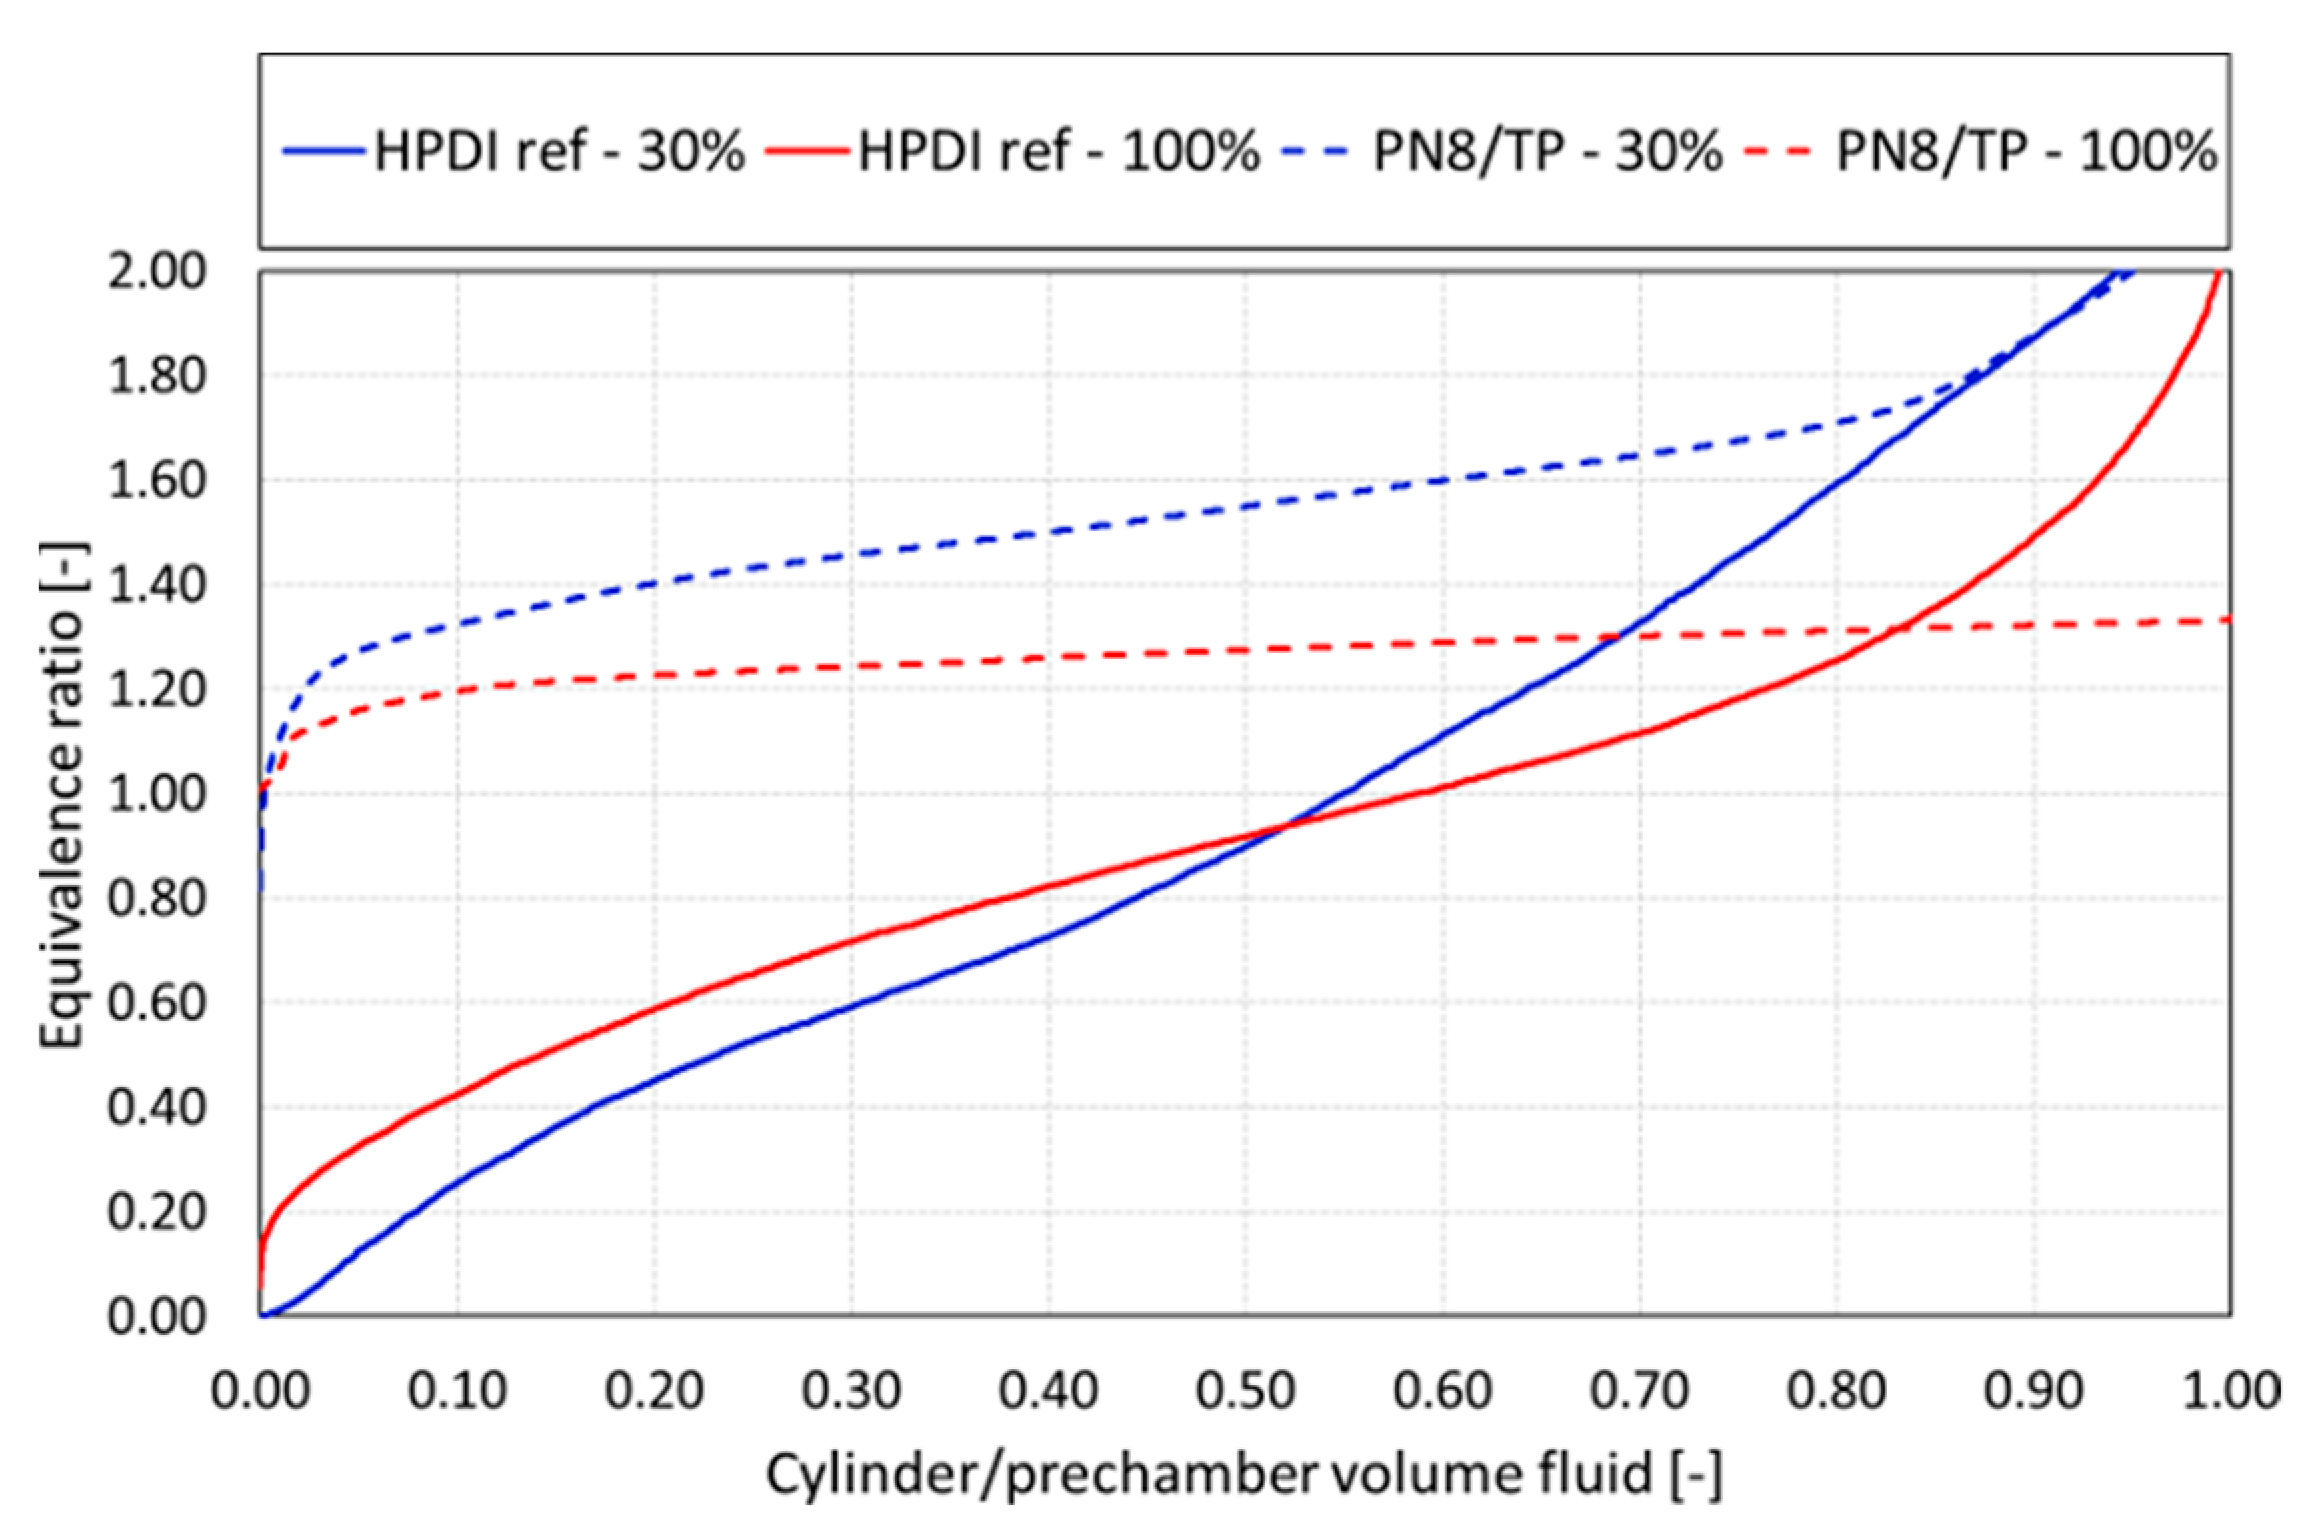
As a final analysis, the best results achieved with the PN8 prechamber in combination with the TP injector configuration are compared with the outcome of the same analysis carried out in [7] for the baseline engine equipped with the HPDI system. The goal is to show the benefits provided by the use of a passive device in terms of mixture uniformity with respect to a standard solution. The homogenization trends for both analyzed loads at 7500 rpm are presented in Figure 25, showing the large improvement provided by the prechamber. The results for the reference engine with the HPDI injector without the passive prechamber are characterized by a notable variability of the air-to-fuel ratio inside the combustion chamber volume. This implies a more severe risk of ignition failure, since repeatability is not guaranteed for the achievement of a stochiometric mixture in proximity of the spark.

4. Conclusions

The study discussed the feasibility of applying a passive prechamber on a HPDI 2S engine trough CFD analysis. After a thorough literature review on existing design guidelines for passive prechambers, two specimens have been designed in order to investigate the influence of the prechamber geometry on both the residuals and fresh fuel distributions. The effect of two injection strategies has been evaluated by changing the injector location. Three engine operating conditions have been considered.
The analysis on the behavior of the residuals showed a suitable scavenging process inside the prechamber, since the average MFBG inside the prechambers was almost equivalent to the main chamber at TDC. The prechamber with eight orifices (PN8) showed the best performance, with a slightly lower amount of trapped residual gases at partial loads thanks to its lower height-to-diameter ratio.
After confirming the ignitability in terms of residuals, the injection process was evaluated. Comparing the two injection strategies, it can be claimed that an injector location on the cylinder liner close to the fifth transfer port ensured the mixture ignitability at all the three operating conditions with acceptable fuel short circuit values, especially if compared to values of standard carburetor engines. In fact, the TP injection leads to a more relevant interaction between fuel and airflow, an increased diffusion of liquid fuel and a better fuel–air mixing. On the contrary, when the injector is located in the cylinder head, the spray diffusion and the mixing with fresh air is poorer, since the injection point is too far from the high velocity flow entering from the transfer ports.
In terms of mixture ignitability, no relevant differences between the two prechambers have been shown from CFD simulations, although the PN8 prechamber showed a slightly more uniform mixture. It can be concluded that a low aspect-ratio prechamber, with a high number of orifices, allows obtaining more suitable conditions in the sparkplug region in terms of both residuals and uniformity of the fresh mixture. Further investigations on the combustion process should be done in the near future in order to assess the actual engine performance.

Author Contributions

Conceptualization, M.C., F.B., G.F.; Methodology, M.C., S.B., F.B.; Software, M.C., S.B.; Validation, S.B., F.B.; Formal Analysis, M.C.; Investigation, M.C.; Resources, G.F.; Data Curation, M.C., S.B.; Writing-Original Draft Preparation, M.C., S.B.; Writing-Review & Editing, F.B., A.B.; Visualization, L.R.; Supervision, F.B., G.F.; Project Administration, G.F. All authors have read and agreed to the published version of the manuscript.

Funding

This research received no external funding.

Conflicts of Interest

The authors declare no conflict of interest.

Acronyms and Abbreviations

°CACrank Angles Degrees
BDCBottom Dead Center
BSFCBrake Specific Fuel Consumption
CFDComputational Fluid Dynamics
CHInjector position on the Cylinder Head
COCarbon Oxide
CPUCentral Processing Unit
DPMDiscrete Phase Model
GDIGasoline Direct Injection
EPCExhaust Port Closing
EPOExhaust Port Opening
HPDIHigh-Pressure Direct Injection
HRRHeat Release Rate
IMEPIndicating Mean Effective Pressure
JIJet Ignition
KHRTKelvin–Helmholtz and Rayleigh–Taylor (breakup model)
LPDILow-Pressure Direct Injection
LTCLow Temperature Combustion
MFBMass of Fuel Burnt (duration)
MFBGMass Fraction of Burnt Gas
NNumber of orifices
NOXNitric Oxides
PDAPhase-Doppler Anemometry
PFIPort Fuel Injection
PN6Six-holes Prechamber
PN8Eight-holes Prechamber
SNumber of Strokes
SISpark Ignition
SOOverall Flow Passage Area
SOIStart of Injection
TDCTop Dead Center
TITorch Ignition
TJITurbulent Jet Ignition
TPInjector position above the central Transfer Port
UHCUnburned Hydrocarbons
VPPrechamber Volume
VCCombustion Chamber Volume
VDCylinder Displacement
WLTPWorldwide Harmonized Light Vehicle Test Procedure

References

  1. Ferrara, G.; Balduzzi, F.; Vichi, G. An Innovative Solution for Two-Stroke Engines to Reduce the Short-Circuit Effects. In Proceedings of the SAE 2012 World Congress & Exhibition, Detroit, MI, USA, 24–26 April 2012; SAE International: Warrendale, PA, USA, 2012. [Google Scholar]
  2. Ohira, T.; Ikeda, Y.; Nakagima, T. Cyclic Variation Due to Misfiring in a Small Two-Stroke Engine. In Unsteady Combustion; Culick, F., Heitor, M.V., Whitelaw, J.H., Eds.; Springer: Dordrecht, The Netherlands, 1996; pp. 369–381. ISBN 978-94-010-7223-6. [Google Scholar]
  3. Romani, L.; Vichi, G.; Ferrara, G.; Balduzzi, F.; Trassi, P.; Fiaschi, J.; Tozzi, F. Development of a Low Pressure Direct Injection System for a Small 2S Engine. Part II—Experimental Analysis of the Engine Performance and Pollutant Emissions; SAE International: Warrendale, PA, USA, 2015. [Google Scholar]
  4. Romani, L.; Vichi, G.; Balduzzi, F.; Bianchini, A.; Ferrara, G. Fine-tuning of a two stoke engine in full power configuration provided with a Low Pressure Direct Injection system. Energy Procedia 2017, 126, 987–994. [Google Scholar] [CrossRef]
  5. Balduzzi, F.; Vichi, G.; Romani, L.; Ferrara, G.; Trassi, P.; Fiaschi, J.; Tozzi, F. Development of a Low Pressure Direct Injection System for a Small 2S Engine. Part I—CFD Analysis of the Injection Process. SAE Int. J. Engines 2015, 8, 1885–1897. [Google Scholar] [CrossRef]
  6. Balduzzi, F.; Vichi, G.; Romani, L.; Ferrara, G. CFD Analysis of the Effect of the Injection Pressure on a Small 2S LPDI Engine; SAE International: Warrendale, PA, USA, 2015. [Google Scholar]
  7. Balduzzi, F.; Romani, L.; Tanganelli, A.; Bigalli, S.; Ferrara, G. On the Effect of the Injector Position on Fuel-Air Mixture Preparation in a Two-Stroke GDI Engine; SAE International: Warrendale, PA, USA, 2018. [Google Scholar]
  8. Romani, L.; Balduzzi, F.; Ferrara, G.; Bosi, L.; Gioia, R.D.; Bonandrini, G.; Fiaschi, J.; Tozzi, F. Experimental Investigation on the Potentiality of a GDI System Applied to a Two-Stroke Engine: Analysis on Pollutant Emission and Fuel Consumption Reduction; SAE International: Warrendale, PA, USA, 2018. [Google Scholar]
  9. Marotta, A.; Pavlovic, J.; Ciuffo, B.; Serra, S.; Fontaras, G. Gaseous Emissions from Light-Duty Vehicles: Moving from NEDC to the New WLTP Test Procedure. Environ. Sci. Technol. 2015, 49, 8315–8322. [Google Scholar] [CrossRef]
  10. Dempsey, A.B.; Curran, S.J.; Wagner, R.M. A perspective on the range of gasoline compression ignition combustion strategies for high engine efficiency and low NOx and soot emissions: Effects of in-cylinder fuel stratification. Int. J. Engine Res. 2016, 17, 897–917. [Google Scholar] [CrossRef]
  11. Agarwal, A.K.; Singh, A.P.; Maurya, R.K. Evolution, challenges and path forward for low temperature combustion engines. Prog. Energy Combust. Sci. 2017, 61, 1–56. [Google Scholar] [CrossRef]
  12. Noguchi, M.; Sanda, S.; Nakamura, N. Development of Toyota Lean Burn Engine; SAE International: Warrendale, PA, USA, 1976. [Google Scholar]
  13. Konishi, M.; Nakamura, N.; Oono, E.; Baika, T.; Sanda, S. Effects of a Prechamber on NOx Formation Process in the SI Engine; SAE International: Warrendale, PA, USA, 1979. [Google Scholar]
  14. Latsch, R. The Swirl-Chamber Spark Plug: A Means of Faster, More Uniform Energy Conversion in the Spark-Ignition Engine; SAE International: Warrendale, PA, USA, 1984. [Google Scholar]
  15. Adams, T.G. Theory and Evaluation of Auxiliary Combustion (Torch) Chambers; SAE International: Warrendale, PA, USA, 1978. [Google Scholar]
  16. Adams, T.G. Torch Ignition for Combustion Control of Lean Mixtures; SAE International: Warrendale, PA, USA, 1979. [Google Scholar]
  17. Hayashi, A.K.; Matsuura, K.; Baba, S. Performance of a Flame Jet Ignition System in a Two-Stroke Engine; SAE International: Warrendale, PA, USA, 2000. [Google Scholar]
  18. Gentz, G.; Thelen, B.; Gholamisheeri, M.; Litke, P.; Brown, A.; Hoke, J.; Toulson, E. A study of the influence of orifice diameter on a turbulent jet ignition system through combustion visualization and performance characterization in a rapid compression machine. Appl. Therm. Eng. 2015, 81, 399–411. [Google Scholar] [CrossRef]
  19. Gentz, G.; Gholamisheeri, M.; Toulson, E. A study of a turbulent jet ignition system fueled with iso-octane: Pressure trace analysis and combustion visualization. Appl. Energy 2017, 189, 385–394. [Google Scholar] [CrossRef] [Green Version]
  20. Yamaguchi, S.; Ohiwa, N.; Hasegawa, T. Ignition and burning process in a divided chamber bomb. Combust. Flame 1985, 59, 177–187. [Google Scholar] [CrossRef]
  21. Gomes, J.R.C.; Valle, R.M.; Pujatti, F.J.P.; Pereira, J.P. Torch Ignition System Analysis in an Spark Ignition Engine; SAE International: Warrendale, PA, USA, 2005. [Google Scholar]
  22. Moreira, T.A.A.; Baeta, J.G.C.; Filho, F.A.R.; Barros, J.E.M.; Pujatti, F.J.P.; Malle, R. Characterization of a Multi-Cylinder Torch Ignition System Operating with Homogenous Charge and Lean Mixture; SAE International: Warrendale, PA, USA, 2014. [Google Scholar]
  23. Mavinahally, N.S.; Assanis, D.N.; Govinda Mallan, K.R.; Gopalakrishnan, K.V. Torch Ignition: Ideal for Lean Burn Premixed-Charge Engines. J. Eng. Gas Turbines Power 1994, 116, 793–798. [Google Scholar] [CrossRef]
  24. Fu, L.; Ishima, T.; Long, W.; Tian, J. Research on the Ignition-Chamber GDI Engine Combustion System. J. Therm. Sci. Technol. 2009, 4, 53–62. [Google Scholar] [CrossRef] [Green Version]
  25. Weng, V.; Gindele, J.; Töpfer, G.; Spicher, U.; Latsch, R.; Kuhnert, D. Investigation of the Bowl-Prechamber-Ignition (BPI) Concept in a Direct Injection Gasoline Engine at Part Load; SAE International: Warrendale, PA, USA, 1999. [Google Scholar]
  26. Kettner, M.; Fischer, J.; Nauwerck, A.; Tribulowski, J.; Spicher, U.; Velji, A.; Kuhnert, D.; Latsch, R. The BPI Flame Jet Concept to Improve the Inflammation of Lean Burn Mixtures in Spark Ignited Engines; SAE International: Warrendale, PA, USA, 2004. [Google Scholar]
  27. Kettner, M.; Rothe, M.; Velji, A.; Spicher, U.; Kuhnert, D.; Latsch, R. A New Flame Jet Concept to Improve the Inflammation of Lean Burn Mixtures in SI Engines; SAE International: Warrendale, PA, USA, 2005. [Google Scholar]
  28. Chiodi, M.; Kaechele, A.; Bargende, M.; Wichelhaus, D.; Poetsch, C. Development of an Innovative Combustion Process: Spark-Assisted Compression Ignition. SAE Int. J. Engines 2017, 10, 2486–2499. [Google Scholar] [CrossRef]
  29. Date, T.; Yagi, S.; Ishizuya, A.; Fujii, I. Research and Development of the Honda CVCC Engine; SAE International: Warrendale, PA, USA, 1974. [Google Scholar]
  30. Dimick, D.L.; Genslak, S.L.; Greib, R.E.; Malik, M.J. Emissions and Economy Potential of Prechamber Stratified Charge Engines; SAE International: Warrendale, PA, USA, 1979. [Google Scholar]
  31. Brandstetter, W.R.; Decker, G.; Schafer, H.J.; Steinke, D. The Volkswagen PCI Stratified Charge Concept-Results from the 1.6 Liter Air Cooled Engine; SAE International: Warrendale, PA, USA, 1974. [Google Scholar]
  32. Garrett, T.K. Porsche stratified charge engine. Environ. Sci. Technol. 1975, 9, 826–830. [Google Scholar] [CrossRef]
  33. Attard, W.P.; Fraser, N.; Parsons, P.; Toulson, E. A Turbulent Jet Ignition Pre-Chamber Combustion System for Large Fuel Economy Improvements in a Modern Vehicle Powertrain. SAE Int. J. Engines 2010, 3, 20–37. [Google Scholar] [CrossRef] [Green Version]
  34. Attard, W.P.; Blaxill, H. A Single Fuel Pre-Chamber Jet Ignition Powertrain Achieving High Load, High Efficiency and Near Zero NOx Emissions. SAE Int. J. Engines 2011, 5, 734–746. [Google Scholar] [CrossRef] [Green Version]
  35. Attard, W.P.; Bassett, M.; Parsons, P.; Blaxill, H. A New Combustion System Achieving High Drive Cycle Fuel Economy Improvements in a Modern Vehicle Powertrain; SAE International: Warrendale, PA, USA, 2011. [Google Scholar]
  36. Attard, W.P.; Toulson, E.; Huisjen, A.; Chen, X.; Zhu, G.; Schock, H. Spark Ignition and Pre-Chamber Turbulent Jet Ignition Combustion Visualization; SAE International: Warrendale, PA, USA, 2012. [Google Scholar]
  37. Attard, W.P.; Blaxill, H.; Anderson, E.K.; Litke, P. Knock Limit Extension with a Gasoline Fueled Pre-Chamber Jet Igniter in a Modern Vehicle Powertrain. SAE Int. J. Engines 2012, 5, 1201–1215. [Google Scholar] [CrossRef]
  38. Boretti, A.A.; Jiang, S. Development of a two stroke direct injection jet ignition compressed natural gas engine. J. Power Technol. 2014, 94, 145–152. [Google Scholar]
  39. Boretti, A.; Jiang, S. Two Stroke Direct Injection Jet Ignition Engines for Unmanned Aerial Vehicles; SAE International: Warrendale, PA, USA, 2015. [Google Scholar]
  40. Roethlisberger, R.P.; Favrat, D. Investigation of the prechamber geometrical configuration of a natural gas spark ignition engine for cogeneration: Part II. Experimentation. Int. J. Therm. Sci. 2003, 42, 239–253. [Google Scholar] [CrossRef]
  41. Roethlisberger, R.P.; Favrat, D. Investigation of the prechamber geometrical configuration of a natural gas spark ignition engine for cogeneration: Part I. Numerical simulation. Int. J. Therm. Sci. 2003, 42, 223–237. [Google Scholar] [CrossRef]
  42. Ryu, H.; Chtsu, A.; Asanuma, T. Effect of Torch Jet Direction on Combustion and Performance of a Prechamber Spark-Ignition Engine; SAE International: Warrendale, PA, USA, 1987. [Google Scholar]
  43. Gentz, G.; Thelen, B.; Litke, P.; Hoke, J.; Toulson, E. Combustion Visualization, Performance, and CFD Modeling of a Pre-Chamber Turbulent Jet Ignition System in a Rapid Compression Machine. SAE Int. J. Engines 2015, 8, 538–546. [Google Scholar] [CrossRef]
  44. Ohtsu, A.; Ryu, H.; Asanuma, T. Visualization of Flame Propagation in a Spark Ignition Engine with an Unscavenged Prechamber. JSME Int. J. Ser. 2 Fluids Eng. Heat Transf. Power Combust. Thermophys. Prop. 1989, 32, 127–133. [Google Scholar] [CrossRef] [Green Version]
  45. Biswas, S.; Qiao, L. Ignition of ultra-lean premixed H2/air using multiple hot turbulent jets generated by pre-chamber combustion. Appl. Therm. Eng. 2018, 132, 102–114. [Google Scholar] [CrossRef]
Figure 1. (a) Conceptual scheme of passive prechamber; (b) conceptual scheme of active prechamber with dedicated injector fueling system.
Energies 13 02846 g001
Figure 2. The two injection strategies used in this work: cylinder head position (CH) and transfer port position (TP).
Energies 13 02846 g002
Figure 3. (a) Drafting of the PN6 prechamber; (b) drafting of the PN8 prechamber.
Energies 13 02846 g003
Figure 4. (a) Side view of the mesh of the fluid domain, including PN6 prechamber; (b) top view.
Energies 13 02846 g004
Figure 5. Side view of the mesh of the fluid domain inside the PN6 (a) and PN8 (b) prechambers.
Energies 13 02846 g005
Figure 6. Mass fraction of burnt gas (MFBG) trends inside the main chamber (continuous lines) and the PN8 prechamber (dashed lines) for the three engine operating points.
Energies 13 02846 g006
Figure 7. In-cylinder scavenging behavior at 7500 rpm and full load using PN8 prechamber.
Energies 13 02846 g007
Figure 8. Scavenging behavior at 7500 rpm and full load inside the PN8 prechamber.
Energies 13 02846 g008
Figure 9. In-cylinder scavenging behavior at 7500 rpm and 30% of load using PN8 prechamber.
Energies 13 02846 g009
Figure 10. Scavenging behavior at 7500 rpm and 30% of load inside the PN8 prechamber.
Energies 13 02846 g010
Figure 11. In-cylinder scavenging behavior at 2500 rpm and 10% of load using PN8 prechamber.
Energies 13 02846 g011
Figure 12. Scavenging behavior at 2500 rpm and 10% of load inside the PN8 prechamber.
Energies 13 02846 g012
Figure 13. Differences in MFBG behavior during scavenging between the two prechambers.
Energies 13 02846 g013
Figure 14. MFBG inside cylinder and prechamber for PN6 and PN8 systems at 360 °CA.
Energies 13 02846 g014
Figure 15. Spray behavior and equivalence ratio contours at 7500 rpm and full load with PN6 prechamber for both injection strategies.
Energies 13 02846 g015
Figure 16. Spray behavior and equivalence ratio contours at 7500 rpm and 30% of load with PN6 prechamber for both injection strategies.
Energies 13 02846 g016
Figure 17. Spray behavior and equivalence ratio contours at 2500 rpm and 10% load with PN6 prechamber for both injection strategies.
Energies 13 02846 g017
Figure 18. In-cylinder fuel homogenization using PN6 prechamber at 360 °CA: comparison between CH injection (continuous lines) and TP injection (dashed lines).
Energies 13 02846 g018
Figure 19. Fuel short circuit using both prechambers and both injection strategies.
Energies 13 02846 g019
Figure 20. Equivalence ratio contours inside the prechamber at top dead center (TDC) for the 7500 rpm and full load case: comparison between the two prechamber geometries for both injection strategies.
Energies 13 02846 g020
Figure 21. Equivalence ratio contours inside the prechamber at TDC for the 7500 rpm and 30% of load case: comparison between the two prechamber geometries for both injection strategies.
Energies 13 02846 g021
Figure 22. Equivalence ratio contours inside the prechamber at TDC for the 2500 rpm and 10% of load case: comparison between the two prechamber geometries for both injection strategies.
Energies 13 02846 g022
Figure 23. Fuel homogenization inside the PN6 prechamber at 360 °CA: comparison between CH injection (continuous lines) and TP injection (dashed lines).
Energies 13 02846 g023
Figure 24. Fuel homogenization inside the PN8 prechamber at 360 °CA: comparison between CH injection (continuous lines) and TP injection (dashed lines).
Energies 13 02846 g024
Figure 25. Fuel homogenization for the 7500 rpm cases: comparison between the PN8 prechamber with TP injection (dashed lines) and the same engine in the standard configuration equipped with the high-pressure direct injection (HPDI) system (continuous lines).
Energies 13 02846 g025
Table 1. Main characteristics of the Betamotor 300 cm3 2S engine.
Maximum power (7500 rpm)31 kW
Displaced volume293.1 cm3
Bore × Stroke72 × 72 mm
Connecting Rod125 mm
Compression ratio11.5:1
Number of Transfer (Exhaust) Ports5 (3)
Table 2. Volumes of the passive prechambers for gasoline engines known to the authors.
YearStrokeInjectionVP [cm3]VP/VC [%]VP/VD [%]Reference
19764Scarburetor4.60 ÷ 10.49.00 ÷ 21.01.15 ÷ 2.60[12]
19794SPFI5.704.50.63[16]
19844SPFI1.300.88 ÷ 3.090.13 ÷ 0.43[14]
19874SPFI4.00 ÷ 38.16.24 ÷ 59.41.35 ÷ 12.85[42]
19894SPFI1933.566.41[44]
19994SGDI1.001.340.15[25]
20002Scarburetor0.50 ÷ 1.409.43 ÷ 26.41.02 ÷ 2.86[17]
20054SPFI1.974.140.50[21]
20054SPFI + GDI0.68 ÷ 2.001.000.09 ÷ 0.11[27]
20144SPFI3.667.900.92[22]
20174SGDI0.15 ÷ 0.300.41 ÷ 0.830.04 ÷ 0.08[28]
Table 3. Flow passage areas of the passive prechambers for gasoline engines known to the authors.
YearStrokeInjectionNSO [mm2]SO/VP [mm−1]Reference
19784SPFI119.47 ÷ 197.931.9⋅10−3 ÷ 3.3⋅10−2[15]
19894SPFI120 ÷ 901.1⋅10−3 ÷ 4.7⋅10−3[44]
20002Scarburetor13.14 ÷ 78.543.9⋅10−3 ÷ 5.6⋅10−2[17]
20044SGDI4 ÷ 123.14 ÷ 9.42ND[26]
20054SPFI112.56 ÷ 28.276.4⋅10−3 ÷ 1.4⋅10−2[21]
20144SPFI128.277.7⋅10−3[22]
Table 4. Geometric characteristic of the six-orifice (PN6) and eight-orifice (PN8) prechambers.
PN6PN8
VP (gross) (mm3)496.9497.0
VP/VD (%)0.1700.170
VP/VC (%)1.8341.834
Head diameter (mm)10.012.0
Bottom diameter (mm)6.859.11
Height-to-diameter ratio (mm)0.740.43
N (-)68
SO (mm2)10.6010.62
SO/VP (mm−1)2.13·10−22.14·10−2
Slope of orifices (deg)2020
Table 5. Details of the mesh used for the PN6 and PN8 prechambers.
PN6PN8
# of cylinder elements at BDC1.30⋅1061.38⋅106
# of prechamber elements1.02⋅1061.59⋅106
# of total elements at BDC2.98⋅1063.62⋅106
sizing of orifices elements (mm)5.0⋅10−2 ÷ 2.0⋅10−13.0⋅10−2 ÷ 1.5⋅10−1
max size of prechamber elements (mm)3.5⋅10−13.5⋅10−1
Table 6. Injection setup used in computational fluid dynamics (CFD) simulations.
SpeedLoadInjector PositionDuration (°CA)
7500 rpm100%CH, TP68.5°
7500 rpm30%CH, TP13°
2500 rpm10%CH, TP