Volume and Surface Resistivity Measurement of Insulating Materials Using Guard-Ring Terminal Electrodes


Abstract
:1. Introduction
2. Experimental Section
2.1. Specimens
2.2. Theoretical Background
2.2.1. Resistivity Measurement
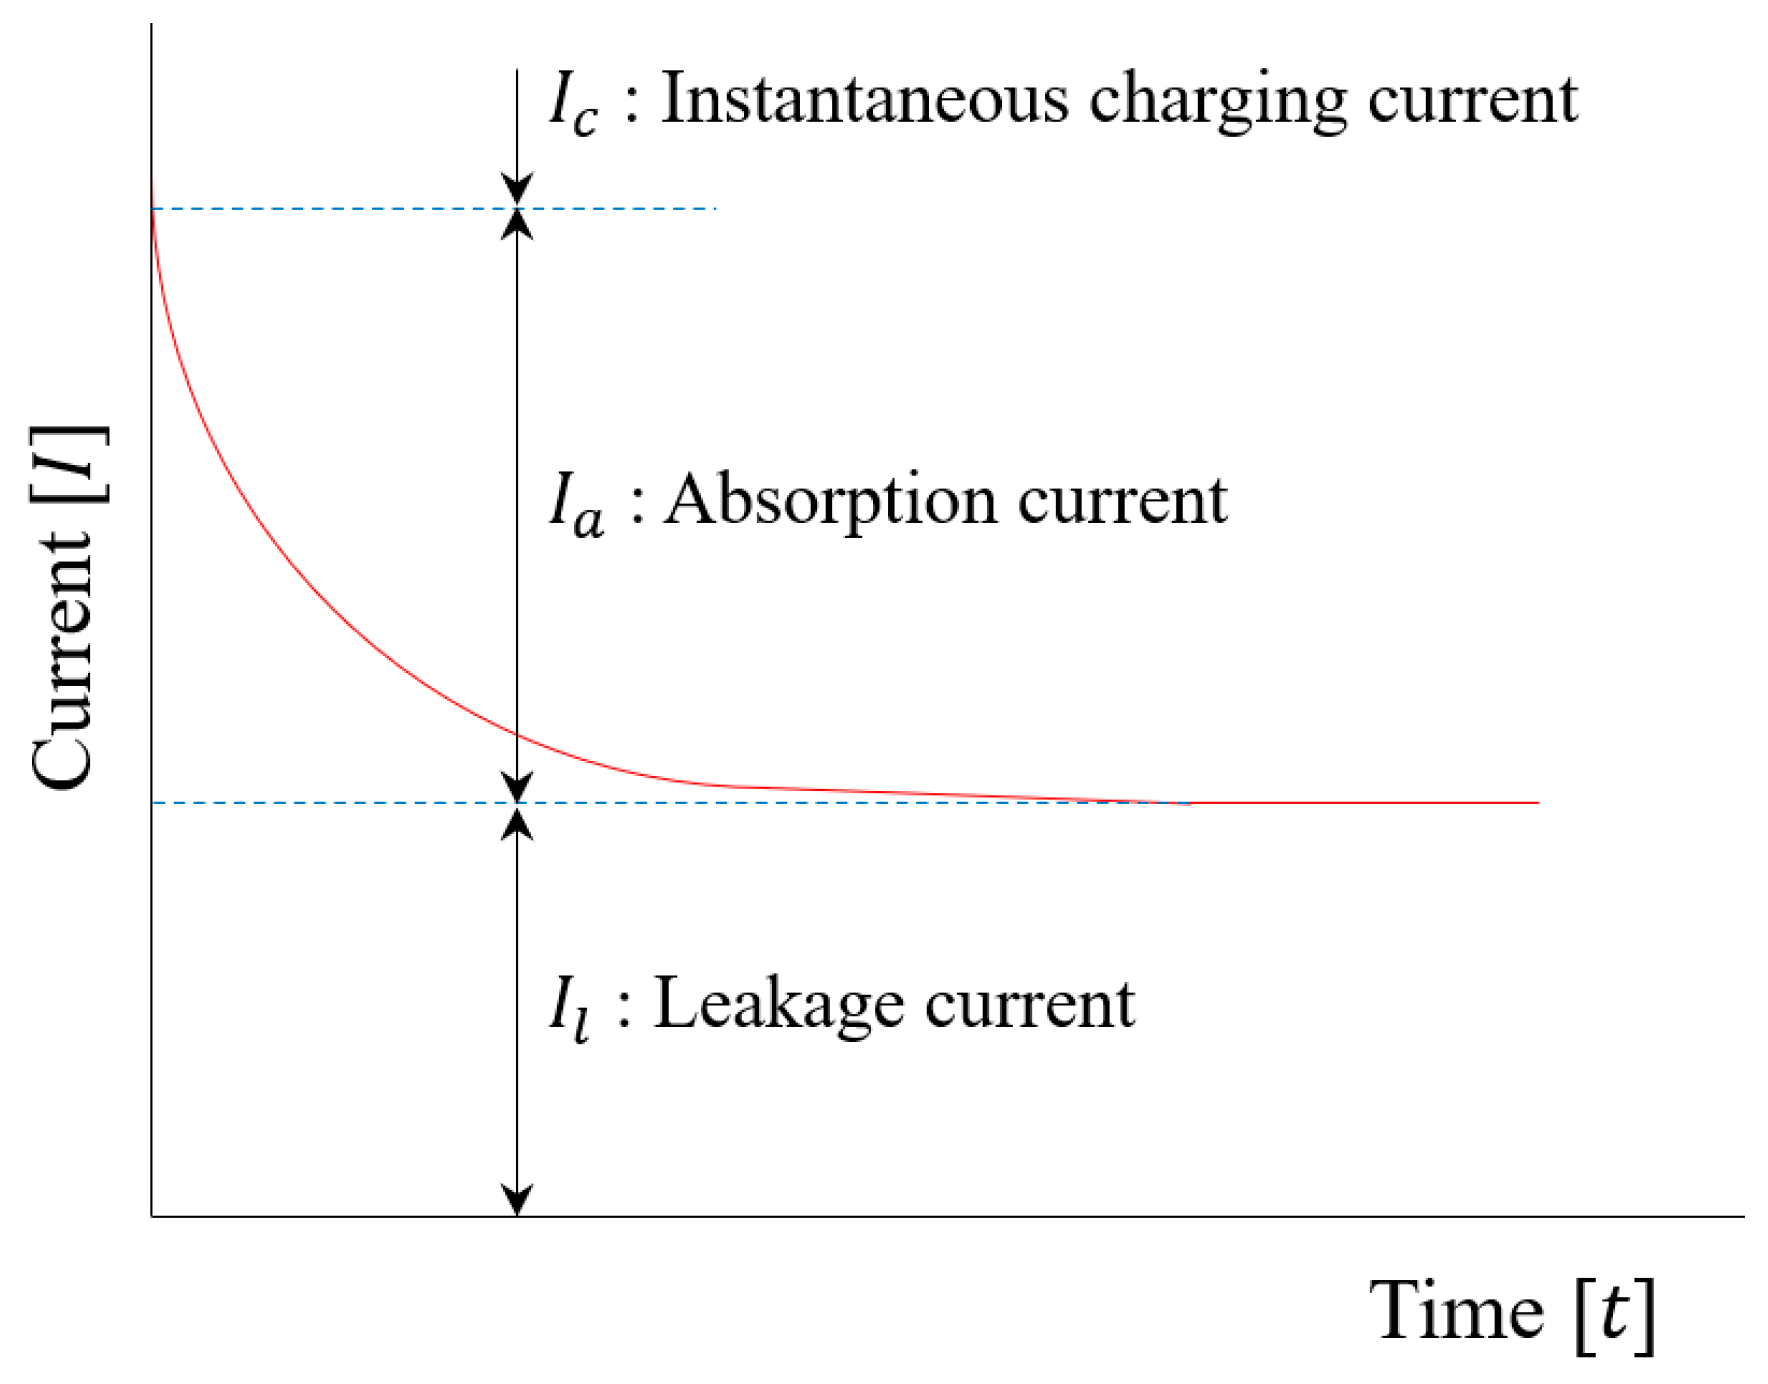
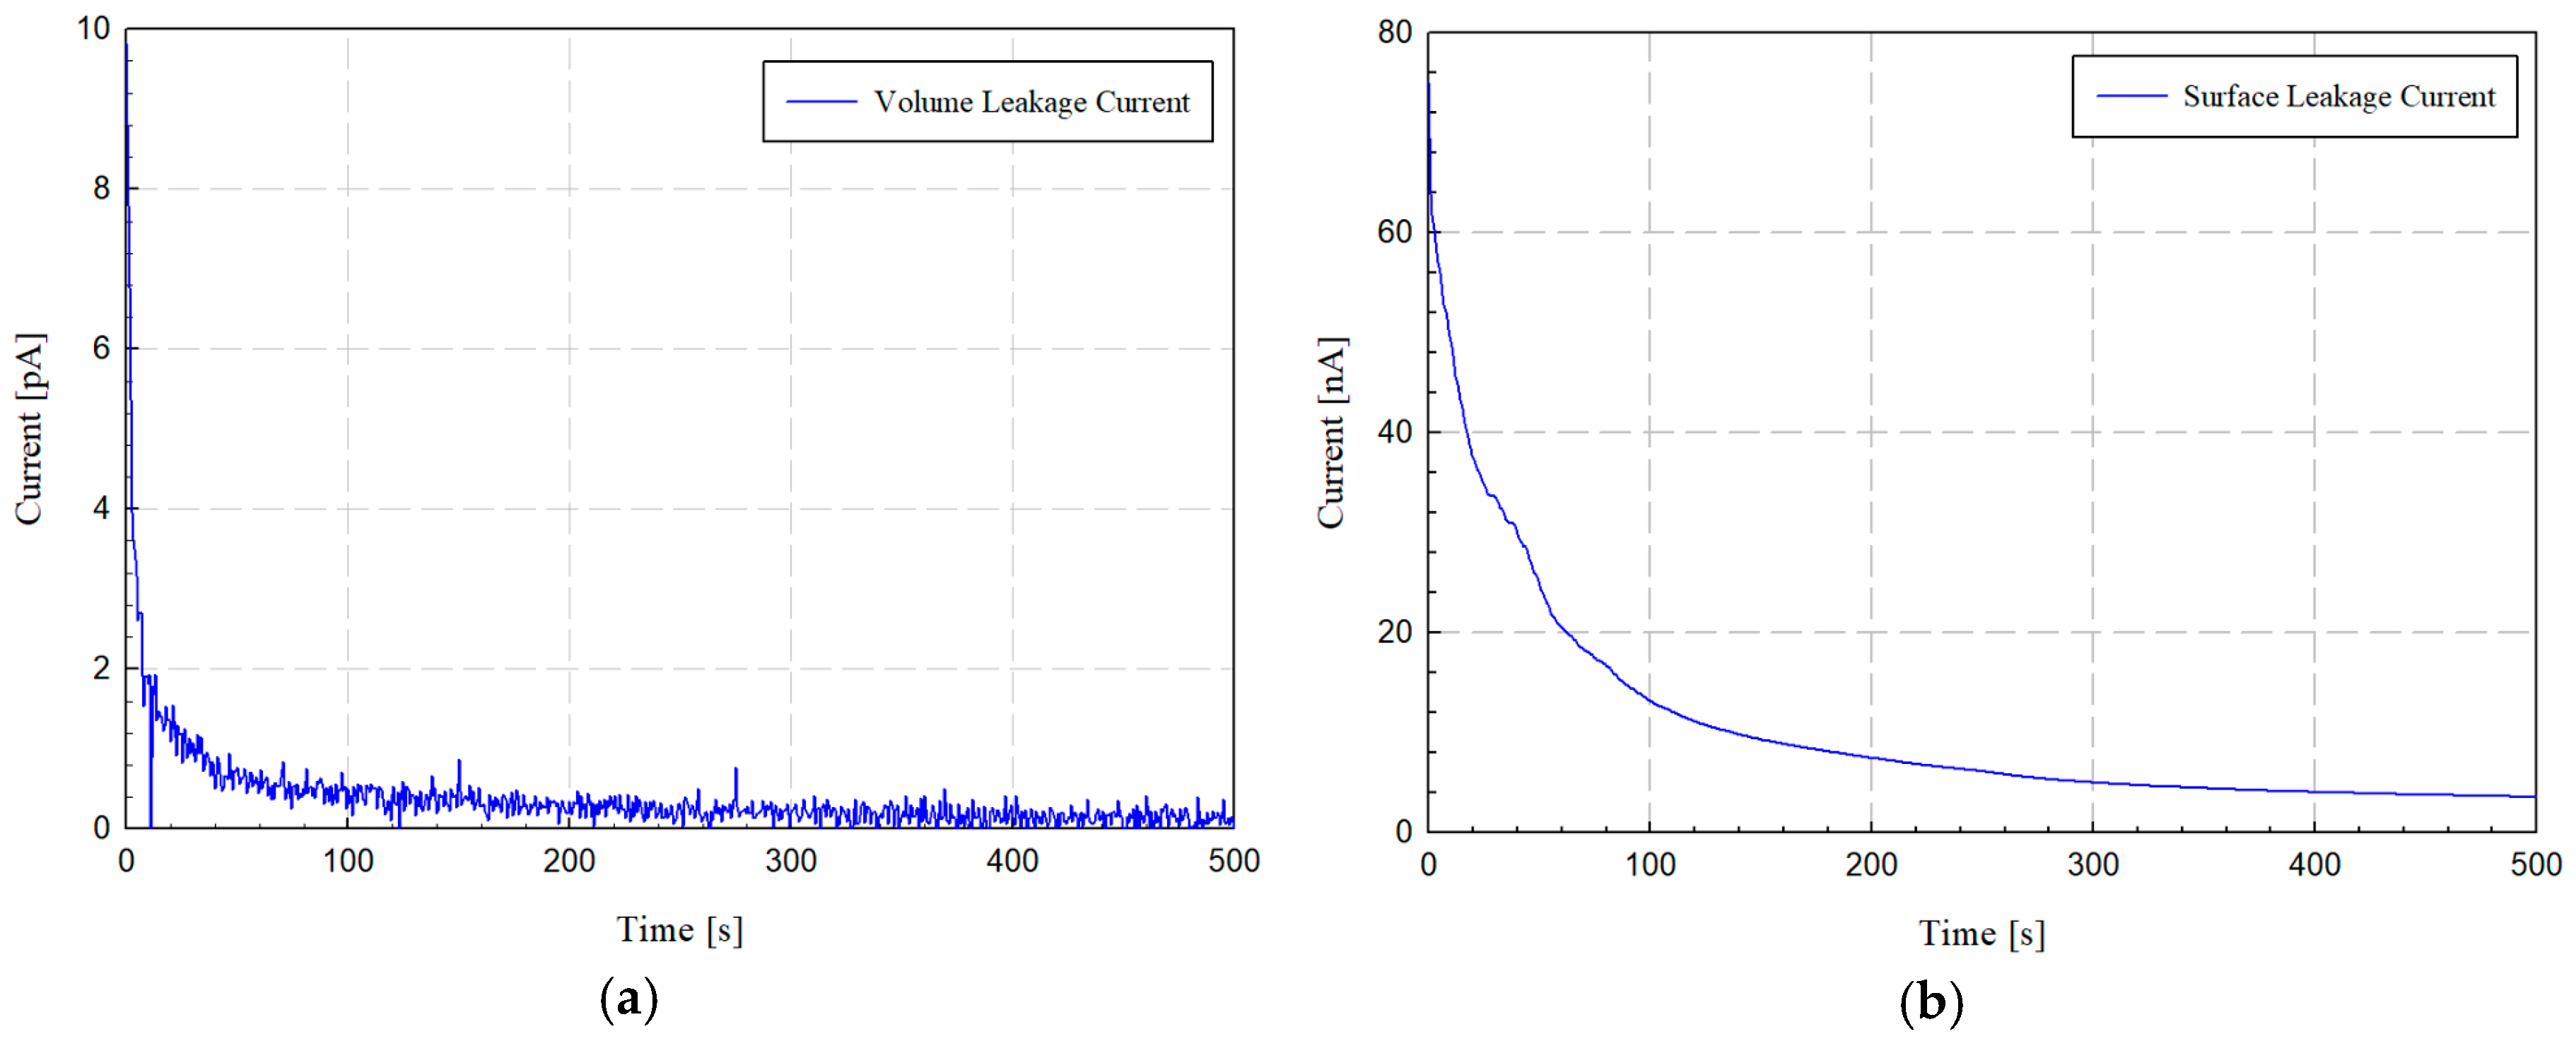
2.2.2. Charging Current
- (Instantaneous charging current): It is the current part that rapidly rises along with the voltage, and it refers to the current component generated by the electrostatic capacity and electron and atomic polarization formed in the insulator.
- (Absorption current): It is the current part that continuously flows and gradually decreases in the charging current, and it refers to a current component based on a relatively gentle electric polarization (such as orientation and interface polarizations).
- (Leakage current): It means the current part reaching a steady state where the current is maintained at a constant value. It is very difficult to calculate the pure leakage current in a short time.
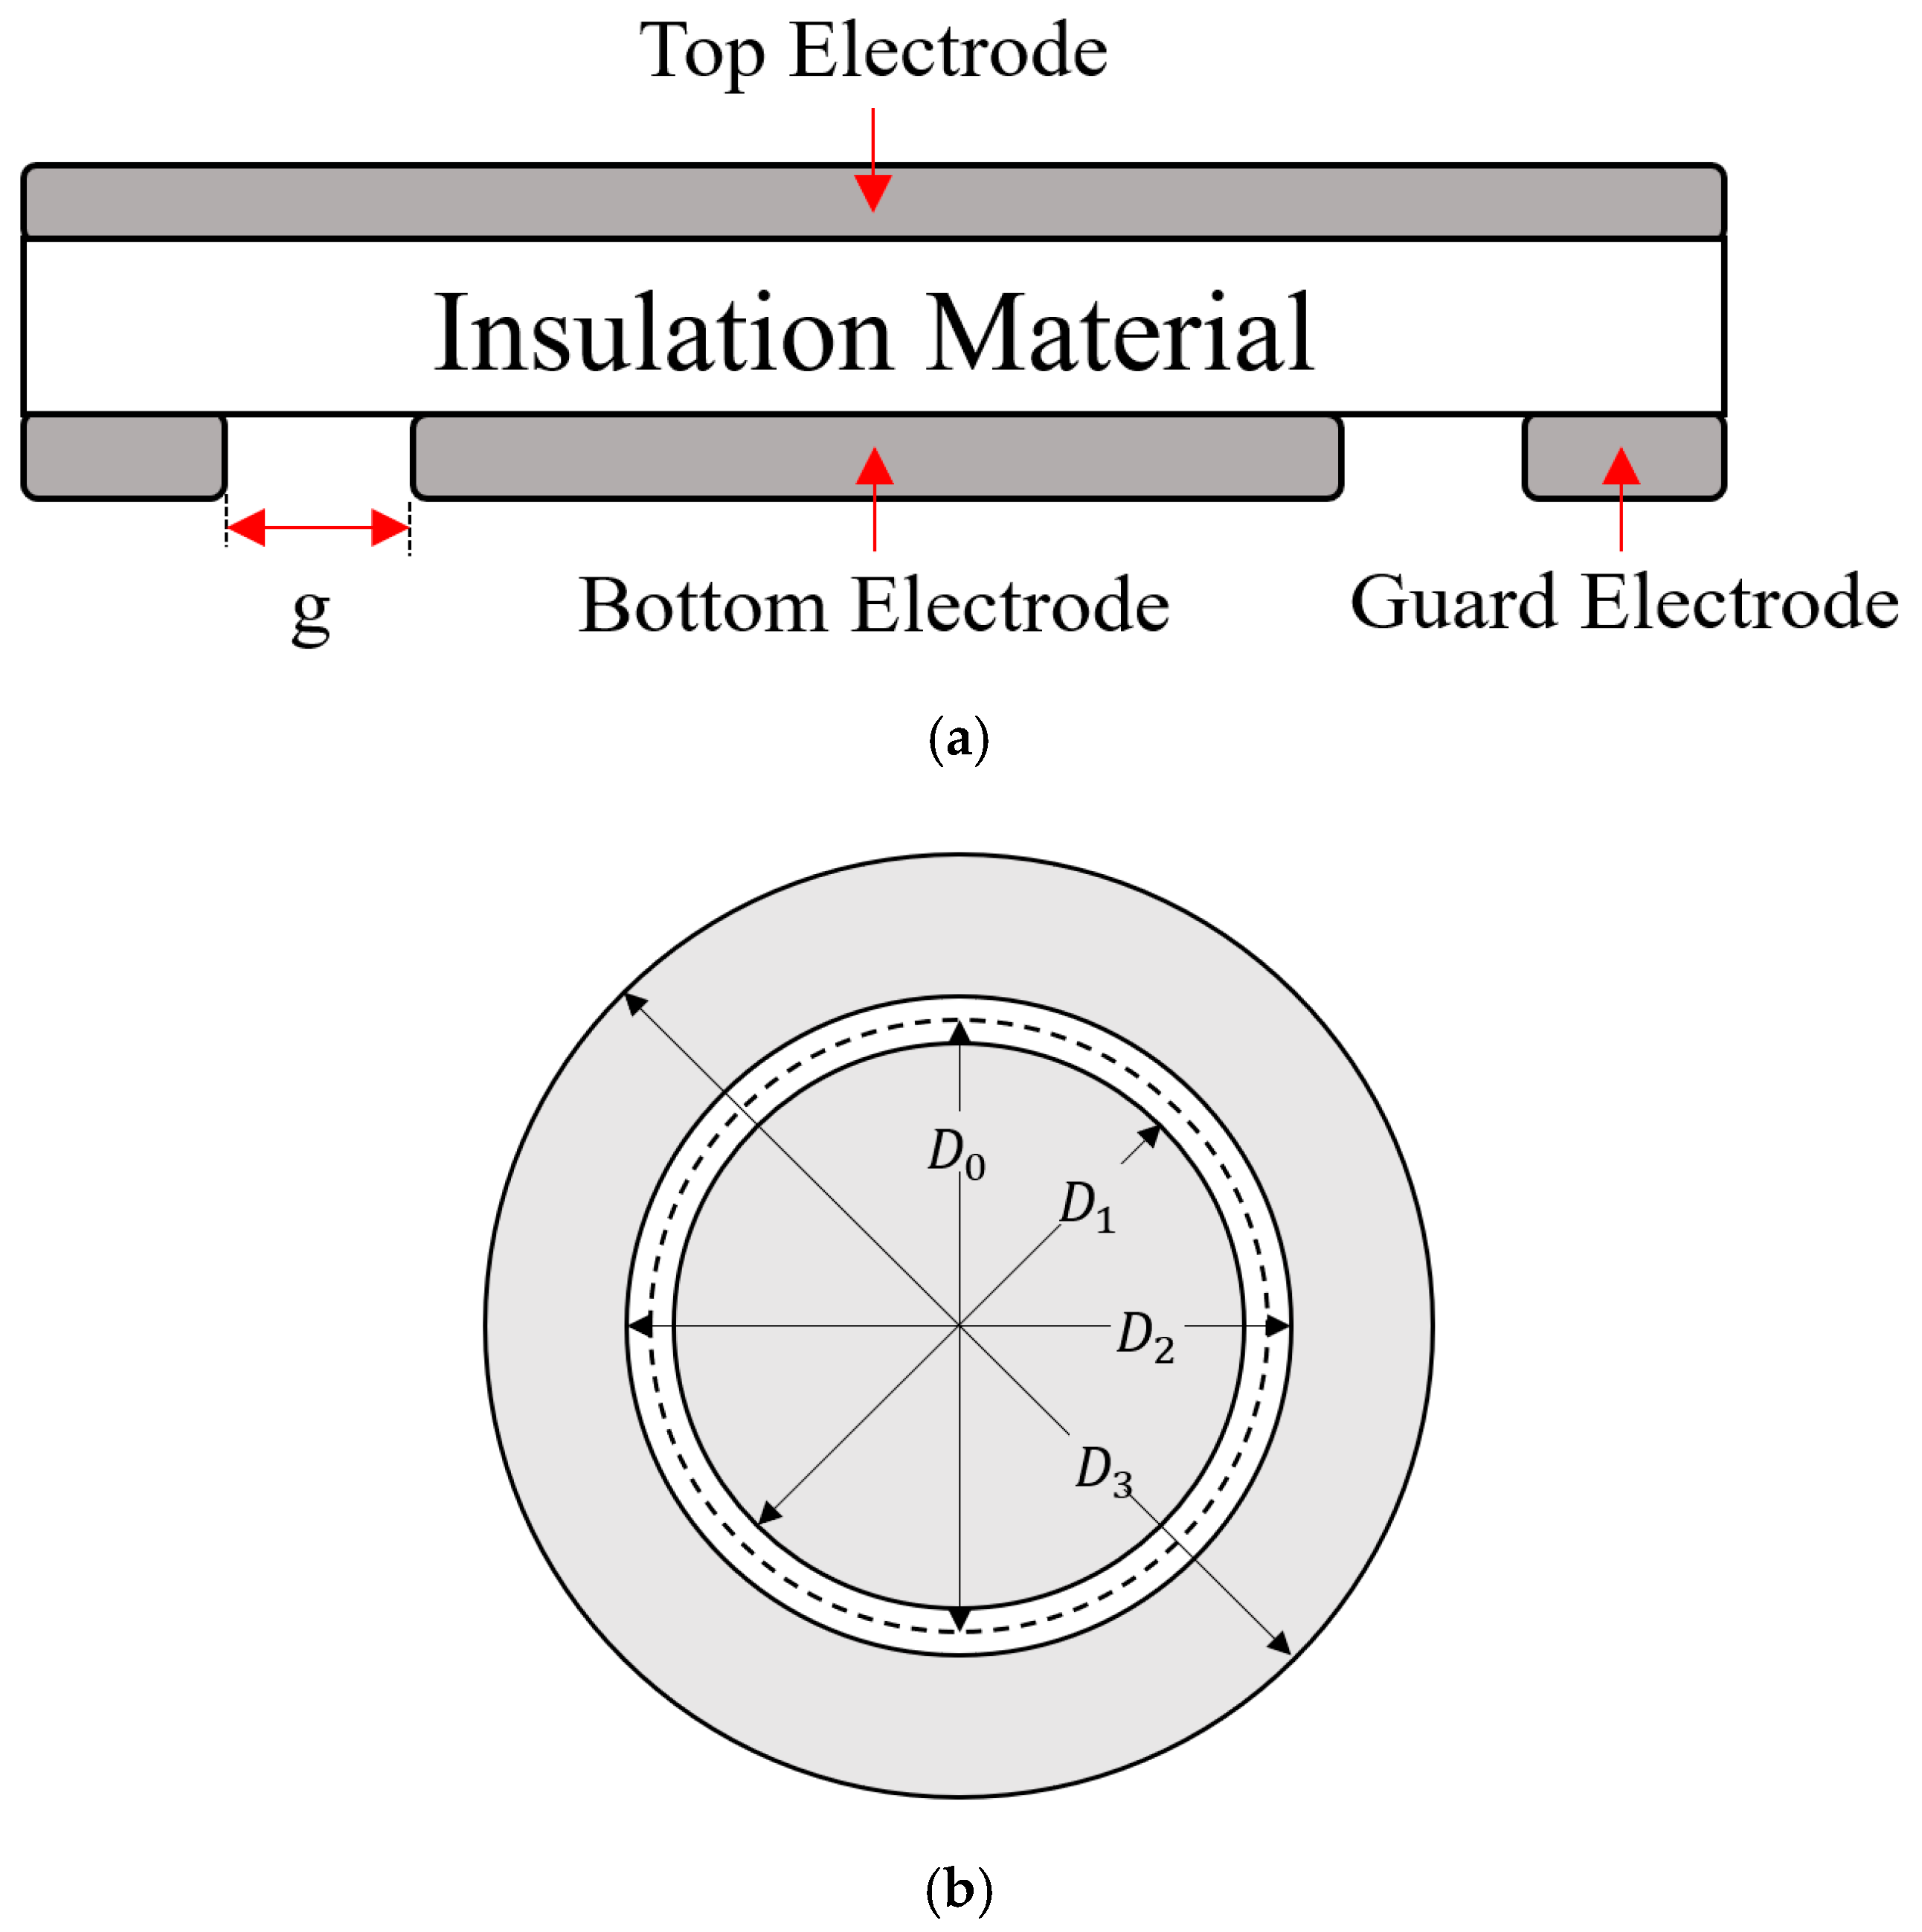
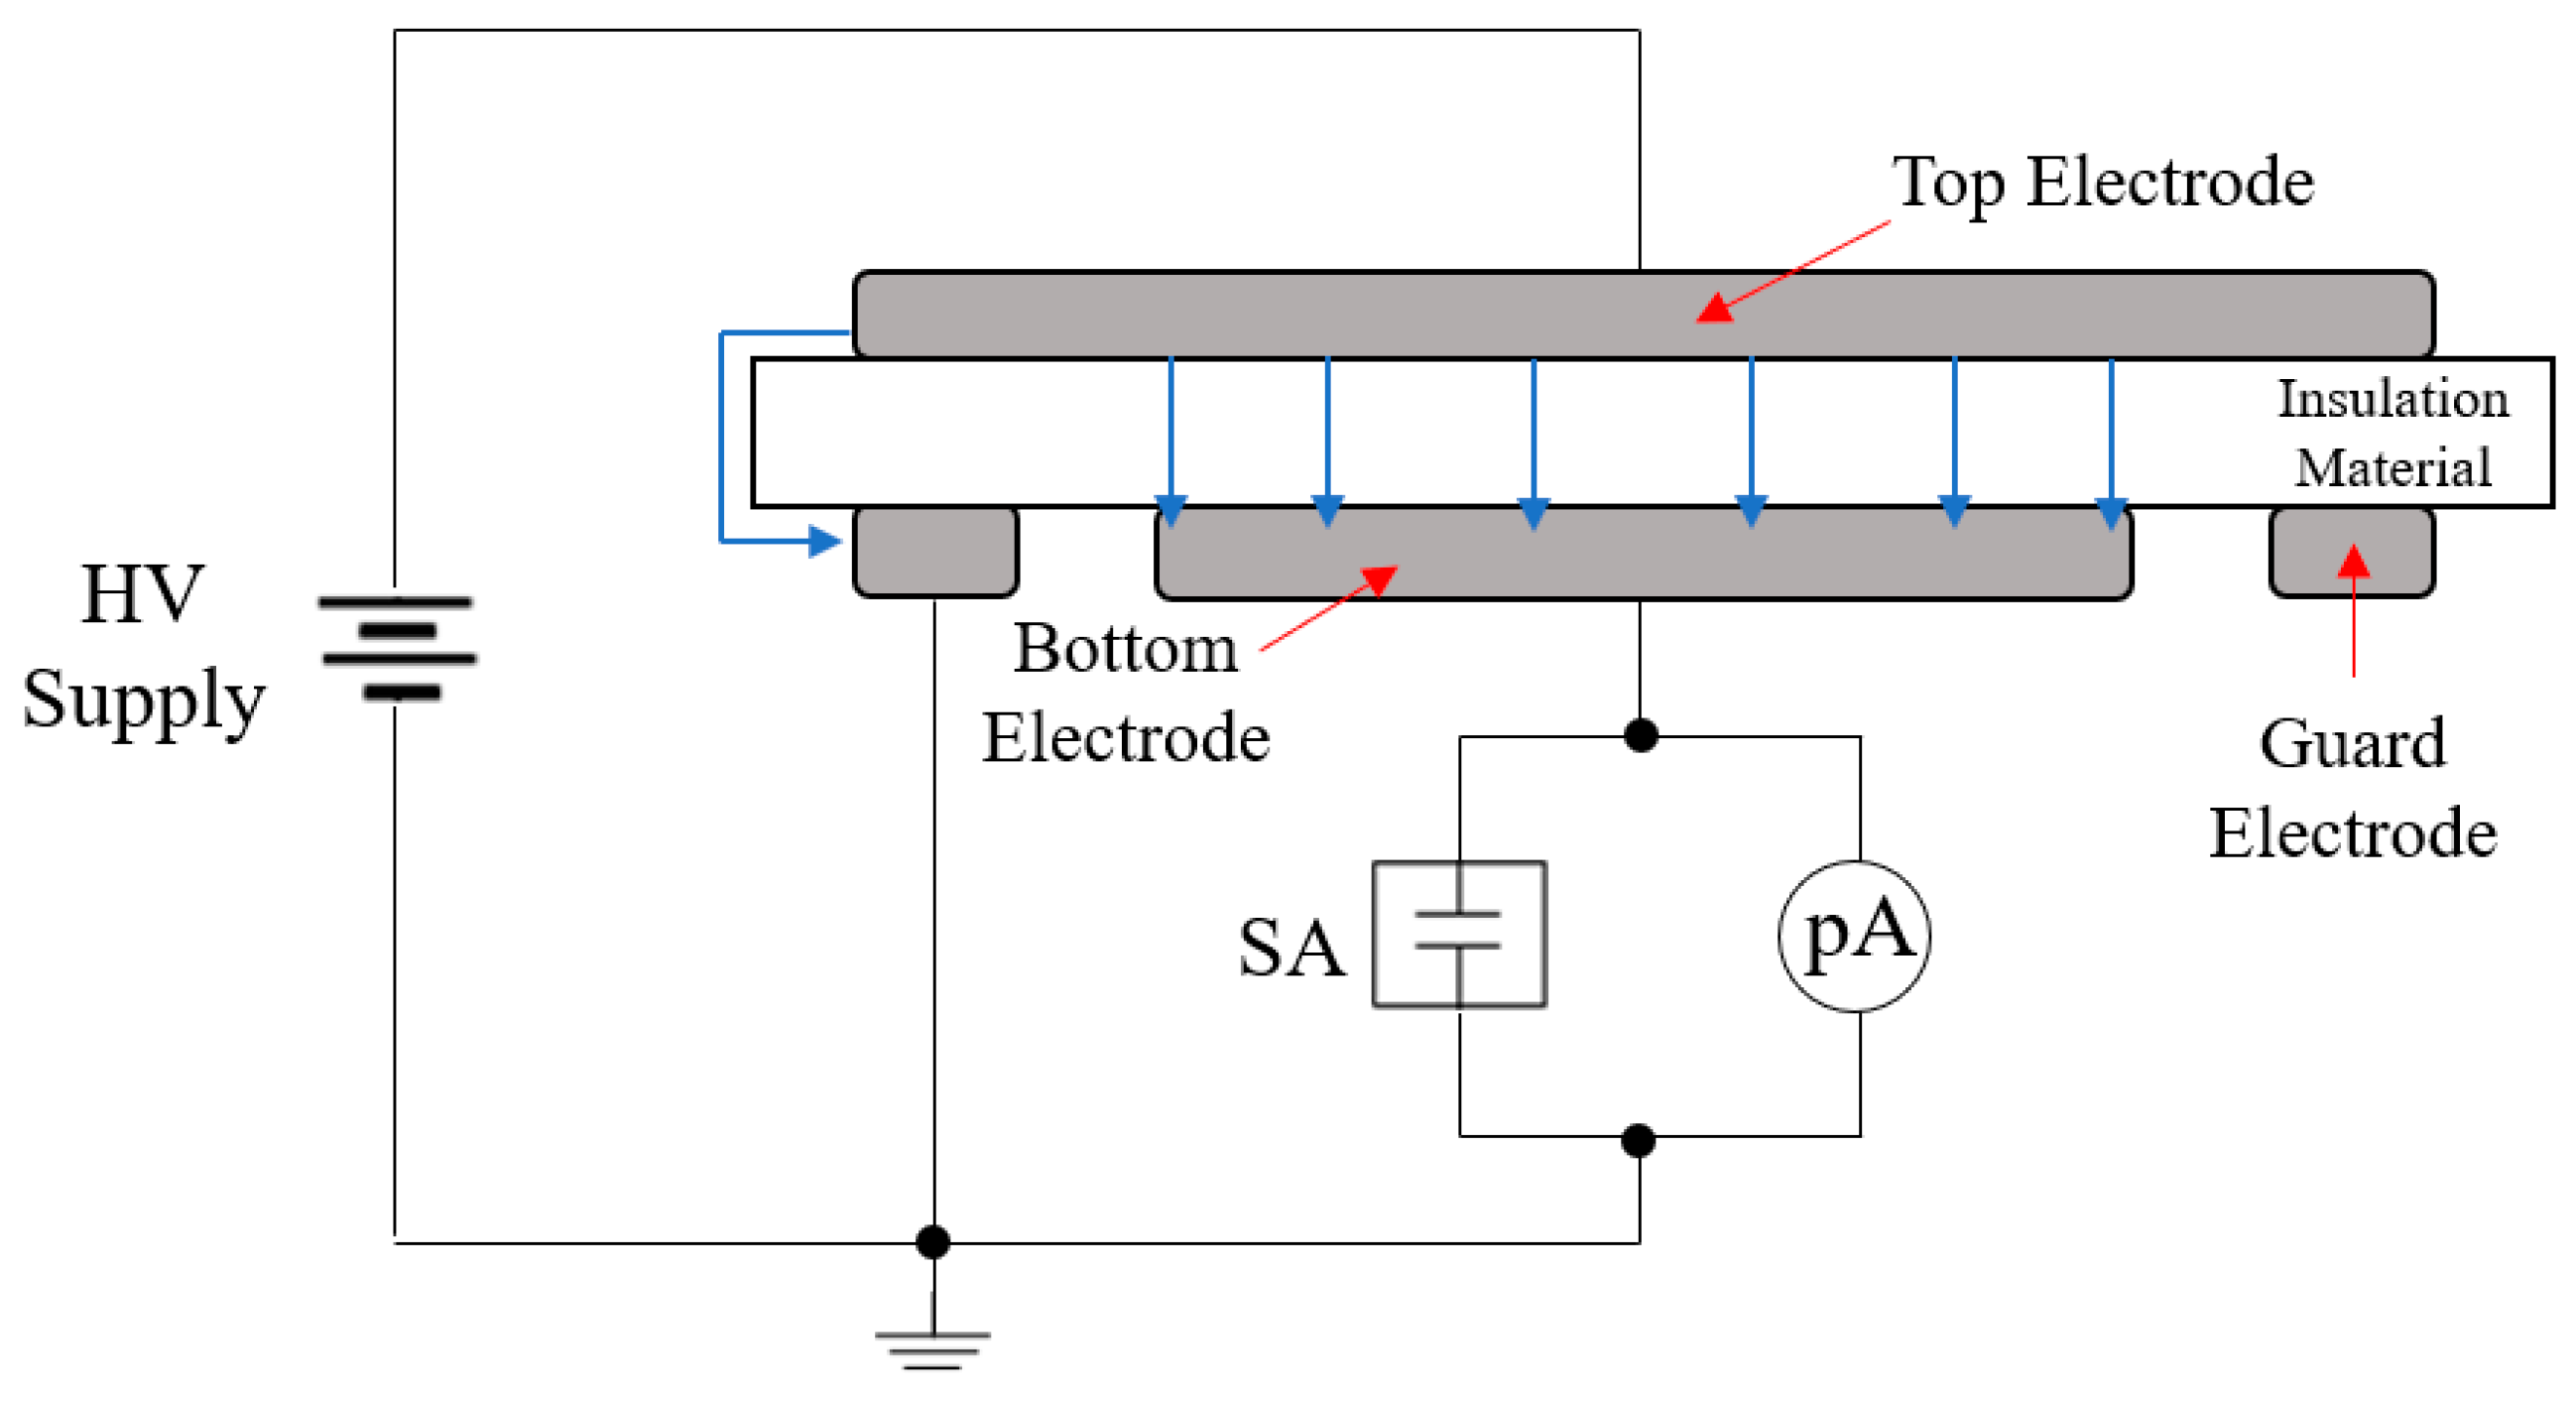
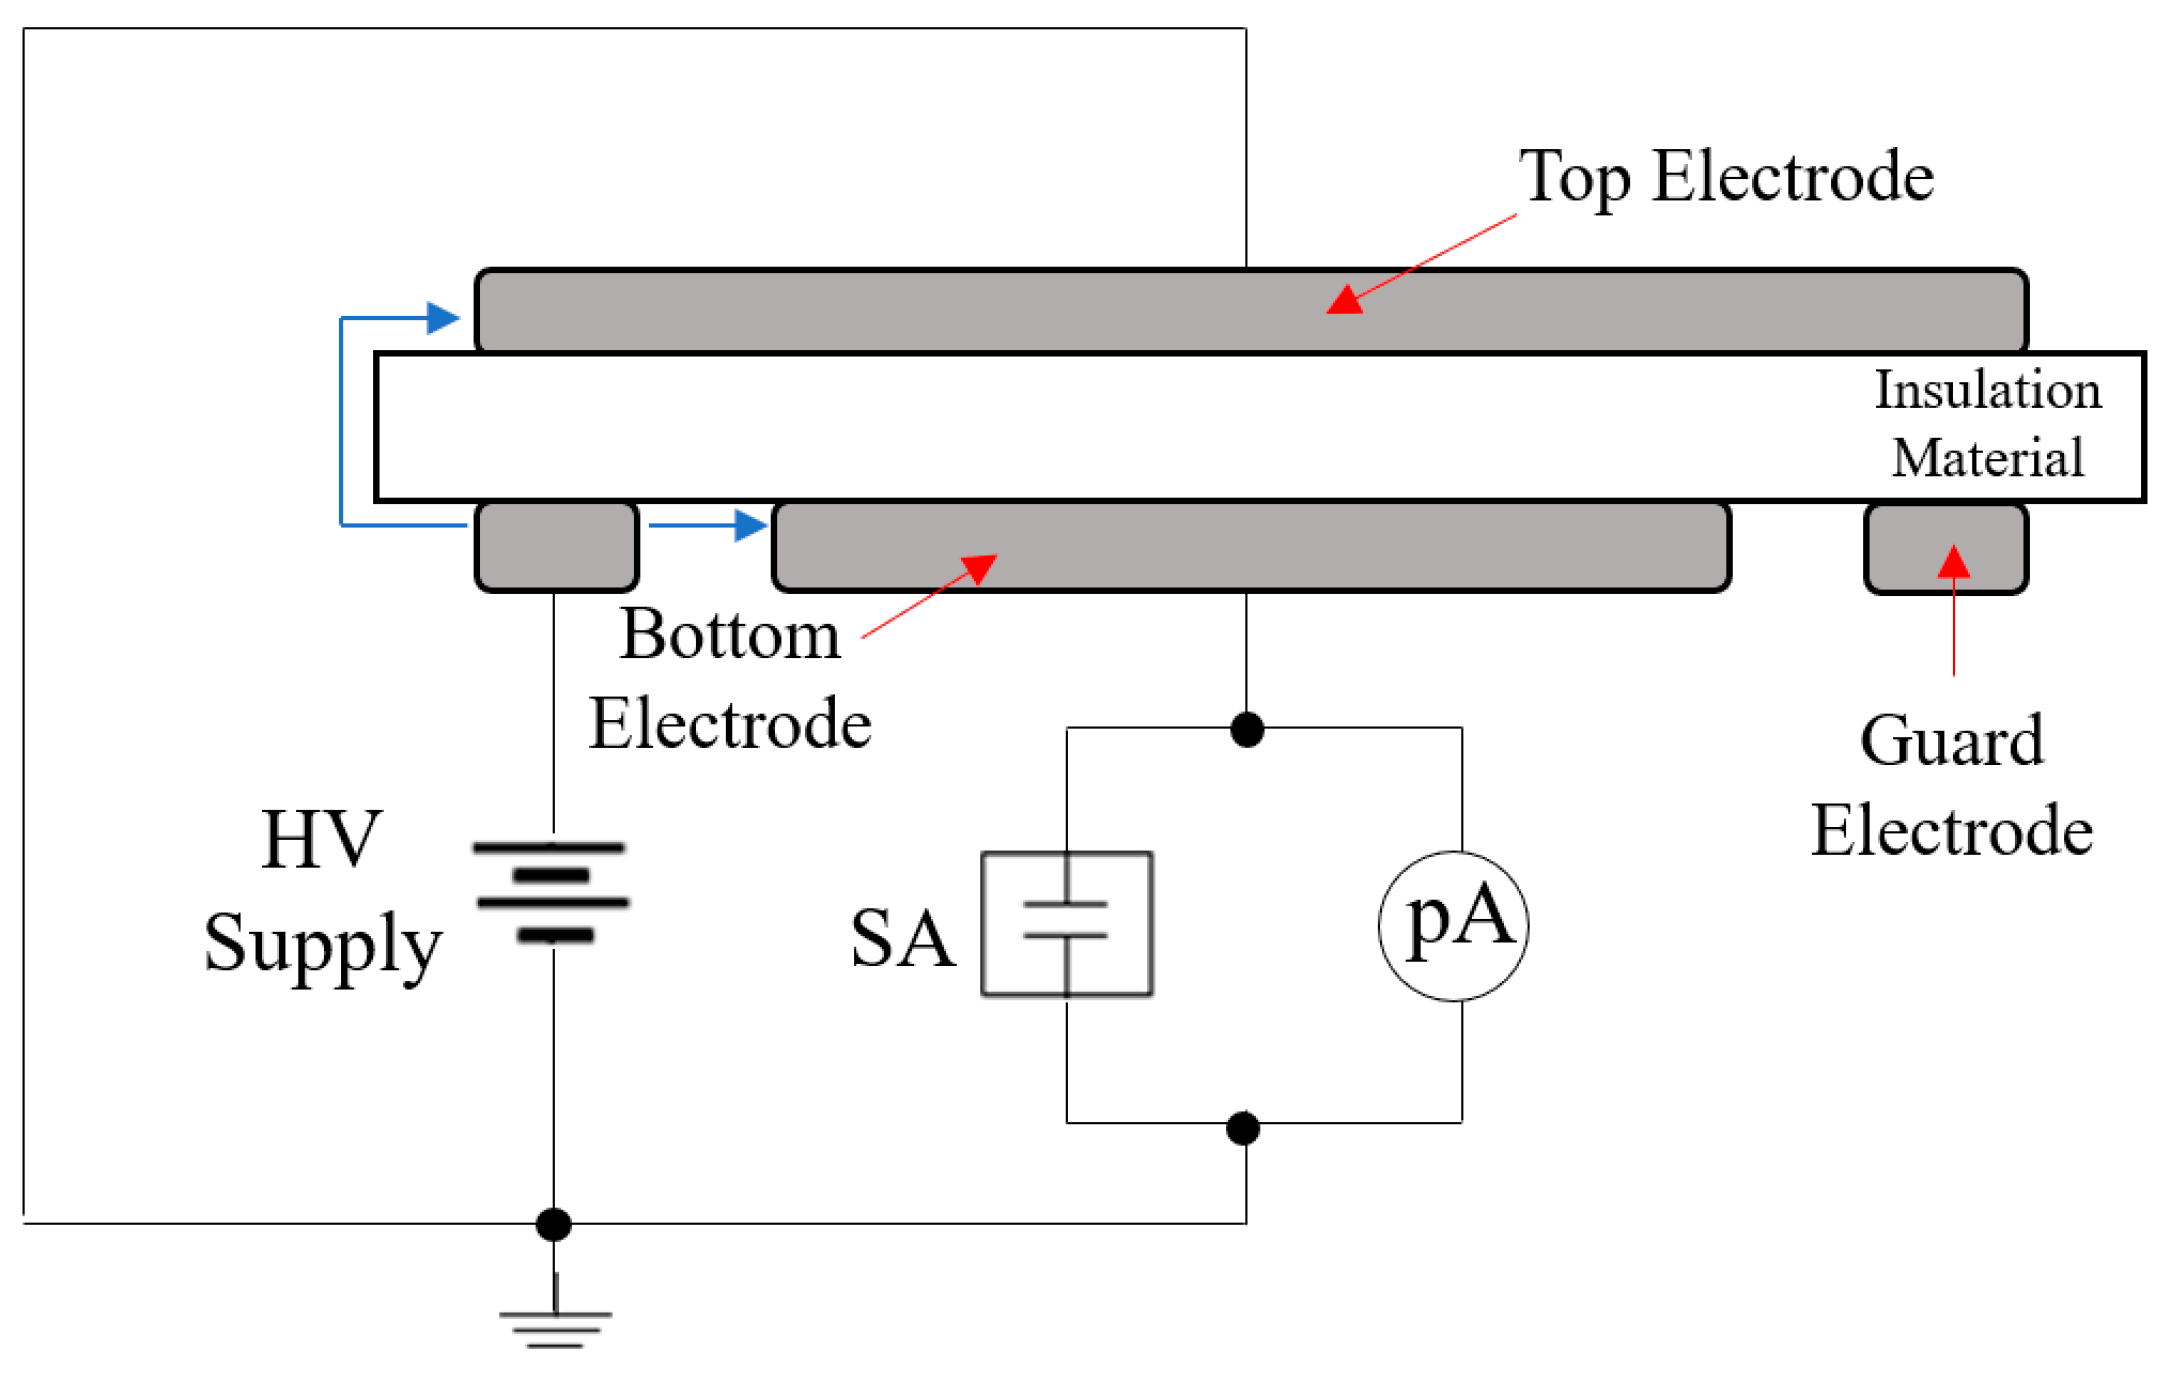
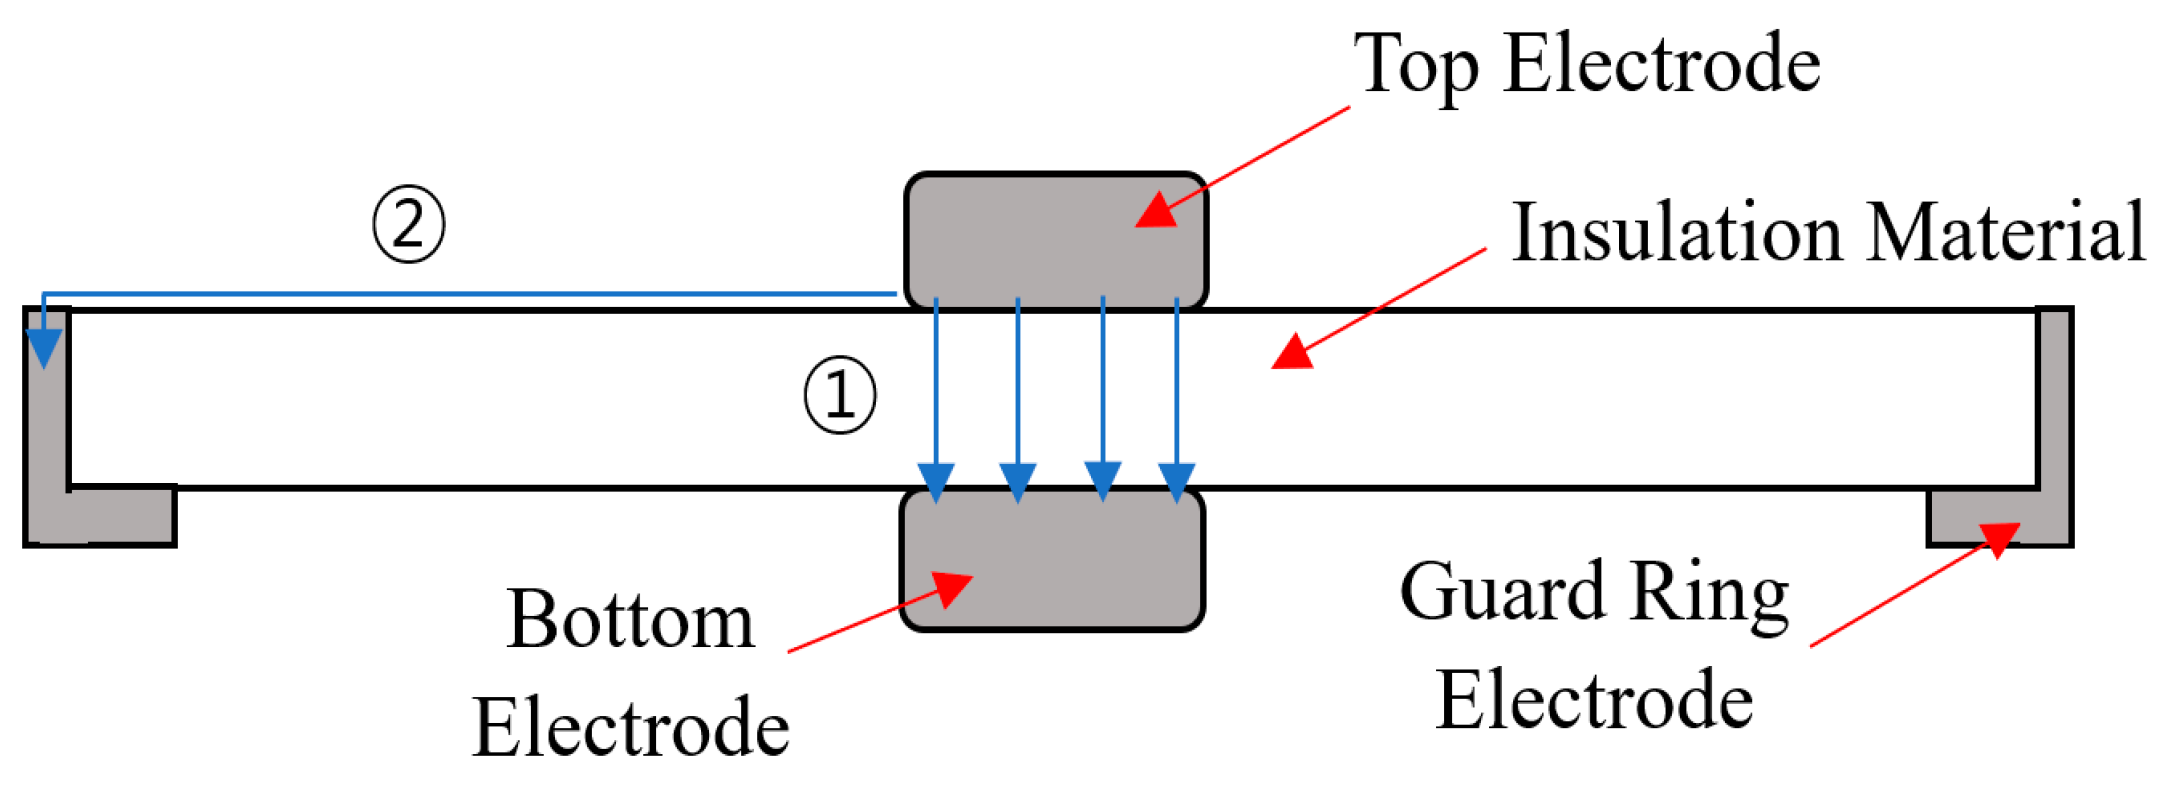
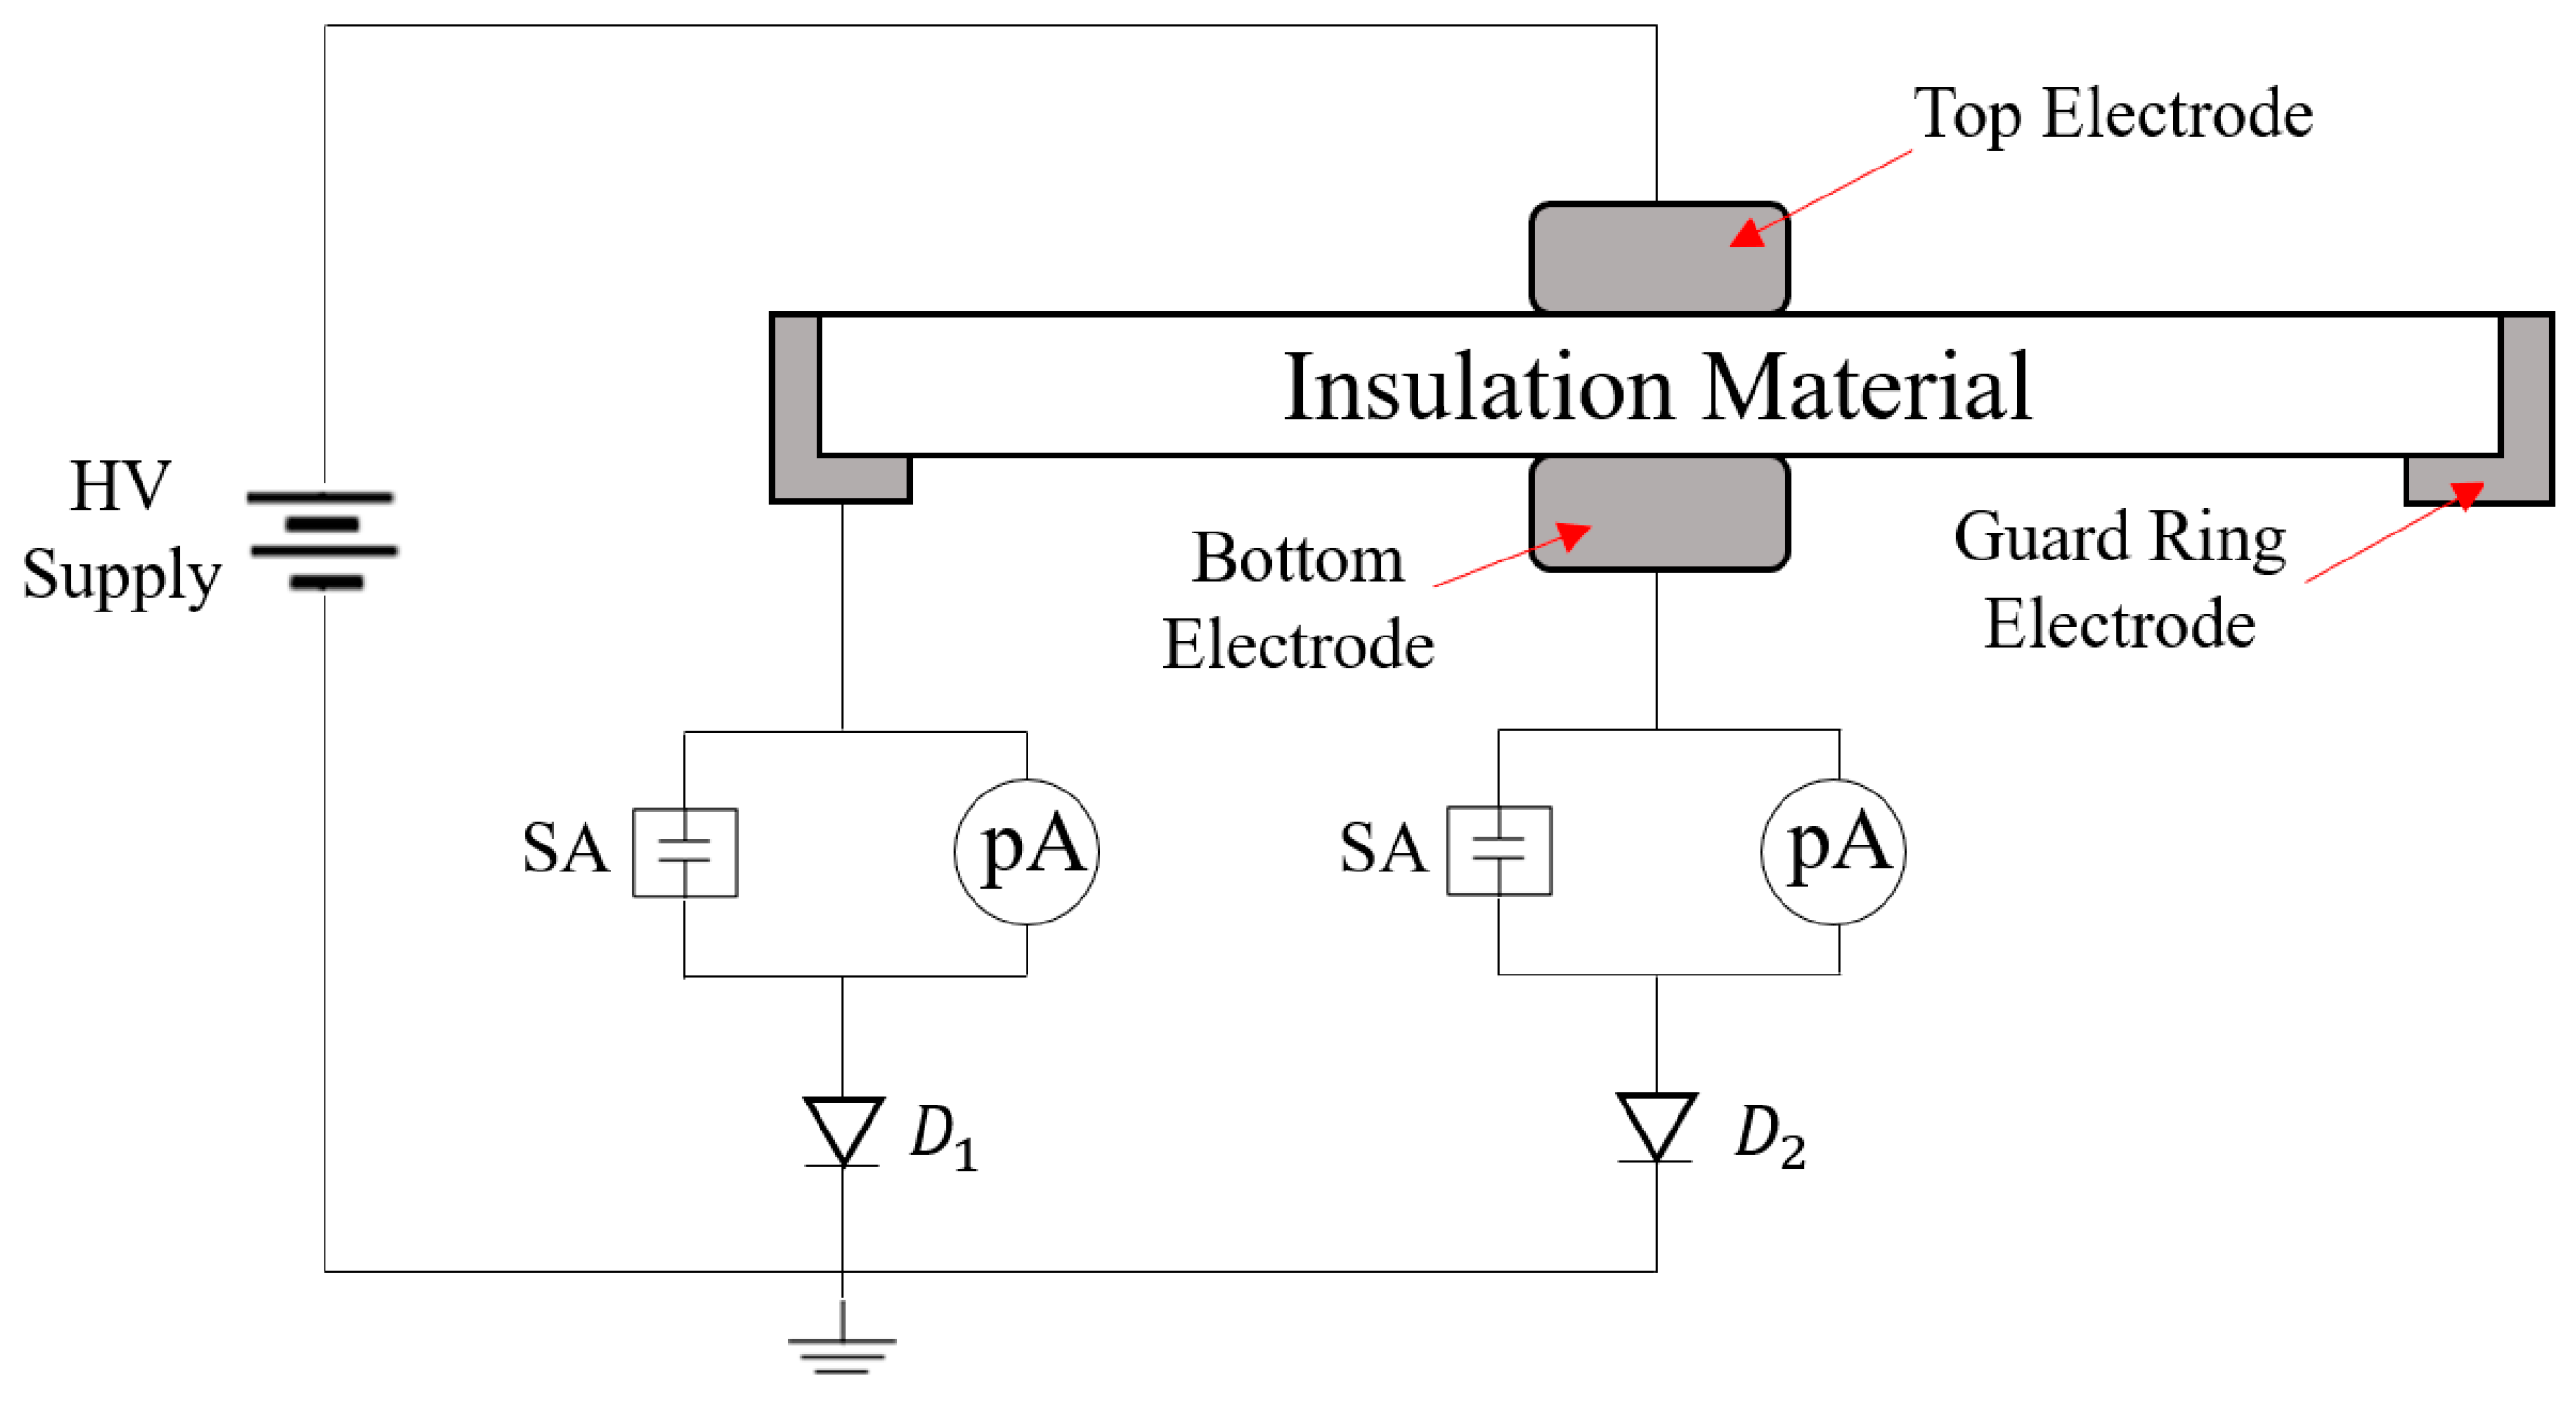
2.2.3. Guard-Ring Terminal Electrode Type Resistivity Measurement System
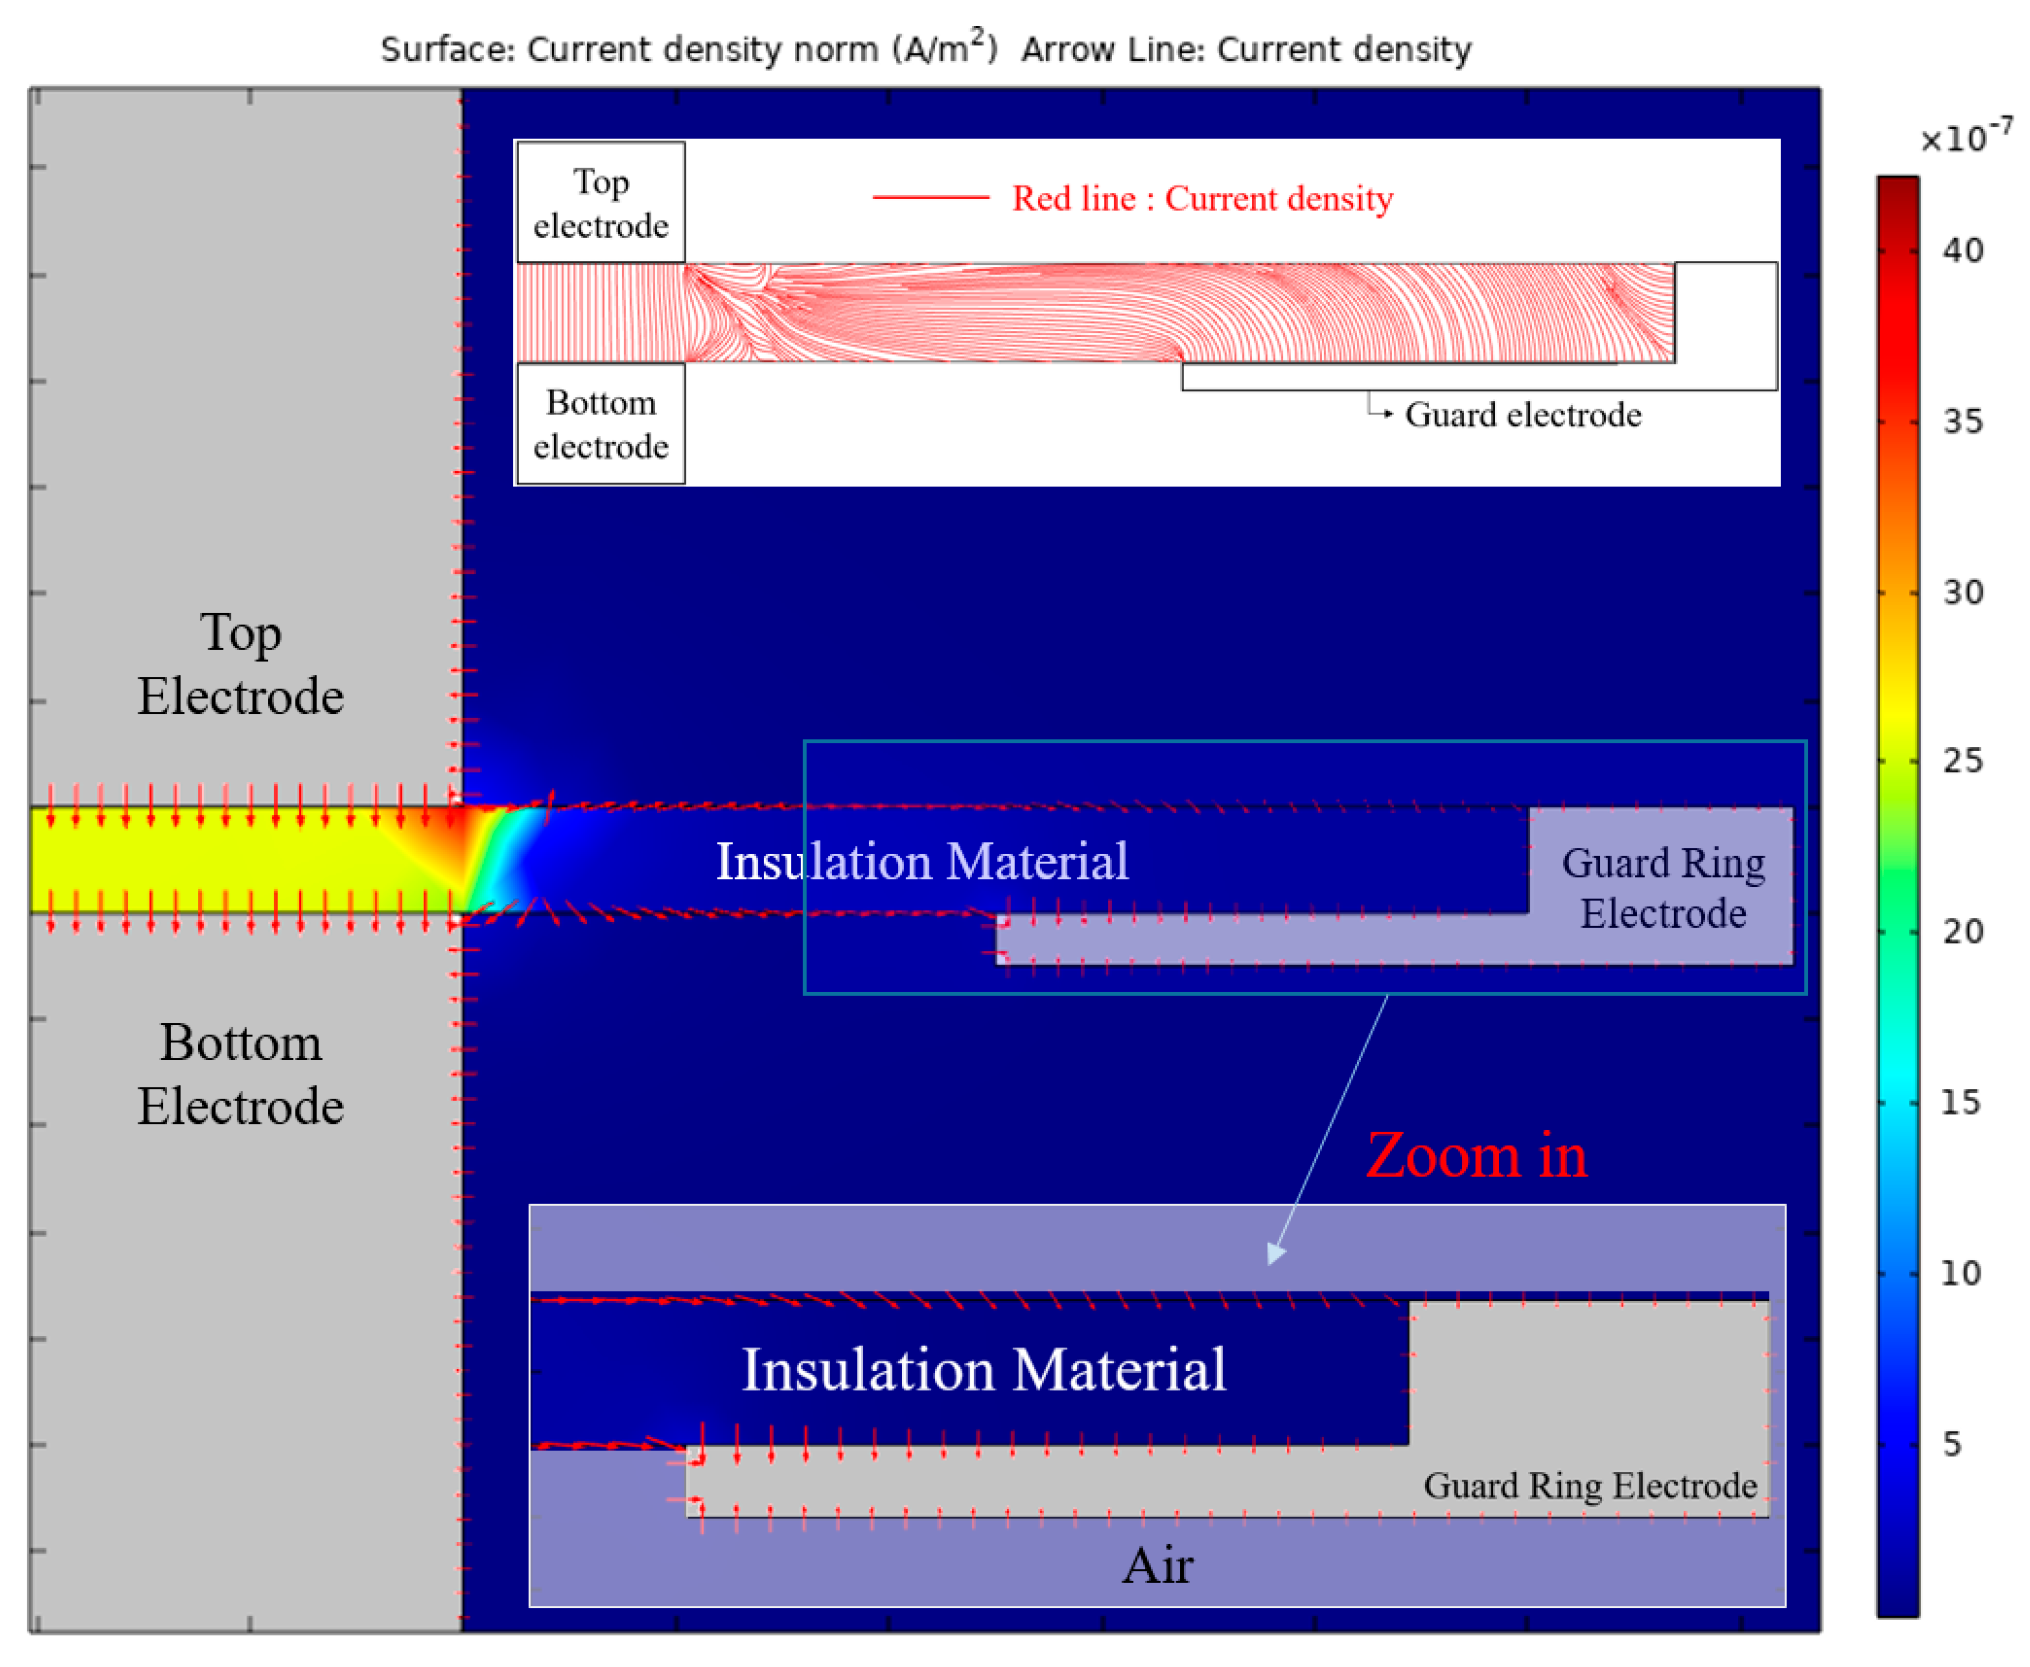
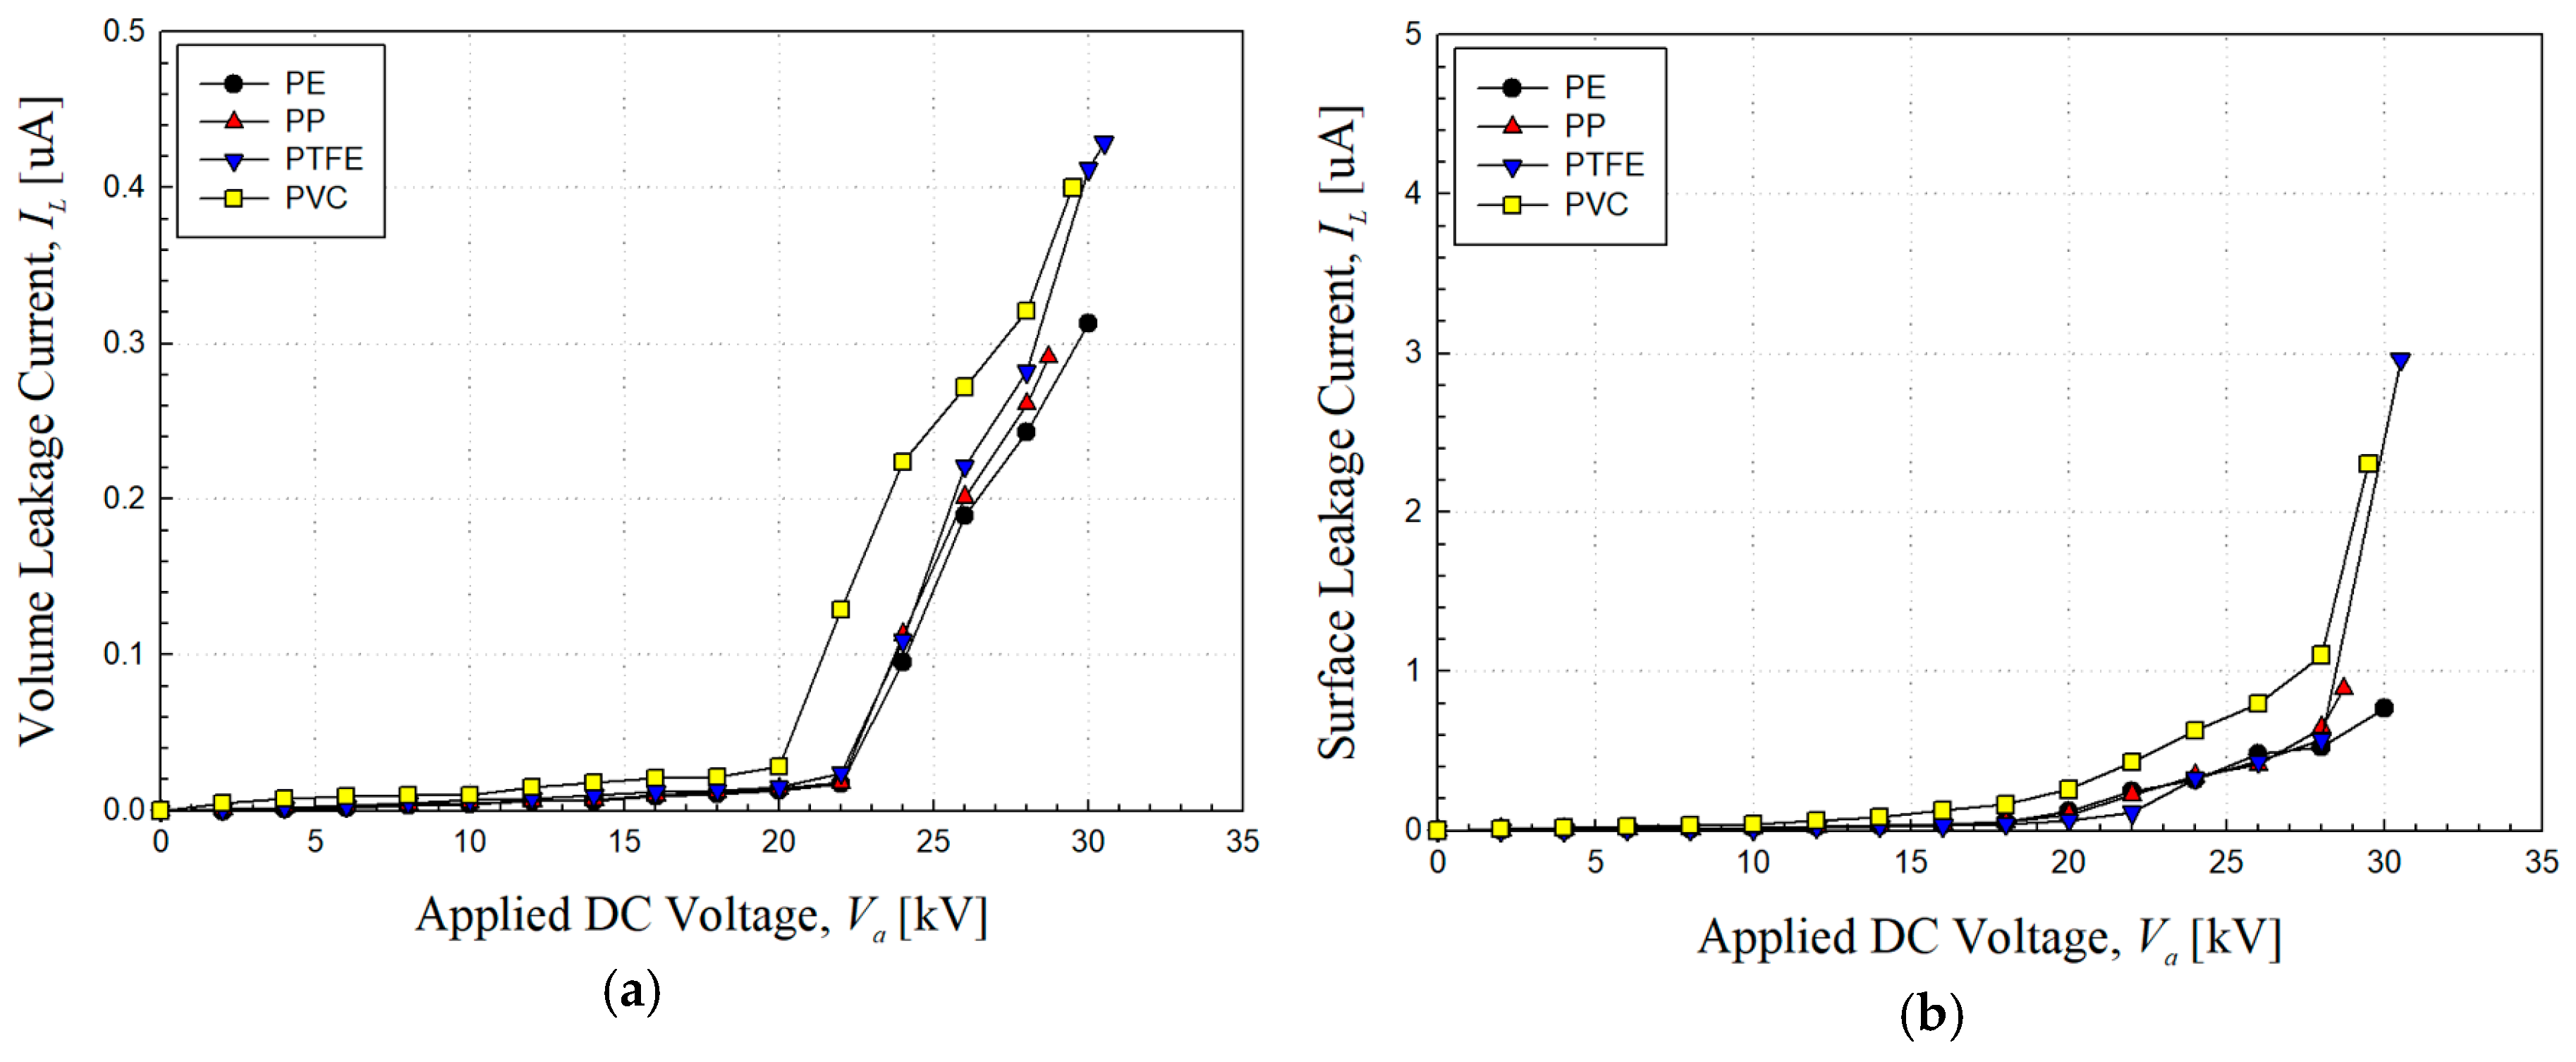
- ① When the voltage for measuring the volume resistivity is applied to the top electrode and to the bottom and guard-ring electrodes, the internal leakage current of the insulator flows through the top and bottom electrodes.
- ② The voltage application method of the surface resistivity measurement is applied in the same way as the volume resistivity measurement. In the surface leakage current of the insulator, a leakage current generated from the top electrode flows along the surface of the insulator to the guard-ring electrode on the side surface.
2.3. Experimental Methods
3. Results and Discussion
4. Conclusions
Author Contributions
Funding
Conflicts of Interest
References
- Erika, P.; Ole, B.; Nasser, N.G.A.; Michael, K. Challenges and opportunities for a European HVDC grid. Renew. Sustain. Energy Rev. 2017, 70, 427–456. [Google Scholar]
- Gonzalez, J.S.; Lacal-arantegui, R. A review of regulatory framework for wind energy in European Union countries: Current state and expected developments. Renew. Sustain. Energy Rev. 2016, 56, 588–602. [Google Scholar] [CrossRef]
- Takashi, O.; Aishah, B.M.I.; Ralph, D.S. Eelectric power grid interconnections in Northeast Asia: A quantitative analysis of opportunities and challenges. Eenergy Policy 2016, 89, 311–329. [Google Scholar]
- Zhonglei, L.; Boxue, D. Polymeric insulation for high-voltage dc extruded cables: Challenges and development directions. IEEE Electr. Insul. Mag. 2018, 34, 30–43. [Google Scholar]
- Wu, R.; Wen, J.L.; Yu, K.; Zhao, D. A discussion of SiC prospects in next electrical grid. In Proceedings of the 2012 Asia-Pacific Power and Energy Engineering Conference, Shanghai, China, 7–29 March 2012. [Google Scholar]
- Muhammad, A.; Adeel, I.; Khan, N.; Muhammad, I. A gerneric scenario of a load flow study in SAARC countries super grid using high voltage alternating current and high voltage direct current. Int. J. Sci. Eng. Res. 2016, 7, 210–223. [Google Scholar]
- Najafi, S.; Saadati, H.; Werle, P. Comparison of acoustical partial discharge signals under AC and DC stress. In Proceedings of the 2016 IEEE Electrical Insulation Conference (EIC), Montreal, QC, Canada, 19–22 June 2016; pp. 523–526. [Google Scholar]
- Xiong, Q.; Zhu, L.; Ji, S.; Cui, Y.; Lu, W. Flashover and partial discharge characteristics of fiber of valve tower in converter station. IEEE Trans. Dielectr. Electr. Insul. 2017, 24, 1985–1991. [Google Scholar] [CrossRef]
- ASTM D257-07. Standard Test Method for DC Resistance of Conductance of Insulating Materials; ASTM: West Conshohocken, PA, USA, 2007. [Google Scholar]
- IEC 60093:1980. Methods of Test for Volume Resistivity and Surface Resistivity of Solid Electrical Insulating Materials; IEC: Geneva, Switzerland, 1980. [Google Scholar]
- Yasushi, Y.; Takeyuki, K.; Masahiro, T.; Shinichi, K.; Kumi, N.; Yoshio, S. Measurement of surface and volume resistivity for alumina ceramics under vacuum condition. In Proceedings of the 2008 23rd International Symposium on Discharges and Electrical Insulation in Vacuum, Bucharest, Romania, 15–19 September 2008; pp. 35–38. [Google Scholar]
- Frederickson, A.R.; Benson, C.E.; Bockman, J.F. Measurement of charge storage and leakage in polyimides. Ioniz. Radiat. Polym. 2003, 208, 454–460. [Google Scholar] [CrossRef]
- Michal, L.; Ryszard, K. Changes proposed for the IEC 60093 Standard concerning measurements of the volume and surface resistivities of electrical insulating materials. IEEE Trans. Dielectr. Electr. Insul. 2003, 13, 139–145. [Google Scholar]
- Michal, L.; Ryszard, K.; Edmund, M.; Pawel, G. Space charge influence on the results of volume resistivity measurements in solid dielectrics. In Proceedings of the XVII IMEKOWorld Congress Metrology in the 3rd Millennium, Dubrovnik, Croatia, 22−27 June 2003; pp. 837–840. [Google Scholar]
- Eichhorn, R.M. Treeing in solid extruded electrical insulation. IEEE Trans. Eelctr. Insul. 1977, EI-12, 2–18. [Google Scholar] [CrossRef]
- Shaw, M.T.; Shaw, S.H. Water treeing in solid dielectrics. IEEE Trans. Eelctr. Insul. 1984, EI-19, 419–452. [Google Scholar] [CrossRef]
- Nunes, S.L.; Shaw, M.T. Water treeing in polyethylene-A review of mechanisms. IEEE Trans. Eelctr. Insul. 1984, EI-19, 419–452. [Google Scholar] [CrossRef]
- Murata, Y.; Goshowaki, W.; Reddy, C.C.; Sekiguchi, Y.; Hishinuma, H.; Hayase, Y.; Tanaka, Y.; Takada, T. Investigation of space charge distribution and volume resistivity of XLPE/MgO nanocomposite material under DC voltage application. Int. Symp. Electr. Insul. Mater. 2008, EA-3, 502–505. [Google Scholar]
- Chen, X.; Morshuis, P.H.F.; Smit, J.J.; Marquezin, G.; Girodet, A. Electrical properties calculation of HVDC bushing. In Proceedings of the 2010 Annual Report Conference on Electrical Insulation and Dielectic Phenomena, West Lafayette, IN, USA, 17–20 October 2010. [Google Scholar]
- Michal, L. Issues of volume resistivity measurement of solid dielectrics and evaluation of uncertainty of results by approximate method at a confidence level of 0.95. Metrol. Meas. Syst. 2009, 16, 233–248. [Google Scholar]
- Michal, L.; Adam, S. Effective area of thin guarded electrode in determining of permittivity and volume resistivity. IEEE Trans. Dielectr. Electr. Insul. 2009, 16, 24–31. [Google Scholar]
- Sirvio, P.; Backfolk, K.; Maldzius, R.; Sidaravicius, J.; Montrimas, E. Dependence of paper surface and volume resistivity on electric field strength. J. Imaging Sci. Tech. 2008, 52, 30501-1–30501-8. [Google Scholar] [CrossRef]
- Peter, P.; Randall, R.B. Using field theory to measure surface resistivity of high-resistance polymeric films. J. Appl. Polym. Sci. 2001, 82, 2856–2862. [Google Scholar]
- Toshiyuki, S.; Makoto, A.; Yoshio, H. Noncontact surface resistivity measurement using a cylindrical surface potential detector with a corona charger. IEEE Trans. Ind. Appl. 2012, 48, 1657–1661. [Google Scholar]
- Floran, V.; Gerhard, M.S.; Halil, S. The influence of electron-beam irradiation on the volume resistivity of polyethylene and kapton. J. Electrost. 2005, 63, 749–754. [Google Scholar]
- Lee, S.-H.; Jang, S.-M.; Choi, J.-Y. Improvement of measuring capacity of the DC high-voltage divider for a national high-voltage standard. J. Trans. Korean Inst. Electr. Eng. 2014, 63, 1622–1625. [Google Scholar]


| Item | |
|---|---|
| Top electrode | diameter: 60 mmΦ |
| Bottom electrode | diameter: 60 mmΦ |
| Guard-ring electrode | inner diameter: 90 mmΦ outer diameter: 100 mmΦ highest: 1 mm |
| Insulation material | diameter: 100 mmΦ thickness: 1 mm |
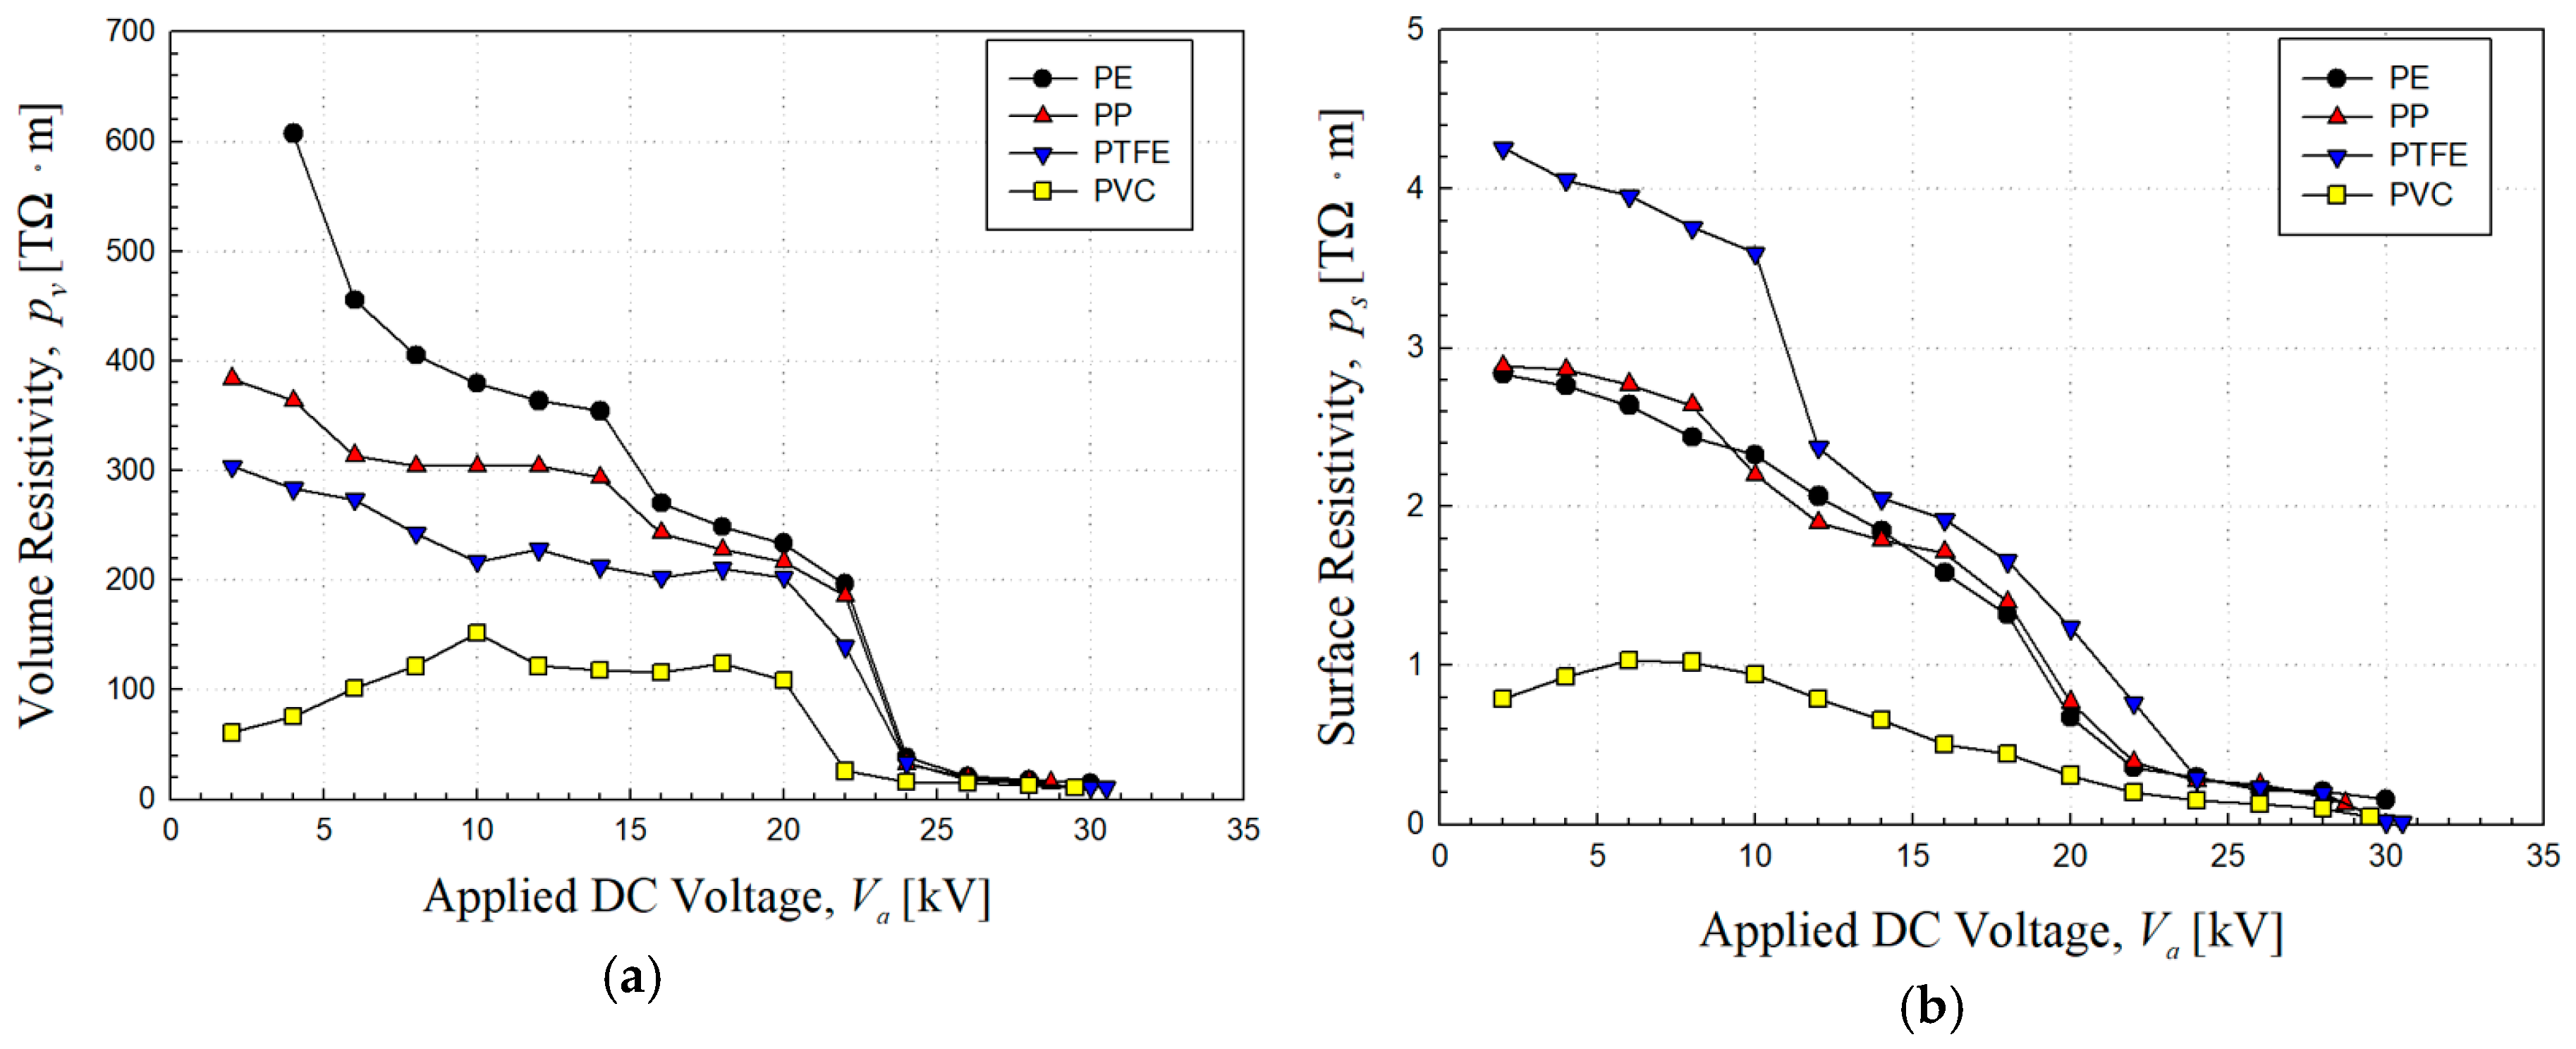
| Materials | Volume Resistivity | Standard Devation | Surface Resistivity | Standard Devation |
|---|---|---|---|---|
| PE | 233.46 TΩ·m | 11.87 | 1.32 TΩ·m | 0.094 |
| PP | 227.62 TΩ·m | 9.42 | 1.40 TΩ·m | 0.063 |
| PTFE | 210.11 TΩ·m | 10.38 | 1.66 TΩ·m | 0.076 |
| PVC | 124.16 TΩ·m | 10.86 | 0.44 TΩ·m | 0.088 |
© 2020 by the authors. Licensee MDPI, Basel, Switzerland. This article is an open access article distributed under the terms and conditions of the Creative Commons Attribution (CC BY) license (http://creativecommons.org/licenses/by/4.0/).
Share and Cite
Lee, H.-G.; Kim, J.-G. Volume and Surface Resistivity Measurement of Insulating Materials Using Guard-Ring Terminal Electrodes. Energies 2020, 13, 2811. https://doi.org/10.3390/en13112811
Lee H-G, Kim J-G. Volume and Surface Resistivity Measurement of Insulating Materials Using Guard-Ring Terminal Electrodes. Energies. 2020; 13(11):2811. https://doi.org/10.3390/en13112811
Chicago/Turabian StyleLee, Heon-Gyeong, and Jin-Gyu Kim. 2020. "Volume and Surface Resistivity Measurement of Insulating Materials Using Guard-Ring Terminal Electrodes" Energies 13, no. 11: 2811. https://doi.org/10.3390/en13112811
APA StyleLee, H.-G., & Kim, J.-G. (2020). Volume and Surface Resistivity Measurement of Insulating Materials Using Guard-Ring Terminal Electrodes. Energies, 13(11), 2811. https://doi.org/10.3390/en13112811