Abstract
This article presents the results of experimental research on energy consumption of a prefabricated lightweight passive house located in the south of Poland. The key design parameters of the building were as follows: orientation maximizing heat gains from solar radiation, high thermal insulation of partitions, heat provided by ground source heat pump, and mechanical ventilation system with the heat exchanger. The measurements were performed in normal operating conditions in an inhabited building, throughout the years 2011–2019. For the year 2012, the article also presents the detailed structure of electricity used for particular devices. The objective of the research was to verify whether, in the long term, the building fulfils the energy consumption requirements for passive buildings. The measurements showed that energy consumption for heating was 50% lower than the value required from passive buildings. However, primary energy consumption for the entire building was exceeded already in the second year of research. This was caused by two factors: human behaviors and the type of primary energy source. The research concludes that the maintenance of passive house standard is vulnerable to human impact and difficult in the case of power source characterized by high index of expenditure on non-renewable primary energy. The article also presents recommendations on how to restore the passive house standard in the building.
1. Introduction
The building sector is receiving increasing attention in policies for sustainable development across the globe. This attention arises from its energy consumption and greenhouse gas (GHG) emissions, which in developed countries represent 30% and 40% of the total values, respectively. The Energy Performance of Buildings Directive (EPBD) [1] aims to improve the overall efficiency of buildings, taking into consideration local conditions, indoor climate, and cost-effectiveness. It is considered that the use of renewable energy in buildings and the promotion of energy-efficient buildings are the best means for resolving the global challenge of climate change and eliminating CO2 emissions. While there is consensus that the use of energy by buildings and their environmental impact must be reduced, there have been many discussions in the recent years as to the proper means of achieving this. Specifically, the debates [2,3] have focused on the advantages and disadvantages of low-energy buildings, net-zero energy buildings (NZEB), nearly Zero Energy Buildings (nZEB), Passive Houses (PH), green buildings, solar houses, sustainable buildings, and energy-plus buildings. All of these concepts are convincing by themselves, as proven by the large number of exemplary projects around the world. However, we can observe varying definitions for the abovementioned terms in different countries. In fact, they are often confused with each other [4].
EPBD [1] promotes the nZEB approach. According to this directive, a “nearly zero-energy building” means a building with very high energy performance and nearly zero or very low amount of energy required, which should be supplied, to a very significant extent, from renewable sources, especially from renewable sources produced on-site or nearby. There are many review papers in the literature which have addressed the different aspects of nZEB building design [5,6,7,8], energy performance [9,10] and energy production [11,12,13,14], and optimization methods [15,16,17,18,19]. Marszal et al. [3] presented the definitions and calculation methodologies of zero energy buildings (ZEBs). Many studies have reviewed energy use in buildings from different climate regions [20,21]. Transformation of existing buildings to nZEB was presented, among others, in References [22,23].
A passive building, by definition, is distinguished by heating- and cooling-related energy savings of up to 90%, as compared to traditional buildings, and over 75%, as compared to average new buildings [24]. Since energy efficiency means reduction of energy consumption and reduction of greenhouse gas emissions, the PH standard has emerged as a key enabler for the nZEB standard. The combination of PH with renewables represents a suitable solution to move to low/zero carbon. Passive houses, indeed, focus on energy-saving instead of energy production, which is also the path paved by the European legislation in its environmental targets [25]. The PH standard thus fulfils the requirements of the EU Energy Performance of Buildings Directive in every possible respect, thereby forming the ideal basis for nZEB.
A PH is designed to have an energy demand that is as low as practically achievable. This is mainly based on its efficient design, by means of high levels of thermal insulation, low heat transfer coefficient of windows, airtightness of the building envelope, and mechanical ventilation system with heat recovery. Furthermore, attention is paid to thermal bridge elimination.
Passive houses require less than 15 kWh·m−2·year−1 for heating or cooling [24,26] (Table 1), and the heating or cooling peak load is limited to a maximum of 10 W·m−2. For a building to be considered a PH, its conventional primary energy use must not exceed 120 kWh·m−2·year−1. The standard allows excessive temperatures for 10% of the cooling period in warmer climates [26]. With such a small amount of energy to be supplied, it is easier to meet the subsequent demand by renewable sources.

Table 1.
Parameters of a passive building [24,26].
Passive House Planning Package (PHPP) is a tool that helps to verify if the design assumptions comply with the passive building standard [27,28,29,30]. As a result of this verification, appropriate corrections and changes can be made at the design stage, to ensure that the object meets the assumed standard.
The performance of PH has been one of the very popular research subjects of building physicists. At the end of the 1980s, a team of scientists led by Feist initiated a project called “Passive”, as a result of which the first passive building was built in 1991 [31,32]. An example of international scientific cooperation was the research program COPHEUS (Cost Efficient Passive Houses as European Standards). This project tested the behavior of 100 apartments in 11 passive building complexes in various European countries [33,34,35,36]. More recent papers have addressed different aspects related to sustainable building design and optimization. The vast majority of the passive-house-related studies currently focus on the following topics: thermal performance under diverse climatic conditions [37,38,39,40]; indoor environment [41,42,43,44]; life-cycle assessment (LCA) and costing (LCC) [45,46,47,48,49]; comparative assessment with zero energy buildings [2,50,51]; integration of renewable energy technologies (RET) [52,53]; upgrade of historic buildings to the standard [54,55]; or investigation of building materials performance [56,57,58,59].
The energy performance of a building is expressed typically with specific energy demand in kWh·m−2·year−1. In the literature, there have been several proposals on introducing indicators for measuring building energy performance: Energy Efficiency Index (EEI) was proposed in Reference [60]. Another term, the relative energy index (EEIB), was proposed in Reference [61]; it is defined as the ratio between energy use and CO2 emissions of the actual building and the reference building that can be used for a common framework of a certification scheme. Instead of the reference building value, it is also possible to use a national energy performance requirement. The EPBD requires the use of primary energy factor (PEF) for all countries [1]. It is calculated as the inverse ratio between the amount of delivered energy and the primary energy required to provide it.
The description of a residential building energy demand firstly involves the identification of the specific energy end uses. According to statistics, the energy end uses relevant to the residential sector include the following: space heating and cooling, water heating (domestic hot water), lighting, cooking, refrigeration, and the use of other appliances (including computers and multimedia devices). The pie charts in Figure 1 and Figure 2 show the estimated energy use in the residential sector in Europe in 2007 and the United States in 2005, respectively [62].
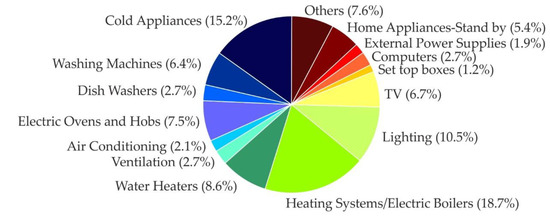
Figure 1.
Breakdown of EU residential electricity consumption, year 2007 [62].
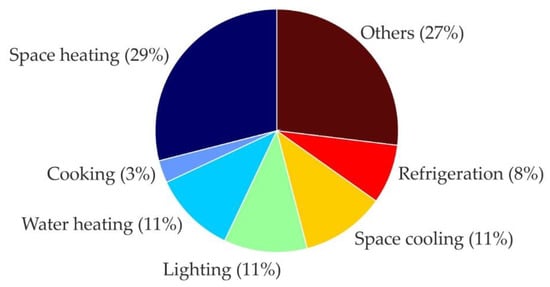
Figure 2.
Breakdown of residential sector energy use in United States [62].
It is important that the process of reducing energy consumption of a building concerns the entire “building life cycle”, i.e., the stage of construction, operation, and utilization [63]. Wood-frame construction fits into the above trend. The construction of partitions allows obtaining much better insulation parameters at the same wall thickness as in brick partitions, because thermal insulation fills most of the cross-section. In this type of building, a high energy-saving standard can be achieved relatively easily.
This paper presents the results and analysis of long-term experimental measurements on energy use by a building designed and constructed within the research project “Passive house for everyone”. The manuscript focuses on detailed measurement results for technical systems and home appliances in the passive building and discusses the impact of their energy use in maintaining the passive house standard.
The building design assumed the Passive House Standard (PHS), while construction costs should not be higher than 120% of typical low-energy house with similar usage and geometry. The PHS was confirmed by calculations, using PHPP software [28], and some more simulations, using WUFI®PLUS [64], were carried out to predict inner climate conditions and energy use. While calculations and simulations make it possible to determine the hypothetical energy consumption, only experimental studies reveal the actual data on the building performance. It is important that measurements are carried out under real climate and operating conditions.
2. Materials and Methods
2.1. Case Study
The tested building is located in Southern Poland, in the village of Boruszowice, the Silesia Province. It is a single-family residential building with a light wooden structure. It was built in 2010, using prefabrication technology. The two stories have a usable area of 119.9 m2 (Figure 3). The rooms on the ground floor are 2.6 m high, while those on the first floor are 2.5 m high. The building has no basement. The floor consists of a 25 cm thick reinforced concrete slab laid on a 50 cm layer of hardened (extruded) polystyrene.
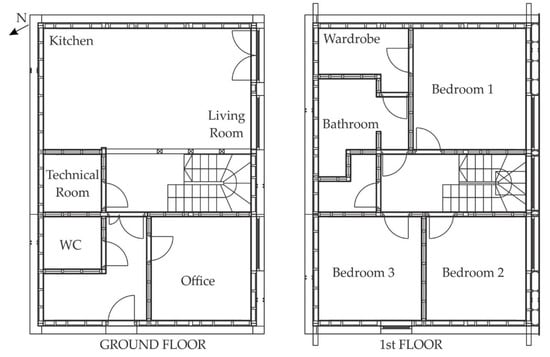
Figure 3.
Ground floor and first floor plan.
The outer walls have a timber frame structure (Figure 4), with pillars and beams stiffened with panels, and insulated with mineral wool. The inside panel is covered by a plasterboard, and on the outside, there is additional insulation along with the finish system. In order to test different structure solutions, 8 versions of partitions were used, which involve combinations of different insulation materials, different insulation thicknesses on the outside, and various types of vapor barriers. To ensure appropriate quality of insulation and minimize the effect of thermal bridges, the windows were installed in the walls at the prefabrication stage. Figure 5 shows the installation of external walls and the final facade of the building.
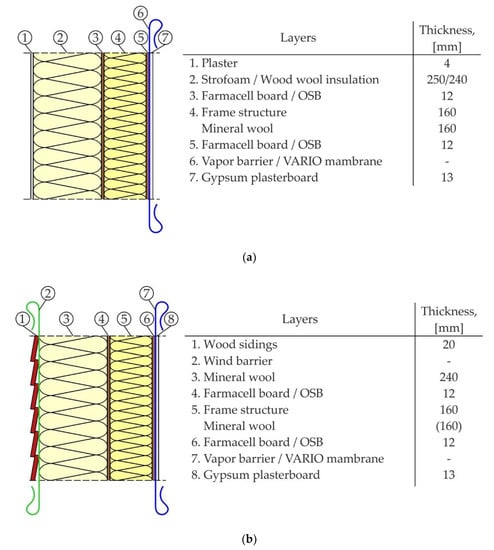
Figure 4.
Assembly of the outer wall: external plaster finishing (a); siding on external surface (b).
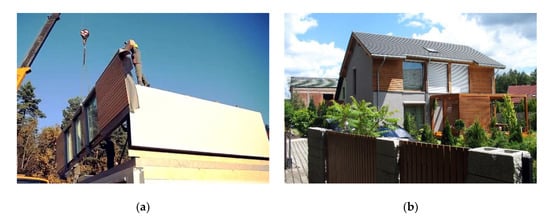
Figure 5.
Installation of prefabricated building elements (a); southwest facade after construction (b).
The building design (Table 2) meets the requirements of the PH standard [26]. For all construction variants, the average heat transfer coefficient for opaque building components equals 0.08 W·m−2·K−1, and for windows 0.74 W·m−2·K−1.
Table 2.
Design parameters of the studied building.
Active systems include heating, domestic hot water (DHW) production, and mechanical ventilation. Heat production is based on a ground source heat pump (with direct evaporation). The building is not equipped with an active cooling system. Reduction of the overheating effect is to be ensured by mechanical ventilation with a ground heat exchanger. Installation of photovoltaics or/and solar collector on the roof was considered, but due to relatively high costs, no renewable energy source was applied. After the construction was completed, the building was inhabited by a family of four (parents + two children). The family grew by one more child in 2012.
2.2. Experimental Research
From 2011 to 2013, comprehensive experimental research on hygrothermal performance and energy use of the building was carried out. The measurements provided, among others things, detailed results on energy use by active systems for the studied period. Later, starting from 2014, only total energy consumption by the house was registered.
In total, 158 sensors were installed in the building, to monitor a number of parameters, such as indoor climate (temperature, humidity, and radiation temperature) and outdoor climate parameters (air temperature and relative humidity, total and diffuse solar radiation, and wind speed and direction). The hygrothermal conditions were measured in eight cross-sections of the outer walls and in two sections of the roof slope [58]. Performance of a ventilation system equipped with a ground heat exchanger was also investigated. The results of experimental research and simulation of the ventilation system are described in Reference [65]. This paper presents the results of the energy consumption analysis for active microclimate control and DHW production.
Despite the small plot area, the land around the building is widely used as an energy source for the heat pump, as well as an effective heat store (winter–summer) for the heat exchanger of the ventilation system (Figure 6).
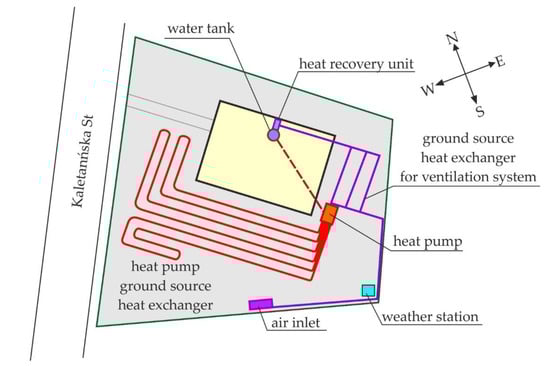
Figure 6.
Location of heat pump pipes and ground heat exchanger around the building.
Figure 7 shows a schematic diagram of the systems. The heat pump (NEURA ProD6EuE®—Table 3) supplies heat to the buffer tank type PRO-CLEAN® (volume 500 l). The geometry of the tank allows for the use of temperature stratification. The tank is supplied with water at two points: at the top and at half of its height. The separation is controlled by means of a three-way valve controlled automatically, depending on the instantaneous temperature distribution in the tank and the supply temperature. Return water is also collected by using a three-way valve from two points, above half the height and from the bottom of the tank. The buffer tank supplies the other elements of the system, i.e., the ventilation air, water heater, and underfloor heating. DHW is provided by flow through heat exchanger (spiral) inside the tank. The ventilation system is equipped by the heat recovery unit (Paul Novus (F) 300®—Table 3).
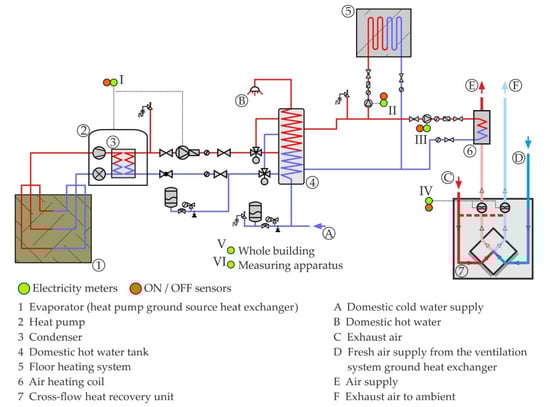
Figure 7.
Active systems: 1-7main elements, A–F flows, I–VI electricity use measurements.
Table 3.
NEURA ProD6EuE® heat pump parameters.
During the research, two types of pulse counters were used. The first one is the Lem-10 model registering 3-phase current, while the second one is the Lem-02 model registering 1-phase systems. Their basic parameters are presented in Table 4.
Table 4.
Basic parameters of Lem-10 and Lem-02 m.
To determine the energy consumption of individual active system components, 6 sensors measuring electricity consumption have been built into the installation (sensors I–VI—Figure 7) and device operation time (ON/OFF) sensors.
Six electricity meters have been installed in the building, four of which are in the active systems. The first three-phase meter measured electricity consumption by the heat pump. The other single-phase meters measured electricity consumption by the water heater and floor heating circulation pumps, and another meter measured the use of electricity by the heat recovery unit (fans and the device controller). On top of that, two additional meters have been installed: one three-phase measuring the total energy consumption in the building and a single-phase measuring the use of energy by the measuring devices, i.e., the server for monitoring and registration of data and internet router for data transmission.
Apart from electricity meters, four additional sensors have been installed to record device operation time. They recorded an ON/OFF state at one-minute intervals. These sensors have been installed for the heat pump, circulation pumps, and the heat recovery unit. The collected data made it possible to determine working time of the abovementioned devices per year. Most of the technical devices and measuring equipment were placed in the technical room (Figure 3).
The article presents detailed results of energy consumption in 2012. In the selected year, there were no failures of the measuring apparatus, hence gap-free, continuous results could be obtained.
3. Results and Discussion
3.1. Outdoor and Indoor Temperature
3.1.1. External Air Temperature
The year selected for the analysis was characterized by the largest variability of outside air temperature from the total nine-year research period. The minimum temperature recorded was −28.2 °C, and the maximum was 36.2 °C (Figure 8). The coldest month (with an average temperature of −7 °C) was February, and the warmest was July (with the average of 19.8 °C). Annually, negative temperatures accounted for 18.9% of all the measurement results; 38.1% were in the range of 0–10 °C; 29.3% in the range of 10–20 °C; and 12.3% in the range of 20–30 °C; while temperatures higher than 30 °C constituted 1.4% of all the measurement results.
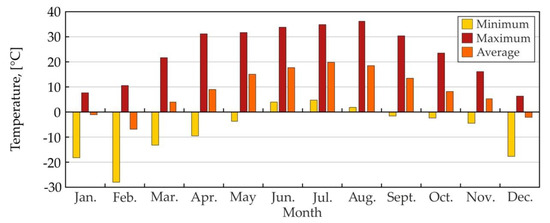
Figure 8.
Monthly maximum, minimum, and average values of the outside air temperature measured in situ.
The measured climate was compared with two statistical climates: for Częstochowa (TMY_1-POL_SL_Czestochowa-Rudniki.AP.125500_TMYx.epw) and Katowice (TMY_2-(and POL_SL_Katowice.Intl.AP.125600_TMYx.epw) [66], as the Boruszowice village is located between these cities, at the distance of about 60 km from each of them. As shown in Figure 9, the average annual temperature coincided with the average for TMY (8.4 °C), also the 25th and 75th percentile values coincided for all three climates. However, the data for the amplitude differ significantly. The maximum temperature measured in situ was higher than the maximum temperature in TMY by about 6 °C, while the lowest was below that of TMY by over 10 °C.
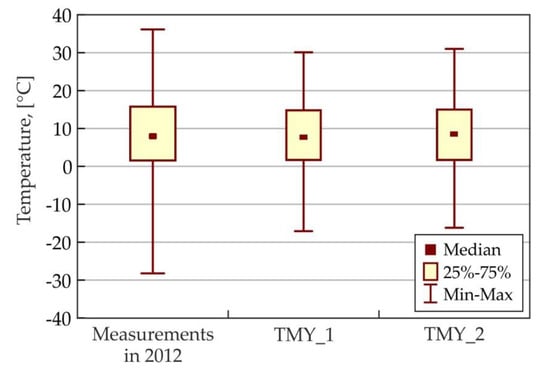
Figure 9.
Median, 25th and 75th percentile, and temperature extremes for measured external climate in 2012, TMY_1, and TMY_2 from the nearest weather stations.
3.1.2. Internal Air Temperature
The temperature inside the building was measured in three representative points: the living room on the ground floor, and in the bedroom and bathroom on the first floor (Figure 3). The temperature in the living room fluctuated within the range 18.5–26.9 °C; for the bedroom, the range was 17.8–27.4 °C, whilst for bathroom, the temperatures from 18.0 to 29.2 °C were registered (Figure 10a). The temperature in the living room was characterized by the lowest variability (standard deviation 1.2 °C); for the bedroom and bathroom, the variation was similar (standard deviation 1.8°C and 1.7 °C, respectively)—Figure 10b.
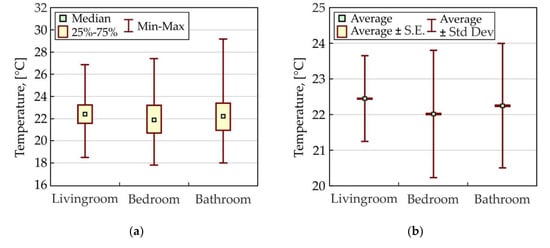
Figure 10.
Basic statistics for indoor air temperature: Median, 25th, and 75th percentile and extremes (a), average, standard error (S.E), and standard deviation (Std Dev) (b).
The temperature range in the living room was, for 99% of the time, within the thermal comfort category II (according to EN 16798-1:2019 [67]). Category I requirements were met for 78% of the heating period (November–March). For the bedroom, category II and I requirements were met for 72% and 36% of the heating season, respectively. In all cases, the lower and upper allowable ranges were exceeded. It should be emphasized that the permissible minimum temperature in the bedroom during the heating period was lowered due to the preferences of residents. The temperature in the bathroom showed the greatest variability. It was maintained at the same level as in other rooms. However, often during bathing, it increased to above 25 °C (Figure 11).
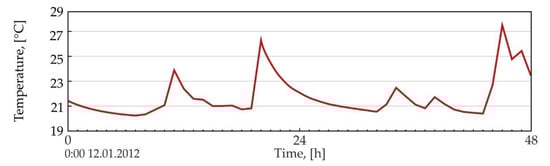
Figure 11.
Bathroom temperature variation for March 12 and 13, 2012.
3.2. Heat Pump—Energy Consumption for Heating and DHW
The heat pump in the building supplies thermal energy, both to the heating system (floor heating and air heaters—Figure 7) and to the production of DHW. The heat pump supplies the buffer tank from which the warm water is directed to the air heater and floor heating system. In the tank, cold water is heated (up to a minimum of 45 °C) by coil flow-through.
For 98% of the 2012 year, hourly electricity consumption did not exceed 1.5 kWh (in 81% was below 0.5 kWh). In the period from 27 January to 12 February and from 8 to 14 December, there was a rapid increase in energy use (Figure 12). Hourly consumption reached 3.7 kWh. This increase corresponds to a drop in outside air temperature below −10 °C.
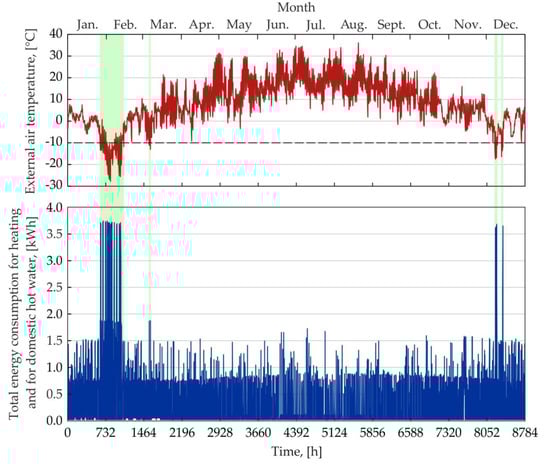
Figure 12.
Hourly energy consumption for heating and DHW production, depending on the outside air temperature.
The total annual electricity consumption of the heat pump to support the two abovementioned systems was 2156.8 kWh. The maximum monthly sum was 451 kWh (for February), and the lowest was 86 kWh (for August).
Separation of energy consumption by the heating system and domestic hot water was only possible with some approximation. The average monthly energy demand in the DHW system was almost constant and amounted to 104.8 kWh (Figure 13a). Having analyzed the operating time of the circulation pumps for the heating system, it was possible to indicate in which months the heat pump worked for both systems, and when only for the needs of DHW. As shown in Figure 13b, the circulation pump worked for both the floor heating and for the air heater only from January to March and from November to December.
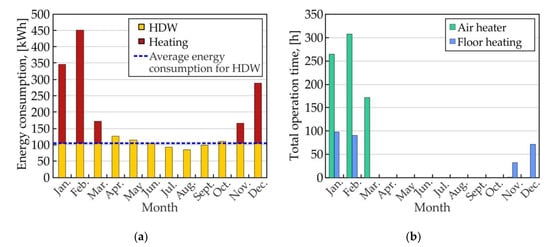
Figure 13.
Monthly electricity consumption by the heat pump for the heating system and DHW (a); operating time of circulation pumps in the heating system (b).
By subtracting, in the months of the heating season, the average value of energy consumption for DHW from the energy used by the heat pump, it was possible to estimate the electricity consumption in the heating system (approximately 888.7 kWh in the year under review). Thus, energy consumption in relation to the heated area was 7.5 kWh·m−2 year−1. This result confirms compliance with the requirement for passive buildings in which the energy consumption for heating should be less than 15 kWh·m−2 year−1.
3.3. Circulation Pump of Floor Heating and Ventilation Air Heating Systems
Electricity consumption in the building was also measured for the circulating pumps supplying energy to the ventilation air heater (annual consumption equaled 22.5 kWh) and for underfloor heating (annual consumption of 20.9 kWh). The maximum hourly energy consumption for the pump in the air heating system did not exceed 0.035 kW (Figure 14a), whilst for underfloor heating, it did not exceed 0.08 kW (Figure 14b).
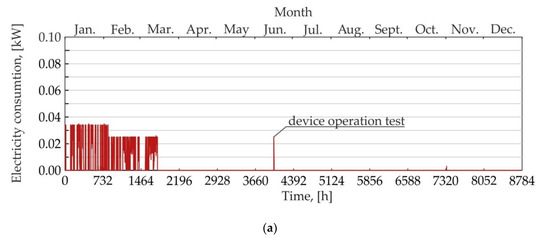
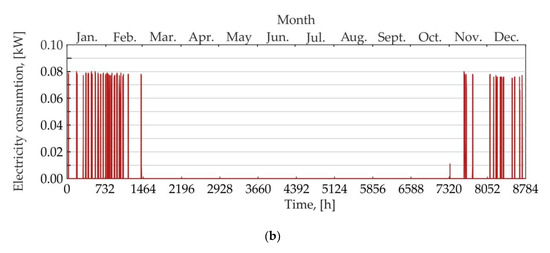
Figure 14.
Hourly energy consumption of the circulator pump in the heating system: for air heater (a) and for floor heating (b).
The pumps worked in the ON/OFF mode. The circulation pump in the air reheating system worked for 822 h during the year, which is 9.4% of time. For the floor heating system, the result was 352 h a year, which is 4%. Energy consumption of the circulator pumps of the floor heating system and air heater has been presented in Figure 15.
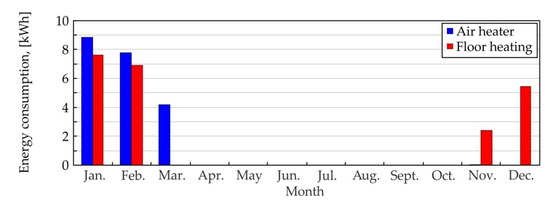
Figure 15.
Monthly energy consumption of the circulator pumps.
3.4. Heat Recovery Unit
Electricity consumption of heat recovery unit includes fan operation, anti-freeze protection, and the unit’s controller. The outside air flowed first through the ground heat exchanger and then was directed to the heat recovery unit (Figure 6). The air temperature at the inlet to the unit during the examined period varied in the range of 5.1–22.7 °C (Figure 16a); therefore, there was no need to run the defrost system. Figure 16b shows temporary differences in temperature at the outlet of the heat recovery unit and inlet to the ground heat exchanger (external air temperature).
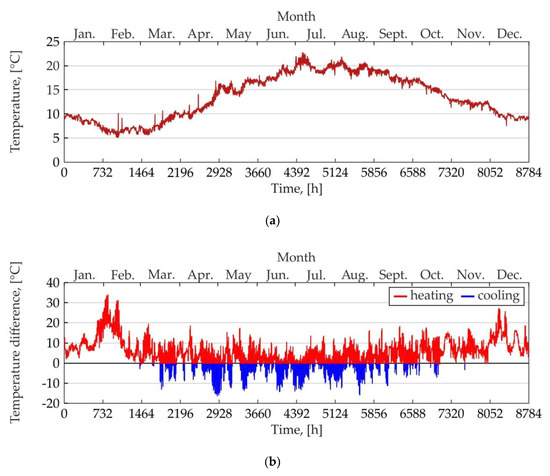
Figure 16.
Inlet temperature to the heat recovery unit after earth–air heat exchanger (a); change in fresh air temperature in the ground heat exchanger (b).
The unit worked throughout the year. Total breaks due to technical control, filter replacement, and sporadic power outages amounted to 19 h, which is 0.2% of the year. Instantaneous hourly electricity consumed by the unit varied in range 0.012–0.14 kW (Figure 17).
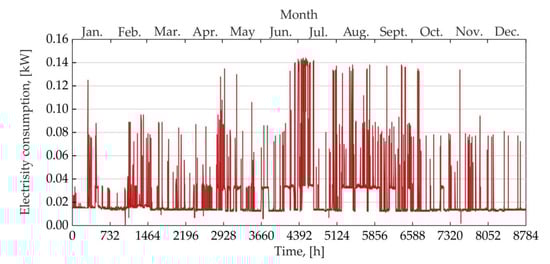
Figure 17.
Hourly electricity consumption of the heat recovery unit.
The unit’s highest energy consumption was in the summer months (average 24.4 kWh·month−1) when the outside air temperature was the highest. For the hottest month (August), consumption was much higher; it amounted to 38.4 kWh (Figure 18). For winter months, the average consumption was 12.0 kWh, and for the spring–autumn transition months, it was 14.3 kWh. The annual energy consumption was 201.5 kWh.
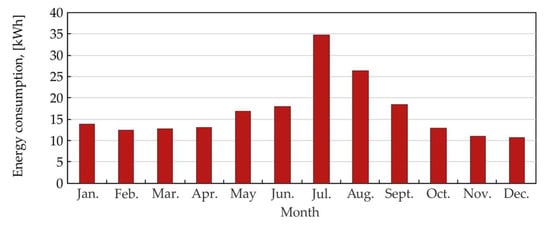
Figure 18.
Monthly electricity consumption of the heat recovery unit.
3.5. Total Energy Consumption
The total energy consumption was continually measured for the whole studied period. Transient power fluctuated in the range of 0.14–4.94 kW during the year (Figure 19). The annual total electricity consumption equaled to 7545 kWh.
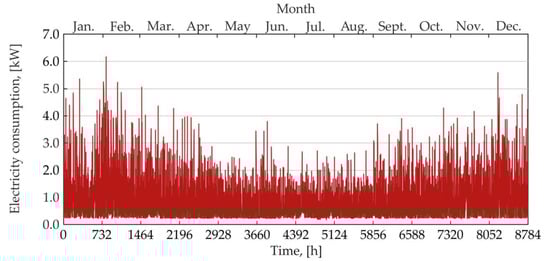
Figure 19.
Instantaneous total electricity consumption.
Electricity measurements, total, and for particular devices made it possible to compile energy consumption structure: monthly (Figure 20) and total use for specific processes (Figure 20). It was estimated that total electricity use of the building, excluding measurement equipment, was 6690 kWh. The apparatus (computer, loggers, and most of the sensors) were located in the technical room. Electrical devices emit approximately the same amount of heat as electricity being used. This indirectly could reduce energy demand for heating in winter and increase electricity use by ventilation unit to reduce overheating tendency in summer. These two opposing effects were, however, neglected in the analysis.
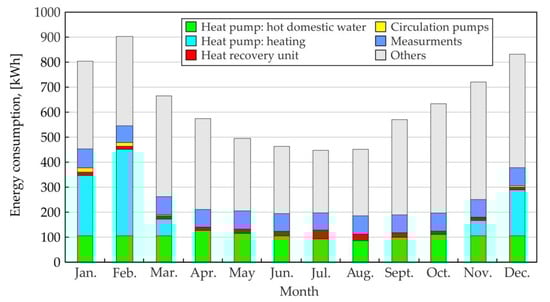
Figure 20.
Monthly energy consumption by process.
As can be seen in Figure 21, the lowest energy consumption was recorded for circulation pumps: It constituted only 0.6% of total consumption. For the heat recovery unit and heat pump, these percentages were 3% and 32.3%, respectively. Thus, energy use for heating and hot water in the analyzed year amounts to 2401.7 kWh, which constitutes about 36% of the total consumption.
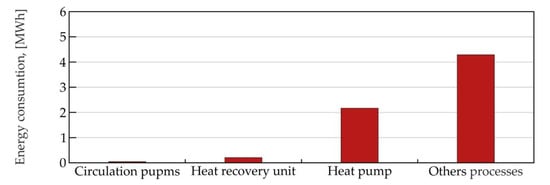
Figure 21.
Annual energy consumption for specific processes.
The total final energy use per square meter is 55.8 kWh·m−2·year−1. Primary energy is calculated based on the final energy use and an input factor for non-renewable sources. The building is powered by a coal power plant, so the multiplication factor (PEF) is 3. Based on this, the value of 167.4 kWh·m−2·year−1 was obtained, which indicates that the threshold of 120 kWh·m−2·year−1 for passive buildings was exceeded by almost 40%. The design calculations proved, however, the PH standard. On the other hand, the electricity consumption structure for the entire building in the year under review demonstrates that other processes (cooking, washing, lighting, entertainment, etc.) used 4014 kWh (64%) of total energy. The real energy use was also much higher than assumed in the design process. To clarify that, the inhabitants were asked, and energy use was reviewed again in situ. It turned out that, due to the newborn baby, an extra heater was used in the bathroom. Additionally, a new, bigger fridge and laundry dryer were purchased and used. Based on preliminary measurements, the total electricity use in the year 2011 was assessed to 4172 kWh, which gives PE of 104.4 kWh·m−2·year−1, i.e., almost the value assumed through PHPP calculation (112.5 kWh·m−2·year−1).
Total electricity-use measurements have been continued till the end of 2019. Figure 22 presents the final and primary energy use of the building throughout the entire research period that is from 2011 to 2019. Excluding 2011, in all subsequent years, the Annual Demand Indicator for Primary Energy (PE) was not met, as shown in Figure 22. The problem in this case is not the building itself or its technological systems, because as the results of energy consumption for heating show, it is twice as low as it is required to be for a passive building. There are two main factors that have an impact on the high demand for non-renewable primary energy: the first is the source of electricity, which in this case, as already mentioned, comes from a coal-fired power plant, whereby the ratio of expenditure on non-renewable primary energy EP is very high; and the second factor is an increased demand for electricity caused by the purchase and operation of additional household appliances by users. It should be noted that, in 2012, another family member was born, which resulted in increased energy consumption. This has resulted in a series of changes with regard to household appliances and the frequency of their operation, which led to increased energy consumption. Based on information provided by the residents, it was determined that energy consumption caused by these changes increased by 17–20 kWh·m−2·year−1. This amounts to additional primary energy usage at the level of 51-60 kWh·m−2·year−1, taking into consideration the multiplication factor (PEF) of 3 for electrical energy obtained from coal plants. The solution of this problem may be a partial change of the electricity source to energy from renewable energy sources (RES), e.g., photovoltaics. This will significantly reduce the use of primary energy. It was calculated that a photovoltaic system of 2.5 kWp would reset PH standard for the building, without reducing of electricity use, which means preserving the hitherto live standard of inhabitants.
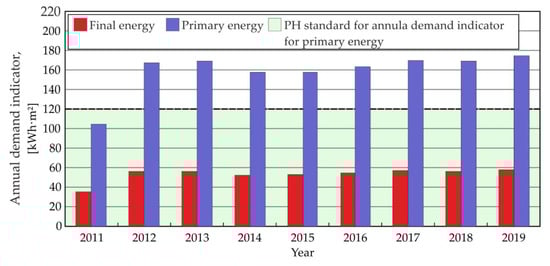
Figure 22.
Annual demand indicator for final and non-renewable primary energy consumption for th building, from 2011 to 2019.
Long-term energy-consumption use structure in the building was compared with the literature data (Figure 23). The energy for DHW is higher by 10%, as compared to the UE average [62], and by 6.5%, as compared to the US average [62]. Energy consumption for heating is lower by 5% in comparison with the EU average and by 32.6% when compared with the USA. Ventilation part is almost the same, and the other-usage percentage is nearly the arithmetic average of the EU and USA.
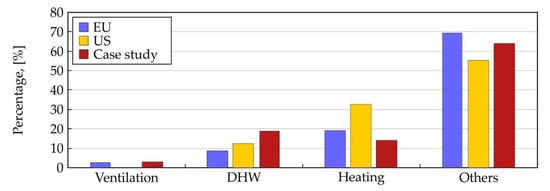
Figure 23.
Energy consumption for particular processes, compared with the literature.
4. Conclusions
Long-term research (nine years) on one family lightweight passive house (PH) performance, under real climate and usage conditions, was carried out. Transient patterns and the structure of energy use by active systems and household were measured and analyzed. The results of energy consumption provided some interesting findings. The case-study building had higher energy use for DHW, much lower for heating, and similar for other processes, in comparison to the literature data regarding passive buildings in the USA and Europe. In general, good quality of the inner climate and a high standard of energy efficiency for the building were confirmed. Indeed, final energy for heating was almost half of a value required by PH standard. Moreover, DHW production and mechanical ventilation performed very effectively. This could be achieved by using shallow geothermal heat exchangers. Low net energy demand for heating resulted from very good thermal insulation of outer assemblies and foundation consisting of a concrete slab laid on 50-cm extruded polystyrene. Reduced heating-energy demand was also supported by solar gains. Almost 90% of windows’ area is oriented to the southwest.
Despite very low final energy use by active systems, only during first year of usage all prerequisites for passive building were fulfilled. Starting from year two of the operation primary energy demand of 120 kWh·m−2·year−1 was exceeded. This happened after a new child was born. The building was designed and adjusted for the needs of a family of four, in order to comply with PHS. Family extension caused usage of new home appliances and changed the energy use patterns by inhabitants. This was reflected in increased electricity use by about 2200 kWh·year−1 and much higher increase of primary energy.
Optimistic assumptions in initial data and simplified energy calculations may lead to an underestimation of energy consumption in PH. This conclusion was also confirmed by other studies. An increase in electricity consumption during the use of the building, compared to the design assumptions was also noted in [68]. These studies concerned two non-residential buildings: a nursery school and a community center. In both cases, the differences between the assumed and actual values were significant. Electricity consumption for electrical appliances and lighting increased 2.3 times and 4.8 times, respectively. Energy consumption for ventilation fan for nursery school increased 4.8 times, while for the community center, it slightly decreased from 4.9 to 4.3 kWh⋅m−2⋅year−1. Energy consumption for heating was also higher than the target value for both buildings. The research described in Reference [69] also shows that steady-state method implemented at the design stage does not guarantee the achievement of good comfort conditions.
However, it should be emphasized that the PE parameter is significantly influenced by the fact that, for the building described in the paper, the electricity grid is powered by a coal plant, with high index of expenditure on non-renewable primary energy. Preserving of PH standard depends on energy origin, which cannot be changed by the inhabitants. Decrease in energy use may well mean deterioration of the living standard, which would make constructing of PH buildings unattractive. The only alternative, requiring a relatively small effort, is the application of about 2.5 kWp photovoltaic system. This could be installed on the roof. The question, however, of dependency of fulfilment of PH standard from local electricity provider remains unanswered.
Author Contributions
Conceptualization, J.R.; Formal analysis, K.W.; Investigation, K.W. and A.S.-S.; Supervision, J.R.; Visualization, A.S.-S.; Writing–original draft, K.W.; Writing–review & editing, J.R. and A.S.-S. All authors have read and agreed to the published version of the manuscript.
Funding
This research was supported by European Union/European Regional Development Fund “Passive house for everyone”.
Acknowledgments
We give a special gratitude to the house inhabitants, the Pawliczek family, for their friendly attitude and great endurance shown during the many years of investigation.
Conflicts of Interest
The authors declare no conflict of interest.
References
- The European Parliament and the Council of the European Union. Directive (EU) 2018/844 of the European Parliament and of the Council of 30 May 2018 Amending Directive 2010/31/EU on the Energy Performance of Buildings and Directive 2012/27/EU on Energy Efficiency; The European Parliament and the Council of the European Union: Brussels, Belgium, 2018. [Google Scholar]
- Mahdavi, A.; Doppelbauer, E. A performance comparison of passive and low-energy buildings. Energy Build. 2010, 42, 1314–1319. [Google Scholar] [CrossRef]
- Marszal, A.; Heiselberg, P.; Bourrelle, J.; Musall, E.; Voss, K.; Sartori, K.; Napolitano, A. Zero Energy Building-A review of definitions and calculation methodologies. Energy Build. 2011, 43, 971–979. [Google Scholar] [CrossRef]
- Berardi, U. Clarifying the new interpretations of the concept of sustainable building. Sustain. Cities Soc. 2012, 8, 72–78. [Google Scholar] [CrossRef]
- Sadineni, S.; Madala, S.; Boehm, R. Passive building energy savings: A review of building envelope components. Renew. Sustain. Energy Rev. 2011, 15, 3617–3631. [Google Scholar] [CrossRef]
- Shameri, M.; Alghoul, M.; Sopian, K.; Zain, M.; Elayeb, O. Perspectives of double skin facade systems in buildings and energy saving. Renew. Sustain. Energy Rev. 2011, 15, 1468–1475. [Google Scholar] [CrossRef]
- Pacheco, R.; Ordóñez, J.; Martínez, G. Energy efficient design of building: A review. Renew. Sustain. Energy Rev. 2012, 16, 3559–3573. [Google Scholar] [CrossRef]
- Lu, Y.; Wang, S.; Shan, K. Design optimization and optimal control of grid-connected and standalone nearly/net zero energy buildings. Appl. Energy 2015, 155, 463–477. [Google Scholar] [CrossRef]
- Altobello, A.; Misceo, M.; Russo, P.; Stefanizzi, P.; Vignola, I. Comparison of numerical and experimental performances of nZEB residential building in Putignano (Apulia Region). In Proceedings of the IOP Conference Series: Materials Science and Engineering, Palembang, Indonesia, 15–16 October 2019; Volume 609, p. 072033. [Google Scholar]
- Rey-Hernández, J.M.; Velasco-Gómez, E.; San José-Alonso, J.F.; Tejero-González, A.; Rey-Martínez, F.J. Energy Analysis at a Near Zero Energy Building. A Case-Study in Spain. Energies 2018, 11, 857. [Google Scholar] [CrossRef]
- Chauhan, A.; Saini, R. A review on integrated renewable energy system based power generation for stand-alone applications: Configurations, storage options, sizing methodologies and control. Renew. Sustain. Energy Rev. 2014, 38, 99–120. [Google Scholar] [CrossRef]
- Bajpai, P.; Dash, V. Hybrid renewable energy systems for power generation in stand-alone applications: A review. Renew. Sustain. Energy Rev. 2012, 16, 2926–2939. [Google Scholar] [CrossRef]
- Ahmed, K.; Carlier, M.; Feldmann, C.; Kurnitski, J. A New Method for Contrasting Energy Performance and Near-Zero Energy Building Requirements in Different Climates and Countries. Energies 2018, 11, 1334. [Google Scholar] [CrossRef]
- Rey-Hernández, J.M.; Velasco-Gómez, E.; San José-Alonso, J.F.; Tejero-González, A.; González-González, S.L.; Rey-Martínez, F.J. Monitoring Data Study of the Performance of Renewable Energy Systems in a Near Zero Energy Building in Spain: A Case Study. Energies 2018, 11, 2979. [Google Scholar] [CrossRef]
- Baos, R.; Manzano-Agugliaro, F.; Montoya, F.; Gil, C.; Alcayde, A.; Gmez, J. Optimization methods applied to renewable and sustainable energy a review. Renew. Sustain. Energy Rev. 2011, 15, 1753–1766. [Google Scholar]
- Pezzini, P.; Gomis-Bellmunt, O.; Sudri-Andreu, A. Optimization techniques to improve energy efficiency in power systems. Renew. Sustain. Energy Rev. 2011, 15, 2028–2041. [Google Scholar] [CrossRef]
- Kampelis, N.; Sifakis, N.; Kolokotsa, D.; Gobakis, K.; Kalaitzakis, K.; Isidori, D.; Cristalli, C. HVAC Optimization Genetic Algorithm for Industrial Near-Zero-Energy Building Demand Response. Energies 2019, 12, 2177. [Google Scholar] [CrossRef]
- Xu, X.; Feng, G.; Chi, D.; Liu, M.; Dou, B. Optimization of Performance Parameter Design and Energy Use Prediction for Nearly Zero Energy Buildings. Energies 2018, 11, 3252. [Google Scholar] [CrossRef]
- Chastas, P.; Theodosiou, T.; Kontoleon, K.J.; Bikas, D. The Effect of Embodied Impact on the Cost-Optimal Levels of Nearly Zero Energy Buildings: A Case Study of a Residential Building in Thessaloniki. Greece Energies 2017, 10, 740. [Google Scholar] [CrossRef]
- Wan, K.; Li, D.; Liu, D.; Lam, J. Future trends of building heating and cooling loads and energy consumption in different climates. Build. Environ. 2011, 46, 223–234. [Google Scholar] [CrossRef]
- Giannakopoulos, C.; Hadjinicolaou, P.; Zerefos, C. Changing energy requirements in the Mediterranean under changing cimatic conditions. Energies 2009, 2, 805–815. [Google Scholar] [CrossRef]
- Ballarini, I.; De Luca, G.; Paragamyan, A.; Pellegrino, A.; Corrado, V. Transformation of an Office Building into a Nearly Zero Energy Building (nZEB): Implications for Thermal and Visual Comfort and Energy Performance. Energies 2019, 12, 895. [Google Scholar] [CrossRef]
- Patiño-Cambeiro, F.; Armesto, J.; Patiño-Barbeito, F.; Bastos, G. Perspectives on Near ZEB Renovation Projects for Residential Buildings: The Spanish Case. Energies 2016, 9, 628. [Google Scholar] [CrossRef]
- PASSIPEDIA. What is a Passive House? Available online: https://passipedia.org/basics/what_is_a_passive_house (accessed on 27 December 2019).
- Lang, A. Defining the Nearly Zero Energy Building, Passive House Institute. Available online: https://passreg.eu/upload/PassREg_International_EN/Flipbook.pdf (accessed on 27 December 2019).
- Passive House Institute (PHI). Available online: https://passivehouse.com (accessed on 27 December 2019).
- The 3D Modeling Tool for the PHPP: Design, PH. Available online: https://passivehouse.com/04_phpp/05_designph/05_designph.htm (accessed on 6 April 2020).
- Passive House Planning Package. Available online: https://passivehouse.com/04_phpp/04_phpp.htm (accessed on 6 April 2020).
- Colclough, S.; Kinnane, O.; Hewitt, N.; Griffiths, P. Investigation of nZEB social housing built to the Passive House standard. Energy Build. 2018, 179, 344–359. [Google Scholar] [CrossRef]
- Ekström, T.; Blomsterberg, Å. Renovation of Swedish Single-family Houses to Passive House Standard–Analyses of Energy Savings Potential. Energy Procedia 2016, 96, 134–145. [Google Scholar] [CrossRef]
- Feist, W. Forschungsprojekt Passive Häuser; Institut Wohnen und Umwelt: Darmstadt, Germany, 1998; ISBN 978-392-265-385-1. [Google Scholar]
- Feist, W. The Passive House in Darmstadt-Kranichstein—Planning, Construction, Results; Technical Information PHI: Darmstadt, Germany, 1997. [Google Scholar]
- Feist, W.; Peper, S.; Görg, M. CEPHEUS Final Publical Report; PHI: Hanover, Germany, 2001; Available online: https://www.phius.org/media/W1siZiIsIjIwMTEvMTIvMjIvMTBfMDFfNTBfOTk2X0NFUEhFVVNfZmluYWxfbG9uZy5wZGYiXV0?sha=a0c58caa (accessed on 8 April 2020).
- Feist, W.; Schnieders, J.; Dorer, V.; Haas, A. Re-inventing air heating: Convenient and comfortable within the frame of the Passive House concept. Energy Build. 2005, 37, 1186–1203. [Google Scholar] [CrossRef]
- Schnieders, J.; Hermelink, A. CEPHEUS results: Measurements and occupants’ satisfaction provide evidence for Passive Houses being an option for sustainable building. Energy Policy 2006, 34, 151–171. [Google Scholar] [CrossRef]
- Schnieders, J. CEPHEUS—Measurement Results from More Than 100 Dwelling Units in Passive Houses; Passive House Institute: Darmstadt, Germany, 2003; Available online: https://pdfs.semanticscholar.org/fdac/fb2ab84094028f506e9b5fc9454b7a706dd3.pdf?_ga=2.140378427.946716576.1584827443-603835346.1584827443 (accessed on 6 April 2020).
- Ridley, I.; Clarke, A.; Bere, J.; Altamirano, H.; Lewis, S.; Durdev, M.; Farr, A. The monitored performance of the first new London dwelling certified to the Passive House standard. Energy Build. 2013, 63, 67–78. [Google Scholar] [CrossRef]
- Ridley, I.; Bere, J.; Clarke, A.; Schwartz, Y.; Far, A. The side by side in use monitored performance of two passive and low carbon Welsh houses. Energy Build. 2014, 82, 13–26. [Google Scholar] [CrossRef]
- Rohdin, P.; Molin, A.; Moshfegh, B. Experiences from nine passive houses in Sweden–indoor thermal environment and energy use. Build. Environ. 2014, 71, 176–185. [Google Scholar] [CrossRef]
- Schnieders, J.; Feist, W.; Rongen, L. Passive Houses for different climate zones. Energy Build. 2015, 105, 71–87. [Google Scholar] [CrossRef]
- Mlakar, J.; Štrancar, J. Overheating in residential passive house: Solution strategies revealed and confirmed through data analysis and simulations. Energy Build. 2011, 43, 1443–1451. [Google Scholar] [CrossRef]
- Kaklauskas, A.; Rute, J.; Zavadskas, E.; Daniuna, A.; Pruskus, V.; Bivainis, J.; Plakys, V. Passive House model for quantitative and qualitative analyses and its intelligent system. Energy Build. 2012, 50, 7–18. [Google Scholar] [CrossRef]
- Langer, S.; Bekö, G.; Bloom, E.; Widheden, A.; Ekbe, L. Indoor air quality in passive and conventional new houses in Sweden. Build. Environ. 2015, 93, 92–100. [Google Scholar] [CrossRef]
- Fokaides, P.; Christoforou, E.; Ilic, M. Performance of a Passive House under subtropical climatic conditions. Energy Build. 2016, 133, 14–31. [Google Scholar] [CrossRef]
- Dahlstrøm, O.; Sørnes, K.; Eriksen, S.; Hertwich, E. Life cycle assessment of a single-family residence built to either conventional-or passive house standard. Energy Build. 2012, 54, 470–479. [Google Scholar] [CrossRef]
- Proietti, S.; Sdringola, P.; Desideri, U.; Zepparelli, F.; Masciarelli, F.; Castellani, F. Life Cycle Assessment of a passive house in a seismic temperate zone. Energy Build. 2013, 64, 463–472. [Google Scholar] [CrossRef]
- Badea, A.; Baracu, T.; Dinca, C.; Tutica, D.; Grigore, R.; Anastasiu, M. A life-cycle cost analysis of the passive house ‘POLITEHNICA’ from Bucharest. Energy Build. 2014, 80, 542–555. [Google Scholar] [CrossRef]
- Galvin, R. Are passive houses economically viable? A reality-based, subjectivist approach to cost-benefit analyses. Energy Build. 2014, 80, 149–157. [Google Scholar] [CrossRef]
- Stephan, A.; Crawford, R.H.; Myttenaere, K. A comprehensive assessment of the life cycle energy demand of passive houses. Appl. Energy 2013, 112, 23–34. [Google Scholar]
- Chel, A.; Janssens, A.; De Paepe, M. Thermal performance of a nearly zero energy passive house integrated with the air–air heat exchanger and the earth?water heat exchanger. Energy Build. 2015, 96, 53–63. [Google Scholar] [CrossRef]
- Kylili, A.; Fokaides, P. European smart cities: The role of zero energy buildings. Sustain. Cities Soc. 2015, 15, 86–95. [Google Scholar] [CrossRef]
- Georges, L.; Skreiberg, Ø.; Novakovic, V. On the proper integration of wood stoves in passive houses: Investigation using detailed dynamic simulations. Energy Build. 2013, 59, 203–213. [Google Scholar] [CrossRef]
- Rekstad, J.; Meir, M.; Murtnes, E.; Dursun, A. A comparison of the energy consumption in two passive houses, one with a solar heating system and one with an air-water heat pump. Energy Build. 2015, 96, 149–161. [Google Scholar] [CrossRef]
- Moran, F.; Blight, T.; Natarajan, S.; Shea, A. The use of Passive House Planning Package to reduce energy use and CO2 emissions in historic dwellings. Energy Build. 2014, 75, 216–227. [Google Scholar] [CrossRef]
- Leardini, P.; Manfredini, M.; Callau, M. Energy upgrade to Passive House standard for historic public housing in New Zealand. Energy Build. 2015, 95, 211–218. [Google Scholar] [CrossRef]
- Sage-Lauck, J.; Sailor, D. Evaluation of phase change materials for improving thermal comfort in a super-insulated residential building. Energy Build. 2014, 79, 32–40. [Google Scholar] [CrossRef]
- Němeček, M.; Kalousek, M. Influence of thermal storage mass on summer thermal stability in a passive wooden house in the Czech Republic. Energy Build. 2015, 107, 68–75. [Google Scholar] [CrossRef]
- Radoń, J.; Wąs, K.; Flaga-Maryanczyk, A.; Schnotale, J. Experimental and theoretical study on hygrothermal long-term performance of outer assemblies in lightweight passive house. Build. Phys. 2018, 41, 299–320. [Google Scholar] [CrossRef]
- Wąs, K. Wpływ Konstrukcji Ściany Lekkiej Szkieletowej na Zjawiska Cieplno-Wilgotnościowe w Budynku Pasywnym (Impact of Light-Frame Wall Structure on Hygrothermal Performance in a Passive House). Ph.D. Thesis, Cracow University of Technology, Kraków, Poland, 2016. [Google Scholar]
- Abu Bakar, N.; Hassan, M.; Abdullah, H.; Rahman, H.; Abdullah, M.; Hussin, F.; Bandi, M. Energy efficiency index as an indicator for measuring building energy performance: A review. Renew. Sustain. Energy Rev. 2015, 44, 1–11. [Google Scholar] [CrossRef]
- González, A.; Díaz, J.; Caamaño, A.; Wilby, M. Towards a universal energy efficiency index for buildings. Energy Build. 2011, 43, 980–987. [Google Scholar] [CrossRef]
- Kapsalaki, M.; Leal, V.; Santamouris, M. A methodology for economic efficient design of Net Zero Energy Buildings. Energy Build. 2012, 55, 765–778. [Google Scholar] [CrossRef]
- Thiel, C.; Campion, N.; Landis, A.; Schaefer, L.; Bilec, M. A Materials Life Cycle Assessment of a Net-Zero Energy Building. Energies 2013, 6, 1125–1141. [Google Scholar] [CrossRef]
- WUFI® Plus. Available online: https://wufi.de/en/software/wufi-plus (accessed on 6 April 2020).
- Flaga-Maryanczyk, A.; Schnotale, J.; Radoń, J.; Wąs, K. Experimental measurements and CFD simulation of a ground source heat exchanger operating at a cold climate for a passive house ventilation system. Energy Build. 2014, 68, 562–570. [Google Scholar] [CrossRef]
- Climate.OneBuilding.Org. Available online: http://climate.onebuilding.org (accessed on 8 April 2020).
- Polish Committee for Standardization. PN-EN 16798-1: Charakterystyka Energetyczna Budynków. Wentylacja Budynków; Parametry wejściowe środowiska wewnętrznego do projektowania i oceny charakterystyki energetycznej budynków w odniesieniu do jakości powietrza wewnętrznego, środowisk; Polish Committee for Standardization: Warsaw, Poland, 2019. [Google Scholar]
- Raide, I.; Kalamees, T.; Mauring, T. Lessons learnt from the first public buildings in Estonia intended to be passive houses. Pest Acad. Sci. 2015, 64, 157–167. [Google Scholar] [CrossRef]
- Constanzo, V.; Fabbri, K.; Piraccini, S. Stressing the passive behavior of Passivhaus: An evidence-based scerario analysis for a Mediterranean case study. Build. Environ. 2018, 142, 265–277. [Google Scholar] [CrossRef]


© 2020 by the authors. Licensee MDPI, Basel, Switzerland. This article is an open access article distributed under the terms and conditions of the Creative Commons Attribution (CC BY) license (http://creativecommons.org/licenses/by/4.0/).