Article

A Study on the V2G Technology Incorporation in a DC Nanogrid and on the Provision of Voltage Regulation to the Power Grid

Department of Electrical and Computer Engineering, Democritus University of Thrace, 67100 Xanthi, Greece
*
Author to whom correspondence should be addressed.
Energies 2020, 13(10), 2655; https://doi.org/10.3390/en13102655
Submission received: 24 February 2020 / Revised: 3 May 2020 / Accepted: 19 May 2020 / Published: 23 May 2020
(This article belongs to the Special Issue Power Electronics for Energy Saving)

Abstract

:
Currently, environmental and climate change issues raise a lot of concerns related to conventional vehicles and renewable energy generation methods. Thus, more and more researchers around the world focus on the development and deployment of Renewable Energy Sources (RES). Additionally, due to the technological advancements in power electronics and electrical batteries, Electrical Vehicles (EVs) are becoming more and more popular. In addition, according to the Vehicle-to-Grid (V2G) operation, the EV batteries can provide electrical energy to the power grid. In this way, many ancillary services can be provided. A Direct Current (DC) nanogrid can be composed by combining the aforementioned technologies. Nanogrids present high efficiency and provide a simple interaction with renewable energy sources and energy storage devices. Firstly, the present study describes the design considerations of a DC nanogrid as well as the control strategies that have to be applied in order to make the V2G operation feasible. Furthermore, the provision of voltage regulation toward the power grid is investigated though the bidirectional transfer of active and reactive power between the DC nanogrid and the power grid. Afterwards, the voltage regulation techniques are applied in an Alternating Current (AC) radial distribution grid are investigated. The proposed system is simulated in Matlab/Simulink software and though the simulation scenarios the impact of the voltage regulation provided by the DC nanogrid is investigated.

1. Introduction

Microgrids/nanogrids are considered as decentralized small-scale power systems. Their configuration includes electric power generation, electric loads and electric storage devices [1]. In the literature, there is not a clear distinction between microgrids and nanogrids. As a rule of thumb, the latter are characterized by low nominal power and complexity in comparison to microgrids. Many nanogrids can be connected in order to form a microgrid. These configurations can play an important role in the integration of renewable energy sources since they allow the use of advanced control methods that increase overall efficiency. Thus, through smart energy management systems, the voltage and frequency instabilities caused by the variable output power of renewable sources can be reduced [2]. DC nanogrids tend to prevail over AC because the majority of the distributed generation, as well as energy storage devices, work under DC voltage/current. Additionally, DC nanogrid presents higher efficiency due to the lack of energy dissipations caused by the AC-DC conversion (and vice-versa) and because the control methods are simpler and easier to be implemented since frequency issues do not exist [2,3]. However, it should be noted that in DC nanogrids, many protection issues arise [4]. These configurations can operate either connected to the power grid or isolated [5].
Internal combustion engines (ICE) have been used in the automotive industry for more than 100 years. However, environmental issues related to tailpipe emissions and the fact that petroleum is a finite resource has increased the popularity of Electric Vehicles (EVs) [6]. EVs present a lot of attractive characteristics such as increased efficiency, they are easy to operate and the electric motor provides the total torque from the startup. Additionally, they are a great choice for urban transportation since they are quiet and they do not consume electricity when idling [7]. However, issues concerning the high cost and degradation of electric batteries as well as their charging time that is required should be further investigated. Furthermore, concerns related to the EVs grid integrations are raised. Specifically, the uncontrollable charging of a large number of EVs will have negative impacts on the power grid and may cause frequency and voltage fluctuations [8,9].
A promising solution concerning the EVs integration in the utility grid is the Vehicle to Grid Technology (V2G). Based on statistical data, cars are remaining idle 95% of the day [10]. Thus, according to the V2G technology the EV batteries, based on the car owner’s needs, can provide electricity towards the grid. Integrating EVs and the V2G operation in a nanogrid, the EVs can be converted to controllable loads as well as to power sources. Controllable EVs charging creates a lot of potential benefits since the charging operation can be activated when the electricity price is low or when energy provided by renewable energy sources is available. Additionally, whenever is needed, EVs can supply with electricity local loads. In this way, the electric transmission congestion is constrained and revenue for the EV owners can be generated [11]. However, the charging/discharging algorithms must take into consideration the EVs owners’ needs and the limited cycles of electric batteries [12,13].
Besides the aforementioned benefits, the V2G operation can provide ancillary services towards the power grid. Using EVs as energy storage devices load balancing can be achieved by peak shaving [14,15] and valley filling [16,17]. Through the bidirectional chargers that are needed to make the V2G operation feasible, EVs can exchange power with the power grid. Thus, authors in [18,19] propose how to provide frequency regulation while voltage regulation is discussed in [20,21]. In addition, EVs can be used as spinning reserves, improve grid efficiency and stability and achieve generation dispatch. Hence, the operating costs of the power grid are reduced while EV owners have a potential economic benefit [8,22,23].
This paper seeks to examine the following topics:
  • The requirements that have to be taken into consideration when designing a DC nanogrid that enable the V2G operation. The configuration is defined as a nanogrid and not a microgrid since it consists of low power topologies and the control strategies that are deployed are simple and easy to be implemented.
  • The description of the power converters that are required as well as the control systems that enable the exchange of active and reactive power between the nanogrid and the utility.
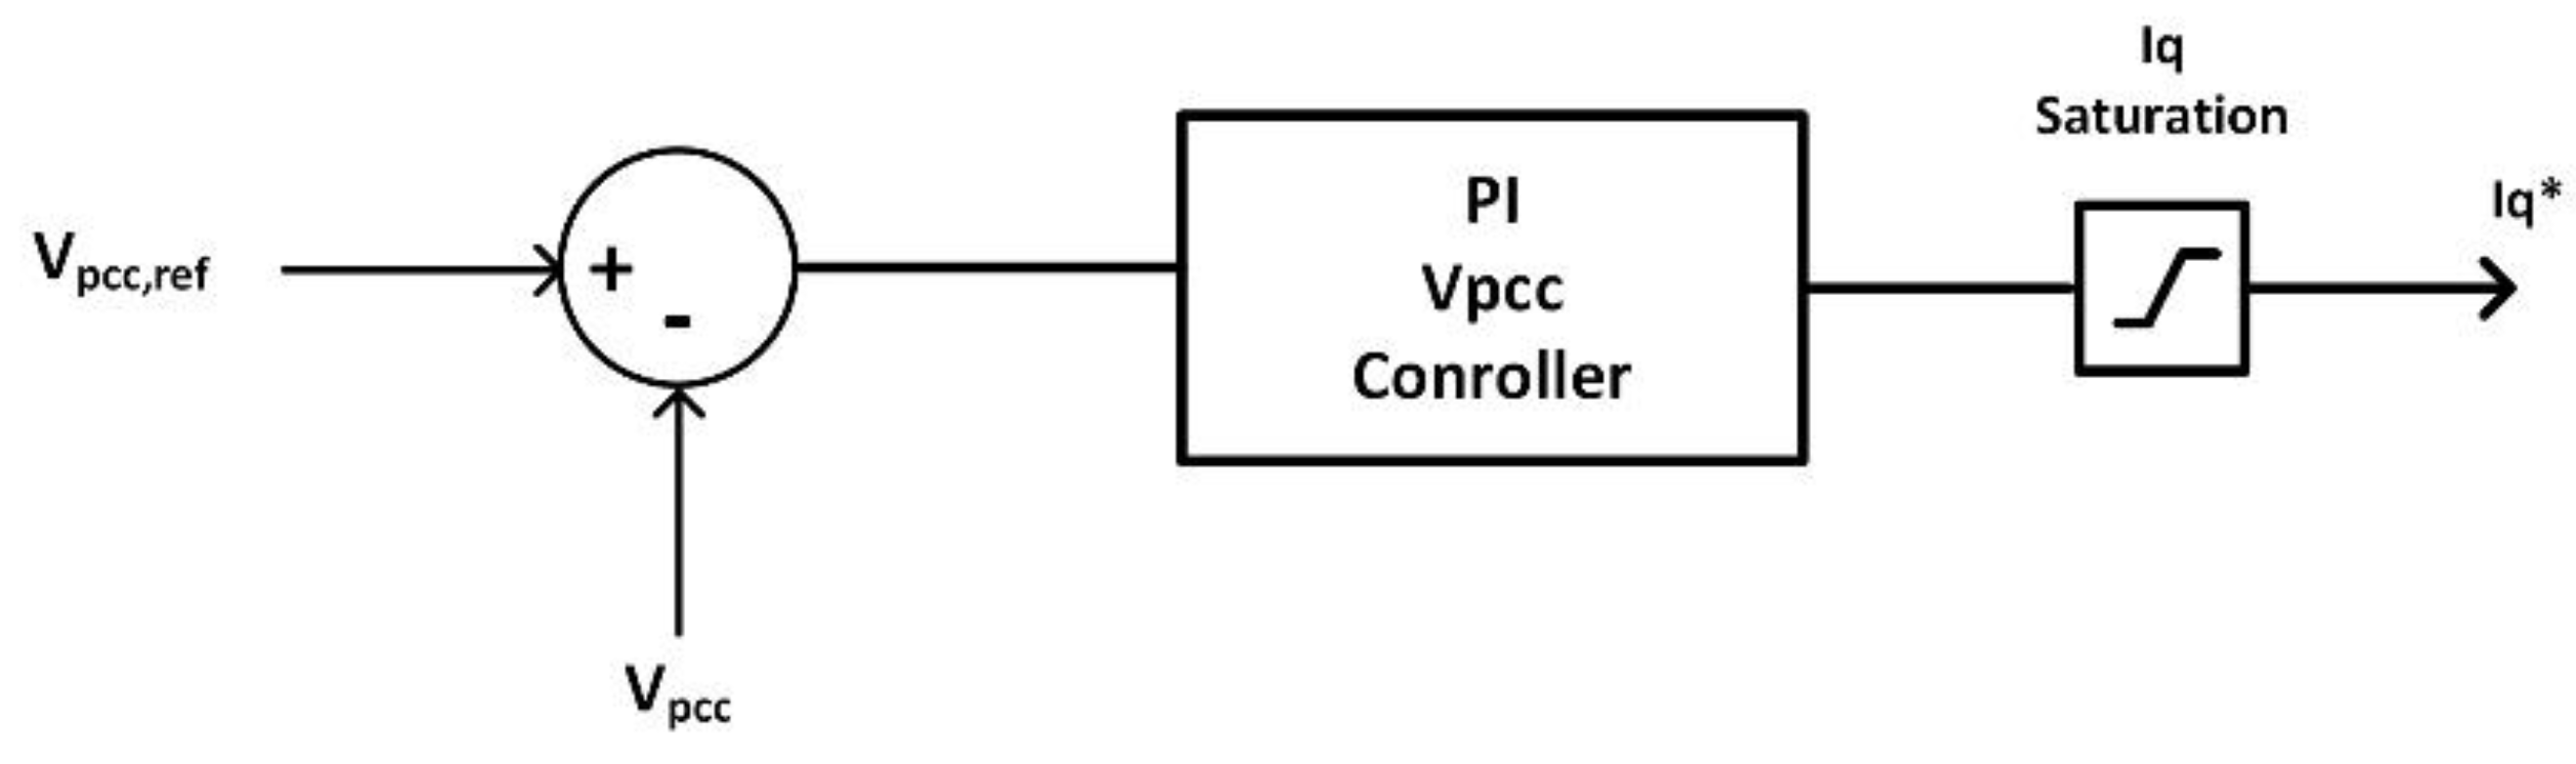
  • The provision of voltage regulation to the power grid. As it was mentioned before, many ancillary services can be provided by the nanogrids. However, the current study focuses on the provision of voltage regulation towards the power grid through the exchange of active and reactive power. Authors in [24] propose to use the EVs batteries to alleviate voltage rise caused by high penetration of photovoltaics while [25] solves this problem by controlling the reactive power. Research conducted in [26] proposes reactive power compensation in order to limit the voltage sags created by EV fast-charging stations. This work investigates the voltage regulation by analyzing the impact of active and reactive power exchanged with the power grid. Furthermore, unlike other studies, different values of grid impedance will be tested.
  • The demonstration of the proposed voltage regulation strategies in an AC radial distribution grid.
The paper is organized as follows. The nanogrid configuration is described in Section 2 while Section 3 addresses the issues concerning the design methodology and the control strategy of the nanogrid. Section 4 begins by laying out the theoretical dimensions of the voltage regulation and looks at how they can be applied. The results of the simulations scenarios are illustrated in Section 5. Section 6 summarizes the conclusions that are drawn from the present paper.

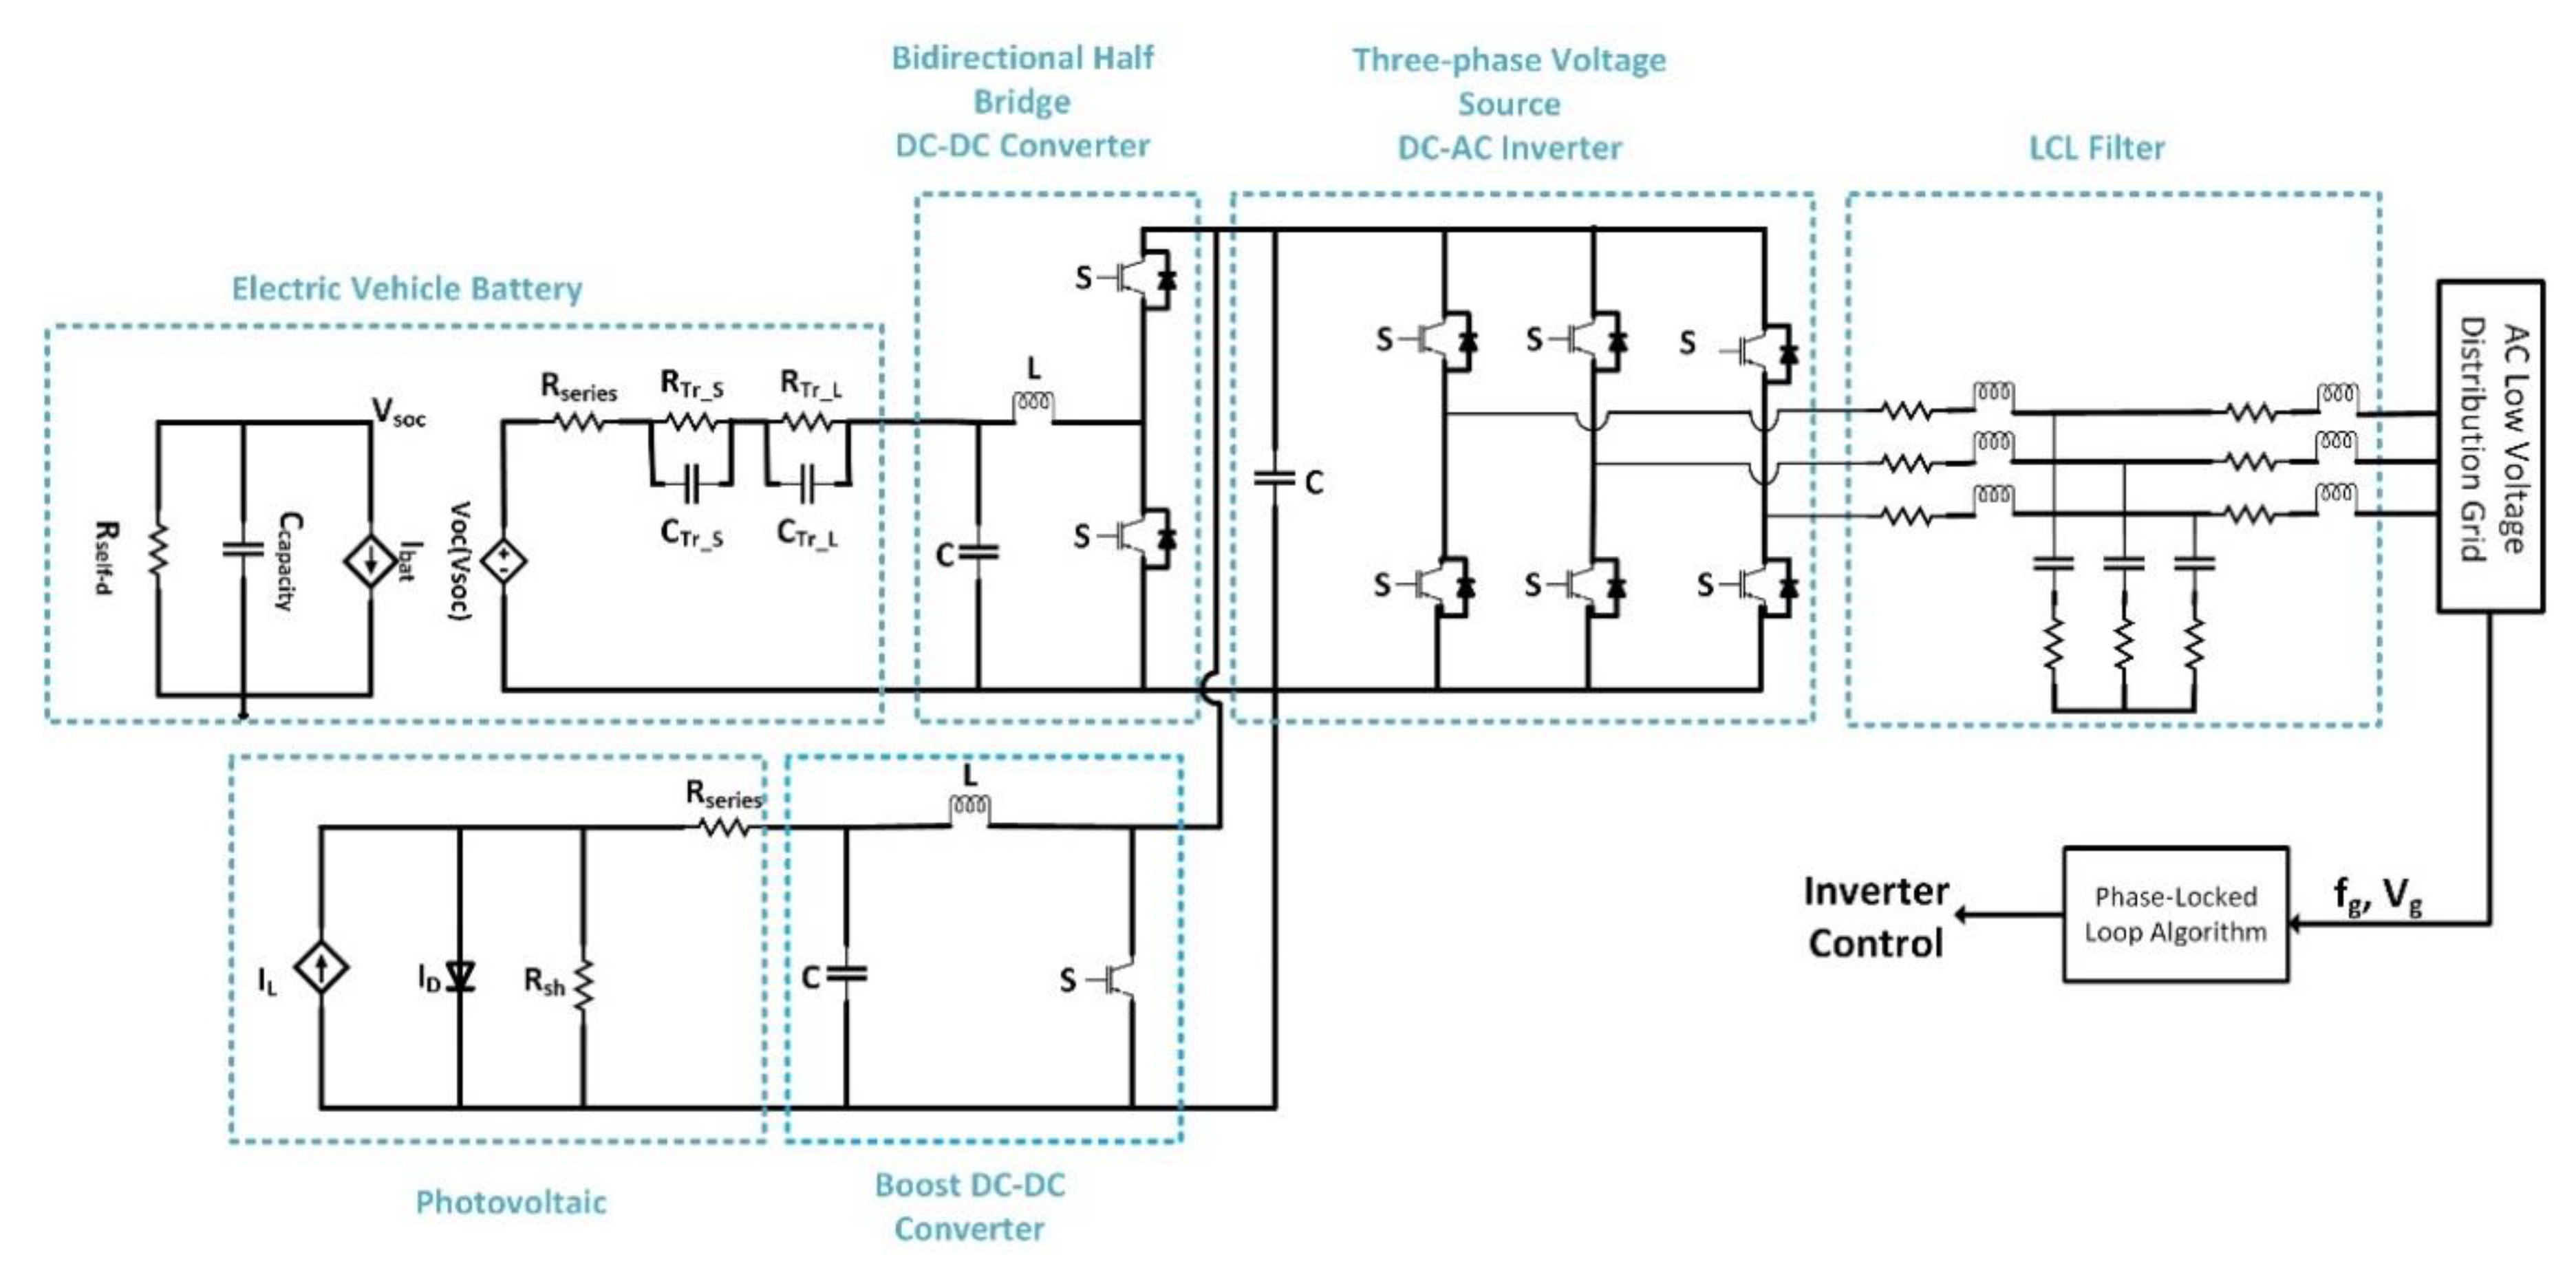
2. DC Nanogrid Configuration

In this section, the understudy system will be analyzed. Figure 1 illustrates the topology of the DC nanogrid. It consisted of photovoltaic (PV) solar panels connected to the DC bus of the nanogrid through a Boost DC-DC converter. A bidirectional DC-DC converter was used to make feasible the exchange of active power transfer between the EV batteries and the DC bus of the nanogrid was achievable through the bidirectional DC-DC converter. The nanogrid was connected to the low voltage distribution grid through a voltage source DC-AC inverter and an LCL filter. The aforementioned configurations were briefly discussed in the following subsections while in Appendix A, the parameters of each topology are given. The nanogrid configuration was simulated in Matlab/Simulink.
At this point, it should be noted that in order to make the V2G operation feasible and for the proper operation of the DC nanogrid, communication links should be established. To be more specific, the EV charger should exchange control signals with the controller of the DC nanogrid (state of charge of the batteries, EV owner needs, etc.). This can be implemented in many ways such as mobile networks, Wi-fi, Bluetooth, Ethernet cables or power line communication. The same procedure must be followed in the nanogrid since the nanogrid controller needs to monitor vital parameters (DC link voltage, PV power generation, etc.) and exchange control signals with the other topologies (PV, bidirectional charger and inverter). Finally, a gateway should be established at the nanogrid to make feasible communication with other nanogrids or the grid operator. The examination of the communication links and the gateways is beyond the scope of the current study and more information can be found in [2,27,28].

2.1. Photovoltaic System

In order to simulate the photovoltaic system, the one diode equivalent circuit model was used. This simulation model provided good accuracy and low complexity. In this way, it was possible to reproduce the I-V curves of photovoltaic panels with respect to the irradiation and the temperature. Additionally, a maximum power point tracking (MPPT) algorithm was used in order to extract the maximum power. In this study, the MPPT algorithm “Perturb and Observe” was used to control the duty cycle of the boost DC-DC converter that connects the photovoltaic system to the DC bus of the nanogrid. The maximum power that can be produced by the selected PV system was equal to 21 kWatts (kW) measured in standard test conditions. The parameters of the PV modules as well as of the PV system are given in the Table A1 and Table A2 respectively in Appendix A.

2.2. EV Battery Model

An accurate battery model was used in order to obtain accurate simulation results. In the current study, an electrical model that is capable of predicting the I-V performance of the battery was used. A detailed analysis of the battery model is given in [30]. The dynamic characteristics of the battery such as the non-linear relationship between the open-circuit voltage and the state of charge (SOC) of the battery can be accurately simulated. The equivalent circuit of the battery model is given in Figure 1 and it is a combination of several battery models presented in the literature. Indicatively, the left part of the equivalent circuit is inherited from the runtime-based models and gives the battery voltage with respect to the SOC of the battery. The Resistor-Capacitor (RC) network in the right part inherited from the Thevenin-based models simulate the transient response of the battery. In the present study, a commercial EV battery was simulated. The most important parameters of the battery are given in Table A3 in Appendix A.

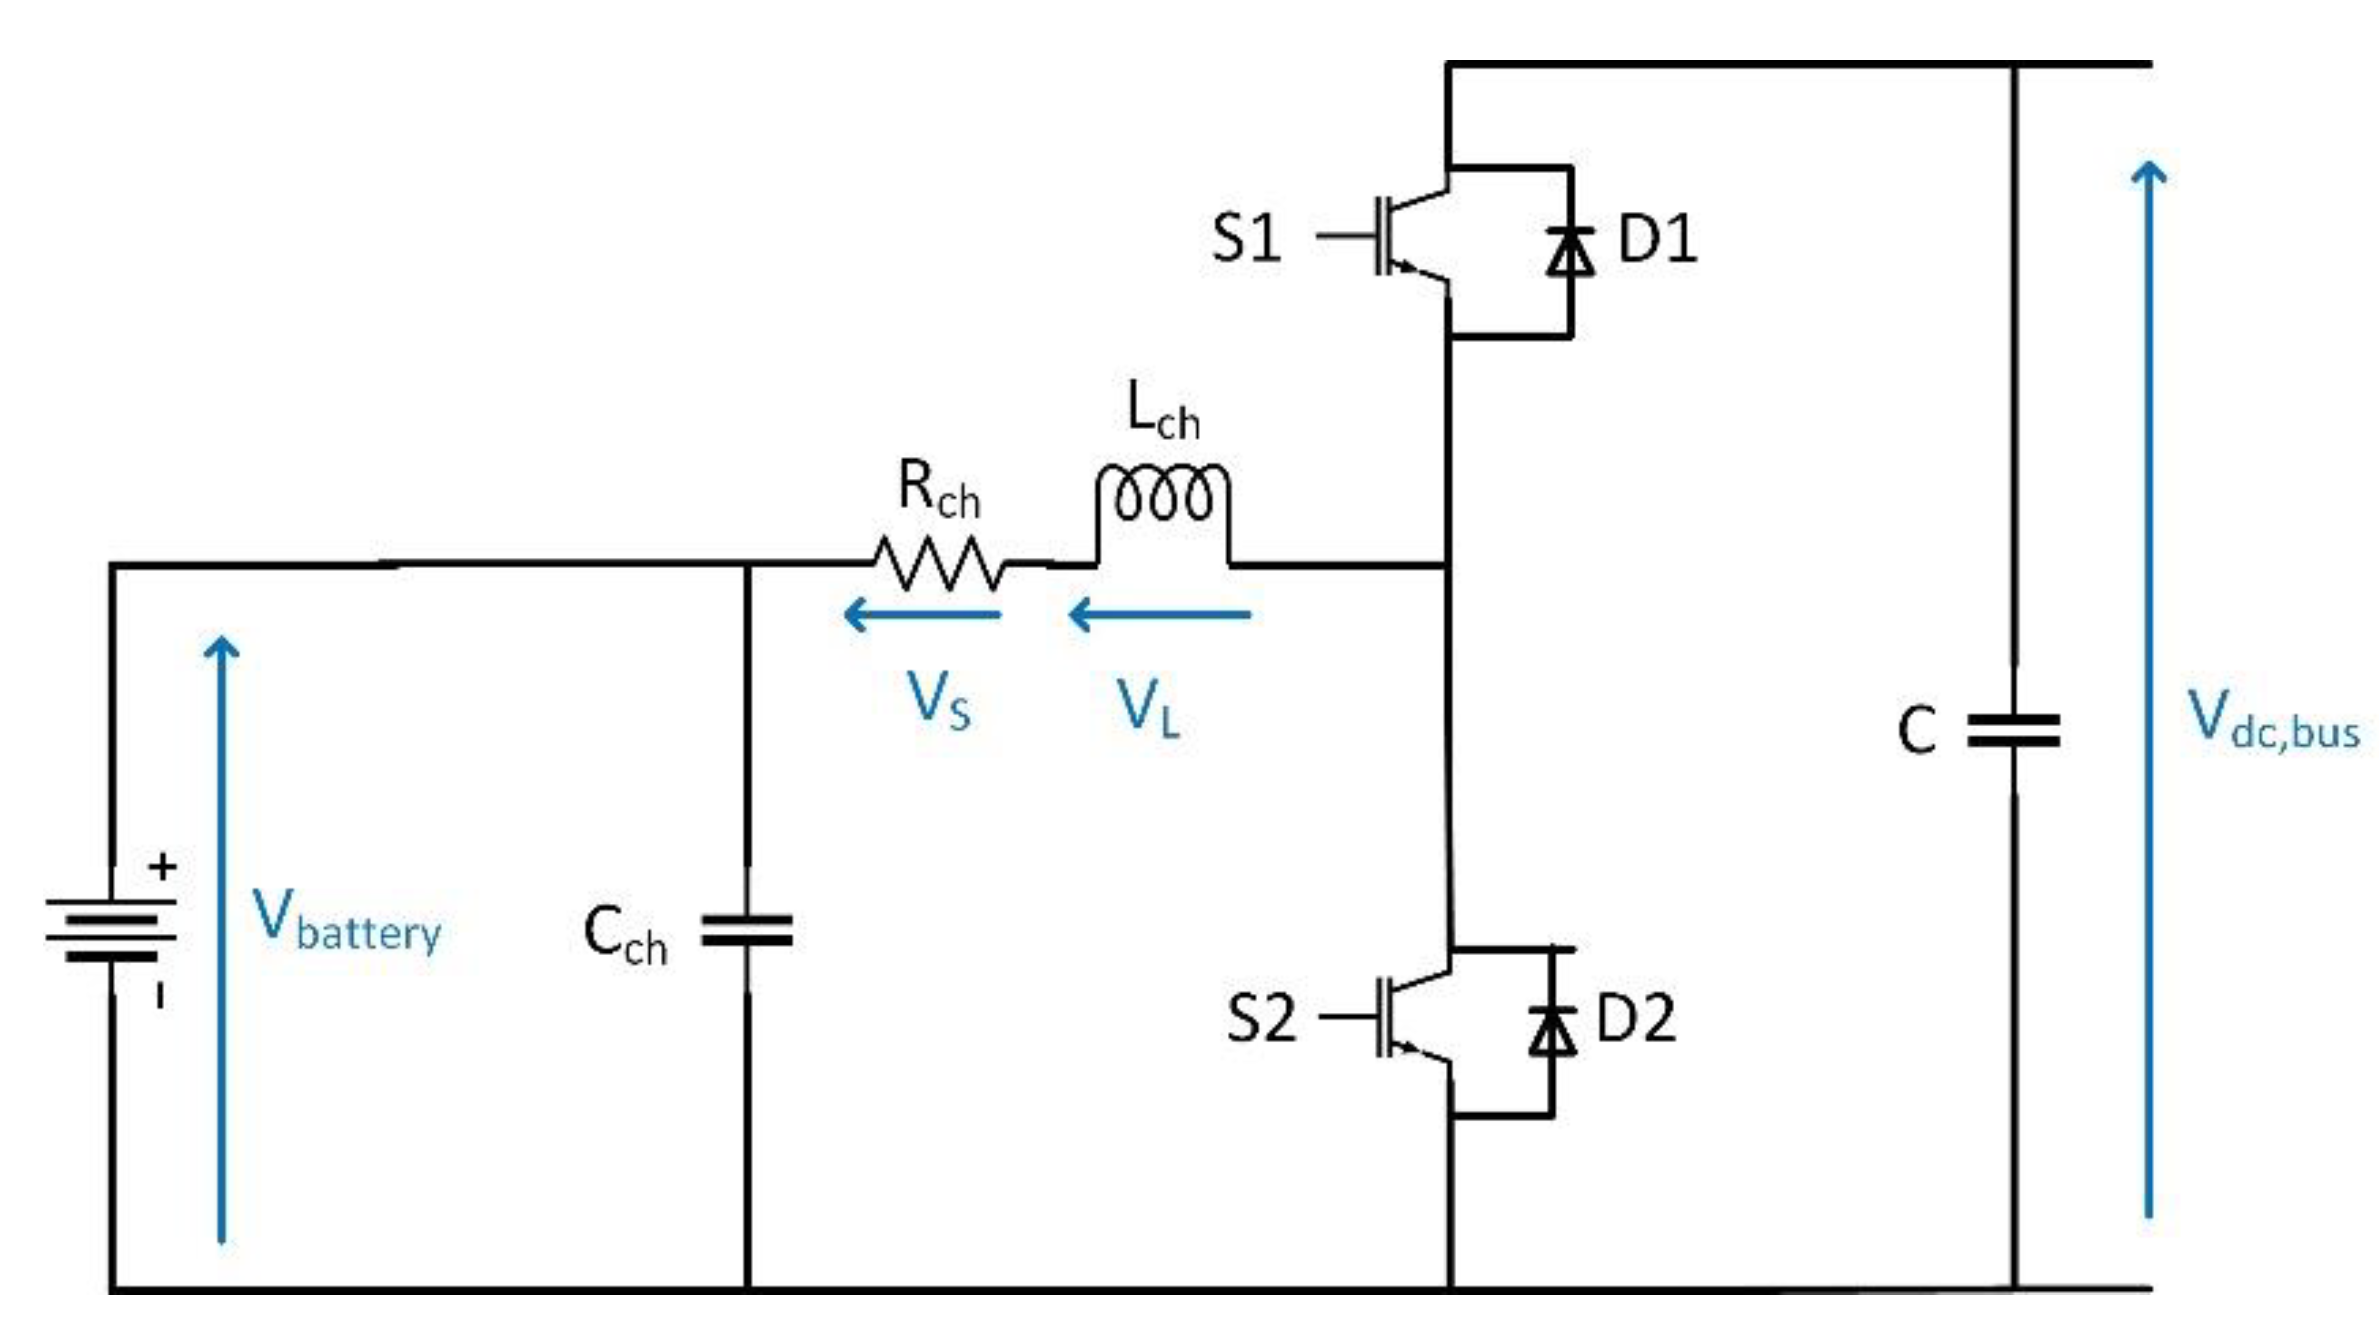
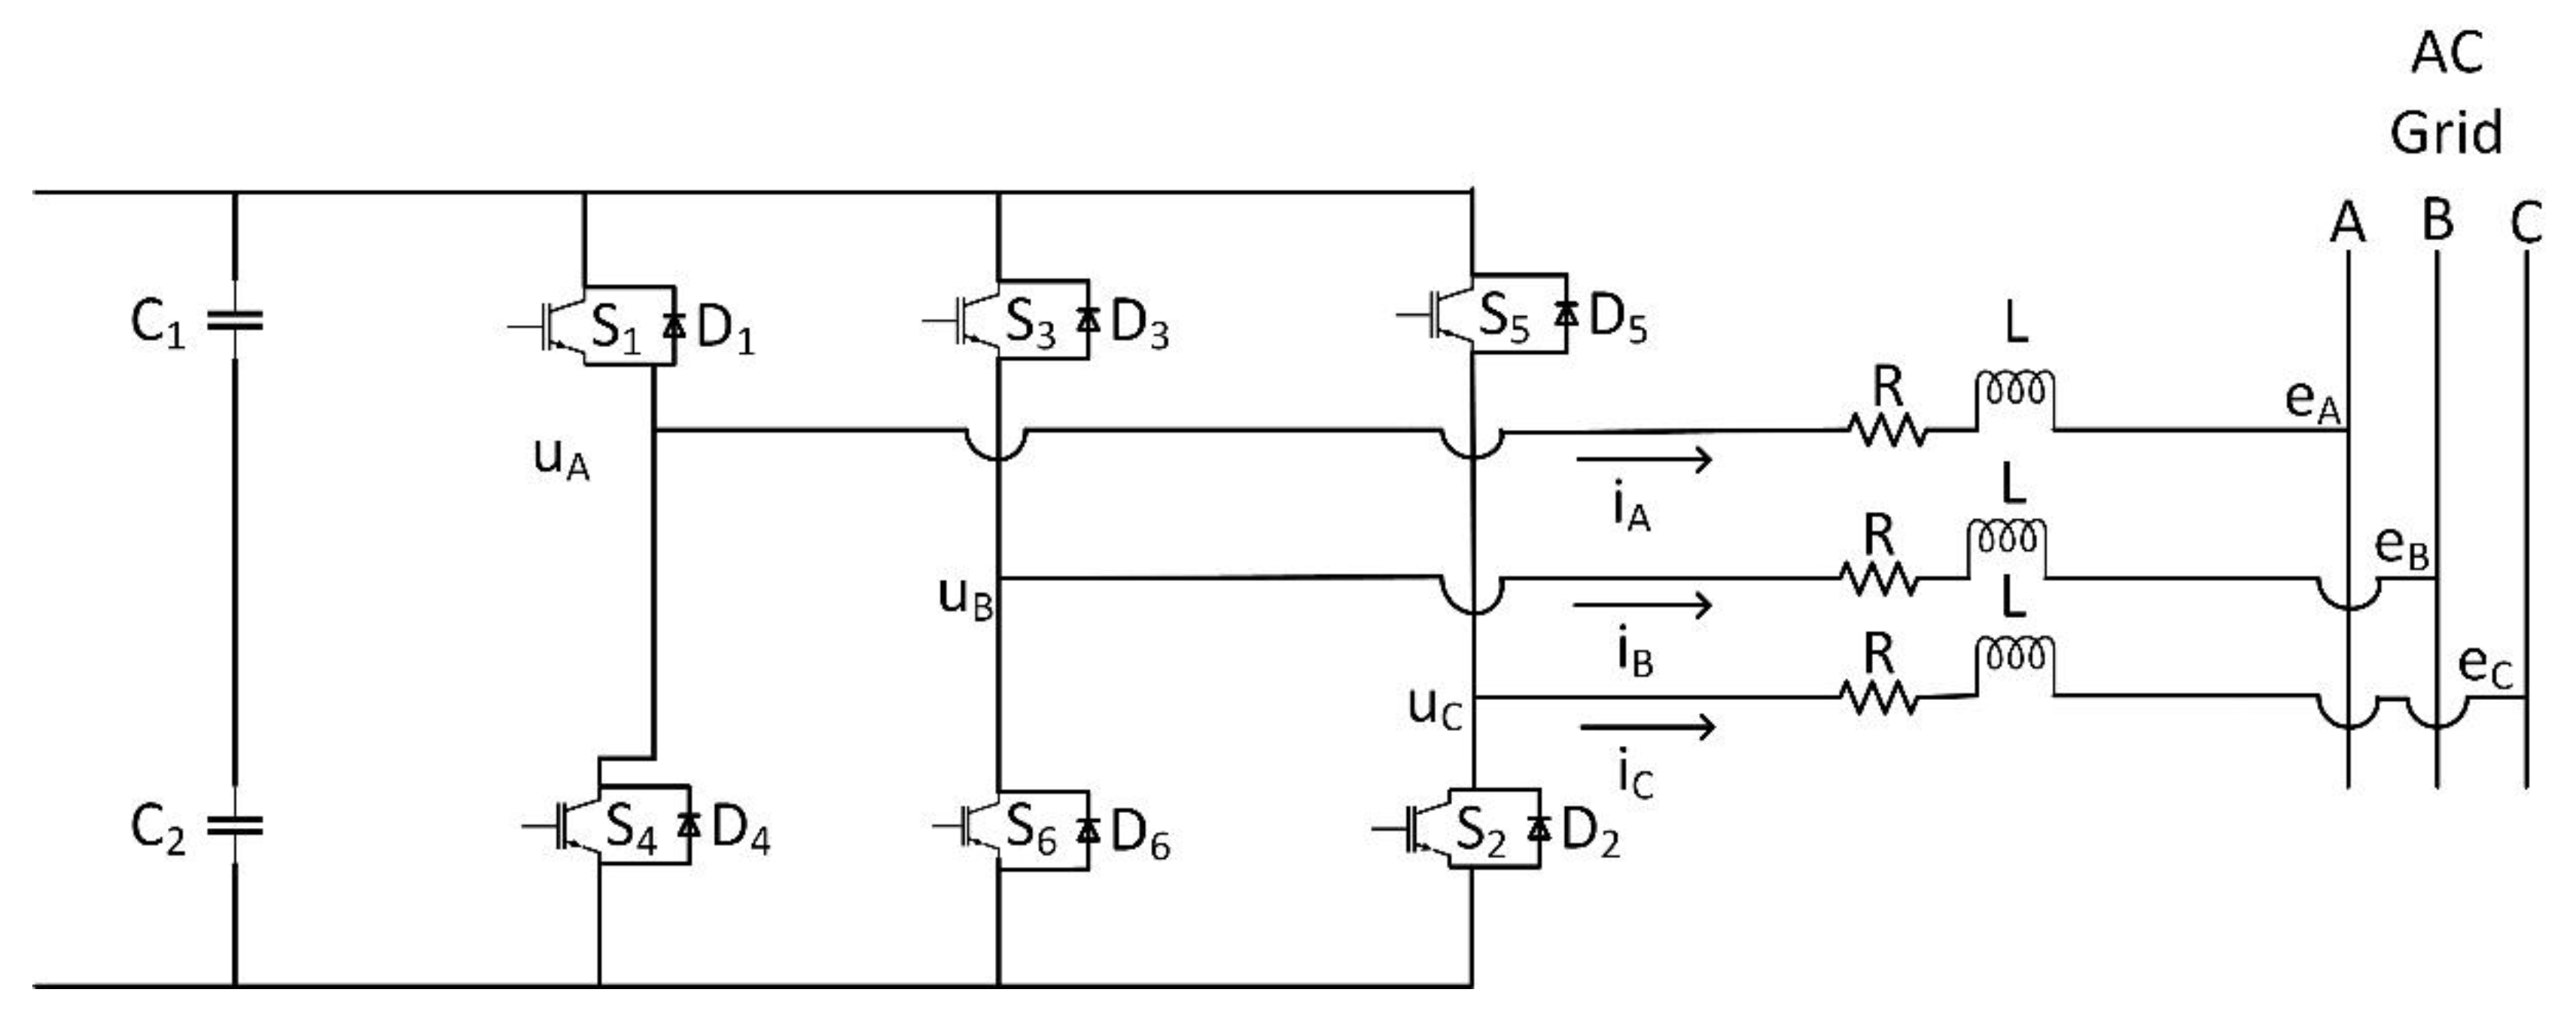
2.3. Power Converters

As it was mentioned before, a boost DC converter connects the photovoltaic system to the DC bus of the nanogrid. The duty cycle of this converter is adjusted based on the MPPT algorithm in order to extract the maximum power. Additionally, as it was mentioned before, the V2G technology requires a bidirectional DC-DC charger. Since the utility grid works under AC voltage, a DC-AC inverter was deployed. In this topology, the existence of the diodes connected in parallel to the switching devices (back-EMF clamp diodes) alongside with appropriate control signals of the IGBTs (or another kind of switching devices) make the bidirectional power flow feasible. These topologies, as well as their control methodology, will be examined in the following section.

2.4. LCL Filter

It is required by many standards that the Total Harmonic Distortion (THD) of the inverter output current should be less than 5%. For this reason, an LCL filter was used. This type of filter provides good harmonic attenuation by using small inductances. However, it is important to design the filter very carefully in order to ensure the stability of the system. In this study, the design methodology proposed in [31] was followed and the calculated parameters are given in Table A6 in Appendix A.

3. Control Strategy of the Power Converters

In this section, the topology and the control methodology of the power converters will be briefly discussed.

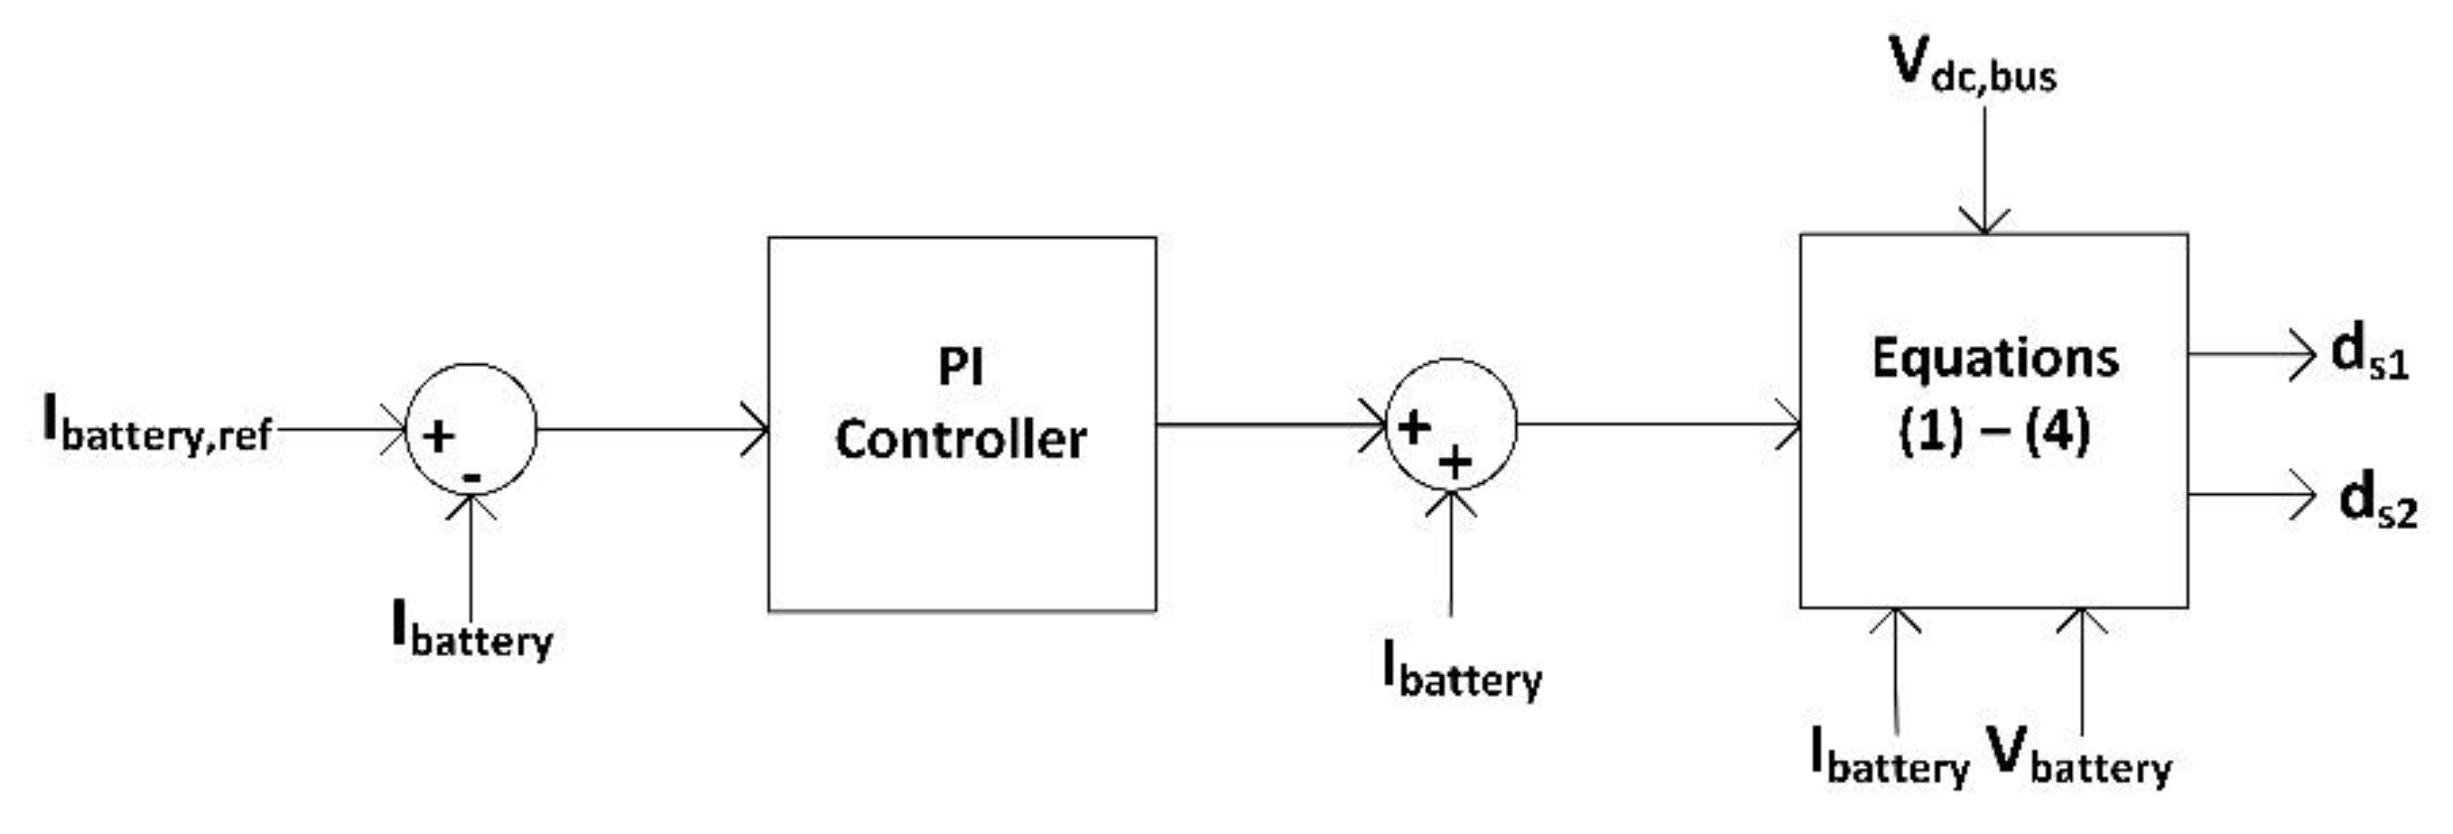
3.1. The Bidirectional DC-DC Converter

For this application, the bidirectional half-bridge DC-DC converter was selected. This topology is illustrated in Figure 2 and enables the bidirectional power transfer between the EV batteries and the DC nanogrid according to the V2G technology. This configuration provides high efficiency and power density. Galvanic isolation was not provided since this topology does not include a transformer. However, due to the lack of the transformer, the cost and the size of the converter were reduced. Furthermore, the two voltage sides of the converter could not be switched. Τhe latter was not a big issue in the current application since the voltage of the EV batteries was always lower than the DC bus voltage.
The bidirectional converter consists of one inductance (L), two capacitors (Cch, C) and two switching devices (S1, S2). During the V2G operation, the controllable switch is the S2 while the S1 is turned off when the EV battery is charging. The opposite control strategy occurs (S2 is off and S1 is the controllable switch) when the EV battery is discharging. In the current study, the nominal power of the charger was selected to be 6.6 kW. This value corresponds to a commercial EV charger. A complete design methodology of this bidirectional charger can be found in [29]. All the parameters of the bidirectional DC-DC converter are included in Table A4 in Appendix A.
Based on the theoretical analysis conducted by Skouros et al. [29] and by Khan et al. [32], the transferred power through the half-bridge DC-DC was controlled based on the following equations:
d S 1 = 1 V d c , b u s ( V b a t t e r y i R ch L ch i r e f i T sw ) ,
d S 2 = 0 ,
where Tsw is the switching period. The duty cycle of the switching devices for the V2G operation are:
d S 1 = 0 ,
d S 2 = 1 1 V d c , b u s ( V b a t t e r y i R ch L ch i r e f i T sw ) ,
Taking into consideration that the EV batteries are charging/discharging under the Constant Current (CC) mode, for the reference current the follow equation applies:
I b a t t e r y , r e f = P r e f V b a t t e r y ,
where Pref is the desired active power that should be transferred through the converter. Figure 3 illustrates the control scheme of the DC-DC converter. The Proportional-Integral (PI) controller eliminates the error between the measured and the reference current. Afterwards, the duty cycle was calculated based on the Equations (1)–(4) and the required measurements.

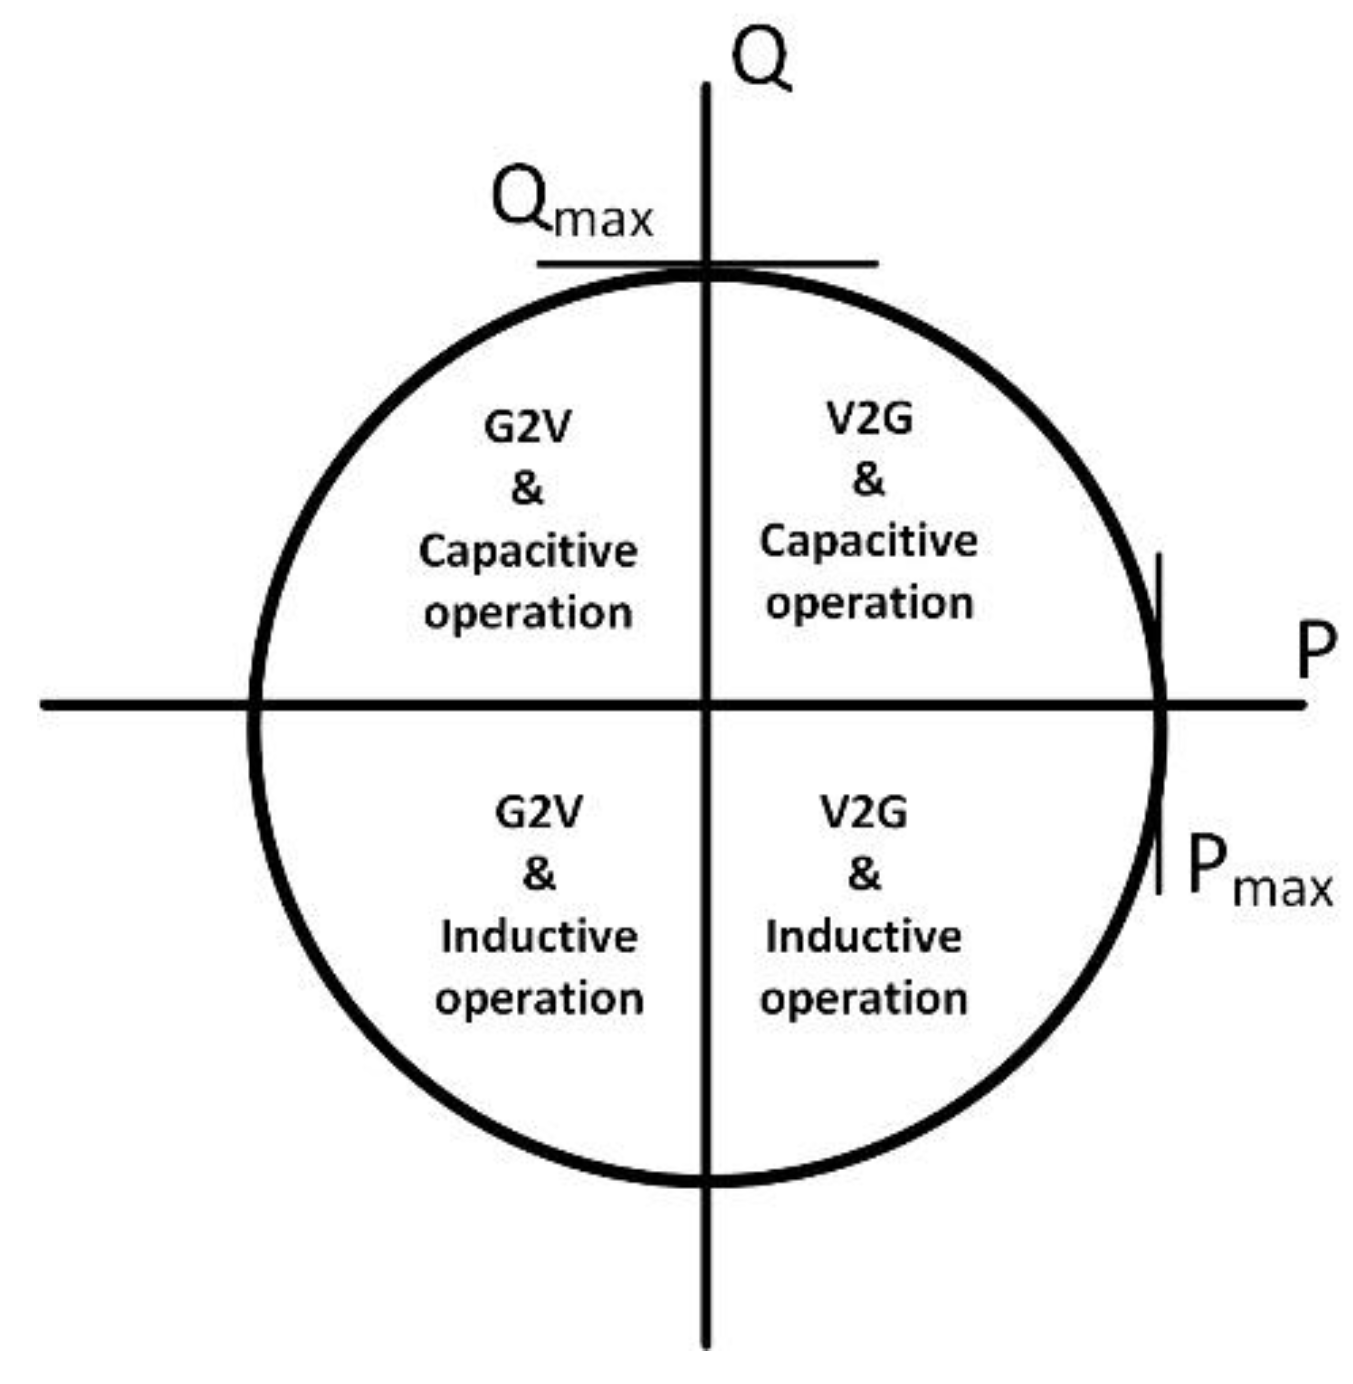
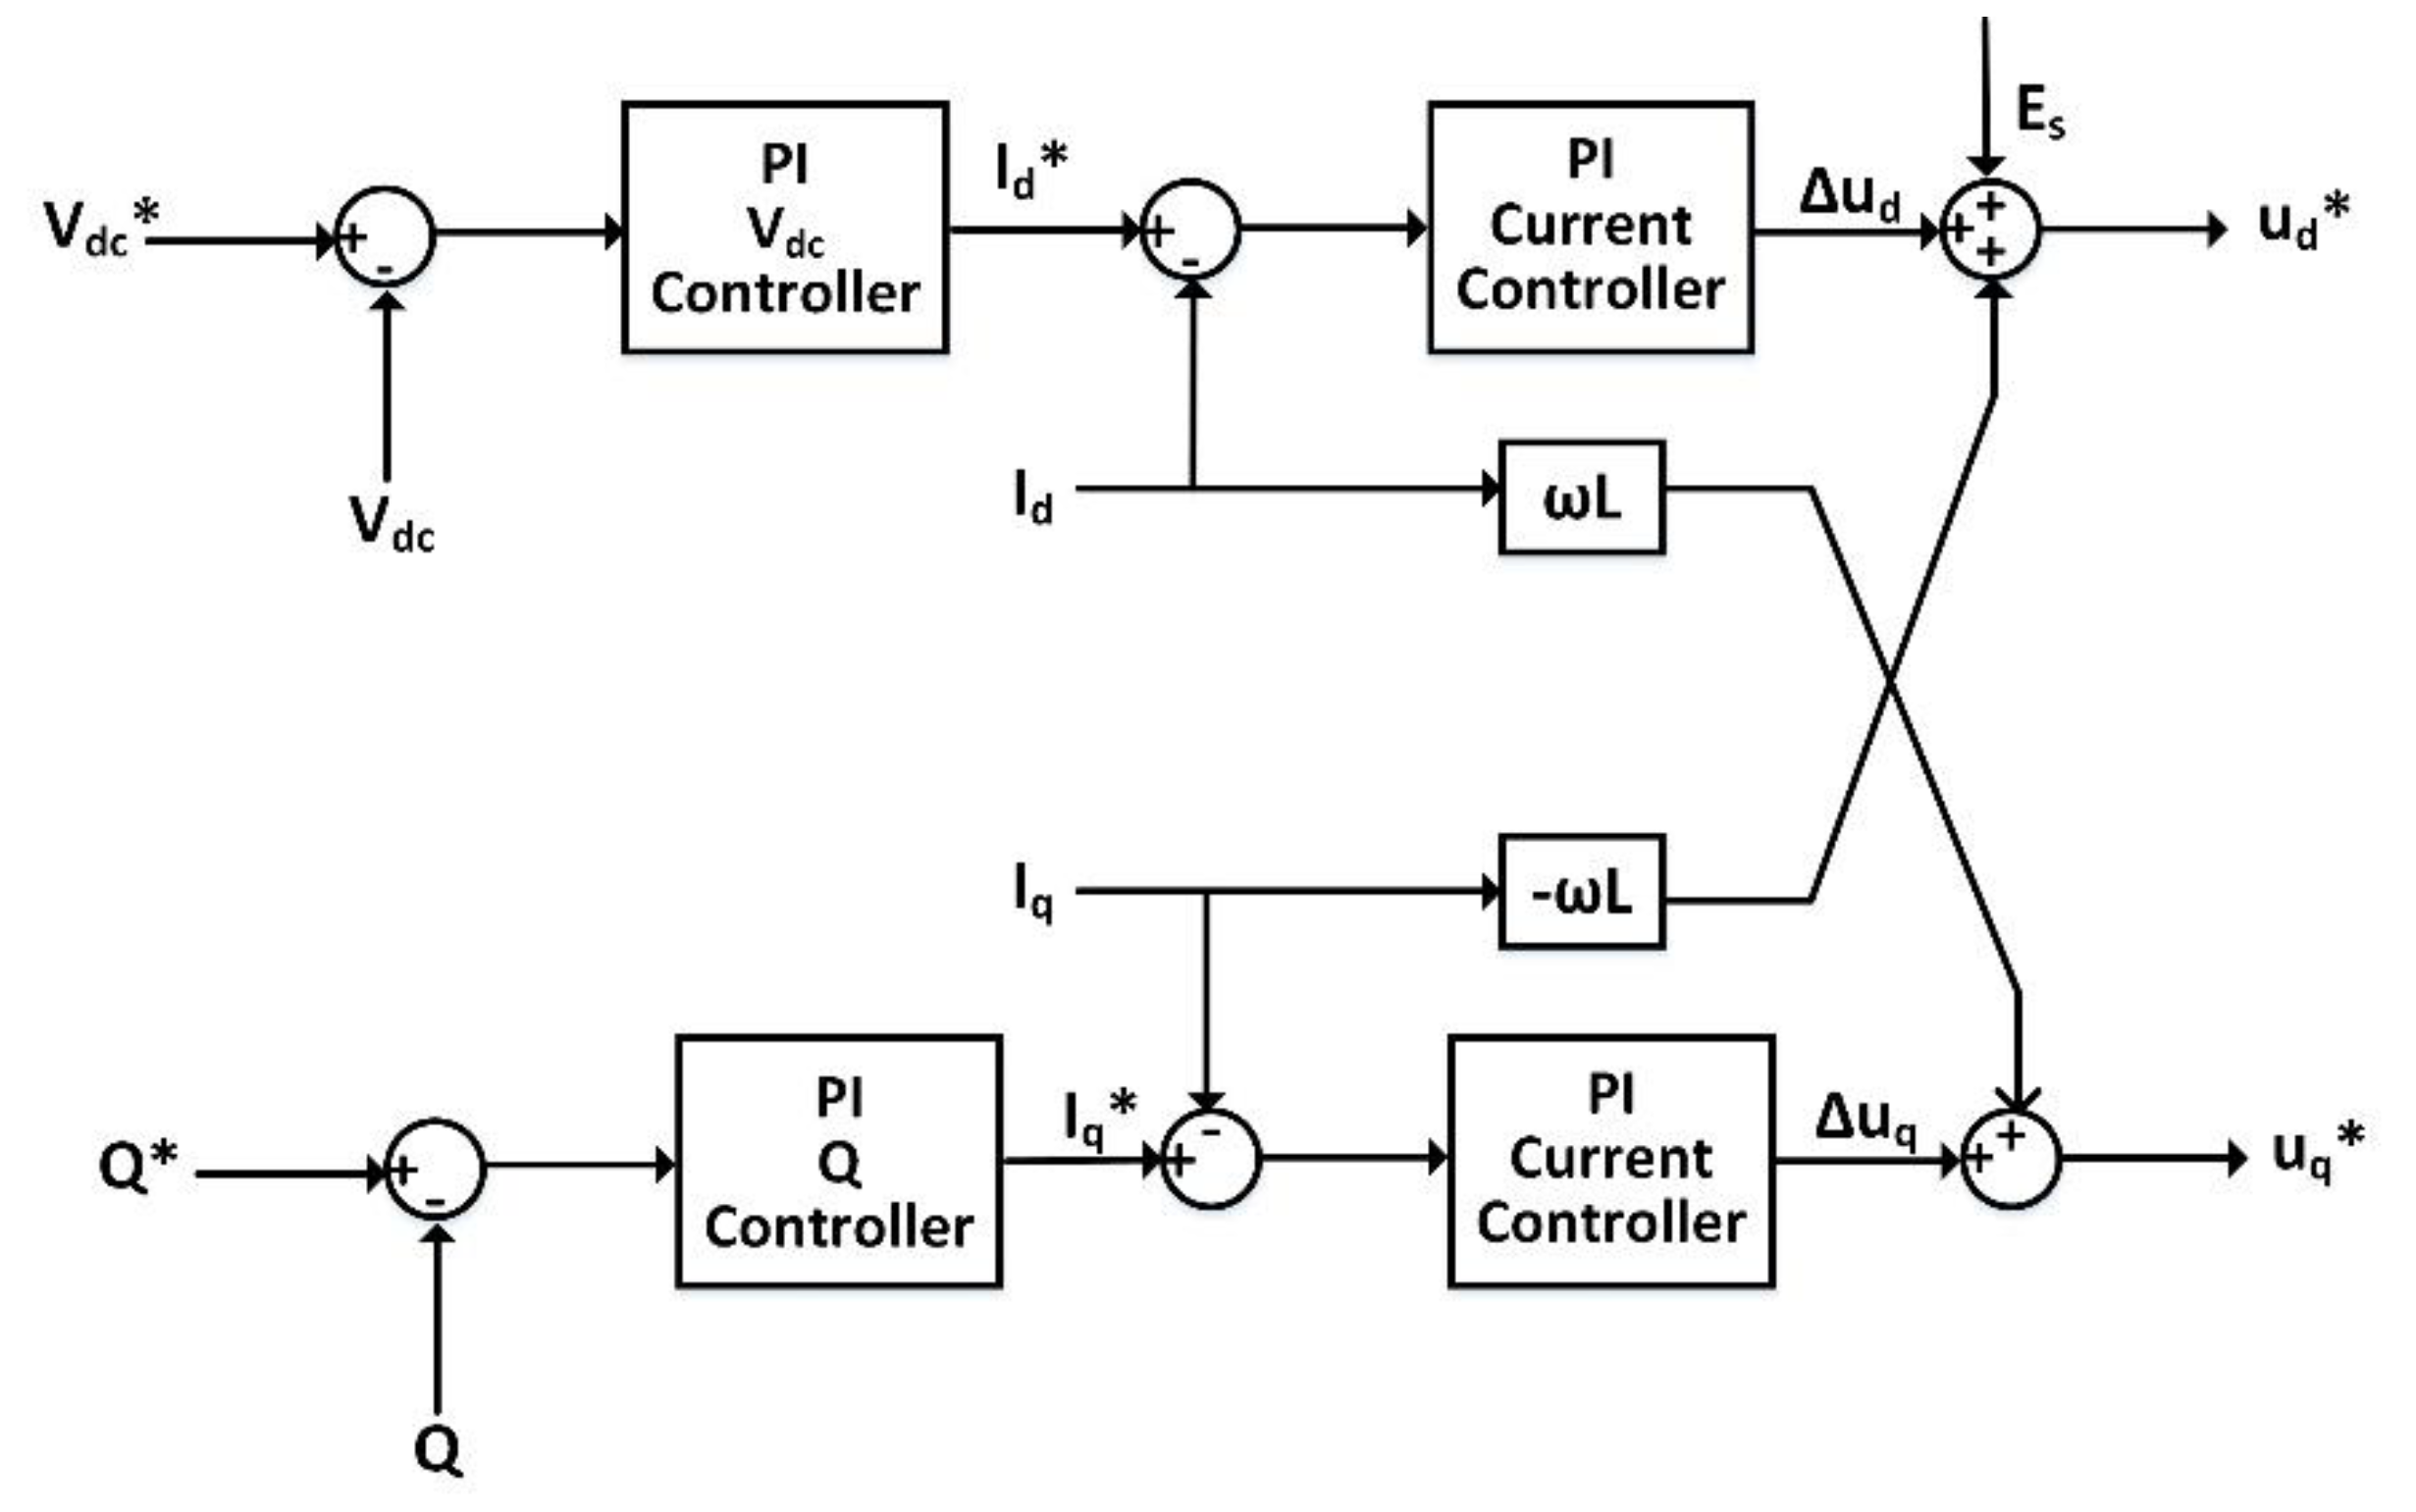
3.2. The DC-AC Inverter

In the present study, a three-phase voltage source converter was used in order to connect the DC nanogrid to the utility grid. This topology was characterized by the four-quadrant operation. Thus, as it is illustrated in Figure 4, it was feasible to inject or absorb reactive power to the AC power grid during the V2G or Grid-to-Vehicle (G2V) operation.
Figure 5 depicts the topology of the DC-AC Inverter. It consists of three one-phase half-bridge inverters. The maximum apparent power that can be transferred through the DC-AC inverter is equal to 27.6 kVA while the DC bus voltage should be kept constant at the value of 700 V. All the parameters of the inverter are given in Table A6 in Appendix A. A step by step design methodology for this converter can be found in [30].
In order to control the transferred active and reactive power, the dq reference frame was used. According to this transformation, the control variables are transformed from their natural abc frame to the stationary dq frame that rotates synchronously with the frequency of the AC power grid voltage. In this way, the steady-state error was eliminated. More information about the abc to dq transformation can be found in the research of Skouros et al. [29], Rocabert et al. [33] and Timbus et al. [34]. Additionally, in order to synchronize the inverter with the power grid, the Phased-Locked Loop (PLL) algorithm was used. Based on Figure 5 the following equation applies:
[ u d u q ] = [ e d e q ] + L d d t [ i d i q ] + ω L [ i q i d ] + R [ i d i q ] ,
where R and L are the resistive and inductive component of the grid impedance that connects the nanogrid with the utility grid respectively. Based on the theoretical analysis conducted by Skouros et al. [29] and Khan et al. [32] the Equation (6) can be rewritten as:
{ u d = E s ω L i q + Δ u d u q = ω L i d + Δ u q ,
where Es is the AC power grid voltage and:
{ Δ u d = L d i d d t + R i d Δ u q = L d i q d t + R i q ,
According to the dq reference frame and the PLL algorithm that was used, the active and reactive power transferred through the converter are:
{ P = 3 2 e d i d Q = 3 2 e d i q ,
Equation (9) indicates that the active power is controlled through the id current. In the present work, the d-axis current was adjusted in order to keep the DC bus voltage constant:
i d * = k p ( V dc * V dc ) + k i ( V dc * V dc ) d t ,
In this way, the voltage of the DC link was kept constant at the value of 700 V, which is vital for the proper operation of the whole configuration. The q-axis current controls the transferred reactive power since the following equation applies.
i q * = k p ( Q * Q ) + k i ( Q * Q ) d t ,
In addition, PI controllers were deployed to set the values of q-axis and d-axis currents, the DC bus voltage (Vdc) and the reactive power (Q) to their reference value. The control system of the DC-AC inverter based on the equations above is given in Figure 6.

4. Voltage Regulation

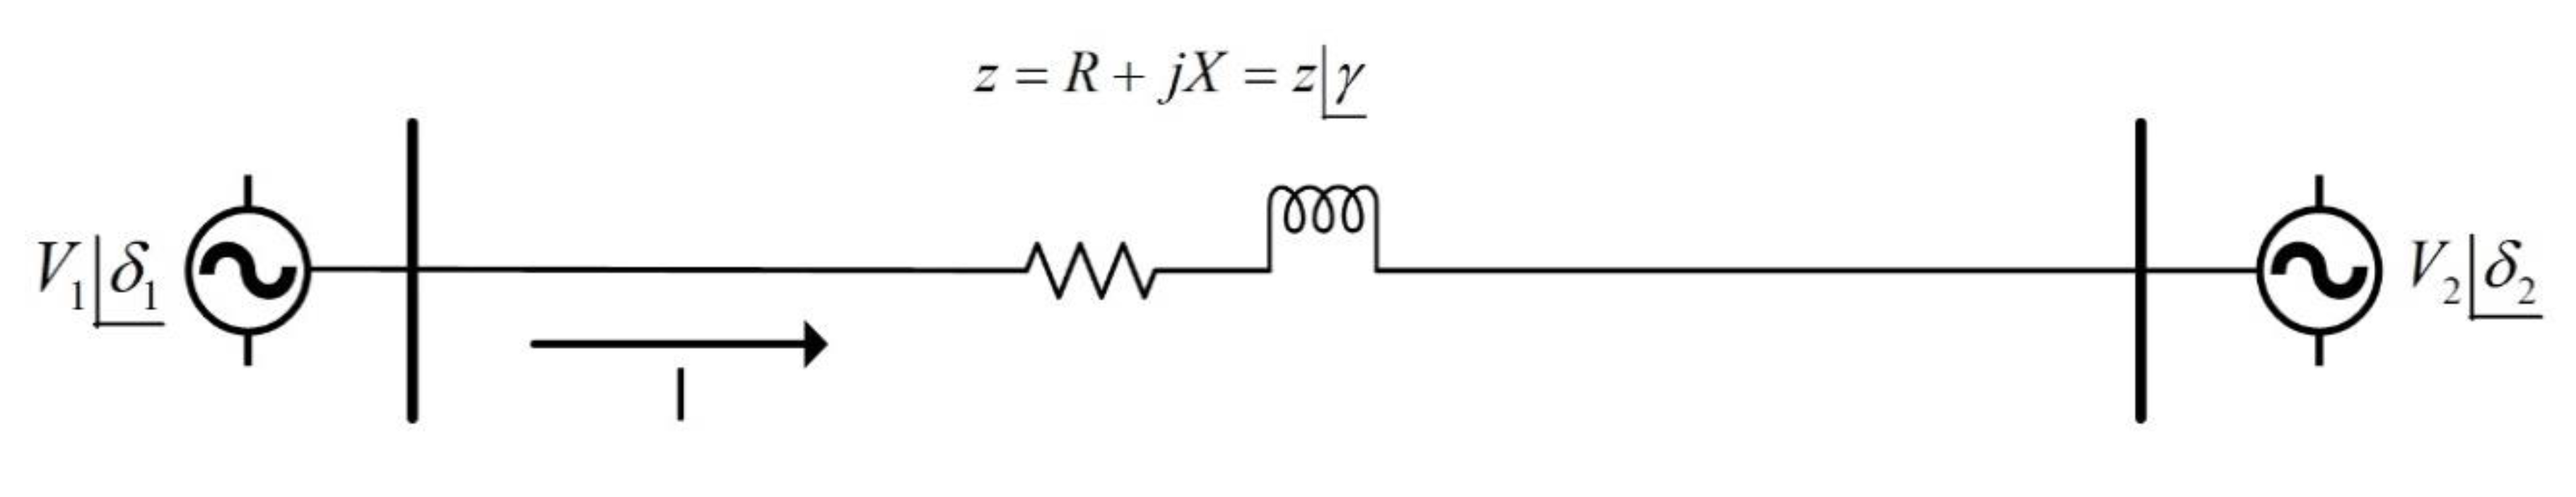
4.1. Theoretical Analysis Neglecting the Resistive Component of the Power Grid Impedance

In this section, the provision of voltage regulation through the DC nanogrid will be discussed. Figure 7 illustrates two AC buses connected through a transmission line with impedance z. The voltage sources that are depicted below can represent either a conventional AC bus of the power grid or the inverter’s output of DC nanogrid. In both cases, the same analysis and the equations below apply.
Based on Figure 7 the value of the current I will be given by the following equation.
Ι = V 1 δ 1 V 2 δ 2 z γ = V 1 δ 1 γ z V 2 δ 2 γ z ,
The apparent transferred power is:
S 1 2 = V 1 I * = V 1 δ 1 V 1 γ δ 1 z V 1 δ 1   V 2 δ 2 γ z   S 1 2 = V 1 2 z γ V 1 V 2 δ 2 γ δ 1 z ,
Taking into consideration that the apparent power is equal to S = P + jQ, the active and reactive power transferred between the two buses is given by the following two equations.
P 1 2 = V 1 2 Z cos γ V 1 V 2 Z cos ( γ + δ 1 δ 2 ) ,
Q 1 2 = V 1 2 Z sin γ V 1 V 2 Z sin ( γ + δ 1 δ 2 ) ,
In many studies, the grid impedance is considered mainly inductive (R = 0, γ = 90°) [35,36,37]. Thus, the above equations can be rewritten as follows:
P 1 2 = V 1 V 2 X sin ( δ 1 δ 2 ) ,
Q 1 2 = V 1 2 X V 1 V 2 X cos ( δ 1 δ 2 ) = V 1 X [ V 1 V 2 cos ( δ 1 δ 2 ) ] ,
In the power systems, the power angle δ = δ1δ2 takes small values. So, this parameter can be neglected.
In order to apply this theoretical analysis to the current application, it considered that the Bus 1 is the Point of Common Coupling (PCC, V1 = Vpcc) and the Bus 2 is a conventional AC grid Bus (V2 = Vg).
At this point, the parameter x is defined as follows:
x = V pcc V g ,
Under normal operation, this parameter is equal to 1. However, when a voltage swag or swell takes place, this parameter indicates the irregularity. Taking into consideration the aforementioned analysis, Equation (16) is written as follows:
Q = V g 2 X ( 1 x ) ,
Based on the Equation (18), the required reactive power can be calculated in order to overcome possible voltage instability. Assuming that one of the voltages of Figure 7 represents the inverter’s output voltage of an DC nanogrid, the required reactive power is given as the reference value to the inverter control system, as it was analyzed in Section 3. However, at this point, it should be noted that the maximum reactive power that can be transferred through the inverter should be taken into consideration. The maximum reactive power is given by the following equation:
Q max = { S 2 P pv 2 ,   when   the   EV   battery   is   not   connected S 2 ( P pv + P battery ) 2 ,   when   the   EV   battery   is   discharging S 2 ( P pv P battery ) 2 ,   when   the   EV   battery   is   charging ,
here Ppv is the power produced by the photovoltaic system.
However, in this technique according to Equation (18) the value of the line inductance should be available to calculate the required reactive power to overcome possible voltage instability. In case that the value of this parameter is not available, the following control method is proposed. As it was mentioned before, the reactive power is controlled through the q-axis current (Equation (11)). Thus, the control system of the q-axis current can be modified as it is illustrated in Figure 8.
In this case, a PI controller was used to adjust the q-axis current based on the voltage amplitude Vpcc and its reference value. Thus, there is no need to calculate the required reactive power. Additionally, the inverter reactive power limits have to be taken into consideration based on the following equation:
i q , m a x = 2 3 Q m a x u d ,
where the Qmax is given by Equation (19). Although the grid inductance value is not required in this method, the proper tuning of the PI controller should be done. The proposed controller replaces the “PI Q controller” that is illustrated in Figure 6. However, it should be noted that in case the value of the grid impedance is known, it is recommended to use the Equation (18) to calculate the required reactive power since the PI controller increases the complexity of the configuration. Additionally, the tuning of the controller could be challenging since the overshoot, the settling time and the steady-state error should be limited.

4.2. Theoretical Analysis Neglecting the Inductive Component of the Power Grid Impedance

In the analysis conducted in the previous subsection, the power grid impedance was considered pure inductive. However, this applies mostly to power transmission lines. Thus, in this subsection, the same analysis will be conducted but this time, neglecting the inductive component of the utility grid impedance. The Equations (13) and (14) can be rewritten as follows [38,39]:
P 1 2 = V g R 2 + X 2 [ R ( V g V pcc cos ( δ 1 δ 2 ) + X V pcc sin ( δ 1 δ 2 ) ] ,
Q 1 2 = V g R 2 + X 2 [ R V pcc sin ( δ 1 δ 2 ) + X ( V g V pcc cos ( δ 1 δ 2 ) ) ] ,
In this case, X = 0 and as it was mentioned before the difference δ = δ1δ2 is very small. Thus, the following equation applies:
P 1 2 = V g R 2 [ V g V pcc cos ( δ 1 δ 2 ) ] ,
Q 1 2 = V g V pcc R 2 [ R V pcc sin ( δ 1 δ 2 ) ] ,
Similar to the analysis explained in the previous subsection, in this case, the required active power to restore the voltage imbalance is given by the following equation:
P = V g 2 R ( 1 x ) ,
In case that the power grid resistance is not known, a PI controller can be used in order to adjust the required active power. As it concerns the maximum active power that can be transferred, the power limits are defined by the EV bidirectional DC charger. To be more specific, the maximum active power that can be exchanged is equal to the maximum charging/discharging power of the EV batteries. In this application, this value was equal to 6.6 kW. In addition, when the absorption of active power is required, besides the activation of the charging of the EV batteries, the curtailment of the PV energy can also be applied. In this way, the overvoltage is furtherly limited.

4.3. Theoretical Analysis Taking into Consideration Both the Inductive and Resistive Components of the Grid Impedance

The DC nanogrid that was studied in the present paper was connected to the low voltage AC distribution grid. Thus, the X/R ratio was typically ≤1 and neither the inductance nor the resistive component of the power grid inductance could be neglected. Based on Figure 7, the following equation apply:
V 1 = V 2 + I ( R + j X ) ,
The apparent power transferred between the two buses is:
S = P + j Q = V 1 I * ,
So, the current flowing between the buses is given by the following equation:
I = P j Q V 1   ,
Equation (27) can be rewritten as follows:
V 1 = V 2 + R P + X Q V 1 + j X P R P V 1 ,
The voltage difference between the two buses is:
Δ V = V 1 V 2 = R P + X Q V 1 + j X P R P V 1 ,
Since the angle between the voltages V1 and V2 are small:
Δ V = R P + X Q V 1 ,
According to the Equation (30), the greater the induction of the line, the greater the impact of the voltage regulation by adjusting the reactive power. Respectively, the impact of the voltage regulation through active power adjustment is greater when the resistive component of the power grid impedance is bigger. In the following section, the impact of active/reactive power support will be further investigated.

5. Simulation Results

So far, the design considerations of the DC nanogrid have been explained. Additionally, the provision of voltage regulation to the utility grid by exchanging active and reactive with the nanogrid was explained in the previous sections. In this section, some simulation results will be presented in order to investigate the effectiveness and the impact of the voltage regulation that can be provided by the DC nanogrid.

5.1. Reactive Power Control and Pure Inductive Power Grid Impedance

The topology that was studied in this section is illustrated in Figure 9. The DC nanogrid was connected to an AC bus of the low voltage AC distribution grid through its inverter as it was analyzed in the previous sections. The difference between Figure 9 and Figure 7 was that the DC nanogrid replaced the voltage V1 while the voltage source V2 was replaced by the AC bus Vg. Thus, the analysis and the equations that were described in the previous section applied in the current configuration. Additionally, the 100 kVA 380 V/20 kV distribution transformer stepped down the voltage from the medium voltage (20 kV) to the low voltage level (380 V). The grid impedance denoted as Lg in this scenario was considered pure inductive and equal to 0.5 mH. Due to the fact that the grid impedance was based on the theoretical analysis conducted in the previous section, the reactive power control method would be used. The purpose of the control method was to restore the Vpcc voltage to the nominal value in case of voltage sag or swell. In this study, a positive value of transferred value means that the nanogrid provides power to the utility grid while a negative one the opposite.
In this scenario, the voltage was decreased by 5% and 15% of the nominal value at the time t = 3 s and t = 6 s respectively as can be seen in Figure 10a. Concerning the active power, it was supposed that the EV batteries provided 6.6 kW while the PV system did not produce active power. At the time t = 3 s the voltage control system detected the voltage sag and the nanogrid provided 15 kVAr. In this way, based on Figure 10b, the voltage was restored to the nominal value. At t = 6 s the nanogrid provided more reactive power since a second voltage sag occurred. However, the voltage could not be fully restored to the reference value due to the reactive power limits (Equation (19)). Figure 10c depicts the transferred power through the inverter.

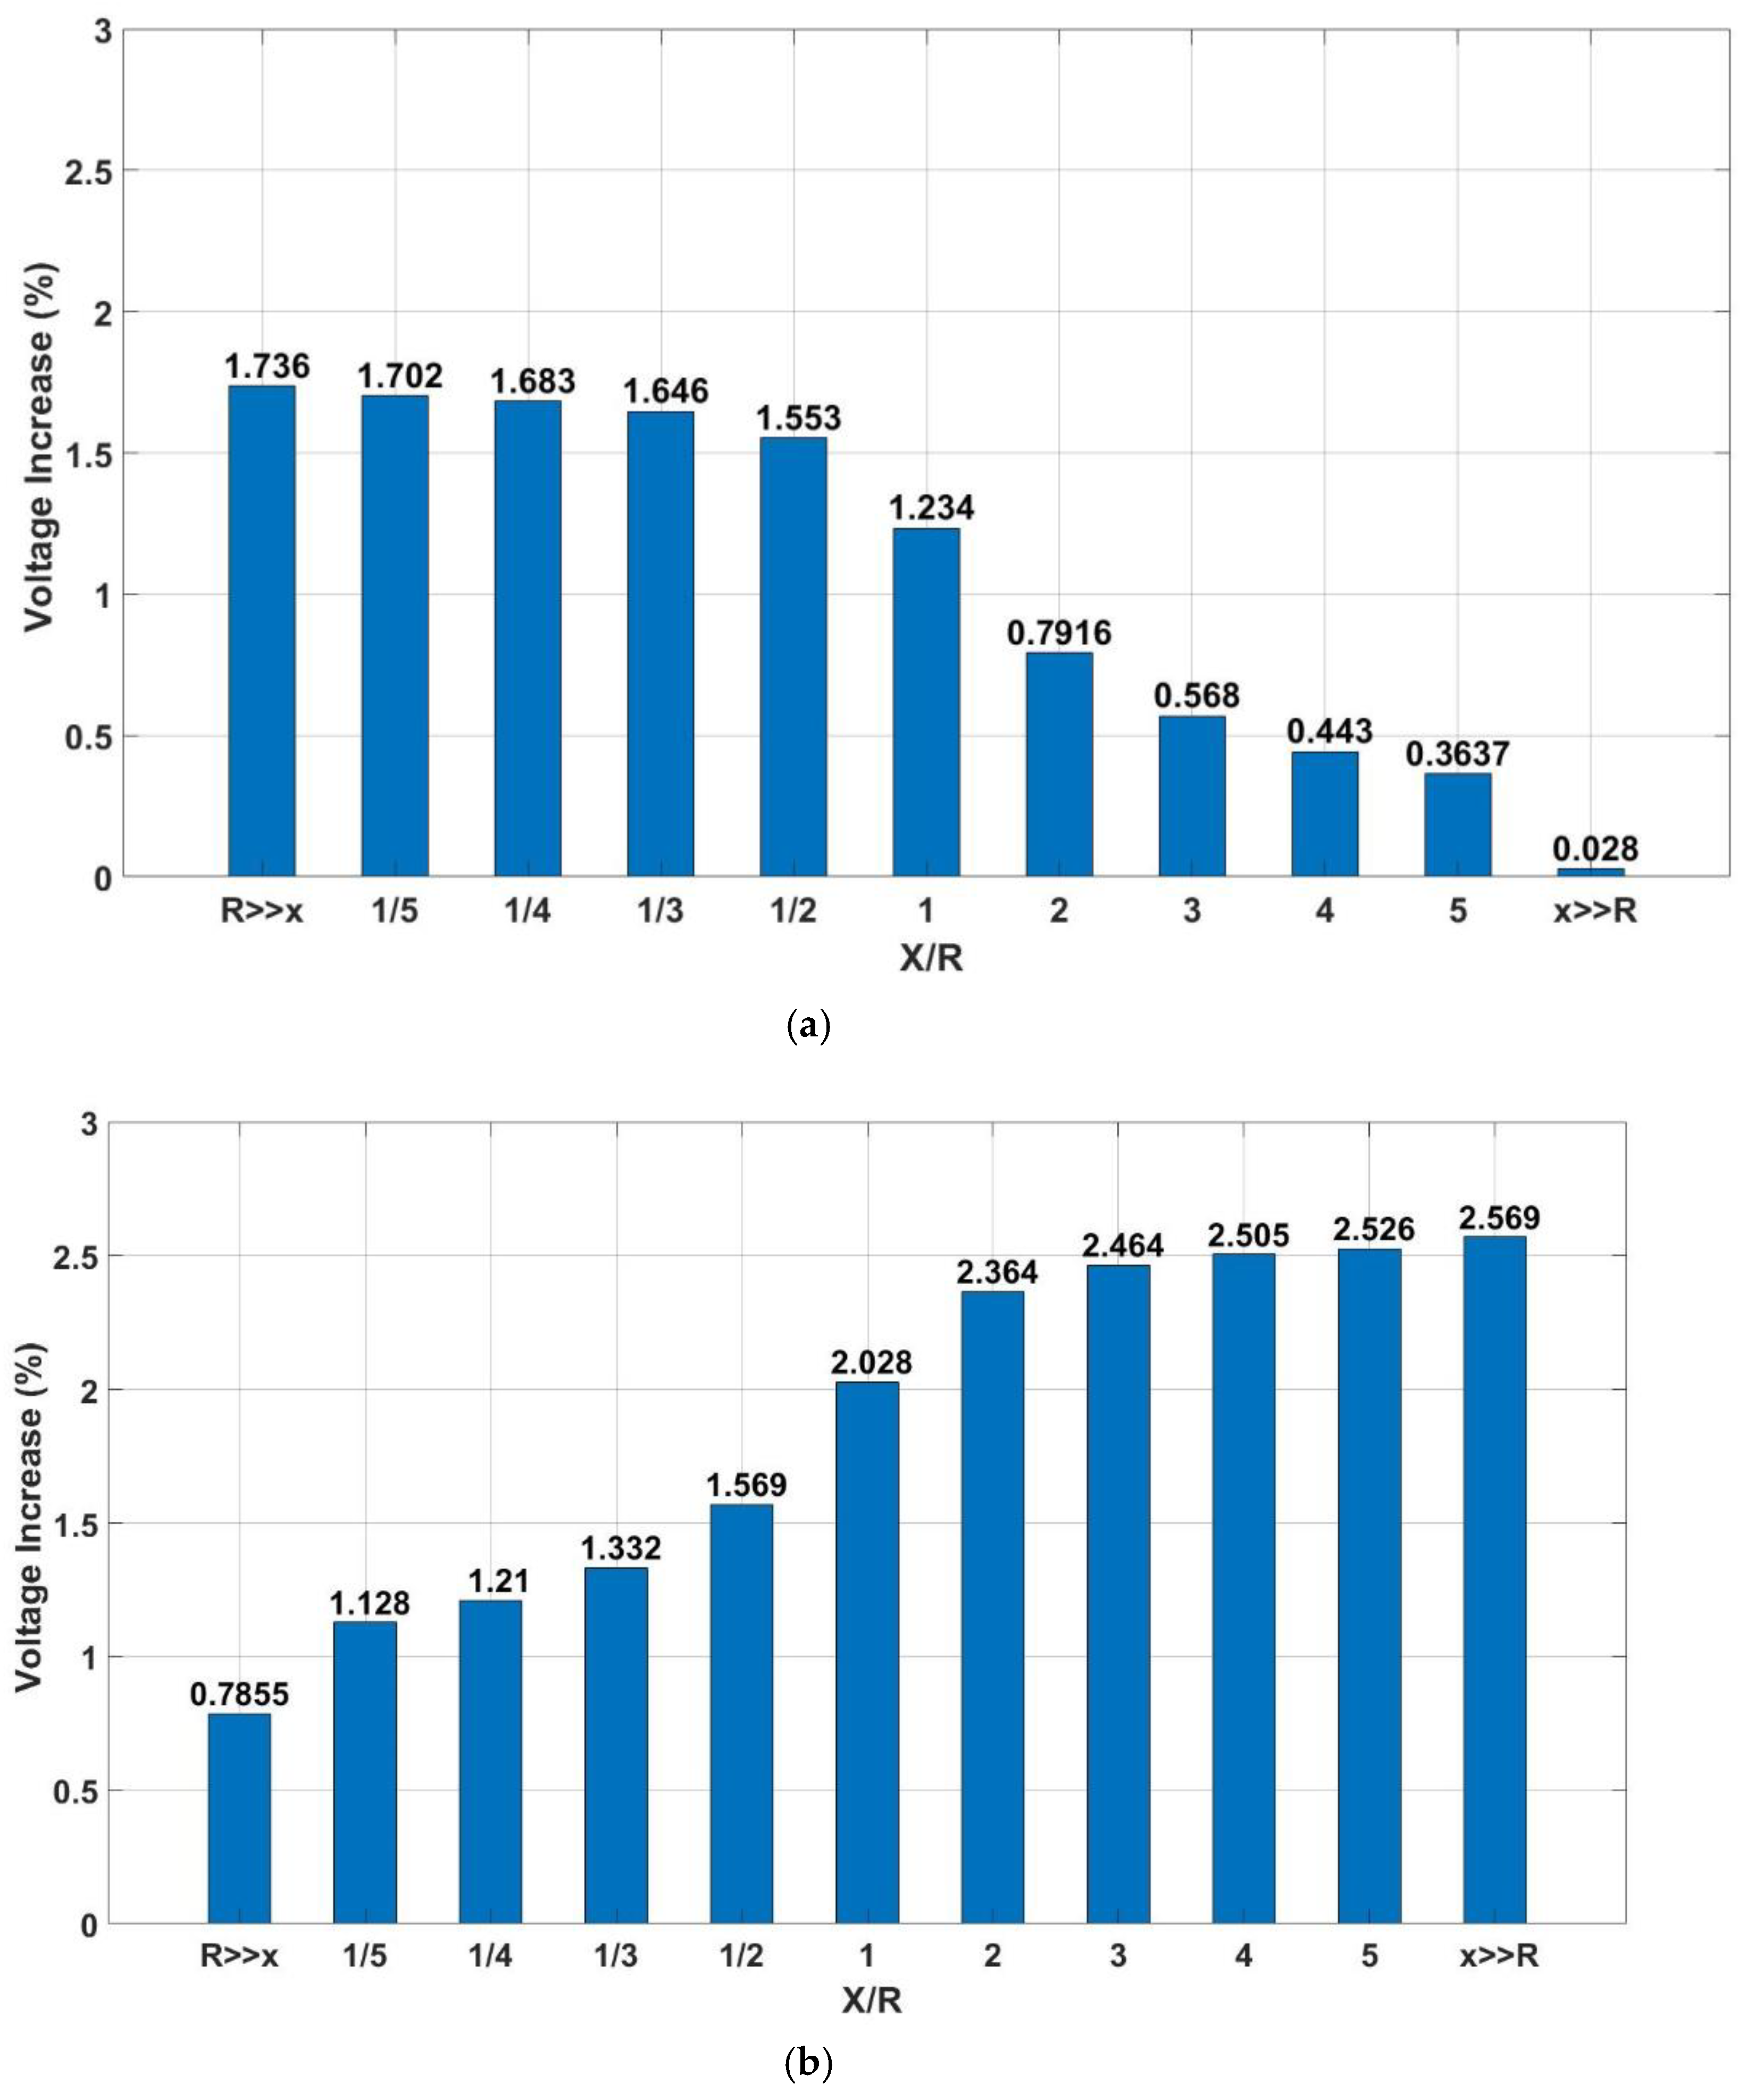
5.2. Comparison between Active and Reactive Power Support

In the previous simulation scenario, the grid impedance was considered pure inductive. However, as it was mentioned before the resistive component of the line impedance was not negligible. Thus, it should be taken into consideration. The value of the grid impedance depends on many factors such as the material of the conductor, the length of the line, etc. So, in this scenario, the impact of active and reactive power support for difference X/R ratios of the power grid impedance will be investigated.
The topology that was used was the same as in Figure 9. The maximum active power that could be provided for voltage regulation was equal to the maximum power that could be transferred through the bidirectional EV charger and was equal to 6.6 kW. Thus, in order to have a fair comparison between the two methods, the reactive power transferred in this scenario was considered equal to 6.6 kVAr. The voltage drop that occurred was equal to 10% of the nominal voltage value. Figure 11 depicts how much the voltage increased when the active and reactive power support was activated for different X/R ratios.
The following conclusions could be drawn from the figures above. First of all, as it was expected the reactive power support was more efficient when the grid impedance was more inductive than resistive and vice versa. Indicatively, when the X/R ratio was equal to 5 and reactive power was provided the voltage increase was 2.569%. On the contrary, for the same X/R ratio, when active power was exchanged, the voltage increase was 0.443%. Another conclusion that could be extracted from the figure above, was that in general, the reactive power support was more effective. For instance, when the X/R ratio was equal to 1, someone could expect that the reactive and active power support would have had the same voltage increase. However, the reactive power support increased the voltage by 2.028% in comparison to the active power support that increased voltage by 1.234%. Τhis can be justified due to the existence of the transformer. To be more specific, the windings of the transformer were mostly inductive. Thus, their inductance contributes to the voltage support during the provision of reactive power from the nanogrid. So, the parameters of the transformer, as well as its distance from the PCC, should be taken into consideration.

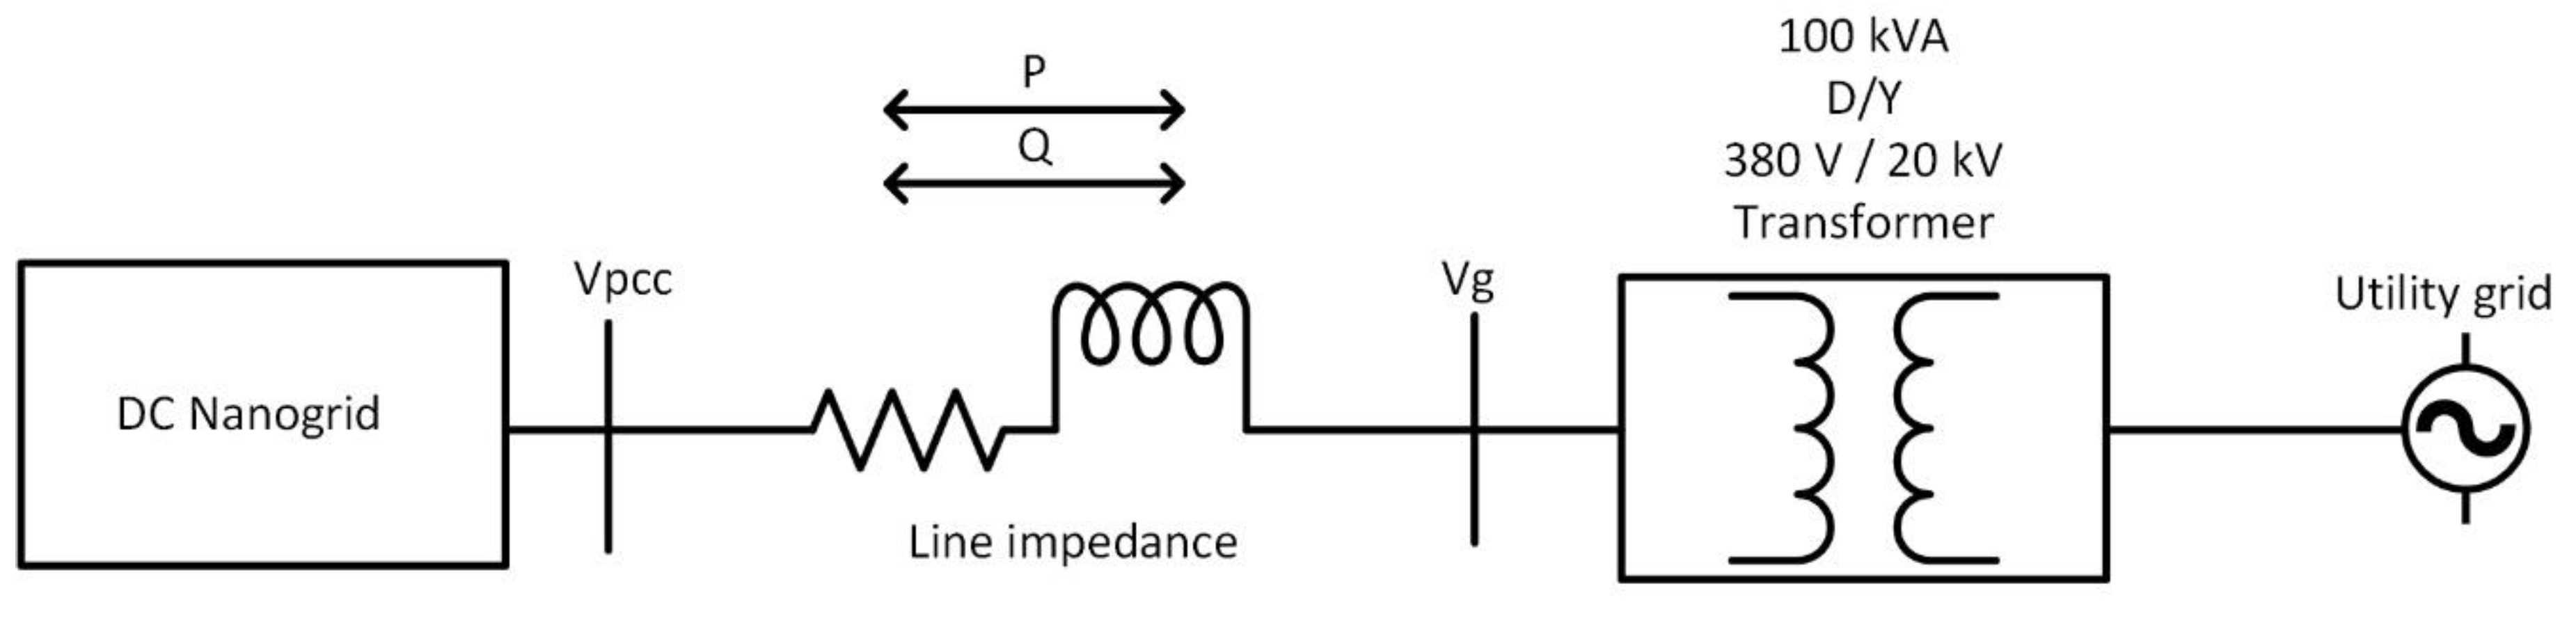
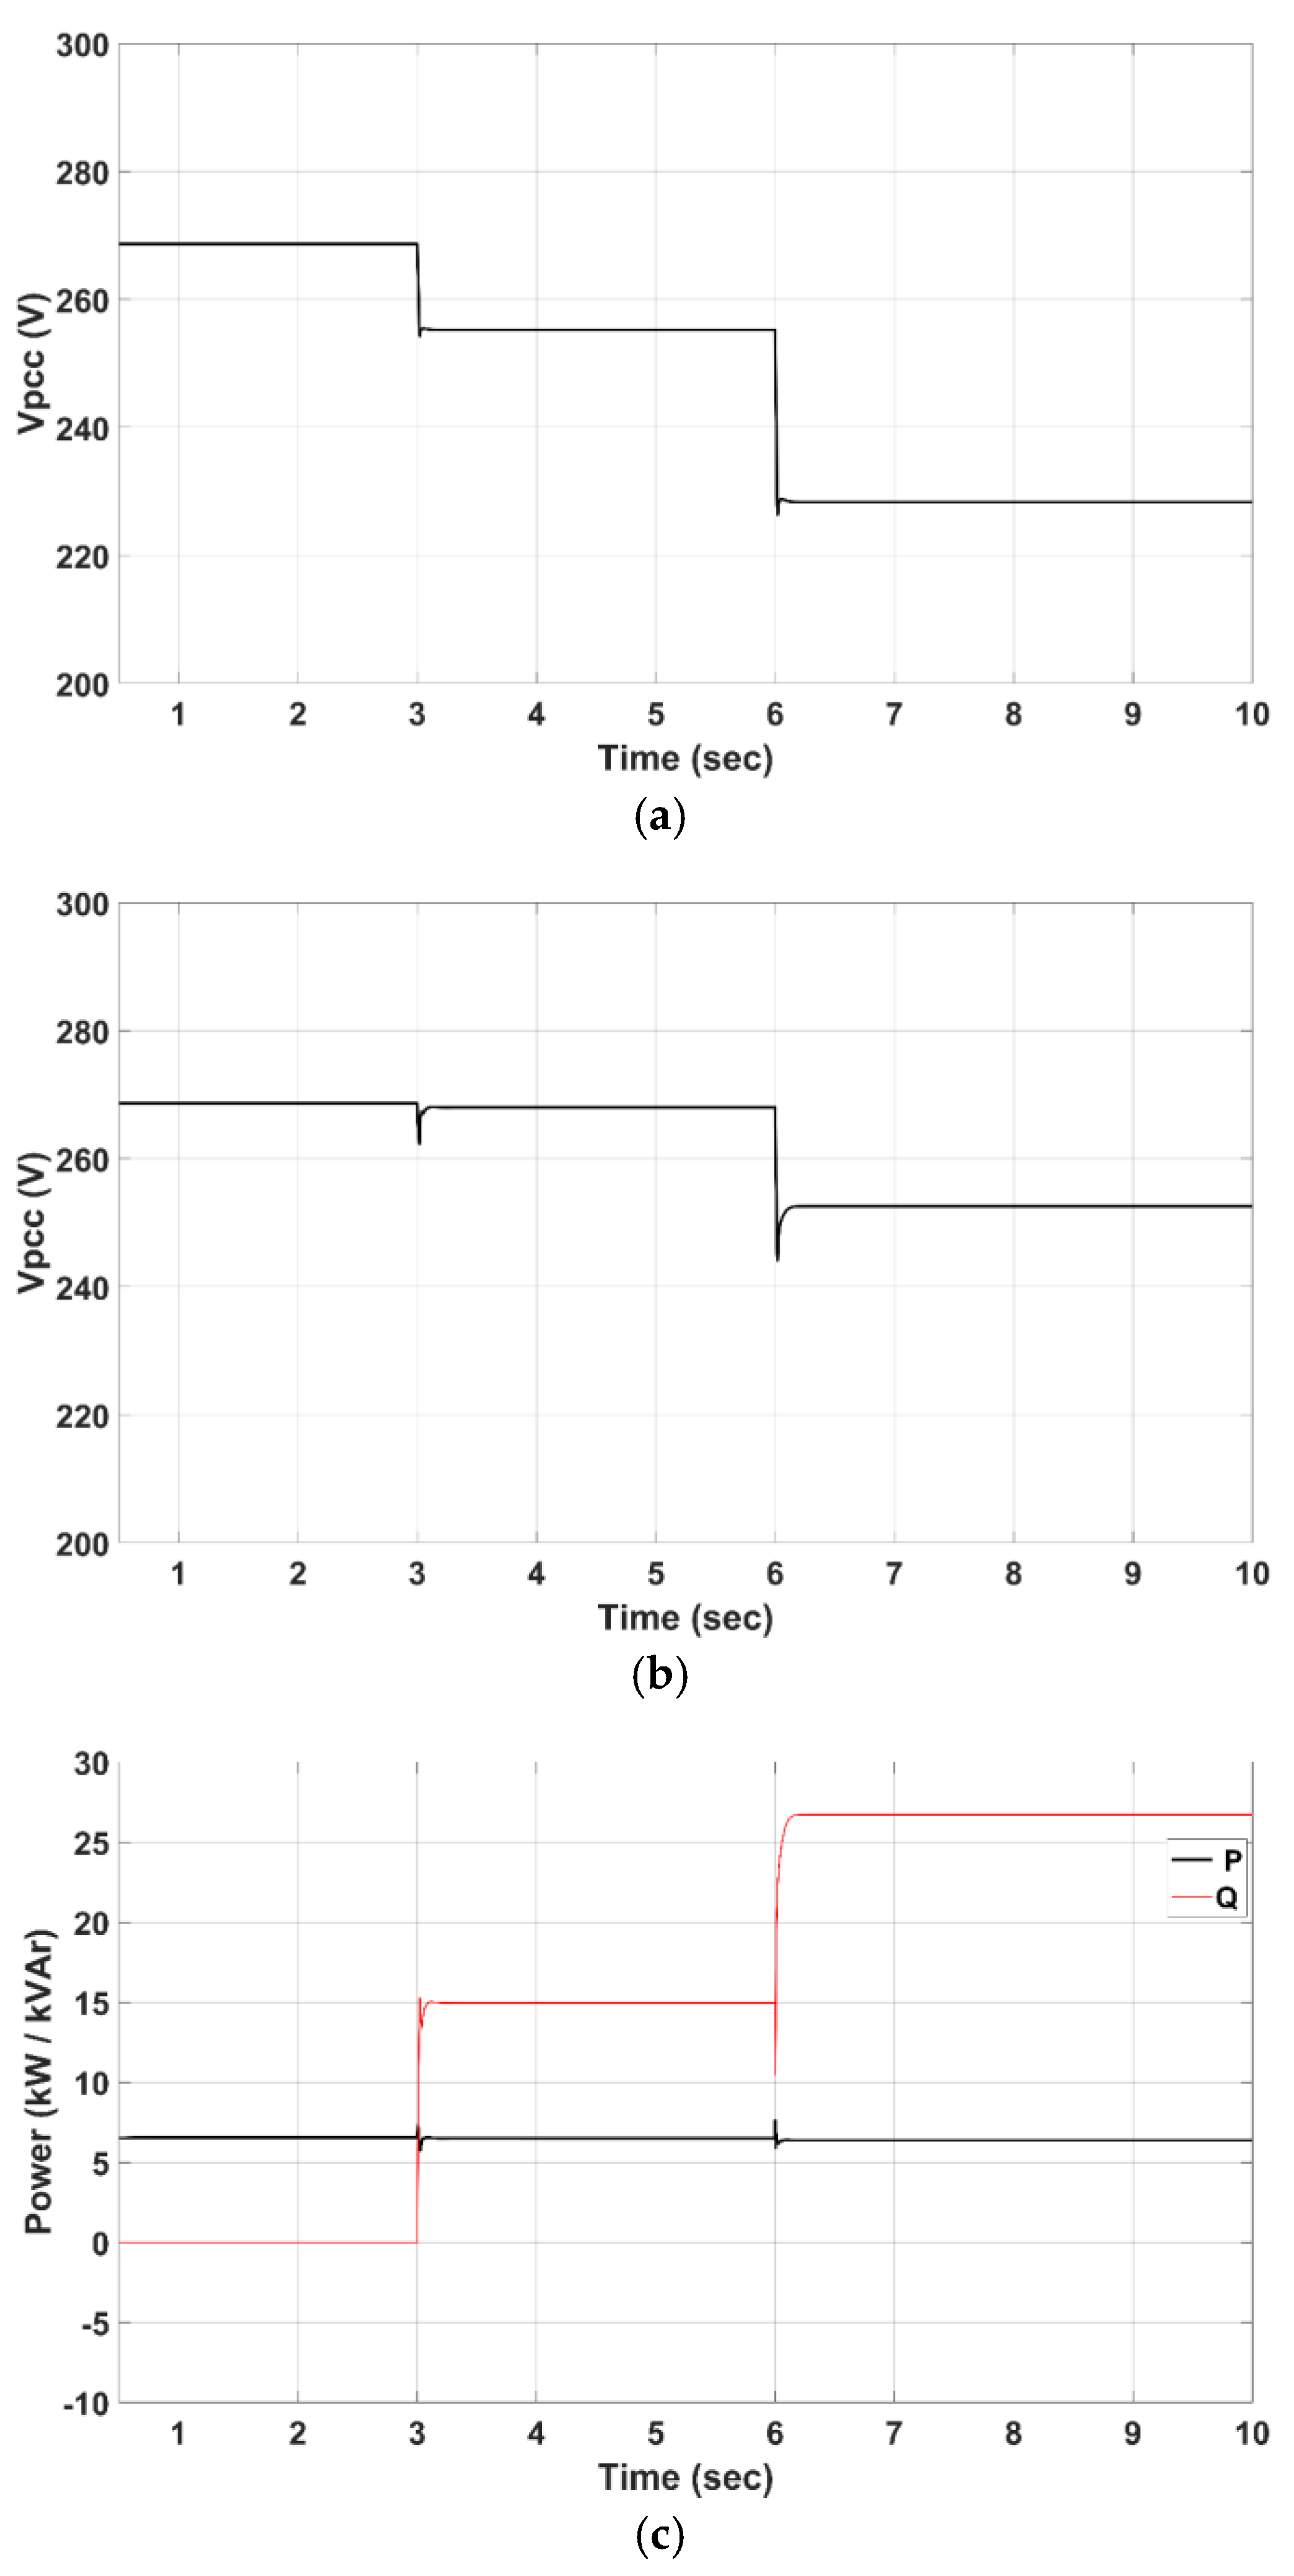
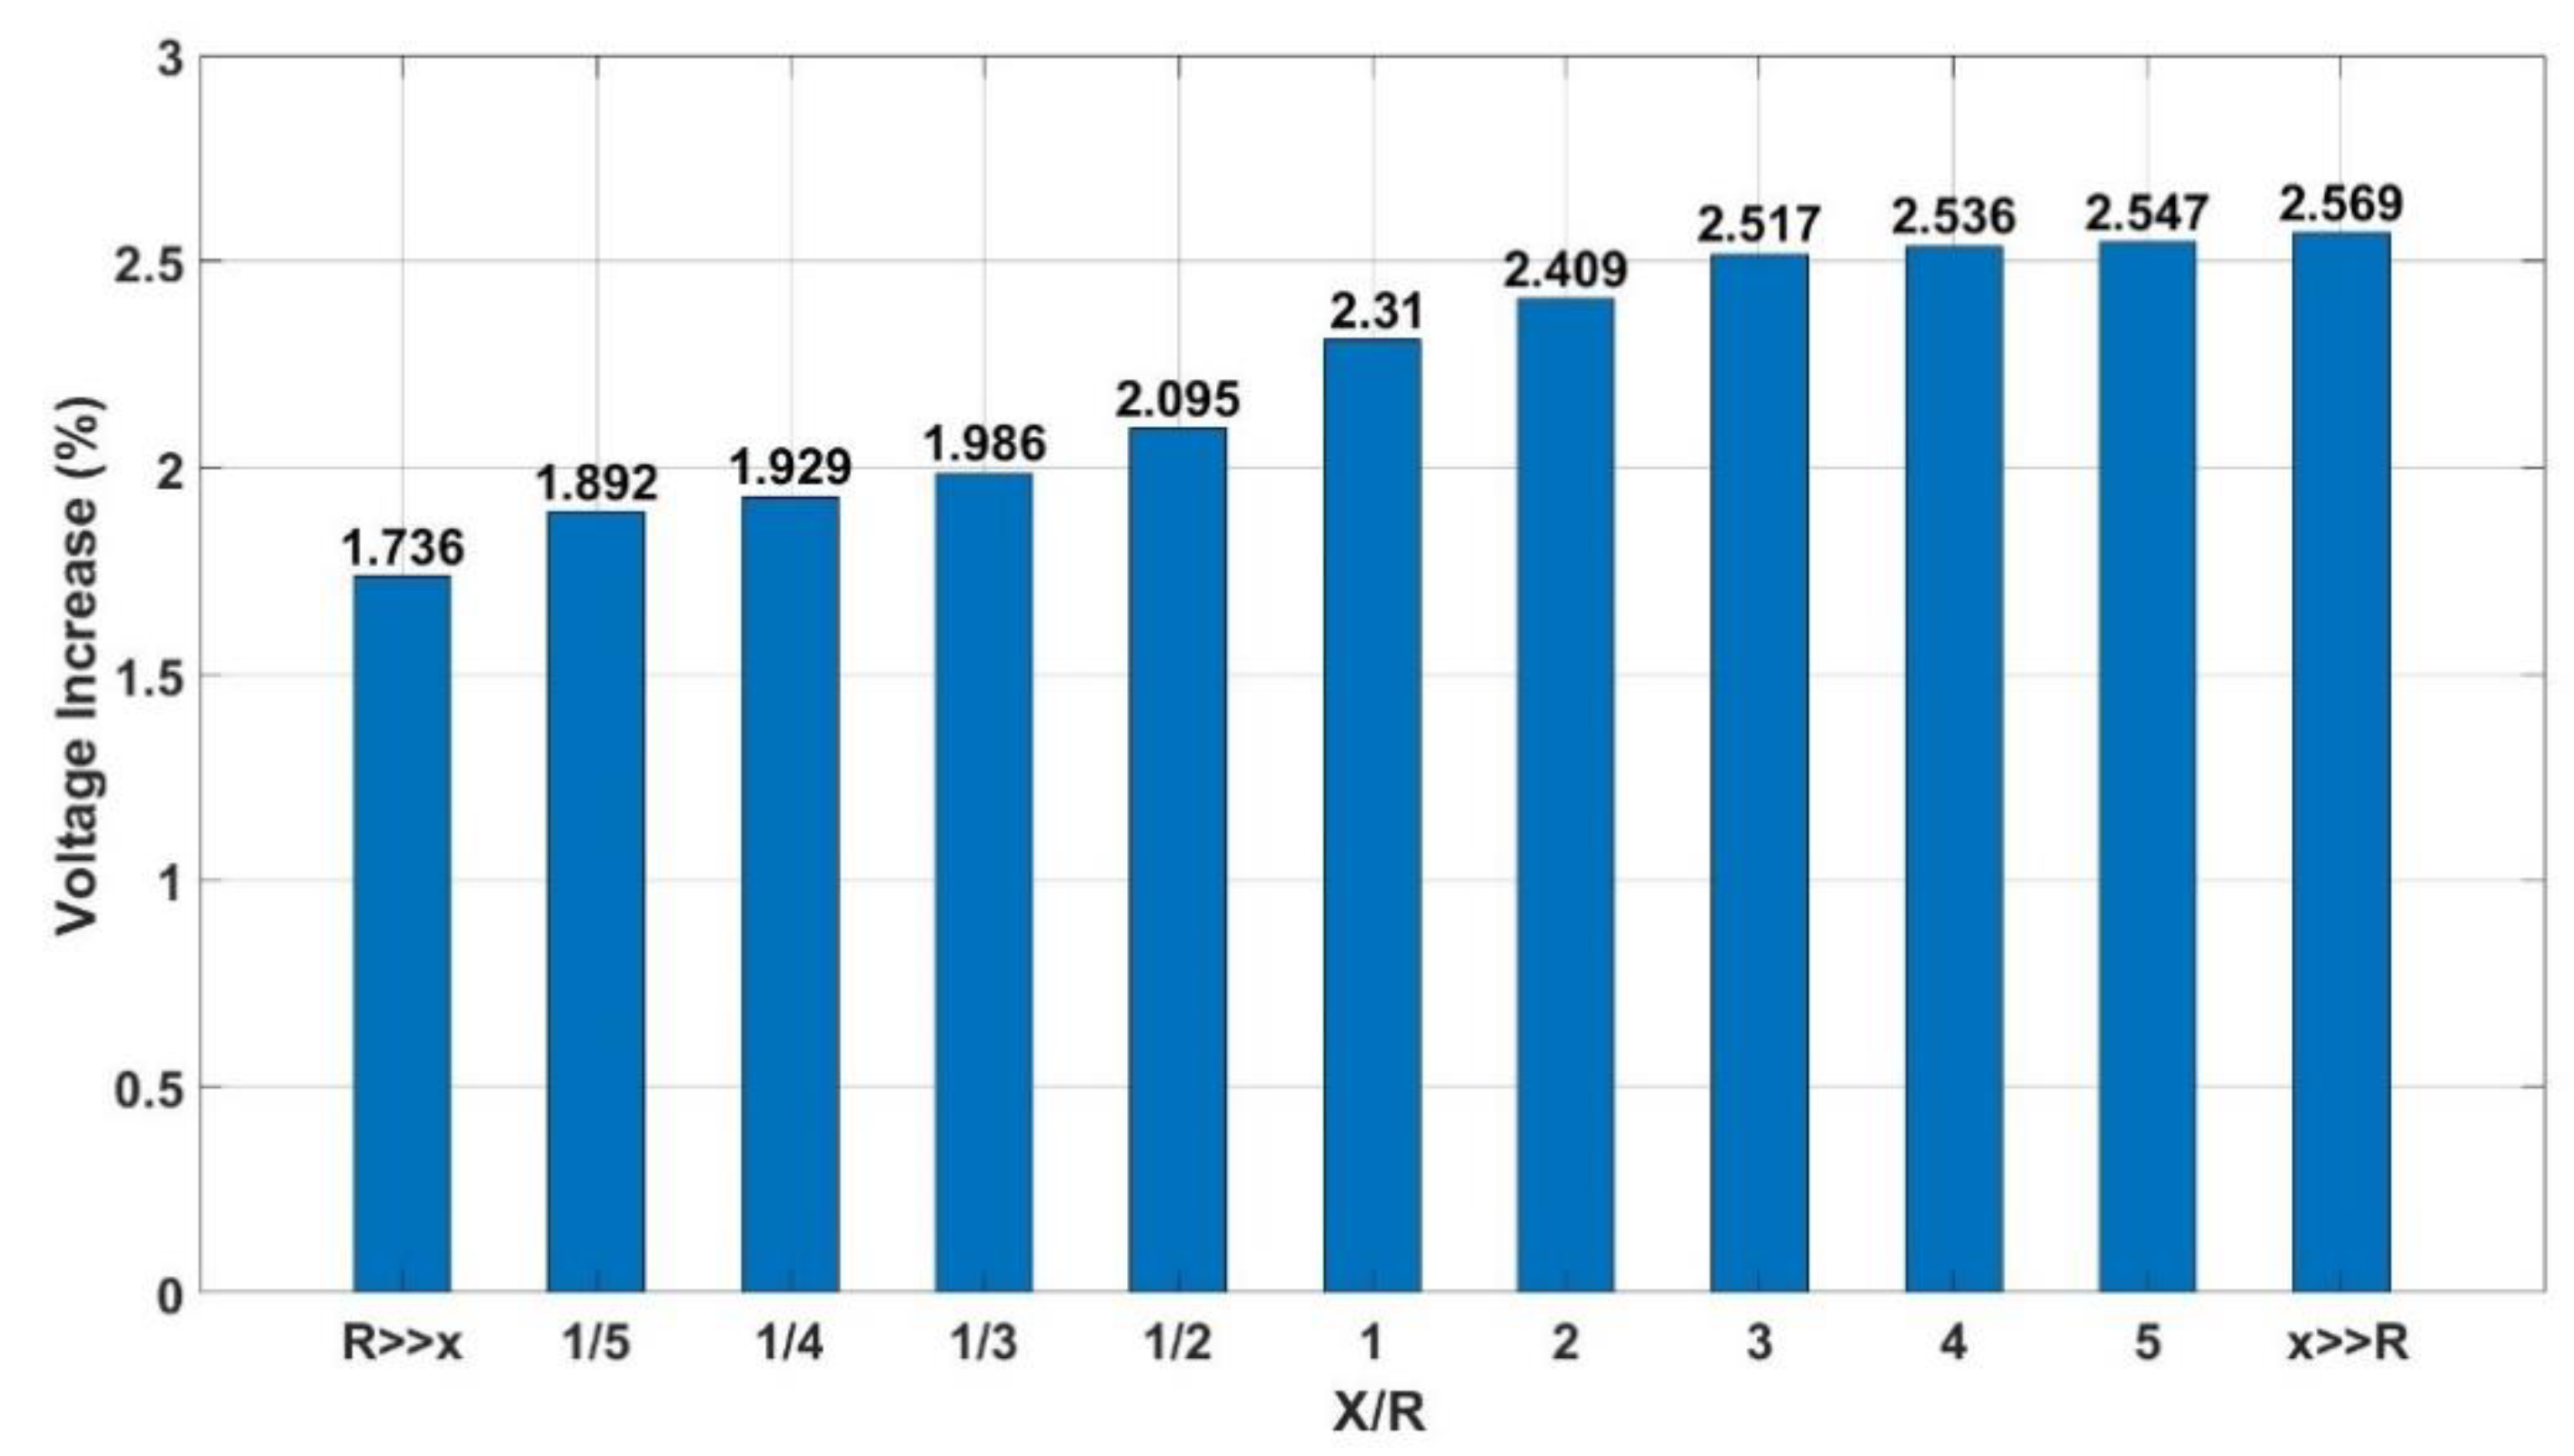
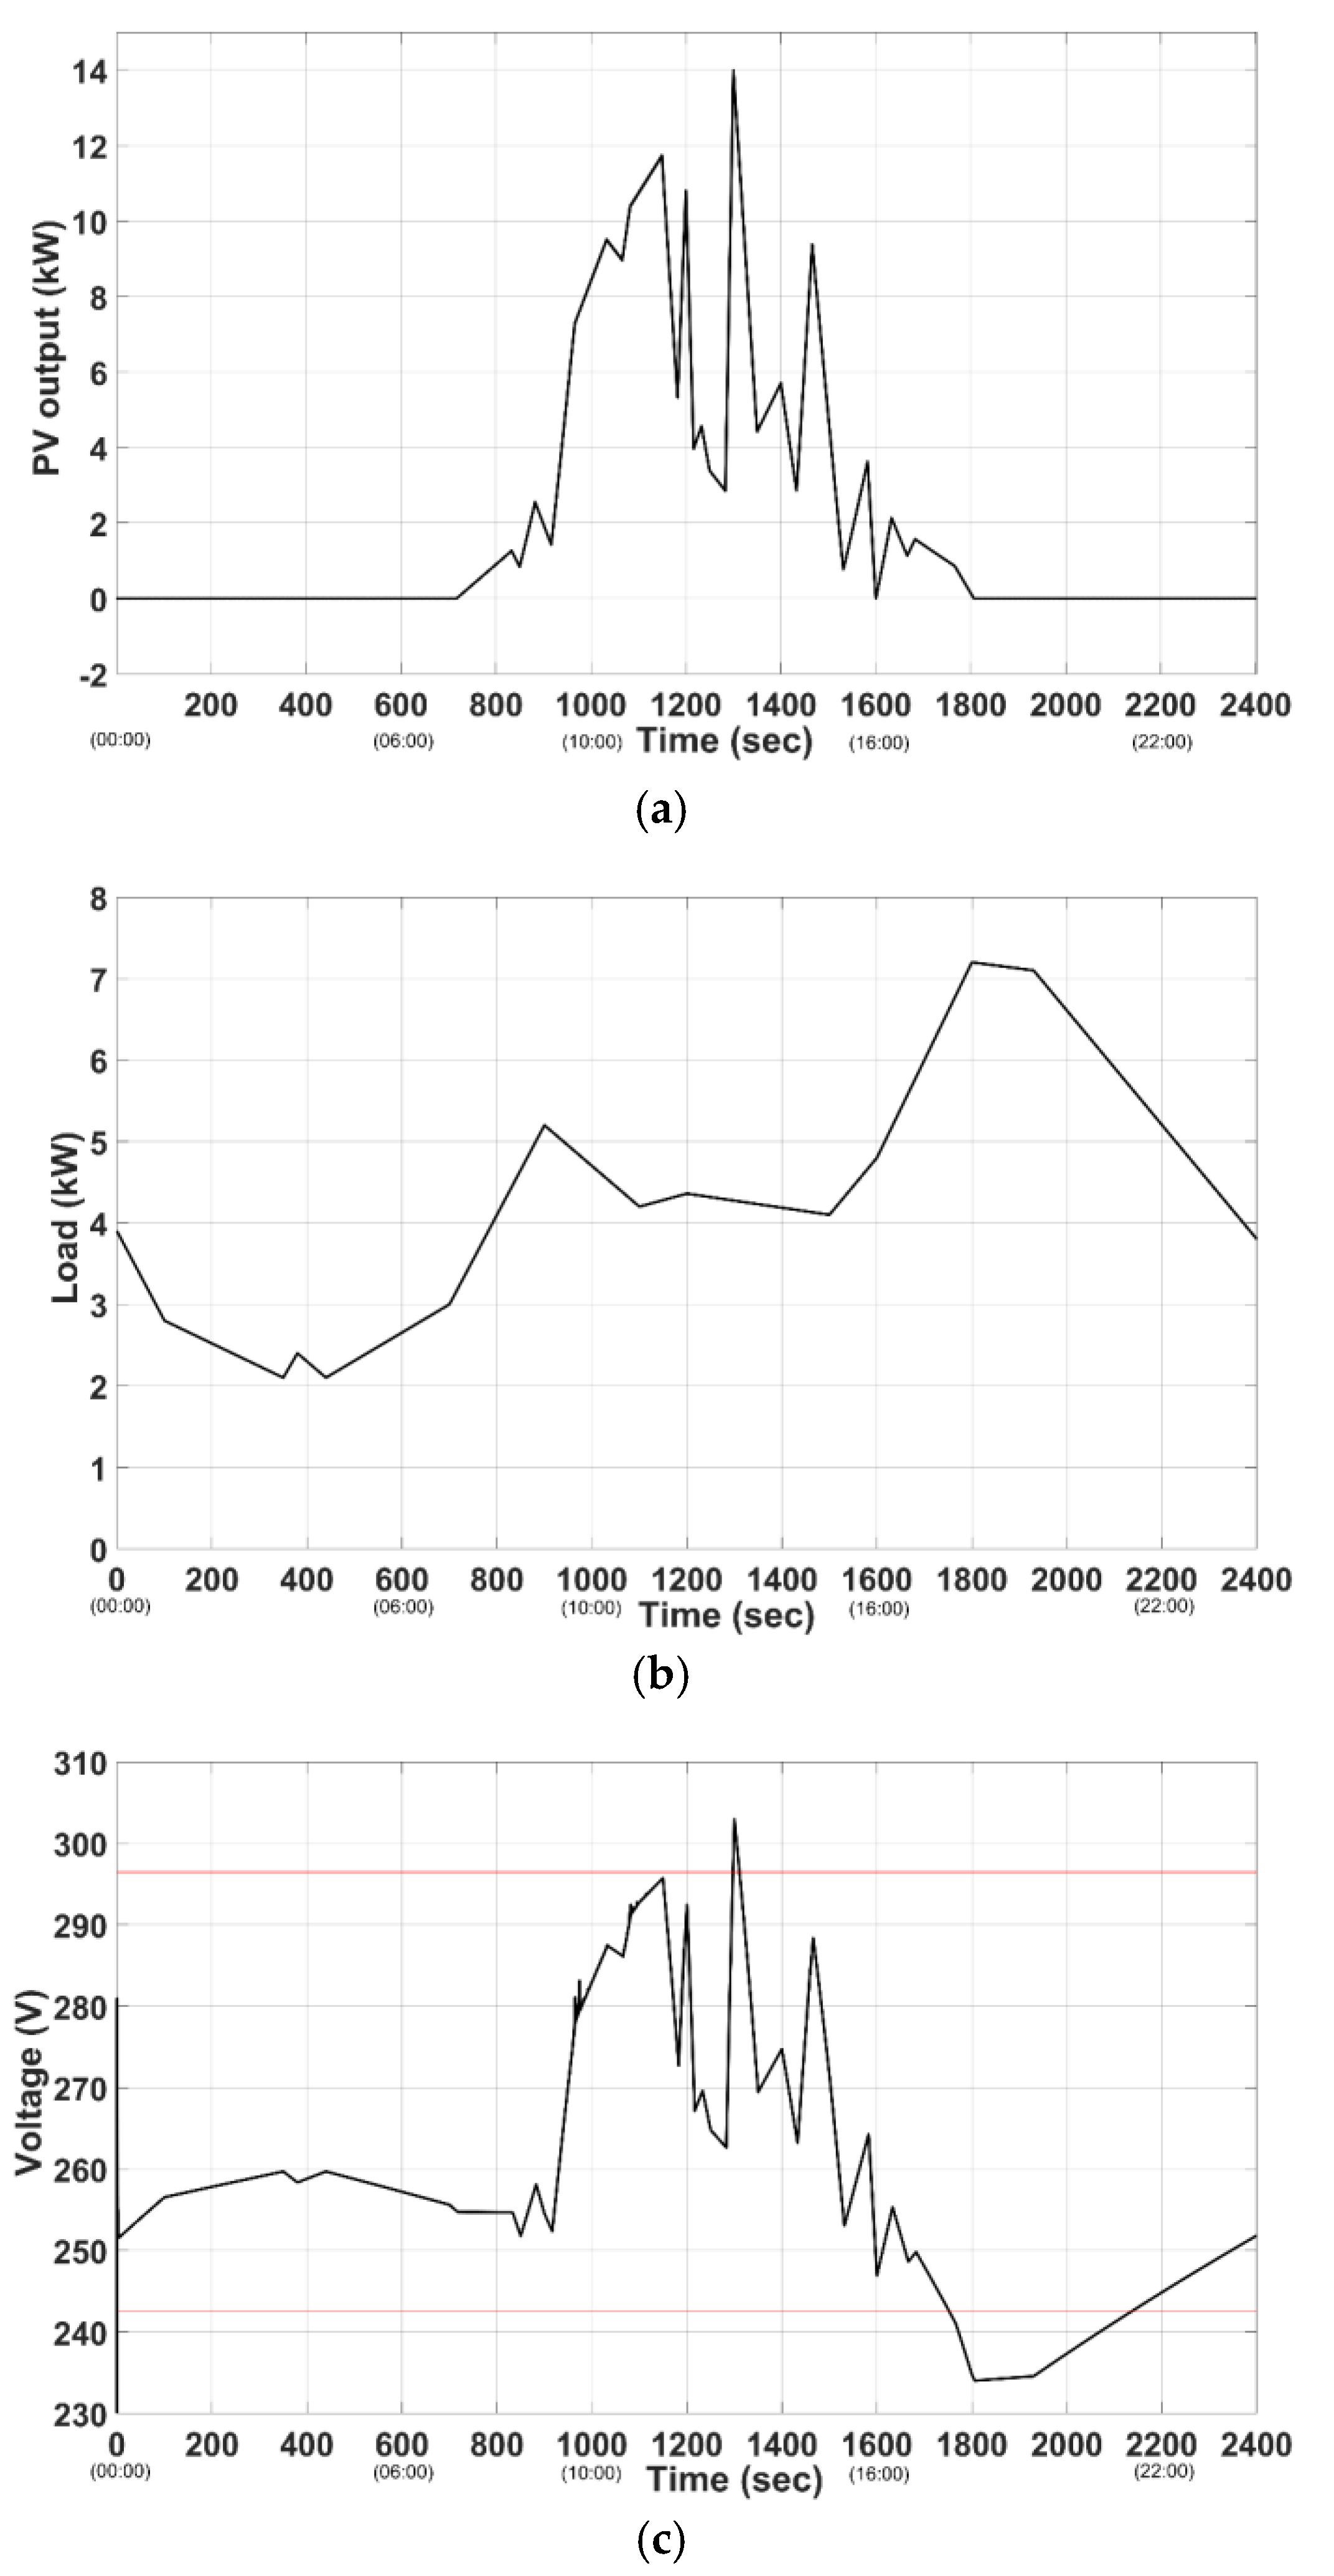
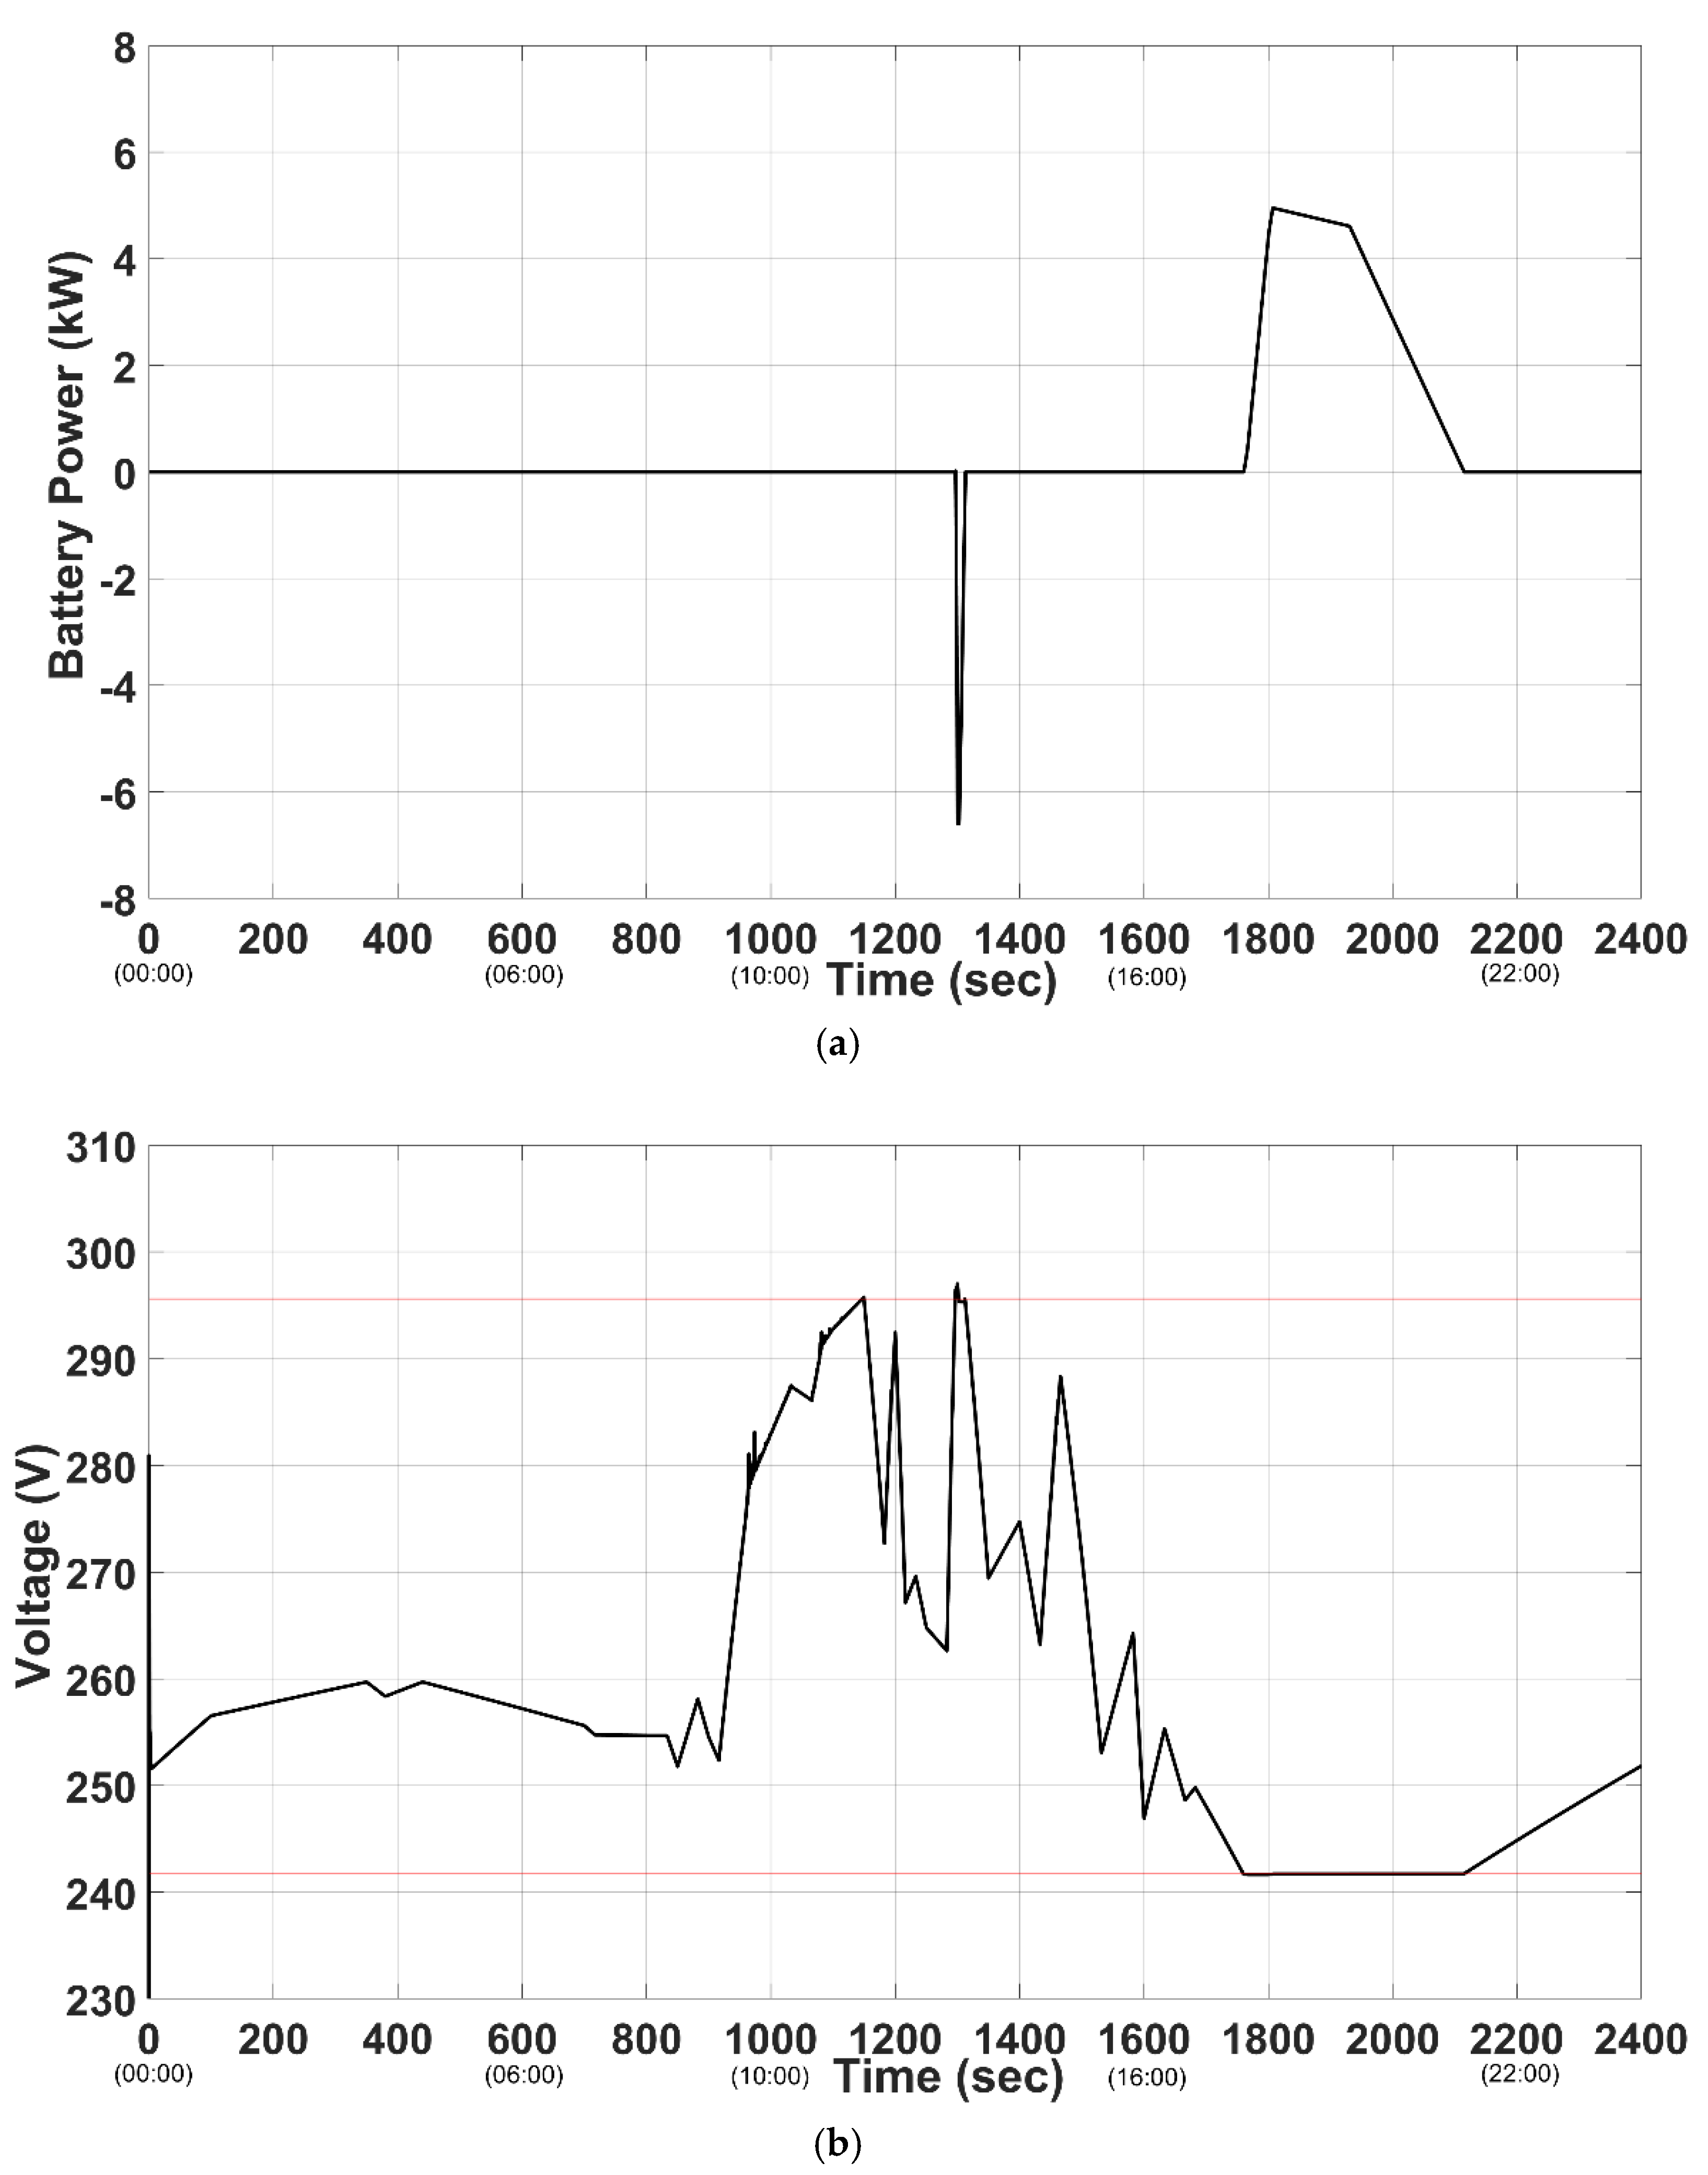
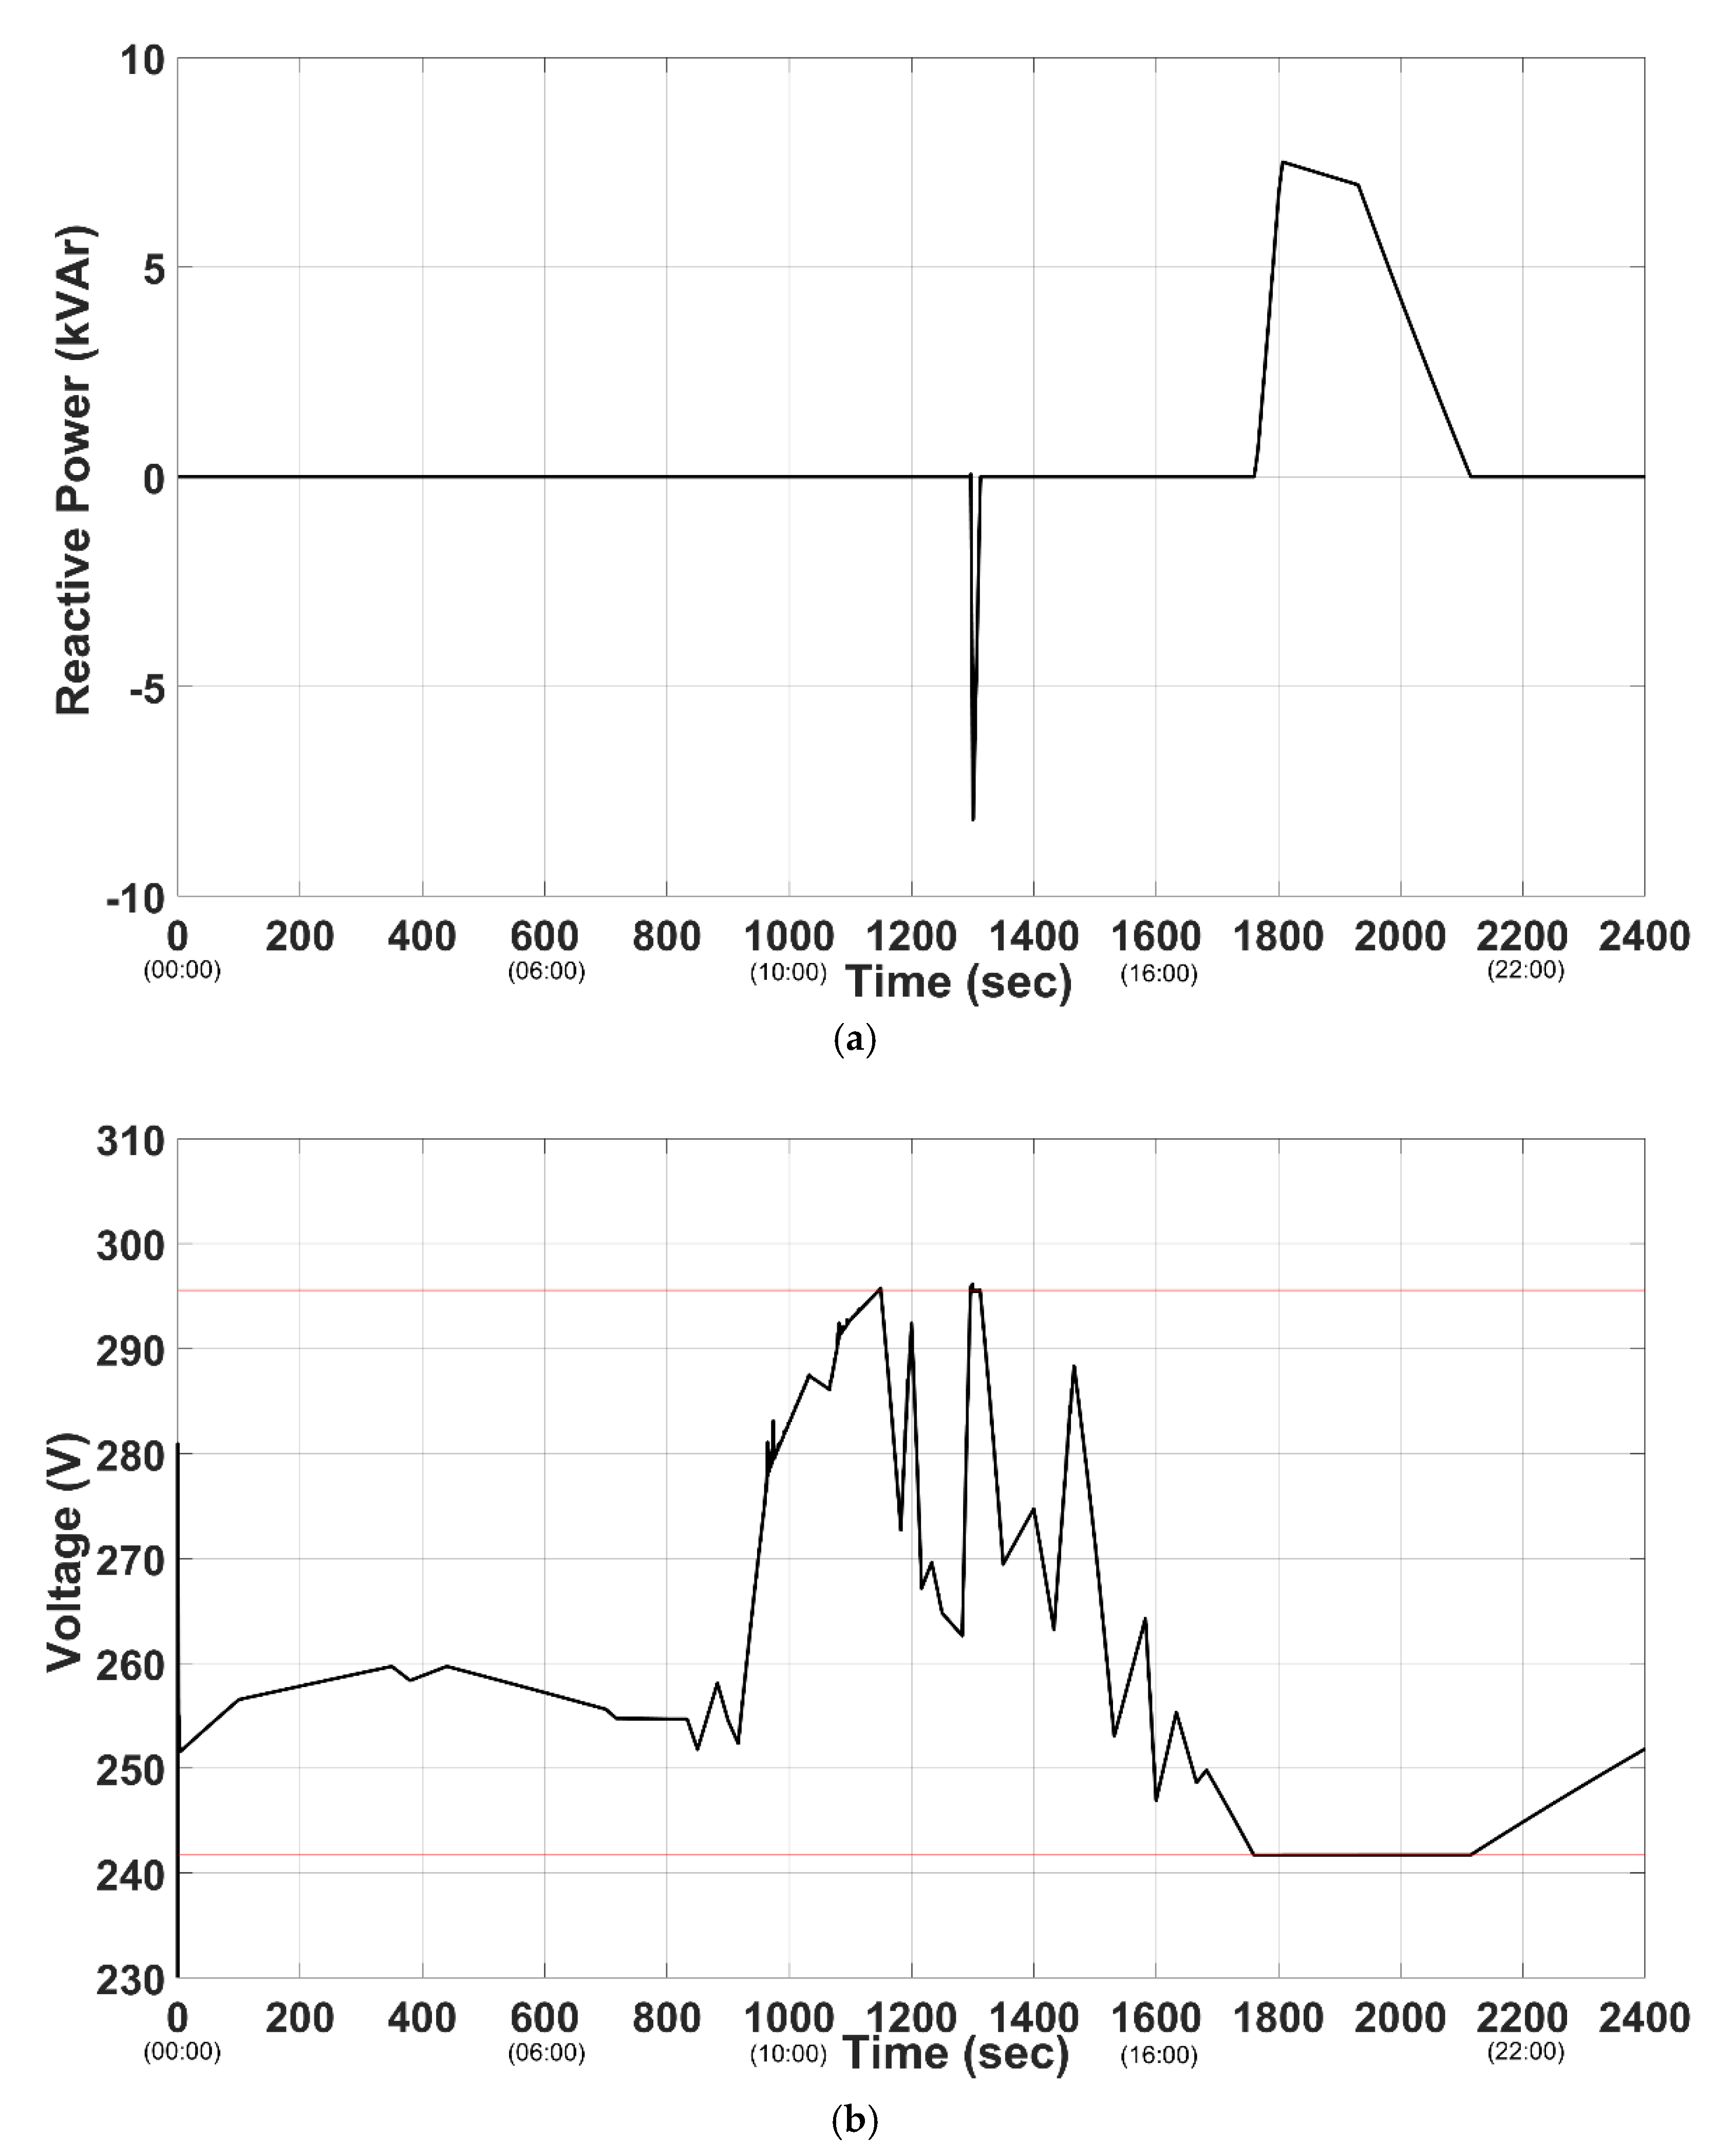
5.3. Provision of Voltage Regulation by Exchanging Both Active and Reactive Power

In the previous subsections, the voltage control was achieved by exchanging either active or reactive power with the DC nanogrid. In this subsection, the voltage regulation by adjusting both active and reactive power will be investigated. First of all, the configuration that was used was the same as the previous scenarios (Figure 9) and the maximum power that can be provided for the voltage control was equal to S = 6.6 kVA. In this study, it was proposed to choose the values of the active and reactive power based on the X/R ratio of the grid impedance. To be more specific, the Q/P ratio of the exchanged power was proportional to the X/R ratio of grid impedance. For example, for an X/R ratio equal to 3, if the reactive power is equal to x then active power will be x/3. So, for a given maximum value S, the active and reactive power can be found. Table 1 includes the active and reactive power that should be provided for each X/R ratio to limit a voltage drop equal to 10% of the nominal voltage power.
Based on Table 1, the scenario that was explained in the previous subsection was conducted and Figure 12 depicts the results.
Comparing Figure 11 and Figure 12 it is noticed that the combined active and reactive power support was more efficient than the active or reactive power exchange for voltage regulation. However, it should be noted that the methodology that was followed in order to choose the active and reactive power values was not optimal since it took into consideration only the X/R ratio of the grid impedance neglecting other factors such as the windings of the transformer. Thus, more research could be conducted to increase the efficiency even more.

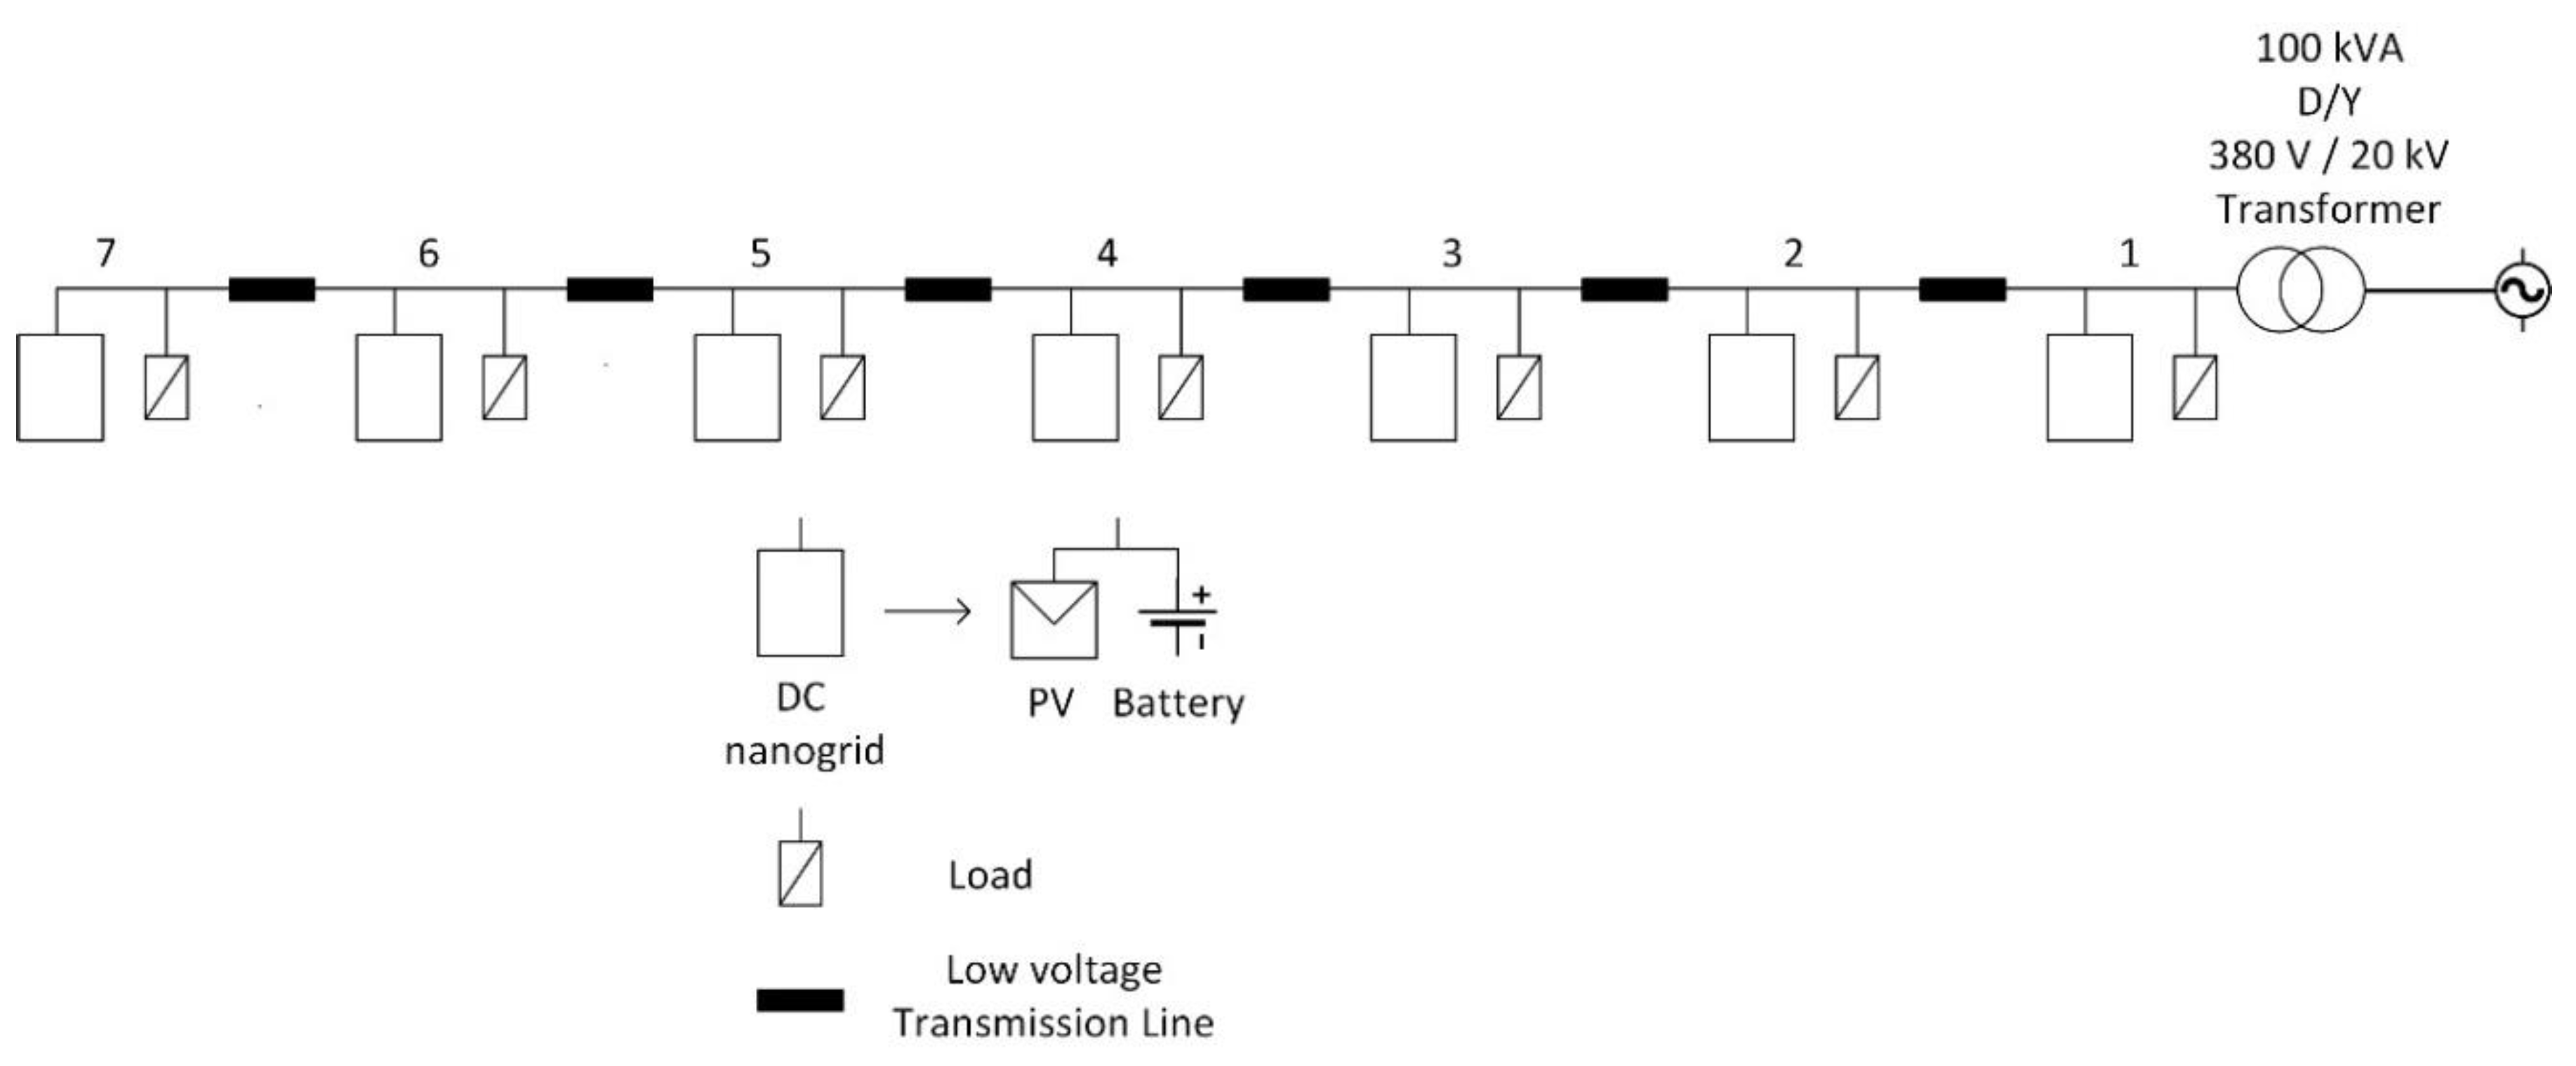
5.4. Voltage Regulation in a Radial Distribution Power Grid

In this subsection, the voltage regulation techniques presented in the previous sections will be tested in a real radial distribution system. In the scenario depicted in Figure 9, it was demonstrated how the voltage regulation could be applied and thus only one DC nanogrid was simulated. Figure 13 illustrates a more realistic configuration since more than one nanogrids were included in a radial distribution AC grid.
Based on the above figure, the AC low voltage radial distribution grid consists of seven AC buses. A DC nanogrid configuration and ten household loads were connected to each bus. Τhe nanogrid topology includes a PV system and an EV battery as it was presented in Section 2. The length of the low voltage transmission line that connected the buses was considered equal to 10 0m and its parameters are given in Table 2.
This scenario will simulate one day (24 h). In order to reduce the simulation time, 100 s in the simulation corresponds to 1 real hour. The irradiance and the temperature data that are given as an input to the PV system, as well as the household loads, corresponded to real measurements of a winter day. The configuration illustrated in Figure 13 was simulated in Matlab/Simulink. The configurations and the control systems were described in Section 2 and Section 3 respectively. The voltage regulation techniques will be applied to Bus 7 since it was the most remote bus of the AC radial distribution grid. Thus, voltage sags and swells were more frequent and intense.
Figure 14a illustrates the PV generation. This figure was extracted through the one diode equivalent circuit model (as it was mentioned in Section 2.1) based on real temperature and irradiance measurements. Figure 14b depicts the total load and Figure 14c the voltage profile of Bus 7 during a day. The region between the two red lines represents the safe voltage operation. In this study, +10% and −10% of the nominal voltage value were considered as the maximum and minimum voltage boundary. It was observed that during the day the voltage exceeded the maximum value. This happened due to the high PV generation while the load was low. This problem will be even bigger during the summer day when the irradiation is higher. The opposite (low PV generation and high load) happened during the evening. Thus, it is noticed that the voltage was lower than the allowable value. The problem will be more intense in case the EV is charging during this period. Thus, the EVs need to be charged with a controllable way.
In order to regulate the voltage into the safe operation region, two control methods were tested: the active and reactive power control. It should be noted that only the DC nanogrid that is connected to bus 7 would participate in the voltage regulation. First, the active power support method was tested. Figure 15a shows the required active power that is exchanged with the power grid and Figure 15b the voltage profile of bus 7 when the voltage regulation is activated. It is observed that the voltage profile was better compared to Figure 14c. In order to restrain the overvoltage during the day, the charging operation of the EV was activated. In this way, the overvoltage was limited while the EV was charging using electrical energy from renewable energy sources. During the evening the V2G operation was activated to prevent the voltage drop.
Afterwards, the reactive power control method was tested. Figure 16a depicts the required amount of reactive power that has to be transferred though the inverter and Figure 16b the voltage profile. It is observed that during the day the DC nanogrid absorbed reactive power and in the evening was providing in order to contribute to the voltage support. Comparing Figure 15b and Figure 16b it should be noted that the amount of the required reactive power was more than the required active power. This happened because low voltage transmission lines were more resistive than inductive (Table 2). Additionally, the two methods could be combined. Specifically, during the day when the PV is producing electrical energy, the active power control method should be used. In the evening, the reactive power support method is more preferable since the EV batteries are not engaged. However, it should be taken into consideration that the maximum available reactive power is sufficient to limit the voltage drop since the reactive power support method is not as efficient as the active power control.

6. Conclusions

In this section, the conclusions that can be drawn from this study will be presented. First of all, the design considerations of a DC nanogrid incorporating the V2G operations were explained. Active and reactive power can be exchanged through the inverter with the power grid and in this way, ancillary services can be provided.
One of the objectives of the current study was to review the voltage regulation by adjusting the active and reactive power. The results of this investigation can be summarized as follows:
  • The line impedance affected the impact of voltage regulation.
  • The transformers increased the efficiency of the voltage regulation when the reactive power was adjusted due to the inductive nature of the winding. Thus, this should be taken into consideration especially at the buses that are near the transformers.
  • Simultaneously active and reactive power exchange increased the impact of the voltage regulation in comparison to exclusively active or reactive power transfer. More research could be conducted taking into consideration more parameters such as the distance from the transformer as well as the inductance of its windings.
All the above findings verified the theoretical analysis that was explained in Section 4.
An AC radial distribution grid was used to test the proposed voltage regulation methods. Both the active and reactive power adjustment was used to maintain the voltage between the upper and lower limits. The simulation results indicate that the active power adjustment was more effective since the low distribution lines were more resistive than inductive. Thus, a greater amount of reactive power in comparison to active power is needed in order to retain the voltage in safe limits. It should be noted that the two methods could be combined. Specifically, during the overvoltage when there is a surplus of active power the controllable EV charging can be activated. However, during the voltage drop, it is more preferable to use the reactive power support (since the required reactive power is within the reactive power limits of the inverter) due to the fact that the EV batteries are not engaged. Based on the scenarios that were simulated in the current study, the maximum impact that was noticed was 2.569%. The impact can be significantly increased in bigger configurations such as fast charging EV chargers where the power rating is bigger. Furthermore, in the AC radial distribution grid scenario, the DC nanogrid connected to the other buses can also participate in the voltage configuration.
As future research, the simultaneously active and reactive power support will be further investigated as well as voltage regulation algorithms including all the nanogrids connected in the radial distribution power grid. These nanogrids can be treated as a microgrid that monitors the voltage profile of the AC power grid and coordinates the nanogrids with the appropriate control signals in order to improve the voltage profile. Additionally, more ancillary services such as frequency control will be examined.

Author Contributions

Conceptualization, I.S. and A.K.; methodology, I.S. and A.K.; software, I.S. and A.K.; validation, I.S. and A.K.; formal analysis, I.S. and A.K.; investigation, I.S. and A.K.; resources, I.S. and A.K.; data curation, I.S. and A.K.; writing—original draft preparation, I.S. and A.K.; writing—review and editing, I.S. and A.K.; visualization, I.S. and A.K.; supervision, I.S. and A.K.; project administration, I.S. and A.K.; funding acquisition, I.S. and A.K. All authors have read and agreed to the published version of the manuscript.

Funding

This research received no external funding.

Conflicts of Interest

The authors declare no conflict of interest

Appendix A

In Section 2, a brief description of the topologies included in the DC nanogrid configuration was given. Appendix A includes the parameters of each topology that were used in order to simulate the DC nanogrid in Matlab/Simulink. More details about the design considerations and methodology of the nanogrid can be found in [29].
Table A1. Parameters of the PV module.
ParametersValueUnit
Maximum Power (STC)200.143W
Current at Maximum Power Point7.61A
Voltage at Maximum Power Point26.3V
Short-Circuit Current8.21A
Open-Circuit Voltage32.9V
Cells54-
Shunt Resistance0.221Ohm
Parallel Resistance415.405Ohm
Diode ideality factor1.3-
Temperature coefficient of Current0.0032A/K
Temperature coefficient of Voltage−0.1230V/K
Table A2. Parameters of the PV system.
ParametersValueMeasurement Unit
Maximum Power (STC)21kW
Current at Maximum Power Point114.15A
Voltage at Maximum Power Point184.1V
Series Connected Modules7-
Parallel Connected Modules15-
Table A3. Parameters of the EV battery.
ParameterValueMeasurement Unit
Battery Type Li-Ion-
Nominal Voltage355.2V
Maximum Voltage393.6V
Minimum Voltage259
Rated Energy18.8kWh
Rated Capacity60Ah
Number of Cells96-
Minimum Cell Voltage2.7V
Maximum Cell Voltage4.1V
Internal Resistance120mOhm
Mass235kg
Volume190.9L
Table A4. Parameters of the EV bidirectional charger.
ParametersValueMeasurement Unit
Rated Power6.6kW
Switching Frequency10kHz
Inductance Value17mH
Capacitance100μF
Parallel Connected Modules15-
Table A5. Parameters of the DC-AC inverter.
ParameterValueMeasurement Unit
Maximum Power27.6kW
DC Bus Voltage700V
DC Bus Capacitor2.4mF
Switching Frequency5050Hz
Line to Line Grid Voltage400V
Power Grid Frequency60Hz
Table A6. Parameters of the LCL filter.
ParameterValueMeasurement Unit
Inverter-Side Inductor1.2mH
Grid-Side Inductor0.57mH
Inverter-Side Resistor0.01Ohm
Grid-Side Resistor0.005Ohm
Capacitor10.4μF
Resonance Frequency2515Hz
Damping Resistor2.019Ohm

References

  1. Carpintero-Rentería, M.; Santos-Martín, D.; Guerrero, J.M. Microgrids Literature Review through a Layers Structure. Energies 2019, 12, 4381. [Google Scholar] [CrossRef] [Green Version]
  2. Burmester, D.; Rayudu, R.; Seah, W.; Akinyele, D. A review of nanogrid topologies and technologies. Renew. Sustain. Energy Rev. 2017, 67, 760–775. [Google Scholar] [CrossRef]
  3. Chandrasena, R.P.S.; Shahnia, F.; Ghosh, A.; Rajakaruna, S. Operation and control of a hybrid AC-DC nanogrid for future community houses. In Proceedings of the 2014 Australasian Universities Power Engineering Conference (AUPEC), Perth, WA, Australia, 28 September–1 October 2014; pp. 1–6. [Google Scholar]
  4. Goikoetxea, A.; Canales, J.M.; Sanchez, R.; Zumeta, P. DC versus AC in residential buildings: Efficiency comparison. In Proceedings of the Eurocon 2013, Zagreb, Croatia, 10 October 2013; pp. 1–5. [Google Scholar]
  5. Alsaidan, I.; Alanazi, A.; Gao, W.; Wu, H.; Khodaei, A. State-of-the-Art in Microgrid-Integrated Distributed Energy Storage Sizing. Energies 2017, 10, 1421. [Google Scholar] [CrossRef] [Green Version]
  6. Skouros, I.; Bampoulas, A.; Karlis, A. A bidirectional dual active bridge converter for V2G applications based on DC microgrid. In Proceedings of the 2018 Thirteenth International Conference on Ecological Vehicles and Renewable Energies (EVER), Monte-Carlo, Monaco, 24 May 2018; pp. 1–9. [Google Scholar]
  7. Un-Noor, F.; Padmanaban, S.; Mihet-Popa, L.; Mollah, M.; Hossain, E. A Comprehensive Study of Key Electric Vehicle (EV) Components, Technologies, Challenges, Impacts, and Future Direction of Development. Energies 2017, 10, 1217. [Google Scholar] [CrossRef] [Green Version]
  8. Yilmaz, M.; Krein, P.T. Review of the Impact of Vehicle-to-Grid Technologies on Distribution Systems and Utility Interfaces. IEEE Trans. Power Electron. 2013, 28, 5673–5689. [Google Scholar] [CrossRef]
  9. Shafiee, S.; Fotuhi-Firuzabad, M.; Rastegar, M. Investigating the Impacts of Plug-in Hybrid Electric Vehicles on Power Distribution Systems. IEEE Trans. Smart Grid 2013, 4, 1351–1360. [Google Scholar] [CrossRef]
  10. Yang, J.; Zeng, Z.; Tang, Y.; Yan, J.; He, H.; Wu, Y. Load Frequency Control in Isolated Micro-Grids with Electrical Vehicles Based on Multivariable Generalized Predictive Theory. Energies 2015, 8, 2145–2164. [Google Scholar] [CrossRef]
  11. Yilmaz, M.; Krein, P.T. Review of benefits and challenges of vehicle-to-grid technology. In Proceedings of the 2012 IEEE Energy Conversion Congress and Exposition (ECCE), Raleigh, NC, USA, 1 September 2012; pp. 3082–3089. [Google Scholar]
  12. Mwasilu, F.; Justo, J.J.; Kim, E.-K.; Do, T.D.; Jung, J.-W. Electric vehicles and smart grid interaction: A review on vehicle to grid and renewable energy sources integration. Renew. Sustain. Energy Rev. 2014, 34, 501–516. [Google Scholar] [CrossRef]
  13. An, K.; Song, K.-B.; Hur, K. Incorporating Charging/Discharging Strategy of Electric Vehicles into Security-Constrained Optimal Power Flow to Support High Renewable Penetration. Energies 2017, 10, 729. [Google Scholar] [CrossRef]
  14. Sortomme, E.; El-Sharkawi, M.A. Optimal Scheduling of Vehicle-to-Grid Energy and Ancillary Services. IEEE Trans. Smart Grid 2012, 3, 351–359. [Google Scholar] [CrossRef]
  15. Zhang, G.; Tan, S.T.; Wang, G.G. Real-Time Smart Charging of Electric Vehicles for Demand Charge Reduction at Non-Residential Sites. IEEE Trans. Smart Grid 2018, 9, 4027–4037. [Google Scholar] [CrossRef]
  16. Takagi, M.; Iwafune, Y.; Yamaji, K.; Yamamoto, H.; Okano, K.; Hiwatari, R.; Ikeya, T. Electricity pricing for PHEV bottom charge in daily load curve based on variation method. In Proceedings of the 2012 IEEE PES Innovative Smart Grid Technologies (ISGT), Washington, DC, USA, 3 April 2012; pp. 1–6. [Google Scholar]
  17. Mei, P.; Wu, L.; Zhang, H.; Liu, Z. A Hybrid Multi-Objective Crisscross Optimization for Dynamic Economic/Emission Dispatch Considering Plug-in Electric Vehicles Penetration. Energies 2019, 12, 3847. [Google Scholar] [CrossRef] [Green Version]
  18. Bampoulas, A.; Karlis, A. Provision of frequency regulation by a residential microgrid integrating PVs, energy storage and electric vehicle. In Proceedings of the 2017 IEEE International Conference on Environment and Electrical Engineering and 2017 IEEE Industrial and Commercial Power Systems Europe (EEEIC/I&CPS Europe), Milan, Italy, 1 June 2017; pp. 1–6. [Google Scholar]
  19. Chen, L.; Jiang, Y.; Li, X.; Yao, L.; Xu, X.; Geng, T. Frequency regulation strategy for decentralized V2G control. In Proceedings of the 2015 5th International Conference on Electric Utility Deregulation and Restructuring and Power Technologies (DRPT), Changsha, China, 26–29 November 2015; pp. 2626–2629. [Google Scholar]
  20. Mao, T.; Lau, W.H.; Shum, C.; Chung, H.; Tsang, K.F.; Tse, N.C.F. A new schedule-controlled strategy for charging large number of EVs with load shifting and voltage regulation. In Proceedings of the 2015 IEEE PES Asia-Pacific Power and Energy Engineering Conference (APPEEC), Brisbane, QLD, Australia, 15–18 November 2015; pp. 1–5. [Google Scholar]
  21. Wu, X.; Li, L.; Zou, J.; Zhang, G. EV-Based Voltage Regulation in Line Distribution Grid. In Proceedings of the 2016 IEEE International Instrumentation and Measurement Technology Conference Proceedings, Taipei, Taiwan, 25 July 2016; pp. 1–6. [Google Scholar]
  22. Keane, E.; Flynn, D. Potential for electric vehicles to provide power system reserve. In Proceedings of the 2012 IEEE PES Innovative Smart Grid Technologies (ISGT), Washington, DC, USA, 16–20 Jane 2012; pp. 1–7. [Google Scholar]
  23. Denholm, P.; Short, W. An Evaluation of Utility System Impacts and Benefits of Optimally Dispatched Plug-in Hybrid Electric Vehicles; National Renewable Energy Laboratory: Golden, CO, USA, 2007. [Google Scholar]
  24. Marra, F.; Yang, G.Y.; Fawzy, Y.T.; Traeholt, C.; Larsen, E.; Garcia-Valle, R.; Jensen, M.M. Improvement of Local Voltage in Feeders with Photovoltaic Using Electric Vehicles. IEEE Trans. Power Syst. 2013, 28, 3515–3516. [Google Scholar] [CrossRef]
  25. Carvalho, P.M.S.; Correia, P.F.; Ferreira, L.A.F. Distributed Reactive Power Generation Control for Voltage Rise Mitigation in Distribution Networks. IEEE Trans. Power Syst. 2008, 23, 766–772. [Google Scholar] [CrossRef]
  26. Yong, J.Y.; Ramachandaramurthy, V.K.; Tan, K.M.; Mithulananthan, N. Bi-directional electric vehicle fast charging station with novel reactive power compensation for voltage regulation. Int. J. Electr. Power Energy Syst. 2015, 64, 300–310. [Google Scholar] [CrossRef]
  27. Nordman, B.; Christensen, K. Local power distribution with nanogrids. In Proceedings of the 2013 International Green Computing Conference Proceedings, Arlington, VA, USA, 27–29 June 2013; pp. 1–8. [Google Scholar]
  28. Werth, A.; André, A.; Kawamoto, D.; Morita, T.; Tajima, S.; Tokoro, M.; Yanagidaira, D.; Tanaka, K. Peer-to-Peer Control System for DC Microgrids. IEEE Trans. Smart Grid 2018, 9, 3667–3675. [Google Scholar] [CrossRef]
  29. Skouros, I.; Karlis, A. Design Methodology of a DC Nanogrid incorporating the V2G Technology. In Proceedings of the IECON 2019—45th Annual Conference of the IEEE Industrial Electronics Society, Lisbon, Portugal, 14–17 October 2019; pp. 5777–5782. [Google Scholar]
  30. Chen, M.; Rincon-Mora, G.A. Accurate Electrical Battery Model Capable of Predicting Runtime and I–V Performance. IEEE Trans. Energy Convers. 2006, 21, 504–511. [Google Scholar] [CrossRef]
  31. Park, M.-Y.; Chi, M.-H.; Park, J.-H.; Kim, H.-G.; Chun, T.-W.; Nho, E.-C. LCL-filter Design for Grid-Connected PCS Using Total Harmonic Distortion and Ripple Attenuation Factor. In Proceedings of the 2010 International Power Electronics Conference—ECCE ASIA, Sapporo, Japan, 21–24 June 2010; pp. 1688–1694. [Google Scholar]
  32. Khan, S.; Mehmood, K.; Haider, Z.; Bukhari, S.; Lee, S.-J.; Rafique, M.; Kim, C.-H. Energy Management Scheme for an EV Smart Charger V2G/G2V Application with an EV Power Allocation Technique and Voltage Regulation. Appl. Sci. 2018, 8, 648. [Google Scholar] [CrossRef] [Green Version]
  33. Rocabert, J.; Luna, A.; Blaabjerg, F.; Rodríguez, P. Control of Power Converters in AC Microgrids. IEEE Trans. Power Electron. 2012, 27, 4734–4749. [Google Scholar] [CrossRef]
  34. Timbus, A.; Liserre, M.; Teodorescu, R.; Rodriguez, P.; Blaabjerg, F. Evaluation of Current Controllers for Distributed Power Generation Systems. IEEE Trans. Power Electron. 2009, 24, 654–664. [Google Scholar] [CrossRef]
  35. Camacho, A.; Castilla, M.; Miret, J.; Vasquez, J.C.; Alarcon-Gallo, E. Flexible Voltage Support Control for Three-Phase Distributed Generation Inverters under Grid Fault. IEEE Trans. Ind. Electron. 2013, 60, 1429–1441. [Google Scholar] [CrossRef]
  36. Kisacikoglu, M.C.; Ozpineci, B.; Tolbert, L.M. EV/PHEV Bidirectional Charger Assessment for V2G Reactive Power Operation. IEEE Trans. Power Electron. 2013, 28, 5717–5727. [Google Scholar] [CrossRef]
  37. Choi, W.; Lee, W.; Sarlioglu, B. Reactive power compensation of grid-connected inverter in vehicle-to-grid application to mitigate balanced grid voltage sag. In Proceedings of the 2016 IEEE Power and Energy Society General Meeting (PESGM), Boston, MA, USA, 17–21 July 2016; pp. 1–5. [Google Scholar]
  38. Laaksonen, H.; Saari, P.; Komulainen, R. Voltage and frequency control of inverter based weak LV network microgrid. In Proceedings of the 2005 International Conference on Future Power Systems, Amsterdam, The Netherlands, 18 November 2005. [Google Scholar]
  39. Weedy, B.M.; Cory, B.J. Electric Power Systems, 4th ed.; John Wiley & Sons: Hoboken, NJ, USA, 1998. [Google Scholar]
Figure 1. The DC nanogrid configuration. Reprint with permission [29]; 2020, IEEE.
Energies 13 02655 g001
Figure 2. The bidirectional half-bridge DC-DC converter. Reprint with permission [29]; 2020, IEEE.
Energies 13 02655 g002
Figure 3. The control scheme of the bidirectional charger. Reprint with permission [29]; 2020, IEEE.
Energies 13 02655 g003
Figure 4. Four-quadrant operation of the DC-AC inverter.
Energies 13 02655 g004
Figure 5. The configuration of the DC-AC inverter. Reprint with permission [29]; 2020, IEEE.
Energies 13 02655 g005
Figure 6. The control diagram of the DC-AC inverter. Reprint with permission [29]; 2020, IEEE.
Energies 13 02655 g006
Figure 7. Two AC buses connected through the transmission line.
Energies 13 02655 g007
Figure 8. Modified q-axis current control system.
Energies 13 02655 g008
Figure 9. The DC nanogrid connected to an AC bus of the AC distribution grid.
Energies 13 02655 g009
Figure 10. (a) The Vpcc voltage without voltage regulation. (b) The Vpcc voltage when the reactive power support is activated. (c) The transferred power through the inverter.
Energies 13 02655 g010
Figure 11. Voltage increase (%) for different X/R ratios when (a) 6.6 kW of active power is provided and (b) 6.6 kVAr of reactive power is provided.
Energies 13 02655 g011
Figure 12. Voltage increase (%) for different X/R ratios when both active and reactive power was used for voltage regulation.
Energies 13 02655 g012
Figure 13. The understudy radial distribution power grid.
Energies 13 02655 g013
Figure 14. Bus 7: (a) the PV generation, (b) the total load and (c) the voltage profile and the maximum and minimum allowable voltage values.
Energies 13 02655 g014
Figure 15. Bus 7: (a) the active power exchanged with the power grid and (b) the voltage profile when voltage regulation is activated.
Energies 13 02655 g015
Figure 16. Bus 7: (a) the reactive power exchanged with the power grid and (b) the voltage power when voltage regulation is activated.
Energies 13 02655 g016
Table 1. Active and reactive power values based on the X/R ratio.
X/R RatioActive Power (kW)Reactive Power (kVAr)
X >> R06600
14666.9466.9
22951,65903.21
32087.16261
416006402
512946471.6
1/25903.212951.6
1/362612087.1
1/464021600
1/564711294
R >> X66000
Table 2. The low voltage transmission line parameters.
ParameterPositive SequenceZero Sequence
Resistance0.520 Ω/km0.998 Ω/km
Inductance0.305 Ω/km0.915 Ω/km
Capacitance12.2 nF/km5.5 nf/km

