Article

Effect of Various Parameters on the Thermal Stability and Corrosion of CO2-Loaded Tertiary Amine Blends

by
Usman Shoukat
and
Hanna Katariina Knuutila
*
Department of Chemical Engineering, Norwegian University of Science and Technology (NTNU), 7491 Trondheim, Norway
*
Author to whom correspondence should be addressed.
Energies 2020, 13(10), 2626; https://doi.org/10.3390/en13102626
Submission received: 26 April 2020 / Revised: 18 May 2020 / Accepted: 19 May 2020 / Published: 21 May 2020
(This article belongs to the Section B: Energy and Environment)

Abstract

:
In this study, the thermal stability and corrosivity of various CO2-loaded tertiary amine blends in both aqueous and non-aqueous form in stainless steel cylinders were studied for combined acid gas and water removal. The thermal stability was measured from the remaining amine concentration and the corrosivity was measured from the amount of various metals in blends using titration and inductively coupled plasma mass spectrometry (ICP-MS), respectively. The experimental data were used to calculate the rate constants of amine group loss. The developed model represented the experimental data very well. Solvent change from H2O to triethylene glycol (TEG) in blends decreased the thermal stability and vice versa for corrosivity. The amine stability was increased when contact with stainless steel was reduced. An increase in the amine concentration or CO2 loading at constant temperature decreased the thermal stability and vice versa for corrosivity.

Graphical Abstract

1. Introduction

Acid gas impurities such as carbon dioxide (CO2) and hydrogen sulfide (H2S) are typically present in natural gas. Energy production from natural gas also produces large quantities of CO2 during combustion [1]. H2S is naturally present with methane, water vapor, CO2, and other impurities in many natural gas reservoirs [2]. Water vapor can cause corrosion in the pipelines and can also form hydrates in the presence of methane at suitable temperatures and pressures. These hydrates can plug manifolds, pipelines, and various accessories, such as valves and fittings [3]. Absorption-based acid gas capture processes are the most versatile processes for the removal of CO2 and H2S from natural gas [4]. Amine solutions are generally used for this type of process, and glycols such as monoethylene glycol (MEG) and triethylene glycol (TEG) are typically used to remove H2O and inhibit hydrate formation [5].
A process that can remove acid gases and water simultaneously from the natural gas stream can be beneficial and using this process for subsea applications will reduce the environmental footprint. Simultaneous acid gas and water removal was discussed as early as 1939 by Hutchinson [6] and later by McCartney [7] and Chapin [8]. An ethanolamine (MEA) and diethylene glycol blend was the first used blend, but it was discontinued due to higher amine degradation and severe corrosivity [4]. MEA is mostly used for CO2 absorption processes, but tertiary amines are alternatives for CO2 absorption due to their higher theoretical CO2 loading capacity and low energy requirement during the regeneration process [9]. Additionally, tertiary amine increases the thermal stability and reduces corrosivity [10]. CO2 is absorbed in the presence of water in tertiary amines, and they form an unstable carbamate, subsequently producing bicarbonate ions, as shown in Equation (1) [9,11,12]:
R 1 R 2 R 3 N + CO 2 + H 2 O     R 1 R 2 R 3 NH + + HCO 3
The thermal stability and corrosivity of amine solutions are major problems in amine-based acid gas capture processes. High temperatures cause thermal degradation and the presence of oxygen can cause oxidative degradation [13,14]. Degradation can create various problems during the acid gas capture process, for example, solvent loss, by-product formation, fouling, foaming, corrosion, and a reduction in the absorption capacity [15,16,17,18,19,20,21].
Corrosion and thermal stability are interconnected since by-products can increase corrosion, while heat-stable amine salts, water vapor, organic acids, oxygen, and acid gas can also increase the corrosion rates [22,23,24]. Therefore, for a combined acid gas removal and water control process, it is essential to consider the corrosivity by checking the metal ion concentration in degraded blends. Corrosion can also be controlled by injecting film formation corrosion inhibitors (FFCIs) or pH stabilizers [25]. An example of a pH stabilizer used is N-methyl diethanolamine (MDEA), which is added to a lean MEG solution to lower the corrosion rate. The effect is based on the formation of a protective layer of FeCO3 on the pipeline wall in the presence of CO2 [25,26,27]. Corrosion inhibition by an FeCO3 protection layer has been observed on mild steel, carbon steel, and stainless steel surfaces [28,29,30]. Thermally degraded solutions (MDEA-MEG-FFCI) decrease the hydrate inhibition, which is still less than the reduction caused by pure thermally degraded MEG [31]. Therefore, combining amine with MEG/TEG can reduce corrosion in comparison to using pure MEG/TEG.
The thermal stability of aqueous MDEA has been studied by various authors for concentrations ranging from 20 to 83.4 wt.% at temperatures from 100 to 230 °C [10,32,33,34,35,36,37,38], and it has been concluded that aqueous MDEA is more thermally stable in the absence of CO2. In the presence of CO2, minimal degradation was observed until 120 °C, but above this temperature, it started degrading rapidly. Moreover, an increase in the initial amine concentration and CO2 loading decreased the amine stability. The thermal stability of 2-(diethylamino)ethanol (DEEA) was studied in the presence of CO2 with 20–35.1 wt.% aqueous solutions at ≥135 °C [35,37,39], and it was concluded that, at temperatures >135 °C, the stability of aqueous DEEA was also reduced by an increase in the initial CO2 loading and amine concentration, like an aqueous MDEA solution.
Only three published works are available for the thermal stability of non-aqueous amines. Al Harooni et al. [25] studied an MDEA-MEG-H2O solution (6.7 wt.% MDEA, 74.64 wt.% MEG, and 18.66 wt.% H2O) at 135–200 °C. The other two studies are our previously published works, where we studied MDEA blends (30 wt.% MDEA and 70 wt.% MEG/TEG) and both MDEA and DEEA blends (20 wt.% amine, 20 wt.% H2O, and 60 wt.% MEG/TEG) at 135 °C for seven weeks in the presence of CO2 [10,37]. It was concluded that the thermal stability of amine was decreased with the addition of MEG in aqueous MDEA and DEEA solutions. Generally, tertiary amines first degrade into primary and secondary amines, and later, these primary and secondary amines make other by-products [33]. This was confirmed by Gouedard et al. [16] by studying aqueous MDEA thermal degradation kinetics and mechanisms. No data are available for the thermal stability of both aqueous and non-aqueous blends of 3-dimethylamino-1-propanol (3DMA-1P) and 3-diethylamino-1-propanol (3DEA-1P). MEG and TEG remained thermally stable up to 157 and 210 °C, respectively, in the absence of oxygen [40,41].
Corrosivity by amine solutions at a high temperature was studied by Grimstvedt et al. [42] in metal cylinders. Solutions were analyzed for the total Fe, Cr, Ni, and Mo, and these metal concentrations were compared to pilot data. The higher the amount of metals in solution, the higher the corrosion rate, and vice versa. Later, a similar approach was used in numerous studies [10,28,35,37]. Eide-Haugmo [35] found that metal concentrations in aqueous MDEA solutions are higher than aqueous DEEA solutions at 135 °C after five weeks of an experiment in 30 wt.% solutions. A similar trend was also observed in our previous work [37] for all aqueous and non-aqueous MDEA and DEEA solutions. According to our other previous work, for 30 wt.% MDEA blends, the metal concentrations were in the order of MDEA.TEG > MDEA.H2O > MDEA.MEG [10].
The stability and corrosivity of amine are important factors to consider while selecting a blend for a combined acid gas and water removal process. In our previous work [43], we identified various potential blends for combined H2S and water removal. Among others, DEEA, 3DMA-1P, and 3DEA-1P showed good acid gas absorption, while MDEA is currently used as an industrial standard amine for H2S removal. As mentioned previously, most investigations of thermal stability in amine solutions have been conducted for aqueous and water lean solutions. There are very little data available for the thermal stability of amine blends in glycols without any water present in blends. Similarly, the effects of the initial amine concentration and CO2 loading were previously only investigated for the thermal stability of amine, and no data are available for their effects on corrosion. Hence, in the current work, four tertiary amine blends in water, MEG, and TEG were studied to investigate their thermal stability and corrosivity. The effects of solvent type, amine concentration, and CO2 loading were investigated. Finally, the impact of metal on MDEA blends’ thermal stability was investigated by running thermal degradation experiments in glass tubes and stainless steel cylinders. The chemical structures of all the chemicals used in this study are shown in Figure 1.

2. Materials and Methods
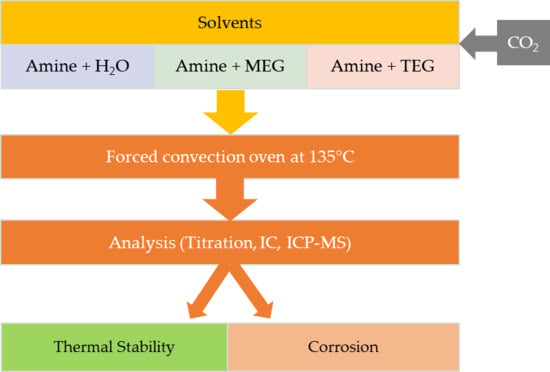
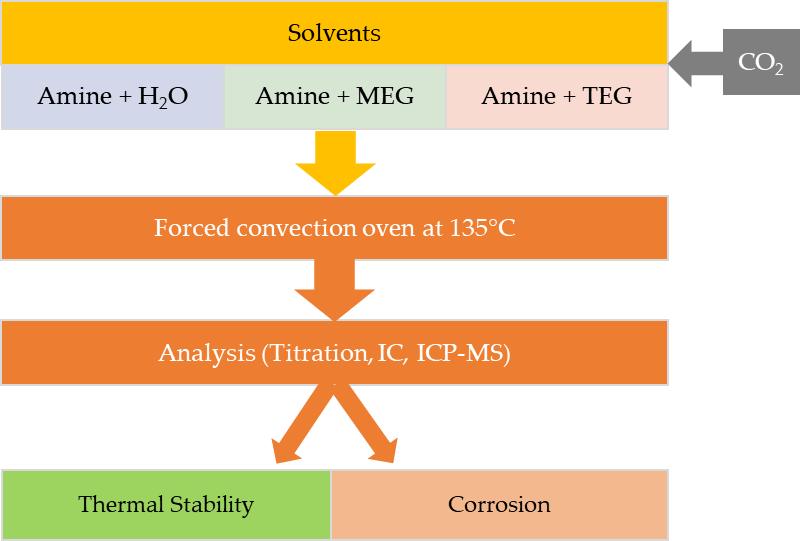
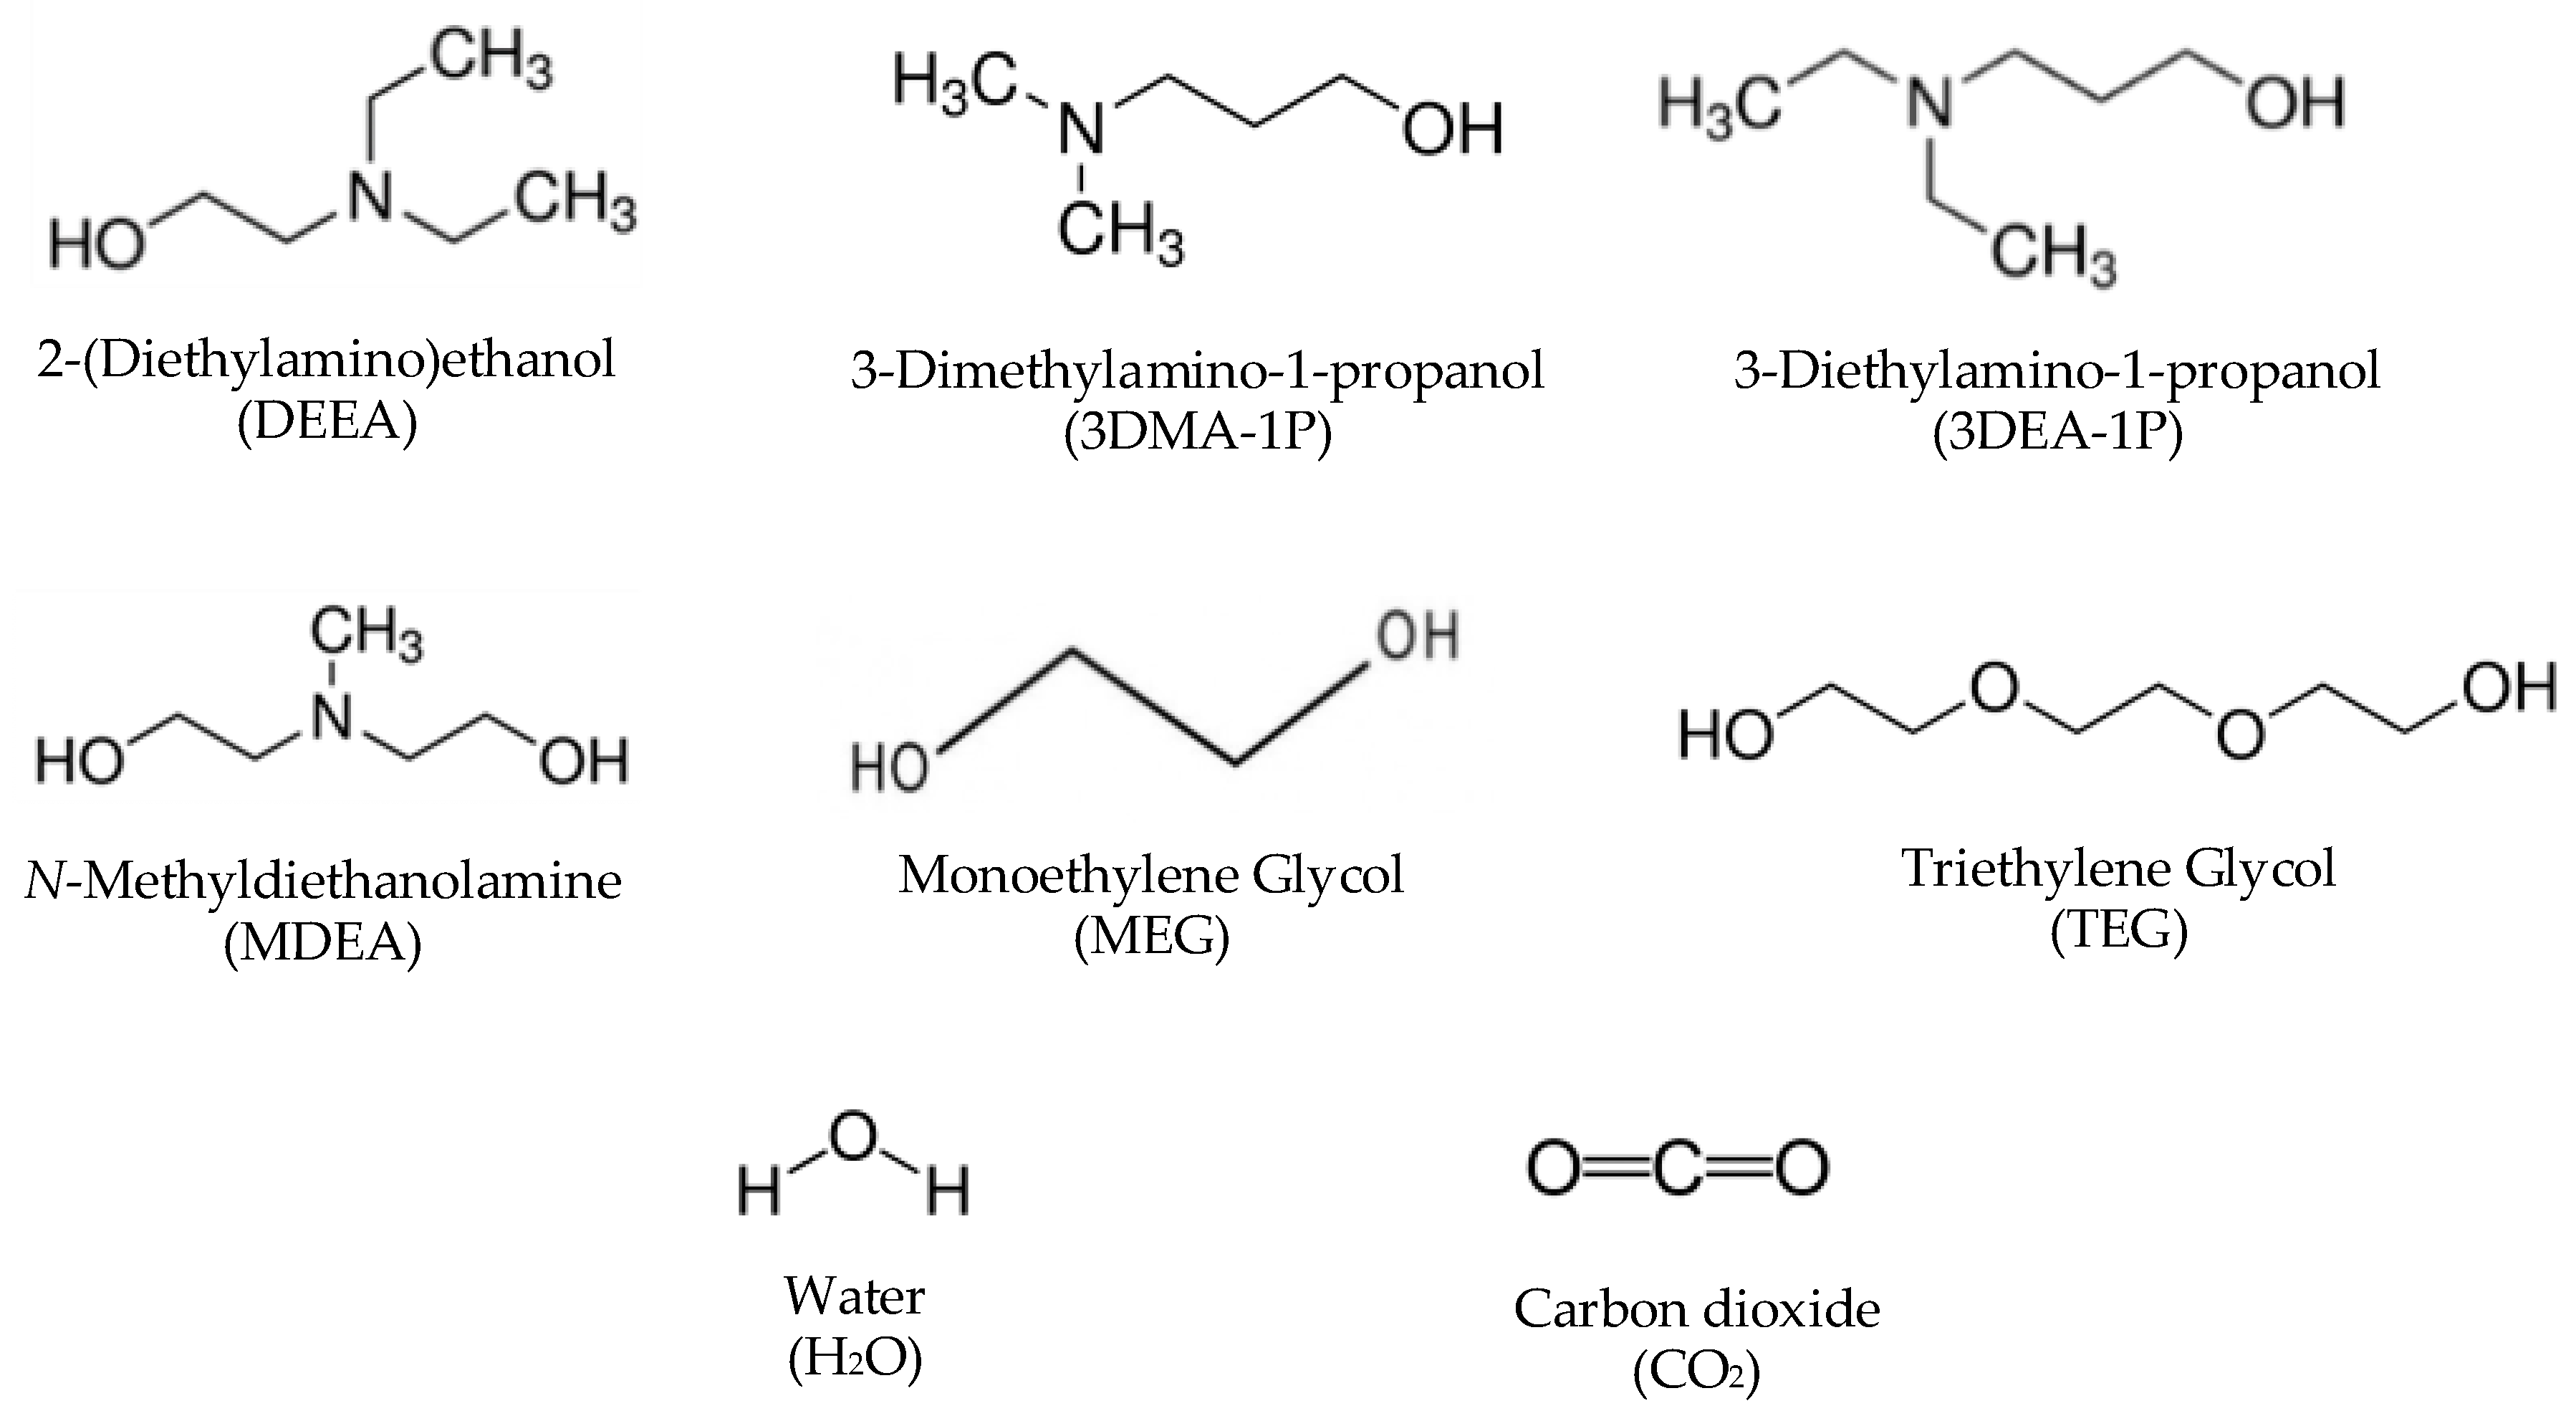
2.1. Materials

All chemicals used in this study were purchased from Sigma-Aldrich (Oslo, Norway), except for 3DEA1P and CO2. 3DEA1P was bought from TCI Europe (Zwijndrecht, Belgium) and CO2 was obtained from AGA AB (Oslo, Norway). All the chemicals used are listed in Table 1 and were used without further purification.
Amine solutions were prepared gravimetrically in flasks using the Mettler Toledo scale, model MS6002S/01 (Oslo, Norway) (±0.01 g). Solutions were loaded with CO2 by using a continuously weighted gas wash bottle in an isolated environment to achieve the required CO2 concentration. All solutions were titrated for amine and CO2 concentration to verify the CO2 loading prior to the start of the experiment [10,44,45]. The unloaded amine wt.% and CO2 loading at the beginning of the experiment for all solutions are given in Table 2.

2.2. Methodology

Both stirred cell reactors [32,33,36,39] and metal cylinders [10,21,28,37] have been used to study amine solutions’ thermal stability. In this work, metal cylinders were selected, as various amine solutions at different concentrations could be tested in multiple cylinders at the same time, consequently reducing the overall experimental duration. The corrosivity of the blends can be studied by analyzing the solutions for the total Fe, Cr, Ni, and Mo. The metal concentrations in the solution can be used as an indicator of corrosivity [42]. Therefore, multiple cylinders were made by using 10 cm long and 1.3 cm diameter 316 stainless steel tubes, with both ends closed with Swagelok® end caps (Stavanger, Norway). Pre-loaded CO2 amine solutions were added in cylinders, leaving around 1 cm gaps between the solution surface and cap. Additionally, glass tubes were used inside metal cylinders to study the effect of metal on the thermal stability of amine solutions for 30 wt.% MDEA solutions (both aqueous and non-aqueous). A replica of each cylinder was made to attain more precise results. Cylinders were stored vertically in a forced convection oven at 135 °C, in order to enhance the degradation and shorten the experimental time. Since several studies using these conditions have been performed previously, the current data can be easily compared with literature data [10,28,35,37]. The experiment was run for seven weeks, and one cylinder, along with a replica of each solution, were taken out from the oven after 1, 3, 5, and 7 weeks at the same time of day. Cylinders were cooled down to room temperature before opening in the fume cabinet and were stored in the fridge to prevent any further decomposition. Cylinders were weighed before and after the experiment to identify any leakages. All cylinders, except for aqueous MDEA solutions in glass tubes for week 3 and week 5, showed less than a 2% difference in weight. The cylinders that leaked, including aqueous MDEA solutions in glass tubes for week 3 and week 5, were not used in the calculations of results.
All solutions were titrated with 0.1 M H2SO4 to measure the amine group in the solutions [37,44]. For all samples, the average difference in amine concentrations was less than ±2% between the solution and its replica in all non-leaking cylinders. In this paper, the average concentrations between the replicates are reported. At the end of the experiment, cation ionized chromatography (IC) was also used to determine the amine concentration of 30 wt.% solutions (α = 0.1) and the difference between the amine group concentration calculated by titration and cation IC was less than ±2.5 percentage points. The average of the total amine group concentration measured by titration was used in Equation (2) to calculate the experimental values of the remaining amine group (%). In this equation, Ci is the amine group concentration at time = t (days), and Co is the amine group concentration in fresh solution at the start of the experiment. Metal concentrations (Fe, Cr, Ni, and Mo) were measured using inductively coupled plasma mass spectrometry (ICP-MS) for only week five solutions and used as an indicator of the relative corrosivity caused by amine solutions on the stainless steel [10,28,37,42]. The primary focus of the current work was to study the effect of TEG/MEG in the absence of water, amine concentration, and CO2 loading on the stability and corrosivity of amine. Therefore, by-products produced due to amine loss were not studied.
Remaining   amine   group   ( % ) = 100   × C i C o

Modeling

Rate constants of amine group loss can be calculated with a linear regression model by using Equations (3) and (4) while assuming first-order reactions concerning amine and integrated over time “t” [37,46].
dC dt = r = kC
ln C o C i = k . t
C i C o = 1 e k . t
Plotting ln (Co/Ci) as a function of time from Equation (4) provided the first-order rate constants (k) as the slope in linear regression, while the correlation coefficient (R2) gave the accuracy of the model. Rate constants were used in Equation (5) to calculate (Ci/Co), which were subsequently used to predict the remaining amine group (%) from Equation (2). First-order rate constants (k), the experimental duration (time “t”), and R2 are given in Table 2.

3. Results and Discussion

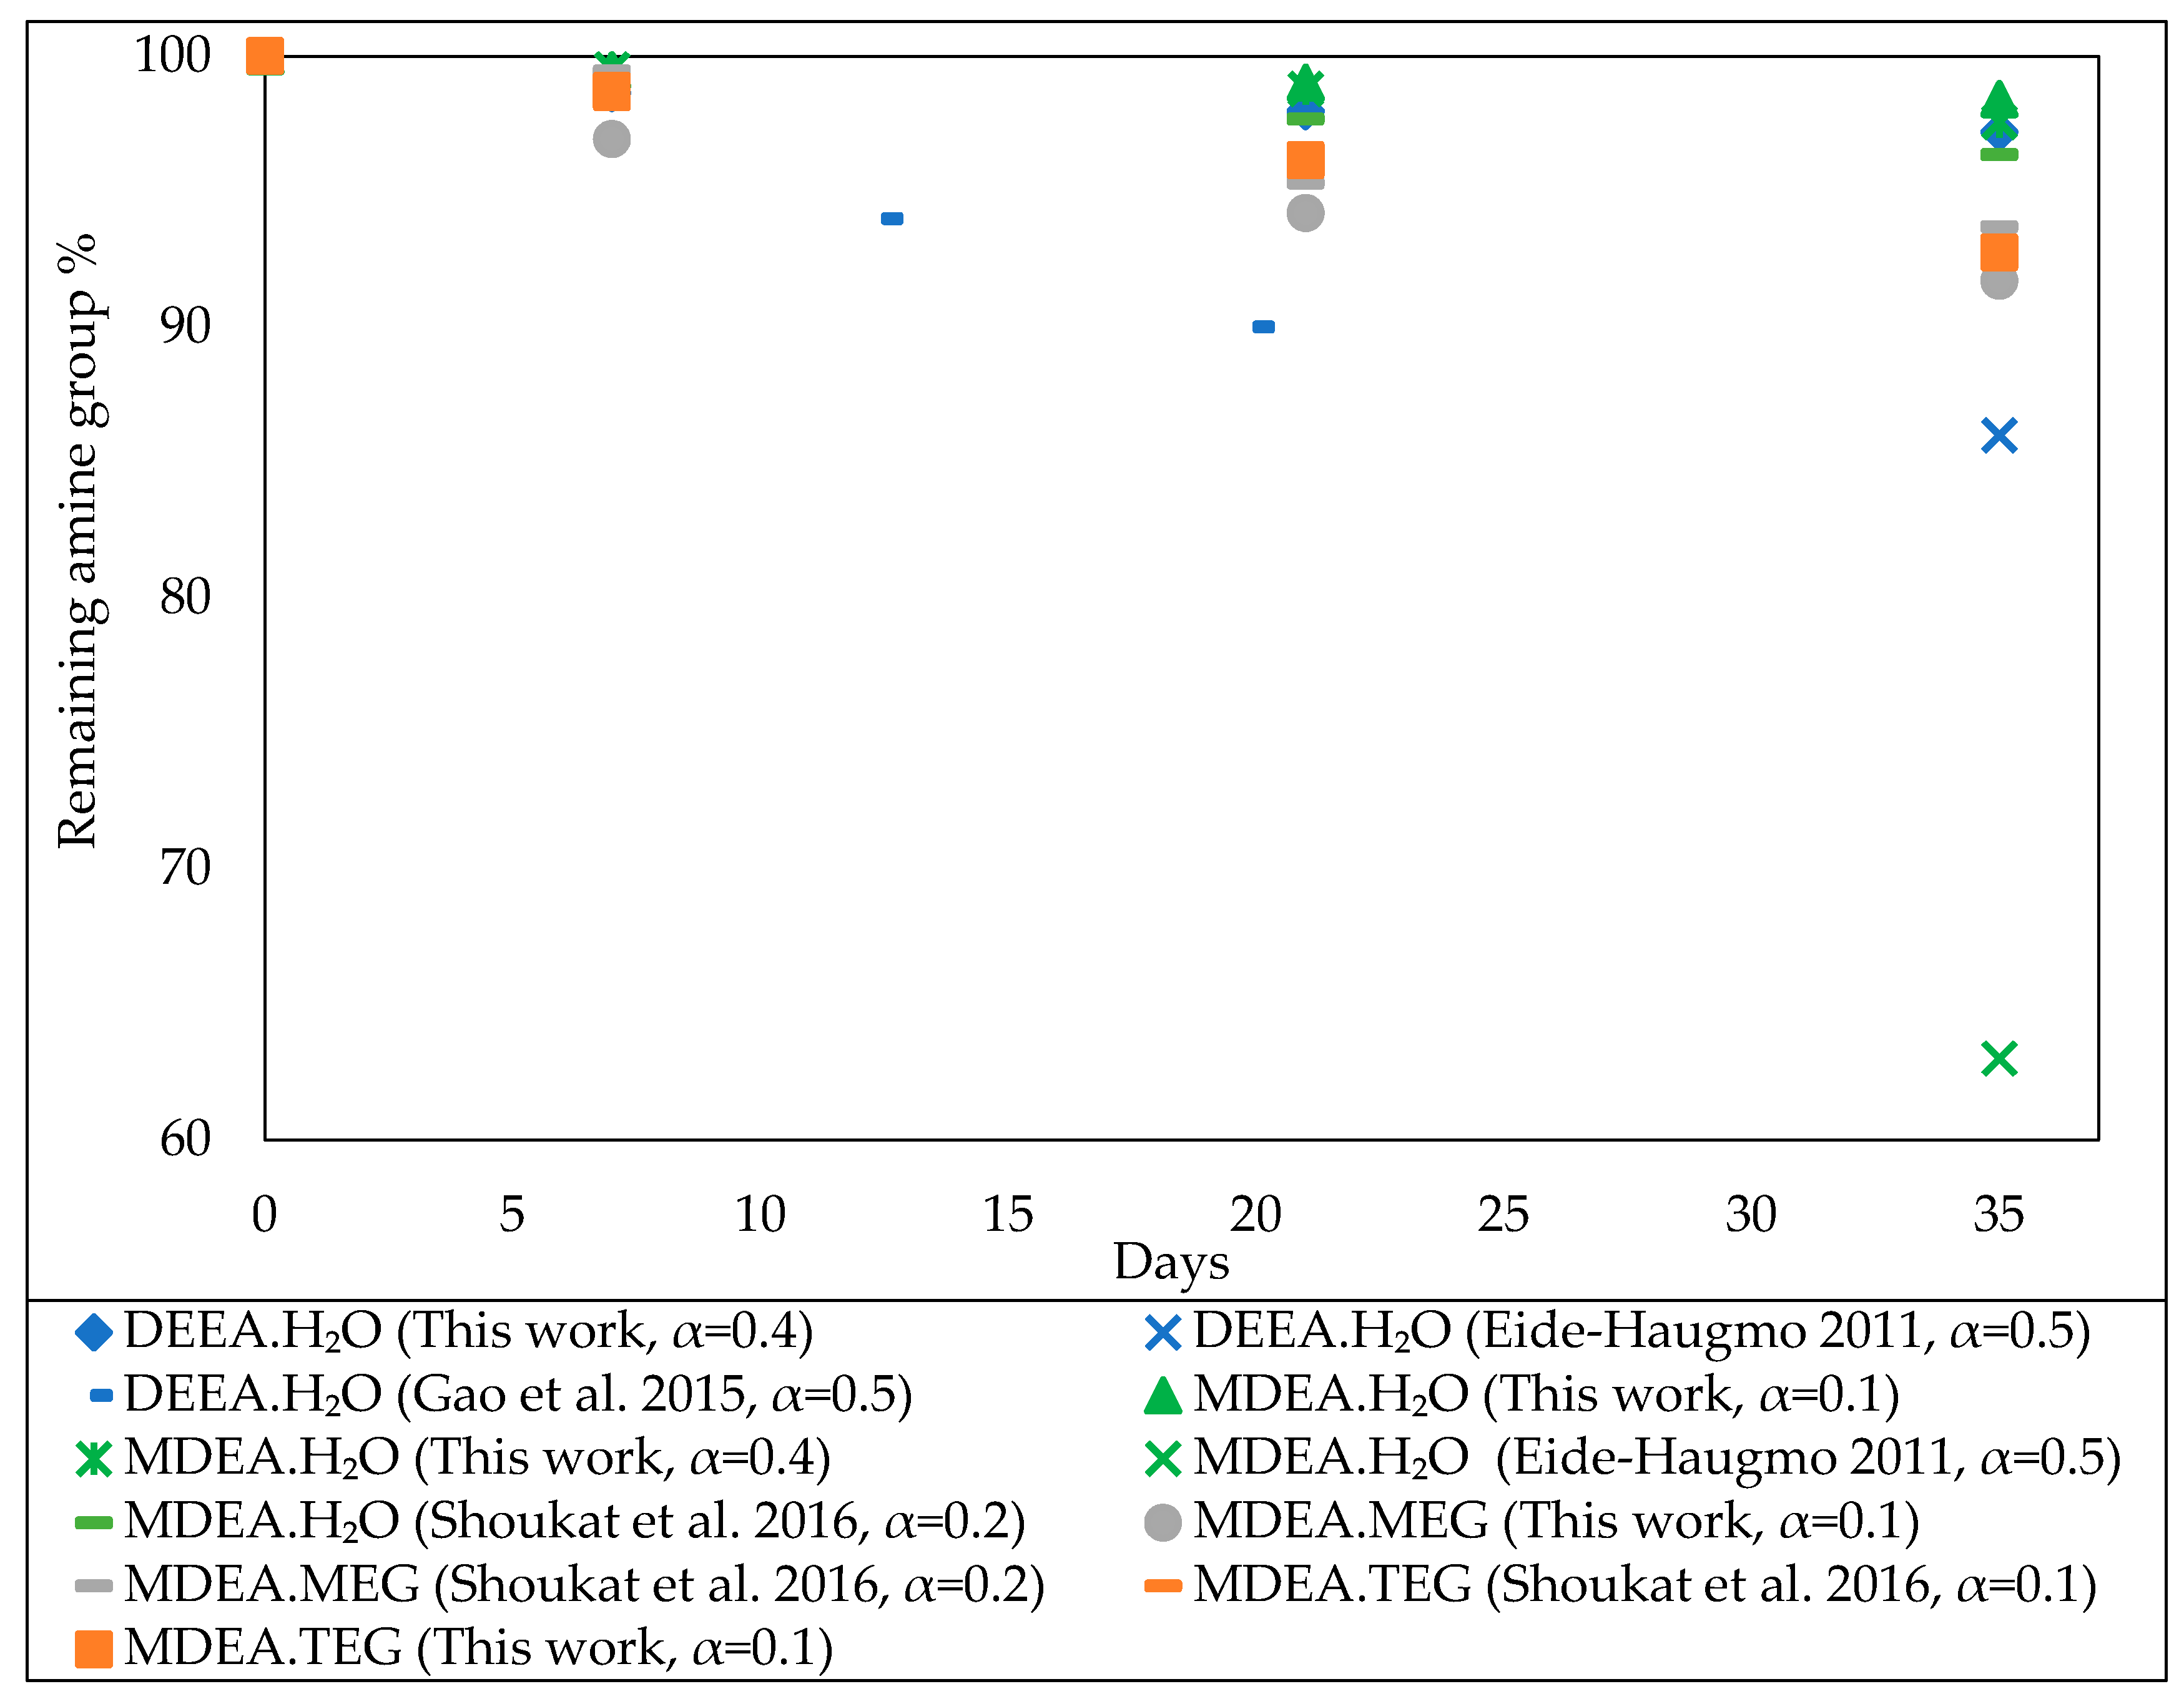
3.1. Comparison with Literature Data

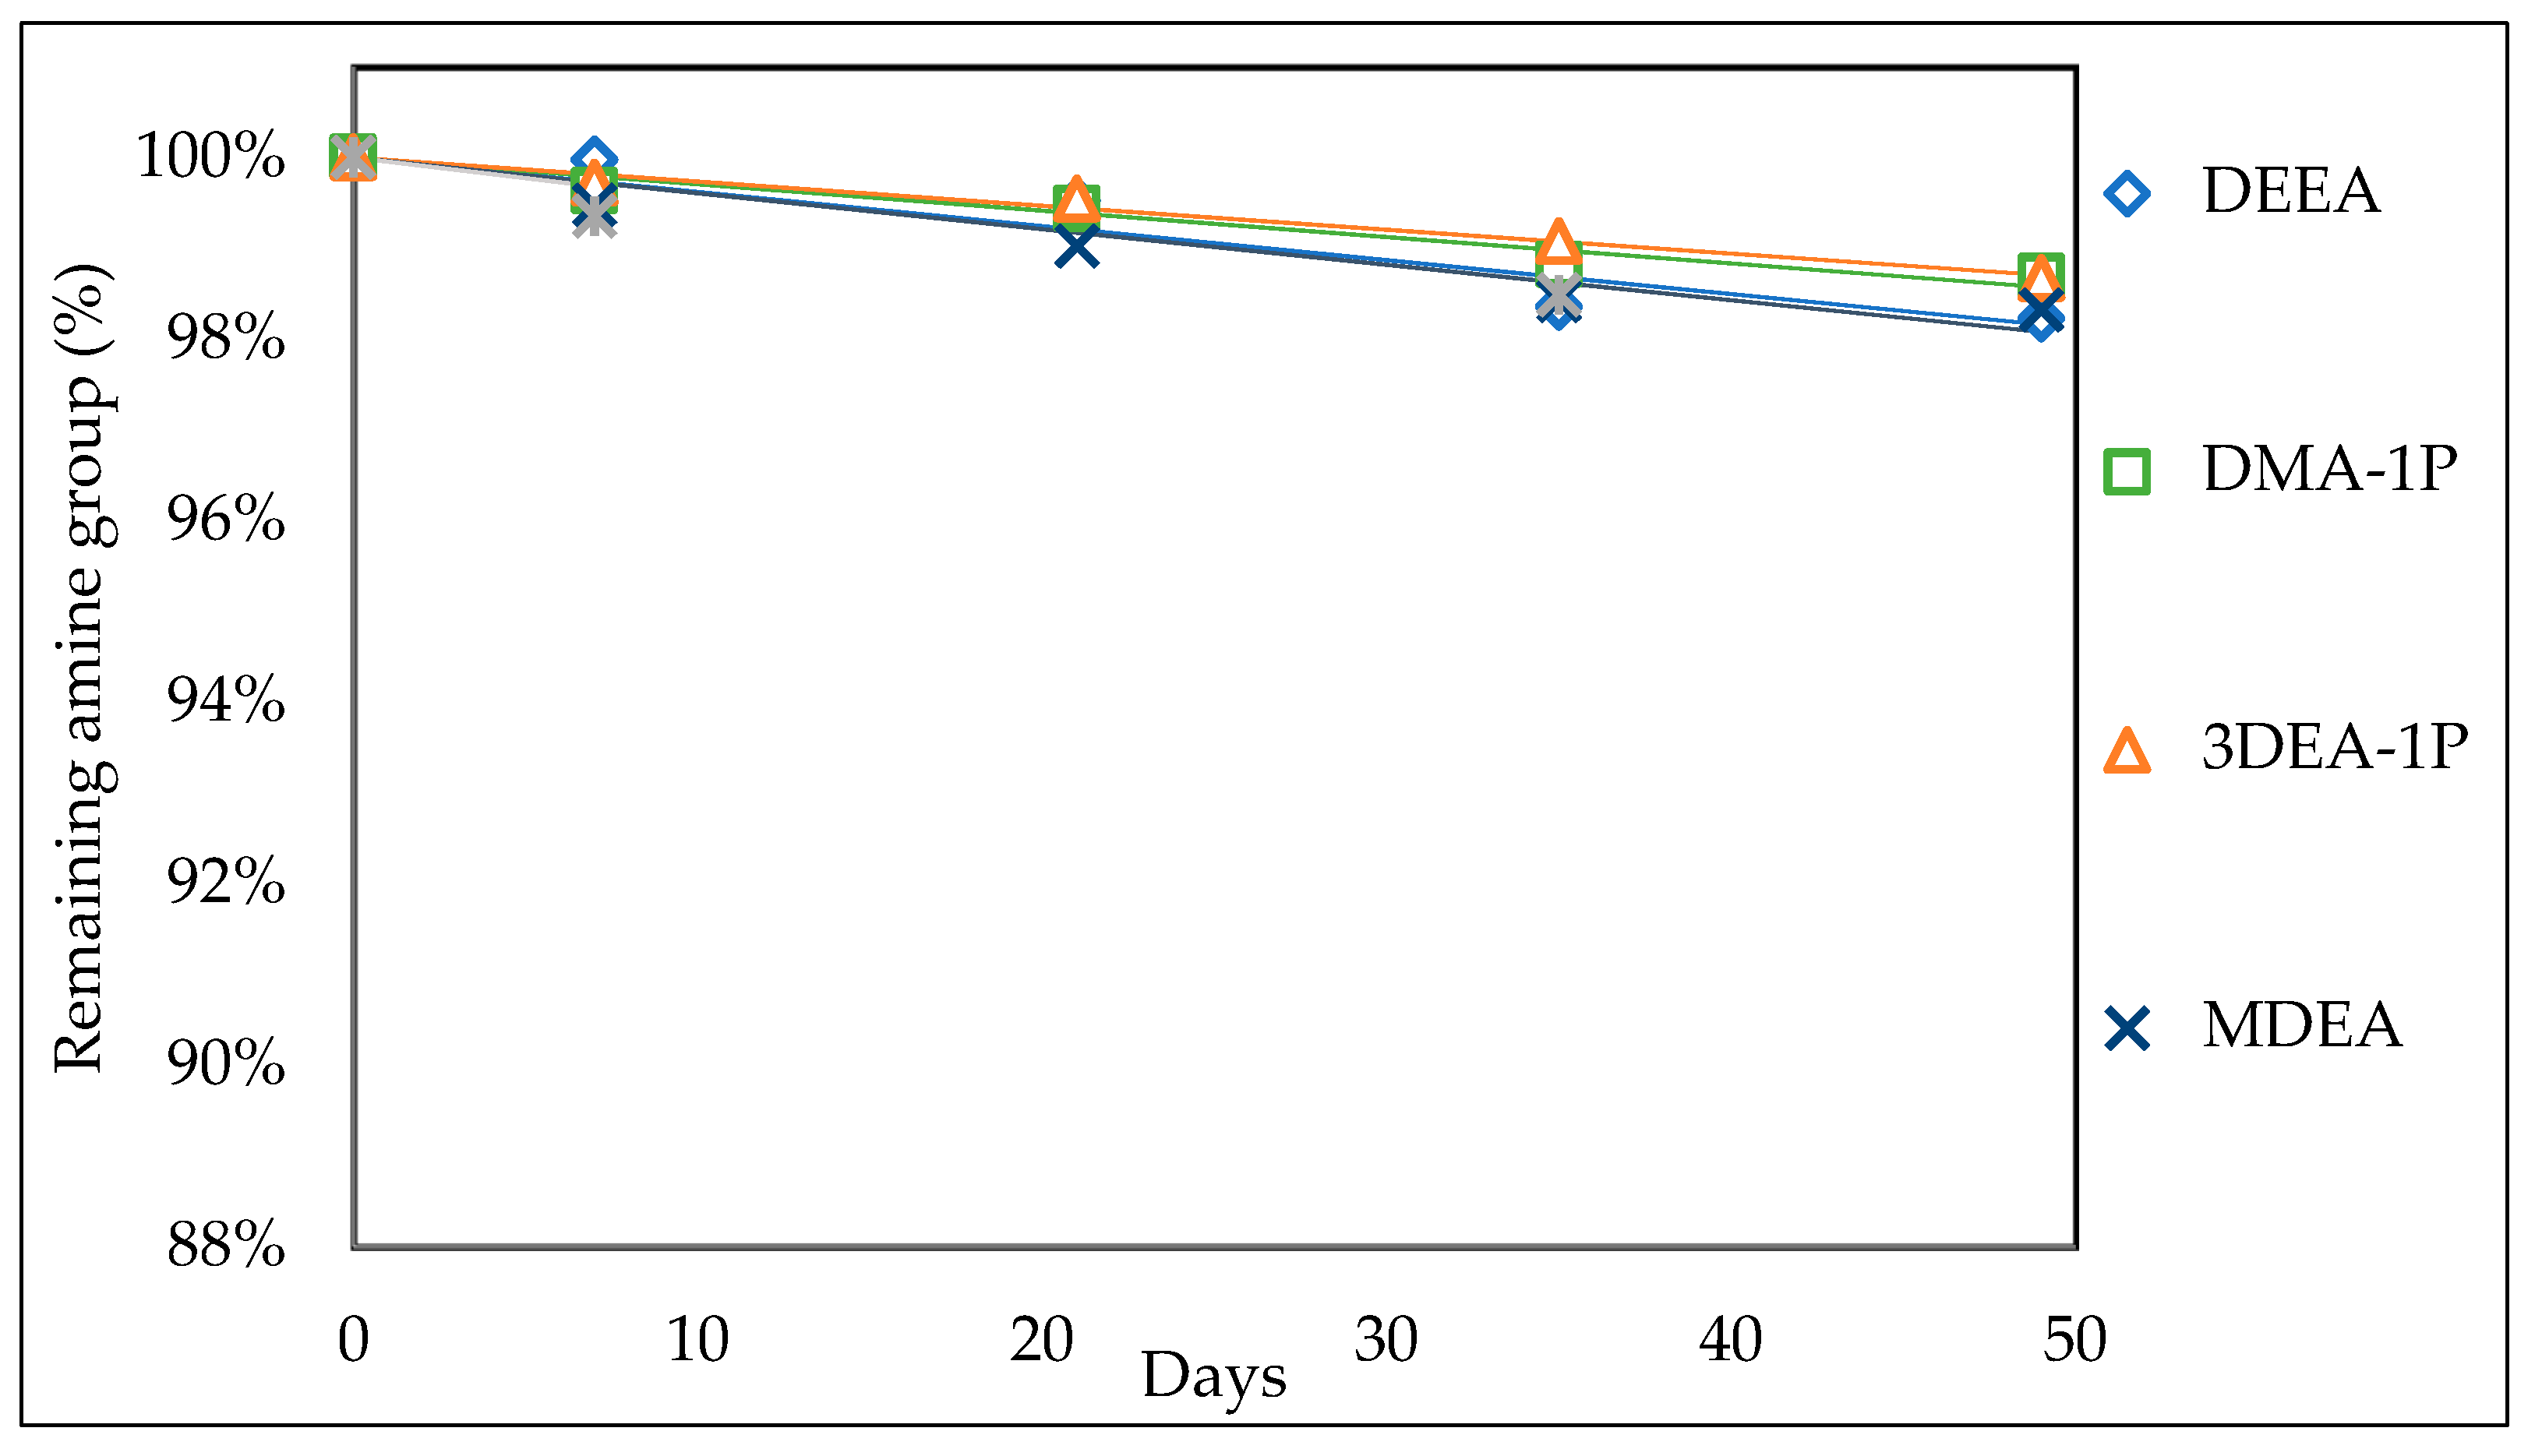
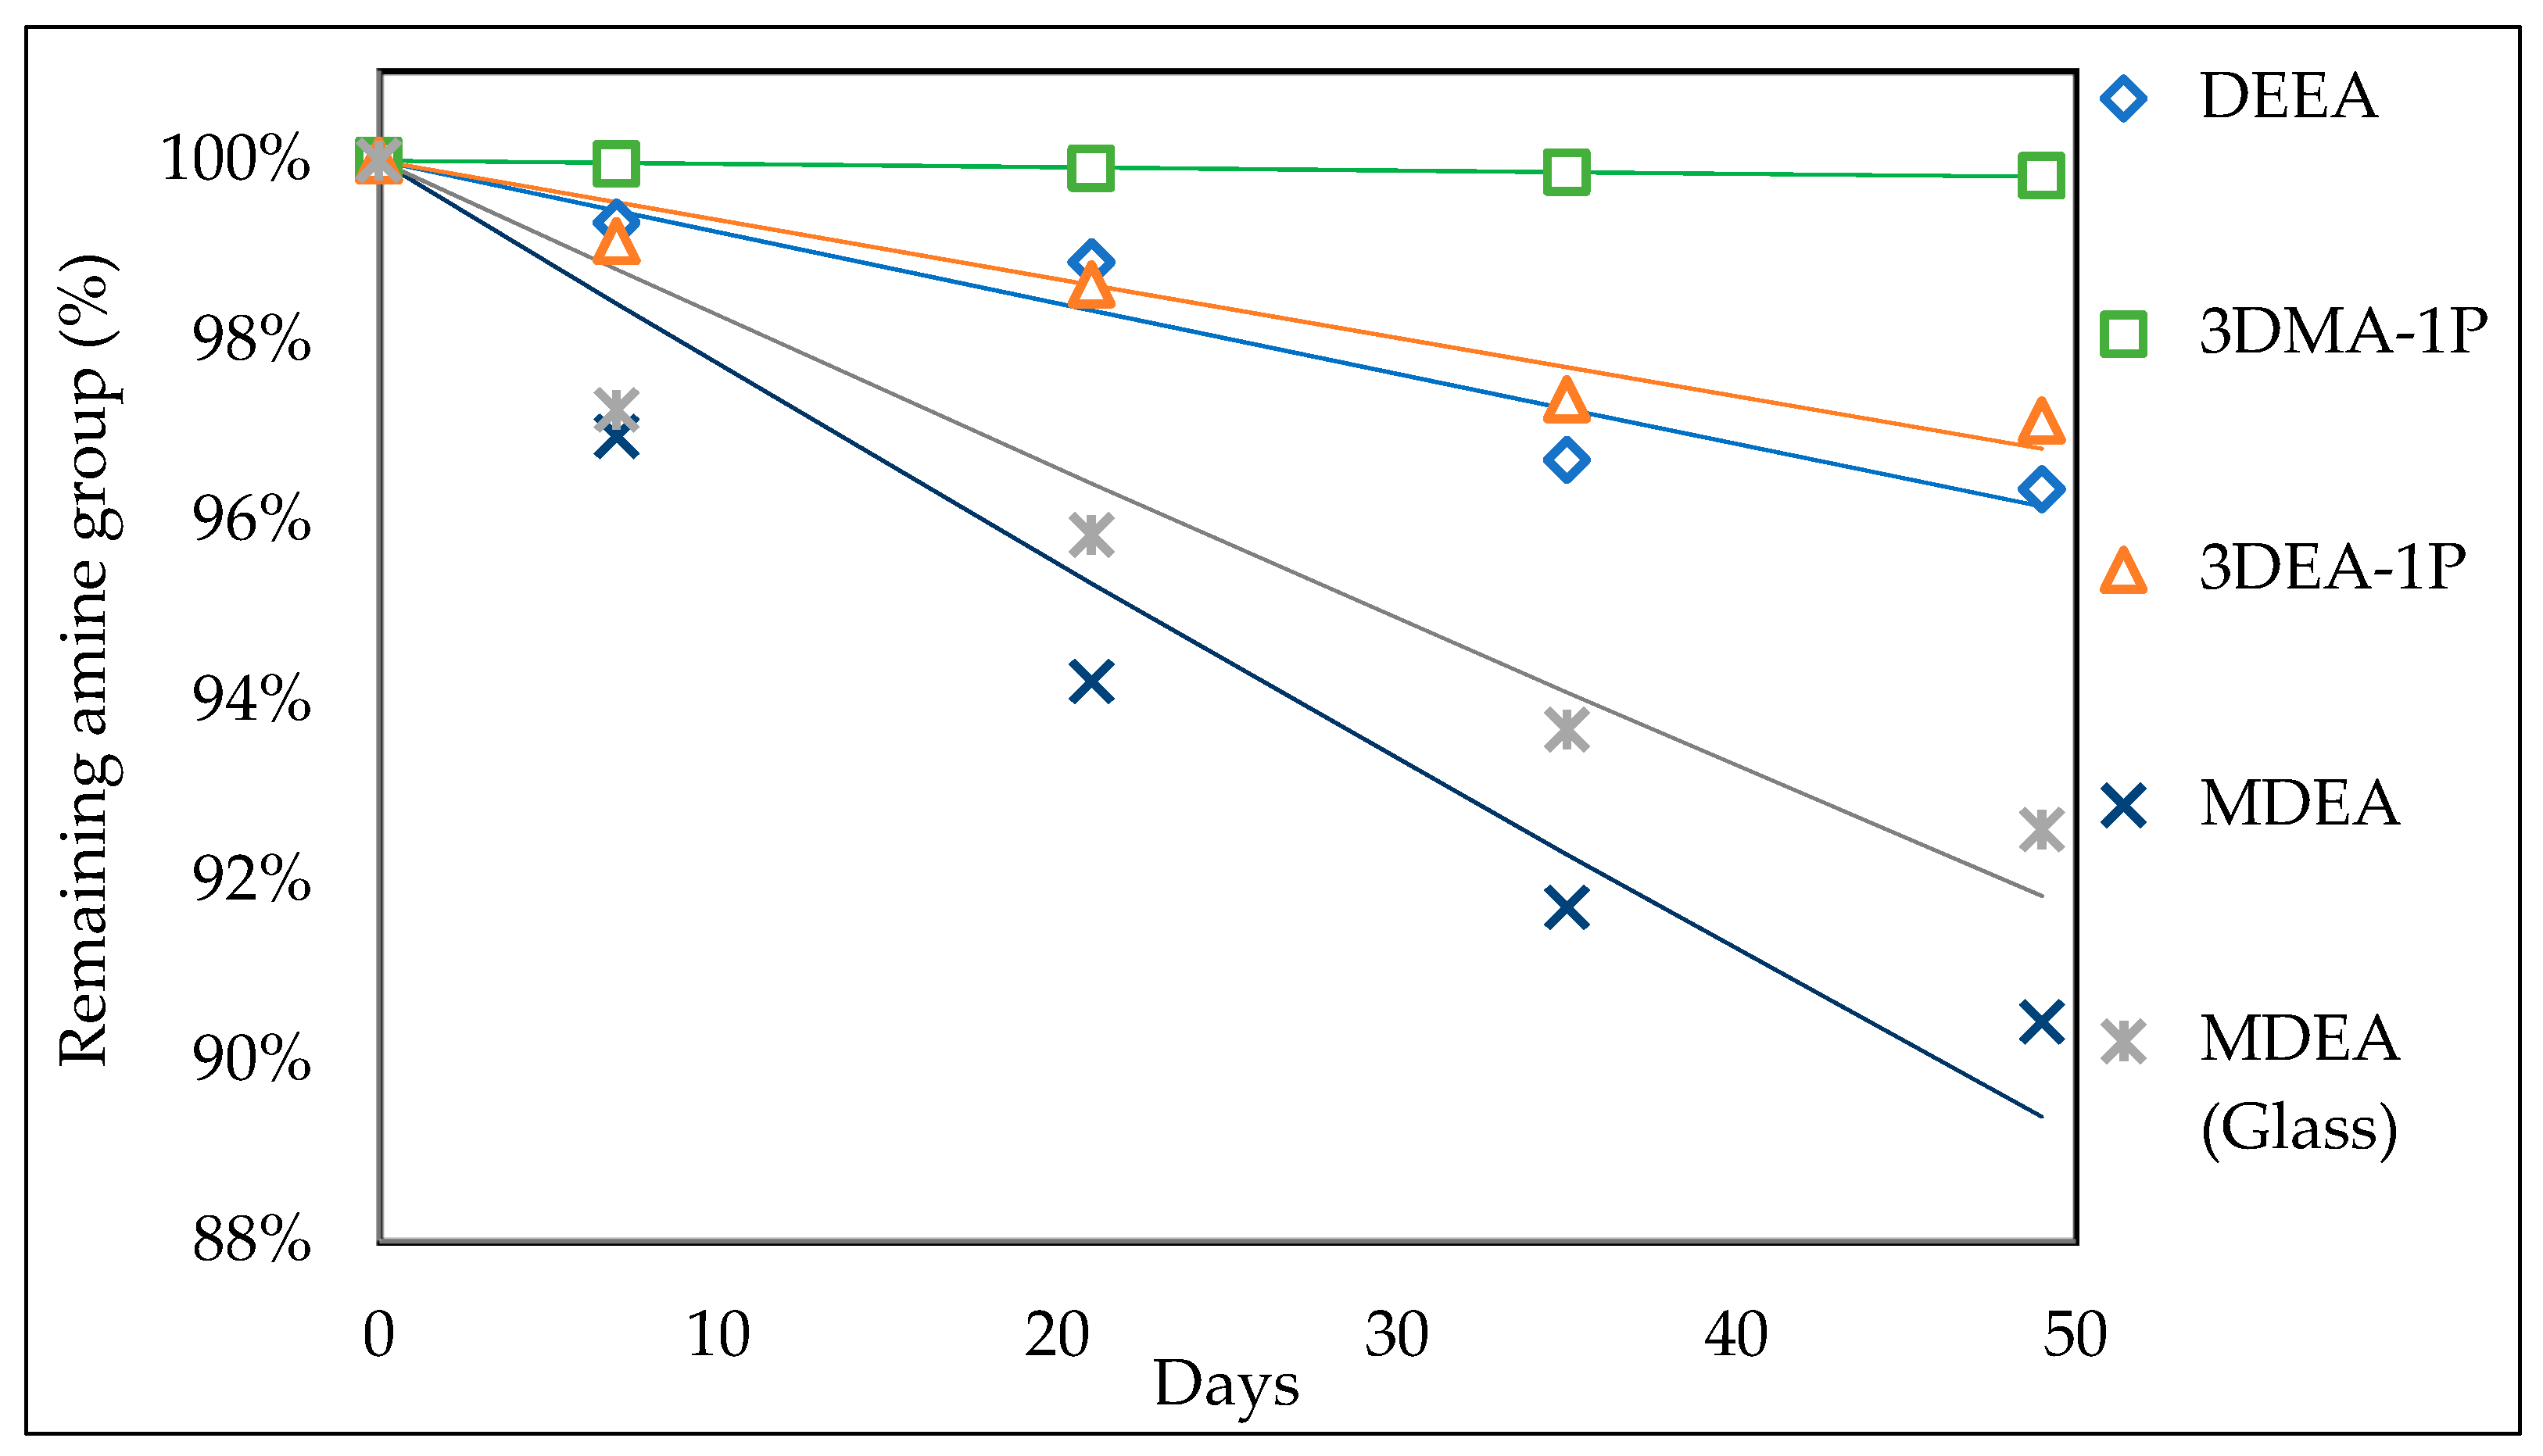
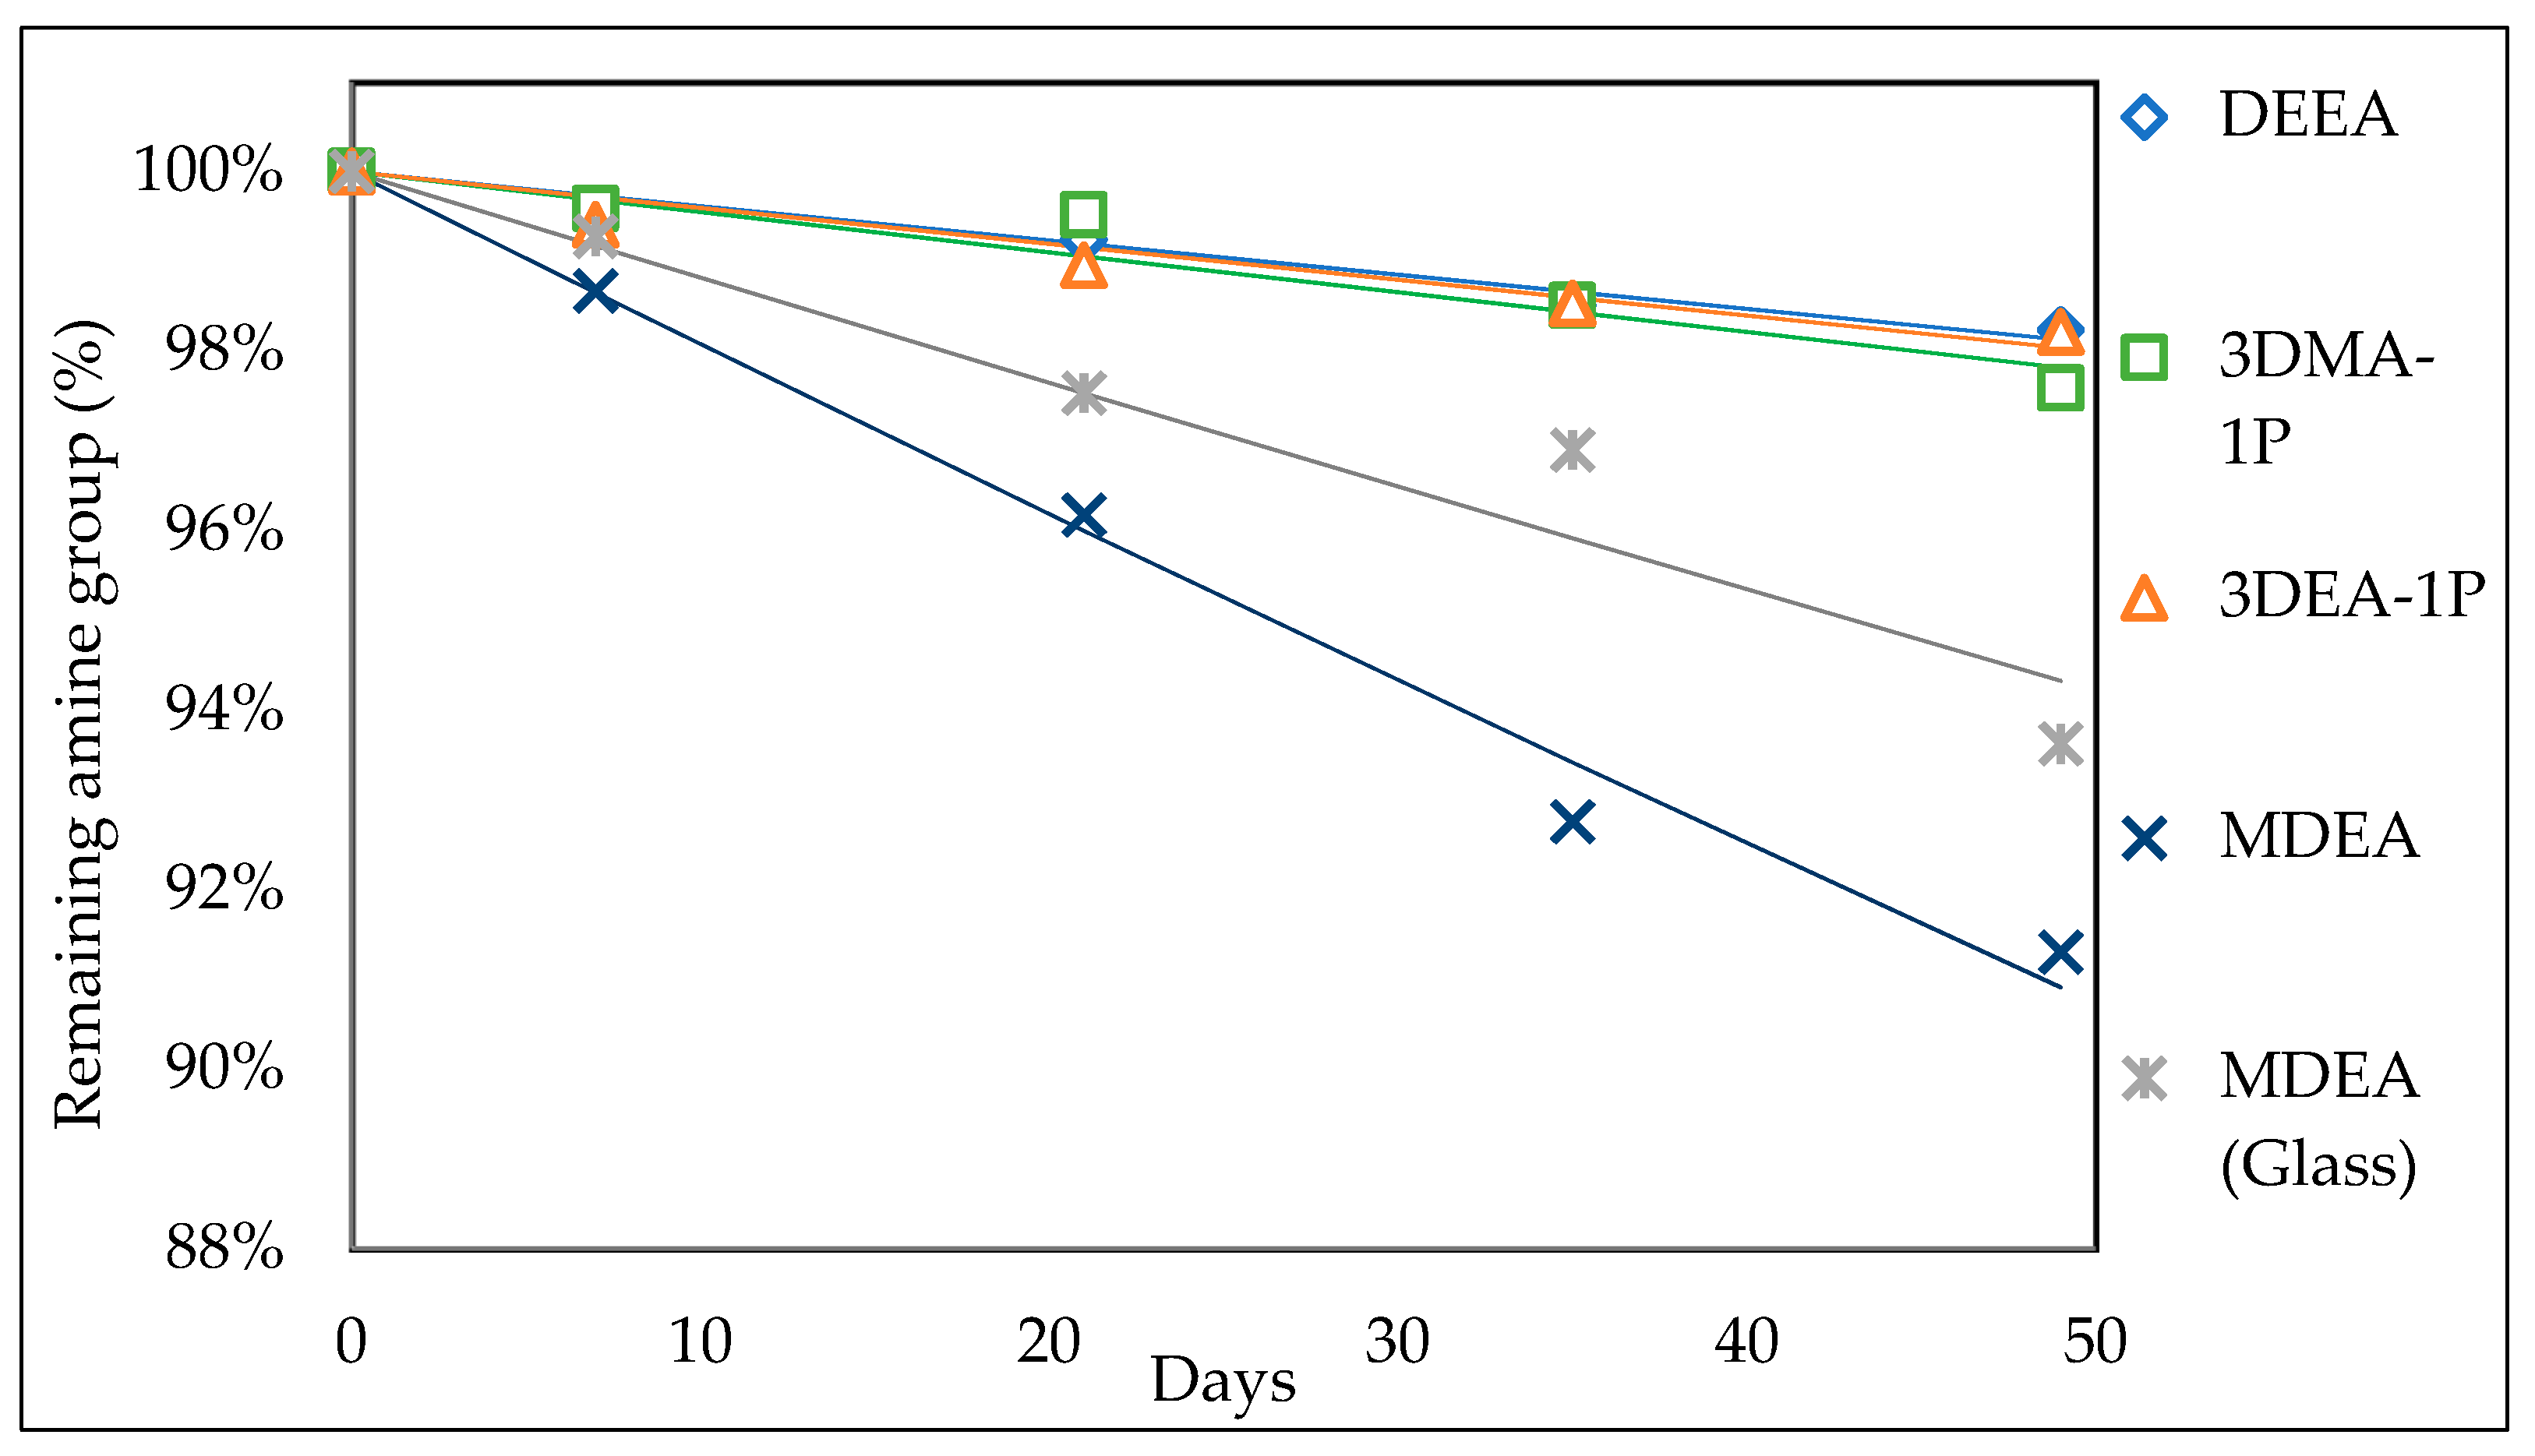
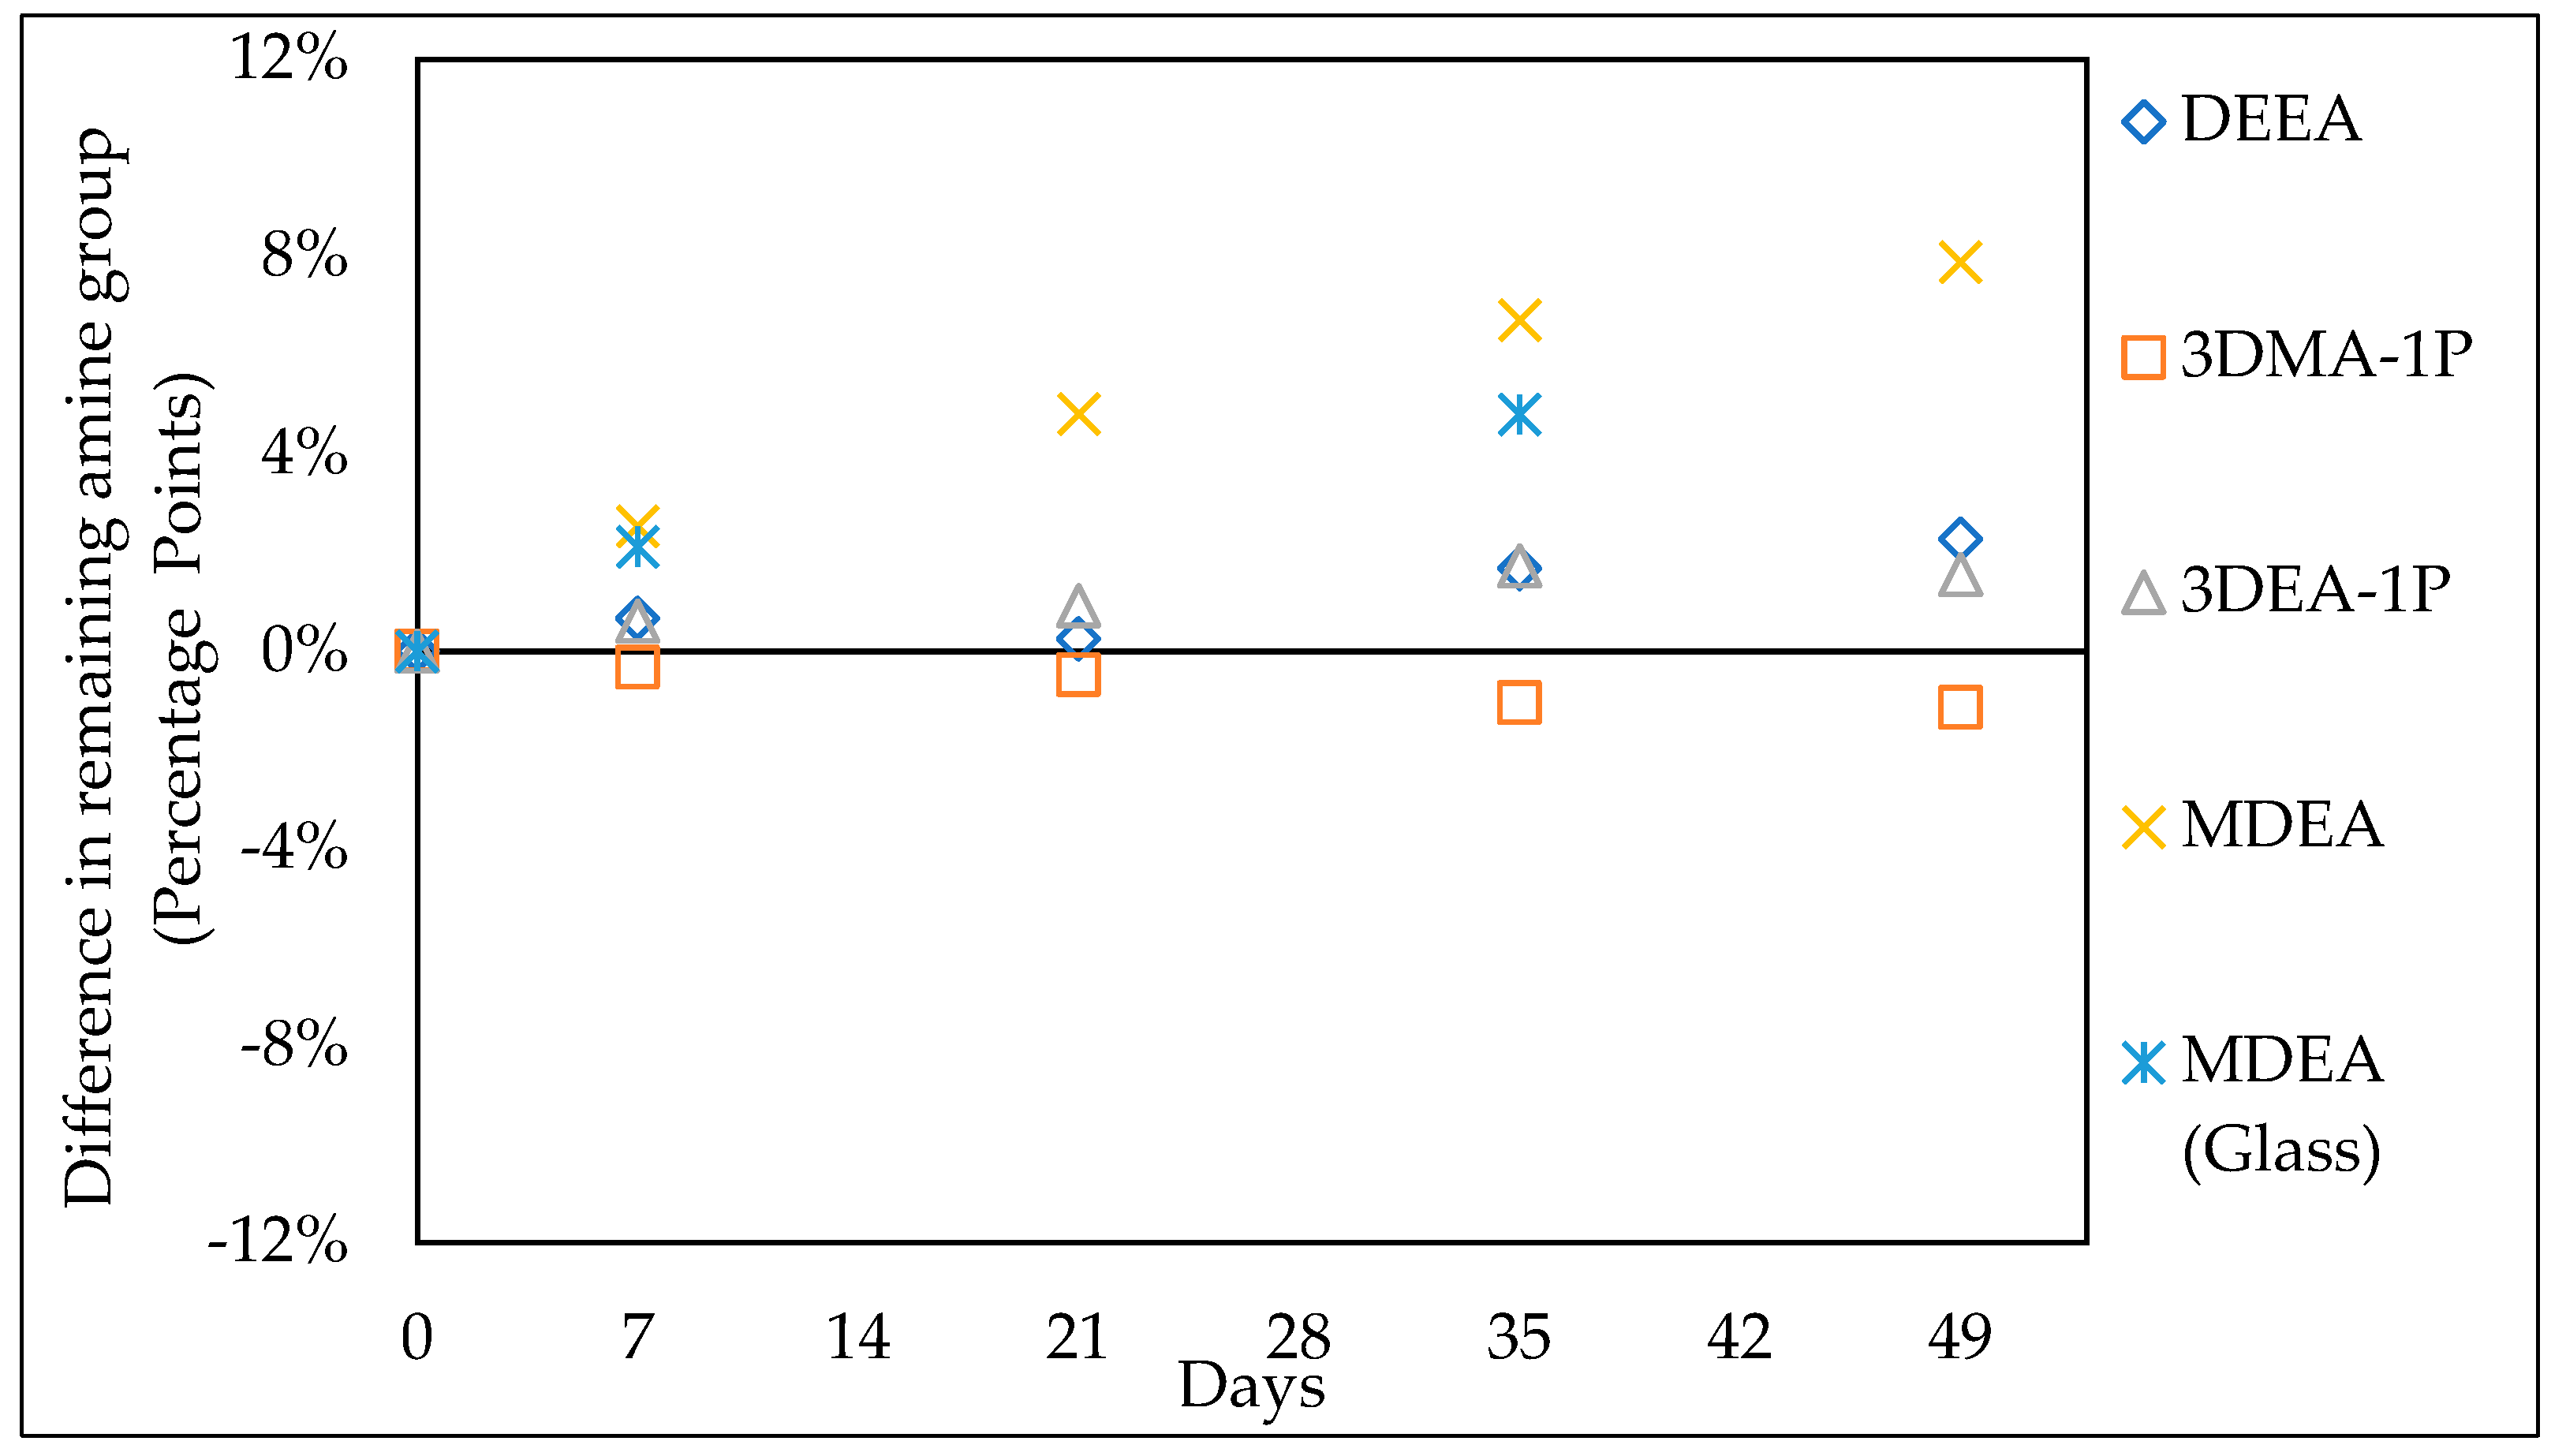
3.1.1. Thermal Stability
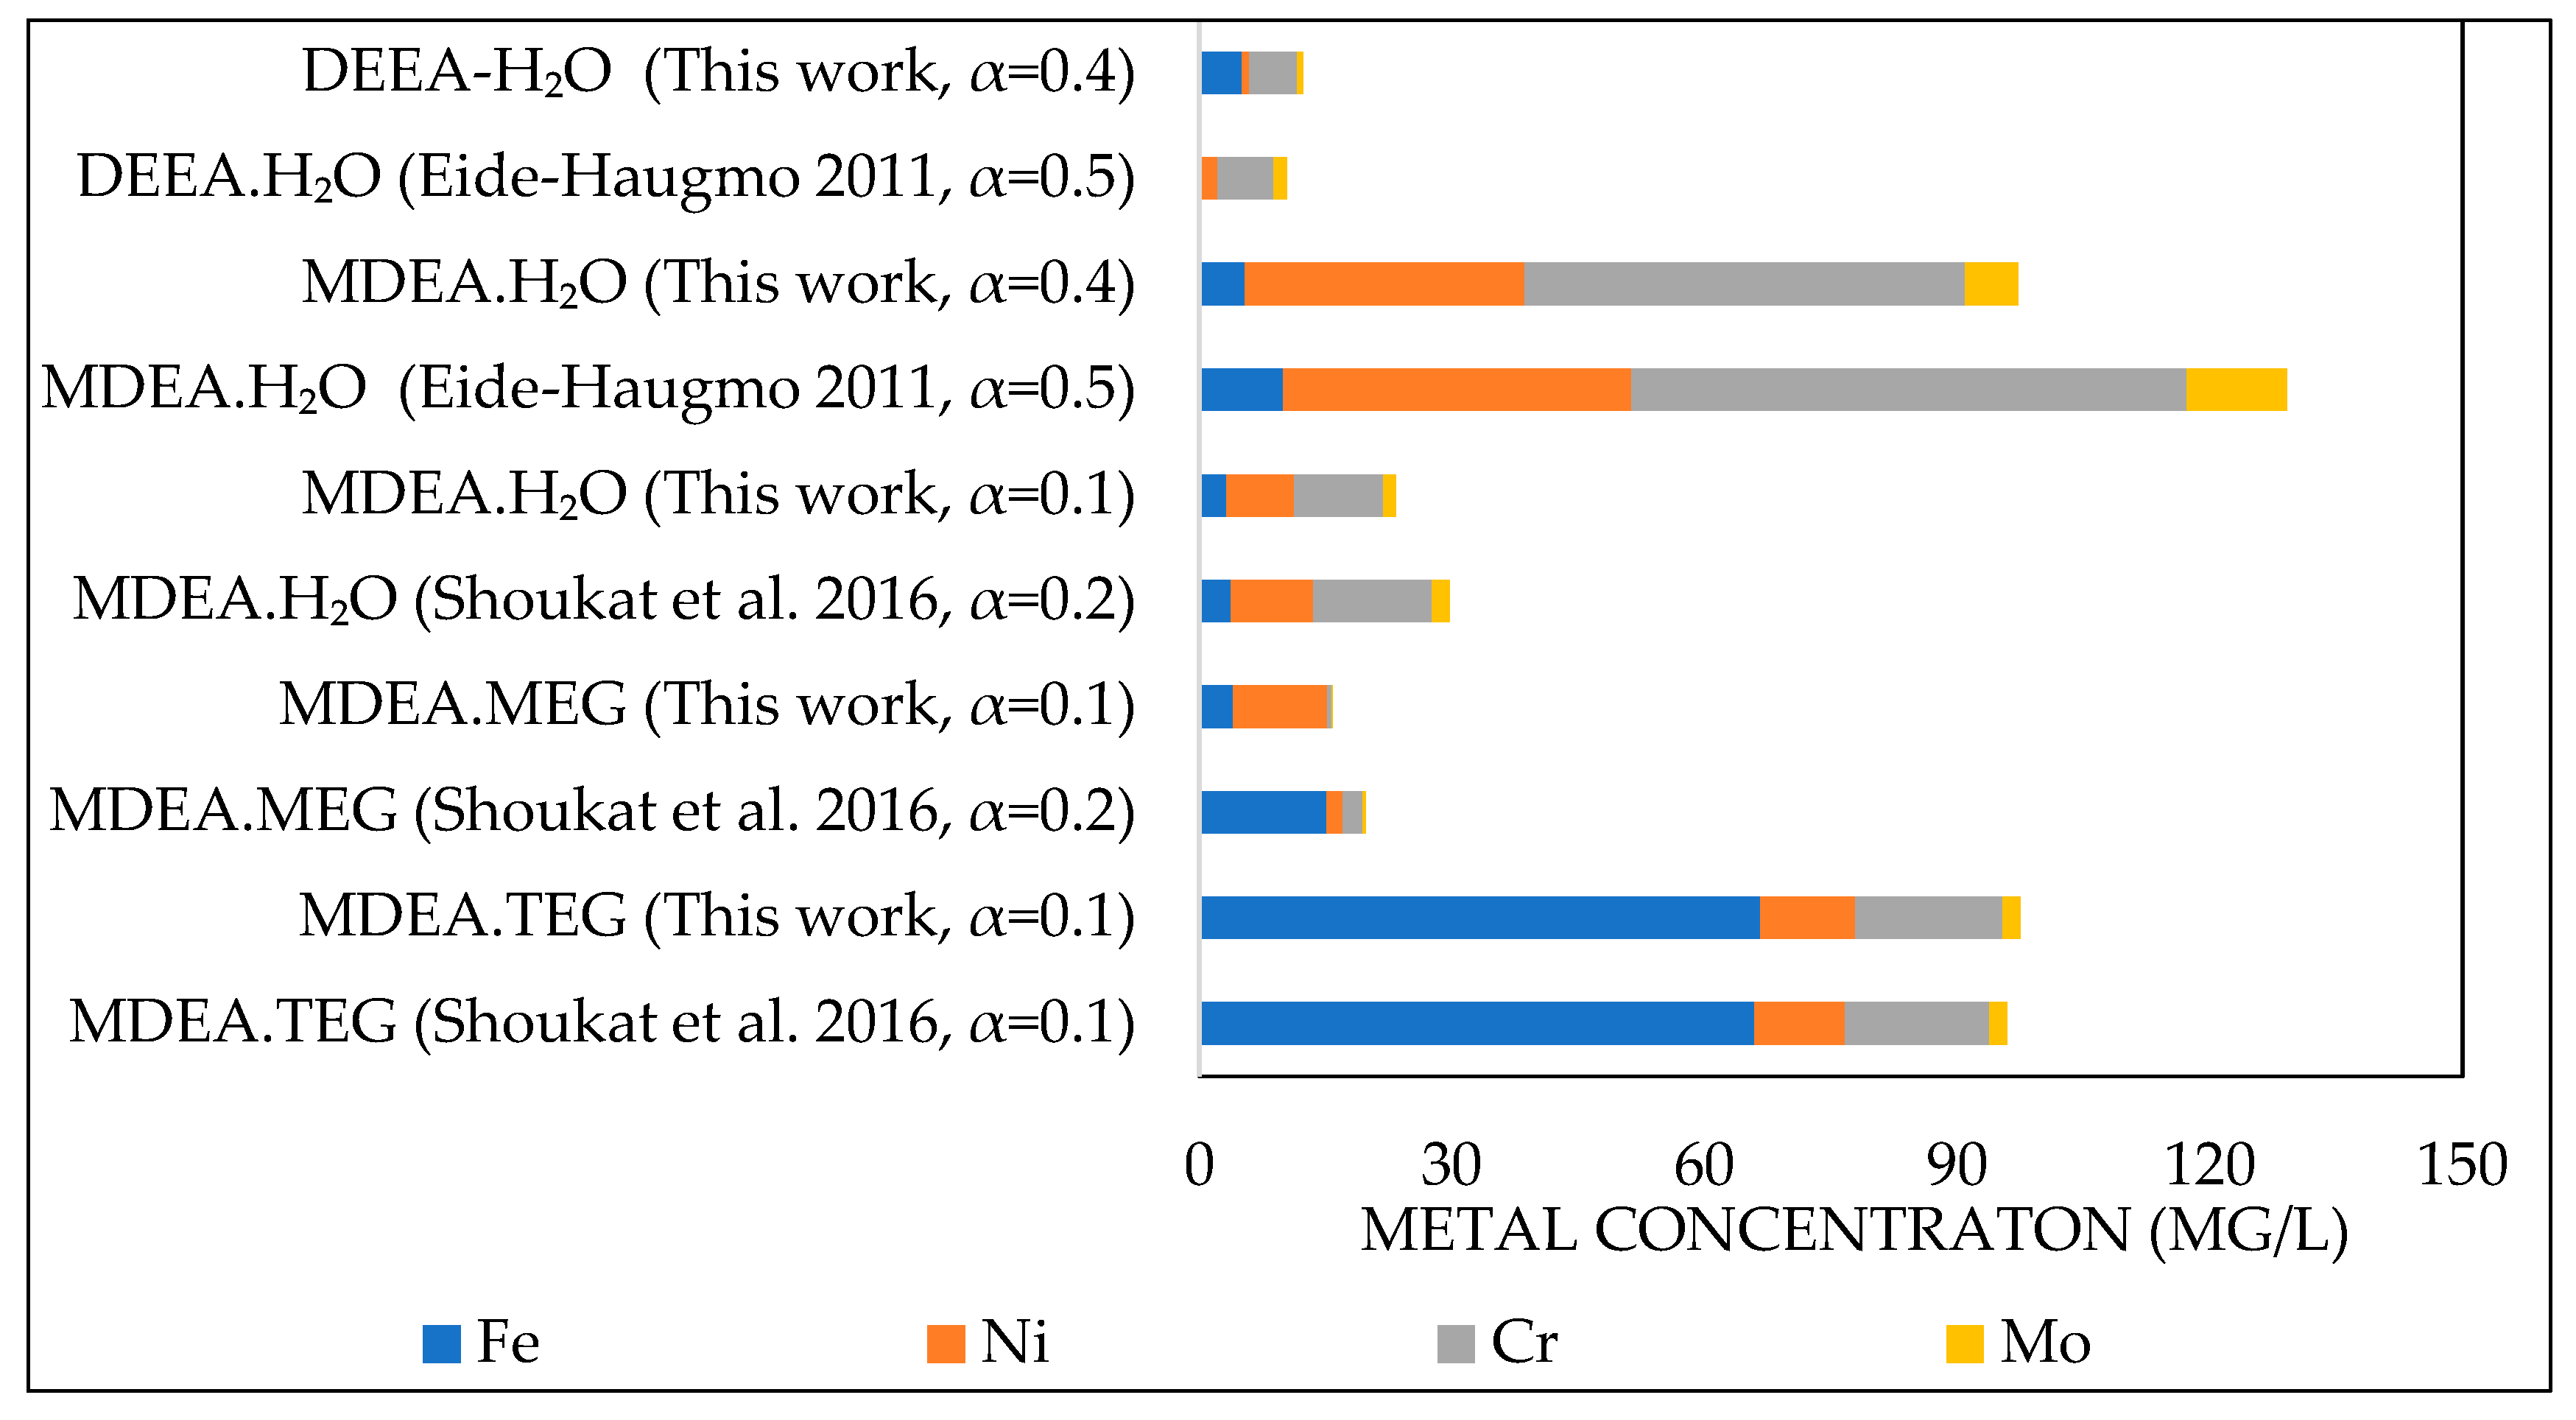
The validation of degradation results is not simple. In the laboratory, the degradation is accelerated to shorten the experimental time and small differences in solvent compositions or experimental conditions can give large differences in the results. Of the solutions studied in this work, the thermal degradation of aqueous DEEA and MDEA has previously been studied and there is adequate agreement found between the current study and published data, as shown in Figure 2. For aqueous DEEA solutions, Gao et al. [39] (35 wt.% DEEA with α = 0.5) showed 4 percentage points and 7 percentage points higher amine loss after 12.5 and 20 days, respectively, probably due to the higher amine concentration and higher CO2 loading. Eide-Haugmo [35] (30 wt.% DEEA with α = 0.5) showed 11 percentage points higher amine loss after five weeks at 135 °C in comparison to our current data, which can be partly explained by the higher loading. Finally, the new data are in good agreement with our previous data, showing a good reproducibility [10]. Figure 2 also presents a comparison of this work (30 wt.% MDEA in H2O, MEG, and TEG with α = 0.1) and our previous work (34 wt.% MDEA in H2O with α = 0.19, 30 wt.% MDEA in MEG with α = 0.19, and 30 wt.% MDEA in TEG with α = 0.11) [10]. The agreement is good and both studies show the same trend in the thermal stability of MDEA blends after seven weeks, which is in the order of MDEA.H2O > MDEA.TEG > MDEA.MEG. It can be concluded that there is a good overall agreement between the published literature data and degradation data reported in this paper.

3.1.2. Corrosion

The corrosion results are in agreement with previously published data from various authors, as shown in Figure 3. Shoukat et al. [10] also found similar total metal concentrations and a similar order for MDEA blends as the current work. Furthermore, the new aqueous MDEA and DEEA data are also in acceptable agreement with Eide-Haugmo [35]. Individual metal ion concentrations display very small quantities (<67 mg/L), both in our current data set and previously published data sets. It can be concluded that the current data set is in good agreement with the literature data.

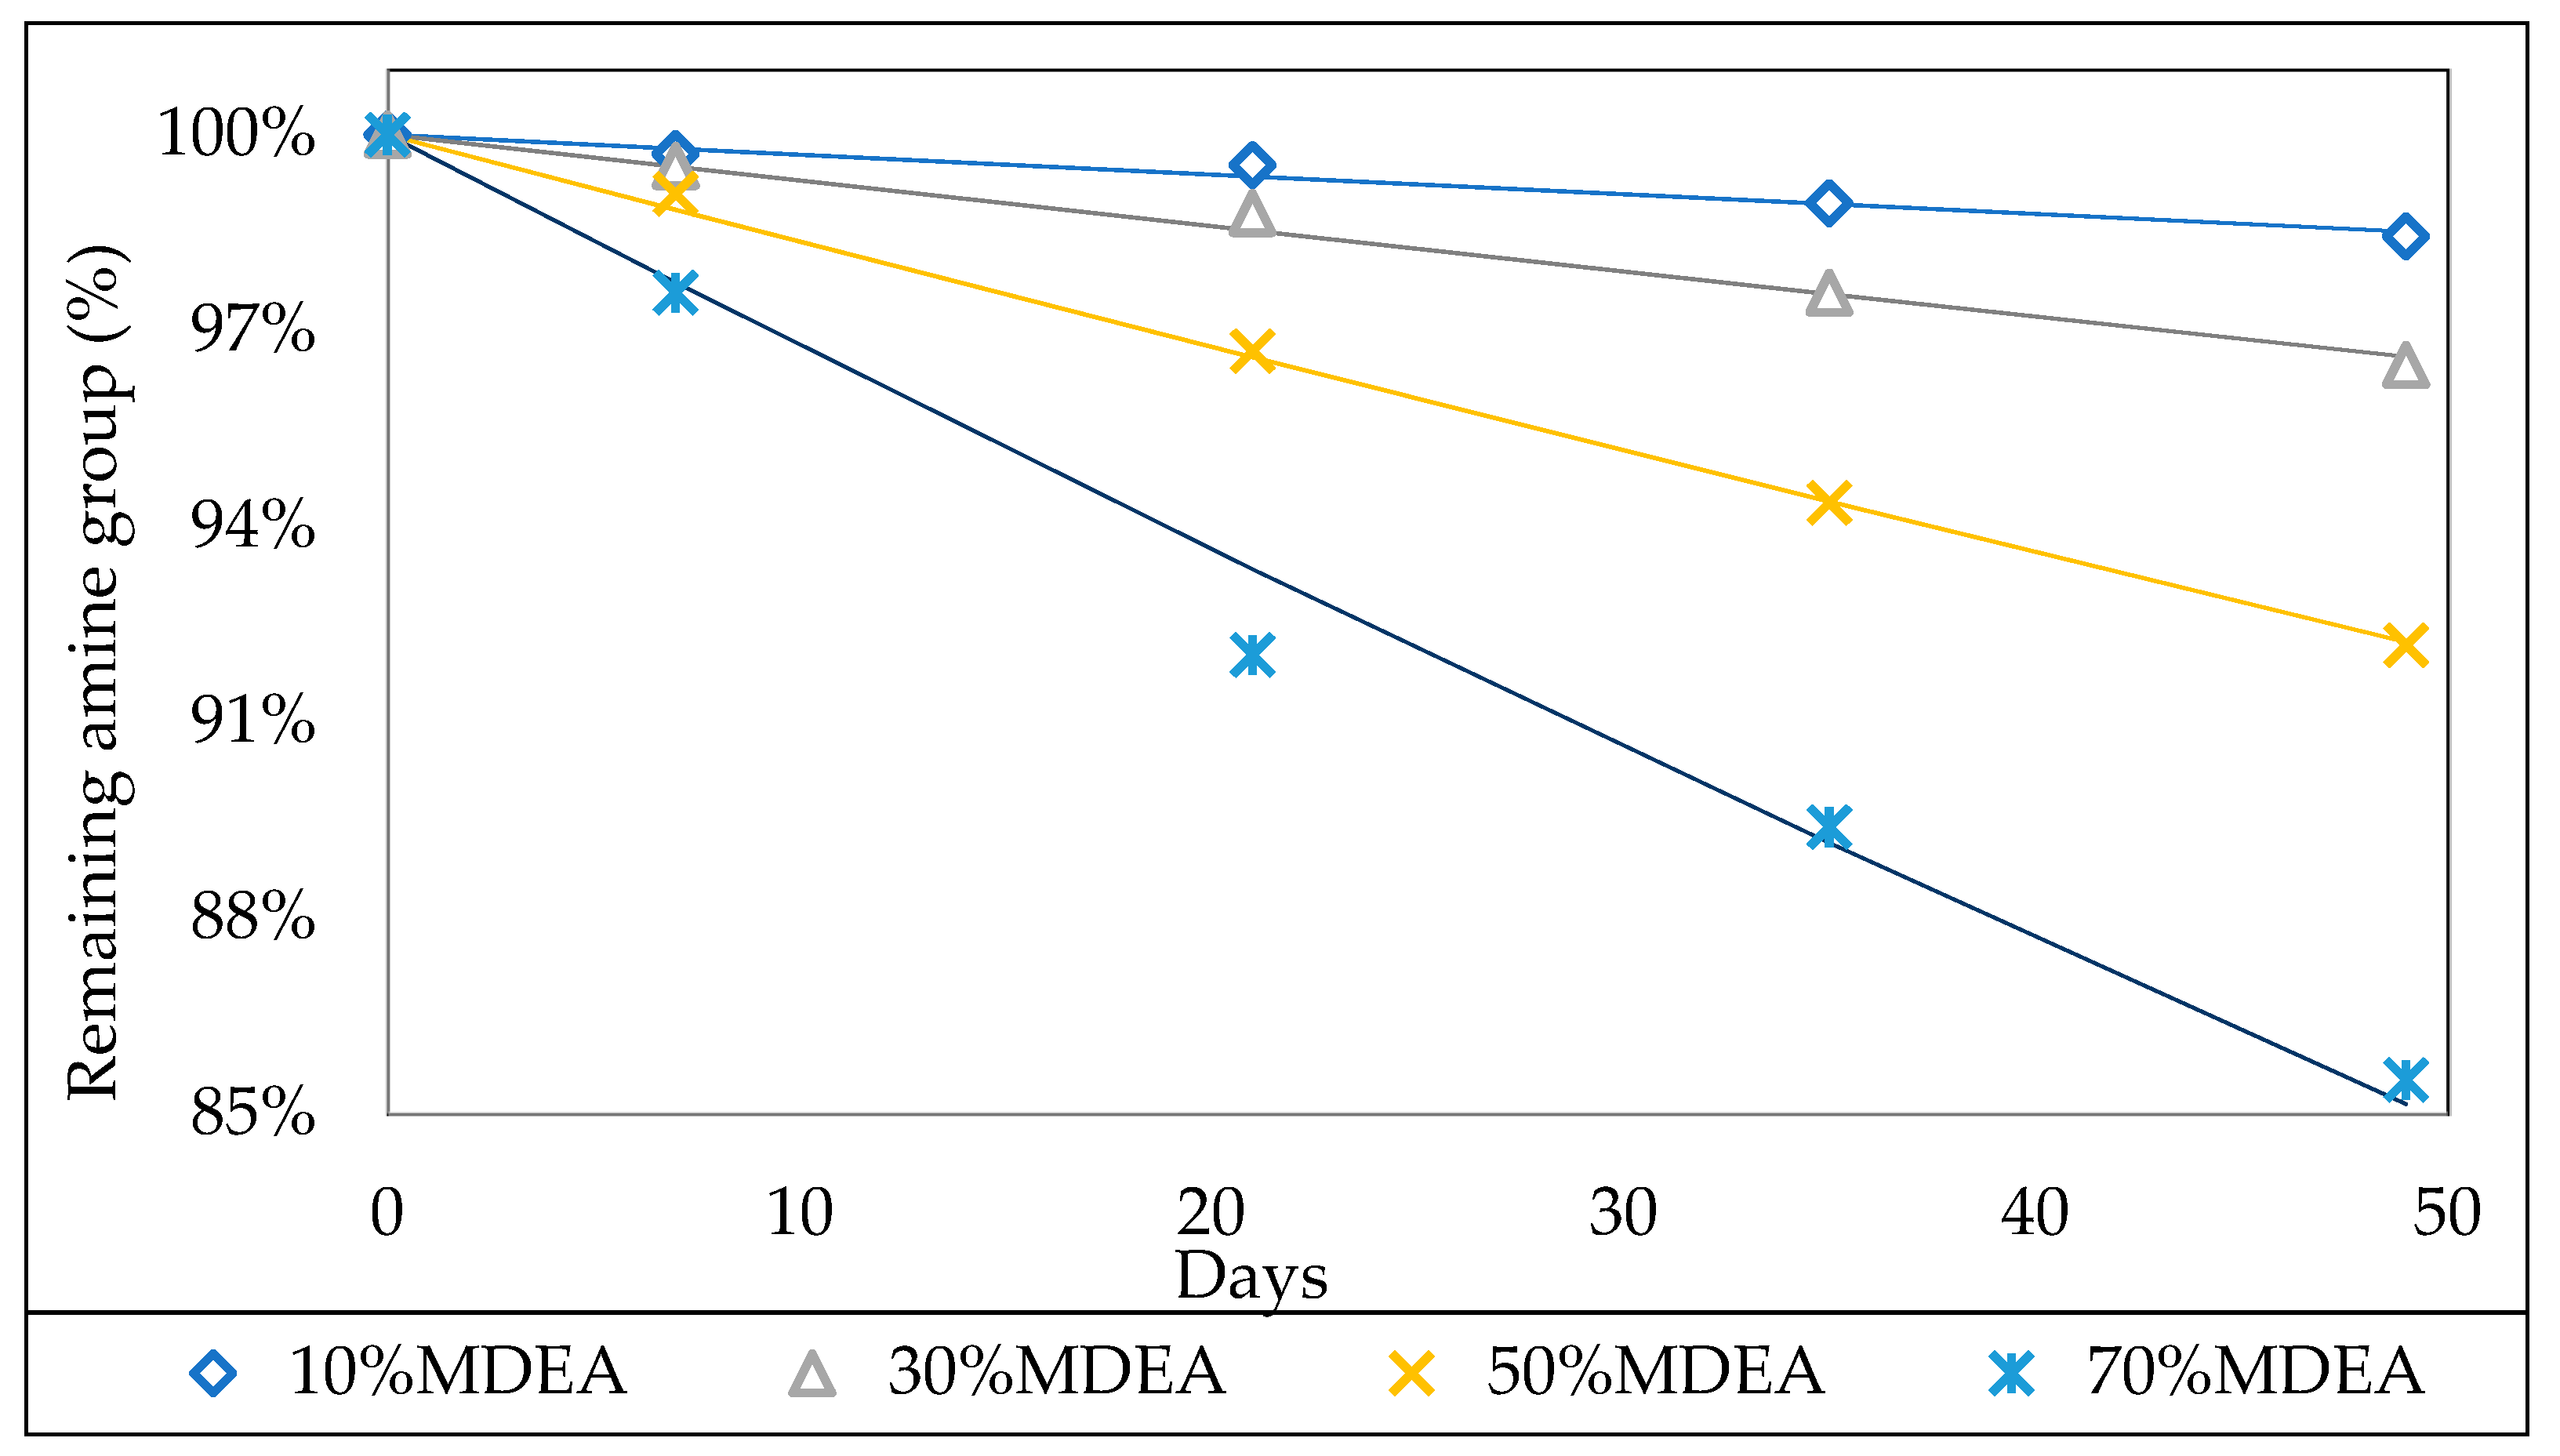
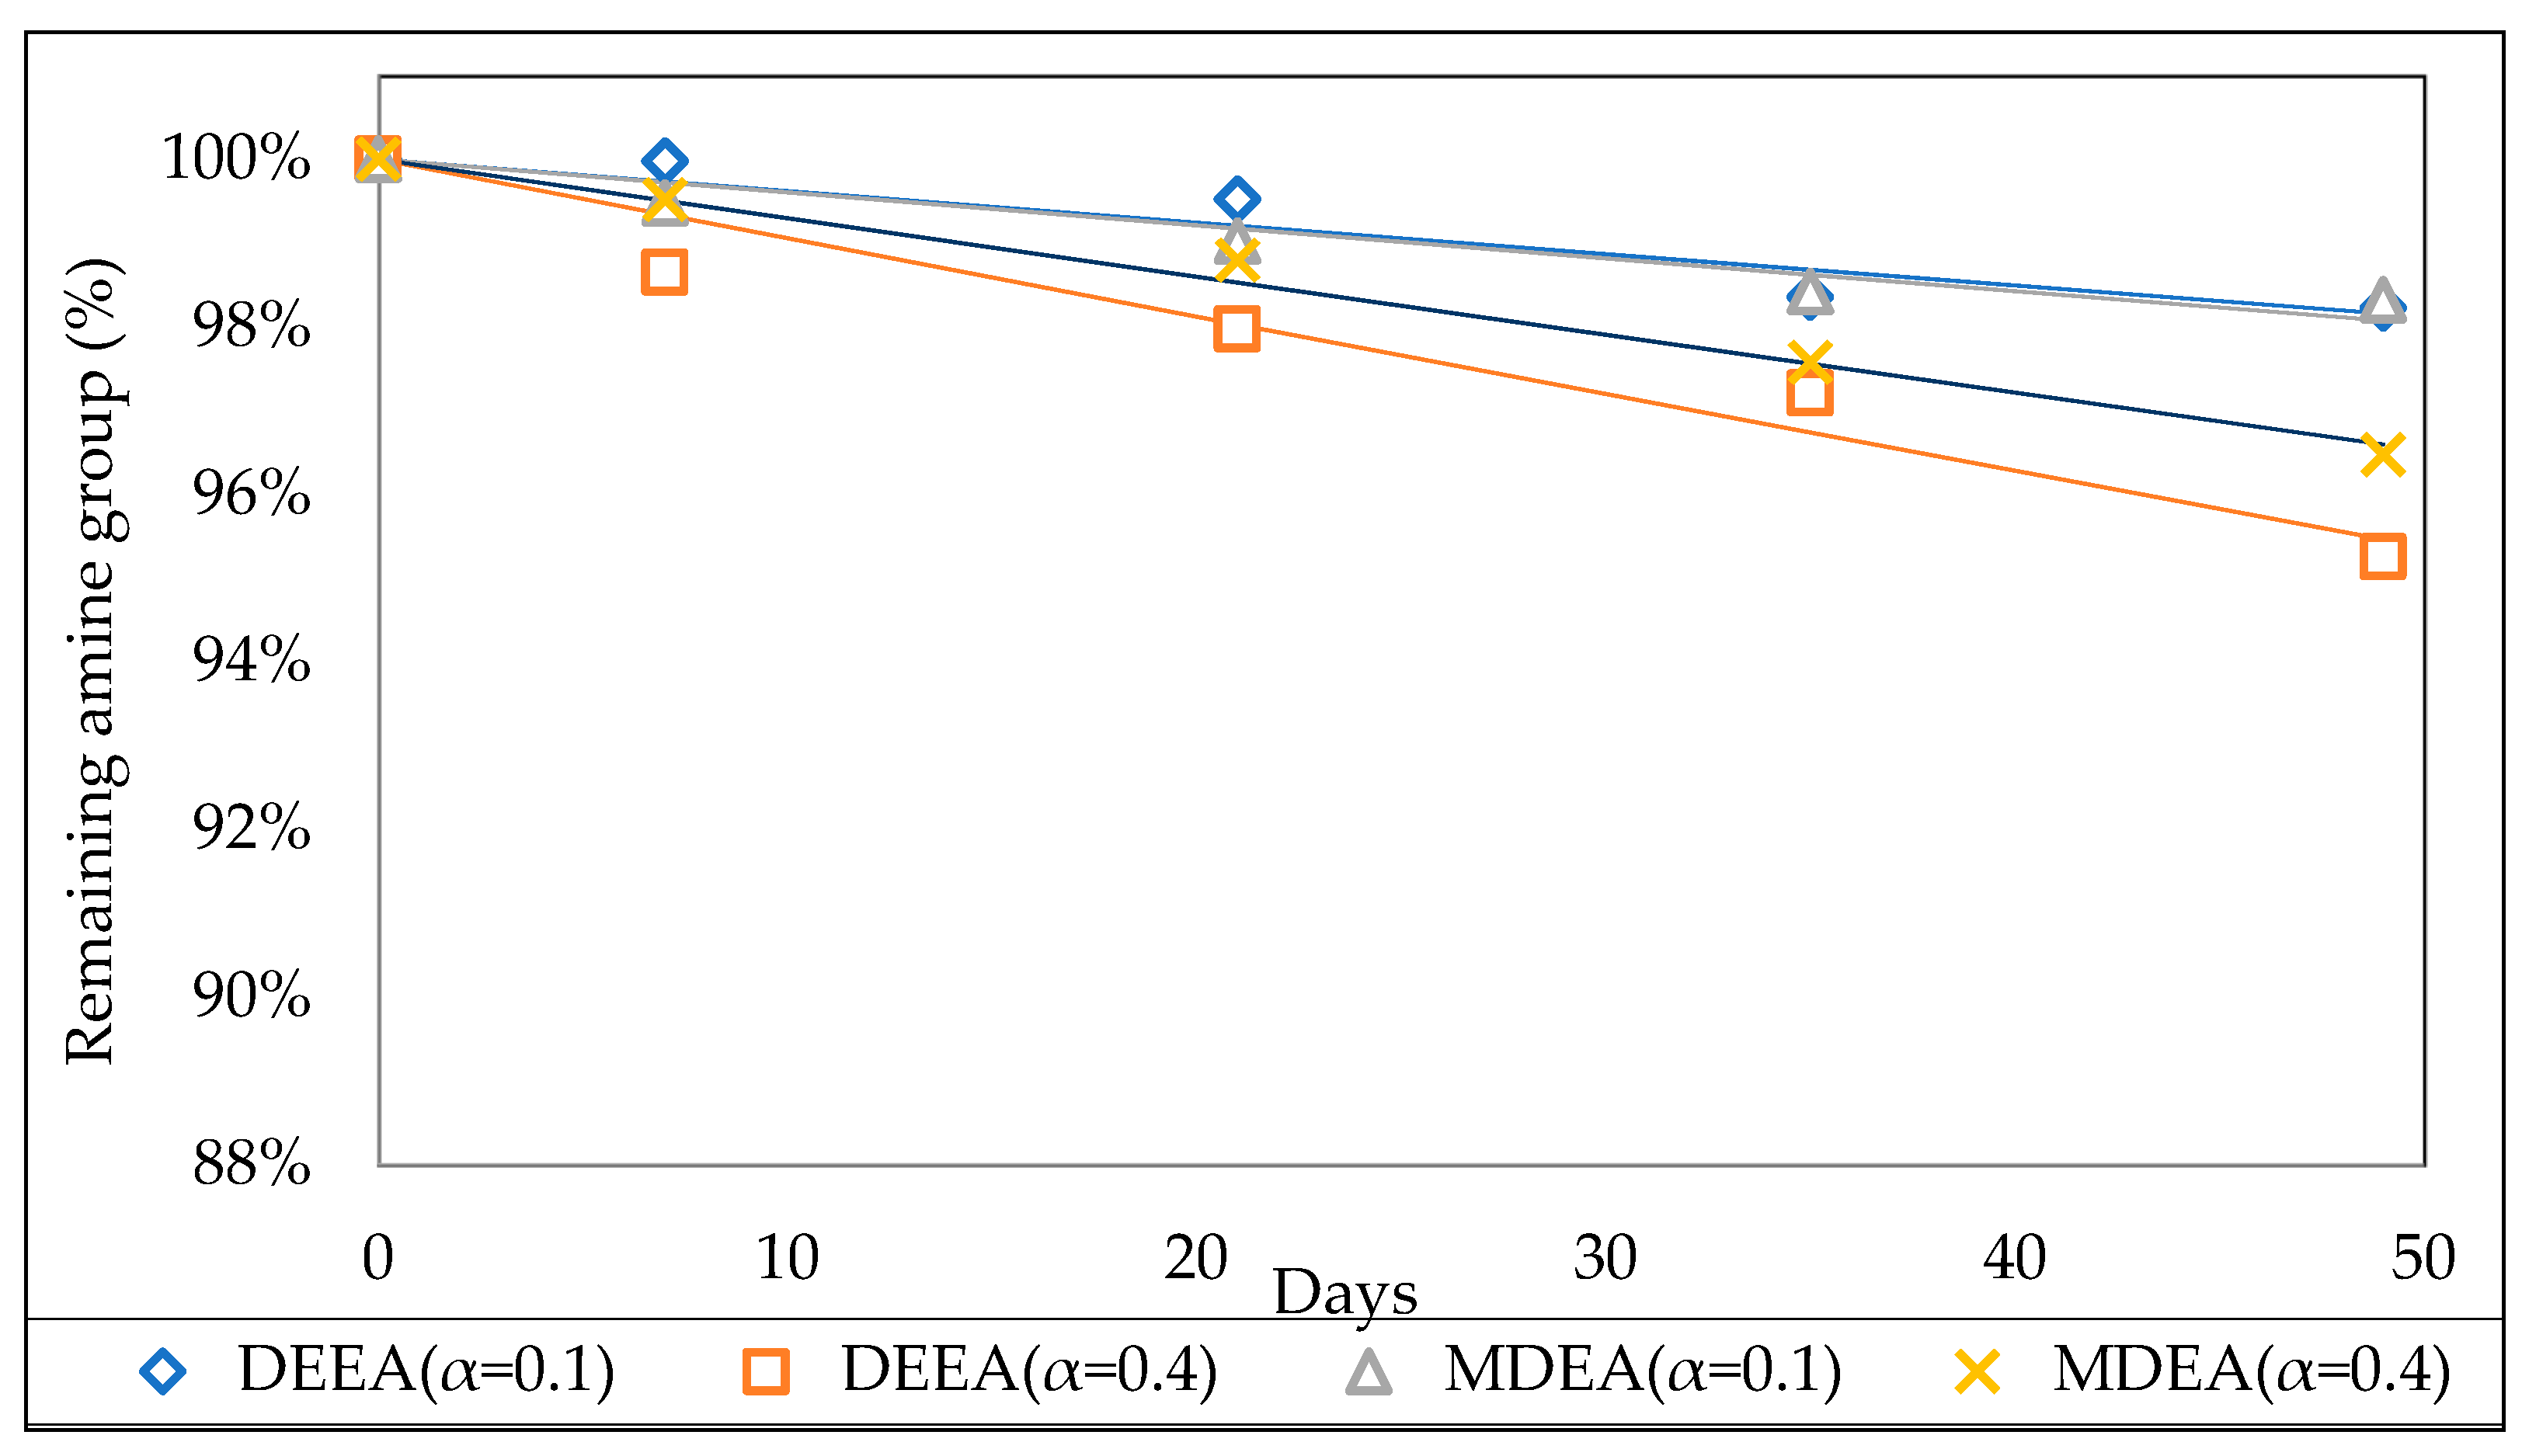
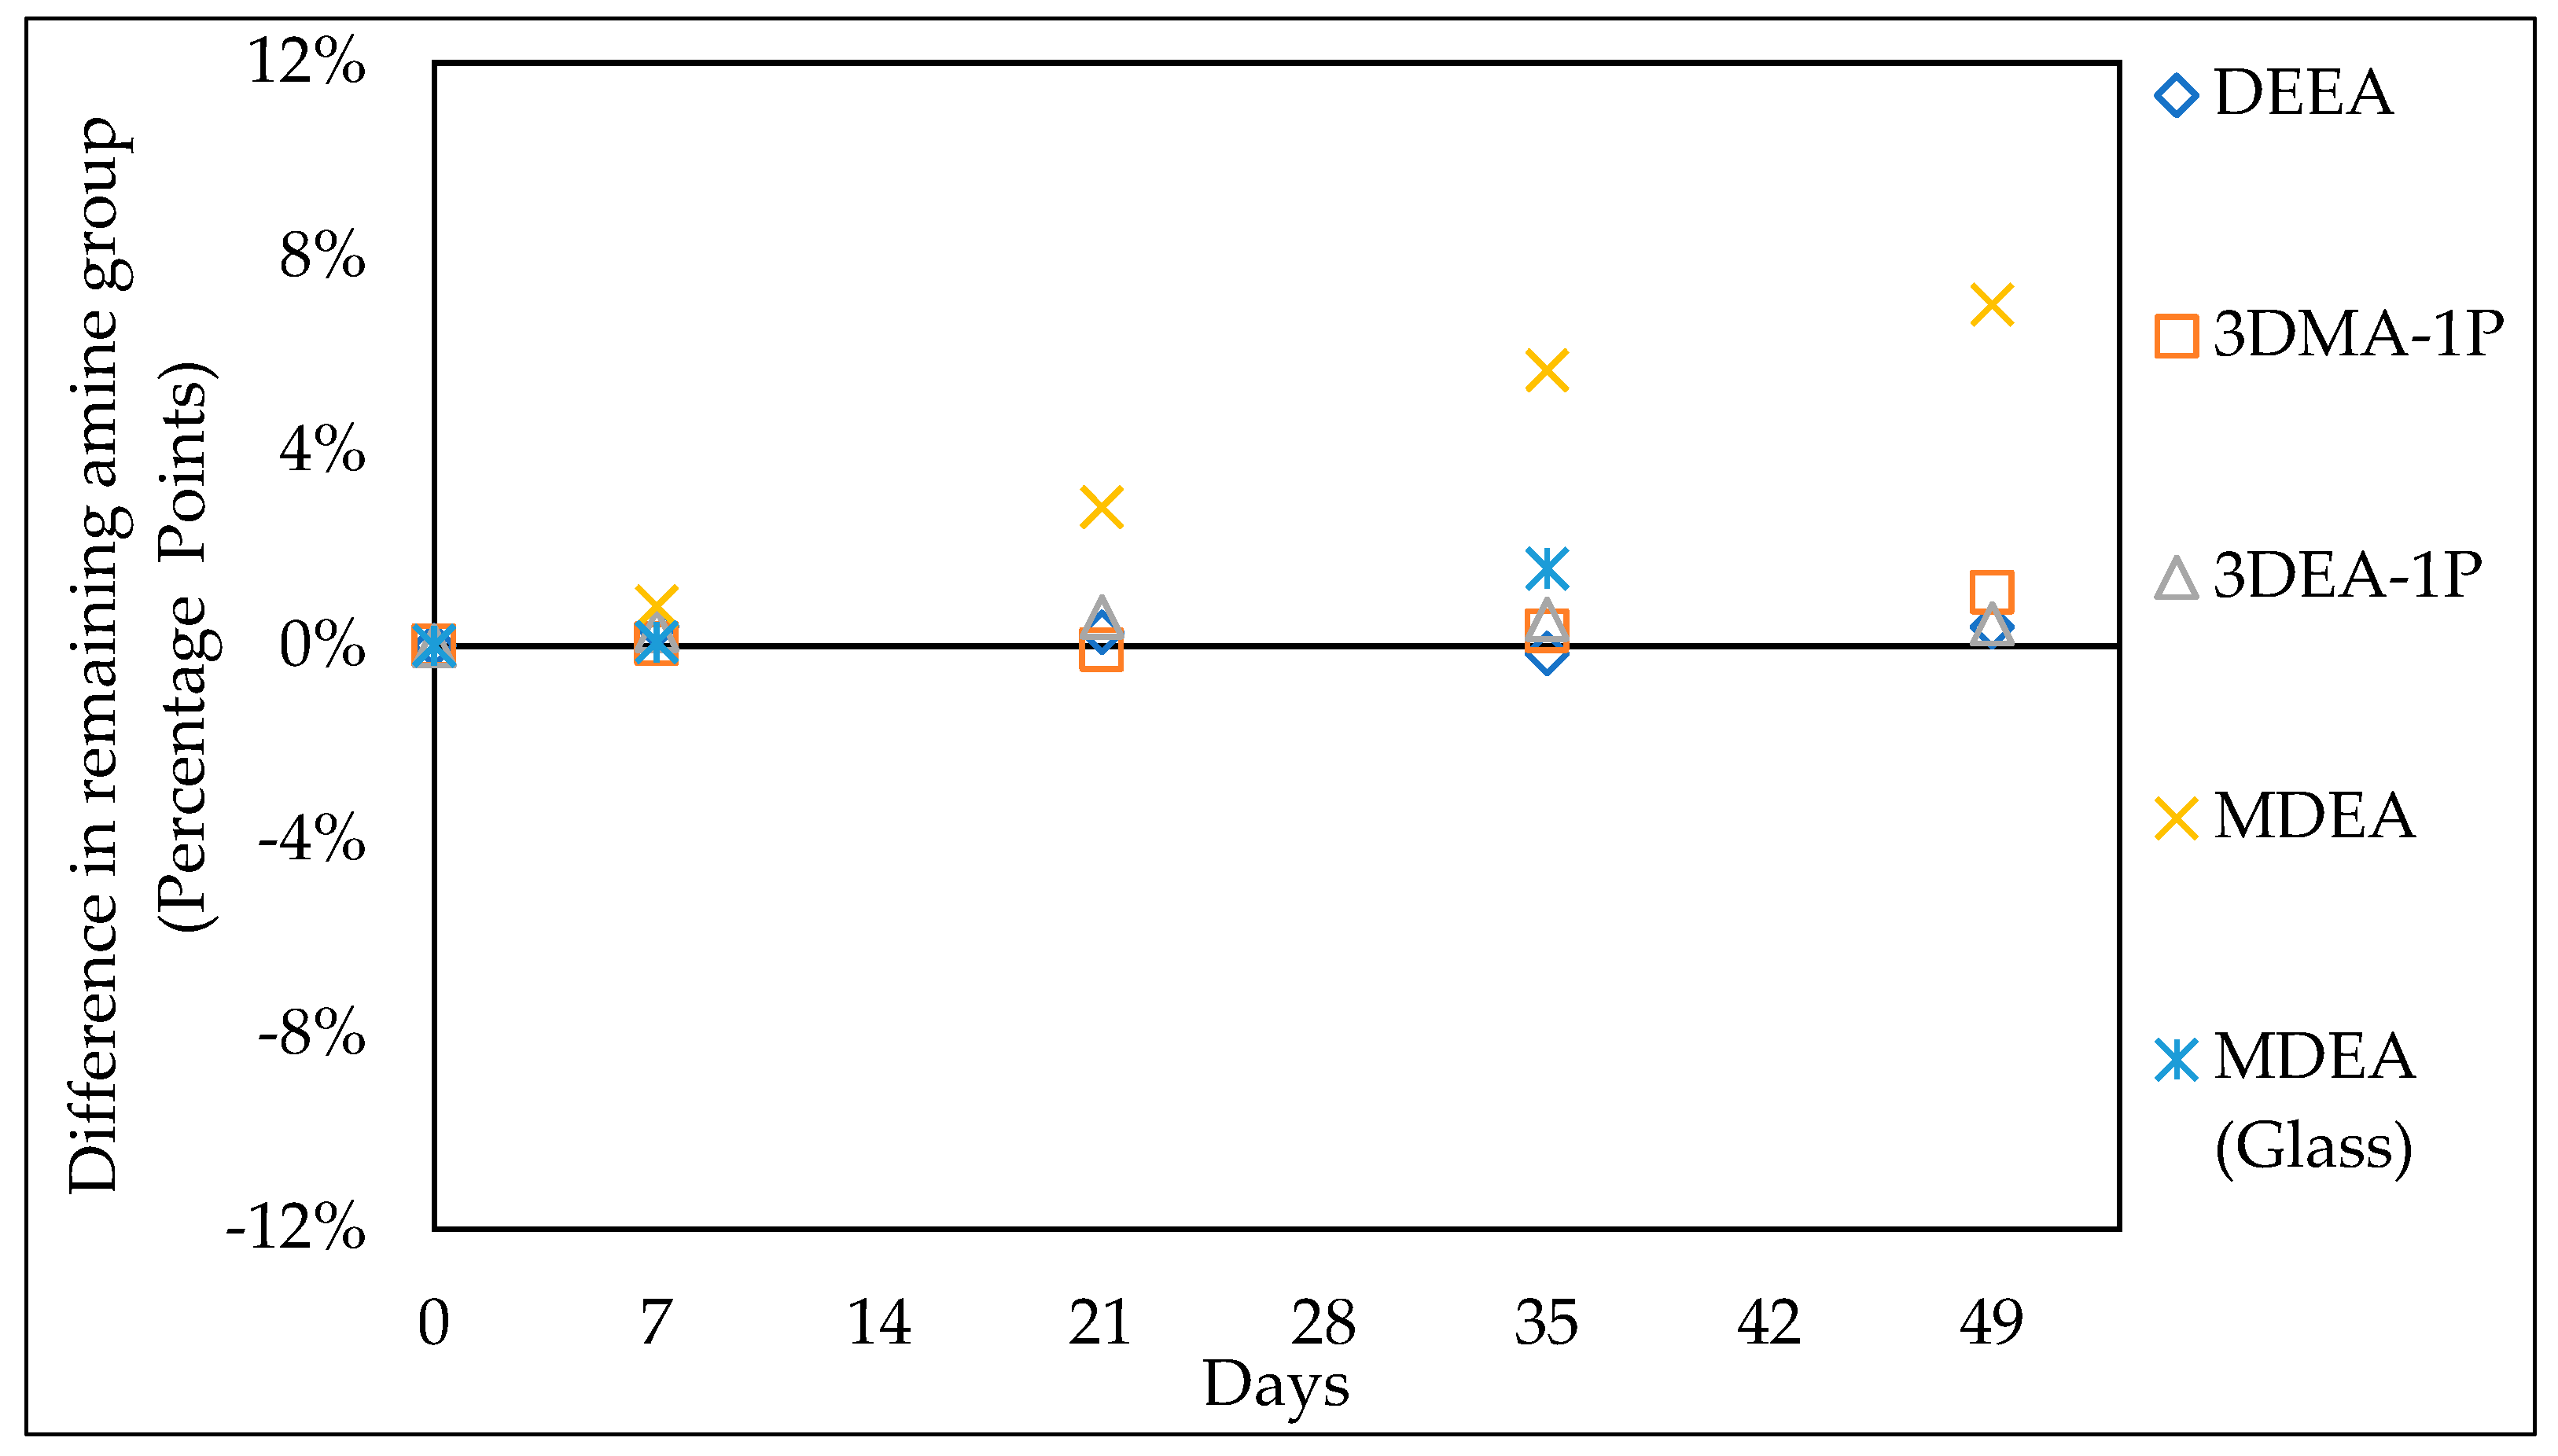
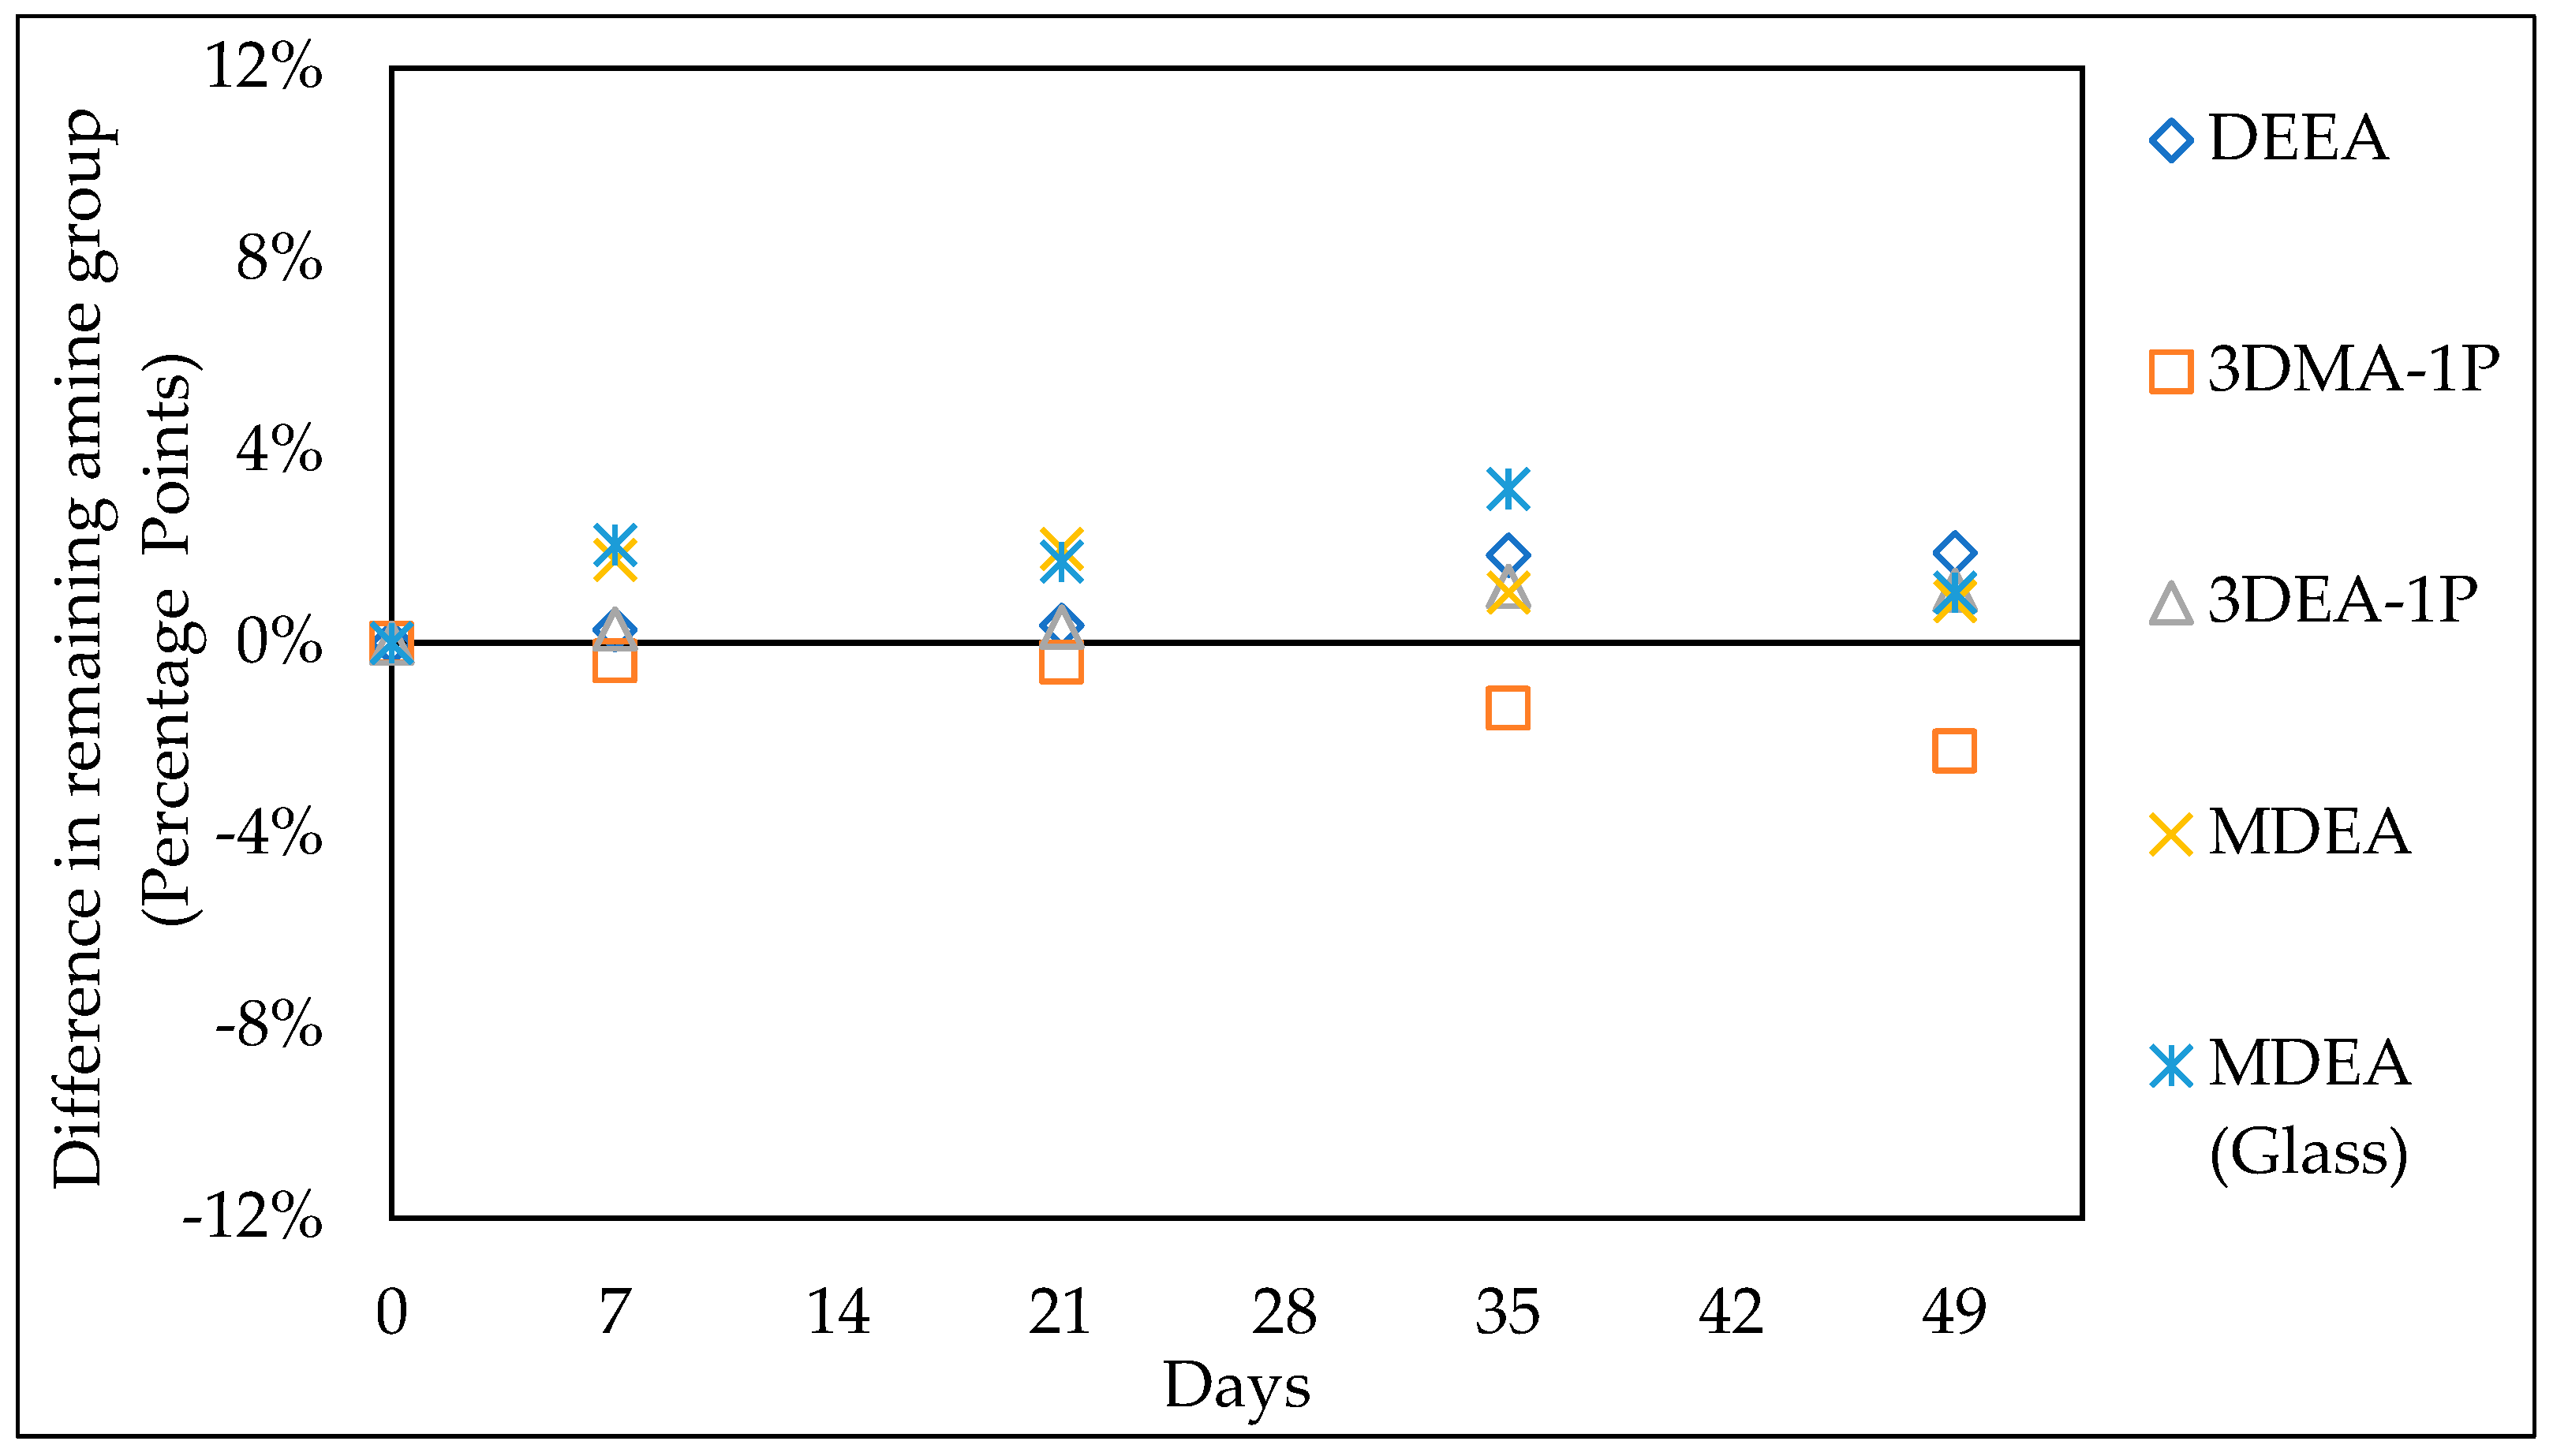
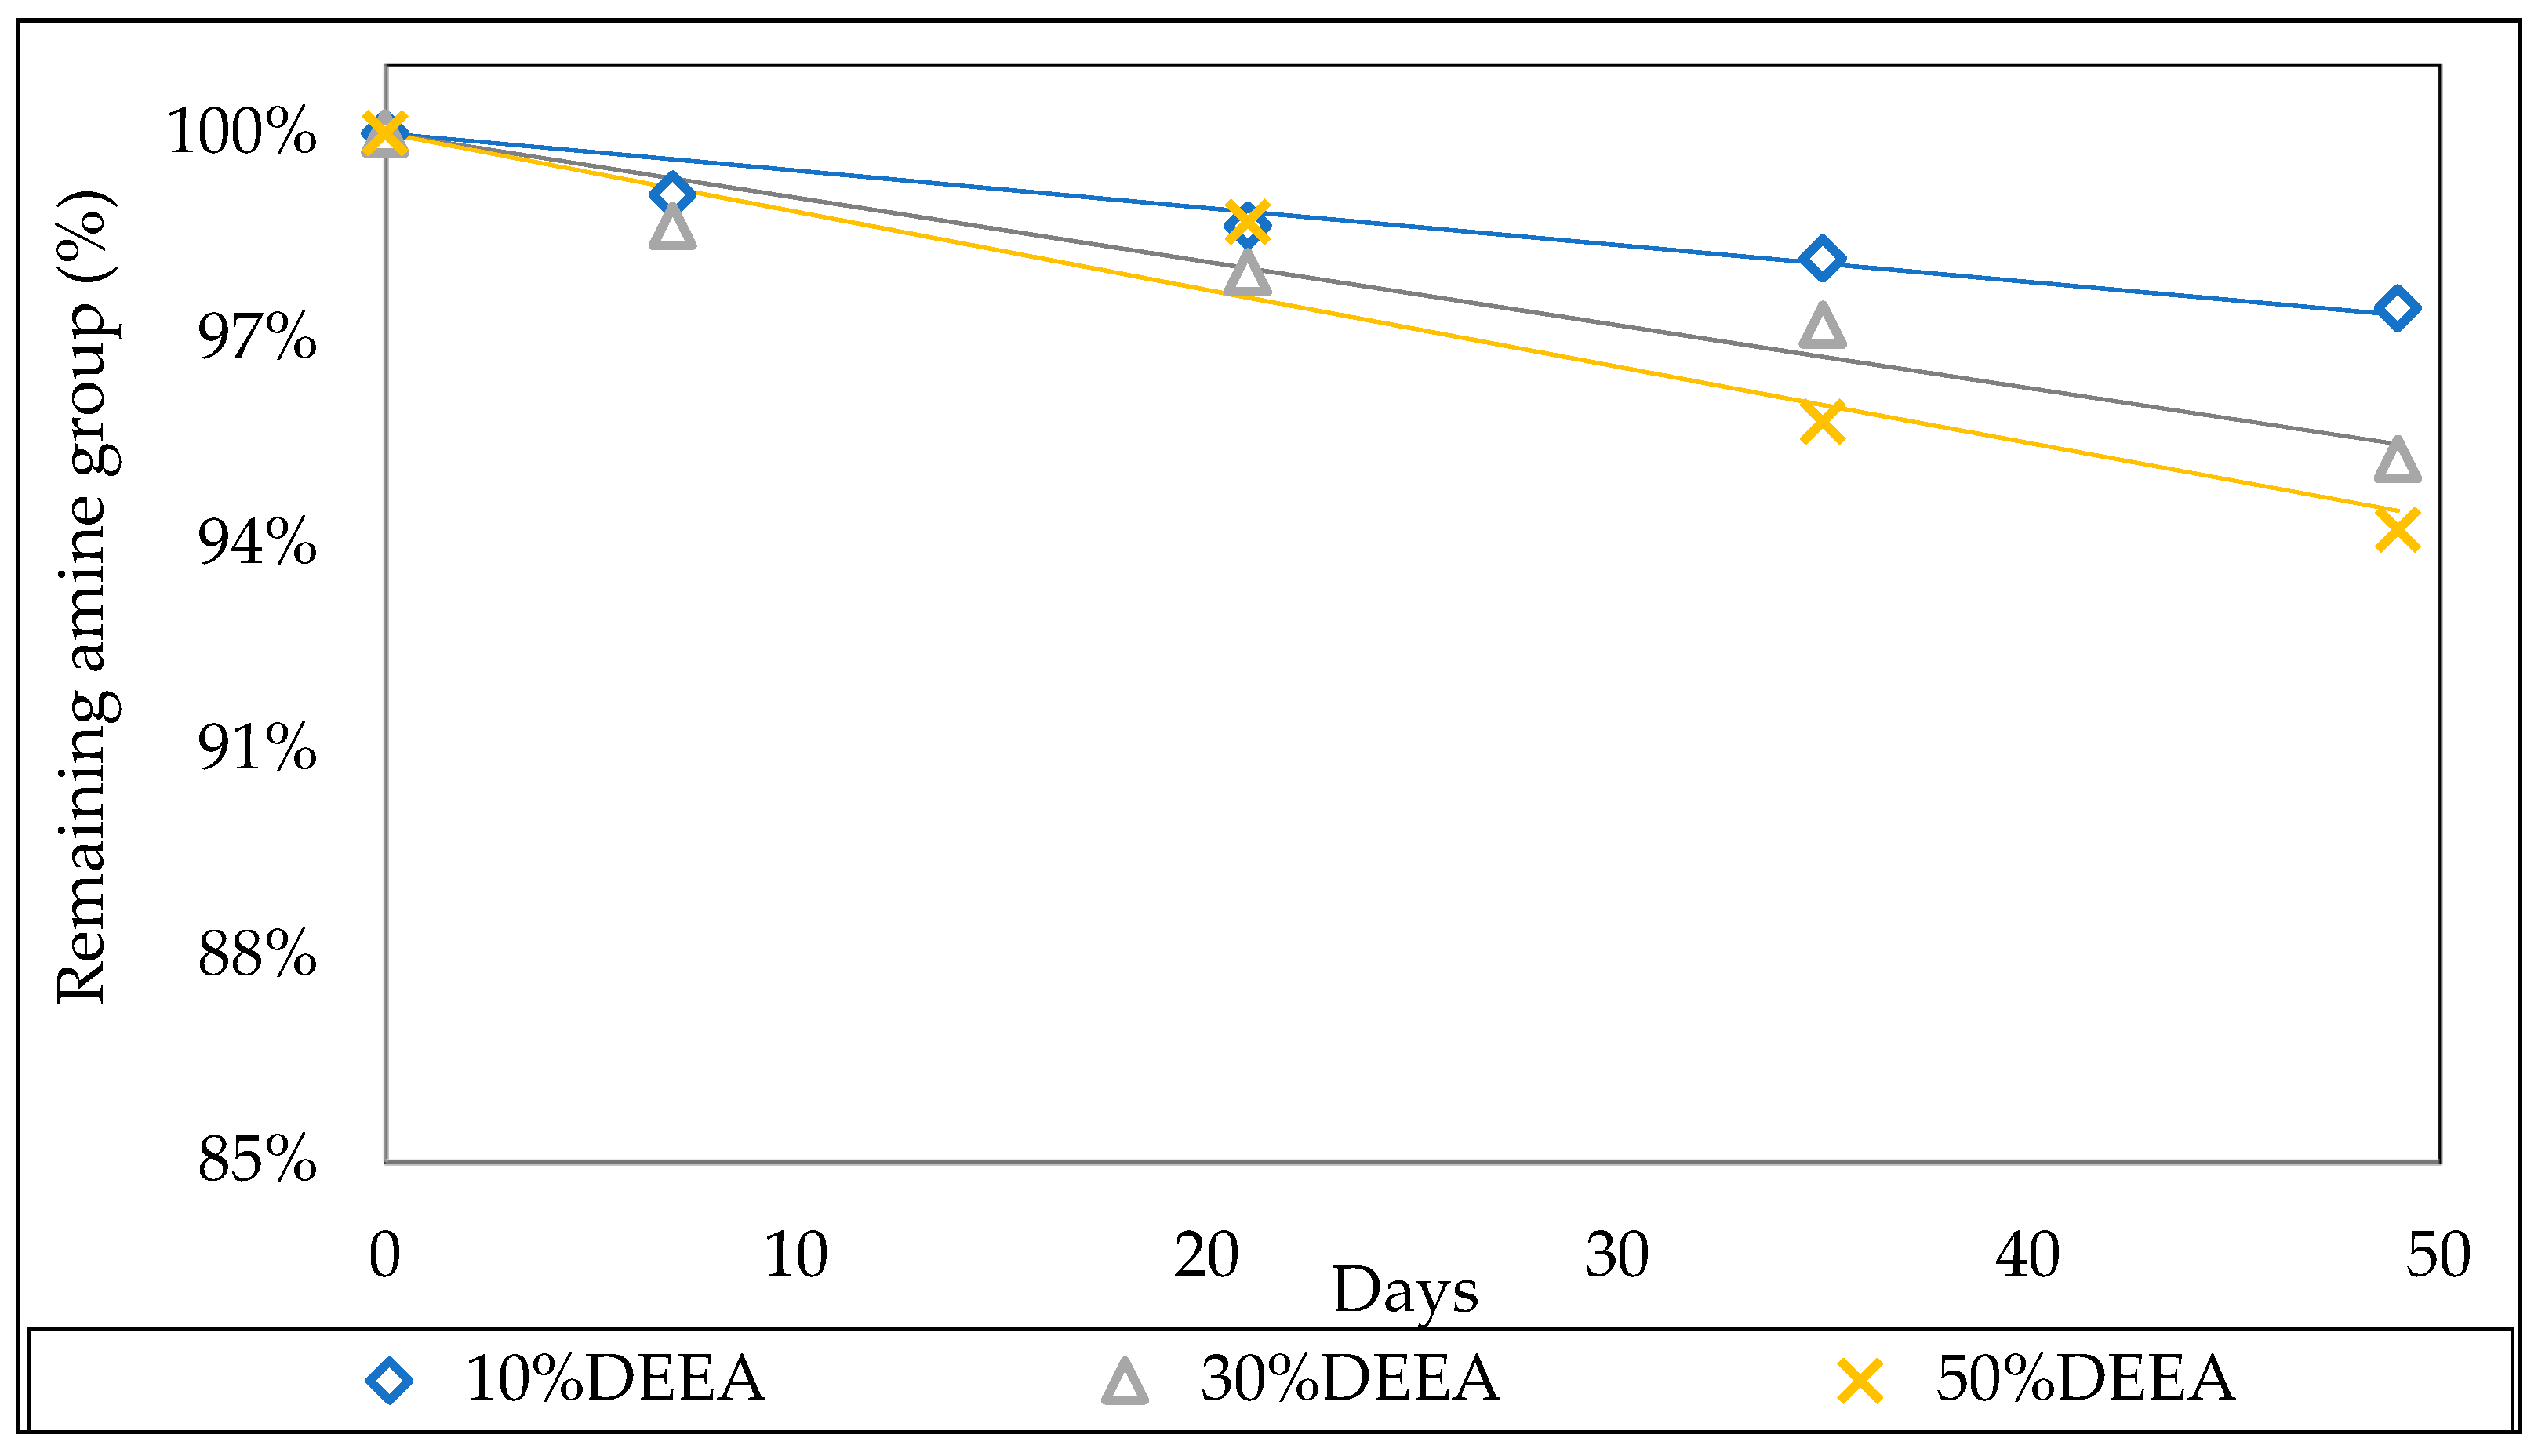
3.2. Thermal Stability

The thermal stability of amines is presented by the remaining amine group (%) (total remaining alkalinity) as a function of experimental days. The remaining experimental amine group % for each solution is shown as markers, while the solid lines are the values calculated from linear regression. All the experimental data of amine group concentrations is given in Table A1. Rate constants were computed for all solutions until 49 days, except MDEA.H2O (Glass) solutions, where the solutions leaked after week one. The week one results of 50 wt.% DEEA.H2O were also not included in linear regression. Unloaded amine wt.% and CO2 loading at the start of an experiment for all solutions, along with the experimental duration, rate constants (k), and correlation coefficients (R2) for all blends, are given in Table 2. The rate constant increased with the increase in amine concentration and CO2 loading in aqueous solutions. The change of solvent had a different effect on each amine solution rate constant. The correlation factor (R2) value was higher than 0.9 in all solutions, showing the good accuracy of the model, and is visible in the thermal stability results (Figures 4–6 & 10–12).
Figure 4 shows the thermal stability results of 30 wt.% aqueous amine solutions with CO2 loading of 0.1. After seven weeks, the maximum thermal stability was observed in 3DMA-1P. Overall, the thermal stability was quite high, as less than 2 percentage points of amine were lost during the whole set of experiments. No significant difference in thermal stability was observed when the methyl group was swapped with an ethyl group in solutions, i.e., 3DMA-1P to 3DEA-1P.
Figure 5 and Figure 6 represent the 30 wt.% amine blends in MEG and TEG with CO2 loading ≈ 0.1, respectively. In both cases, MDEA blends showed the least thermal stability compared to others. Installing a glass tube in between the metal cylinder and blend increased the thermal stability of MDEA blends. In both MEG and TEG blends of MDEA, the glass tube increased the thermal stability by 2 percentage points after seven weeks, which might be due to the absence of metal ions. An increase in the alkyl group in amine from 3DMA-1P to 3DEA-1P decreased the thermal stability in amine–MEG blends and the opposite trend was seen with amine–TEG blends. Eide-Haugmo [35] and Shoukat et al. [37] also found that an increase in the carbon number or alkyl group length reduced the thermal stability in aqueous amine solutions, and vice versa, for amine–water–glycol solutions. 3DMA-1P and DEEA showed the highest thermal stability among MEG and TEG blends, respectively, after 49 days.
Figure 7 presents the effect of a change of solvent from water to MEG on the thermal stability of amine for 30 wt.% amine blends at 0.1 CO2 loadings. MEG usage instead of water replacement decreased the thermal stability of all solutions, except 3DMA-1P. The thermal stability of MDEA was decreased by 8 percentage points, which was more than three times that of other blends. Similarly, Figure 8 shows the results for the change of solvent from water to TEG. TEG decreased the thermal stability of all blends. Again, like the effect of MEG, the maximum thermal stability decrease was observed in the MDEA.TEG blend. Figure 9 represents the results of changing the solvent from MEG to TEG. Apart from 3DMA-1P, the thermal stability was increased for all blends. The maximum increase (3 percentage points) in thermal stability was observed in the MDEA (Glass) week five blend.

3.2.1. Effect of the Initial Amine Concentration

Figure 10 and Figure 11 present the results of 10–70 wt.% MDEA.H2O solutions and 10–50 wt.% DEEA.H2O solutions, respectively, with initial CO2 loading of 0.4. An increase in the amine concentration decreased the thermal stability of amine in all solutions. The thermal stability of amine was decreased more rapidly in MDEA solutions with an increase in the amine concentration in comparison to DEEA solutions. Every increase of 20 wt.% MDEA concentration in aqueous solution doubled the amine loss in each step. The results are in good agreement with the literature. Chakma and Meisen [32] found that an increase in the initial MDEA concentration increased the amine loss rates due to the higher solubility of CO2 in the solutions achieving constant CO2 loading at higher amine concentrations. Similarly, Gao et al. [39] concluded that an increase in the initial concentration of DEEA significantly decreased the stability of amine due to the availability of a more reactive DEEA molecule for CO2 absorption.

3.2.2. Effect of Initial CO2 Loading
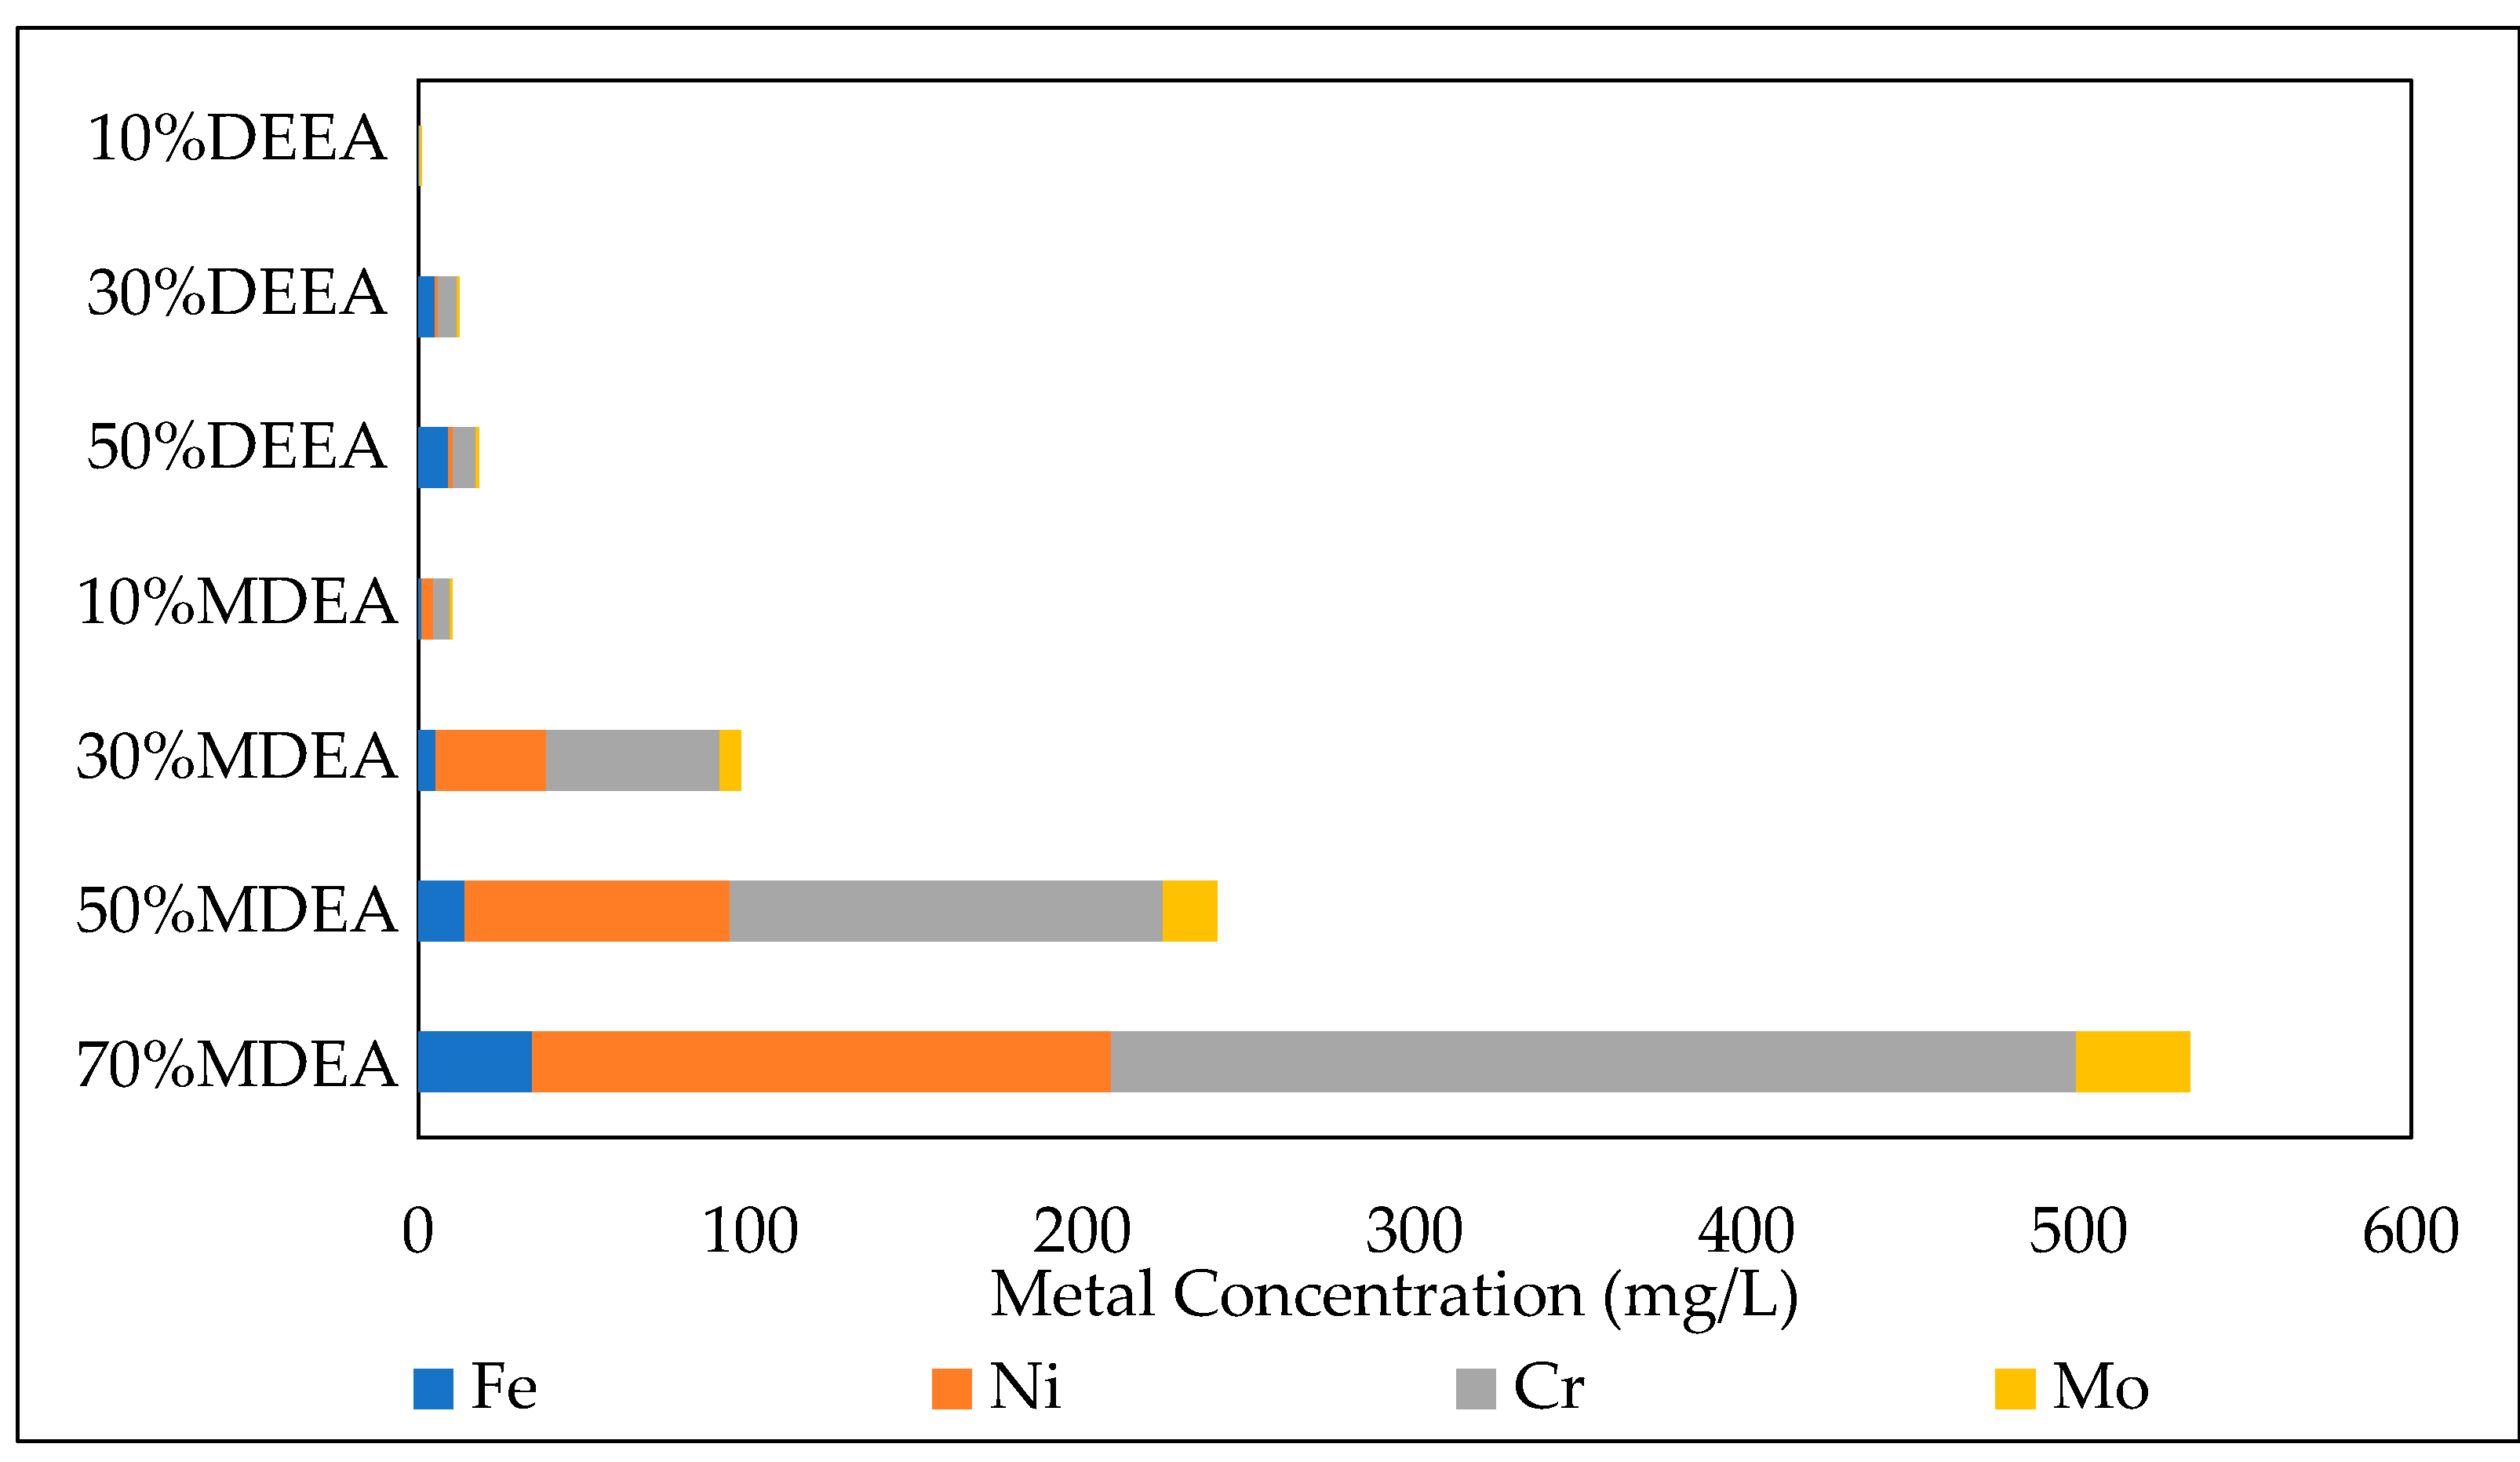
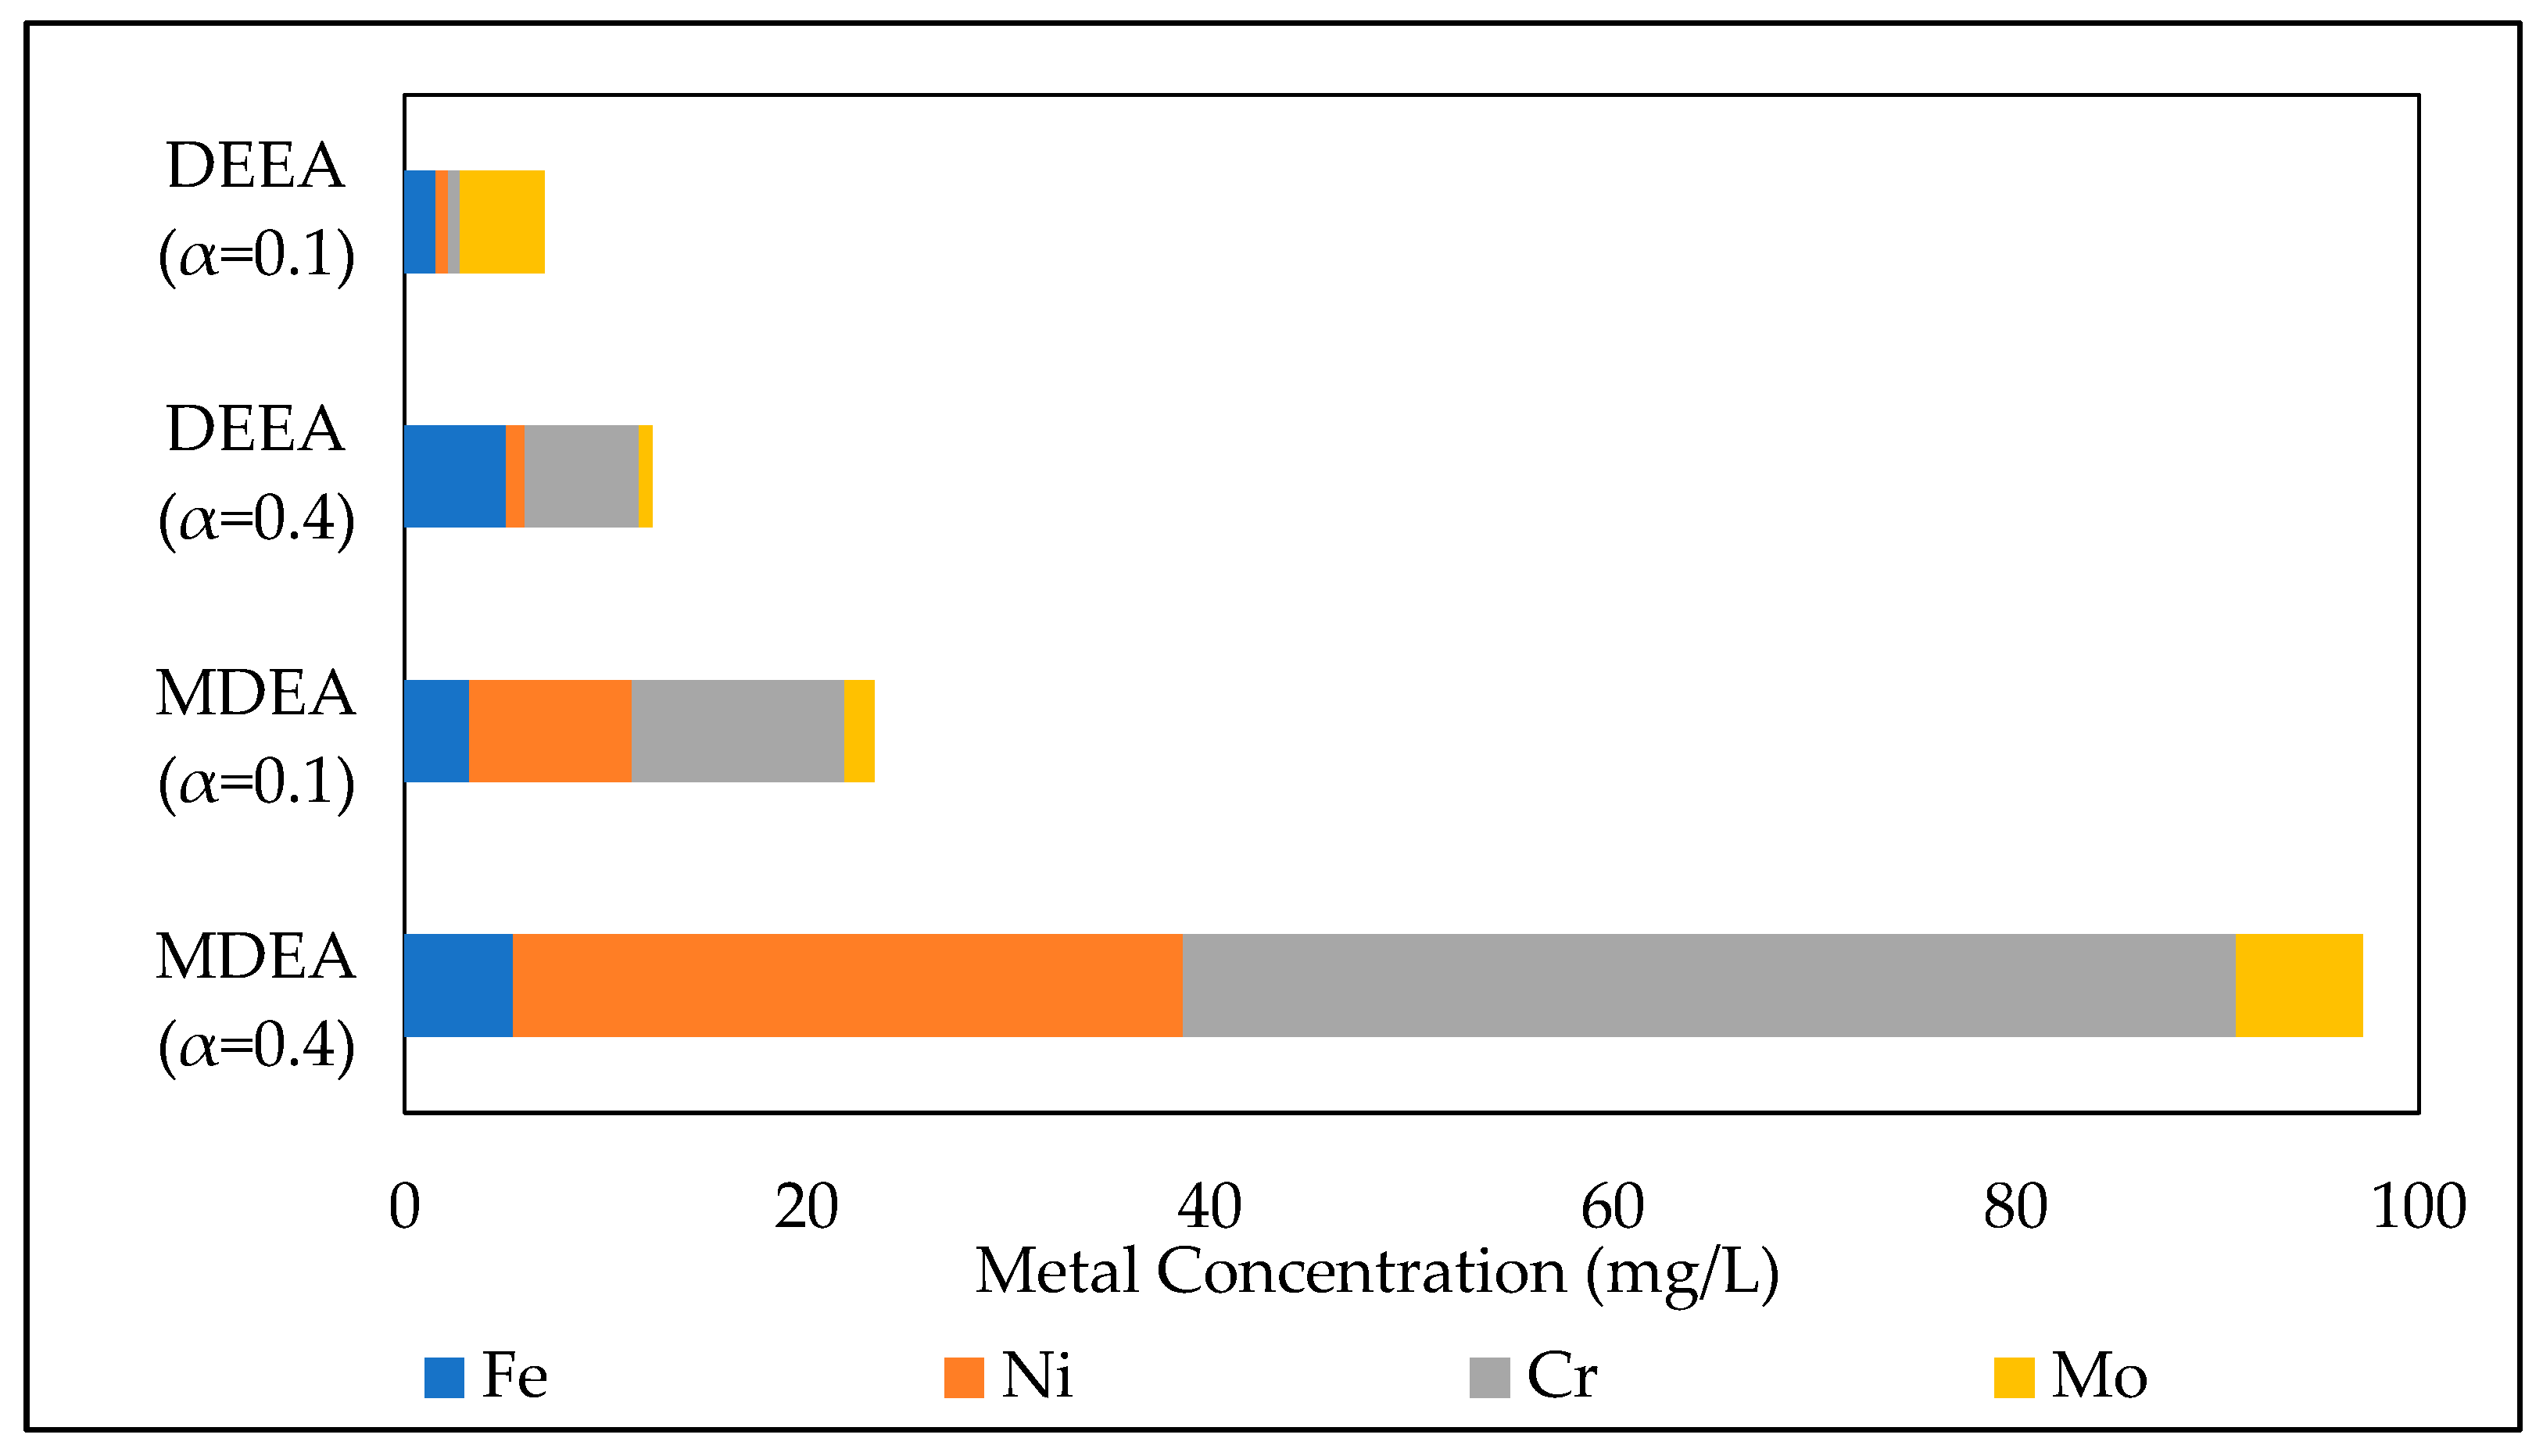
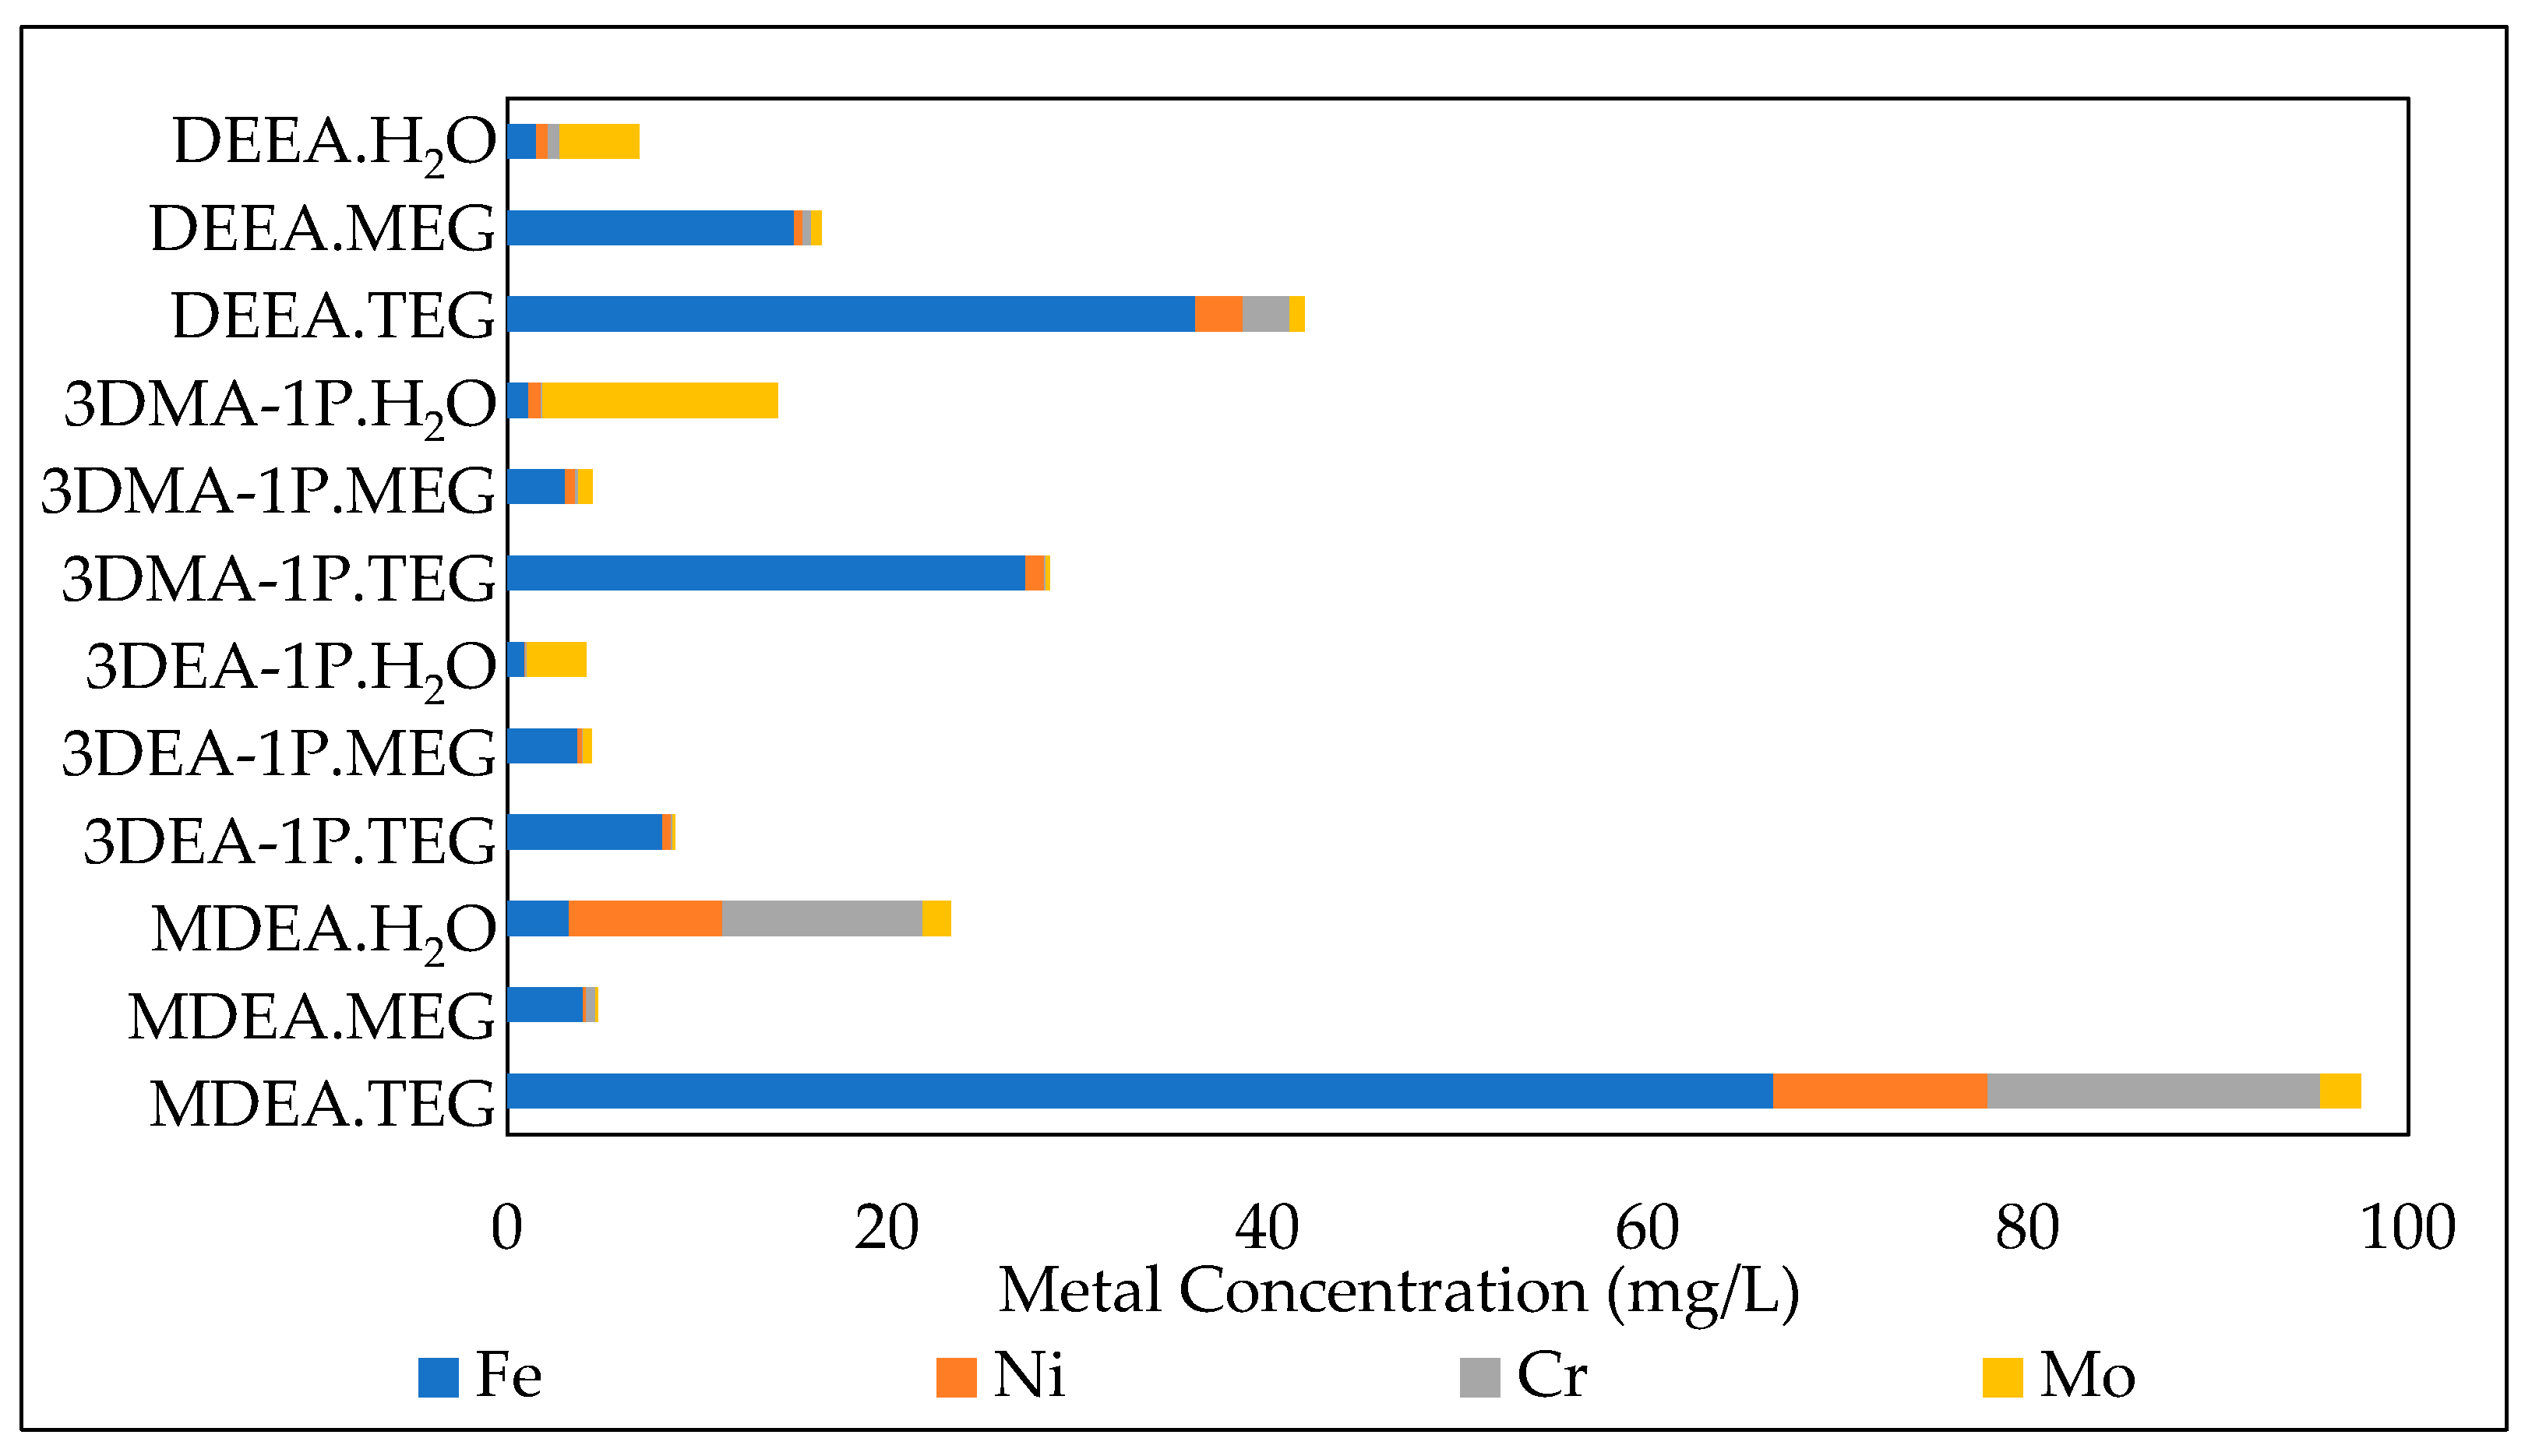
The effect of CO2 loading on the thermal stability in the initial 30 wt.% MDEA and DEEA aqueous solutions is presented in Figure 12. After 49 experimental days, the thermal stability was reduced with an increase in CO2 loading from 0.1 to 0.4 for both amines. Aqueous DEEA solution exhibited a greater reduction in the thermal stability compared to aqueous MDEA. Again, our data agree with the published literature. Chakma and Meisen [32] and Gao et al. [39] found that an increase in the CO2 concentration in solutions decreased the thermal stability of aqueous MDEA and DEEA solutions, respectively. Lepaumier et al. [33] and Eide-Haugmo [35] also concluded that the addition of CO2 reduced the thermal stability of amines.

3.3. Corrosion

Week 5 blends were analyzed for individual metal components (iron (Fe), nickel (Ni), chromium (Cr), and molybdenum (Mo)) using ICP-MS, and the results as a sum of all of these metals for 30 wt.% amine blends with initial 0.1 CO2 loadings are given in Figure 13. A higher corrosivity of a blend was indicated by a higher metal concentration. Each solution and its replica were analyzed and the average was used for result calculations. The average deviation in the replicas was ±0.1 mg/L. Various metal concentrations (mg/L) in all solutions after five weeks are given in Table A2. Iron contributed most to the total metal concentration in all amine blends in MEG and TEG. In aqueous amine solutions, Mo showed the highest contribution, except for aqueous MDEA solutions, where Cr contributed the most. In all amine blends except the DEEA blend, the total metal concentration was highest in amine–TEG blends, followed by amine–H2O blends. The lowest metal concentrations were found in amine–MEG blends. The total metal concentration in DEEA blends was in the order of DEEA.H2O < DEEA.MEG < DEEA.TEG.

3.3.1. Effect of the initial amine concentration

The results for the effects of the amine concentration on corrosivity at a constant initial CO2 loading of 0.4 are presented in Figure 14. An increase in the amine concentration increased the corrosivity, mainly due to higher amine loss. The maximum metal concentration (534 mg/L) was found with 70 wt.% MDEA aqueous solution, whereas the minimum value (1 mg/L) was found with 10 wt.% DEEA aqueous solution. The total metal concentration in aqueous MDEA increased exponentially, whereas in aqueous DEEA it increased quite linearly.

3.3.2. Effect of Initial CO2 Loading

CO2 loading affected the corrosivity caused by amine solutions. The total metal concentrations for 30 wt.% aqueous MDEA and DEEA solutions with CO2 loadings of 0.1 and 0.4 after week five are shown in Figure 15. An increase in CO2 loading increased the total metal concentration in both solutions. The aqueous MDEA solution with 0.4 CO2 loading contained the highest amount of metals compared to other solutions. Eide-Haugmo [35] also found that CO2-loaded amine solutions corroded more in comparison to their unloaded counterpart.

4. Conclusions

In this work, the thermal stability and corrosivity of four tertiary amine blends in water, MEG, and TEG, loaded with CO2, were studied in stainless steel cylinders at 135 °C for seven weeks. The effects of direct metal contact with the blend, the initial amine concentration, and the initial CO2 loading were discussed. An increase in the initial amine concentration, CO2 loading, and direct contact between the cylinder and blends decreased the thermal stability, and vice versa, for corrosivity. Amine blends with TEG displayed a higher thermal stability, except for 3DMA-1P, and higher corrosion, in comparison to MEG. 3DEA-1P blends showed a good combination of low corrosion and a higher thermal stability in comparison to other solutions.

Author Contributions

Conceptualization, H.K.K. and U.S.; methodology, U.S.; writing—original draft preparation, U.S.; writing—review and editing, H.K.K.; supervision, H.K.K. All authors have read and agreed to the published version of the manuscript.

Funding

This work was carried out under funding provided by the NTNU-SINTEF Gas Technology Centre (GTS) and the Faculty of Natural Sciences, Norwegian University of Science and Technology (NTNU), Trondheim, Norway.

Acknowledgments

We would like to thank the Department of Chemical Engineering (IKP) at the Faculty of Natural Sciences and Technology, Norwegian University of Science and Technology (NTNU), Trondheim, Norway, for their support.

Conflicts of Interest

The authors declare no conflict of interest.

Appendix A

Table A1. Amine group concentrations in all solutions.
NameCO2 Loading (α)Remaining Amine Group Concentration (mole/L) after Time (days)
07213549
DEEA.H2O0.12.50052.49992.48862.45942.4561
3DMA-1P.H2O0.12.90982.89922.89352.87552.8716
3DEA-1P.H2O0.12.19322.18712.18332.17302.1641
MDEA.H2O0.12.41782.40512.39422.37962.3772
MDEA.H2O(Glass)0.12.41782.4022-2.3812-
DEEA.MEG0.12.50442.48712.47612.42122.4130
3DMA-1P.MEG0.12.90632.90522.90382.90252.9014
3DEA-1P.MEG0.12.25192.23182.22092.19222.1869
MDEA.MEG0.12.41672.34262.27682.21622.1854
MDEA.MEG(Glass)0.12.41672.34972.31612.26392.2371
DEEA.TEG0.12.48162.47142.46282.44472.4378
3DMA-1P.TEG0.12.89952.88762.88562.85622.8295
3DEA-1P.TEG0.12.23872.22542.21532.20582.1987
MDEA.TEG0.12.42972.39732.33672.25372.2183
MDEA.TEG(Glass)0.12.42972.41212.36972.35432.2748
DEEA.H2O0.40.81410.80680.80310.79920.7933
DEEA.H2O0.42.40622.37372.35742.33902.2919
DEEA.H2O0.43.9907-3.93923.82263.7596
MDEA.H2O0.40.77790.77560.77430.76970.7658
MDEA.H2O0.42.30812.29702.28022.25222.2266
MDEA.H2O0.43.83483.80013.70763.61843.5348
MDEA.H2O0.45.34245.21314.91664.77574.5688
Table A2. Various metal concentrations (mg/L) in all solutions after five weeks.
NameUnloaded Amine Weight (%)CO2 Loading (α)Fe (mg/L)Ni (mg/L)Cr (mg/L)Mo (mg/L)
DEEA.H2O300.11.550.620.624.17
3DMA-1P.H2O300.11.130.660.0712.36
3DEA-1P.H2O300.11.150.060.113.15
MDEA.H2O300.13.248.0810.531.49
DEEA.MEG300.115.110.440.440.56
3DMA-1P.MEG300.13.060.530.140.74
3DEA-1P.MEG300.13.700.220.030.36
MDEA.MEG300.13.990.160.510.10
DEEA.TEG300.136.212.482.480.76
3DMA-1P.TEG300.127.280.980.080.22
3DEA-1P.TEG300.18.180.460.070.12
MDEA.TEG300.166.6411.2517.532.12
DEEA.H2O100.40.330.010.260.37
DEEA.H2O300.45.060.915.690.64
DEEA.H2O500.49.111.466.910.84
MDEA.H2O100.41.133.544.830.82
MDEA.H2O300.45.4233.2452.276.31
MDEA.H2O500.414.1079.80130.5016.07
MDEA.H2O700.434.48174.17290.4934.39

References

  1. Amosa, M.; Mohammed, I.; Yaro, S. Sulphide scavengers in oil and gas industry–A review. Nafta 2010, 61, 85–92. [Google Scholar]
  2. Jalili, A.H.; Shokouhi, M.; Maurer, G.; Zoghi, A.T.; Ahari, J.; Forsat, K. Measuring and modelling the absorption and volumetric properties of CO2 and H2S in the ionic liquid 1-ethyl-3-methylimidazolium tetrafluoroborate. J. Chem. Thermodyn. 2019, 131, 544–556. [Google Scholar] [CrossRef]
  3. Kohl, A.L.; Nielsen, R.B. Chapter 11—Absorption of Water Vapor by Dehydrating Solutions. In Gas Purification, 5th ed.; Kohl, A.L., Nielsen, R.B., Eds.; Gulf Professional Publishing: Houston, TX, USA, 1997; pp. 946–1021. [Google Scholar]
  4. Kohl, A.L.; Nielsen, R.B. Chapter 2—Alkanolamines for Hydrogen Sulfide and Carbon Dioxide Removal. In Gas Purification, 5th ed.; Gulf Professional Publishing: Houston, TX, USA, 1997; pp. 40–186. [Google Scholar]
  5. Netusil, M.; Ditl, P. Comparison of three methods for natural gas dehydration. J. Nat. Gas Chem. 2011, 20, 471–476. [Google Scholar] [CrossRef]
  6. Hutchinson, A.J. Process for Treating Gases. U.S. Patent US2177068 A, 1939. [Google Scholar]
  7. McCartney, E.R. Gas Purification and Dehydration Process. U.S. Patent US2435089 A, 28 June 1948. [Google Scholar]
  8. Chapin, W.F. Purification and Dehydration of Gases. U.S. Patent US2518752 A, 28 June 1950. [Google Scholar]
  9. Chowdhury, F.A.; Yamada, H.; Higashii, T.; Goto, K.; Onoda, M. CO2 capture by tertiary amine absorbents: A performance comparison study. Ind. Eng. Chem. Res. 2013, 52, 8323–8331. [Google Scholar] [CrossRef]
  10. Shoukat, U.; Fytianos, G.; Knuutila, H.K. Thermal stability and corrosion studies of amines for combined acid gas removal and hydrate control for subsea gas treatment systems. In Techno-Ocean 2016: Return to the Oceans; IEEE: Kobe, Japan, 2016; pp. 176–180. [Google Scholar]
  11. Barth, D.; Tondre, C.; Delpuech, J.J. Kinetics and mechanisms of the reactions of carbon dioxide with alkanolamines: A discussion concerning the cases of MDEA and DEA. Chem. Eng. Sci. 1984, 39, 1753–1757. [Google Scholar] [CrossRef]
  12. Vaidya, P.D.; Kenig, E.Y. CO2-Alkanolamine Reaction Kinetics: A Review of Recent Studies. Chem. Eng. Technol. 2007, 30, 1467–1474. [Google Scholar] [CrossRef]
  13. Chi, S.; Rochelle, G.T. Oxidative degradation of monoethanolamine. Ind. Eng. Chem. Res. 2002, 41, 4178–4186. [Google Scholar] [CrossRef]
  14. Vevelstad, S.J.; Grimstvedt, A.; Elnan, J.; da Silva, E.F.; Svendsen, H.F. Oxidative degradation of 2-ethanolamine: The effect of oxygen concentration and temperature on product formation. Int. J. Greenh. Gas Control 2013, 18 (Suppl. SC), 88–100. [Google Scholar] [CrossRef] [Green Version]
  15. Islam, M.S.; Yusoff, R.; Si Ali, B.; Islam, M.N.; Chakrabarti, M.H. Degradation studies of amines and alkanolamines during sour gas treatment process. Int. J. Phys. Sci. 2011, 6, 5883–5896. [Google Scholar]
  16. Gouedard, C.; Picq, D.; Launay, F.; Carrette, P.L. Amine degradation in CO2 capture. I. A review. Int. J. Greenh. Gas Control 2012, 10, 244–270. [Google Scholar] [CrossRef]
  17. Da Silva, E.F.; Lepaumier, H.; Grimstvedt, A.; Vevelstad, S.J.; Einbu, A.; Vernstad, K.; Svendsen, H.F.; Zahlsen, K. Understanding 2-ethanolamine degradation in postcombustion CO2 capture. Ind. Eng. Chem. Res. 2012, 51, 13329–13338. [Google Scholar] [CrossRef]
  18. Zhou, S.; Wang, S.; Chen, C. Thermal degradation of monoethanolamine in CO2 capture with acidic impurities in flue gas. Ind. Eng. Chem. Res. 2012, 51, 2539–2547. [Google Scholar] [CrossRef]
  19. Zoannou, K.S.; Sapsford, D.J.; Griffiths, A.J. Thermal degradation of monoethanolamine and its effect on CO2 capture capacity. Int. J. Greenh. Gas Control 2013, 17, 423–430. [Google Scholar] [CrossRef]
  20. Rao, A.B.; Rubin, E.S. A technical, economic, and environmental assessment of amine-based CO2 capture technology for power plant greenhouse gas control. Environ. Sci. Technol. 2002, 36, 4467–4475. [Google Scholar] [CrossRef] [Green Version]
  21. Freeman, S.A.; Davis, J.; Rochelle, G.T. Degradation of aqueous piperazine in carbon dioxide capture. Int. J. Greenh. Gas Control 2010, 4, 756–761. [Google Scholar] [CrossRef]
  22. Davoudi, M.; Safadoust, A.R.; Akbar Mansoori, S.A.; Mottaghi, H.R. The impurities effect on thermal degradation and corrosivity of amine solution in South Pars gas sweetening plants. J. Nat. Gas Sci. Eng. 2014, 19, 116–124. [Google Scholar] [CrossRef]
  23. Sandengen, K.; Kaasa, B.; Østvold, T. pH Measurements in Monoethylene Glycol (MEG) + Water Solutions. Ind. Eng. Chem. Res. 2007, 46, 4734. [Google Scholar] [CrossRef]
  24. Davoudi, M.; Heidari, Y.; Safadoost, A.; Samieirad, S. Chemical injection policy for internal corrosion prevention of South Pars sea-pipeline: A case study. J. Nat. Gas Sci. Eng. 2014, 21, 592. [Google Scholar] [CrossRef]
  25. AlHarooni, K.; Pack, D.; Iglauer, S.; Gubner, R.; Ghodkay, V.; Barifcani, A. Analytical Techniques for Analyzing Thermally Degraded Monoethylene Glycol with Methyl Diethanolamine and Film Formation Corrosion Inhibitor. Energy Fuels 2016, 30, 10937–10949. [Google Scholar] [CrossRef]
  26. Khorrami, M.R.; Raeissi, K.; Shahban, H.; Torkan, M.A.; Saatchi, A. Corrosion behavior of carbon steel in carbon dioxide-loaded activated methyl diethanol amine solution. Corrosion 2008, 64, 124–130. [Google Scholar] [CrossRef]
  27. Zheng, L.; Landon, J.; Matin, N.S.; Thomas, G.A.; Liu, K. Corrosion mitigation via a pH stabilization method in monoethanolamine-based solutions for post-combustion CO2 capture. Corros. Sci. 2016, 106, 281. [Google Scholar] [CrossRef] [Green Version]
  28. Fytianos, G.; Ucar, S.; Grimstvedt, A.; Hyldbakk, A.; Svendsen, H.F.; Knuutila, H.K. Corrosion and degradation in MEA based post-combustion CO2 capture. Int. J. Greenh. Gas Control 2016, 46, 48–56. [Google Scholar] [CrossRef]
  29. Xiang, Y.; Yan, M.; Choi, Y.-S.; Young, D.; Nesic, S. Time-dependent electrochemical behavior of carbon steel in MEA-based CO2 capture process. Int. J. Greenh. Gas Control 2014, 30 (Suppl. SC), 125–132. [Google Scholar]
  30. Nordsveen, M.; Nešić, S.; Nyborg, R.; Stangeland, A. A Mechanistic Model for Carbon Dioxide Corrosion of Mild Steel in the Presence of Protective Iron Carbonate Films—Part 1: Theory and Verification. Corrosion 2003, 59, 443–456. [Google Scholar] [CrossRef] [Green Version]
  31. AlHarooni, K.; Pack, D.; Iglauer, S.; Gubner, R.; Ghodkay, V.; Barifcani, A. Effects of Thermally Degraded Monoethylene Glycol with Methyl Diethanolamine and Film-Forming Corrosion Inhibitor on Gas Hydrate Kinetics. Energy Fuels 2017, 31, 6397–6412. [Google Scholar] [CrossRef]
  32. Chakma, A.; Meisen, A. Methyl-Diethanolamine Degradation - Mechanism and Kinetics. Can. J. Chem. Eng. 1997, 75, 861–871. [Google Scholar] [CrossRef]
  33. Lepaumier, H.; Picq, D.; Carrette, P.L. New amines for CO2 Capture. I. mechanisms of amine degradation in the presence of CO2. Ind. Eng. Chem. Res. 2009, 48, 9061–9067. [Google Scholar] [CrossRef]
  34. Closmann, F.; Rochelle, G.T. Degradation of aqueous methyldiethanolamine by temperature and oxygen Cycling. Energy Procedia 2011, 4, 23–28. [Google Scholar] [CrossRef] [Green Version]
  35. Eide-Haugmo, I. Environmental Impacts and Aspects of Absorbents used for CO2 Capture. Ph.D. Thesis, Norwegian Univeristy of Science and Technology, Trondheim, Norway, 2011. [Google Scholar]
  36. Handojo, L.; Yudiyanto, M.D.; Susanti, R.F.; Yaswari, Y.; Raksajati, A.; Indarto, A. Non-oxidative thermal degradation of amines: GCMS/FTIR spectra analysis and molecular modeling. Sep. Sci. Technol. 2018, 53, 2259–2266. [Google Scholar] [CrossRef]
  37. Shoukat, U.; Baumeister, E.; Pinto, D.D.; Knuutila, H.K. Thermal stability and corrosion of tertiary amines in aqueous amine and amine-glycol-water solutions for combined acid gas and water removal. J. Nat. Gas Sci. Eng. 2019, 62, 26–37. [Google Scholar] [CrossRef]
  38. Shoukat, U.; Baumeister, E.; Knuutila, H.K. ATR-FTIR Model Development and Verification for Qualitative and Quantitative Analysis in MDEA–H2O–MEG/TEG–CO2 Blends. Energies 2019, 12, 3285. [Google Scholar] [CrossRef] [Green Version]
  39. Gao, H.; Liang, Z.; Liao, H.; Idem, R.O. Thermal degradation of aqueous DEEA solution at stripper conditions for post-combustion CO2 capture. Chem. Eng. Sci. 2015, 135, 330–342. [Google Scholar] [CrossRef]
  40. Rossiter, W.J.; Brown, P.W.; Godette, M. The determination of acidic degradation products in aqueous ethylene glycol and propylene glycol solutions using ion chromatography. Sol. Energy Mater. 1983, 9, 267–279. [Google Scholar] [CrossRef]
  41. Campbell, J.M. Gas Conditioning and Processing; Campbell Petroleum Series: Norman, OK, USA, 1982. [Google Scholar]
  42. Grimstvedt, A.; da Silva, E.F.; Hoff, K.A. Thermal degradation of MEA, effect of temperature and CO2 loading. TCCS7 SINTEF Mater. Chem. 2013, 7465. [Google Scholar]
  43. Shoukat, U.; Pinto, D.D.D.; Knuutila, H.K. Study of Various Aqueous and Non-Aqueous Amine Blends for Hydrogen Sulfide Removal from Natural Gas. Processes 2019, 7, 160. [Google Scholar] [CrossRef] [Green Version]
  44. Ma’mun, S.; Svendsen, H.F.; Hoff, K.A.; Juliussen, O. Selection of new absorbents for carbon dioxide capture. Energy Convers. Manag. 2007, 48, 251–258. [Google Scholar] [CrossRef]
  45. Monteiro, J.G.M.S.; Pinto, D.D.D.; Zaidy, S.A.H.; Hartono, A.; Svendsen, H.F. VLE data and modelling of aqueous N,N-diethylethanolamine (DEEA) solutions. Int. J. Greenh. Gas Control 2013, 19, 432–440. [Google Scholar] [CrossRef] [Green Version]
  46. Vevelstad, S.J.; Johansen, M.T.; Knuutila, H.; Svendsen, H.F. Oxygen and Temperature Effect on Formation of Degradation Compounds from MEA. Energy Procedia 2014, 63, 957–975. [Google Scholar] [CrossRef] [Green Version]
Figure 1. Chemical structures of all chemicals used in this study.
Energies 13 02626 g001
Figure 2. Comparison with the literature in terms of the remaining amine group concentration in 30 wt.% amine–H2O solutions (Eide-Haugmo 2011 [35], Gao et al. 2015 [39], Shoukat et al. 2016 [10]).
Energies 13 02626 g002
Figure 3. Total metal concentrations in 30 wt.% amine blends (Eide-Haugmo 2011 [35], Shoukat et al. 2016 [10]).
Energies 13 02626 g003
Figure 4. Remaining amine group concentration in aqueous amine solutions, with solid lines representing the model results; unloaded amine wt.% = 30; CO2 loading ≈ 0.1.
Energies 13 02626 g004
Figure 5. Remaining amine group concentration in amine monoethylene glycol (MEG) blends, with solid lines representing the model results; unloaded amine wt.% = 30; CO2 loading ≈ 0.1.
Energies 13 02626 g005
Figure 6. Remaining amine group concentration in amine triethylene glycol (TEG) blends, with solid lines representing the model results; unloaded amine wt.% = 30; CO2 loading ≈ 0.1.
Energies 13 02626 g006
Figure 7. Difference between the remaining amine group (percentage points) of aqueous amine solutions vs. the amine–MEG blend; unloaded amine wt.% = 30; CO2 loading ≈ 0.1.
Energies 13 02626 g007
Figure 8. Difference between the remaining amine group (percentage points) of aqueous amine solution vs. the amine–TEG blends; unloaded amine wt.% = 30; CO2 loading ≈ 0.1.
Energies 13 02626 g008
Figure 9. Difference between the remaining amine group (percentage points) of amine–MEG blends vs. amine–TEG blends; unloaded amine wt.% = 30; CO2 loading ≈ 0.1.
Energies 13 02626 g009
Figure 10. Remaining amine group (%) in various aqueous N-methyl diethanolamine (MDEA) solutions, with solid lines representing the model results at CO2 loading ≈ 0.4.
Energies 13 02626 g010
Figure 11. Remaining amine group (%) in various aqueous 2-(diethylamino) ethanol (DEEA) solutions, with solid lines representing the model results at CO2 loading ≈ 0.4.
Energies 13 02626 g011
Figure 12. Remaining amine group (%) in various aqueous amine solutions, with solid lines representing the model results; unloaded amine wt.% = 30.
Energies 13 02626 g012
Figure 13. Metal concentrations of amine solutions after five weeks; unloaded amine wt.% = 30; CO2 loading ≈ 0.1.
Energies 13 02626 g013
Figure 14. Metal concentrations of various aqueous MDEA and DEEA solutions after five weeks at CO2 loading ≈ 0.4.
Energies 13 02626 g014
Figure 15. Metal concentrations of 30 wt.% aqueous MDEA and DEEA solutions after week five at various CO2 loadings.
Energies 13 02626 g015
Table 1. Full name, CAS, and purity of all chemicals.
ChemicalCASPurityMolecular Weight (g/mol)
N-Methyldiethanolamine (MDEA)105-59-9≥99.0%119.16
2-(Diethylamino)ethanol (DEEA)100-37-8≥99.5%117.19
3-Dimethylamino-1-propanol (3DMA-1P)3179-63-3≥99.0%103.16
3-Diethylamino-1-propanol (3DEA-1P)622-93-5≥95.0%131.22
Monoethylene glycol (MEG)107-21-1≥99.5%62.07
Triethylene glycol (TEG)112-27-6≥99.8%150.17
Carbon dioxide (CO2)124-38-9≥99.9%44.01
Table 2. Rate constants (k) and correlation factor (R2) of all solutions, along with the experimental duration (time), CO2 loading (α), and unloaded amine weight %.
NameUnloaded Amine wt.%α (mol CO2/mol amine)Time
(days)
k × 10−4 (day−1)R2
DEEA.H2O300.1493.7920.910
3DMA-1P.H2O300.1492.9330.945
3DEA-1P.H2O300.1492.6590.981
MDEA.H2O300.1493.9600.908
MDEA.H2O (Glass)300.1354.5460.904
DEEA.MEG300.1497.9980.938
3DMA-1P.MEG300.1490.3620.981
3DEA-1P.MEG300.1496.6340.930
MDEA.MEG300.14922.9100.919
MDEA.MEG (Glass)300.14917.3900.900
DEEA.TEG300.1493.8530.974
3DMA-1P.TEG300.1494.5050.928
3DEA-1P.TEG300.1494.0430.914
MDEA.TEG300.14919.4500.988
MDEA.TEG (Glass)300.14911.9200.939
DEEA.H2O100.4495.4830.916
DEEA.H2O300.4499.4730.941
DEEA.H2O500.44911.5610.935
MDEA.H2O100.4493.0580.974
MDEA.H2O300.4497.0610.990
MDEA.H2O500.44916.5200.998
MDEA.H2O700.44932.8100.986

