1. Introduction
Global energy demand is increasing gradually due to constant economic growth, and research shows that growing demand is leading toward environmental hazards since a significant portion of the energy is produced by burning fossil fuels [
1]. Consumers in developing countries are facing more problems due to the growing energy demand and supply gap because they have to face higher energy prices and power outages in different areas. Massive investment and infrastructure are required to increase the overall capacity of generation plants, and it can take several years to develop new energy sources in developing countries [
2]. Research shows that energy wastage and inefficient use of energy are boosting energy crises in most of the regions [
3]. Developed countries have already been focusing on this topic, but consumers in developing countries still need to be educated about the active measures required to improve energy efficiency by reducing energy wastage. Presently, communities should focus on the improvement of energy efficiency rather than burning more fossil fuel to increase the overall energy production capacity. The industrial consumer has a significant share of energy consumption. According to the U.S. Energy Information Administration (EIA), the industrial sector consumes 54% of the world’s delivered energy, so improving the energy efficiency of industrial facilities is more important than all other sectors [
4]. The industrial sector of Pakistan consumes 35% of the total produced energy, and it is the largest energy consumer in the country [
5]. The performance of the industrial sector in Pakistan is brutally affected, due to the severe energy crises occurring in the country. An industrial energy monitoring and management system can help in reducing energy wastage in the industrial sector, which can ultimately lead to economic and environmental improvements.
Monitoring and controlling of load on the consumer side are becoming more convenient due to the involvement of advanced communication and data transmission technologies in the energy sector [
6]. Most Internet of things (IoT)-based energy monitoring devices can be controlled remotely, and they can also transmit data to distant locations through the Internet. Smart energy meters are good for residential systems, but a complete energy monitoring and management system can fulfill the requirements of industrial users to extract detailed energy consumption data in a centralized server [
7].
This study introduced the design, system structure, and hardware of a successfully implemented energy monitoring system in a well-known automobile factory in Pakistan. The manufacturing plant of this factory consists of more than eleven departments covering an approximate area of more than 170,000 m
2, as seen in the aerial view of the factory shown in
Figure 1. The major departments of this factory include welding, bending, painting, assembling, testing, polishing, repairing, and quality control, as well as administration, warehouse, canteen, and so forth. More than 2000 workers run all these departments with a production speed of 50,000 vehicles per year, so it is very hard for the engineering department to control the energy usage behavior of all workers without a robust monitoring and control system. The total assigned electric load of this particular plant is 5 MW, and the local utility company is providing medium voltages (11 kV) at the main incoming supply. Three electric substations operate at different factory locations for distributing electricity to all departments. All three substations are equipped with six step-down transformers and power control panels to supply low-voltage power to all departments. One of the transformers in substation 02 is used to supply the power to all emergency and control equipment inside the factory through distributed uninterruptable power supplies (UPS). That transformer always remains energized to avoid any control equipment failure in the plant. Some production departments are using sensitive machinery and require a stable voltage source, so an automatic voltage regulator (AVR) is connected with two substations to provide stabilized power to selected departments. The plant is also equipped with a 500 kW solar photovoltaic power system. Three diesel generators are installed to provide emergency backup to the plant during load shedding by the local electric supply company.
The designed energy monitoring system was used to implement energy conservation policies in the factory, leading to noticeable energy savings. This energy monitoring system consisted of a huge network of hardware connected with a centralized monitoring and data logging software to extract real-time energy consumption and power quality data from each node of the factory. The data communication part of the system was designed with a combination of Modbus and Ethernet protocols to minimize the data communication delays and to ensure the real-time energy monitoring in a centralized server. This system was equipped with modern features such as remote monitoring and controlling of energy flow, automatic generation of power consumption reports for each department inside the factory, in addition to sending monthly reports to each department through email, defining the daily energy consumption limits for each department as per production speed, and ensuring long-distance data transmission without any data loss and delay.
Technologies used in this system included, but were not limited to, digital instrumentation, control and automation, supervisory control and data acquisition (SCADA), communication protocol converters, and centralized servers with database management. This system also had the ability to synchronize with a utility supply company’s local grid for demand forecasting so the grid could manage its supply as per demand [
8]. The SCADA system is widely used in the manufacturing industry, and it can be designed for any advanced monitoring and controlling applications such as the SCADA-based remote monitoring and control system for an industrial furnace that was introduced in [
9]. The authors of [
10] showed the implementation of SCADA- and programmable logic controller (PLC)-based automatic flow control and monitoring system for an oil pipeline. SCADA can also be used for energy monitoring and management purposes as seen in [
11], which introduced a General Packet Radio Services (GPRS)-based energy consumption monitoring platform for large-scale industry users. The authors collected all the energy consumption data with the help of energy meters in a centralized server. As described by the authors, the designed system had the ability of data acquisition, statistical analysis, and prediction, which can help in implementing energy conservation policies in the future. The authors did not develop any automatic management and controlling mechanism in their study. The authors in [
12] introduced a SCADA-based energy management system with a centralized cloud database. The cloud computing provided virtual infrastructure services, and the user was able to able to model dynamic and nonlinear models of the power system. The authors were successful in having the SCADA system communicate with SAP (systems, applications, products), but there were some bugs in the communication with the open platform communication (OPC) software. The authors of [
13] described an overview of two years of continuous energy monitoring with the help of the SCADA system in a coal mine. This study showed a perfect example of monitoring and controlling energy processes from a distance. The authors explained that the user was able to save 10% energy annually by implementing energy-saving policies with the help of an energy monitoring system.
Previous studies show that every SCADA-based energy monitoring system is designed according to the requirements of the consumer. This paper further discusses the description of the installed system, methods used for energy savings, and results gained from all those methods. The majority of industrial consumers in developing countries do not adopt modern technologies to improve the efficiency of their facility because of the general concept that these technologies are expensive and do not have major financial benefits for the industry, which is totally wrong. The designed system is cost-effective, and this study shows that annual savings due to this system are much more than the total initial investment. The significant contributions of the presented research work are as follows.
The very first purpose was to design a cost-effective, innovative, efficient, and real-time energy monitoring system for the process industry. The proposed system has a flexible graphical representation of complex energy data, automatic controlling of the system, remote access to the system, automatic reporting, and fault indications. To the authors’ knowledge and following a literature review, such a study does not exist. The investigation is essential, and it has many merits when being used in the current process industry.
The second purpose was to find an improved energy monitoring system with the flexibility of the system’s future expansion in terms of software and hardware by controlling energy wastage. An industrial energy monitoring system is helpful in reducing energy crises in developing countries by improving the energy efficiency of the industrial sector, so these systems can be promoted in developing countries to control energy wastage in the industrial sector.
The designed SCADA software also has the ability of remote communication with the local utility grid, and the power supply company can also control the power flow inside the factory with the permission of the user. This feature can help power supply companies to turn off non-critical loads in selected factories with the permission of consumers rather than having complete blackouts during the time of load shedding. Previous studies did not cover all these concerns of modern process industries included in one system covering all industrial electrical standards. This study reflects its unique impact by covering all discussed matters after fulfilling the requirements of industrial standards.
2. System Description
The energy monitoring system was designed as per the technical requirements of the factory. As the electrical power system of the factory consisted of three substations and one AVR, power quality and energy data were extracted from the incoming power supplies of all substations, the incoming power supply of the AVR, the outgoing power line of the AVR, and all outgoing nodes of substations.
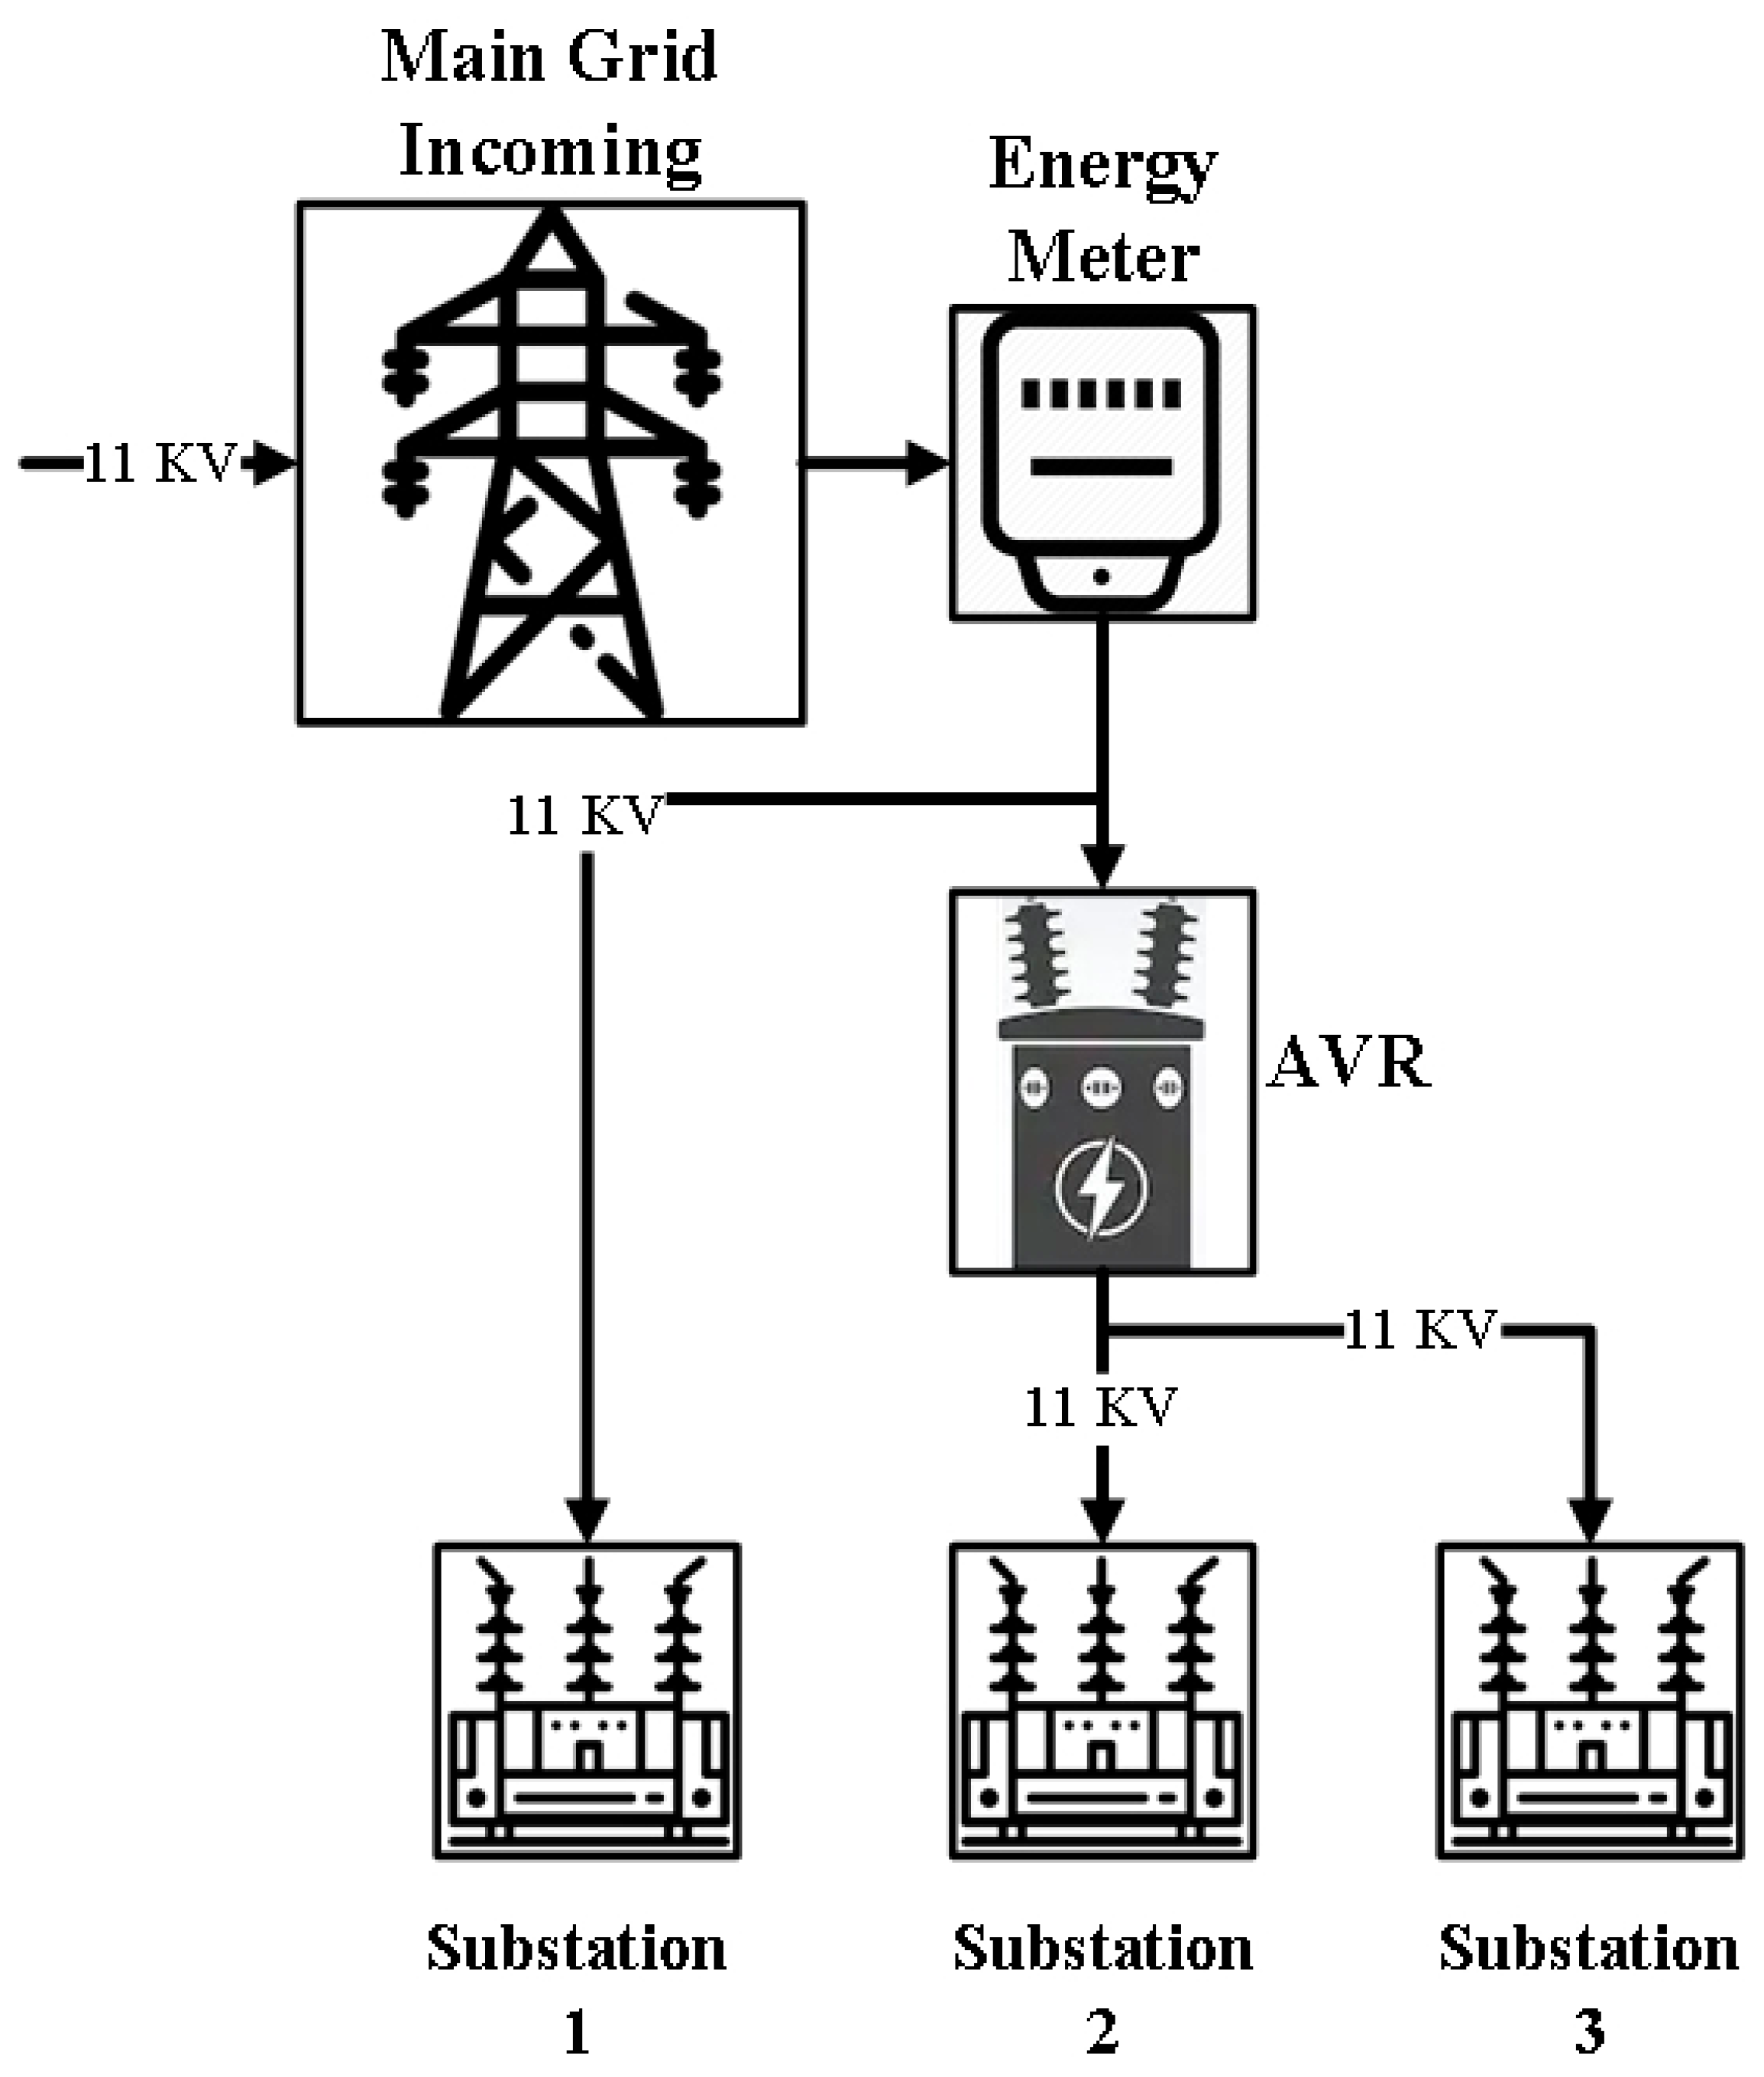
Figure 2 shows the general layout of a medium voltage power network of the selected factory where one substation is directly connected to the main grid, and two substations are connected through the automatic voltage regulator (AVR). The output of all substations in three phases was 440 VAC at 50 Hz frequency.
As per the technical survey of the factory, the energy monitoring and management system had to perform the following tasks:
Real-time monitoring and data logging of each department’s voltage, current, active power, reactive power, power factor, and peak power consumption.
Monitoring and data logging of the power quality for each department.
Displaying the energy consumption limits and real-time energy consumption data of each department at locally installed display devices for each department.
Providing the visual signal of the fire alarm system at display devices of all departments and the control room as well.
Generating monthly energy consumption reports and bills for each department.
Remotely controlling the main circuit breakers of each department in case of any fault or abnormal activity.
Generating warning signals to the departments that exceeded their daily consumption limits.
Transmitting energy consumption data to different remote and local locations.
Providing remote monitoring and control options to various users.
Maintaining a continuous database of energy consumption data.
System Hardware
The basic hardware used for this system comprised an energy analyzer, a current transformer (CT), a potential transformer (PT), a gateway module, the programmable logic controller (PLC), temperature and light sensors, flow meters, supervisory control and data acquisition (SCADA) software, and a centralized server. An energy analyzer PM5310 (Schneider Electric, Rueil-Malmaison, France)) was used to measure the energy and power quality. This energy analyzer was able to store real-time energy data, transmit these data through an RS-485 port, display basic parameters on its liquid crystal display (LCD), provide feedback with two digital inputs and outputs. The front LCD of PM5310 with basic parameters is shown in
Figure 3.
Table A1 given in appendix shows the basic technical specifications of the energy analyzer.
A total of 50 energy analyzers were used in four different zones with the help of a 3 km long two-core shielded cable to cover the whole factory. The PM5310 was used to measure the energy data from low voltage and medium voltage lines with the help of current and potential transformers. The same analyzer provided the values of current, voltage, frequency, active power, reactive power, energy, power factor, and harmonics up to the 31st harmonic to the system.
The PM5310 was equipped with an internal current transformer (CT) of 5 amperes, but external current transformers could also be attached up to a ratio of 6000/5 to measure high current levels [
14].
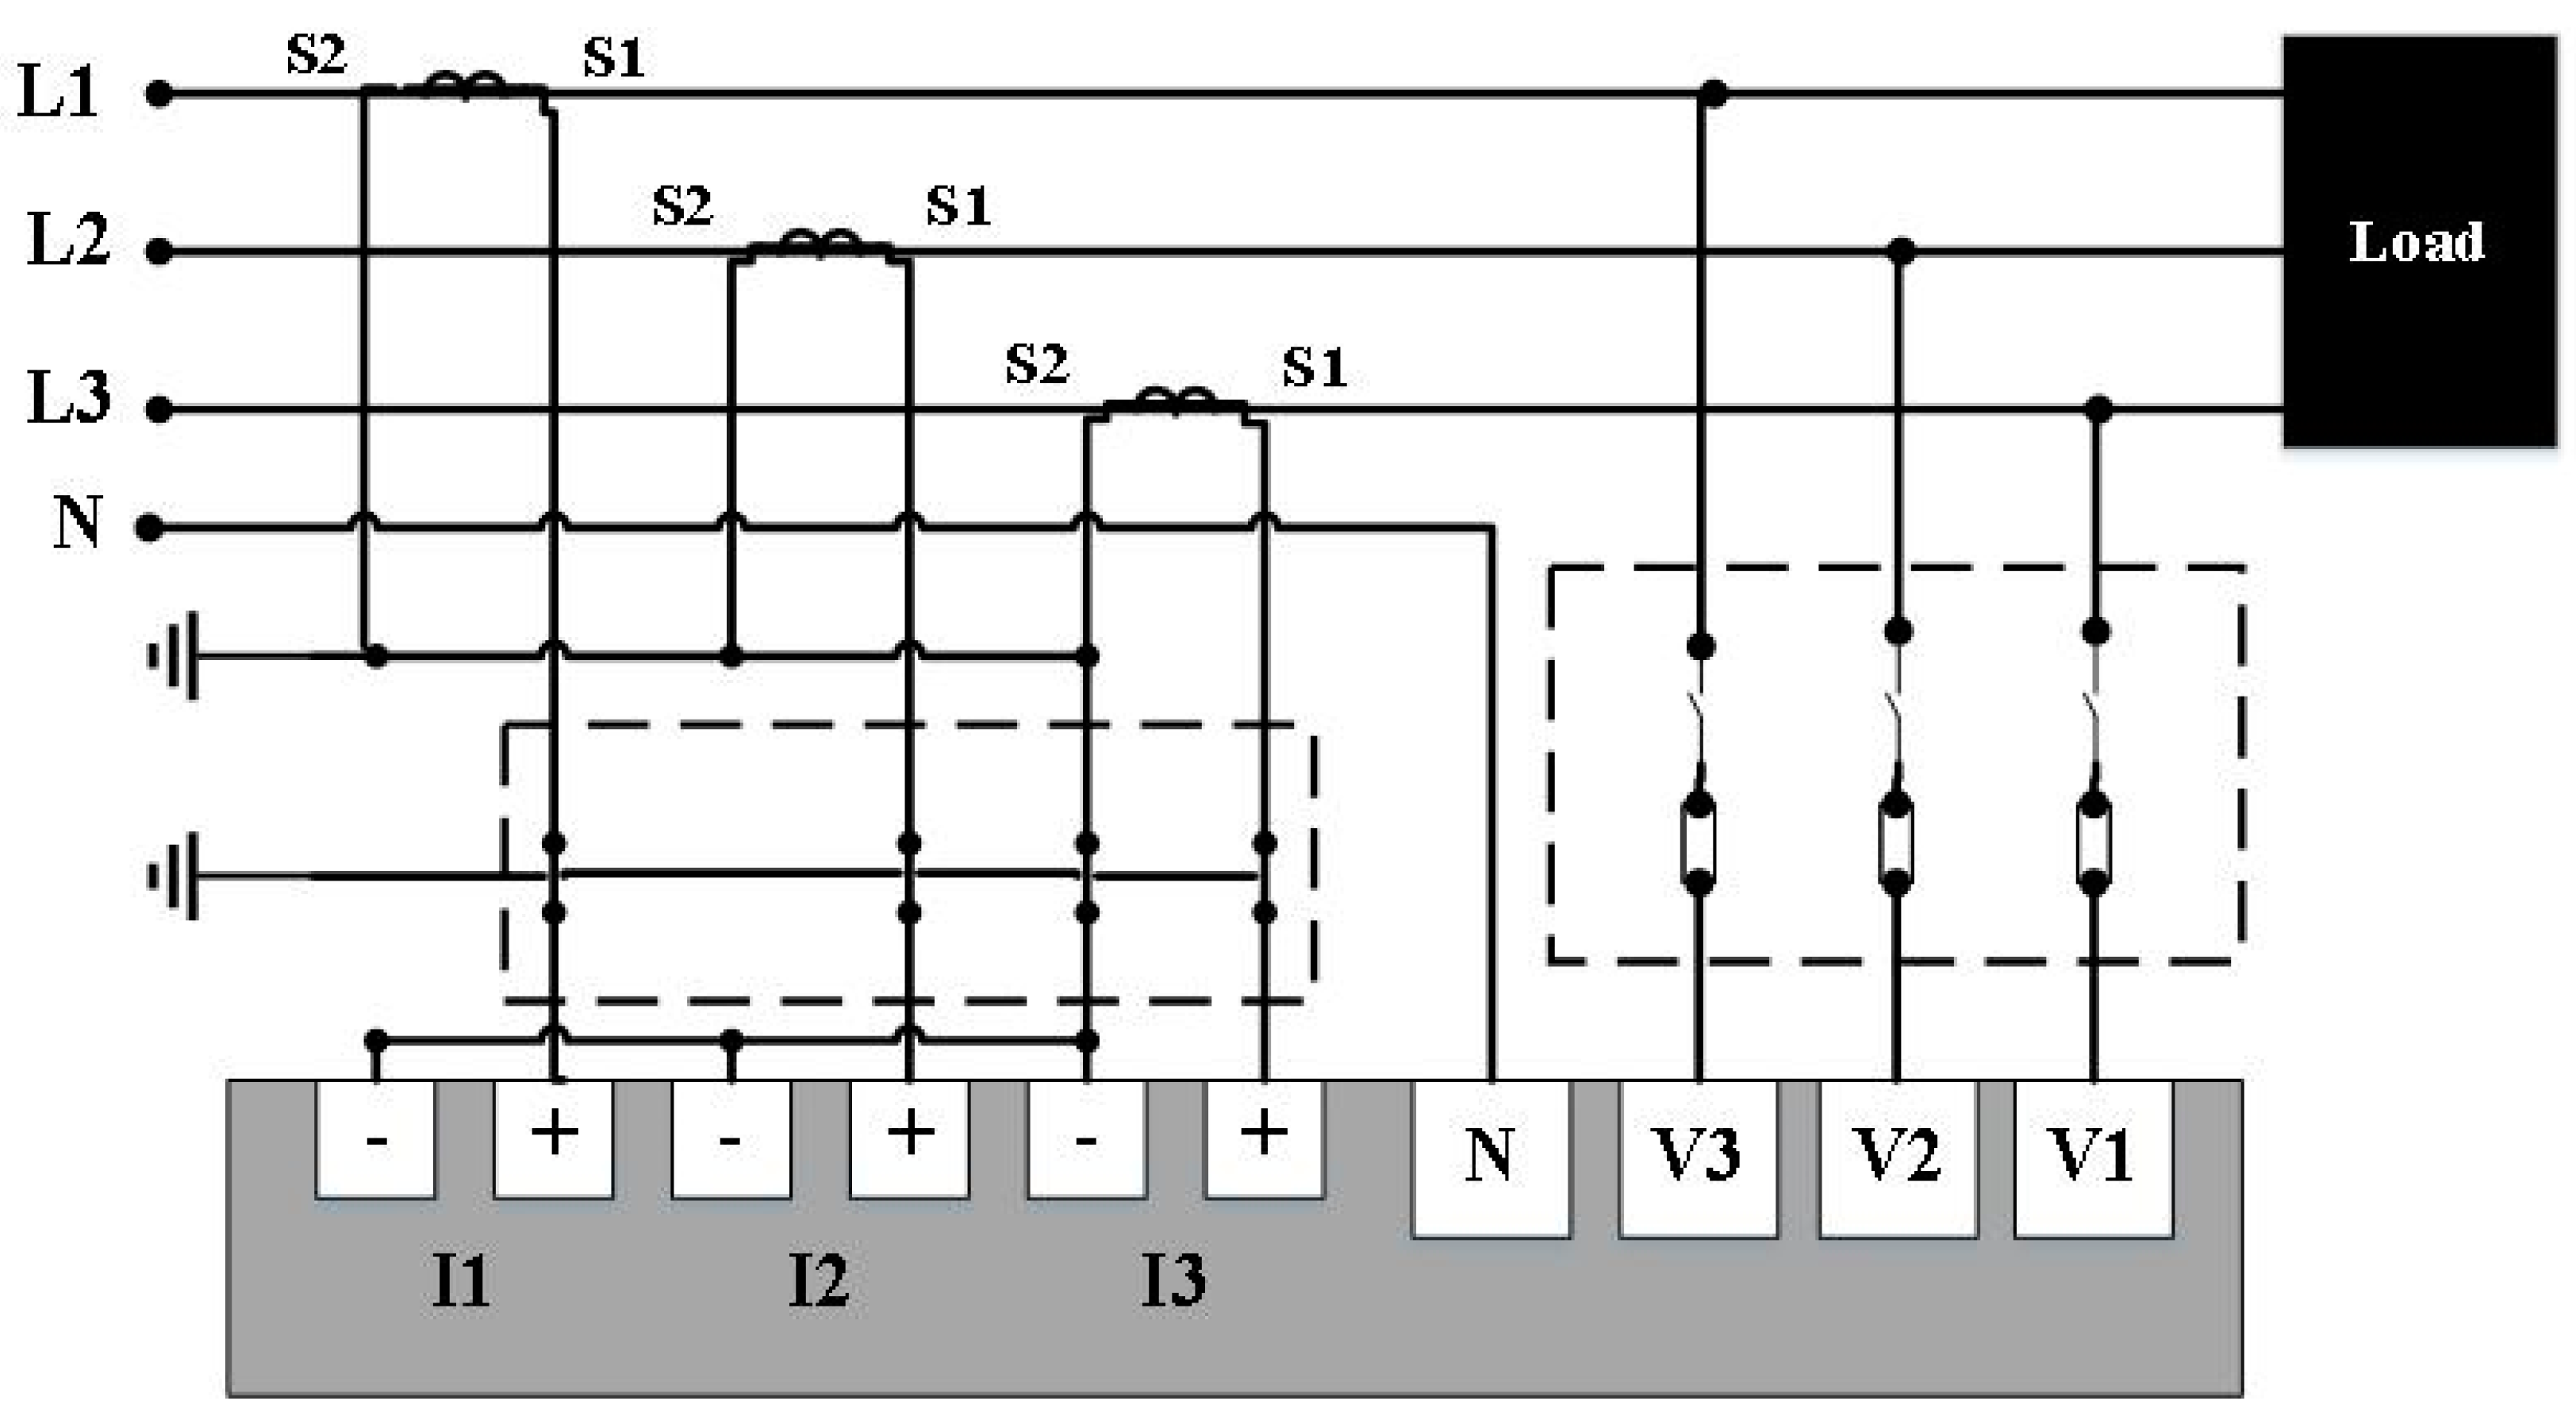
Figure 4 shows the connection between the current transformer and the voltage source with an energy analyzer. This diagram is only valid for low voltage sources because the main lines are directly connected to the energy analyzer. The PM5310 was also used to measure medium voltage levels at the incoming bus-bar of all three substations and the main utility grid by using potential transformers (PTs). An RS-485 communication port is available in an energy analyzer, and this port is used to transmit all energy-related data to the centralized server. Digital input and output (I/O) ports of energy analyzers are only used for basic feedbacks and controls such as the feedback signals of a breaker’s position and turning it on and off remotely.
The covered area of the factory was very large, and research [
15] shows that an RS-485 signal cannot be transmitted if the distance between two nodes is more than 1200 m. Therefore, this whole network was divided into four different zones with the help of gateway modules, as shown in
Figure 5. The gateway module converted the RS-485 Modbus protocol to an Ethernet protocol so the data could be easily transmitted through the existing local area network (LAN) [
16]. Maximum 32 Modbus devices could be connected to this gateway module. Each gateway module was configured with a unique IP to transfer data from the energy analyzers to the server so it could be easily configured in the monitoring software.
A programmable logic controller (PLC) was used along with input and output modules for controlling and feedback purposes. The PLC communicated various feedback and controlling signals such as controlling the lighting systems, providing feedbacks of temperature sensors, providing the status of the fire alarm system of each zone, providing the data from steam and water flow meters, and controlling the emergency alarms [
17]. In addition, 20 input and output modules were used with the PLC to cover 160 digital inputs (DIs), 48 digital outputs (DOs), 16 analog inputs (AIs), and 8 analog outputs (AOs). The PLC’s data storage was extended by using a 16 GB SD card of, and data from all energy analyzers were also stored in the PLC to perform all programmed control tasks. The PCL was equipped with an internal Ethernet port and communicated directly to the centralized server through the Ethernet protocol.
A supervisory control and data acquisition (SCADA) software was designed and installed in a centralized server for logging and monitoring the data from all over the factory. SCADA was the main important part of this project, because a better monitoring and reporting design could be more helpful in improving the efficiency of the plant. The designed SCADA system performed monitoring, data logging, controlling, and reporting tasks with the ability of cloud connectivity and data transmission to remote locations. All energy analyzers were configured in the SCADA system according to their locations and configured with unique Modbus addresses. Data from gas flow meters, steam flow meters, water flow meters, and airflow meters were also extracted in this software to keep track of all utility consumptions in the factory. The main dashboard, display screens, single line diagrams of current flow, energy from different sources, and reports were designed according to the user’s requirements.
Figure 6 shows the main default dashboard of the SCADA system and the load utilization of different panels.
Figure 7 shows the data communication structure of the system, in which voltage and current reference signals were directly connected to the energy analyzer then transferred to a centralized SCADA system through an Ethernet gateway. The PLC was also getting signals from sensors and communicating them to the same SCADA system. The control signal from the SCADA system also travelled to the PLC and energy analyzers, making the system remotely controllable through the SCADA system.
The SCADA server is the point where users can connect this system with any remote site, including a smart energy grid, a utility billing company, other production units, a data center, or a remote power generation plant [
18].
Figure 8 shows the data logging and displays a SCADA algorithm. This algorithm always ensures the connection between the analyzer and the main server, then displays the data after removing all the errors in the system. The data sampling time and connection testing time can be adjusted in SCADA. The software checks the connection status every 120 ms and reports an alarm if there is any connection error in the system. In addition, the sampling time of data logging is set to 100 ms, and the sampling time for data display can always be selected by the user as per their requirements. The present data storage capacity of the system can store the whole plant’s energy consumption data for 20 years with the current system parameter settings. The energy monitoring system obtained some useful energy consumption trends of the plant after logging data for some time. Reports of the energy monitoring system showed some human errors and machine errors, which were leading to energy wastage. The user was able to identify the energy wastage inside the plant after getting the detailed energy consumption data and developed some energy conservation policies to avoid this energy wastage. All methods for saving energy inside the factory are described in the next section.
3. Materials and Methods
Energy-saving policies were developed after the identification of all energy wastage points in the production plant. Most of the energy wastage was due to the negligence of workers because they were not taking care of energy wastage inside the plant. Most of the workers were not turning off their machines and other equipment during break times, leading to significant energy wastage. The energy-saving policy developed to avoid this particular wastage was to maintain the daily energy consumption of each department within limits established by the utility department. The energy monitoring system was able to show real-time energy consumption data of each department at their locally installed screens; a total of 11 display screens for all departments showed the assigned daily energy consumption limits. These energy consumption limits were calculated with the help of the energy monitoring system, by practicing the efficient use of energy during regular working shifts at a specific production speed. Real-time energy consumption data and remaining limits were always displayed on local screens so every department could meet the energy consumption targets daily and avoid any energy wastage.
The second issue was that the ventilation system, air conditioning system, and lights inside the production plant also used to run during shift breaks. The schedule for break times during each shift was therefore programmed into the energy monitoring system so that all unnecessary production machines could go off automatically at those times to save energy. All the lights were controlled through occupancy and light intensity sensors.
The energy monitoring system also helped to detect two outdated transformers, which were wasting more energy as compared to the other transformers. Their power consumption was double as compared to other transformers of the same capacity. Those two transformers in substation 02 were replaced with new transformers to save energy. The user also observed that all transformers were energized even when the production plant was closed, and the power consumption of each transformer was more than 20 kW. The user changed the factory shutdown procedure and adopted the method of turning off the main incoming breaker of each transformer to reduce the wastage due to idle energized transformers.
Figure 9 shows the electric consumption chart of the factory for 30 days. The blue in the bars shows the energy from the solar power unit. This graph shows that energy consumption on the weekend is also low because all production departments remain closed on these days except the quality and IT departments. The black horizontal line shows the energy consumption target set by the utility department. Daily energy consumption of the plant was always higher than the target line, so the user could very easily detect the departments with higher energy wastage and ask for explanations regarding higher energy consumption.
Research shows that the poor rewinding of a motor can decrease its efficiency by up to 5.5% [
19]. It was very easy for the user to compare the energy consumption of all motors of the plant with the help of the energy monitoring system. Motors with relatively greater losses were replaced to save energy. The total power of the replaced motors was 370 kW. Utility prices are relatively high for peak energy demand time in most countries, as described in [
20], so the production timing was scheduled in such a way that peak time power demands could be minimized. This action did not have any effect on energy efficiency, but the cost of energy was reduced because the same amount of energy was delivered at a higher rate at peak demand times by the utility companies.
Trends created by the energy monitoring system for torque load of all machines showed that some of the machines required soft starters to lower the 70% starting torque load [
21]. Most of the machines were already equipped with soft starters, and the rest were installed after checking the difference between the power consumption of both types of cases. Power factor trends and charts calculated by this system showed that some departments had a very low power factor because they were adding heavy induction motors without increasing the capacity of the power factor improvement panels. Power factor improvement (PFI) panels have been installed at different locations to reduce losses due to reactive power [
22]. Detailed reports generated by the monitoring and data logging software helped the user to implement very easily the energy-saving policies. A visual analysis of the data demonstrates the results more clearly in the next section.
4. Observations and Results
The system discussed in this study provides all real-time energy consumption data of the factory in graphical trend charts and bars, which makes it very easy for the user to check any abnormal behavior of the electrical power system.
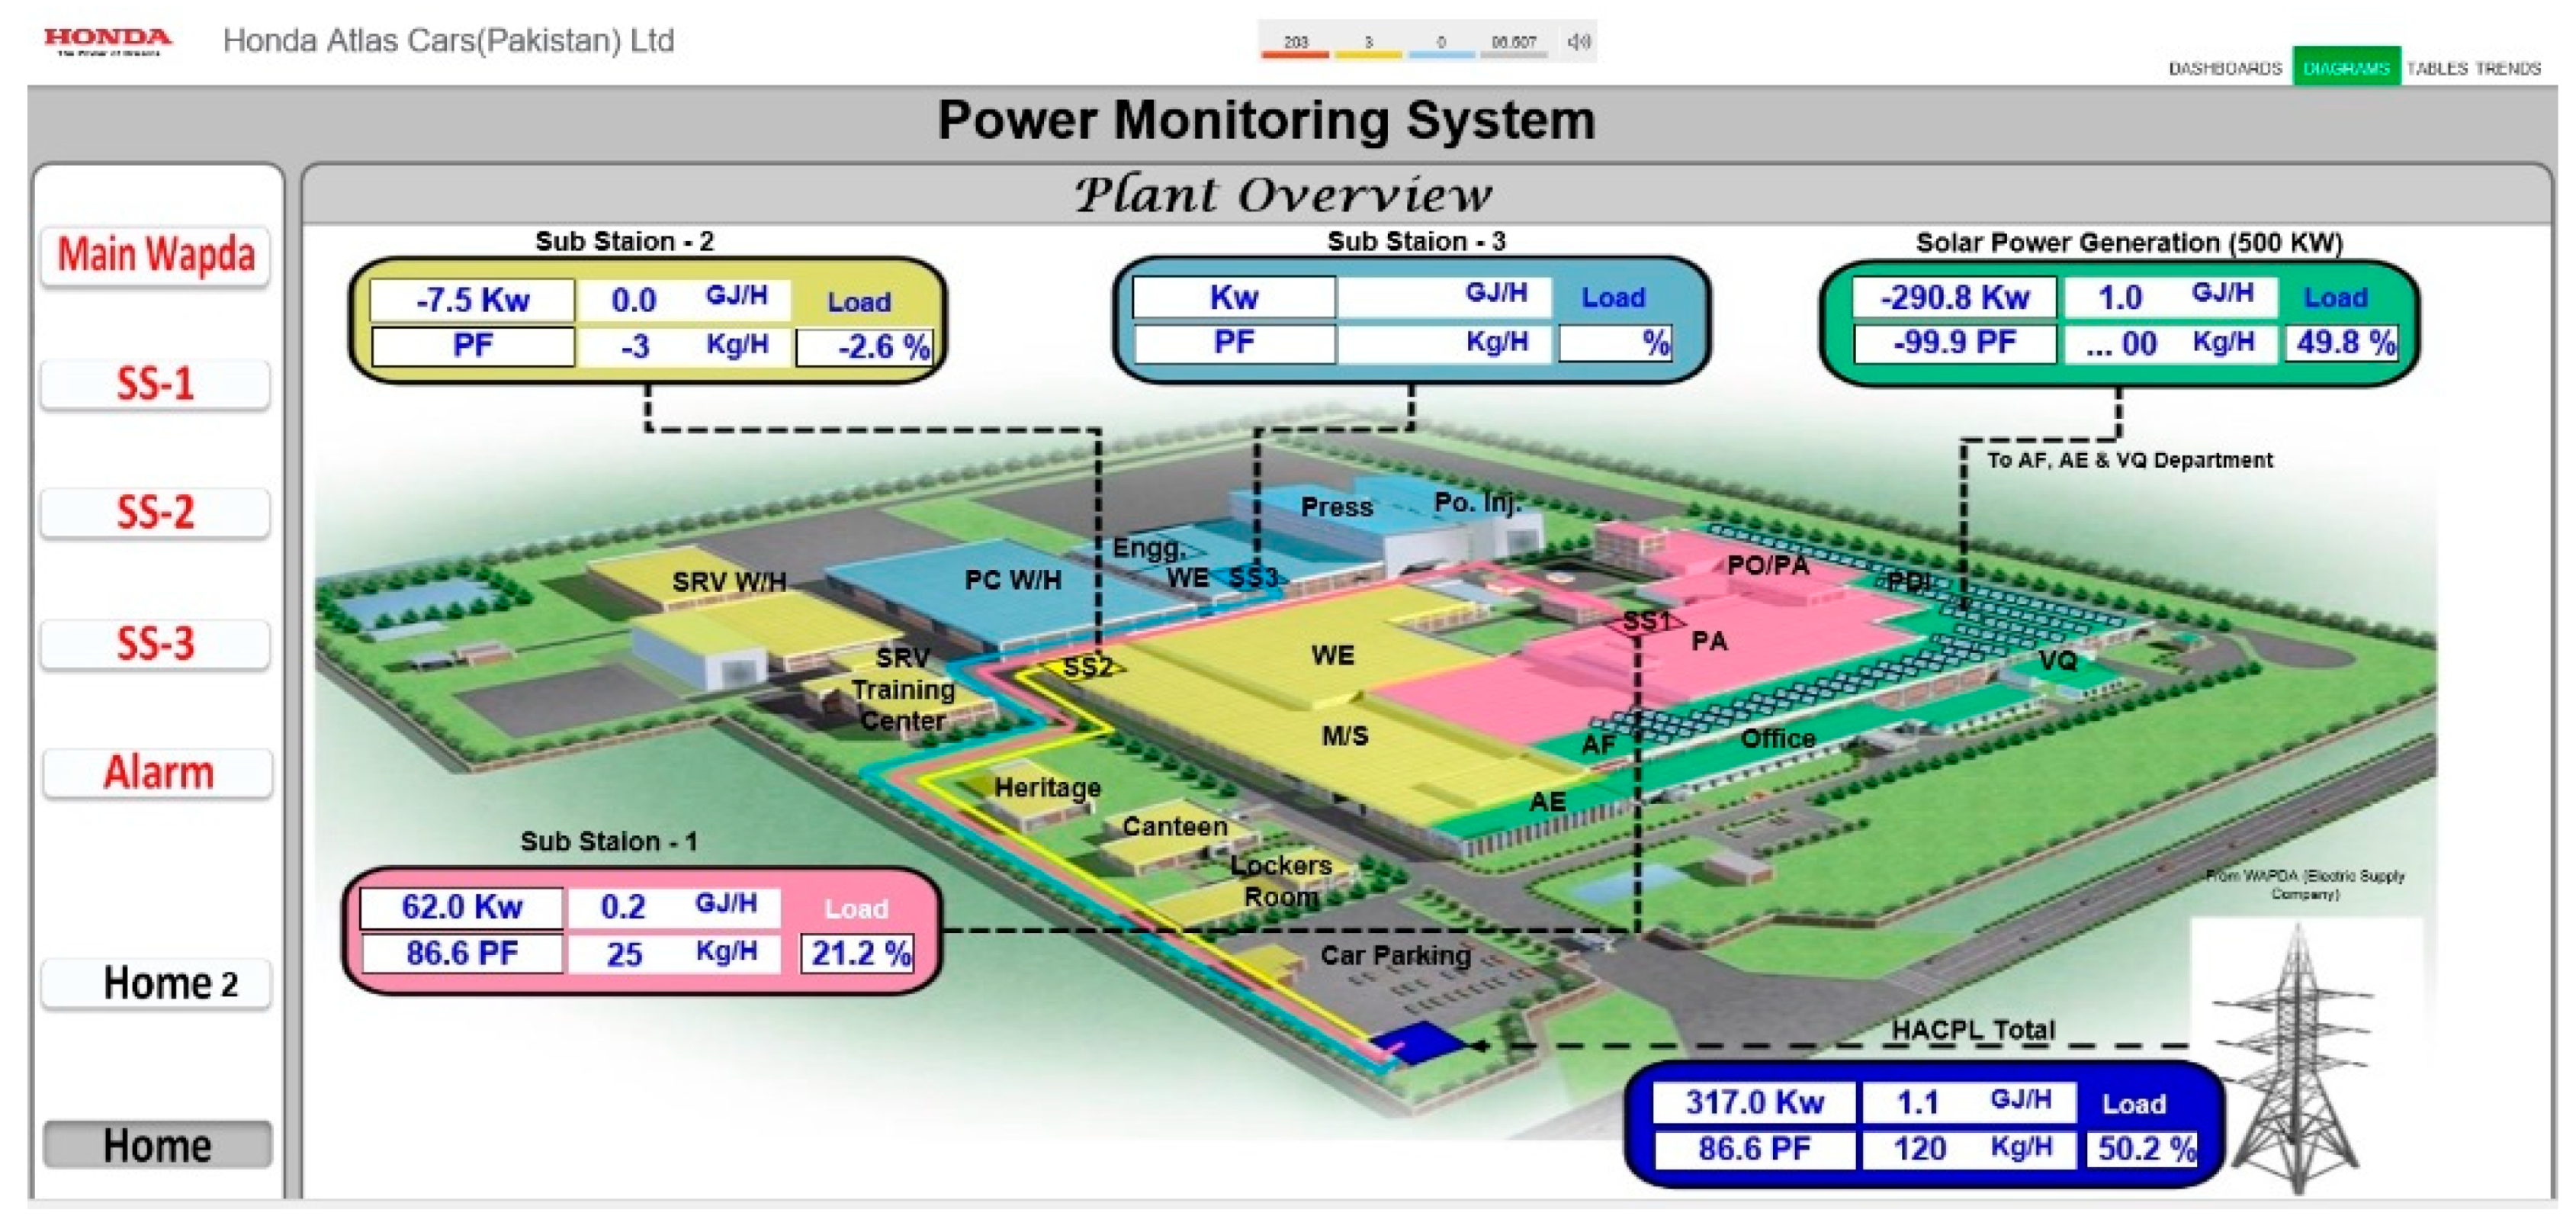
Figure 10 shows the basic overview of the plant with real-time power consumption data of each department, main incoming supply from the electric supply company, energy supplied by a solar power unit, and energy supplied by diesel generators on the same screen. This single screen shows the electric power distribution network of all energy-consuming departments and power sources. More detailed data of each substation can also be accessed from the left menu bar in the software. The plant layout can also be viewed, as shown in
Figure 11. This diagram does not show the connections between all departments, but the location and energy consumption of each department can be easily viewed on this single screen.
Users can easily obtain the data regarding load distribution between each substation, as shown in
Figure 12. These data can help the user to plan for balanced load distribution between each substation in the future as per the capacity of the installed cables.
Figure 13 shows the graphical representation of the real-time present and historical data of the administration department of the factory. The graph in the upper left corner shows the target limits for this specific department. This graph will turn red and send a warning message to the responsible person of any department exceeding the assigned energy consumption limits. The same data are always displayed on the locally installed display screens of each department to warn the users about the energy consumption targets. The Admin Period over the period chart in
Figure 13 shows the energy consumption comparison of two consecutive months.
Figure 14 shows the energy consumption comparison of two consecutive years within the monitoring software. There is a huge difference in energy consumption data in this diagram because the production speed of the plant was reduced during recent months. These data cannot be used to calculate the energy efficiency improvement because all the data are stored after the implementation of energy conservation policies.
Figure 15 shows the real-time voltage data before and after the automatic voltage regulator (AVR). Ideal incoming voltages for sensitive equipment should be close to 11,000 V, and the main incoming voltages are regulated from 11.5 kV to 11.0 kV by AVR. The monitoring system generates warning messages to the control room in case of any voltage fluctuation above or below the threshold limits defined in the control system.
Figure 16 shows the trend charts of fluctuation in power factor and main incoming voltages before and after AVR. The user can clearly check the performance of AVR with the help of this trend chart. The graphical display shows that any surge or fault in AVR can easily be detected and observed by the user without any detailed analysis of the data. The first trend chart shows the power factor of the plant, and this graph is fluctuating due to the variable induction load. Most utility supply companies charge heavy fines if the power factor of the industrial consumer goes below a defined range, which is mostly 0.8 in Pakistan [
23].
Figure 17 shows the general layout of substation 01, and any energy analyzer can be accessed remotely through this platform for checking the real-time data of any connected node, as shown in
Figure 18.
Figure 17 also shows that energy monitoring devices were installed on each node of the substation, so energy wastage could be detected at the individual machine level.
The reports generated by the energy monitoring system are detailed and easy to understand. These reports include the calculated results and suggestions for energy management to improve the energy efficiency of the examined factory.
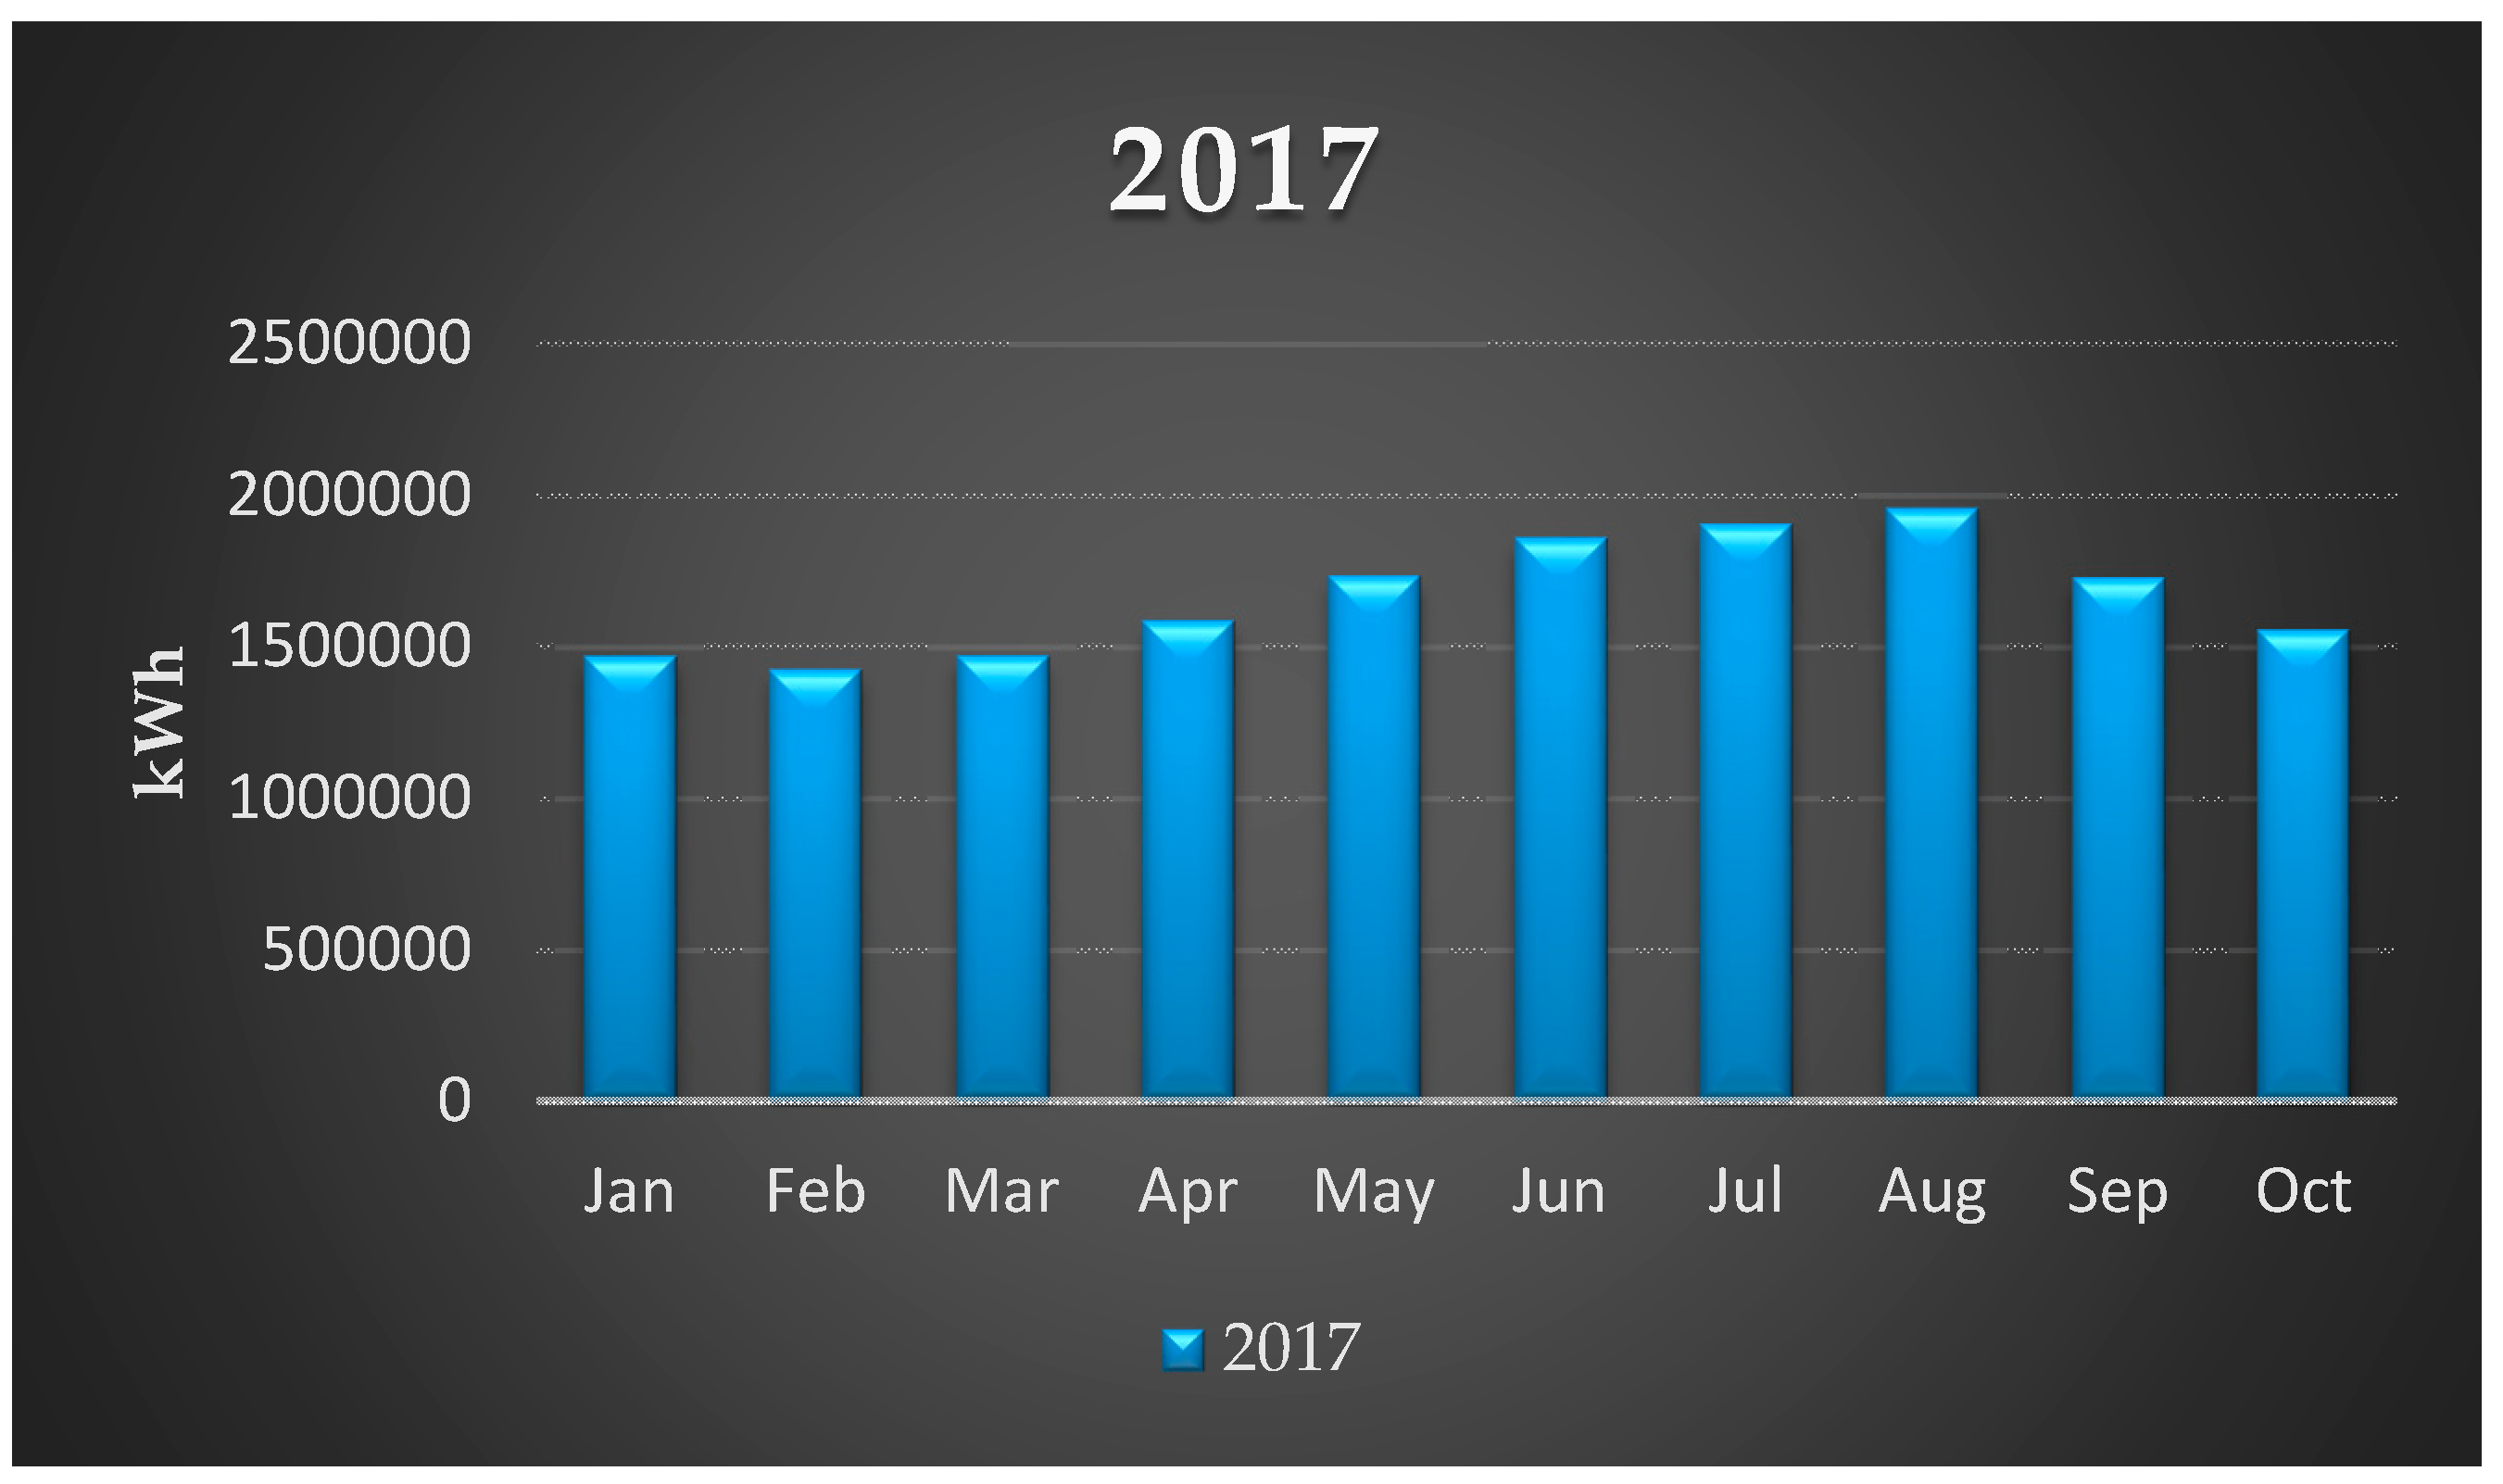
Figure 19 shows the monthly power consumption of the factory before the implementation of energy management policies. There is a rise in energy consumption during summer (April–Sepetmber) because the environmental temperature is usually high in Pakistan during these months. Factories and production plants use ventilation and air conditioning units to maintain the normal temperature for machines and workers. The energy consumption data before the installation of an energy monitoring system were extracted from the electric bills charged by the local electric supply company, namely the Lahore Electric Supply Company (LESCO).
The factory was relying on the energy meter installed at the main incoming panel of the utility grid to get the power consumption data before the installation of the energy monitoring system. The developed system was tested in a practical environment to obtain energy monitoring and saving data.
Figure 20 shows the comparison of energy consumption data of the factory before and after implementing energy conservation policies. This graph indicates that energy consumption in the summer is significantly improved due to the efficient use of ventilation and air conditioning units. These data were also taken from the electric bills charged by the local electric supply company. The production capacity of this plant reduced after October 2018, but it produced 50,000 vehicles per year before that, so the energy consumption data before October 2018 can be compared directly without any production speed correction.
Monthly and annual comparison charts can be easily created with the help of data stored in the energy monitoring system. The annual energy audit report by a third party describes an 8% energy efficiency improvement after the implementation of the energy monitoring and management system.
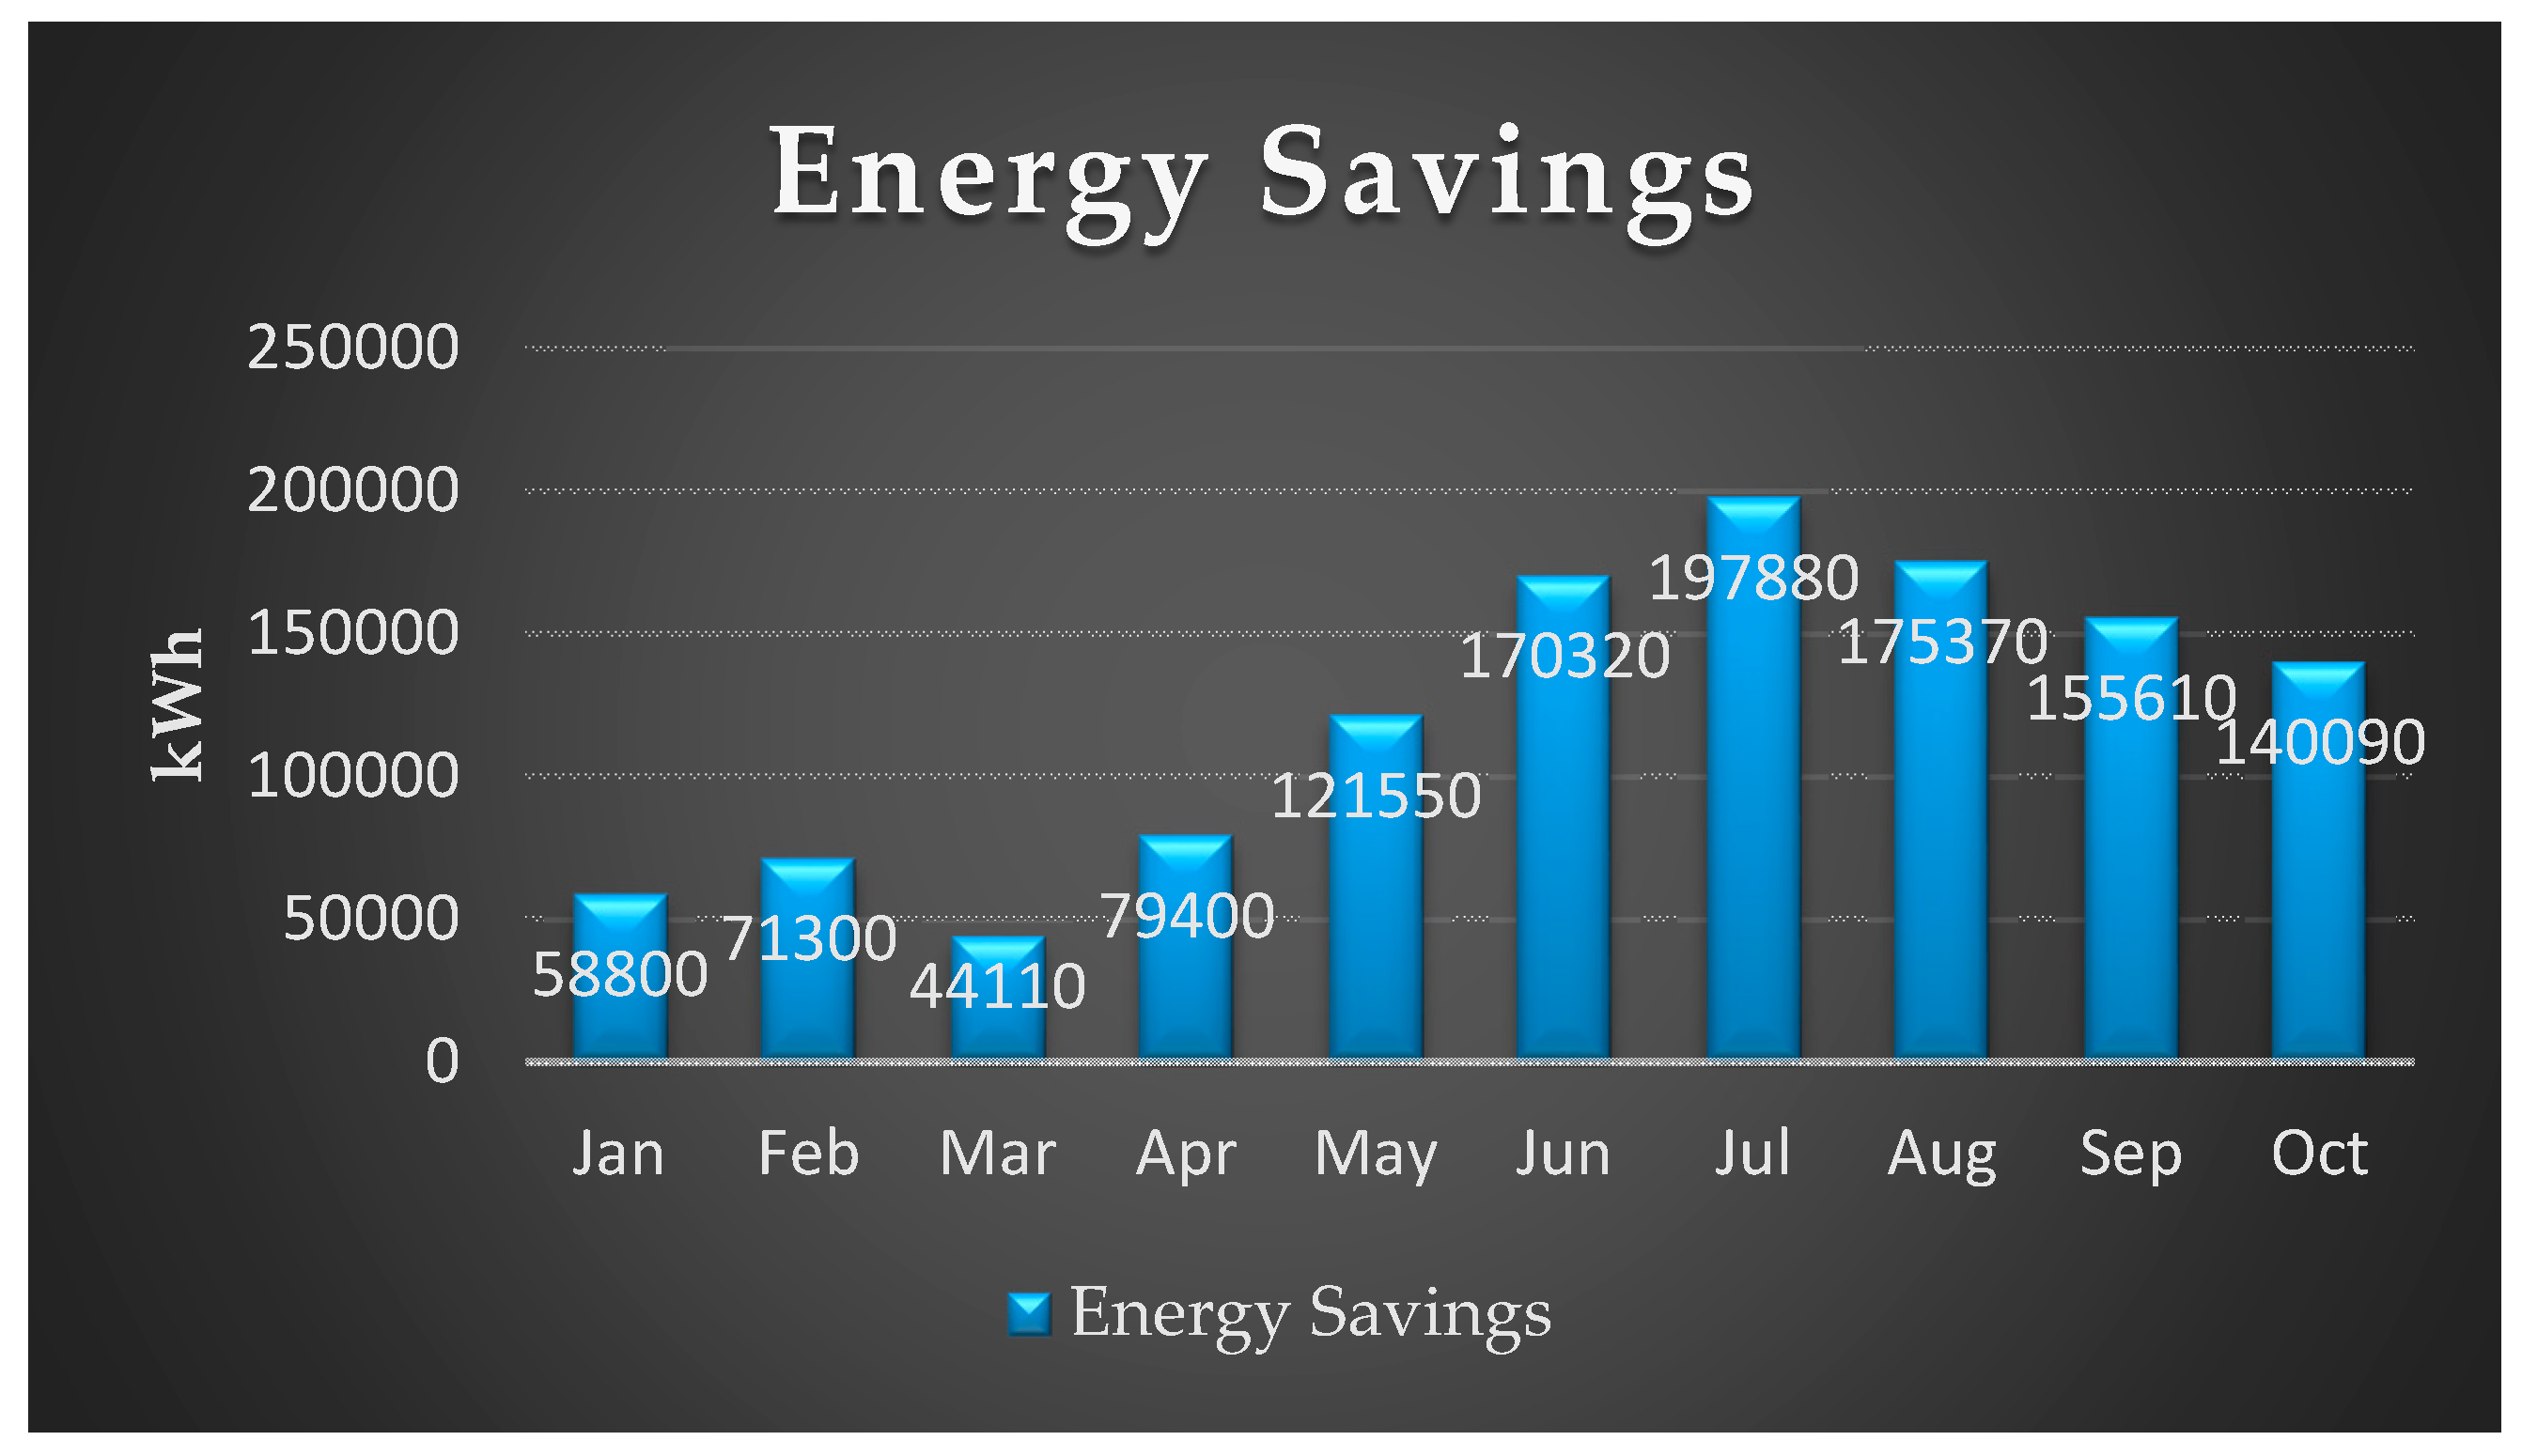
Figure 21 shows the monthly energy savings of the factory after following the energy conservation policies. This result shows that the energy wastage was high in summer due to the inefficient use of ventilation and air conditioning units. Total savings include the savings due to the replacement of inefficient motors, the shutting down of the main incoming power of major transformers during closing times, the replacement of inefficient transformers, the shutting down of the machines during break times, the installation of soft starters on bigger motors, the upgrading of power factor improvement panels in each substation, and the efficient use of a sensor-based lighting system. These are direct energy saving impacts of the system. An indirect saving generated by this system is achieved by switching a major load of the factory from peak demand time to off-peak demand time. Utility rates are 25% higher for peak demand times, so production and break times were managed by considering peak and off-peak demand times to save utility costs. The energy efficiency improvement of the plant can be calculated using the following equation.
Energy consumed for a specific period before energy conservation policies:
Energy consumed for a specific period after energy conservation policies:
Power consumption data before and after the installation of the system were compared, and the results show that 7.75% of the energy was saved throughout the year with the same production capacity of the plant. Total saved energy was 1.21 GWh per year, and the total cost of this power was 177,000 USD as per local utility rates. The savings generated by switching load from peak time to off-peak time are not included in this amount because peak time changes throughout the year. Furthermore, there was a reduction of 730 metric tons of carbon dioxide by saving 1.21 GWh annually [
24]. According to calculations from the U.S. Environmental Protection Agency, the same amount of carbon emissions can be reduced by 1006 acres of U.S. forests in one year.
Energy consumption data of all the departments can be accessed remotely through the energy monitoring system.
Figure 18 shows the remotely accessed real-time energy monitoring data of an energy analyzer installed for a particular department. This figure also indicates that power quality data, energy demand data, feedbacks from digital inputs, control of digital outputs, and alarm status of any energy analyzer in the system can also be accessed remotely, as the options are available at the top of this figure. Remote access to each device can save much of the engineers’ troubleshooting and reporting time because any fault in the line can be checked online before visiting the site.
5. Conclusions
In this study, the software and hardware of an energy monitoring system were designed and successfully implemented in an automobile factory. The system introduced in this study shows an efficient visual and user-friendly platform with advanced and flexible hardware. Therefore, troubleshooting and maintenance tasks can be performed easily and safely by simple planning. The system enabled the logging of real-time sensitive energy parameters from analyzers and transferred them into the graphical environment, making it easy for the user to plan the modification and maintenance of the energy distribution system without any major shutdown.
The PM5310 energy analyzer used as this system’s main hardware is a very powerful and precise measurement device that had never been used before for similar studies. This analyzer enabled the detailed observation of the energy distribution network by providing sensitive and accurate measurements of harmonics, current, voltage, power, frequency, and power factor to the monitoring software. All measured data in the analyzer were transferred to the host server via Modbus communication at 100 ms time intervals and updated continuously at 150 ms time intervals in the graphical display.
The detailed and user-friendly graphical representation is another good feature of this system. The power monitoring software brought a more functional and graphical interface to the system due to its built-in energy monitoring features. This software introduced an advanced reporting technology by offering automatic report generation and delivery to the assigned email addresses periodically. This system also improved the behavior of the workers toward the efficient use of energy by displaying daily energy consumption limits of 11 different departments to their locally installed display screens. This study continuously collected the power quality and energy consumption data of the plant.
This energy monitoring system fulfilled all the technical requirements of the consumer. The consumer was able to implement all their policies related to energy conservation, as mentioned in
Section 3, and monitored the results throughout the year. These policies included defined shutdown times for heating and cooling units, automatic turning off of all machines during break times, a lighting control system, turning off of the main power supply of all transformers except the transformer providing power to emergency and control equipment, and a shift of the maximum load to off-peak demand times. The consumer was able to identify the energy wastage inside the factory and accurately resolved this problem. As per the annual energy audit report, the consumer was able to save approximately 7.75% annual energy cost by implementing energy conservation policies through the energy monitoring system. Annual savings in the form of energy after the installation of the energy monitoring system were 177,000 USD. The initial cost of the energy monitoring system was 86,500 USD and the cost for all necessary equipment installation including the cost of new transformers, motors, variable frequency drives, and all sensors was 327,000 USD, bringing the total investment of the systems to 413,500 USD. The return on investment of energy monitoring systems for the industrial user is less than 28 months. This system has been running for more than two years, and the consumer is still improving energy consumption quality. All results show that this type of industrial energy monitoring system can be helpful in reducing energy crises in developing countries by improving the energy efficiency of the industrial sector. Therefore, these systems should be promoted in developing countries to control energy wastage in the industrial sector.


