1. Introduction
Amid a year of record-breaking high temperatures [
1], a month of worldwide climate change strikes [
2] and following the airing of a new advert thanking homeowners for allowing the installation of smart meters [
3], the UK government released a consultation report on the Smart Meter Rollout Programme [
4]. Approximately one third of the UK’s electrical energy consumption comes from the domestic sector [
5]. It equates to 17% of the UK’s 370 million tonnes of annual carbon dioxide emissions [
6]. The original aim of the Smart Meter Rollout was to install smart meters in 50 million households and small and medium-sized enterprises (SMEs) by 2020 [
7] to empower consumers to make informed decisions about consumption and to reduce the UK’s energy use and emissions. The new target date for the rollout has been put back from 2020 to 2024 [
4].
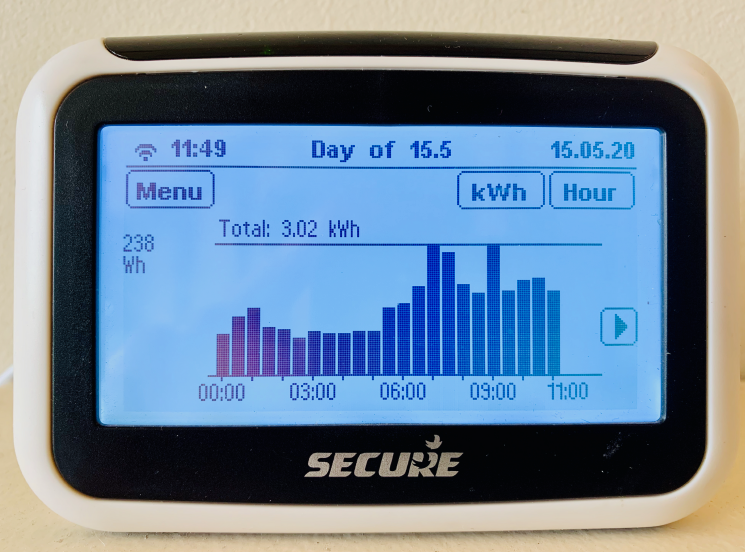
The main difference between traditional meters and smart meters is that smart meters can provide regular and accurate updates on consumers’ energy usage. The digital meter readings are sent over secure wireless networks automatically to the energy supplier regularly, so the consumers will receive accurate, not estimated bills. An in-home display is also provided with the smart meter as an energy feedback that shows the exact usage (in pounds and pence) in near real time. While past energy usage consumption research has suggested that direct energy feedback could result in reductions of up to 15% in energy consumption [
8], a recent UK Government report suggests that the actual value might be closer to 2% per household by 2050 [
4].
On the technology front, there are plenty of advances in smart metering and smart grids in general [
9,
10]. On the other hand, a significant body of research has been developed, starting from before the Rollout and continuing to this day, which debates the effectiveness of smart meters and energy feedback, as well as which methods can be best harnessed to reduce energy consumption. This paper aims to contribute to this conversation and inform future energy policy by reporting on a series of focus groups, where postgraduate consumers were asked to discuss their experiences and perceptions of smart meters and energy feedback tools. This study investigates not only domestic consumer use at home, but also how participants considered and acted on energy conservation at work, as well as the perception of energy reduction efforts by institutions and companies.
This paper provides multiple contributions to the topic, as well as reinforcing many of the findings from previous papers [
11,
12] with new evidence. New perspectives are offered on certain replicated results, while the role that institutions play in consumer energy consumption is discussed. Conducted almost a decade later than some of the original literature discussed, this research highlights what has changed in consumer perceptions and behaviour as the UK has moved from small scale pilot studies of smart meters and energy feedback, to nationwide deployment of millions of smart meters. The policy implications are discussed, and recommendations are posited.
The paper is organised as follows. Following a short review of relevant quantitative and qualitative background literature in
Section 2, our focus group research methodology is outlined in
Section 3.
Section 4 reports the findings from the focus groups and
Section 5 discusses the results.
Section 6 closes with conclusions and policy implications.
2. Background and Related Work
2.1. Quantitative Research
Halfway through the first decade of the new millennium, Darby [
8] compiled a thorough review of energy feedback methods for the UK Department for Environment, Food and Rural Affairs. This highly cited paper summarised the findings of a wide range of research and made the case for energy companies and governments to prioritise informing consumers, via direct and indirect feedback, to facilitate a reduction in energy consumption, ideally with the result of 10–15% less electrical consumption. Entering this decade, subsequent reviews supported Darby’s upper bound assessment [
13,
14], but significantly reduced the lower bounds to 5–15% savings. Ehrhardt-Martinez et al. [
15] continued this downward trend of predicated energy savings, reporting 5–10% savings.
A meta-review by Delmas et al. [
16] demonstrated the issues with these predicted ranges. In their paper, compiling all of the major feedback studies resulted in an average reduction of electrical consumption at around 10%, only slightly below Darby’s suggested lower bound. On the other hand, focusing on the robust studies that made use of controls and took into account external factors significantly affecting results, reduced the average energy savings to as low as 2%—the same as the prediction from the new Government report. Most, if not all, of the studies used in these reviews took place over a short period of time and so long-term savings from these energy feedback methods had not been investigated thoroughly. Several recent papers have sought to address this [
17,
18,
19] and their findings on
persistent electrical consumption reduction concur with the downward trend, with the average ranges falling within the bounds of 0–8% savings. The large body of quantitative results for direct energy feedback seem to suggest that there is still a gulf between the expectations and outcomes.
2.2. Qualitative Research
While quantitative research attempts to determine the benefits from scale implementations of energy feedback, qualitative research has investigated what effect these devices and techniques have at an individual level, what factors drive consumption and how to best harness energy feedback to reduce energy consumption.
Table 1 presents and contrasts the major findings as themes from different authors.
Hargreaves et al. [
11,
12] produced some of the first studies on these topics, interviewing UK householders after running an in-home display (IHD) pilot scheme at the turn of the decade. These studies provided the foundation for much of the understanding behind energy feedback through IHD use for preceding studies. A key point of these studies was the idea of the ‘invisible’ use of energy, that is to say that the normally habitual consumption of electricity, provides no direct feedback to users to highlight or make the consumer aware of this consumption. Energy feedback was considered a potential method of visualising this ‘invisible’ electricity consumption. In the studies, participants were asked questions relating to their motivations, use of the IHD, changes in behaviours and perceptions, and if they could suggest improvements for the IHD. As seen in
Table 1, some of the main findings were that financial motivations were the key driver of responding to energy feedback over environmental concerns. IHDs caused problems to participants as displayed energy units were not straightforward to understand and feedback required participants to actively carry out heuristic analysis of their consumption to identify problem areas. This prompted participants to create a ‘baseline’ of their energy consumption, the minimum amount of electricity consumers believed they had to use, and the IHDs acted as visual cues to reinforce this consumption behaviour.
Energy consumption reduction was mainly achieved through turning devices off. Energy efficiency strategies were employed less, and these mainly focused on replacing old lightbulbs with more efficient LED bulbs. Focusing on appliance efficiency was more difficult due to a lack of information. While engagement with energy feedback was high during installation and use of IHDs, as consumers became aware of their energy habits and ‘baseline’ use, IHDs moved into the background and were only re-engaged when changes in energy consumption were made or heuristic analysis of specific appliances was attempted.
An important highlighted element of feedback was the presentation of information in context. Participants discussed their energy use in household contexts, where, for example, there are essential appliances, but they cannot compare or analyse consumption without considering the context of these appliances and the nature of their home and household. The final point relates to the wider context of energy conservation. Participants reportedly felt unsupported by society and policy, that the burden was being shifted on to individual households rather than aiding consumers with these problems.
Subsequent research by [
20] focused more on consumer motivation and engagement with IHDs by comparing two groups of consumers, one group who had access to IHDs throughout a series of group sessions and diary reporting and another group who received their displays later into the study. While the first group engaged well with the IHDs and saw greater effect from the feedback, the second group engaged less well and reported similar critical findings to Hargreaves et al., as seen in
Table 1. The implication from this study is that motivated engagement is needed from consumers to make the best use of feedback. In this instance, it was achieved through the group meetings and diary taking that provided motivation for participants to engage.
Buchanan et al. released three papers between 2014 and 2016 investigating energy feedback and perceptions of energy feedback in the UK [
21,
22,
23]. The findings from these papers reinforced previous findings, as seen in
Table 1. There was also greater support for IHDs and energy feedback as methods of making energy consumption visible, in a physical sense, as a physical device that can be looked, in a financial sense, as a way of picturing the monetary cost of consumption, and in a conscious sense, creating a mental view of consumption to promote conservation actions.
The literature review [
22] highlighted the main barriers to engagement: disinterested consumers, problematic financial motivations, comprehension of feedback issues, what actions consumers are able to do to reduce consumption and how much they are willing to do to achieve reductions. Meanwhile, the last paper [
21] outlined consumers’ concerns of smart meters, and indirectly energy feedback, which mainly relate to the loss of control or privacy, mistrust of profit-driven energy suppliers and negative perceptions on how energy feedback could affect consumers’ lives. This research also demonstrated the need for energy feedback to fit consumers’ needs without requiring excessive effort or management to engage with. Communication between the public, government and energy suppliers is integral for consumer acceptance.
To try and counteract issues with engagement and promote consumption knowledge development and sharing, Burchell et al. [
24] investigated the use of ‘Smart Communities’, where energy feedback was shared and discussed amongst a community. Similar issues and challenges to previous research can be seen in
Table 1; however, Burchell’s study demonstrated that long-term behaviour changes can be achieved when consumers are working together to reduce consumption, when they are ‘part of something bigger’.
The final study relevant to this research was conducted by van den Broek and Walker to investigate the perceptions and drivers behind energy conservation and consumption reduction behaviours in young adults [
25].
Table 1 again shows where findings are similar; however, this research also highlighted the impact of behavioural norms observed from parents and peers that promote pro-environmental actions. While a lack of financial and environmental incentives from feedback suggested participants would struggle to change their behaviour, as has been the norm across previous studies, participants reported a strong sense of moral responsibility that urged them to reduce consumption but this was tempered by feelings of a lack of action by the ‘people in power’ and feelings of insignificance at being one among the sheer number of people consuming electricity. There were also concerns raised about lacking knowledge to make significant energy consumption reductions and that sufficient knowledge was needed to promote a feeling of control in consumers.
Building on the previous research discussed in this section, this study conducted a series of focus groups to investigate energy feedback perceptions and use as the original 2020 target of the Smart Meter Rollout approaches.
3. Methodology
With ethical permission, focus groups were conducted with postgraduate students from Keele University. This is in line with the previous research conducted by Hargreaves et al. [
11,
12], which used a qualitative data collection method (in their case individual interviews). The groups were chosen to support the exploration not only of what individual respondents had to say, but also to provide insights into the sources of complex behaviours and motivations enabled by participants both querying and explaining themselves to each other [
26,
27]. Postgraduates were selected as an available cohort with a cross section of ages and accommodations (from student housing to private room and house renting), a level of education that would imply awareness of energy issues and ability to understand IHDs, and as Keele University has a focus on environmental issues, a greater level of understanding and involvement with said issues.
3.1. Sample
Participants were directly recruited from postgraduate events and through mail lists and adverts. Fifteen participants were recruited, with an age range of 24–36 and an average age of 29. As participants were from a variety of accommodation types, they were asked about their control of the energy supply and bills: 40% had electricity included in their rent, 20% paid their bills directly but the supplier was selected by the landlord and 40% had full control of their bills and energy supplier. This selection allowed for a view of the perceptions from postgraduate students as they transitioned from having limited or no control of their energy supply and bills, to a situation where they have more involvement and greater control.
3.2. Focus Groups
Five focus groups were conducted with an average of three participants per group. Sessions lasted between 40 and 70 minutes with participant responses recorded via digital voice recorders. Discussions were based around five main questions: How do participants currently monitor their energy use and the tools available to them, how do participants make use of these tools to change their behaviours, what interest do participants have in the energy consumption of institutions, what steps do participants take to reduce their energy use outside the home (i.e., when at an institution) and participants’ thoughts on using their mobile phones as energy feedback devices. The laddering technique as described by Rugg and McGeorge [
28] was employed to break these questions down into smaller, more specific questions when needed to focus participant responses on the precise answers. A projective approach was also taken [
29], where participants were asked to give some answers in relation to how an individual might act on, or perceive, energy feedback. This allowed participants to discuss issues that they might feel are socially taboo, such as the reasons why they themselves are not doing more to reduce their consumption and environmental impact.
3.3. Grounded Theory
As with the original Hargreaves studies [
12], a broad Grounded Theory approach [
30] was taken in designing, conducting and analysing the focus groups. Apart from this approach, facilitating the focus group techniques discussed previously and generating insight on how perceptions have changed since the Hargreaves studies, inductive reasoning allows for gathering more evidence that may help to differentiate the energy consumption behaviour models currently put forward in the literature [
11,
25].
3.4. Ethical Approval
This research received ethical approval from Keele University’s Faculty of Natural Sciences Non-Psychology Research Ethics Committee, reference number: NS-190006|NSFI-0002.
4. Findings
Following a broad grounded theory approach to collect and analyse participant responses during the focus groups and the coding approach outlined by Charmaz [
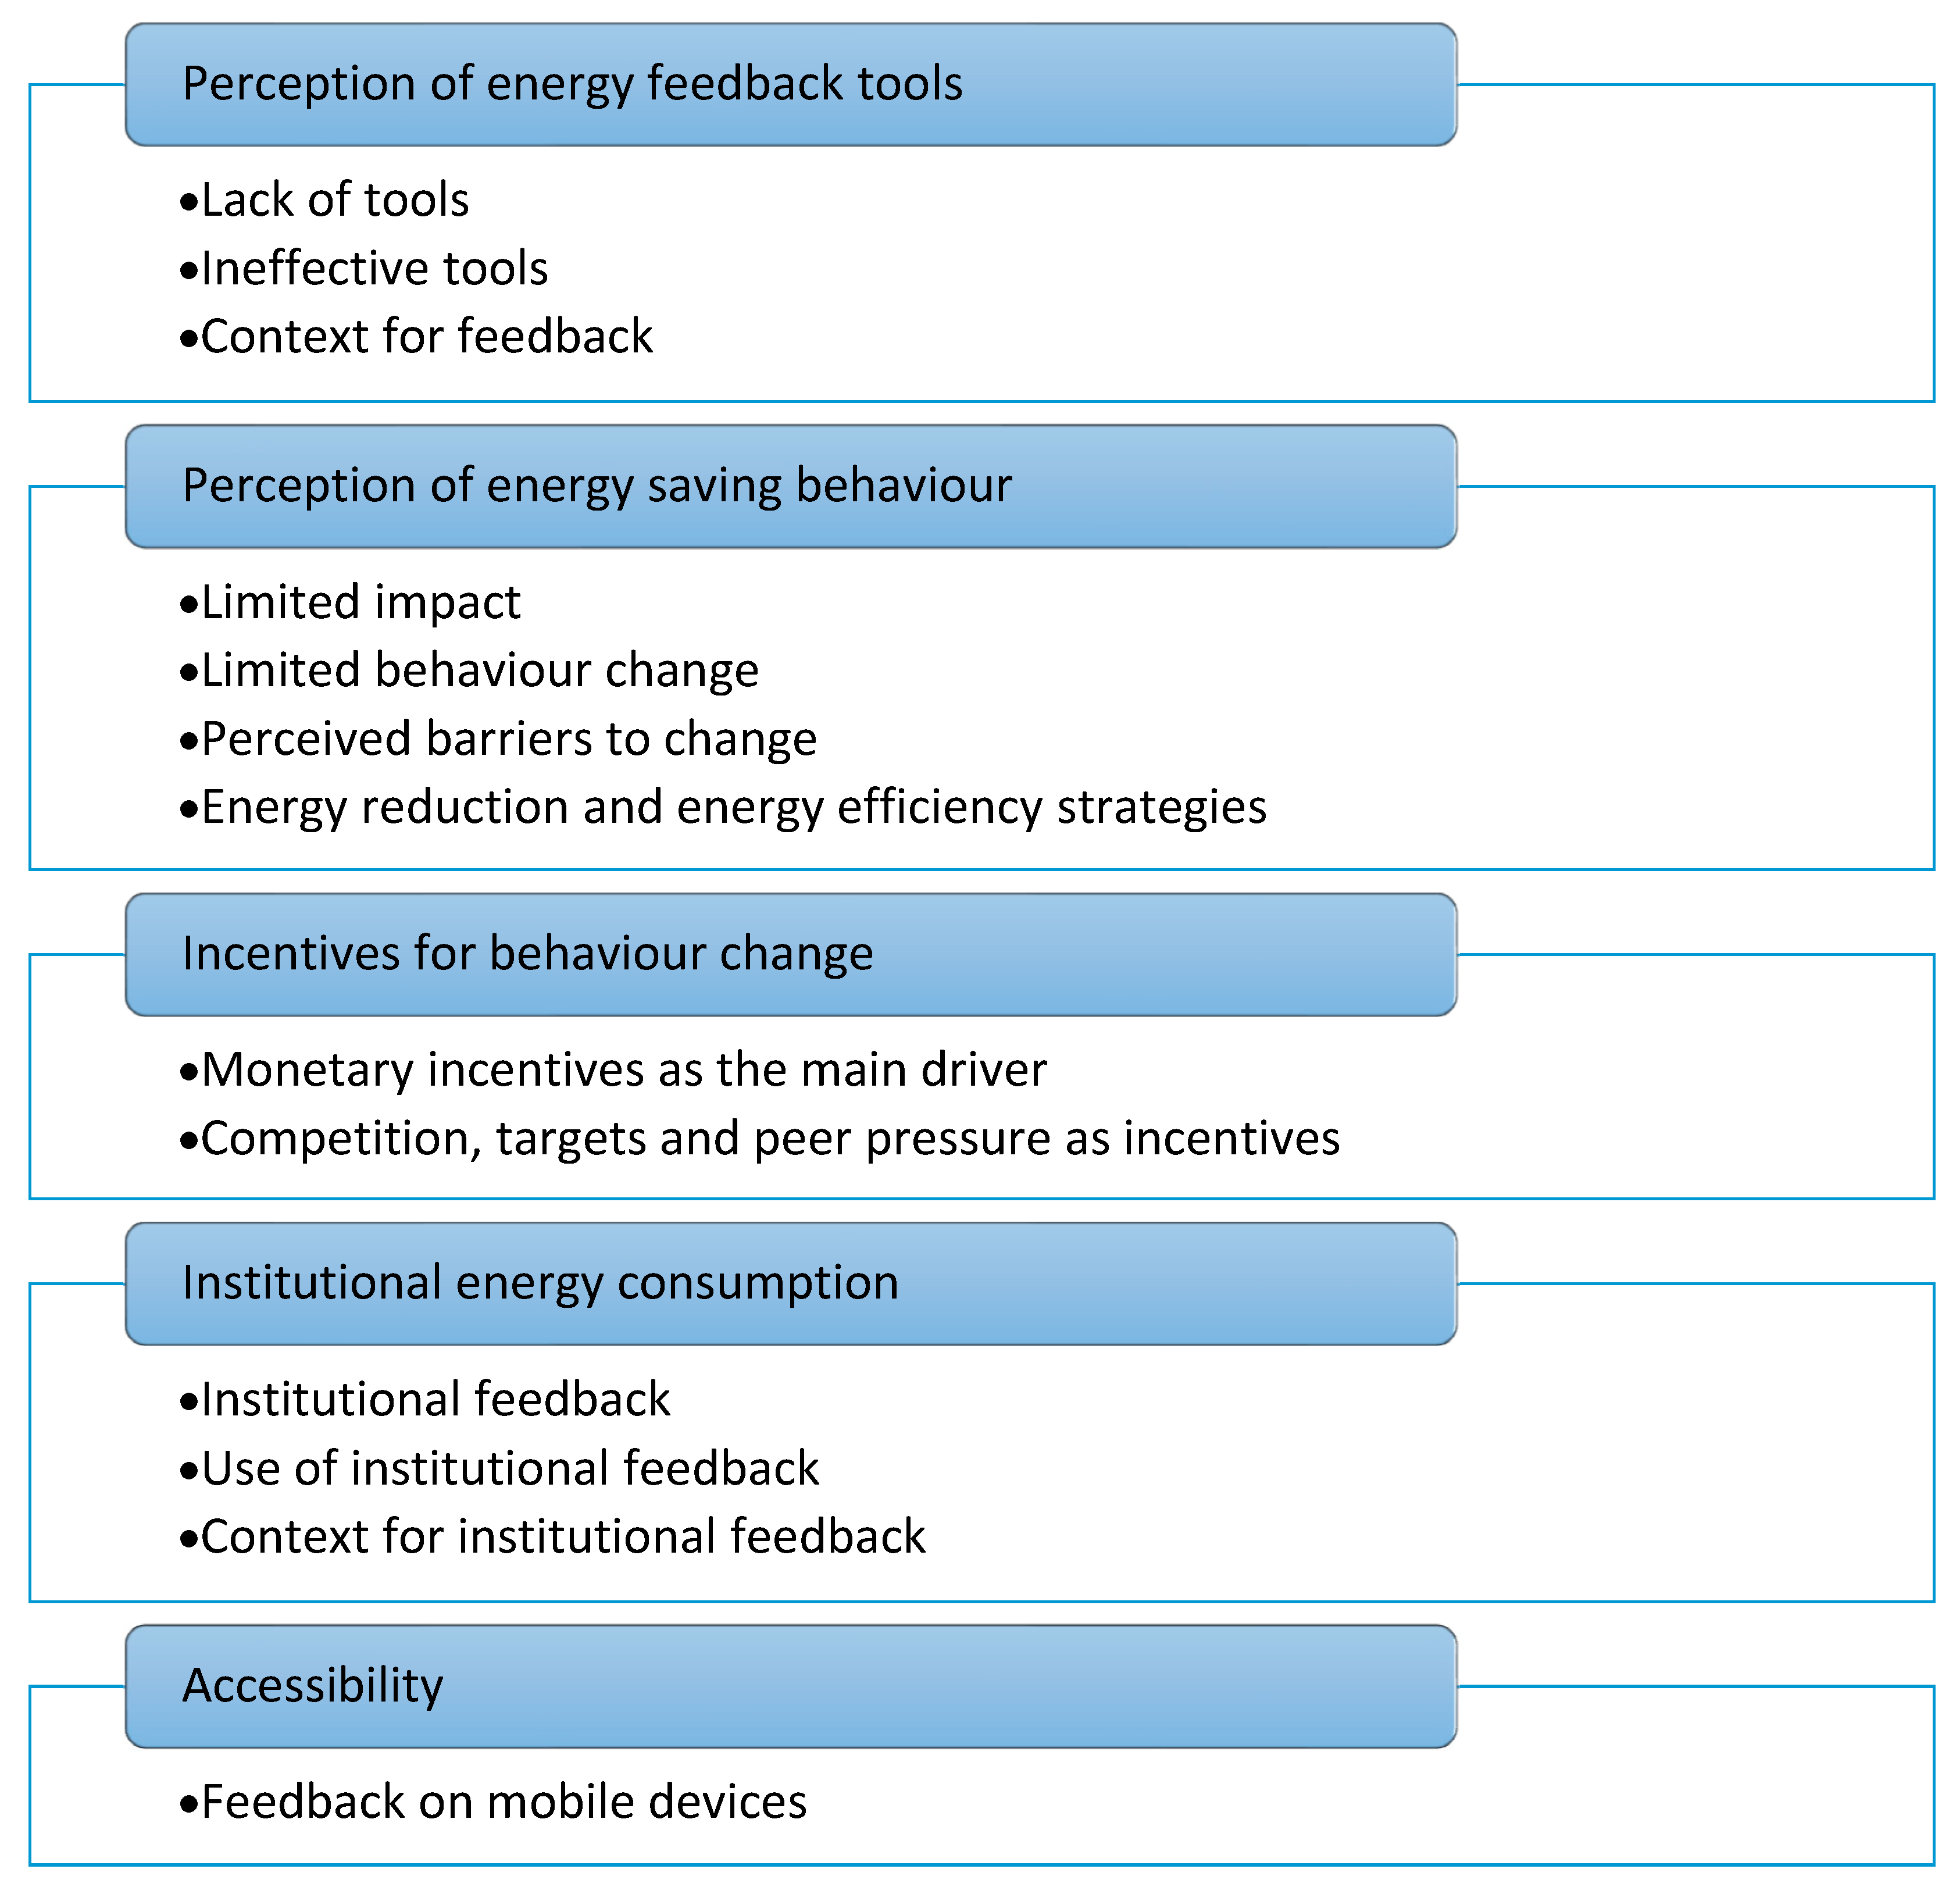
30], five main themes were identified, most broken up further into specific topics: perception of energy feedback tools, perception of energy saving behaviour, incentives for change, institutional energy consumption and accessibility.
Figure 1 summarises the five key energy feedback perception themes and sub-themes extracted from the coding of participant feedback.
4.1. Perception of Energy Feedback Tools
The first theme highlighted in the findings was related to the participants perceptions and experiences with energy feedback tools, this includes: smart meters, IHDs, feedback via billing, per-plug monitors and other smart home monitoring set ups.
4.1.1. Lack of Tools
Despite the Smart Meter Rollout, not all participants had access to smart meters or IHDs. In student style accommodation, where bills are included in the rent, no energy feedback was provided unless residents used their own equipment. Most participants received estimates of consumption with bills, but one participant used monthly meter readings to ensure accurate pricing as the estimates given by their provider fluctuated enormously.
As will be discussed again later, many of the per-plug socket sensors and smart home devices that can be used for energy monitoring were considered by participants to be too cost-prohibitive as well as posing security and reliability issues while being intrusive and difficult to set up. Less than half the participants had access to web-based feedback, either through a mobile application or a website, and less than a quarter discussed receiving additional energy consumption advice information in the form of digital or physical booklets.
4.1.2. Ineffective Tools
There was limited praise given to the energy feedback tools available to participants. The participant who took monthly meter readings was concerned about the accuracy and reliability of any smart meter installed to replace the current non-smart meter, and thus, refused to allow the meter to be changed.
A pair of the participants had swapped from a standard prepayment meter (where credit must be purchased for the device and payment is taken as electricity is provided, rather than at a later time) to a smart prepayment model. Whereas the standard meter showed the balance left on the account in real-time on the device, information for the smart version was viewed on an IHD or a mobile app but with a significant delay (regularly up to 12 hours long). This meant the participants were unaware of how much credit was left on the account at any specific moment and could not easily make any conscious decisions about energy consumption without running the risk of reducing the credit to nothing.
All of the energy feedback tools employed by participants were simply to make sure household consumption did not go over the expected amount on the next electricity bill, the ‘baseline’ average consumption. Participants commented on the usefulness of seeing historical monthly data on IHDs, because this allowed them to pinpoint what was causing them to go over their baseline electrical consumption. However, this required a heuristic analytical approach to the presented data for the participants to discover any relevant information, as the collected readings are presented in aggregate of the household, meaning participants required a decent awareness of the energy consumption within their household to identify any meaning within the readings. This was cause for much of the criticism for smart meters and IHDs, describing such devices as ‘not smart’ due to the lack of ‘straightforward’ feedback on energy consumption, no ability for the devices to highlight where electricity was being ‘wasted’ vs. what could be ‘saved’ and the lack of disaggregated appliance consumption data. There was also a common idea of using energy feedback as a driver for turning off unused lights: “we’ve got a smart meter, better start turning the lights off” and “he stomps around, turning off all the left on lights”.
One participant described their IHD as “face down on floor, because it was being annoying”, which highlighted a common response to the displays, simply ignoring them. Some participants had replaced their IHDs by switching to a mobile application to display feedback, though this was not a commonly available option to participants.
4.1.3. Context for Feedback
A common problem highlighted within the literature was the focus of some of the criticisms made by the participants: what does the feedback actually mean when it is presented in kWh? The units displayed in the feedback lacked a point of reference and participants had to again rely on heuristic approaches to be able to understand or use feedback. When the data is presented in a more understandable unit, £/time, there was a risk of the displayed values being so minimal and with limited reaction to changes (£00.03/s) that no useful information was displayed.
The aggregate nature of the feedback also meant participants could not easily determine high-consumption devices, especially if multiple devices are used in tandem. A participant commented that they “wouldn’t stop their kids playing on Xbox” just to conserve some electricity but if they could see that there was a significant impact from the children having so many devices on at once, they would intervene to ensure some of the devices were switched off. The limited and aggregate nature of the feedback, however, made it difficult to determine if any of the devices were particularly high consuming. Relying on only aggregate data, participants discussed how it would also be incredibly difficult to identify devices that should be the focus of future replacements so that more energy efficient devices could be used instead.
Some participants received additional feedback through billing or a web portal, which was presented as comparisons of their household energy consumption in relation to similar or nearby properties. Participants did not respond well to this feedback, pointing out that comparisons lacked enough context to be of any use. One participant highlighted how their flat had more bedrooms than nearby flats, so how could a reasonable comparison be made on electrical consumption between the properties when the participants had more people living in it and consuming power.
Generic advice included in billing or sent separately in booklet form was mocked by some participants because the advice was so generic as to be completely unhelpful. With everyone’s baseline consumption based on widely differing requirements, generic advice and comparisons lacked any useful information to feedback to participants.
4.2. Perception of Energy Saving Behaviour
The second theme consolidates participant responses related to their perceptions, knowledge and experiences of energy saving behaviours linked to energy feedback.
4.2.1. Limited Impact
One participant described smart meters as seemingly there to benefit energy companies in collecting data, rather than providing newer and better services to consumers. Participants also stated that they had not seen any evidence to suggest that reducing their energy consumption will have much of a positive impact on the environment and that, in fact, any reductions made would be entirely for a monetary incentive. Other ecological actions taken were believed to have a greater positive impact on the environment and that if there was any negative effect from not reducing their electrical consumption further, this would be offset by other environmentally friendly actions.
A consensus among many of the participants was that an energy conscious individual would have changed their behaviour to reduce their energy consumption without needing to make use of energy feedback. Although energy feedback could possibly facilitate these changed behaviours, it was not considered a driver of the changes. Participants also discussed that even without considering energy feedback, they made conscious decisions to replace devices with more efficient versions when the opportunity arose. The main example given was replacing old lightbulbs with significantly more energy efficient LED bulbs.
4.2.2. Limited Behaviour Change
While participants generally agreed that engaging with energy feedback had not resulted in the development of significant consumption reducing behaviours, some changes were discussed. A common behaviour was to use IHDs to make sure that devices had been turned off after use. Although this does not reduce a consumer’s baseline energy consumption, it would prevent some wasteful electrical usage. Participants were also more conscious of the electrical consumption of high-power devices and tried to avoid using such devices where possible.
The participants who had been using the prepayment meter suggested that their energy conscious behaviours had developed due to the actions necessary to maintain credit in the meter. While they did not feel that their IHD was able to help with developing new behaviours, they did use the device to more easily identify their baseline energy consumption.
One participant also proposed that individuals regularly make decisions about energy consuming actions without really considering consumption as a factor in the decision. An example would be choosing what to eat for dinner: a person would be unlikely to choose to eat a meal because it has the lowest energy consumption from their possible options.
4.2.3. Perceived Barriers to Change
Participants discussed the issues that could prevent people from adopting consumption reducing behaviours. There were several trains of thought that each focus group agreed on. One of the major barriers is considered simply to be a lack of incentive. This could be monetary incentives: the upfront costs are too high and the reward too low. There were even social incentives: this is a private matter for most people, and there is no pressure from friends, family or neighbours. As energy feedback is generally focused upon one’s own household, it could appear to be a personal sacrifice that no-one else is undertaking. It may simply be that saving energy is not a priority, that a person’s perception of their baseline consumption is as much as they need to consume. As mentioned in the societal impact topic, the individual may think alternative energy saving strategies are more beneficial and would rather expend their effort on a different strategy such as installing solar panels.
As well as discussing what potential barriers exist for behaviour in a residential setting, this theme covers the discussion for what barriers prevent individuals from changing their energy consumption behaviours in an institutional or work setting. Just as with the previous discussion, it may simply be that the individual does not consider changing their behaviour a priority, or they are disconnected from the institution. The individual may even feel they are not significant enough to make an impact at an institutional level.
4.2.4. Energy Reduction and Energy Efficiency Strategies
Participants were asked to discuss the actions they take while at work, in an institutional setting, to reduce energy consumption, either through curtailment of use or engaging energy efficiency strategies. Curtailment was the main approach to curbing consumption through turning lights off when leaving a room, making sure all standby equipment, heating and unused devices are switched off when not needed. One participant commented “not a lot you can do” as an individual other than this but there was acknowledgement by several participants that it is not their responsibility to.
In regard to efficiency strategies for individuals at work, participants examples were mostly limited to efficient use of computers. Suggestions for strategies an institution could employ were more numerous, however, such as using automated smart lighting and heating based on occupancy so as not to waste either and improving buildings by means of, for example, installing new insulation—participants also suggested running charity events to raise money for building works. It was acknowledged that the cost of installing double glazing on an old building likely dwarfed any potential savings, as perhaps improving infrastructure to promote new energy efficient technologies, such as electric vehicles.
Some social approaches were also suggested by participants, namely running energy saving competitions within the institution. These could be between departments, buildings, labs and/or offices. Rewarding energy saving behaviours with positive reinforcement, such as payment on the institution’s card system, was highly regarded by participants.
Participants also suggested that students at the institution would be unlikely to make conscious energy decisions, assumingly due to the lack of energy feedback and incentives available, and that this can be seen in the early evening, before it gets dark, when “pretty much every single accommodation room is lit up like a Christmas Tree”.
4.3. Incentives for Behaviour Change
The third theme covers participants’ responses related to incentivising energy consumption reducing behaviours and habits: what personally works to drive their behaviour and what they suggest might be effective in an institutional setting.
4.3.1. Monetary Incentives as the Main Driver
Financial incentives being the main driver for behavioural change was a common theme discussed in each of these focus groups and every participant agreed that it was the most likely incentive to promote a person to action. Similar examples from other conservationist goals were stated as proof of it working in other areas, these being having to pay for single use plastic bags and disposable coffee cups if you have not brought your own.
The participants who had experience of living with a limited pre-paid meter recalled how their energy consuming behaviours had to be made consciously and with aforethought to ensure they did not spend too much on electricity. With both these experiences and money saved from reducing electrical consumption, it results in a reduction of expenditure, although not so much a direct rewarding incentive.
Using money as the main incentive for driving change will likely be difficult in a number of cases. Upfront costs of some energy feedback technologies or energy efficiency strategies can significantly dwarf the amount possibly saved in reduced electrical consumption. This also would not act as an incentive for those who are not directly paying the electricity bills. Participants with included bills had no interest in reducing their energy use based on costs and in an institutional setting, the cost of electricity consumption was not even considered.
In every focus group, it was agreed that it was difficult to relate the energy feedback from IHDs to actual monetary costs with some participants voicing irritation at not being able to easily find out the current cost metrics of their electricity use from IHDs. It was unanimously agreed that it should be simpler to determine costs from IHDs and energy feedback.
4.3.2. Competition, Targets and Peer Pressure as Incentives
Some participants felt that incentives based on competition, targets and peer pressure would be more likely to result in them changing behaviours. “If it was just me looking at my own data, I don’t think I’d particularly care”. One participant suggested that if they lived in a neighbourhood where everyone was visibly taking steps to reduce their consumption or increase their electrical efficiency, they would do the same, a “Keeping up with the Joneses attitude…”.
Using energy feedback to reduce consumption was considered an almost endless goal, with there not currently being much emphasis on setting reasonable objectives, similar to S.M.A.R.T (specific, measurable, attainable, realistic, time-bound) targets or making use of budgeting targets, as in modern mobile banking apps.
As discussed earlier, comparing the energy uses of different homes was not well received by participants as there were too many differences to draw any real conclusions from the comparison. This would make competitions for residential energy use more difficult; however, participants were very positive about energy competitions between institutions. “Every institution should have an energy challenge”, one participant suggested, where institutions would be given competitive ratings and certificates based on their approach to energy consumption and environmental conservation. Participants agreed they would not want to attend an institute that received a poor energy rating.
The student dorms NUS competition was briefly discussed but participants were quick to say that it was not well advertised or particularly engaging.
4.4. Institutional Energy Consumption
The fourth theme highlights participants’ perceptions of the energy consumption of their workplace -institution, what they would like from institutes they attend or visit and how they would make use of the information provided.
4.4.1. Institutional Feedback
Participants were asked to discuss whether they had any interest in how institutions are consuming electricity and the actions being undertaken to reduce consumption. Most participants showed interest in learning more about institutions’ energy consumption and provided several reasons why: to confirm these institutions are making the changes that they claim and that it is not merely for improved public relations, so that the released data can demonstrate they are making positive contributions to society and the environment, to view the impact from conservation activities on a larger scale than a single household can achieve and demonstrate this to the public and finally to see how institutions they attend compare to others: are they wasteful or ahead of the curve.
Comparisons were heavily discussed by participants and much interest was shown in being able to view differences between institutions, as well as the effects of different energy efficiency strategies and improvements on institutions, how new buildings compare to old in energy savings and how different facilities compare, such as computer labs against chemistry labs. One participant suggested “It wouldn’t have a negative impact” to be able to see institutional energy consumption and further discussions highlighted that this information could provide a ‘nudge’ to people who may be undecided about energy feedback and conservation.
There were also participant suggestions that government facilities should be more transparent about their energy consumption and reduction efforts.
4.4.2. Use of Institutional Feedback
While discussing energy feedback and consumption at institutions, several reasons for why participants would want accessible feedback about an institution were highlighted. A major reason was to facilitate decision making on which institutes to attend. Participants generally wanted to be involved with organisations that were pushing to improve their environmental impact and could demonstrate the effects of their efforts. This can be seen earlier when participants discussed competition as a motivation: the suggestion that all institutes, organisations and businesses should display competitive energy certificates based on what actions they have taken to reduce their negative environmental impact.
Participants were also interested in being able to view feedback from institutions as a learning experience, to see how effective certain technologies and techniques are, with the possibility of using this information in the application to their home energy consumption. There were also significant social suggestions, such as being able to highlight and discuss with others the positive and negative effects of institutions’ energy related actions. This would not only act as a way of disseminating energy feedback further, but would provide people with evidence to build cases to promote institutions into taking greater environmentally friendly actions. There was also some discussion about having direct access to the data behind the energy feedback, using this for analysis and aiding in smart energy research.
Another use for institutional feedback discussed was that it could allow individuals to determine what environmental impact they are personally having as part of the organisation. Although participants suggested this may prompt them to be more conscious of their energy consumption at work, other responses were that it would be mainly for curiosity and likely lose interest after a week: “wouldn’t look at it but might turn a light off”.
4.4.3. Context for Institutional Feedback
Similar to household energy feedback, participants discussed the importance of ensuring institutional feedback is viewed in the correct context. Comparing different households’ energy consumption was viewed as problematic due to the range of variables not taken into account, and this problem was considered the same for institutions. A common example was trying to effectively compare a high population institution with a rapidly changing populace to a significantly smaller one that maintains the same people. Participants stressed that this feedback had to be displayed in an understandable and contextual manner; otherwise, rather than informing people’s decisions, it would result in action being taken on incorrect information. The high population vs. low population institution was used as an example again here, where individuals could mistake the reasoning behind the differences in energy consumption and would choose the low population institution because of the lower impact, only for the consumption load to be shifted from the high to the low as the population moves from one to the other. Another similar example of this load shifting causing problems without context was suggested as students charging their devices on campus rather than in their dorm or home, shifting the burden of consumption.
Due to the difficulties in effectively contextualising energy feedback to be easily compared between locations, participants suggested that the main comparisons should be focused on changes over time internally, focusing on demonstrating improvements being made to bring down consumption over time rather than already being lower than other locations.
4.5. Accessibility
The final theme relates to the ease and availability of accessing energy feedback. Only one topic is discussed here, using general mobile devices for feedback over tools such as IHDs.
Feedback on Mobile Devices
Participants were asked if they would prefer to be able to access their energy feedback and consumption data on their mobile devices and the response was unanimously positive. Being able to view feedback and monitoring at any time and in any place, when going to bed as a prime example, was considered highly beneficial over the semi-static location currently afforded by IHDs. Freedom in accessing feedback was perceived as more in line with how participants made us of feedback, checking consumption when the thought occurs for a particular reason—“did I turn the TV off”—instead of having to move to the IHD. The few participants who already had access to energy feedback via a mobile app reported they had used the energy feedback more from the app than IHDs. Participants suggested that mobile access would be more ‘friendly’ and would have greater accessibility than IHDs, assumingly as participants with accessibility needs could make use of tools on their mobile devices to interact with energy feedback in a manner not currently supported by IHDs, and that push “notifications would be very beneficial” for keeping to consumption targets.
When discussing institutions, being able to access feedback on mobile devices was predicted to be highly useful. As well as being able to easily investigate an institution’s energy consumption before visiting, which could factor in to whether to visit the institution or go elsewhere, mobile access would allow easing sharing and promoting of information from energy feedback. This could be used to easily spread evidence on the benefits of certain techniques and technologies, as well as highlight where improvements need to be made to a wider audience.
A major caveat discussed by participants, however, although this is not unique to mobile devices, is that they desire for more ‘smart’ energy feedback tools and greater consumption information than what is currently being provided by IHDs. Participants emphasised several elements that they wanted to see in future feedback, especially mobile feedback, which included feedback that highlighted which appliances were high consumption or likely wasting electricity due to inefficiency and should ideally be replaced with a greater efficiency model, identify when appliances have been left turned on or are on standby/idle, provide greater context and further information to consumers and, most importantly, reduce the current heuristic effort and time consumption needed to effectively make use of energy feedback.
5. Discussion
A key component of research into energy feedback was the idea that IHDs and energy feedback provide a layer of visibility to the ‘invisible’ use of electricity [
11,
12,
23], that consumers can visualise their energy use in a way that promotes control and reduction of consumption. The downward trend in estimates of consumption reductions based on energy feedback highlighted in the literature, the predictions made in the recently published Government report, and the findings in this study, build an argument that energy feedback is in fact failing to prompt consumers to visualise electrical consumption in a sufficiently effective way. A persistent aspect throughout all the energy-reducing focus groups discussions of this study was the focus on turning off lights (“wouldn’t look at it but might turn a light off”, “he stomps around, turning off all the left on lights” etc.), and even when turning off equipment, the emphasis was on ensuring the ‘little lights’ were turned off. Even when discussing energy efficiency strategies, participants’ first suggestions were related to installing automatic lights. Despite lighting consuming some of the least energy of home appliances [
31], participants’ immediate thoughts of consumption focus on lights and lighting—the ‘visible’ element of energy use. Energy feedback needs visualizations that encourage a shift in consumers’ perspectives toward significant, but less ‘visible’, energy consumptions. Ideally, feedback should engender emotive responses that motivate positive energy reducing behaviours [
32].
Table 2 compares and contrasts the focus group findings with the findings from the literature. It is important to note, however, that many of these findings are from the beginning of the decade. As the UK has progressed from a few thousand smart meter installations in pilot studies to almost 15 million meters installed across household and SMEs, the experience, perception and behaviour of consumers related to energy feedback does not appear to have changed much. Even many of the complaints about IHDs and similar energy feedback tools have not altered since the initial IHD feedback papers. This suggests that the current implementations of energy feedback and feedback tools have not been built upon the foundations of early research and have failed to implement the suggestions published by more recent papers.
Some of the key findings of this study are where new perceptions can be offered on previous findings. While this paper concurs with the previous literature that environmental concerns are not a key driver of reducing energy consumption, these findings demonstrate that it is not a lack of interest in environmental conservation behind this, but the perception that reducing energy consumption has a limited to non-existent impact on the environment. In fact, participants were actively embracing other conservation behaviours. Although the consensus is that monetary factors are the key driving force behind reducing energy consumption, it should be noted that saving money, especially the predicted minor savings from energy feedback as of the new Government report, has a lesser effect than being rewarded. Participants responded well to the idea of gamification and positive reinforcement for reducing consumption.
The participants for this study were all postgraduate researchers, and this population represents quite a transitionary period, as many are moving from living in standard student accommodation to private rentals or ownership. Their responses in these focus groups highlight important issues with how this affects energy feedback. Previous literature highlighted the need for social norms and motivated engagement for conservation behaviours and energy feedback to be effective. Moving from an environment of no energy feedback into a household with limited feedback does not provide an inducive setting for developing energy saving behaviours. Both previous research and the results in this paper highlighted that the effective heuristic analytical strategies that consumers need to conduct to make best use of energy feedback and prompt consumption reduction behaviours are time consuming, and with limited motivations to drive these actions, it is unlikely most consumers will undertake them. Earlier engagement with energy feedback, however, may improve long-term prospects.
A unique aspect of this study was to investigate perceptions of home and institutional, or work, energy consumption together. Previous research has highlighted how community involvement and driven engagement are more likely to promote energy saving behaviours, and this appears to be supported by findings in this paper. Despite the perception of disconnect between the participants and their institution, which some suggested would lead to apathy about consuming energy on campus, all participants tried to maintain a standard of not wasting electricity through leaving devices or lights on. When discussing incentives for driving energy conservation behaviours, participants suggested peer and community pressure would act as a driver in this instance, along with the discussions prompting institutions to be more transparent about their energy reduction activities, which promotes the use of institutes and workplaces as community drivers for these behaviours. Participant responses demonstrated a high level of interest in institutional openness about their energy policies: this was both for personal reasons of promoting individuals’ choices and public reasons for driving discourse and energy saving behaviours. Our results suggest consumers are more than willing to become further involved with energy saving behaviours and activities, but they require institutes and organisations to demonstrate the same willingness and lead the behaviour changes from a top-down approach. By changing consumers behaviours and perceptions outside the home, this will likely carry over to their home life too.
While energy feedback is currently mainly accessed through IHDs and billing, consumers want more freedom in how they access and use their energy data. Participants responded more positively to the idea of accessing their information via mobile devices than continuing with IHDs. Allowing consumers to access their data more readily provides them the opportunity to engage with energy feedback on their terms and how they want to. Web-based energy feedback would be accessible to consumers on their phones and computers, while allowing energy suppliers to provide new solutions to highlighted problems with energy feedback in IHDs. Push notifications and in-app messaging could provide updates and warnings on energy consumption, while being able to reach more consumers directly would allow for the dissemination of efficiency strategies and prompt continued engagement with energy feedback. A web-based solution would also allow those with accessibility needs to engage with energy feedback using accessibility tools, and currently IHDs would need to be specifically designed to specific needs.
6. Conclusions and Policy Implications
Addressing the title of this paper, since the introduction of IHDs as a method of providing ‘visibility’ to ‘invisible’ energy consumption at the beginning of the decade, little appears to have changed in the ‘visibility’, perception and experiences of energy feedback, IHDs and smart meters. Despite the significant investment in infrastructure and installation of devices, there has been little change in consumer energy behaviours. Regarding energy consumption visibility, suppliers need to be pushed to embrace greater visualisations of consumption to promote emotive connections forming and facilitate easier behaviour changes. Energy saving tools and feedback need to be introduced to consumers earlier to improve chances of engagement and developing energy conscious behaviours.
The consensus from previous research and these findings is that consumers are incentive-driven and that, currently, there is a lack of adequate incentives to prompt energy reduction. Although finances are the driving force behind reduced consumption, saving money does not have the same effect and response as receiving money or prizes. Where possible, positive reinforcement should be the standard for rewarding consumers, either directly with monetary gains, or through some method of gamification that can be used in tandem with targets and competitive incentives.
Policy makers need to direct energy suppliers to produce web-based billing and feedback methods. These should be the norm to allow consumers freedom of access and use of accessibility tools that they would lack without specialist energy feedback devices. Newer IHDs could be web-based devices so that they can still be used for energy feedback. This approach allows energy suppliers to promote engagement and education by sending additional information to consumers through these web portals. Energy efficiency strategies need to be communicated to consumers, as reduction actions outside of energy curtailment are largely unknown. On the other hand, for those customers that are not technologically literate (e.g., those without access to a smart phone and readily available Internet access), traditional paper-based communication method should still be used.
Promoting energy feedback needs a top-down approach. Consumers cannot be given the burden of reducing energy consumption if effective change is sought. Institutions, companies and the government need to win trust and demonstrate benefits and positive impacts of energy reduction. Only once this is achieved will consumers be more willing to engage with consumption-reducing behaviours. A new platform for viewing and disseminating energy feedback should be established so that the public can easily see and make sense of energy consumption reduction strategies. This needs to demonstrate the benefits of everyone saving energy together. Institutions, organisations and the government need to promote a community spirit of focus on conservation efforts to shift the perceptions and behaviours of individual and household consumers.
The focus group participants in this study can be argued as not being representative of the wider British population and one of the expected recommendations for future studies could be that a varied population would provide a more realistic feedback. However, the fact that there is a large overlap in the attitudes, concerns and behaviours highlighted in the findings compared to previous papers, suggests that the results are characteristic of the British public and that more work needs to be done to address issues that in energy feedback and consumption that have lingered throughout the decade. More research is needed into effective energy feedback for consumers. Future research should be conducted with the involvement of institutions, companies and governments to overcome the barriers to energy-reducing behaviours. In addition, effective and visible actions are needed to evidence the impacts of working together to reduce energy consumption and reduce environmental damage.
Author Contributions
Conceptualization, D.F.; methodology, D.F., Z.F., S.W., E.d.Q.; validation, D.F.; formal analysis, D.F.; investigation, D.F., Z.F., S.W., E.d.Q.; data curation, D.F.; writing—original draft preparation, D.F.; writing—review & editing, Z.F., S.W., E.d.Q.; visualization, D.F., S.W.; supervision, Z.F., S.W.; project administration, Z.F.; funding acquisition, Z.F., M.S. All authors have read and agreed to the published version of the manuscript.
Funding
This work is partly supported by the SEND project (grant ref. 32R16P00706) funded by ERDF and BEIS. The work of D. Fredericks is in part supported by Connexica.
Conflicts of Interest
The authors declare no conflict of interest.
References
- Copernicus. Another Exceptional Month for Global Average Temperatures. 2019. Available online: https://climate.copernicus.eu/another-exceptional-month-global-average-temperatures (accessed on 9 September 2019).
- BBC. As It Happened: Climate Strike Protests Sweep around the World. 2019. Available online: https://www.bbc.co.uk/news/live/world-49753710 (accessed on 23 September 2019).
- Smart Energy (GB). 30″ TV Advert. August 2019. Available online: https://www.smartenergygb.org/en/-/media/SmartEnergy/website-terms-and-conditions/ad-claims/thank-you-tv-advert.ashx?la=en&hash=9EE18C3EB83F87AD1E7BDA54A152E7459D02CFEC (accessed on 15 May 2020).
- BEIS. Delivering a Smart System: Consultation on a Smart Meter Policy Framework Post 2020; BEIS: London, UK, 2019. [Google Scholar]
- BEIS. Provisional UK Greenhouse Gas Emissions National Statistics 2017; Department for Business, Energy & Industrial Strategy: London, UK, 2018. [Google Scholar]
- BEIS. Digest of UK Energy Statistics (DUKES) 2018: Main Report; Department for Business, Energy & Industrial Strategy: London, UK, 2018. [Google Scholar]
- BEIS. Smart Meters Quarterly Report to end June 2018; Department for Business, Energy & Industrial Strategy: London, UK, 2018. [Google Scholar]
- Darby, S. The Effectiveness of Feedback on Energy Consumption (Literature Review); Environmental Change Institute, University of Oxford: Oxford, UK, 2006. [Google Scholar]
- Cano-Ortega, A.; Sanchez-Sutil, F.; Hernandez, J. Power Factor Compensation Using Teaching Learning Based Optimization and Monitoring System by Cloud Data Logger. Sensors 2019, 19, 2172. [Google Scholar] [CrossRef] [PubMed]
- Sanchez-Sutil, F.; Cano-Ortega, A.; Hernandez, J.; Rus-Casas, C. Development and Calibration of an Open Source, Low-Cost Power Smart Meter Prototype for PV Household-Prosumers. Electronics 2019, 8, 878. [Google Scholar] [CrossRef]
- Hargreaves, T.; Nye, M.; Burgess, J. Keeping energy visible? Exploring how householders interact with feedback from smart energy monitors in the longer term. Energy Policy 2013, 52, 126–134. [Google Scholar] [CrossRef]
- Hargreaves, T.; Nye, M.; Burgess, J. Making energy visible: A qualitative field study of how householders interact with feedback from smart energy monitors. Energy Policy 2010, 38, 6111–6119. [Google Scholar] [CrossRef]
- Faruqui, A.; Sergici, S.; Sharif, A. The impact of informational feedback on energy consumption—A survey of the experimental evidence. Energy 2010, 35, 1598–1608. [Google Scholar] [CrossRef]
- Stromback, J.; Dromacque, C.; Yassin, M.H. The Potential of Smart Meter Enabled Programs to Increase Energy and Systems Efficiency: A Mass Pilot Comparison, Short Name: Empower Demand; ESMIG: Brussels, Belgium, 2011. [Google Scholar]
- Ehrhardt-Martinez, K. A Comparison of Feedback-Induced Behaviors from Monthly Energy Reports, Online Feedback, and In-home Displays. ACEEE Summer Study on Energy Efficiency in Buildings. 2012. Available online: https://www.semanticscholar.org/paper/A-Comparison-of-Feedback-Induced-Behaviors-from-and-Ehrhardt-Martinez/e1ec211714952d19254116664725421755141a4c (accessed on 15 May 2020).
- Delmas, M.A.; Fischlein, M.; Asensio, O.I. Information strategies and energy conservation behavior: A meta-analysis of experimental studies from 1975 to 2012. Energy Policy 2013, 61, 729–739. [Google Scholar] [CrossRef]
- Tedenvall, M.; Mundaca, L. Behaviour, context and electricity use: Exploring the effects of real- time feedback in the Swedish residential sector. In Proceedings of the 39th IAEE International Conference on Energy: Expectations and Uncertainty, Bergen, Norway, 19 June–22 September 2016. [Google Scholar]
- Schleich, J.; Faure, C.; Klobasa, M. Persistence of the effects of providing feedback alongside smart metering devices on household electricity demand. Energy Policy 2017, 107, 225–233. [Google Scholar] [CrossRef]
- Wemyss, D.; Cellina, F.; Lobsiger-Kägi, E.; De Luca, V.; Castri, R. Does it last? Long-term impacts of an app-based behavior change intervention on household electricity savings in Switzerland. Energy Res. Soc. Sci. 2019, 47, 16–27. [Google Scholar] [CrossRef]
- Oltra, C.; Boso, À.; Espluga, J.; Prades, A. A qualitative study of users’ engagement with real-time feedback from in-house energy consumption displays. Energy Policy 2013, 61, 788–792. [Google Scholar] [CrossRef]
- Buchanan, K.; Banks, N.; Preston, I.; Russo, R. The British public’s perception of the UK smart metering initiative: Threats and opportunities. Energy Policy 2016, 91, 87–97. [Google Scholar] [CrossRef]
- Buchanan, K.; Russo, R.; Anderson, B. The question of energy reduction: The problem(s) with feedback. Energy Policy 2015, 77, 89–96. [Google Scholar] [CrossRef]
- Buchanan, K.; Russo, R.; Anderson, B. Feeding back about eco-feedback: How do consumers use and respond to energy monitors? Energy Policy 2014, 73, 138–146. [Google Scholar] [CrossRef]
- Burchell, K.; Rettie, R.; Roberts, T.C. Householder engagement with energy consumption feedback: The role of community action and communications. Energy Policy 2016, 88, 178–186. [Google Scholar] [CrossRef]
- Broek, K.L.V.D.; Walker, I. Exploring the perceptions of drivers of energy behaviour. Energy Policy 2019, 129, 1297–1305. [Google Scholar] [CrossRef]
- Morgan, D.L. Focus Groups. Annu. Rev. Sociol. 1996, 22, 129–152. [Google Scholar] [CrossRef]
- Morgan, D.L.; Krueger, R.A. When to Use Focus Groups and Why. In Successful Focus Groups: Advancing the State of the Art; Morgan, D.L., Ed.; SAGE Publications: Southend Oaks, CA, USA, 2014; Volume 156, pp. 3–19. [Google Scholar]
- Rugg, G.; McGeorge, P. Laddering. Expert Syst. 1995, 12, 339–346. [Google Scholar] [CrossRef]
- Rugg, G.; Petre, M. A Gentle Guide to Research Methods; Open University Press: Maidenhead, UK, 2006. [Google Scholar]
- Charmaz, K. Constructing Grounded Theory: A Practical Guide through Qualitative Analysis; Sage: Los Angeles, CA, USA, 2006. [Google Scholar]
- Krishnamurti, T.; Davis, A.L.; Wong-Parodi, G.; Wang, J.; Canfield, C. Creating an in-home display: Experimental evidence and guidelines for design. Appl. Energy 2013, 108, 448–458. [Google Scholar] [CrossRef]
- Fredericks, A.D.; Fan, Z.; I Woolley, S. Visualising the Invisible: Augmented Reality and Virtual Reality as Persuasive Technologies for Energy Feedback. In Proceedings of the 2019 IEEE SmartWorld, Ubiquitous Intelligence & Computing, Advanced & Trusted Computing, Scalable Computing & Communications, Cloud & Big Data Computing, Internet of People and Smart City Innovation (SmartWorld/SCALCOM/UIC/ATC/CBDCom/IOP/SCI), Leicester, UK, 19–23 August 2019; pp. 1209–1212. [Google Scholar]
© 2020 by the authors. Licensee MDPI, Basel, Switzerland. This article is an open access article distributed under the terms and conditions of the Creative Commons Attribution (CC BY) license (http://creativecommons.org/licenses/by/4.0/).


