Article

Measurements and Simulation Study of Daylight Availability and Its Impact on the Heating, Cooling and Lighting Energy Demand in an Educational Building

Division of Air Conditioning and Heating, Faculty of Building Services, Hydro and Environmental Engineering, Warsaw University of Technology, Nowowiejska 20, 00-653 Warsaw, Poland
*
Author to whom correspondence should be addressed.
Energies 2020, 13(10), 2555; https://doi.org/10.3390/en13102555
Submission received: 22 April 2020 / Revised: 6 May 2020 / Accepted: 14 May 2020 / Published: 18 May 2020
(This article belongs to the Special Issue Building Energy Performance Measurement and Analysis)

Abstract

:
This paper deals with the impact of the use of daylight on the overall energy demand for heating, cooling, and lighting in educational buildings. The energy performance of buildings is currently of the utmost importance as current European regulations, starting from 31st December 2020 impose that all new buildings must meet nearly zero-energy building requirements. This paper presents a study of the illuminance distribution in an educational room obtained from measurements and simulation results using two different models. One of the models, integrated with a thermal simulation software, was used to estimate the impact of daylight on the energy demand. The analysis included the use of various window types, lighting control system, reference point location, and daylight calculation model for a sample room in an educational building. Results of the analysis indicate that, due to the high share of lighting demand (reaching up to 78% of the primary energy balance), there is a need to take into account the efficiency of lighting systems during the design process to correctly determine the actual energy balance of a building, increase the quality of the design of lighting systems, as well as to select the optimal parameters of windows.

1. Introduction

European regulations such as the energy performance of buildings directive impose demands on the construction industry and investors [1]. Both buildings as a whole, as well as building elements that significantly impact the energy performance of the building, should meet cost-optimal levels of energy performance.
For years, regulations on the energy efficiency of buildings have focused on the heating and cooling demand of buildings [2,3,4,5,6]. This is due to the fact that almost 50% of the EU’s final energy consumption is used for heating and cooling, of which 80% is used in buildings [7]. However, not all building components are responsible only for heating or cooling demand. In case of windows, heat loss and gains are only a part of the actual energy balance as the use of daylighting can significantly reduce the energy demand for artificial lighting.
Considering the energy use for heating, cooling, and lighting purposes the share of final energy consumption for lighting in the EU is around 7% for residential buildings and nearly 16% for non-residential buildings [8]. For comparison, the final energy demand for cooling is lower and amounts to 2.1% for residential buildings and 5.4% for non-residential buildings. As properties of windows simultaneously affect heating, cooling, and lighting demands, windows constitute an extremally important component of buildings.
Although many studies focused only on the influence of windows on the heating and cooling demand of buildings [9,10,11], other studies pointed out that they are a valuable source of daylight [12,13,14,15,16,17,18]. Considering the impact of windows on the energy performance of buildings, stricter regulations regarding heating/cooling energy demand, ones that don’t take into account their influence on the energy demand for lighting may result in worse actual energy performance of buildings. Therefore, there is a need to include the energy demand for lighting, including the use of natural light, in the energy performance of buildings calculations. This need is all the more important as the use of active transparent facades is one of the main lines of research for increasing energy efficiency in buildings [19,20,21,22].
There are many applications designed specifically to assess the availability of daylight such as Radiance, VELUX Daylight Visualizer, Daysim, Relux, and DIALux [23,24,25,26,27]. There are also many thermal simulation tools that include daylighting such as EnergyPlus, DesginBuilder, Dial+, Ida Ice, and IESVE [28,29,30,31,32].
For all those tools the main input data is the geometry of analyzed spaces, properties of the materials used for construction, and installed luminaires as well as time and sky conditions.
Radiance is a set of tools for the analysis and visualization of lighting system designs [23]. Its engine uses the Monte Carlo approach with a backward ray-tracing algorithm. Simulation results are available in both graphical and numerical format and include spectral radiance, irradiance, and glare indices. The tool has been verified in many experiments and thanks to its good accuracy and capabilities many applications are based on its simulation engine, for example Daysim, or DesignBuilder.
Various possibilities of different applications and the results obtained with their use was compared in [33,34,35]. In some studies, the model’s accuracy was verified on the basis of measurements and, although most results were satisfactory [36,37], other studies demonstrate quite significant discrepancies for particular conditions [38,39,40].
The role of daylight calculation in the design practice is increasing year to year [41,42,43,44]. The available daylight simulation tools can be classified into two types: one that is based on advanced and accurate models based on ray-tracing algorithms (e.g., Radiance), and tools that use analytical formulas and static methods (e.g., EnergyPlus). Due to the significant computational time requirements, the first type of tools is better suited for designing lighting systems for visual comfort, while much less time consuming tools can be used more efficiently for the calculation of the energy performance of buildings.
The important role of the energy demand for lighting requires a significant increase the quality of the design of lighting systems through a better adaptation to the actual conditions. Moreover the need to improve the energy performance of buildings requires to take into account the efficiency of lighting systems during the design process of buildings and their systems. Both of these goals can be achieved through an extensive use of proper simulation tools.
The field measurements conducted in this study were used to examine the accuracy of two different daylight illuminance distribution models used in the Design builder program. One of them was the complex Radiance model and the other was the simplified EnergyPlus model. Next, the annual energy demand for heating, cooling, and lighting of the educational room in various conditions was simulated using the standard EnergyPlus model and its build-in alternative, a DElight model. The results were used to analyze the impact of the o the accuracy of the daylight calculations on the estimated energy performance of buildings.

2. Materials and Methods

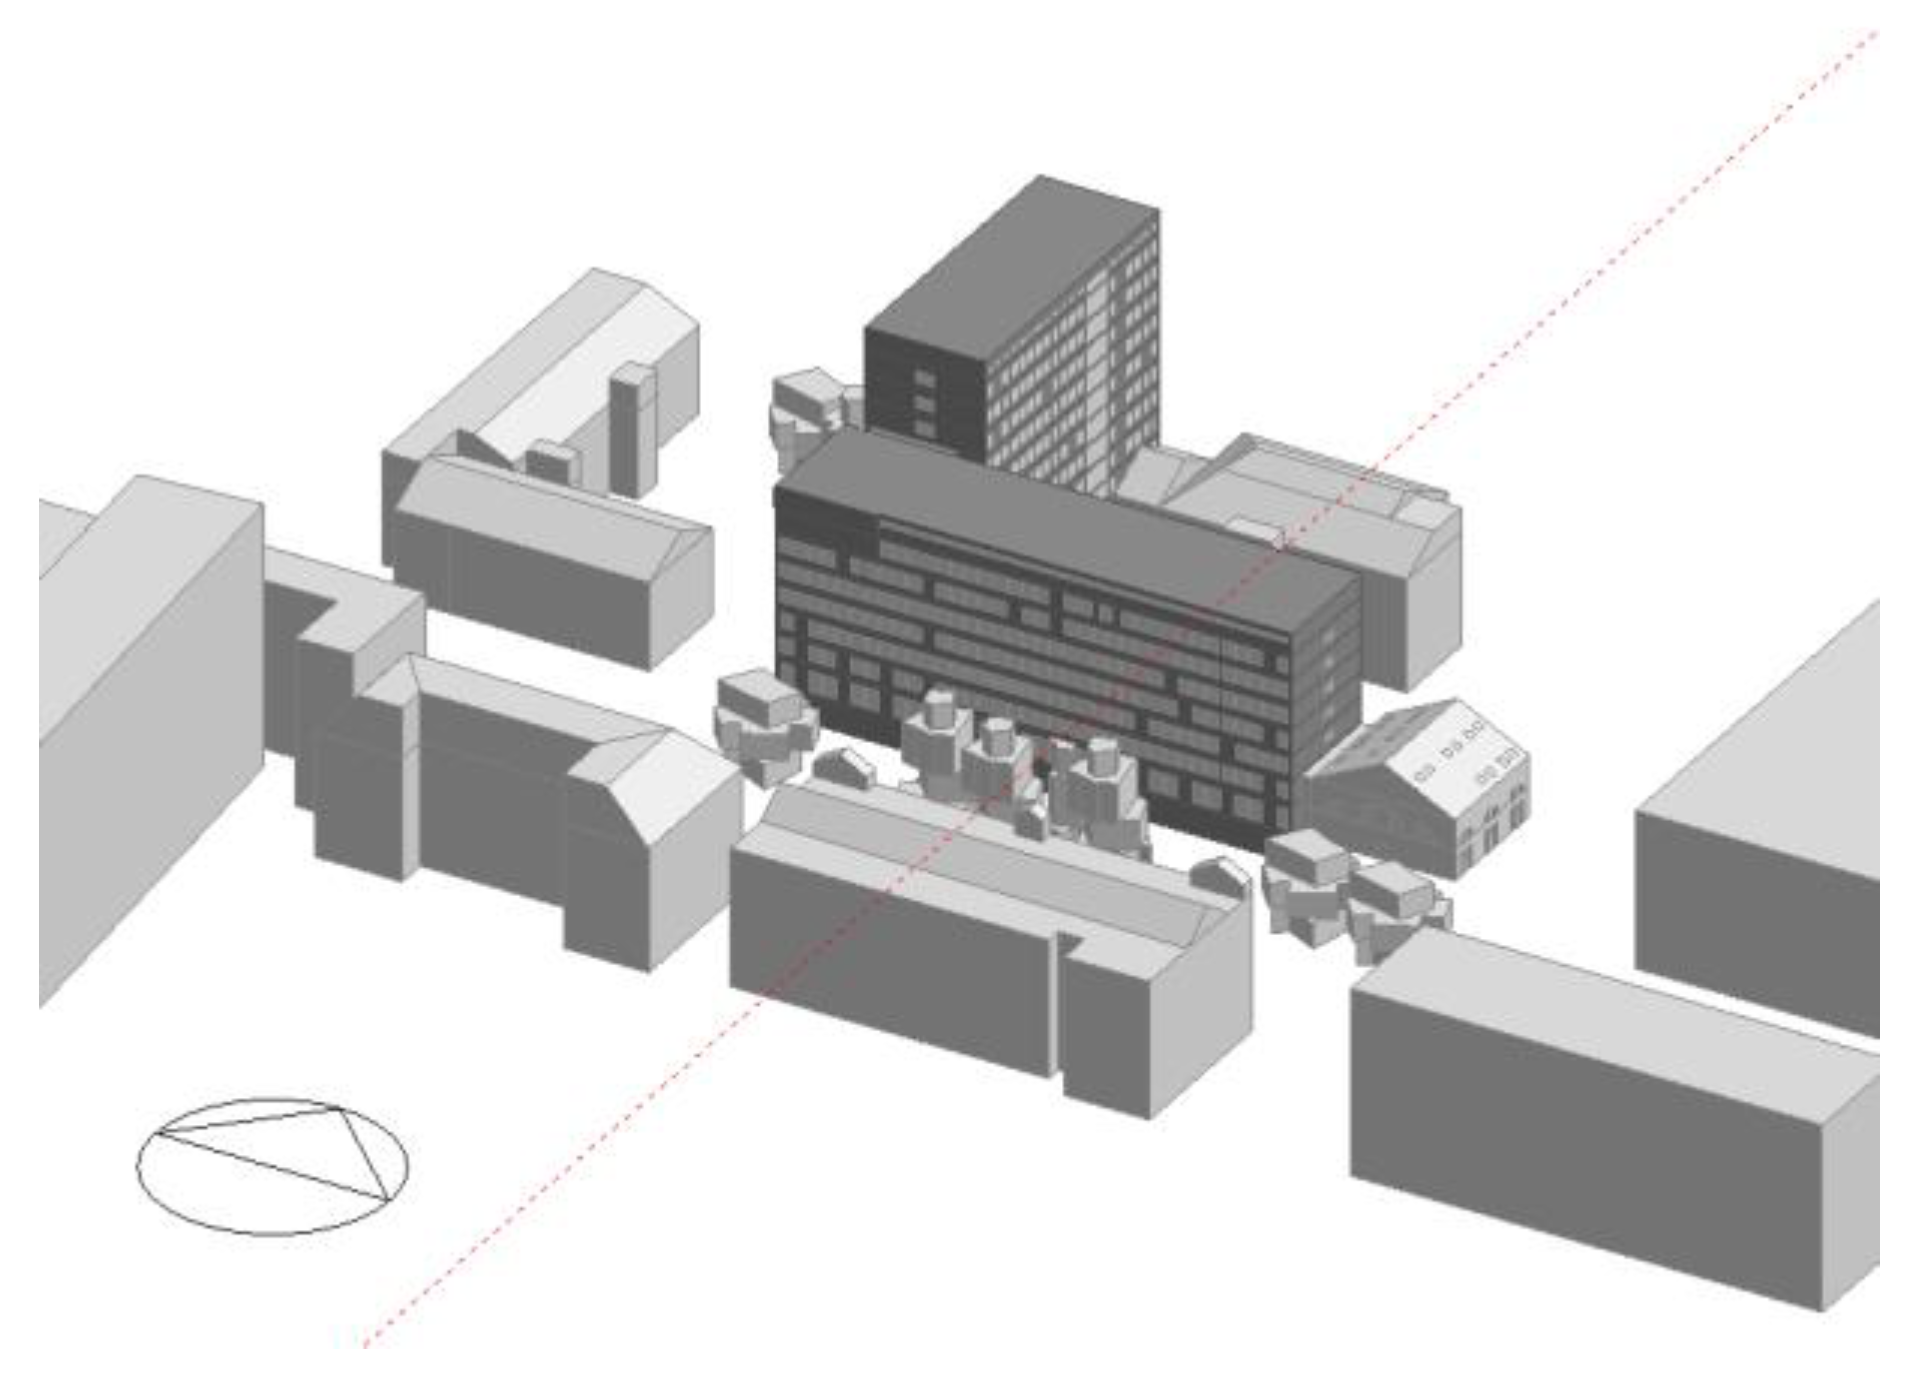
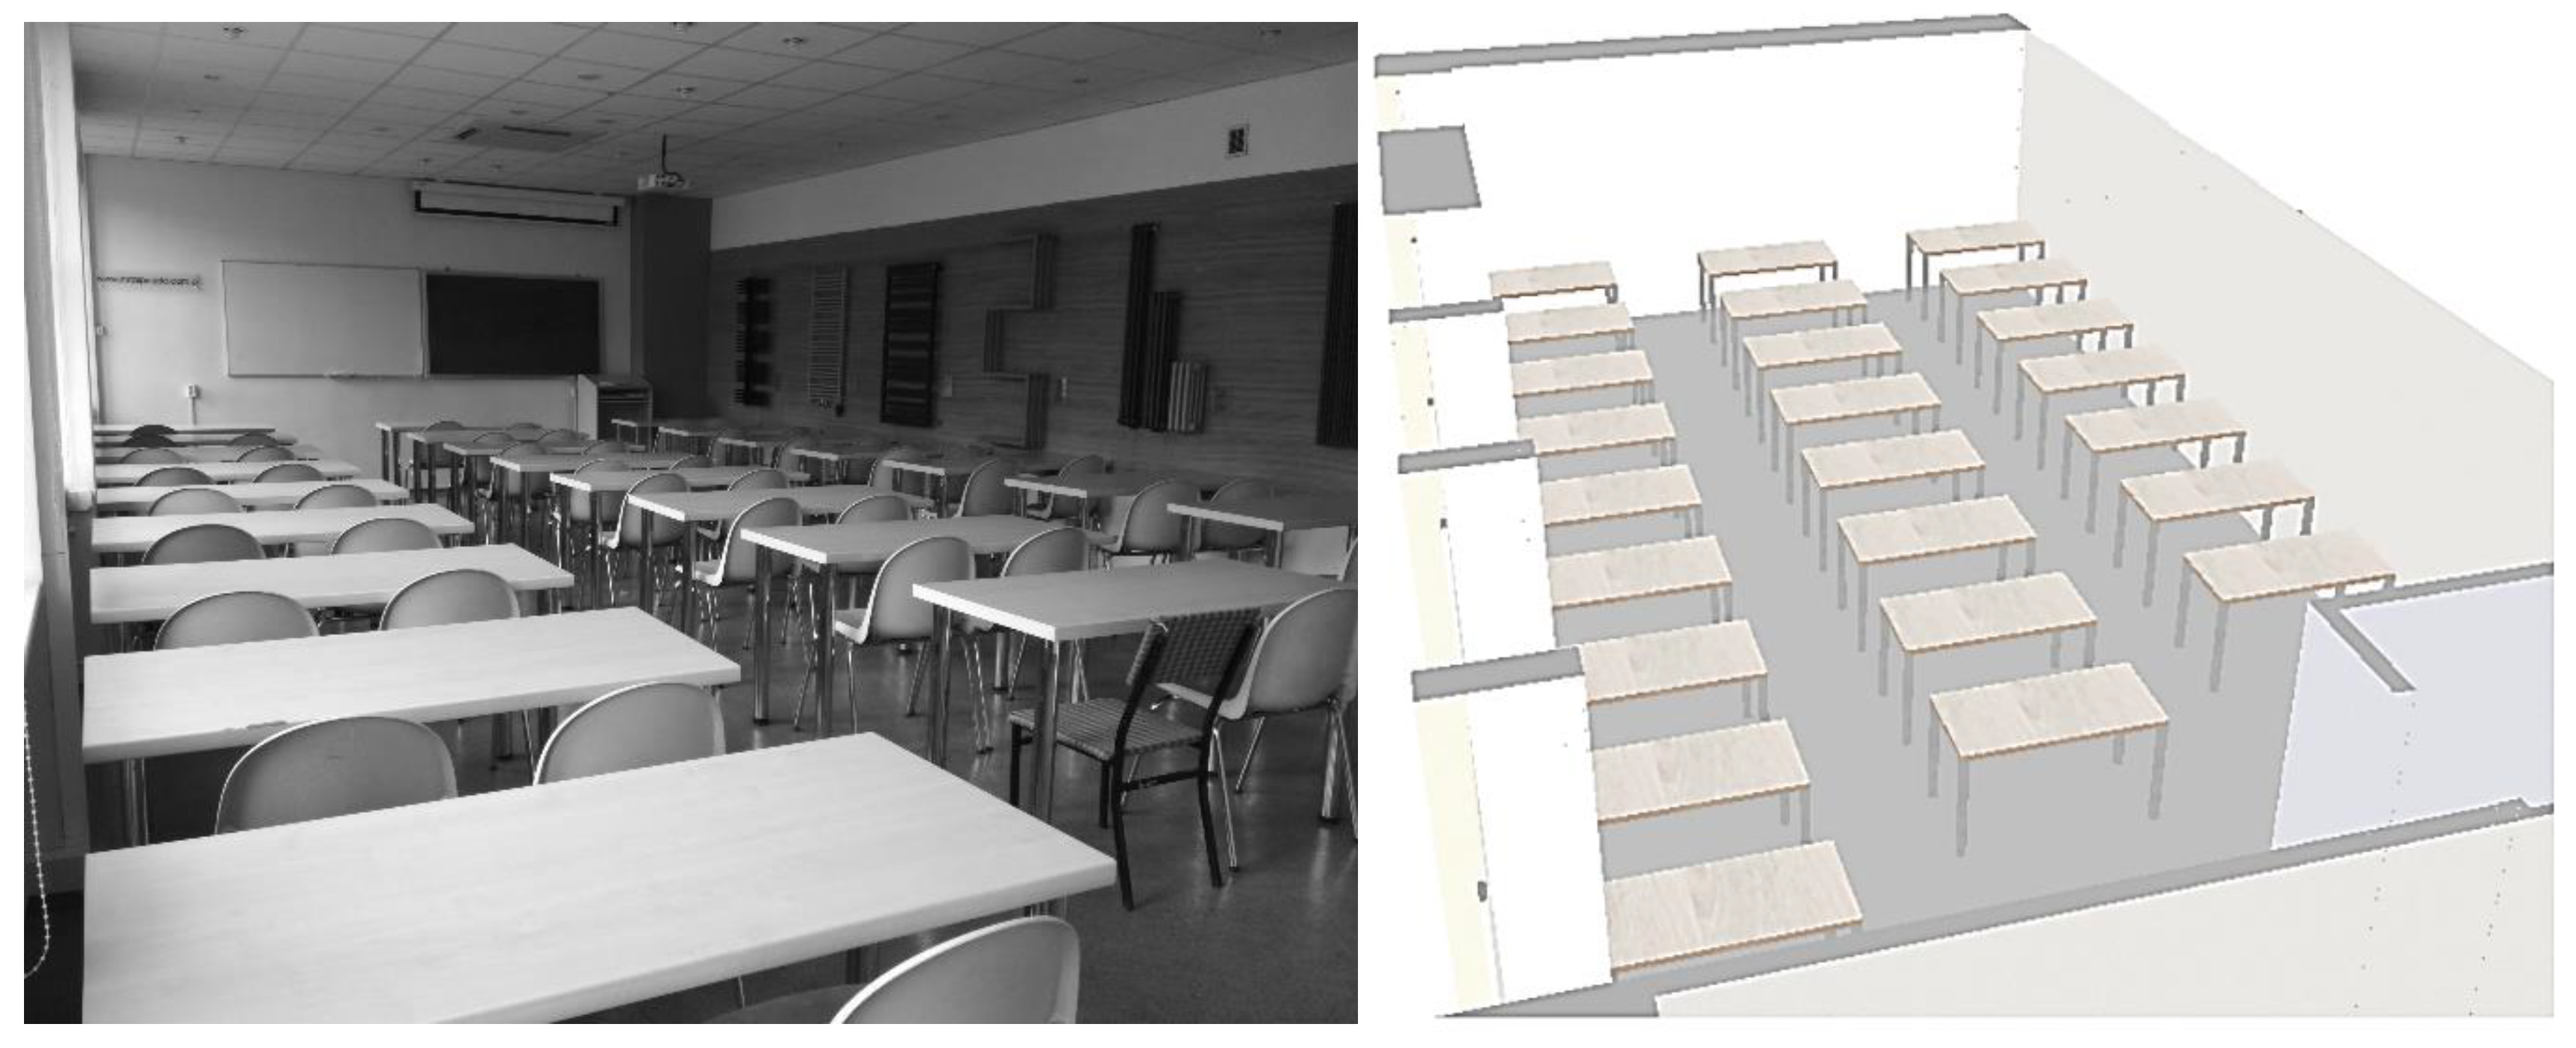
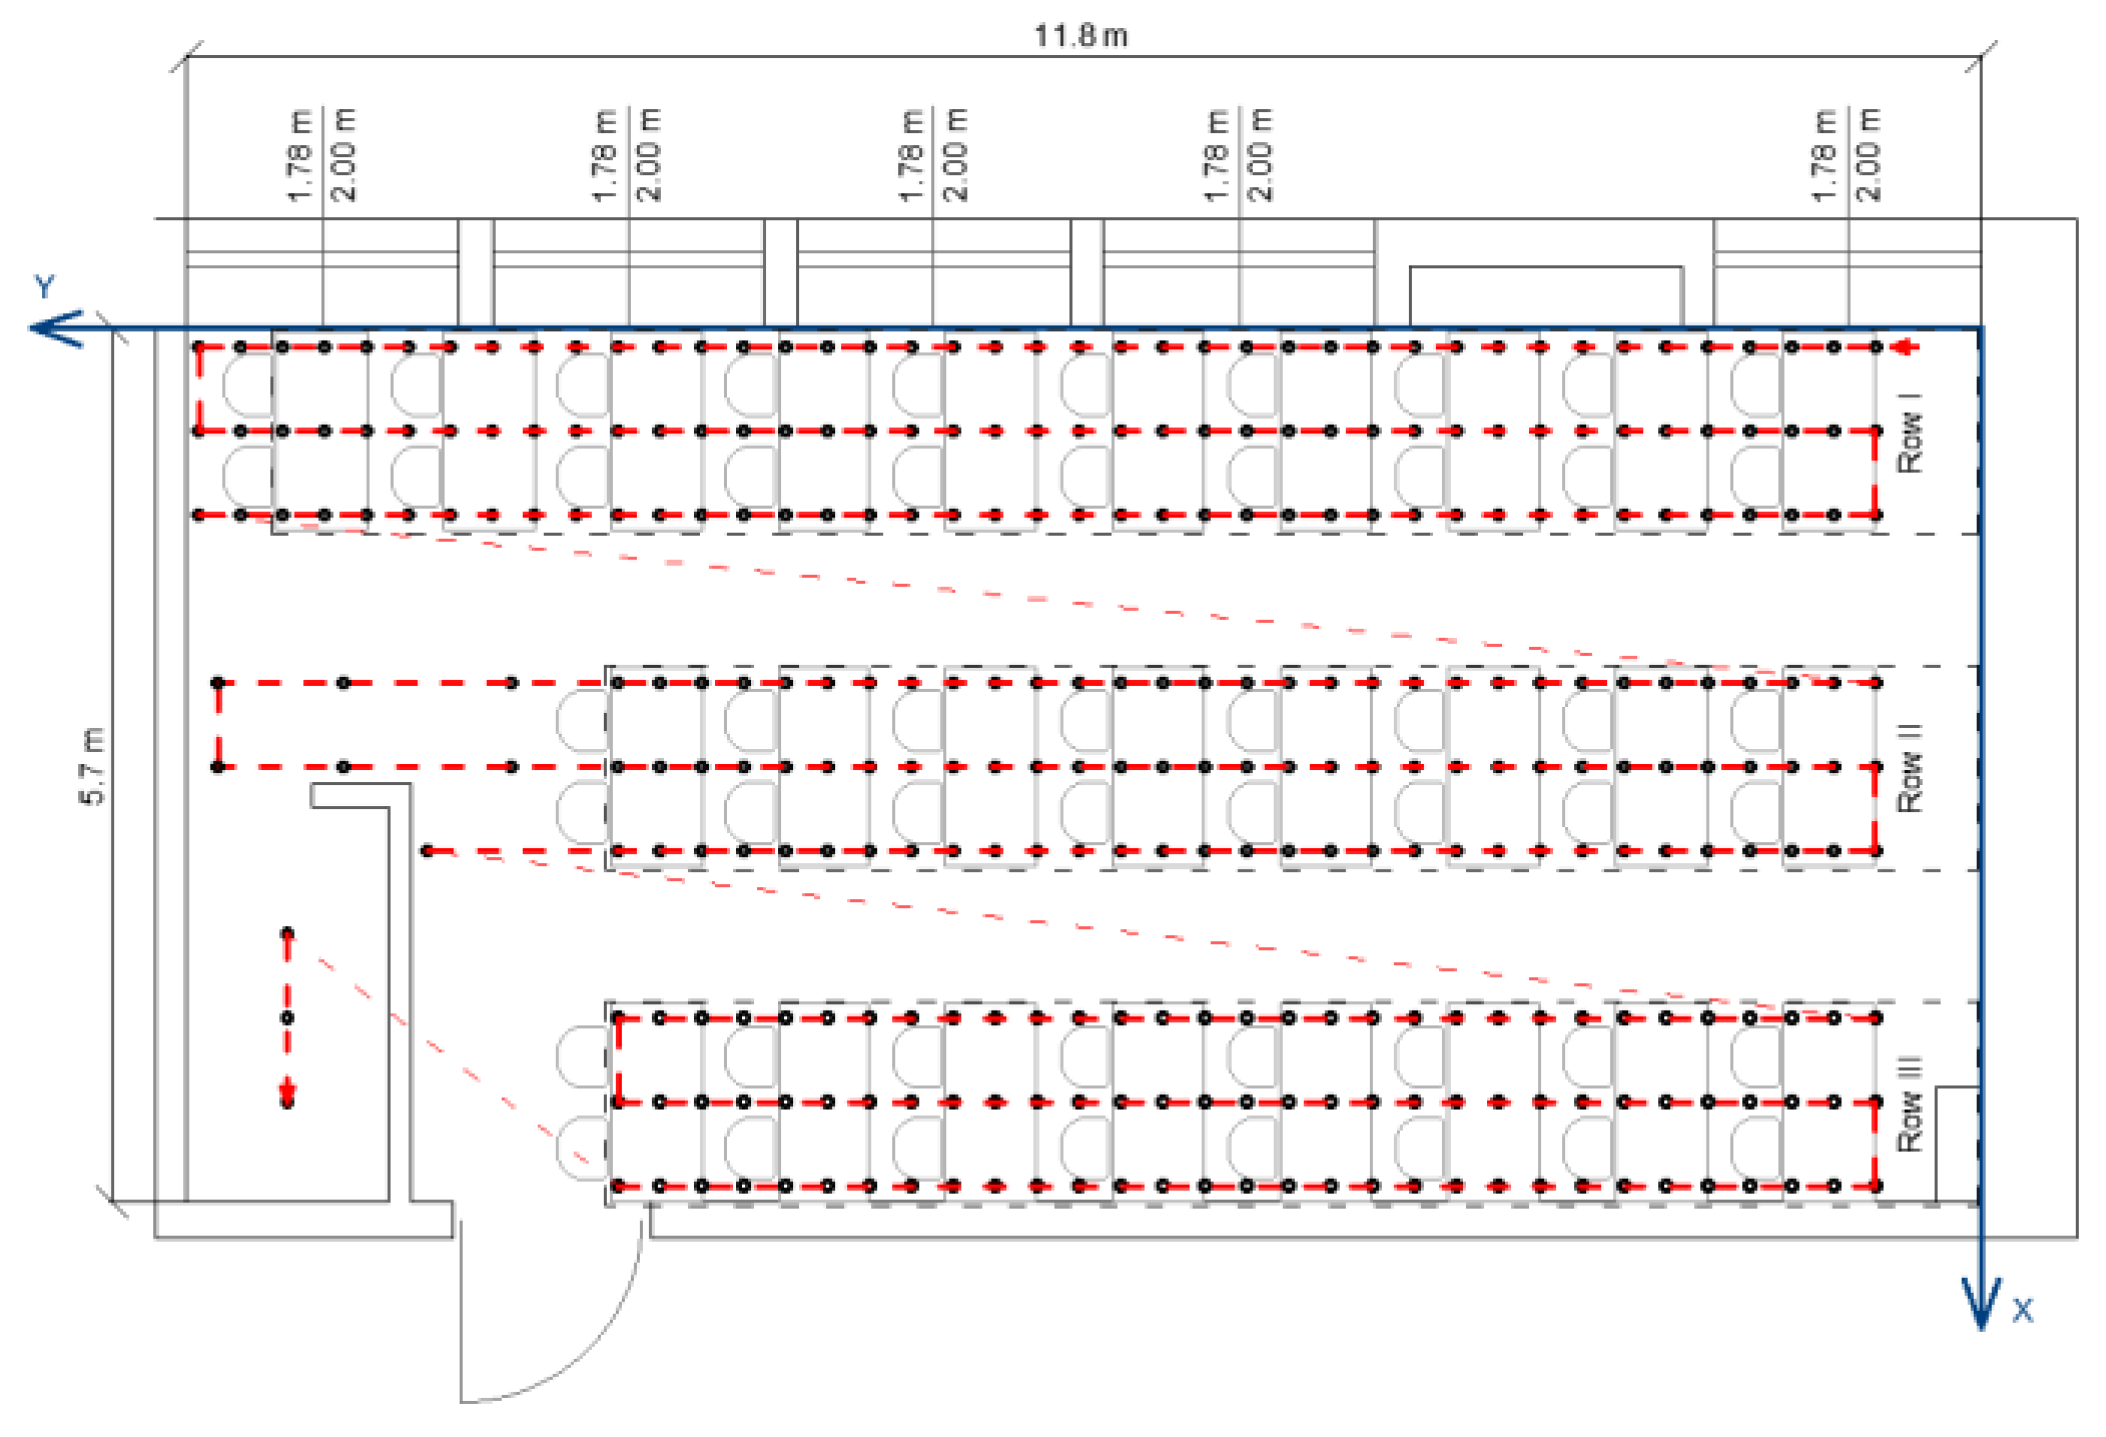
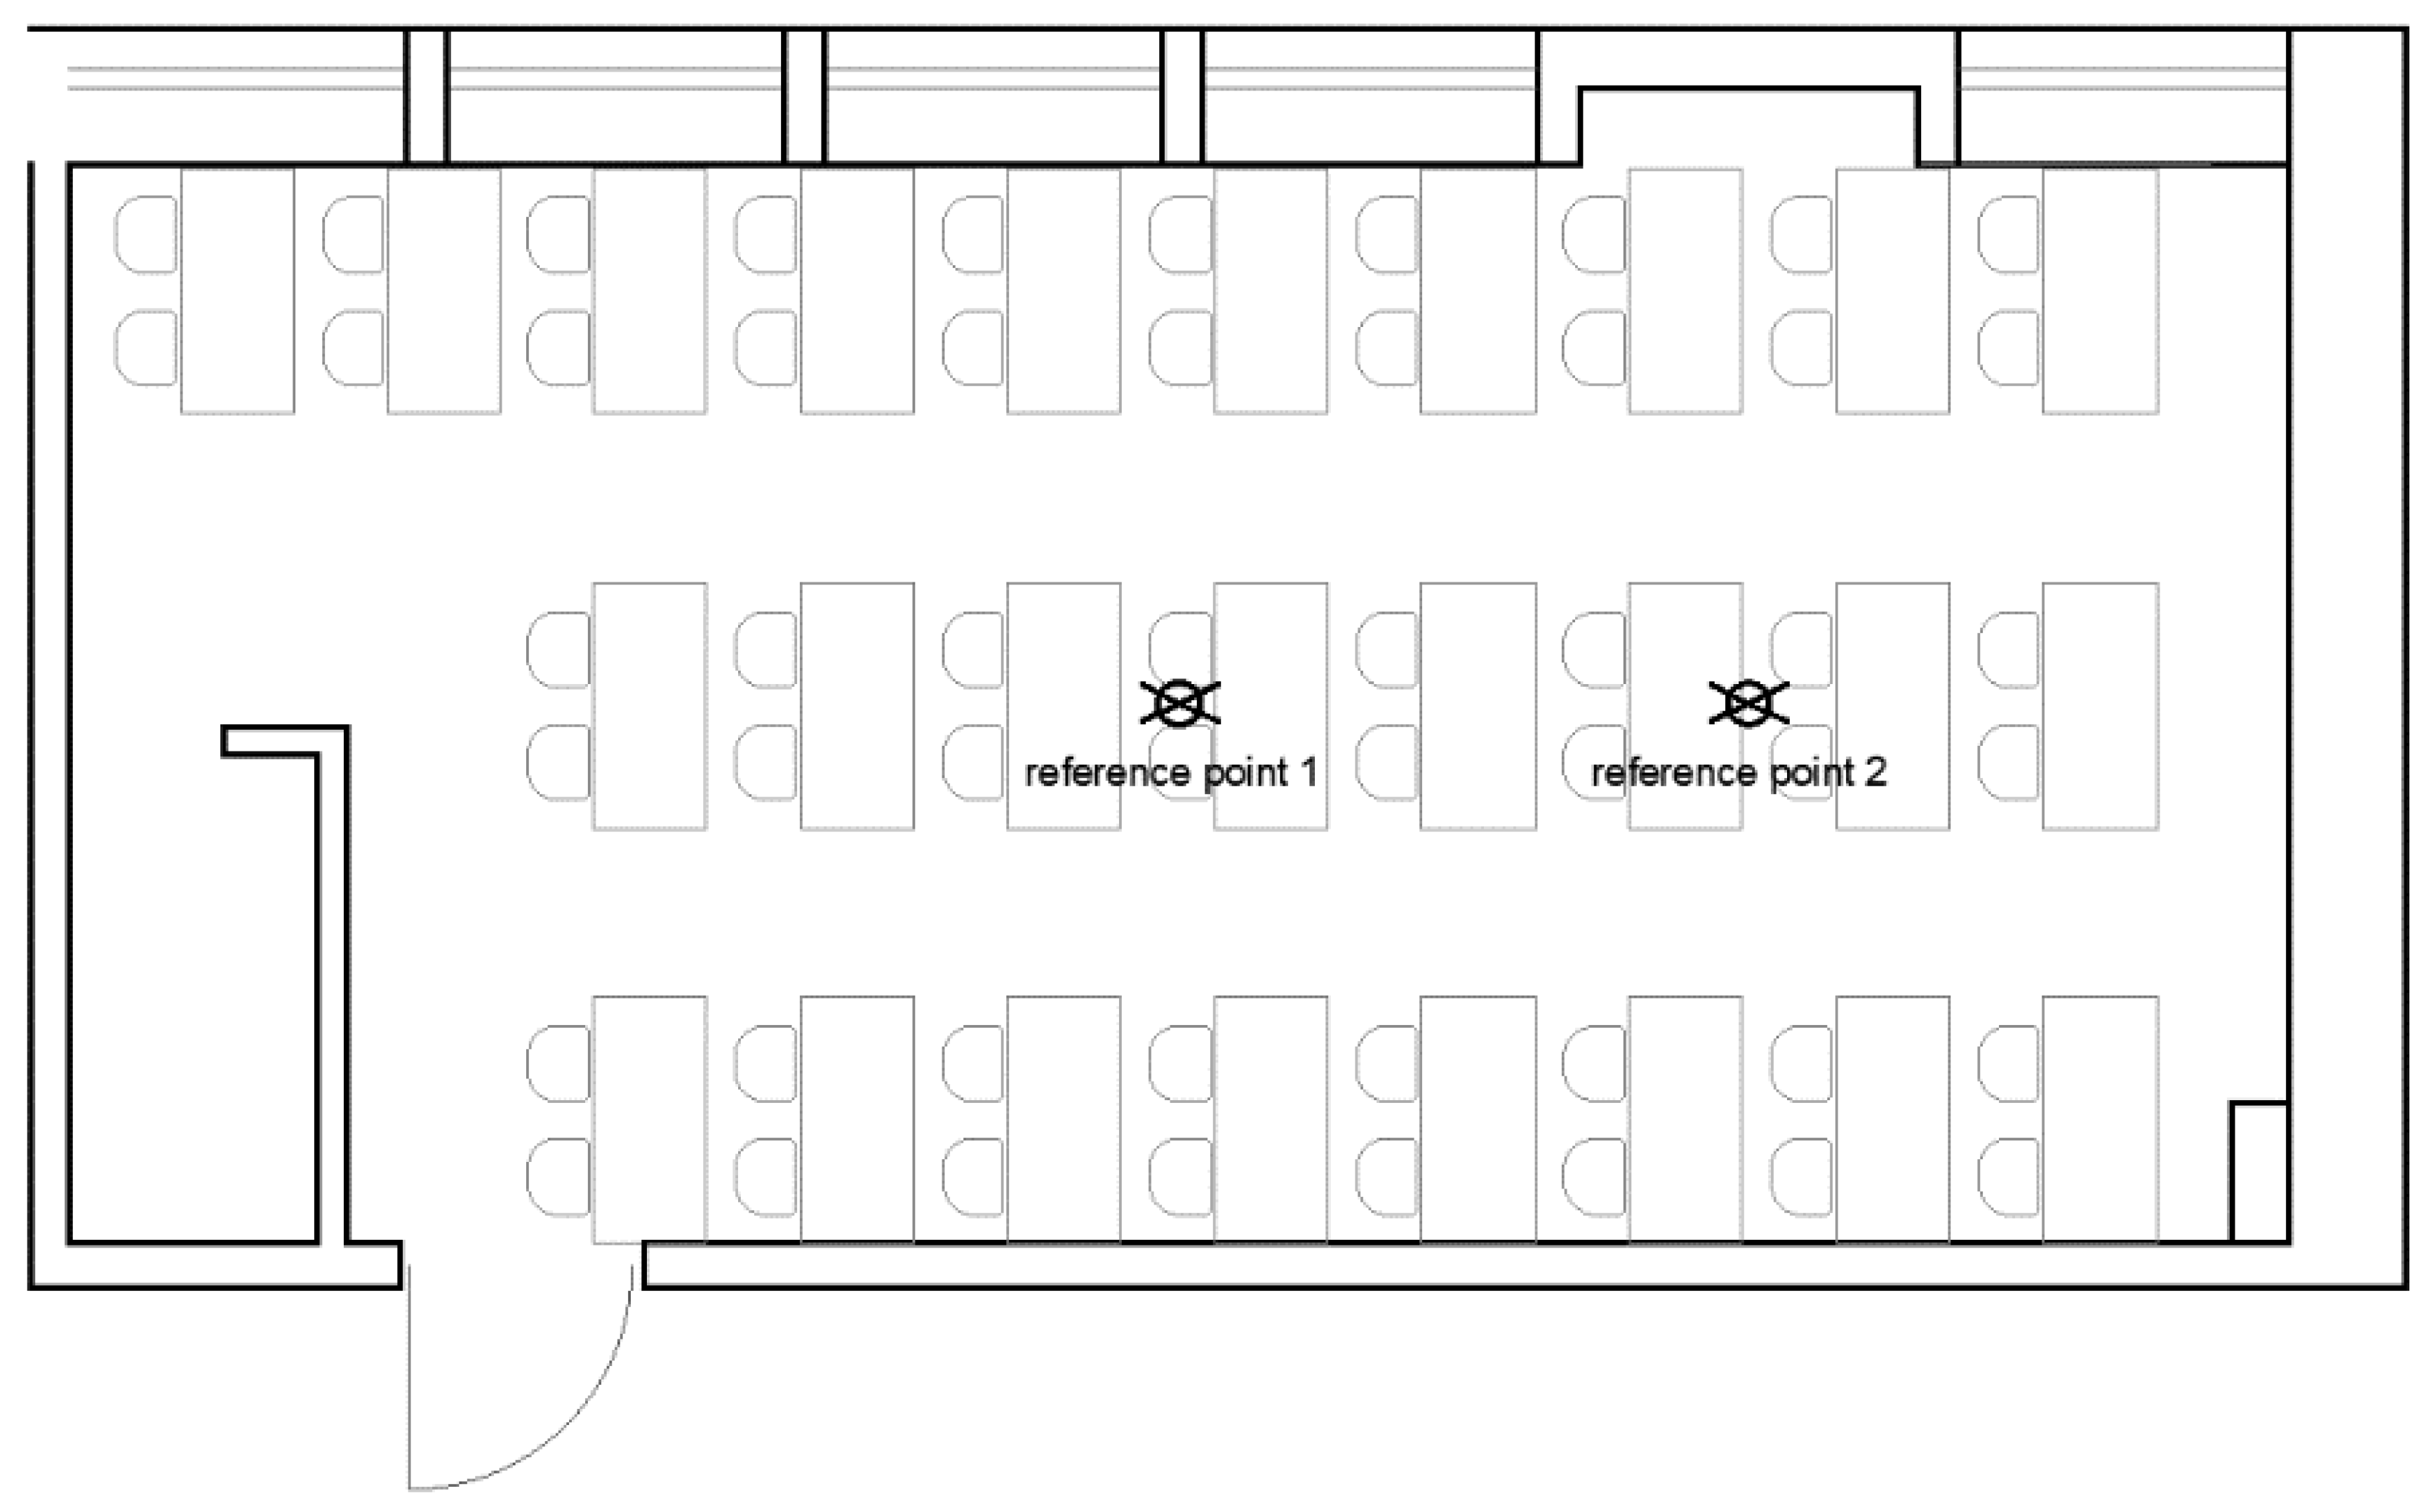
2.1. Investigated Educational Room

The study was conducted in an educational building of the Faculty of Building Services, Hydro and Environmental Engineering (Wydział Instalacji Budowlanych Hydrotechniki i Inżynierii Środowiska) located in the main area of the Warsaw University of Technology. The building has 335 rooms that serve different purposes (educational, laboratory, technical and office) and over 2000 people use it daily. Built in the 1970s, it has only been partially modernized since then. Visualization of the building (dark gray) and its surroundings (light gray) is presented in the Figure 1.
The values of the main parameters characterizing the building are presented in Table 1.
The analysis of the illuminance was carried out for an educational room in the building: the lecture hall (room 210) on the second floor (Figure 2). Although the room has two external walls, all of the five 1.78 × 2.00 m windows are installed in the south facade constituting 52% of its area. The lecture hall is 11.8 m in length, 5.7 m in width, and 2.9 m in height. As in engineering practice, designers do not usually have accurate data on the optical properties of the materials, thus the values of the visible absorptance of the surfaces in the room were assumed on the basis of visual assessment and measured values for various materials [45].

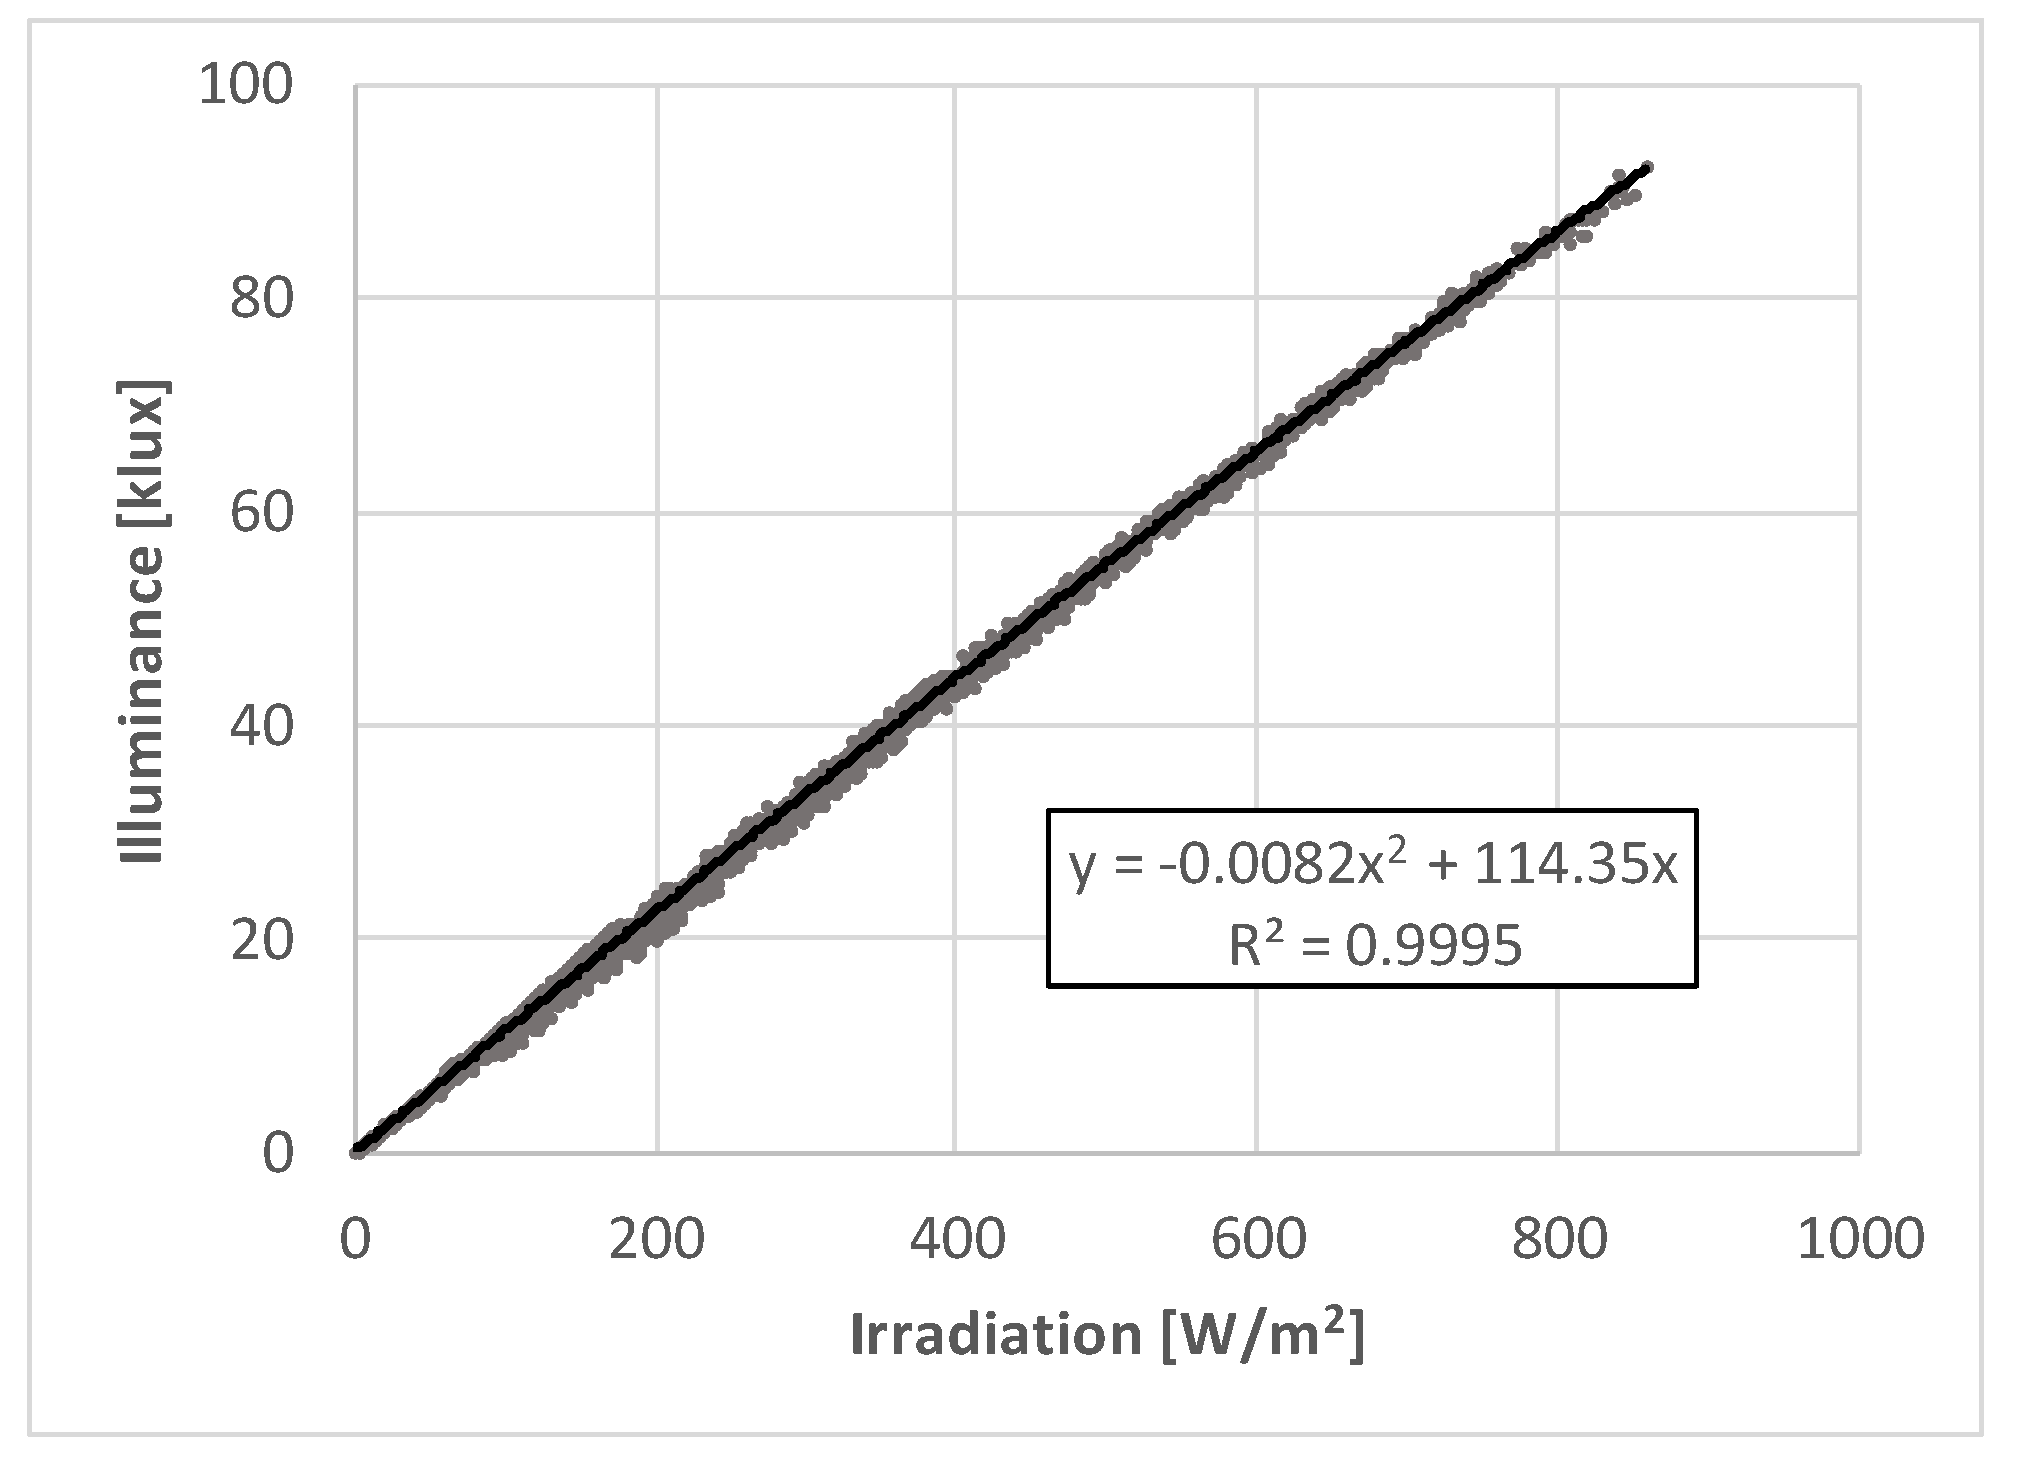
2.2. Field Measurements

The field measurements were conducted on selected days in 2018 and 2019. Each day, several measurement series at various times of the day were carried out. The illuminance in the room was measured in accordance with the diagram shown in Figure 3. The solar radiation intensity was measured on the roof. The following sensors were used for the measurements: datalogger with sensor LP471 PYRA 02 to record external solar radiation intensity, datalogger with sensor LP 471 PHOT to measure illuminance in the auditorium and Testo 545 illuminance meter to measure the reference level of illuminance. The dimensions of the grid were set to correspond with the distribution of the workstations. A total of 319 measuring points were distributed at the level of the working plane (75 cm above the floor), every 27.5 cm along the Y axis of the room and every 55 cm along the X axis. Measurements at individual points were made in turn by two operators moving in opposite directions in accordance with the line illustrated in the drawing of the room. Moving the sensor to the next point, together with concealing the operator below the work plane and stabilizing the indications required on average about 8 s, therefore one measurement series took about 20 min to perform.
As the external solar illuminance level is not stable, to compensate for its changes during each series a reference measurement of indoor illuminance was made at a fixed location in the middle of the room. Consequently, the measured illuminance value for each point was corrected accordingly to the ratio of the illuminance value recorded at the same time for the reference point time to the reference value recorded for a chosen moment during the measurement series.
After the analysis of the obtained data, two measuring series for were selected for which the conditions were the most stable and close to those described by the CIE standard [46], which is used to model sky conditions in the Design Builder software.
The measurements used in the analysis were taken 21 September 2018 with a clear sky with no cloud cover (representing CIE sunny clear day) and 11 January 2019 with overcast sky and 100% cloud cover (representing CIE Overcast Day).

2.3. Illuminance Simulations

The analysis is based on the building model created with the Design Builder software as part of the KODnZEB project [47]. The Design Builder program was chosen because it has two different modules that allow to calculate the daylight illuminance distribution in the room. As both methods use the same numerical model of the room and its surroundings, the differences in the results of illuminance calculations should result only from the differences between the models, not the input data in regards of the geometrical or optical properties of the room. The main difference in terms of the input data between the models is that EnergyPlus module is based on solar irradiation data from the weather database, while the Radiance based module carries out simulations according to the outdoor illuminance characteristic of a selected sky model. There are 7 possible choices:
  • CIE Sunny Clear Day
  • CIE Clear Day
  • CIE Sunny Intermediate Day
  • CIE Intermediate Day
  • CIE Overcast Day
  • CIE Overcast Day (specify illuminance)
  • Uniform Cloudy Sky.
These models take into account various weather conditions that affect the availability of daylight. Depending on the model, a different scope of data is required for simulations. In case of the CIE Overcast Day conditions for specific illuminance, the level of external illuminance has to be entered, while the sunny clear day model requires the date and time for the simulation. As the external illuminance was not measured, its value was calculated using the results of the outdoor solar radiation intensity measurements. The calculations were based on the correlation curve determined for the irradiation and illumination data from the weather database (Figure 4).

2.4. Energy Demand Simulations

The next stage of the study was to perform energy performance calculations that were carried out with an hourly time step and included the room’s use schedules, which reflected its educational character. The most important factors regarding the energy efficiency of the building were:
  • mechanical ventilation with heat recovery (average temperature efficiency 73%) with a scheduled fresh air volume for one person of 30 m3/h,
  • heating/cooling via fan coil units with a set temperature of 20 °C for heating and 24 °C for cooling,
  • artificial lighting system including scheduled operating hours and a linear regulation of its intensity within a range of 0–500 lx. The control of the artificial light power in design builder used a single reference point and a light sensor with no inertia and perfect accuracy. The maximum lighting power was 10 W/m2.
To assess the possible impact of windows on the energy balance of a building, the annual energy demand for heating, cooling, and lighting under various conditions was simulated with Design Builder. The overall energy performance of educational buildings depends on many factors such as location, construction and space arrangement, therefore the analysis included three different variants of windows, a change of orientation as well as different reference point positioning.
The energy demand analysis was made for three different sets of windows currently available on the market and compliant with current technical requirements. The first variant used double-glazed windows with a heat transfer coefficient of the glazing Ug = 1.0 W/(m2 K), solar energy transmittance gg = 0.50, and light transmittance coefficient Lt = 0.71. For the second variant, we chose triple glazed windows with a heat transfer coefficient Ug =0.7 W/(m2 K) and solar energy (gg = 0.35) and light transmittance (Lt = 0.57) coefficients. Finally, the third variant utilized windows with superior triple glazing, with a reduced Ug = 0.4 W/(m2 K) and maintained values of gg = 0.35 and Lt = 0.57. Conducting tests with different types of glazing allowed us to verify the impact of the change of energy losses and gains through windows on the energy demand of the analyzed room.
In order to illustrate the impact of the direct solar radiation availability, the simulations were carried out for two extreme orientations of the room (with windows facing south and north). The energy demand was calculated for two reference point locations used by the artificial lighting control system based on the availability of natural light. The point was located accordingly 2.9 m and 5.9 m from the western external wall, in the middle of the room. A point at the distance of 5.9 m (in the middle of the room) is the default point location used in the Design Builder software (reference point 1). The second point was located in the middle of the wide area between windows. Its location was chosen to check the impact of the reference point selection on the energy demand for various needs (Figure 5).

3. Results and Discussion

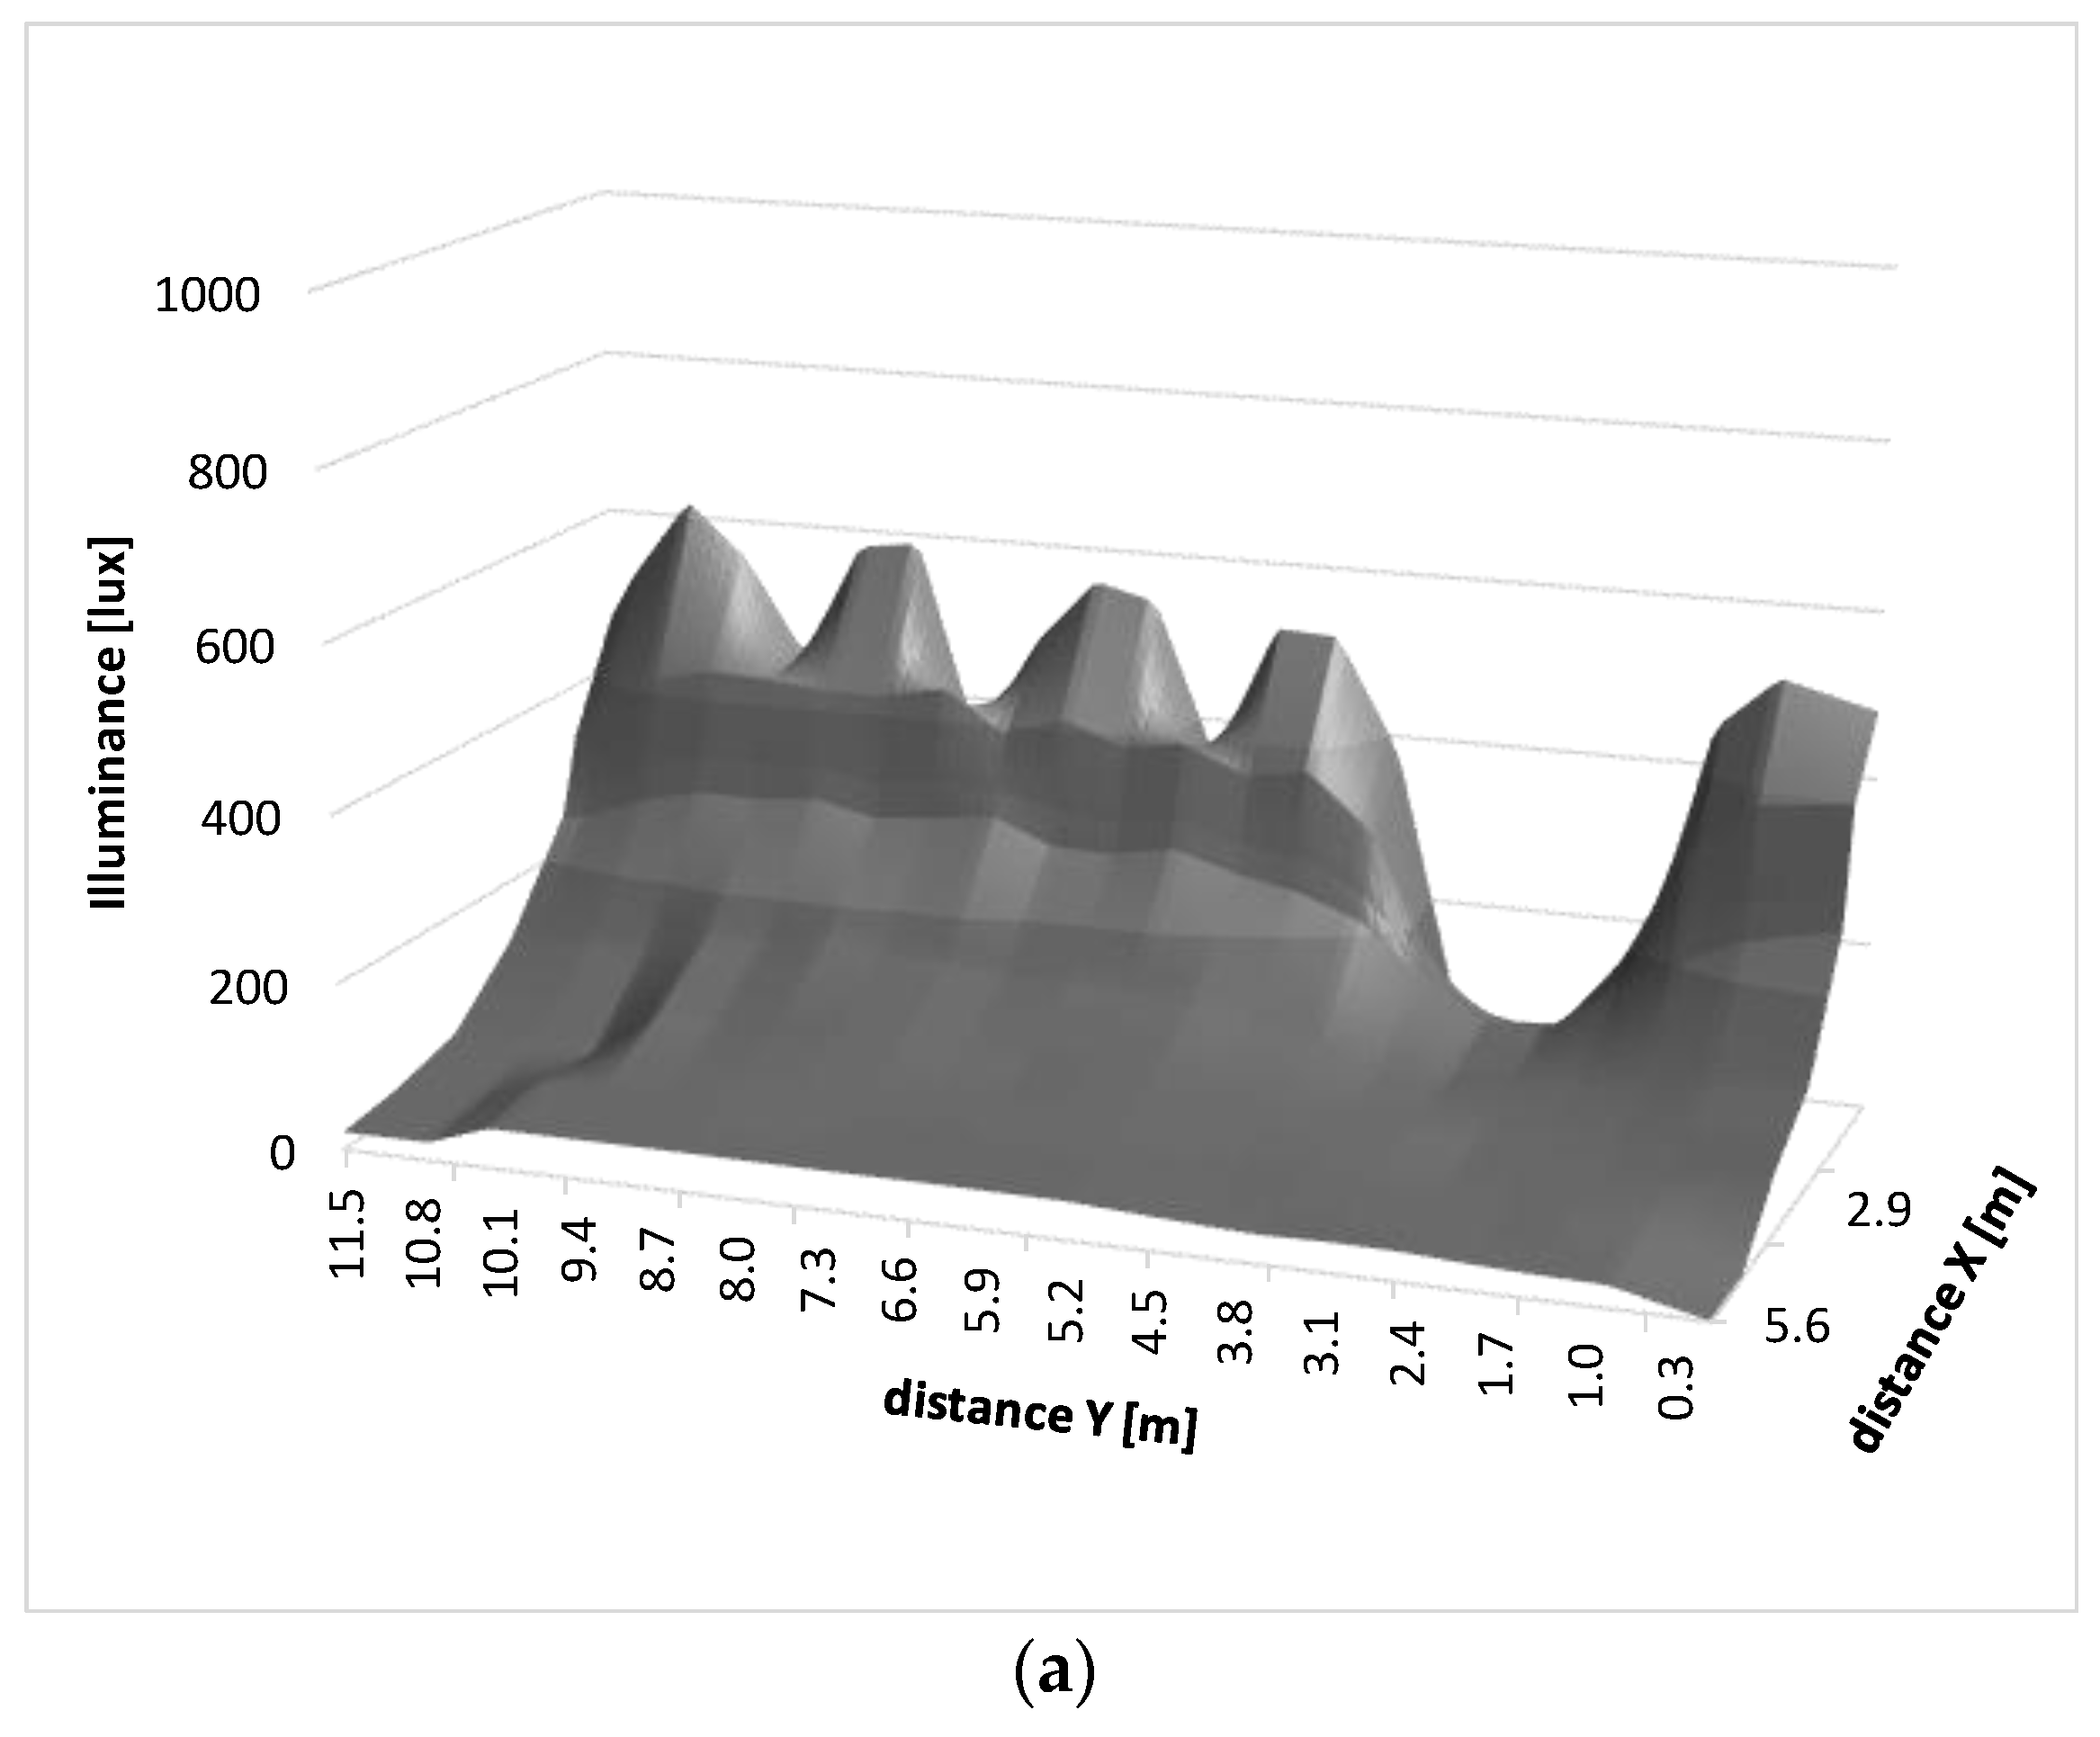
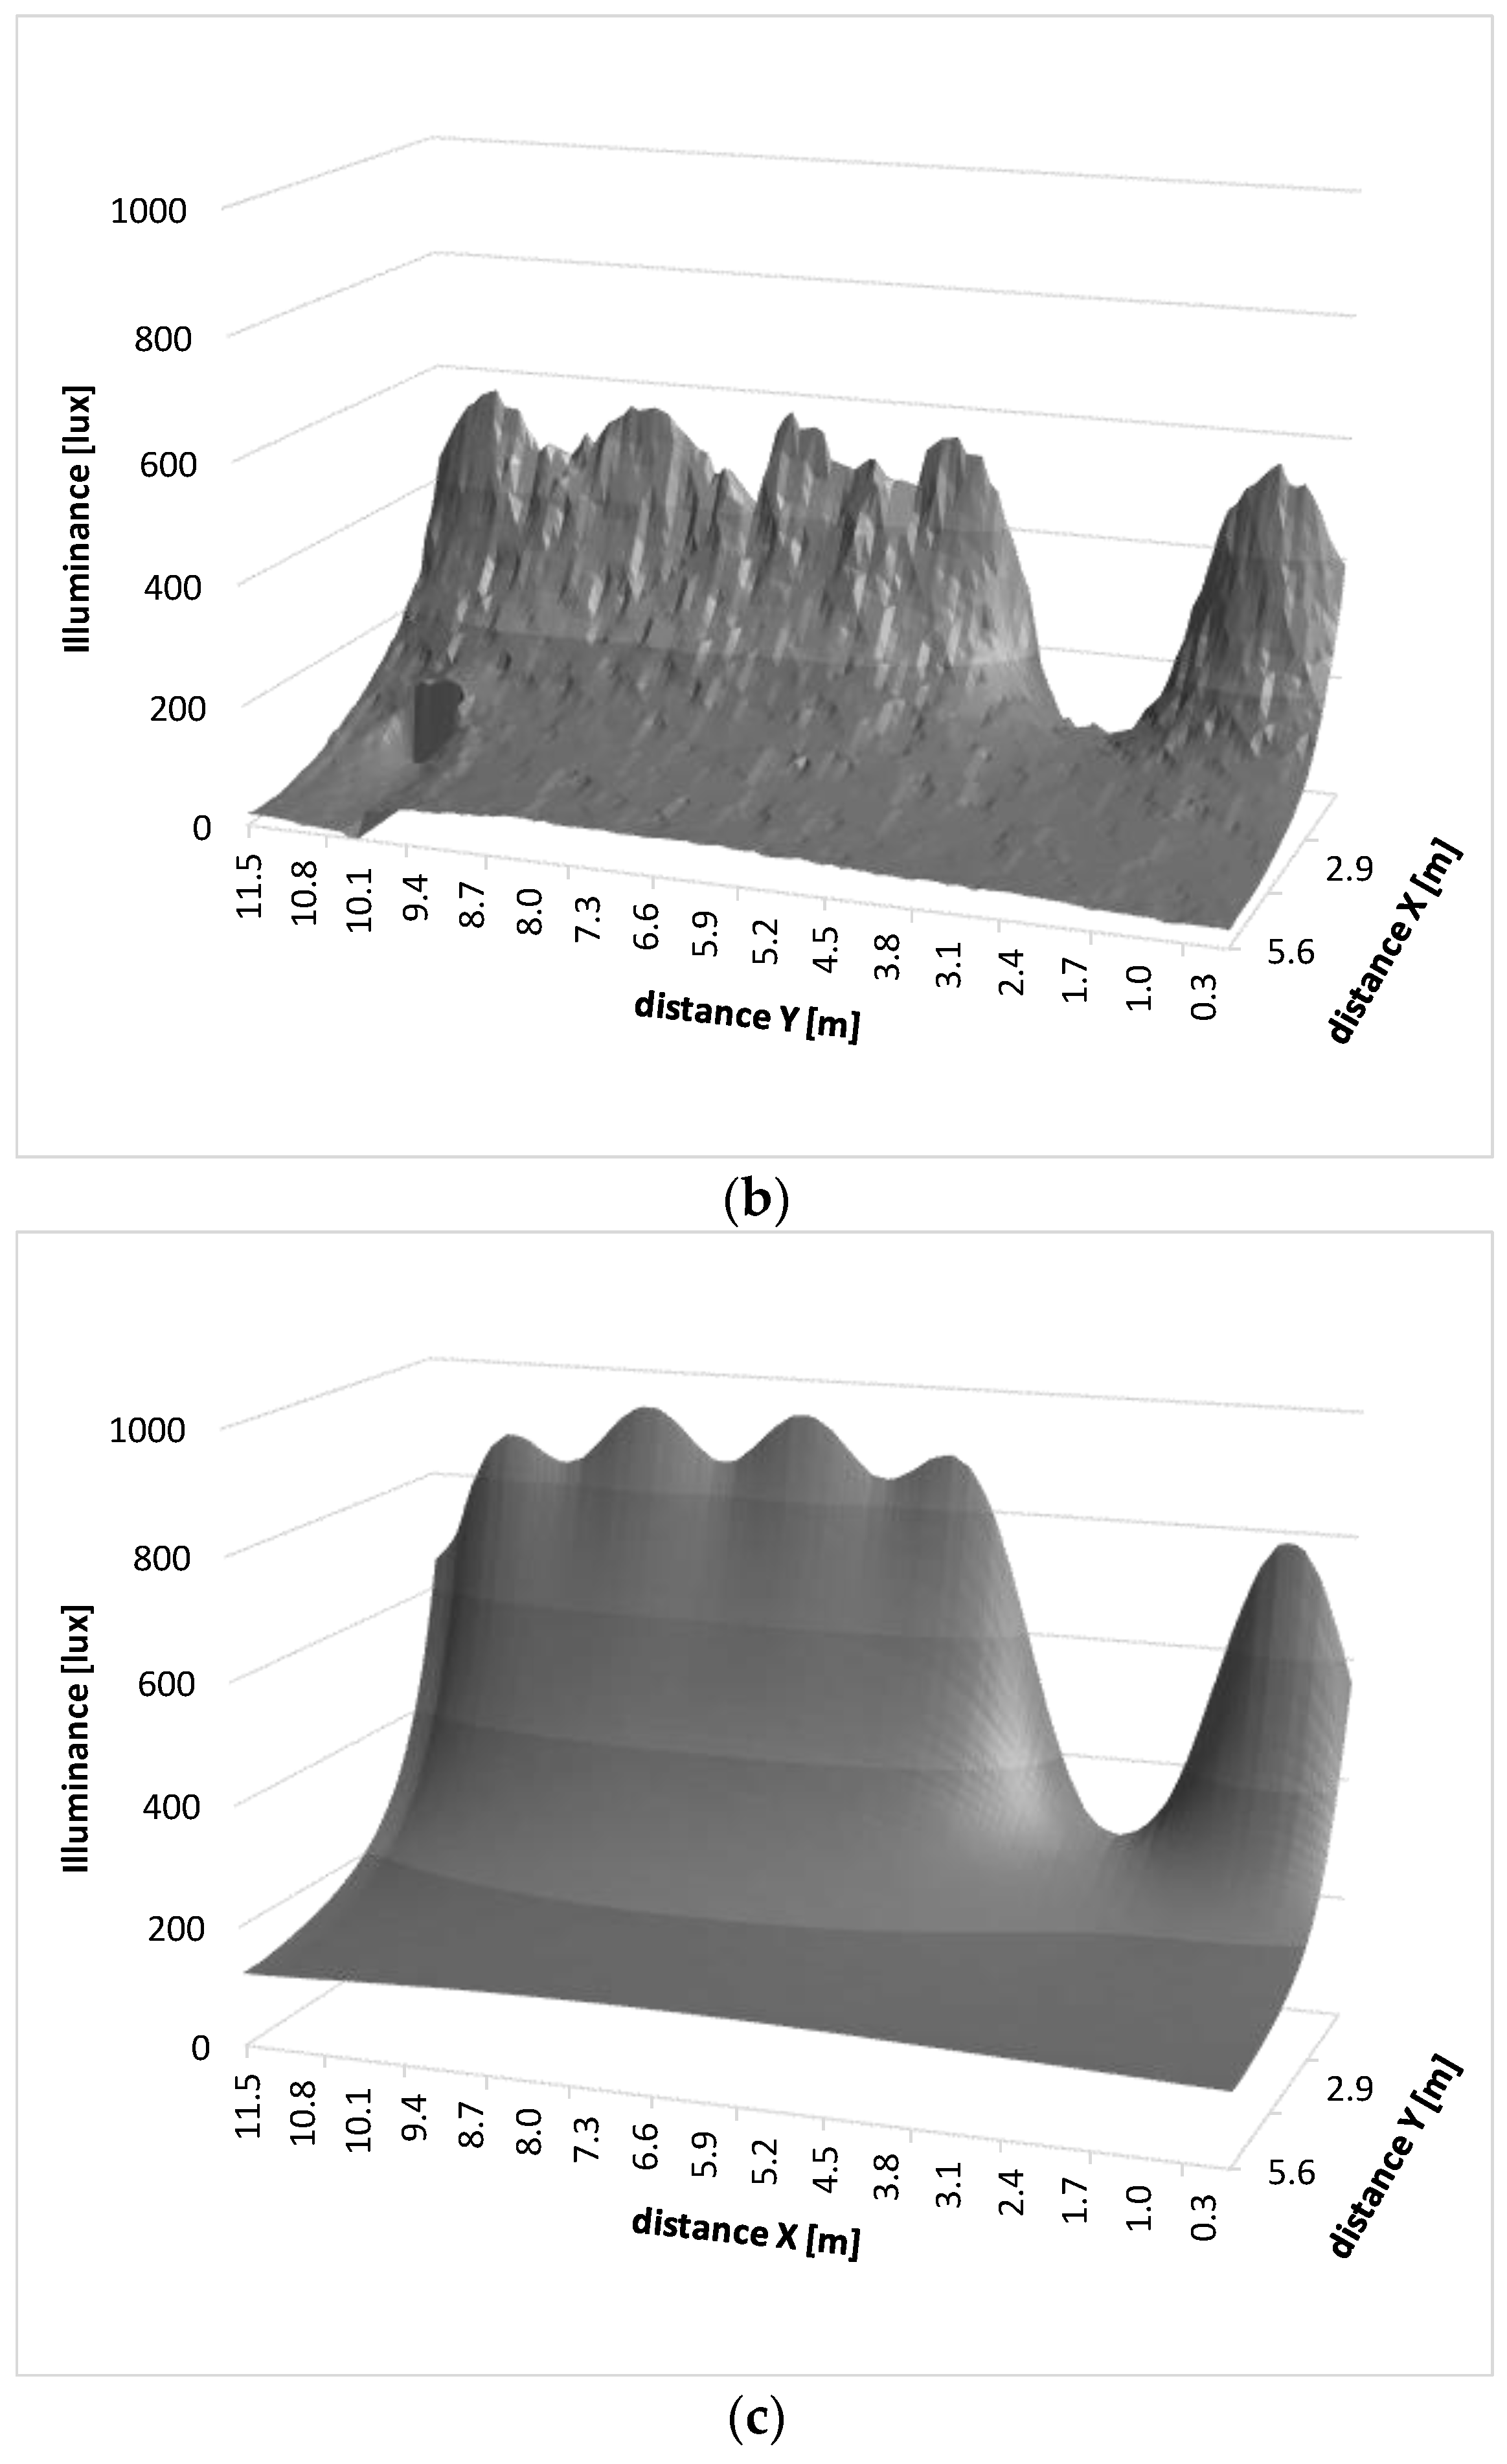
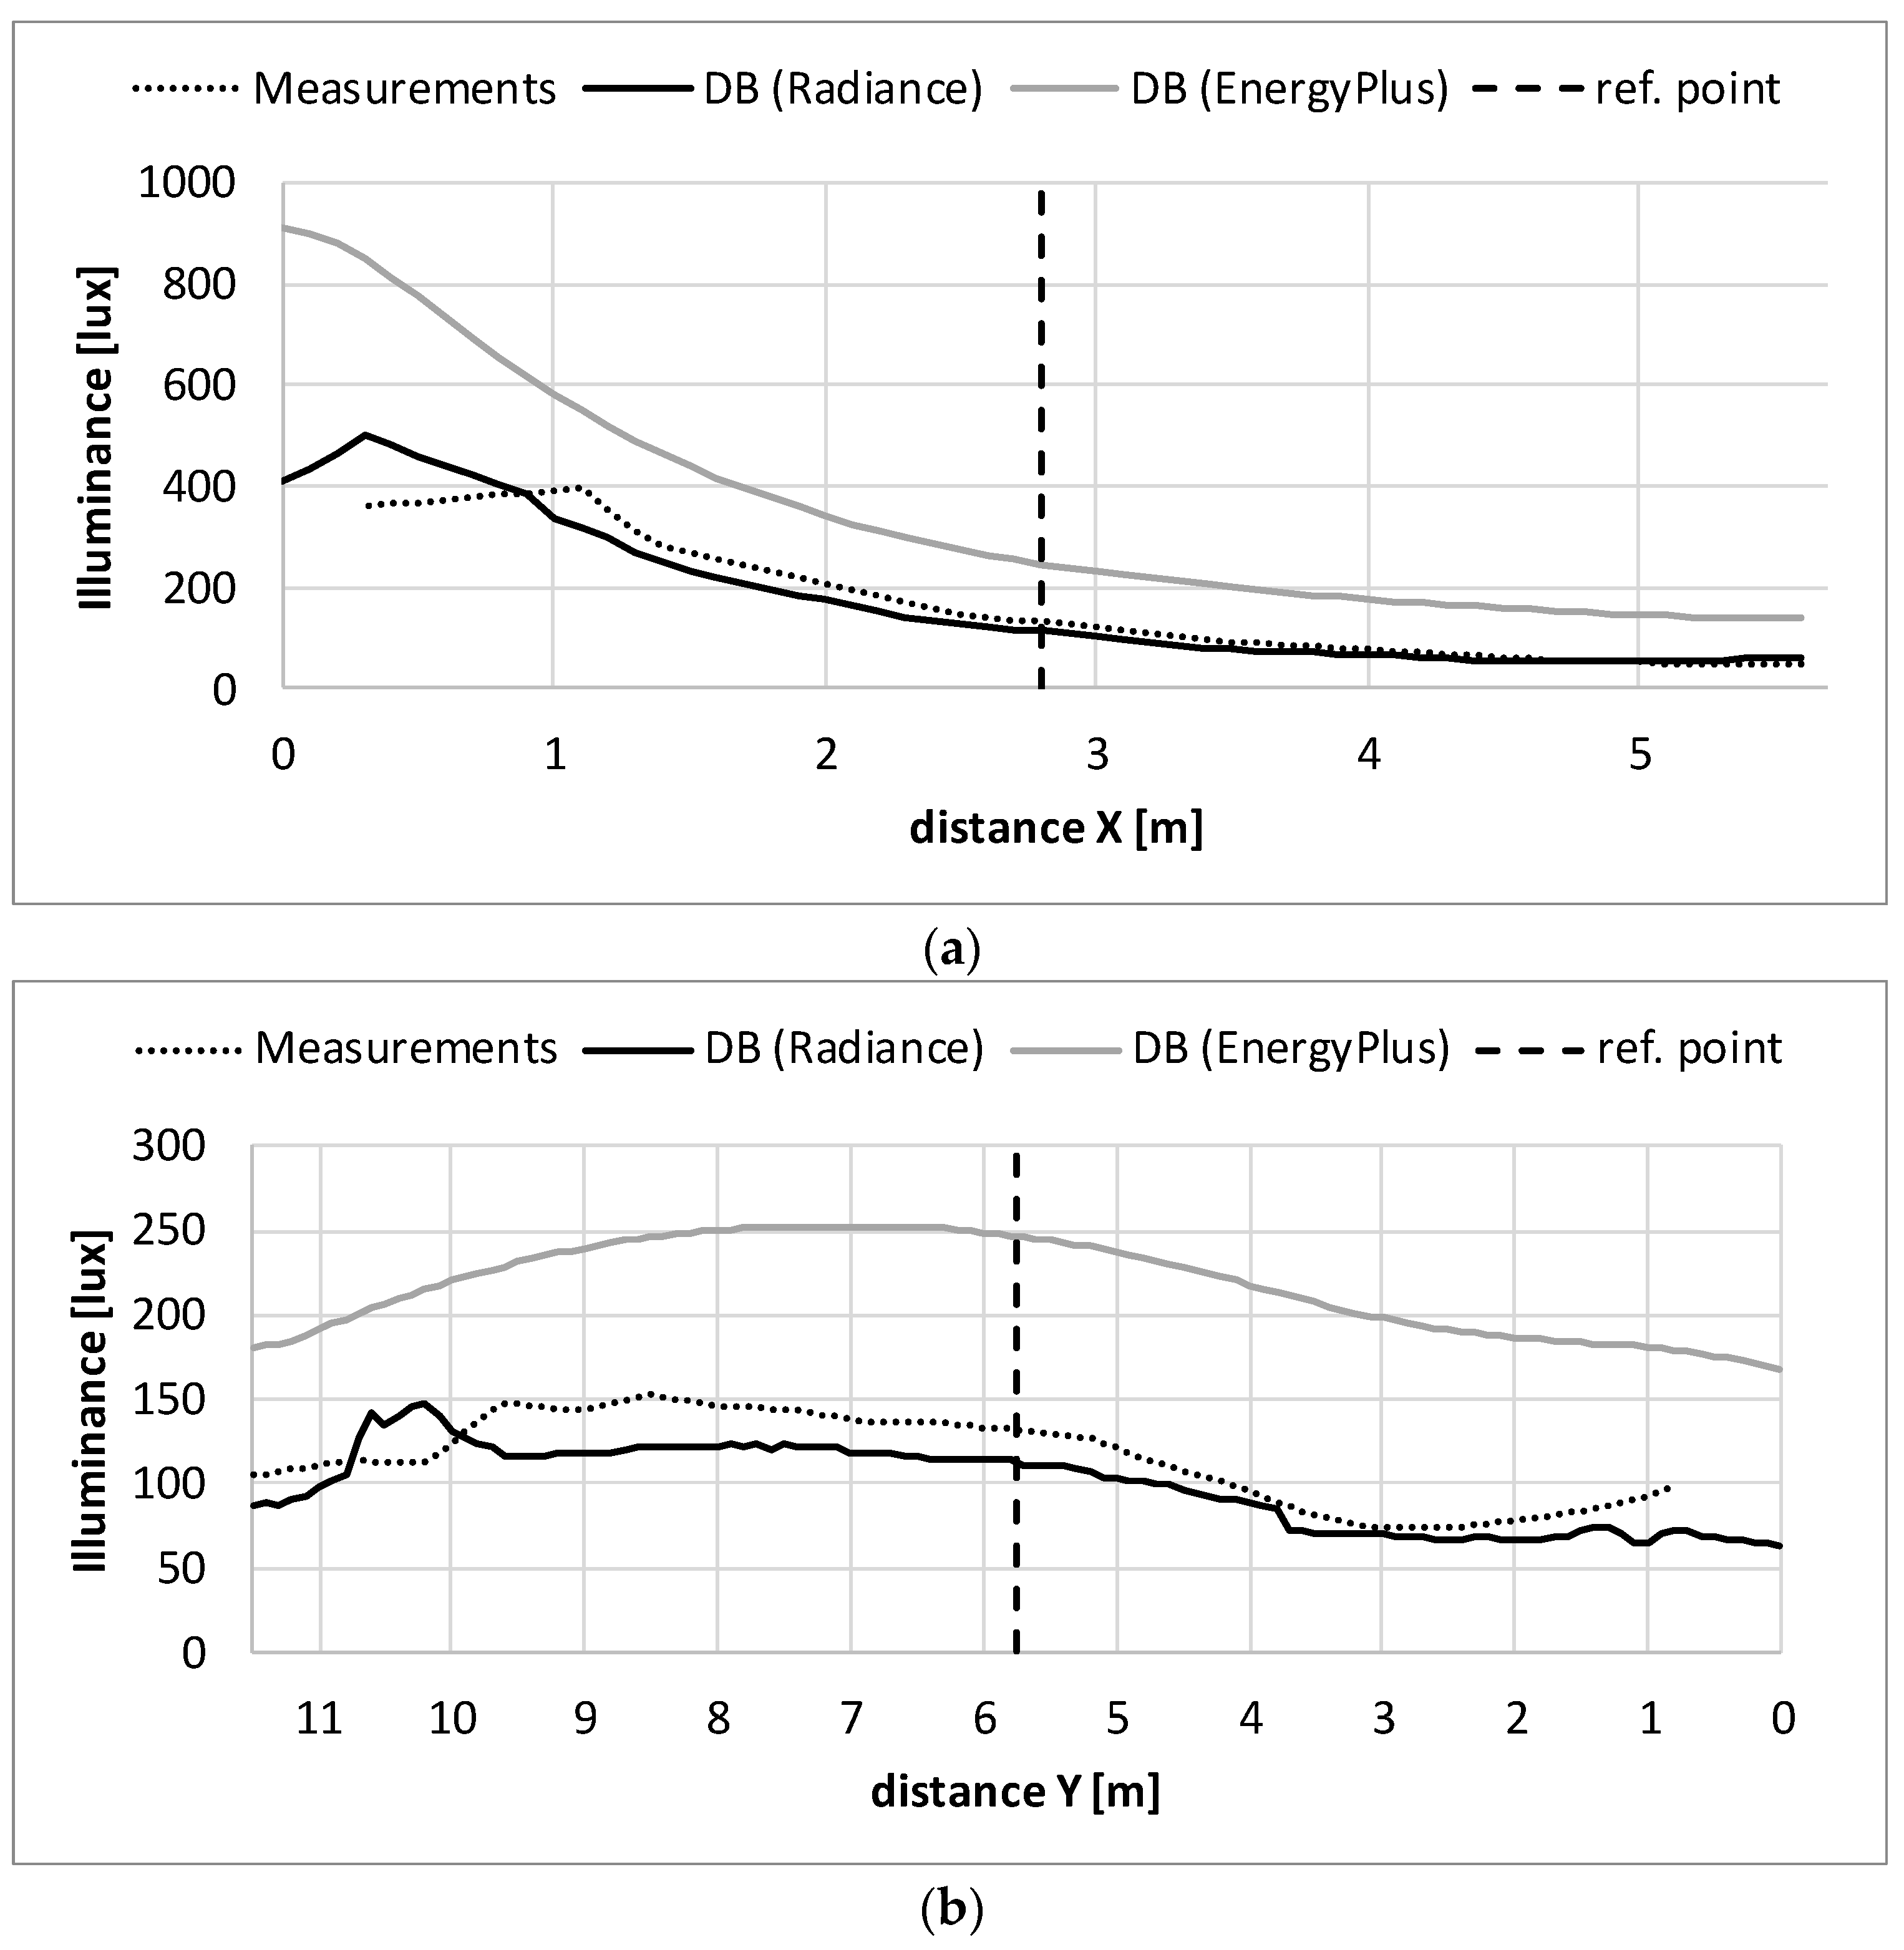
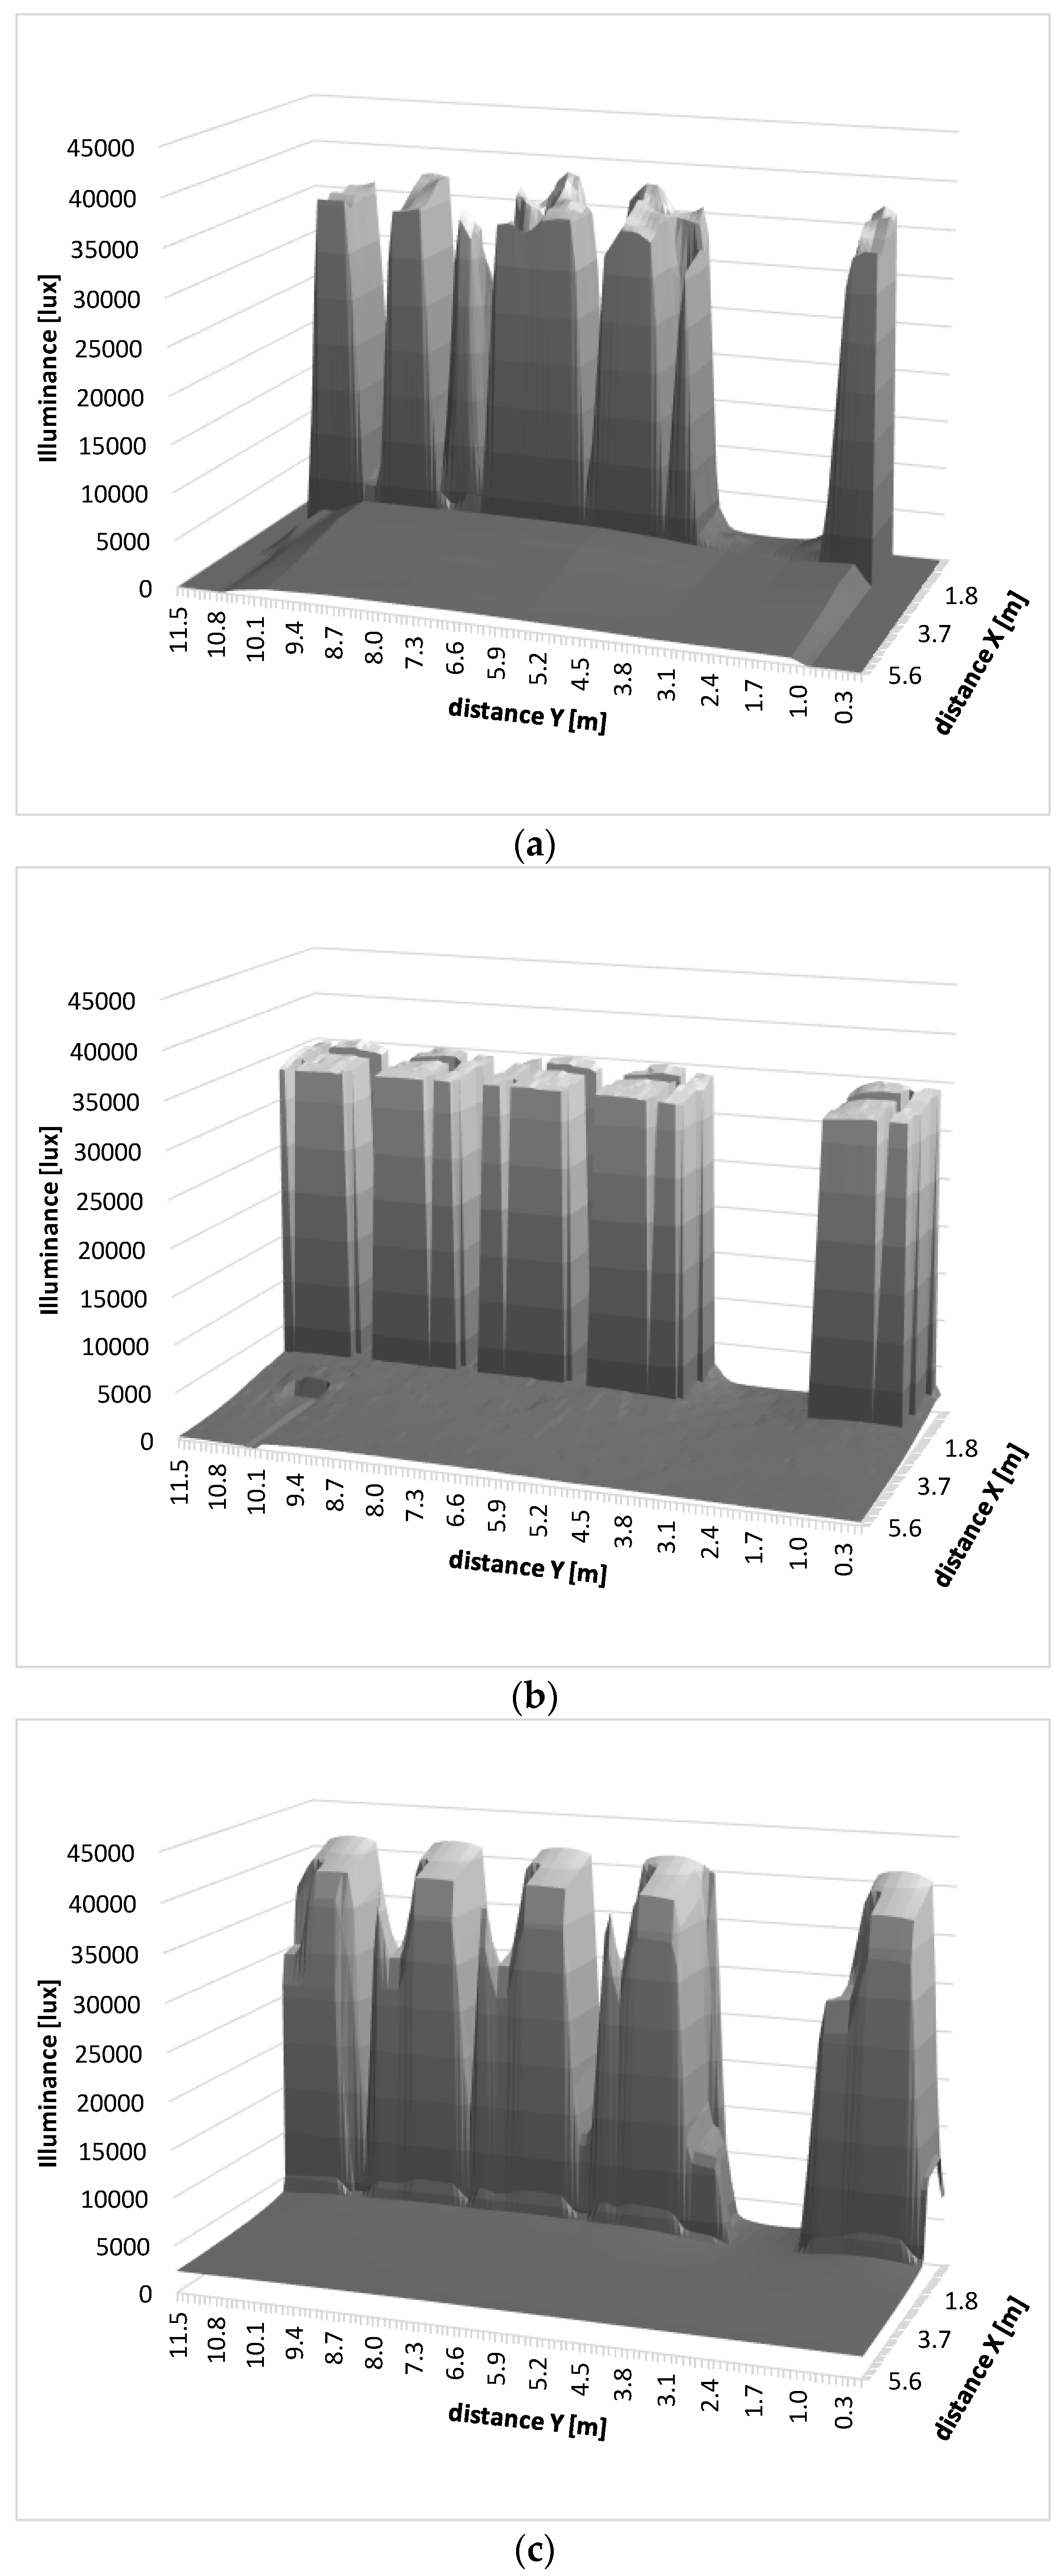
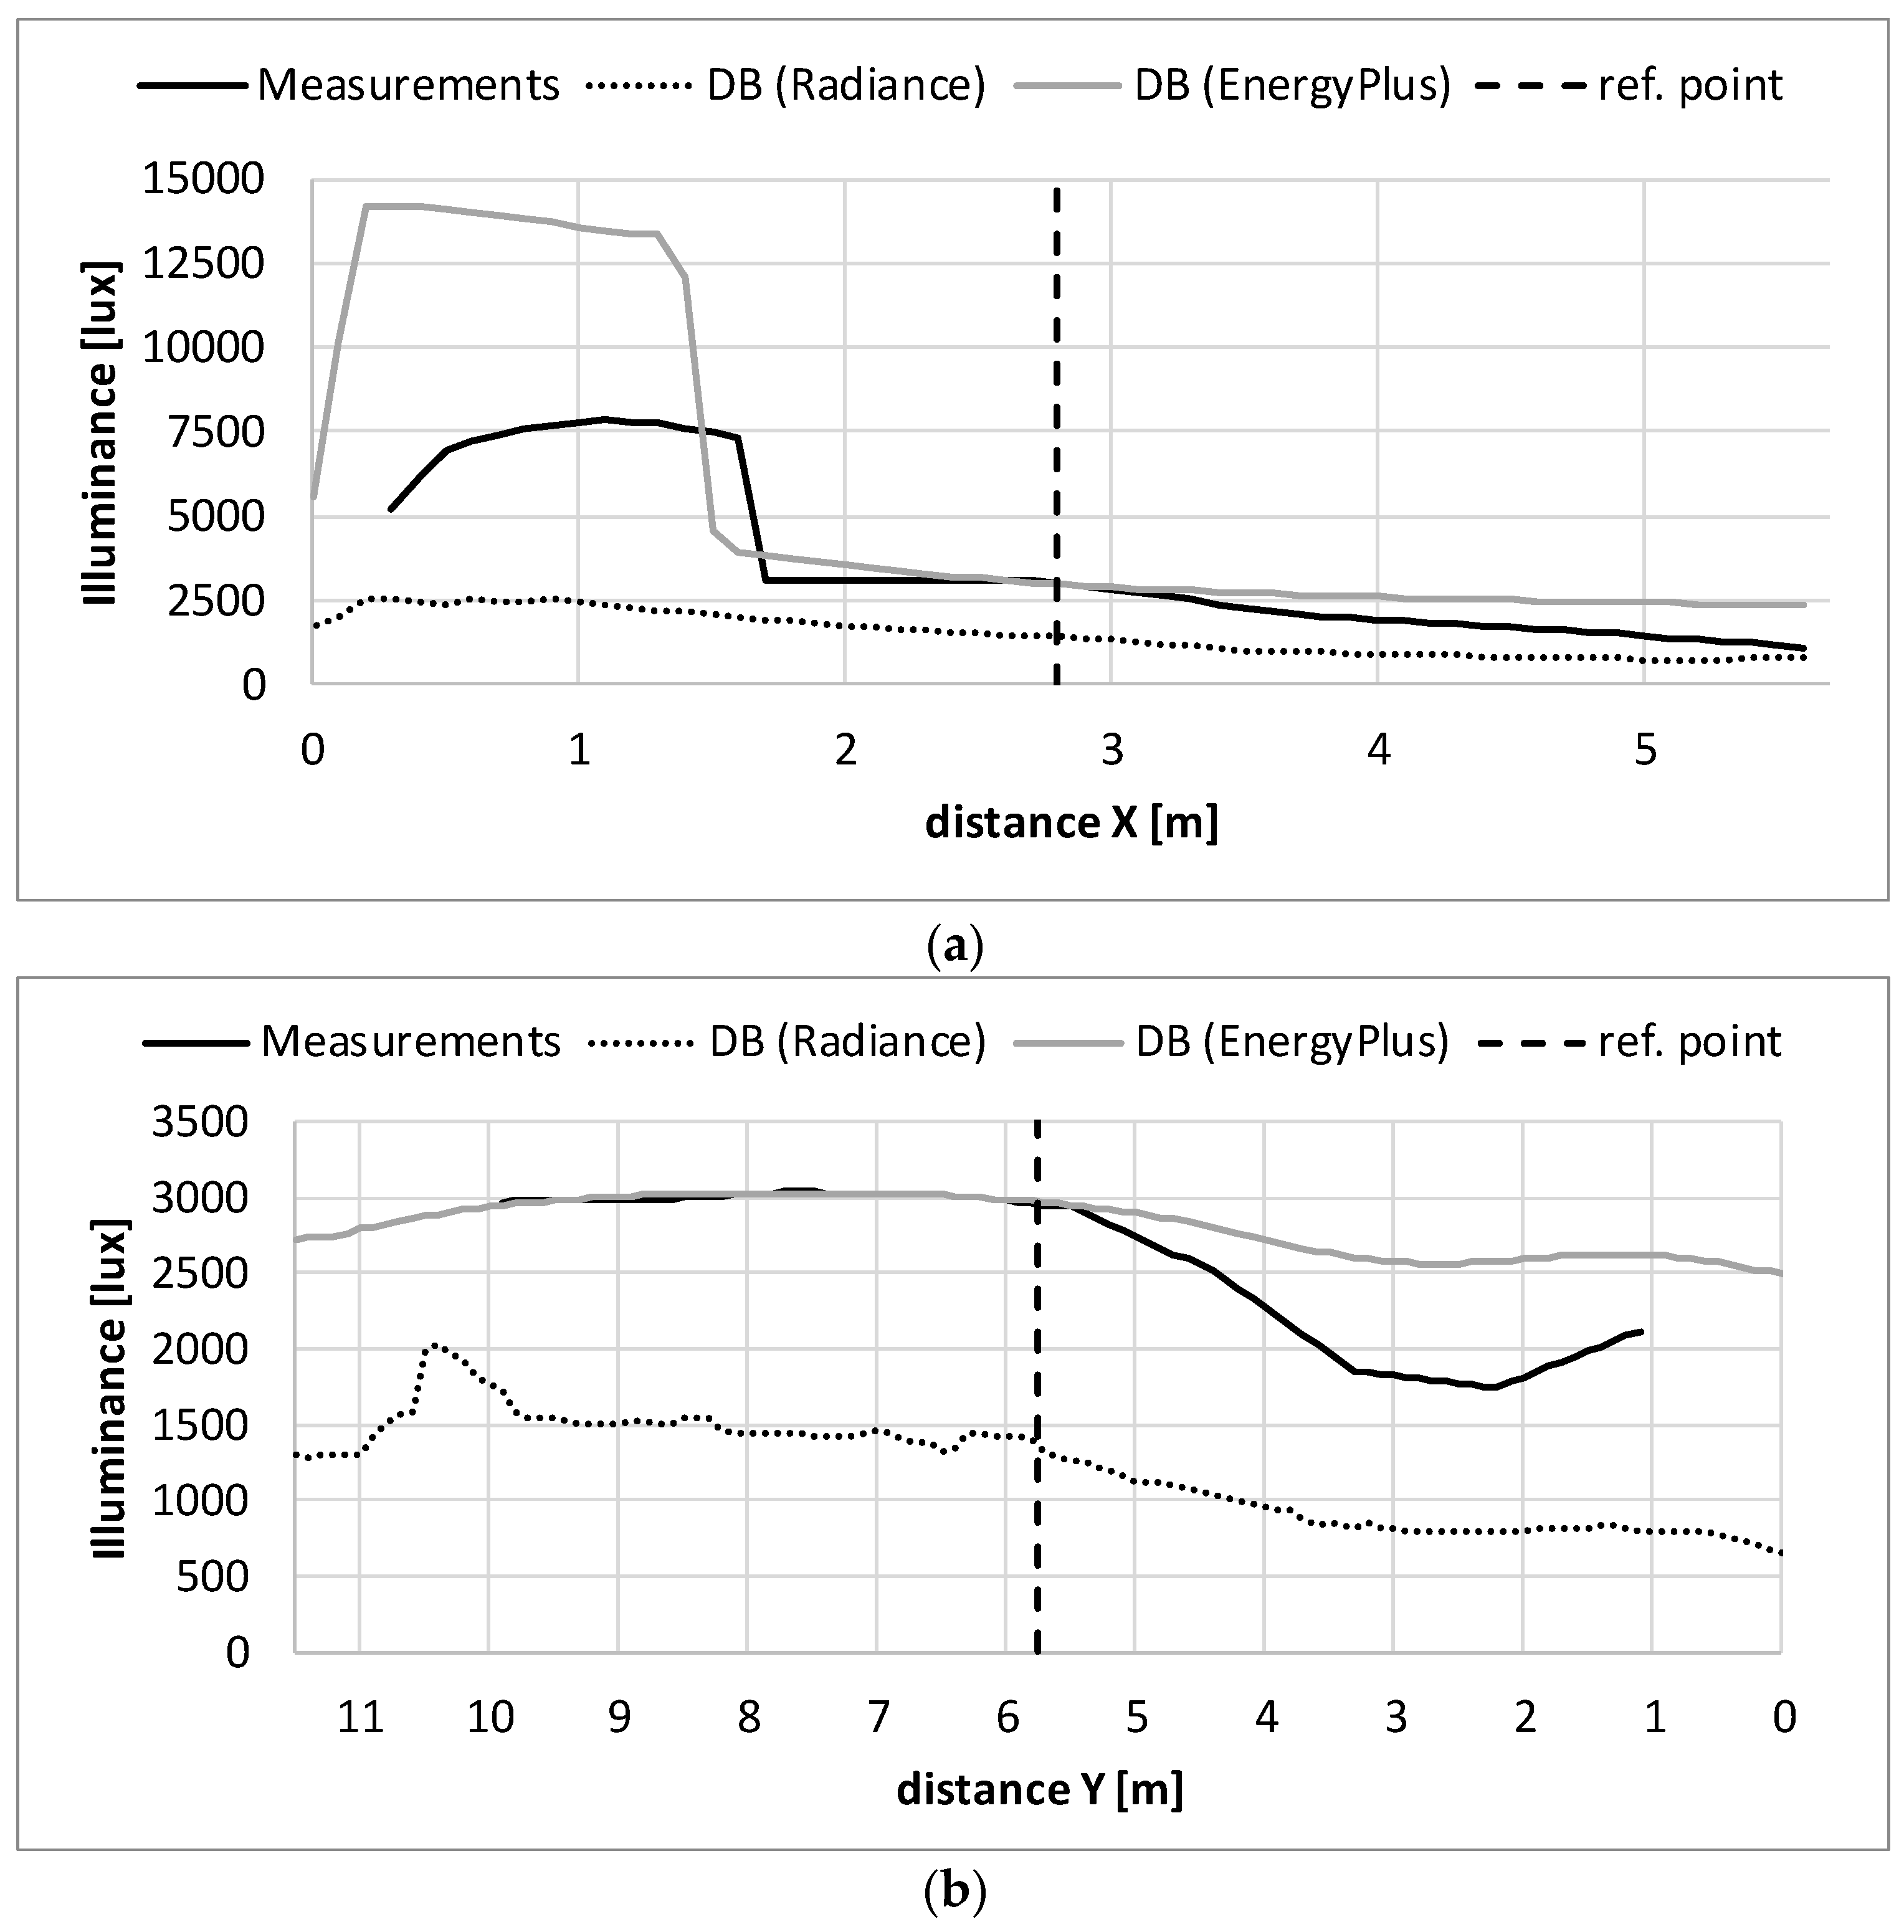
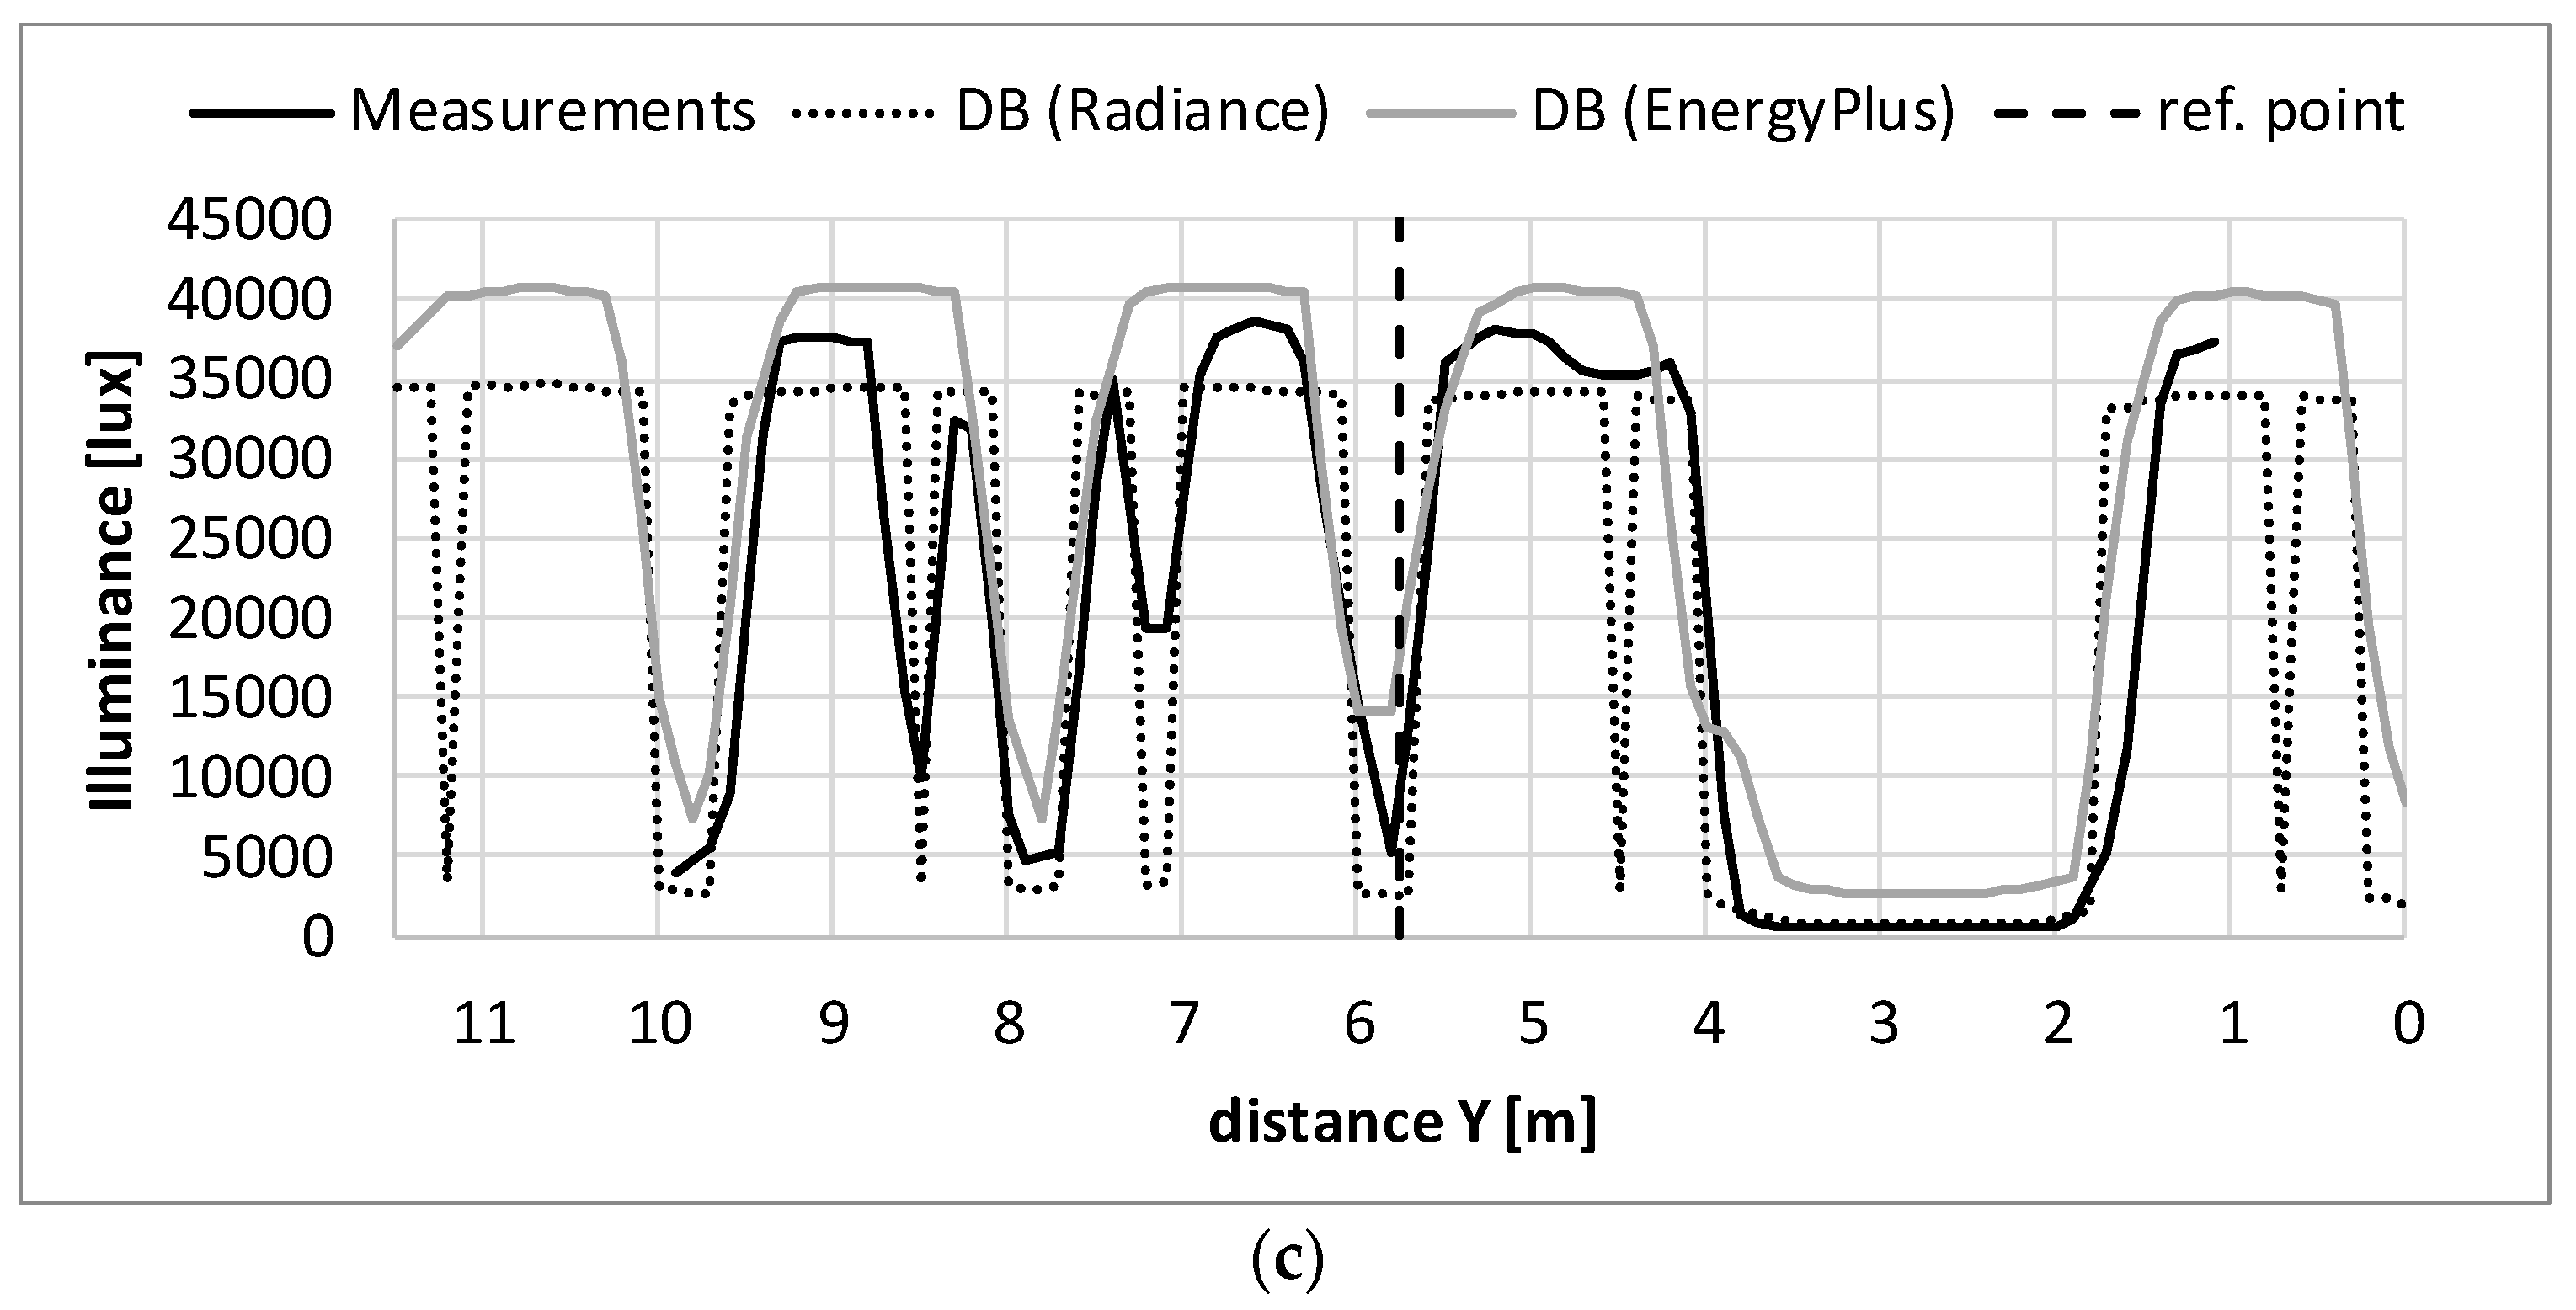
3.1. Daylight Distribution

The analysis of the measurements and simulations results indicated that the calculated level of illuminance can differ significantly from the results of measurements. Although the general characteristics of the measured and calculated illuminance distribution were similar, there were significant deviations in the illuminance level across the room. Most importantly, the nature of these differences varied and depended on both the outside illuminance conditions and the location in the analyzed room.
In general, in the case of the overcast sky on 11 January 2019, the EnergyPlus model produced results that indicated much higher illuminance than the measured values, while the deviations of the Radiance model were much smaller (Figure 6).
The accuracy of both models was further verified for the area where the three rows of benches are located. For this purpose, the minimum, maximum and arithmetic average of the illuminance values for points located in the three working areas (rows I, II, and III) marked in Figure 3 were analyzed (Table 2). According to the results, the average illuminance for the first row of benches (nearest to the windows) was over 60% higher than the average of measured values in case of the EnergyPlus model and nearly 13% lower in the case of the Radiance model. For the second row, the differences were +102% and −15%, respectively, while for the third row, it was +204% and +13%.
The energy demand calculations in Design Builder are not based on the distribution of daylight but on the illuminance value calculated for a selected reference point location. The figures (Figure 7a,b) present the daylight illuminance profiles along the lines intersecting in the geometrical center of the room—the default reference point location. According to the results, the daylight illuminance level for the reference point calculated by the EnergyPlus model is much higher than the measured value (+87%), whereas the illuminance calculated by the Radiance model is slightly lower (−16%). Similar differences can be recorded along the length of both profiles with some exceptions, e.g., the immediate vicinity of windows.
In the case of the sunny clear day conditions on 21 September 2018 again the illumination levels calculated by the EnergyPlus model were mostly higher than the measured values, however the deviations of the Radiance model were much higher compared to the deviations for the overcast day (Figure 8).
According to the results, the average illuminance for the first row was over 23% higher than the average of measured values for the EnergyPlus model and nearly 13% lower for the Radiance model (Table 3). For the second row, the differences were +19% and −53% respectively, whereas for the third row they were +100% and −43%.
In this case, daylight illuminance value at the reference point calculated by the EnergyPlus model was almost the same as the measured value (+0.4%), whereas the illuminance calculated by the Radiance model was much lower (−52%). Moreover, the differences varied along the length of both profiles. Significant deviations from the measured values in the vicinity of windows were caused by the fact that the profile ran in a line between windows and even a small displacement in time and/or location could have had a huge impact. Figure 9c presents profiles along the length of the room, 0.3 m from windows, where the impact of the given location can be seen more clearly.
Comparison of simulation results made with two different methods with the measurement results indicated some deviations in the illuminance level across the room for both methods. The Radiance method provided very similar results to the results of measurements in case of the cloudy conditions (up to about 15% variation), while in case of the sunny conditions the differences were more significant (up to about 53%). One of the reasons for this might be the way sunlight conditions in this method are defined. In the case of cloudy conditions, the exact value of the external illuminance is entered, while the value for sunny conditions is defined on a basis of standard conditions. This problem affects both the total value of the external illuminance, as well as the share of the diffuse radiation due to the actual clearness of the atmosphere. Some of the differences might be caused by the difference between the actual level and distribution of reflectance values of the surfaces in the room. As these surfaces didn’t have uniform visual absorptance it was extremely difficult to estimate a correct visual reflectance value.
In the case of the EnergyPlus method, despite the use of actual values of solar irradiation, both the level and distribution of illumination similarity with measurement results was worse than in the case of the Radiance method. In this case, the source of the differences could be that the method is based on interpolation of pre calculated daylight factors, that are interpolated accordingly to the current time step’s sun position and sky condition. As a results these conditions may not accurately reflect actual conditions.
It should be noted that both models quite well and comparatively render the profiles of the distribution of illumination in the room. Therefore, in the case of year-round calculations for which the assumptions regarding standard conditions will be met, compliance of the results should be satisfactory.

3.2. Energy Demand Simulations

Simulations of the energy demand were performed for a single room under different conditions. This made it possible to observe some dependencies that would have been blurred when analyzing the entire building.
Table 4 presents the annual results of the energy demand for heating, cooling, lighting and primary energy balance (PE) for analysis.
The analysis of the simulation results confirmed the important and complex role of windows in shaping the energy balance of buildings and allowed us to formulate several interesting conclusions.
The energy needs required for lighting in modern educational rooms are as important as other energy needs. For the analyzed room, depending on the variant, the share of lighting in the overall usable energy demand varied from 22% to 48%. In case of the primary energy analysis the importance of lighting is even higher. The primary energy factor value for lighting is usually much higher than for the energy sources used for heating and cooling. According to the energy efficiency directive (Directive 2012/27/EU), the average for the member states (Primary Energy Factor) PEF value for electricity is 2.5. Assuming the use of electricity based energy sources such as a reversible air to air heat pump for heating and cooling, with seasonal efficiency of heating (Seasonal Performance Factor) SPF = 3.0 and cooling (Seasonal Energy Efficiency Ratio) SEER = 4.0 the primary energy demand share varied from 49% to 76%.
Such a high share of lighting in the energy balance of the room shows how important it is to correctly design the lighting system. The designer should take into account both the location and parameters of the windows as well as the use of an appropriate lighting control system.
An automatic lighting control system based on the intensity of natural light in the room can provide significant energy savings not only in terms of the demand for lighting but also cooling as it reduces the heat gains form unnecessary lighting. In the case of the analyzed room, the possible usable energy savings were between 52% and 68% in case of lighting and from 50% up to 61% for cooling. The drawback of the control system was the 17%–22% increase of the demand for heating.
A proper selection of the reference point location is important for the sake of correct estimation of the energy demand. For the two analyzed locations, the difference in the demand for lighting varied from 9% to 14%. In rooms where the distribution of daylight is more irregular, the selection of the reference point location can be even more important.
The selection of the method of calculation can have a great impact on the accuracy of the results. According to the results, the difference in the energy demand for lighting calculated with the Detailed method and the DELight method varied from 2% to 37%. The most important deficiency of the DELight method was that it did not take into account the orientation of the room, and consequently, the demand for the southern orientation was overestimated by 20%–37% in comparison to the detailed method.
The use of windows with a lower U-value does not guarantee better energy balance. For example, in the case of the variants #1 and #2, the use of a lower U value windows results in the reduction of the useful energy demand by 84 kWh/a for heating and 106 kWh/a for cooling, whereas the lighting demand increased by 66 kWh/a. In terms of the primary energy balance, it would result in an increase of the overall primary energy consumption by 26 kWh/a. The difference is even more significant in case of the north oriented room in variants #4 and #5, where, despite the lower U value, the increase of the primary energy consumption is 90 kWh/a.
The difference could be even more significant if we consider the use of optimization measures like passive and active shading devices or advanced automatic lighting control systems adapting the power of individual luminaires. However, the problem here may be the possibility to include these solutions in simulations, e.g., Design Builder software used in this research does not allow to adjust the power of individual luminaries accordingly the distribution of natural lighting.
The results of the analysis showed that the choice of window parameters in the designed buildings should not be based on a single performance indicator such as U-value, but should be based on the overall energy balance, that takes into account the energy demand for heating, cooling and lighting. As a result, you may need to use a different type of window depending on the orientation of the facade or other factors such as the function of the room.

4. Conclusions

This study analyzed the distribution of illuminance resulting from the use of daylighting in an educational room. The results of measurements were used to verify the accuracy of the numerical models used for lighting design and energy simulations. Indicated discrepancies between the measurements and the results of simulations could have been caused both by the inaccuracy of the models used as well as the inability to use accurate environmental data. However, in the case of year-round calculations for which the assumptions regarding standard conditions will be met, compliance of the results should be satisfactory.
The radiance model provided a more accurate representation of the natural light distribution for the defined intensity of external illuminance (cloudy day) than the Energy plus model, but unspecified external illuminance for a sunny clear day conditions resulted in significant deviations in the simulated levels of illuminance. The high compliance of the generated illuminance profiles for both models confirms that they allow to significantly increase the quality of the design of lighting systems through a better adaptation to the actual conditions.
The results of the annual energy demand simulations obtained with the Design Builder software indicated both the importance and complexity of windows in shaping the energy performance of buildings. Changes of window parameters resulted in significant variations of all three primary elements of the balance, i.e., heating, cooling, and lighting. Although the presented simulation results relate to an example room in a given location, the obtained results illustrate universal problems concerning the impact of fenestration systems for various buildings and locations.
In the case of the analyzed educational room, the share of usable energy demand for artificial lighting reached 48%, while the primary energy demand reached 76%. The simulated possible energy savings for lighting and cooling due to the use of a lighting control system based on the natural light availability indicated a large potential for energy consumption reduction. This indicates the need to take into account the efficiency of lighting systems during the design process of buildings and their systems.
Differences in the simulated energy demand caused by changes of window properties, the use of a different daylight model, or the reference point position indicated the importance of using appropriate tools and due diligence, both of which are required to correctly determine the actual energy balance of buildings as well as to select the optimal parameters of windows.

Author Contributions

J.R. and A.T. planned and carried out the experiment. They developed and carried out the research methodology and performed the calculations. Both authors contributed to the final version of the manuscript. All authors have read and agreed to the published version of the manuscript.

Funding

This research received no external funding.

Conflicts of Interest

The authors declare no conflict of interest.

References

  1. Council, E. Directive 2010/31/EU of the European Parliament and of the Council of 19 May 2010 on the energy performance of buildings. Off. J. Eur. Union 2010, 153, 13–35. [Google Scholar]
  2. Chandel, S.S.; Sharma, A.; Marwaha, B.M. Review of energy efficiency initiatives and regulations for residential buildings in India. Renew. Sustain. Energy Rev. 2016, 54, 1443–1458. [Google Scholar] [CrossRef]
  3. Annunziata, E.; Frey, M.; Rizzi, F. Towards nearly zero-energy buildings: The state-of-art of national regulations in Europe. Energy 2013, 57, 125–133. [Google Scholar] [CrossRef]
  4. Avasoo, D. The European Window Energy Labelling Challenge. ECEEE Summer Study. 2007. Available online: https://www.eceee.org/static/media/uploads/site-2/library/conference_proceedings/eceee_Summer_Studies/2007/Panel_6/6.342/paper.pdf (accessed on 10 July 2018).
  5. Rosenberg, M.; Jonlin, D.; Nadel, S. A Perspective of Energy Codes and Regulations for the Buildings of the Future. J. Sol. Energy Eng. 2016, 139. [Google Scholar] [CrossRef] [Green Version]
  6. Lee, D.H.W. Daylighting and its implications to overall thermal transfer value (OTTV) determinations. Energy 2002, 27, 991–1008. [Google Scholar]
  7. Directive 2018/844/EU of the European Parliament and of the Council of 30 May 2018 Amending Directive 2010/31/EU on the Energy Performance of Buildings and Directive 2012/27/EU on Energy Efficiency. Available online: https://eur-lex.europa.eu/legal-content/EN/TXT/PDF/?uri=CELEX:32018L0844&from=EN (accessed on 10 July 2018).
  8. Eurostat 2019. Available online: https://ec.europa.eu/energy/en/eu-buildings-database (accessed on 26 June 2019).
  9. Persson, M.-L.; Roos, A.; Wall, M. Influence of window size on the energy balance of low energy houses. Energy Build. 2006, 38, 181–188. [Google Scholar] [CrossRef]
  10. Poirazis, H.; Blomsterberg, Å.; Wall, M. Energy simulations for glazed office buildings in Sweden. Energy Build. 2008, 40, 1161–1170. [Google Scholar] [CrossRef]
  11. Gasparella, A.; Pernigotto, G.; Cappelletti, F.; Romagnoni, P.; Baggio, P. Analysis and modelling of window and glazing systems energy performance for a well insulated residential building. Energy Build. 2011, 43, 1030–1037. [Google Scholar] [CrossRef]
  12. Doulos, L.T.; Kontadakis, A.; Madias, E.N.; Sinou, M.; Tsangrassoulis, A. Minimizing energy consumption for artificial lighting in a typical classroom of a Hellenic public school aiming for near Zero Energy Building using LED DC luminaires and daylight harvesting systems. Energy Build. 2019, 194, 201–217. [Google Scholar] [CrossRef]
  13. de Rubeis, T.; Nardi, I.; Muttillo, M.; Ranieri, S.; Ambrosini, D. Room and window geometry influence for daylight harvesting maximization—Effects on energy savings in an academic classroom. Energy Procedia 2018, 148, 1090–1097. [Google Scholar] [CrossRef]
  14. Dussault, J.-M.; Gosselin, L.; Galstian, T. Integration of smart windows into building design for reduction of yearly overall energy consumption and peak loads. Sol. Energy 2012, 86, 3405–3416. [Google Scholar] [CrossRef]
  15. Lee, J.W.; Jung, H.J.; Park, J.Y.; Lee, J.B.; Yoon, Y. Optimization of building window system in Asian regions by analyzing solar heat gain and daylighting elements. Renew. Energy 2013, 50, 522–531. [Google Scholar] [CrossRef]
  16. Chen, Y.; Liu, J.; Pei, J.; Cao, X.; Chen, Q.; Jiang, Y. Experimental and simulation study on the performance of daylighting in an industrial building and its energy saving potential. Energy Build. 2014, 73, 184–191. [Google Scholar] [CrossRef]
  17. Hee, W.J.; Alghoul, M.A.; Bakhtyar, B.; Elayeb, O.K.; Shameri, M.A.; Alrubaih, M.S.; Sopian, K. The roleofwindow glazing on daylightingand energy saving in buildings. Renew. Sustain. Energy Rev. 2015, 42, 323–343. [Google Scholar] [CrossRef]
  18. Fontoynont, M.; Ramananarivo, K.; Soreze, T.; Fernez, G.; Guldhammer Skov, K. Economic feasibility of maximising daylighting of a standard office building with efficient electric lighting. Energy Build. 2016, 110, 435–442. [Google Scholar] [CrossRef] [Green Version]
  19. Ramírez-Balas, C.; Fernández-Nieto, E.; Narbona-Reina, G.; Sendra, J.J.; SuárezThermal, R. 3D CFD Simulation with Active Transparent Façade in Buildings. Energies 2018, 11, 2265. [Google Scholar] [CrossRef] [Green Version]
  20. Peng, J.; Curcijac, D.C.; Lub, L.; Selkowitz, S.E.; Yang, H.; Zhang, W. Numerical investigation of the energy saving potential of a semi-transparent photovoltaic double-skin facade in a cool-summer Mediterranean climate. Appl. Energy 2016, 165, 345–356. [Google Scholar] [CrossRef]
  21. Flores Larsen, S.; Rengifo, L.; Filippín, C. Double skin glazed façades in sunny Mediterranean climates. Energy Build. 2015, 102, 18–31. [Google Scholar] [CrossRef]
  22. Foraboschi, P. Laminated glass columns. Struct. Eng. 2009, 87, 20–26. [Google Scholar]
  23. Radiance, About Radiance. 2019. Available online: https://www.radiance-online.org/about (accessed on 14 December 2019).
  24. VELUX, Daylight Visualizer. 2019. Available online: www.velux.com/article/2016/daylight-visualizer (accessed on 14 December 2019).
  25. Reinhart, C.; Walkenhorst, O. Dynamic RADIANCE-based daylight simulations for a full-scale test office with outer venetian blinds. Energy Build. 2011, 33, 683–697. [Google Scholar] [CrossRef]
  26. Reinhart, C.; Andersen, M. Development and validation of a Radiance model for a translucent panel. Energy Build. 2006, 38, 890–904. [Google Scholar] [CrossRef]
  27. DIALux. Lighting Design Software DIALux. 2019. Available online: https://www.dial.de/en/dialux-desktop/ (accessed on 14 December 2019).
  28. EnergyPlus. Energy Plus Software Manual 8.3.0; EnergyPlus: Indianapolis, IN, USA, 2015. [Google Scholar]
  29. Design Builder. Design Builder Software Manual 4.7.0.027; Design Builder: London, UK, 2016. [Google Scholar]
  30. Dial+. Energy Simulation Tool. 2019. Available online: https://www.dialplus.ch/home (accessed on 14 December 2019).
  31. IDA ICE. Energy Simulation Tool. 2019. Available online: https://www.equa.se/en/ida-ice (accessed on 14 December 2019).
  32. IESVE. Energy Simulation Tool. 2019. Available online: https://www.iesve.com (accessed on 14 December 2019).
  33. Bellia, L.; Pedace, A.; Fragliasso, F. The impact of the software’s choice on dynamic daylight simulations’ results: A comparison between Daysim and 3ds Max Design. Sol. Energy 2015, 122, 249–263. [Google Scholar] [CrossRef]
  34. Reinhart, C.; Breton, P.-F. Experimental validation of 3ds Max® design 2009 and Daysim 3.0. In Proceedings of the Eleventh International IBPSA Conference, Glasgow, Scotland, 27–30 July 2009. [Google Scholar]
  35. Ramos, G.; Ghisi, E. Analysis of daylight calculated using the EnergyPlus programme. Renew. Sustain. Energy Rev. 2010, 14, 1948–1958. [Google Scholar] [CrossRef]
  36. Loutzenhiser, P.G.; Maxwell, G.M.; Manz, H. An empirical validation of the daylighting algorithms and associated interactions in building energy simulation programs using various shading devices and windows. Energy 2007, 32, 1855–1870. [Google Scholar] [CrossRef]
  37. Yun, G.; Kim, K.S. An empirical validation of lighting energy consumption using the integrated simulation method. Energy Build. 2013, 57, 144–154. [Google Scholar] [CrossRef]
  38. Merghani, A.H.; Bahloul, S.A. Comparison between Radiance Daylight Simulation Software Results and Measured on-Site Data. J. Build. Road Res. 2017, 20, 49–69. [Google Scholar]
  39. Acosta, I.; Navarro, J.; Sendra, J.J. Towards an Analysis of Daylighting Simulation Software. Energies 2011, 4, 1010–1024. [Google Scholar] [CrossRef] [Green Version]
  40. Loura, R.M.; De Assis, E.S.; de Souza, R.V.G. Analysis of EnergyPlus daylighting module results—A Brazilian case. In Proceedings of the Eleventh International IBPSA Conference, Glasgow, Scotland, 27–30 July 2009. [Google Scholar]
  41. Ayoub, M. 100 Years of daylighting: A chronological review of daylight prediction and calculation methods. Sol. Energy 2019, 194, 360–390. [Google Scholar] [CrossRef]
  42. Haberl, J.S.; Kota, S. Historical Survey of Daylighting Calculations Methods and Their Use in Energy Performance Simulations. In Proceedings of the Ninth International Conference for Enhanced Building Operations, Austin, TX, USA, 17–19 November 2009. [Google Scholar]
  43. Reinhart, C.; Fitz, A. Findings from a survey on the current use of daylight simulations in building design. Energy Build. 2006, 38, 824–835. [Google Scholar] [CrossRef] [Green Version]
  44. Galasiu, A.D.; Reinhart, C.F. Current daylighting design practice: A survey. Build. Res. Inf. 2008, 36, 159–174. [Google Scholar] [CrossRef]
  45. Dornelles, K.; Roriz, M. A Method to Identify the Solar Absorptance of Opaque Surfaces with a Low-cost Spectrometer. In Proceedings of the Passive and Low Energy Architecture, Geneva, Switzerland, 6–8 September 2006. [Google Scholar]
  46. ISO 15469:2004(E)/CIE S 011/E:2003. Spatial distribution of daylight—CIE Standard General Sky; International Commission on Illumination: Geneva, Switzerland, 2004. [Google Scholar]
  47. KODnZEB, Thermo-modernization of two chosen Public Buildings According to nZEB Standards. 2018. Available online: www.kodnzeb.pl (accessed on 5 January 2018).
Figure 1. Visualization of the model of the building and its surroundings.
Energies 13 02555 g001
Figure 2. A photograph and visualization of the lecture hall 210.
Energies 13 02555 g002
Figure 3. The distribution of measurement points.
Energies 13 02555 g003
Figure 4. Correlation between external horizontal illuminance and global solar irradiation.
Energies 13 02555 g004
Figure 5. Location of reference points in the room.
Energies 13 02555 g005
Figure 6. Illuminance distribution for cloudy conditions (11 January 2019) (a) measured at 8:48–9:09, (b) DB (Radiance) 9:00, ext. illuminance 5251 lx, (c) DB (EnergyPlus) 9:00, irradiation 47.68 W/m2.
Energies 13 02555 g006aEnergies 13 02555 g006b
Figure 7. Daylight illuminance profiles in the room for cloudy conditions (11 January 2019 9:00) (a) along the width (b) along the length.
Energies 13 02555 g007
Figure 8. Illuminance distribution for sunny conditions (21 September 2018) (a) measured from 11:40–12:34, (b) DB (Radiance) 12:00, sunny clear day, (c) DB (EnergyPlus) 12:00, irradiation 610.64 W/m2.
Energies 13 02555 g008
Figure 9. Daylight illuminance profiles in the room for sunny conditions (21 September 2018 12:00) (a) along the width (b) along the length (center) (c) along the length (0.3 m from windows).
Energies 13 02555 g009aEnergies 13 02555 g009b
Table 1. Characteristic parameters of building envelope.
U-ValueW/(m2 K)
wall south facade0.24
other external walls1.00
roof0.23
internal walls1.90
windows1.49
solar energy transmittance of windows (gg)0.57
light transmission coefficient of windows (Lt)0.74
visible absorptance
walls0.50
celling0.30
floor0.50
tables0.30
Table 2. Illuminance values summary for cloudy conditions (11 January 2019).
Row Illuminance [lx]Simulation/Measurement
min.max.avg.
IMeasurements59616353-
DB (Radiance)405703090.88
DB (EnergyPlus)2579415701.61
IIMeasurements57180108-
DB (Radiance)47157920.85
DB (EnergyPlus)1542952182.02
IIIMeasurements276546-
DB (Radiance)3170521.13
DB (EnergyPlus)1241571403.04
Table 3. Illuminance values summary for sunny conditions (21 September 2018).
Row Illuminance [lx]Simulation/Measurement
min.max.avg.
IMeasurements42738,75721,078-
DB (Radiance)70034,69918,2630.87
DB (EnergyPlus)254440,85325,9521.23
IIMeasurements43331342353-
DB (Radiance)603173710980.47
DB (EnergyPlus)2442327327971.19
IIIMeasurements18917051188-
DB (Radiance)4039296790.57
DB (EnergyPlus)2254249923752.00
Table 4. Summary of the simulation results.
ModelReference PointOrientationWindows VariantVariant
#
HeatingCoolingLightingPE
kWh/akWh/akWh/akWh/a
Detailed1S1110649025592848
229807966242874
337489796242795
N1416853156983346
2513933128323436
3611033918323244
2S1710459286132983
289628326913049
3973410286912982
N11016363277943553
21113443499673756
31210644509673585
DELight1S11310189586823152
2149268747843278
31570710867843228
N11617013206823323
21714213117843339
31811273837843139
2S11998410348103491
2208939919453726
32168112269453696
N12216403408103604
22313593549453716
32410774529453543
No controlNo reference pointS125874182517546254
226806170517546122
327614197517546131
N128138677517546024
229118281217545878
33094294217545759

