Abstract
A container terminal is a high energy demanding organization. Giving priority to the investments that have a better impact on the minimization of energy consumption is a prime concern of the management board of the Port Authority and container terminals. This study presents a tool for the classification of the processes that take place in the port. The Relevant Use of Energy (RUE) index is described and applied to a case study, the Port Authority of Valencia, which is the main port of the Mediterranean in container traffic. Three different functional units have been discussed for the assessment: Twenty-foot Equivalent Units (TEU), cargo handled, and several container ships that operate in the port. The implementation of specific projects following the recommendation of the RUE Index validated the tool and allowed a reduction of the energy intensity of 29.5%, and a 40% reduction of the cost of energy per TEU between 2008 and 2016. However, there is still room for improvement, and project lines are proposed for this matter. A partnership between the RUE Index and an energy management system ISO 50001 certified and ensures quality data giving confidence to the decision-making process of the management board.
1. Introduction
Achieving a carbon-neutral economy is a priority [1]. The adequate management of the sources of energy is a key aspect of this mission. Ports, as nodes of the global economy, are expected to reduce emissions and energy consumption along the whole maritime supply chain [2]. Furthermore, port authorities are looking to protect local communities from any negative effect caused by their operations [3]. The minimization of energy consumption, together with air quality control is the main concern of European ports [4].
When assessing the energy consumption of an organization in absolute values, the evolution is irregular and unpredictable as external factors are involved. For example, the global economy influences the market and determines the business volume of a subsequent period even five years later. To make operational and investment decisions, relative values are needed. Traditionally, the energy intensity is calculated in economic terms (per units of gross domestic product, GDP) to assess the energy efficiency of a country or region [5]. This study proposes a tool with a more useful definition for decision-makers on an organization scale, defining a formal functional unit consistent with the activity of the company.
The Port of Valencia is the first port in container traffic in the Mediterranean Sea [6]. The concern of the port authorities and managers of the terminals regarding the environment has promoted innovative studies. A recent study assessed the feasibility of the installation of wave energy converters in this port, estimating the resource power of the area in 4.51 kW/m [7]. Most of the published studies related to this topic focused on the assessment of a well-known environmental indicator, the carbon footprint, for example, emissions caused by vessels [8,9,10] or transport within the port [11,12,13,14,15,16,17]. However, significant issues have been registered when assessing the environmental impact or the energy consumption of the terminal as an organization, considering all its processes [18,19,20]. There is no worldwide regulation forcing port authorities to measure their energy consumption and environmental impact [20]. However, since 1972 the International Maritime Organization is committed to minimizing emissions from ships and the maritime sector (including land operations) through the adoption of a series of environmental measures [21]. The European Commission in 1969 first and the European Union from 1999 are doing the same for seaports under its geographic competence [22]. In this line, the European Sea Ports Organization has held regular consultations since 1996 in 94 ports in 21 European countries on aspects related to climate change and energy efficiency: 76 are monitoring energy consumption, and 40 of them have a carbon footprint [23]. In Europe, large companies must address an environmental audit at least every four years, according to the European Directive 2012/27/UE. A port terminal is a modal exchanger with a stockyard where the different loading rhythms of the sea and land route. The main job of a port terminal is to manage the movements of goods under these conditions with efficiency and safety watching over the environment and the economy.
The Port Authority of Valencia (PAV), also known as VALENCIAPORT is the public body responsible for managing the Port of Valencia on the Mediterranean coast, Eastern Spain, where the port terminals operate. PAV is the organization in charge of managing the port area where three container terminals operate in the Valencia Port. PAV invigorates the cluster of companies in the port area to improve energy efficiency and minimize their carbon footprint. These three container terminals represent 85% of the energy consumption of the port. VALENCIAPORT is Spain’s leading Mediterranean port in terms of commercial traffic, mostly containerized cargo, due to its dynamic area of influence and an extensive network connecting it to major world ports. It is also considered to be a port community system [24].
The stakeholders of PAV are the port terminals operating in the Port of Valencia, port personnel, clients, investors, the administration, the media, the port neighbors, unions, other terminals, suppliers, the management board, workers, physical environment, political environment, carriers, shipping associations, financial entities, the Customs Office, and the National Association of Stowage Companies. All these stakeholders have some influence over the organization for one reason or another. Most relevant internal influences are related to contractual conditions between the port authorities and the terminal, machinery and infrastructure, financial conditions of the organization, working conditions of employees, and internal communication. The external influences highlighted by the analysis are related to other organizations such as the National Association of Stowage Companies, the Customs Office, and the financing entities. Other external influences are considered, such as meteorology, the European regulation related to stowage and other legal requirements, the characteristics of the markets, and the media.
The concept of Relevant Use of Energy (RUE) is proposed as a tool for decision-making to prioritize investments and projects focused on the improvement of the energy performance of an organization. RUE is defined as substantial energy consumption that offers considerable potential for improving energy performance according to ISO 50001 framework [25]. ISO 50001 defines requirements for an organization to use data to better understand and make decisions about energy use besides other objectives as develop a policy for efficient use of energy [25].
In this study, the RUE Index is presented. The application of this indicator in three container terminals under the coordination of VALENCIAPORT during a period of 10 years is carried as a validation of the tool. RUE Index is a new innovative tool to classify the energy used for its relevance. As a bonus, an analysis of the benefits of having a verified energy management system (ISO 50001) for the implementation of the tool developed is discussed along with the results of the projects designed based on the information obtained from the tool.
2. Methods
In this section, four concepts are explained:
- the research design,
- the methodology applied for the definition of the tool as an indicator,
- the methodology applied to assess the quality of the indicator when implemented in the case study (Data Quality Ranking (DQR) index) and
- the methodology applied to assess the energy intensity of the organizations.
2.1. Research Design
The research has been designed based on the cycle plan–do–check–act (PDCA) consistent with ISO 50001 described in Figure 1, where stakeholders and influences need to be identified and described.

Figure 1.
Plan–do–check–act (PDCA) cycle. Adapted from [25].
- Plan: The definition of an index has been planned to provide quality information for decision-making to the authorities of a port where several container terminals can be operating.
- Do: The index is defined within the framework of the energy management system.
- Check: The index is validated as a tool through the implementation in the case study presented: three container terminals in the Port of Valencia (Spain) under the coordination of VALENCIAPORT. Results of the based year (2008) are compared with the results obtained in the following years. The investments made in this period by participating in different energy-efficient projects are compared with the evolution of the index for validation.
- Act: A proposal for improving the energy efficiency of the Port of Valencia is made based on the results obtained. The proposal is accompanied by a prediction of the results of its implementation that, following the cycle, should be planned, applied, and checked if accepted by the decision-making board.
2.2. Definition of Indicator
For the definition of the tool, as an index, the standard UNE 66175 [26] for the definition of indicators in 6 stages:
- Selection of indicator
- Denomination of the indicator
- Calculation method: specification and information sources
- Specifications for representation
- Definition of responsibilities
- Definition of thresholds and objectives
The index is validated through a case study. The processes of three container terminals in the Port of Valencia are identified, and the RUE Index for the set of processes is calculated for 2008 (base). Since then, the index is calculated every two years until 2012 and then every year.
2.3. Data Quality
The quality of the inputs of the tool when assessing the case study has been assessed by the DQR index. This methodology has been proposed by the European Commission [27] in the International Reference Life Cycle Data System, and considers six indicators for each parameter to be used in the assessment:
- TeR: Degree of technical representativeness
- GR: Degree of geographical representativeness
- TiR: Degree of temporal representativeness
- C: Completeness
- P: precision/uncertainty
- M: methodological adequacy and consistency
These indicators are assessed by an expert panel with a ratio between 0 and 5 where 0 stands for “non-applicable”, 1 is the best quality with a representation greater than 95%, 2 if it is between 85% and 95%, 3 if it is neutral with representation between 75% and 85%, 4 if it is bad (50% to 75%) and 5 is the worst punctuation under 50% of the representation. The DQR index is calculated as in Equation (1):
where Xw is the worst level of all indicators, and i represents the number of indicators applied. If the result is equal or under 1.6 the data is considered “high quality”; between 1.6 and 3 (equal or less) is considered “basic quality”; over 3 is classified as “data estimated”.
DQR = (TeR + GR + TiR + C + P + M + Xw × 4)/(i + 4),
2.4. Energy Intensity Methodology
Figure 2 shows the methodology applied to assess energy intensity. Each step is described below.

Figure 2.
Methodology to assess the energy intensity.
2.4.1. Goal and Scope Definition
The goal and scope of the study should be well defined from the first stage to ensure relevant findings. What is going to be analyzed and how results are going to be used is essential information to address a proper study. The quality of data required, the allocation procedure, and any assumption taken must be clearly established here. A functional unit is required to give the right dimension to the results (ISO 14040, [28]). The functional unit does not necessarily need to correspond to the operational unit; however, if the results of the study are going to be part of the management of the organization, the understanding between the management board and researchers’ language should be ensured.
2.4.2. Inventory Analysis
The inventory analysis will draw the full picture of the organization within the system boundaries previously defined. Detailed information about each process included in the system boundaries of the study and its information source must be well described. These processes have been classified into operational processes and infrastructure. The energy consumption should be disclosed by type of energy (the type of fuel or electricity source). The data quality analysis is carried out in this stage, given sufficient information to dimension quantify the results obtained in the following stage.
2.4.3. Energy Intensity
The energy intensity for organizations is calculated as the relationship between energy consumption for a certain year and the functional unit in Equation (2).
where I stands for energy intensity, E represents the energy consumption in joules (J), and FU is the functional unit defined in the first stage of the study.
I = E/FU
2.4.4. Interpretation of Results
The interpretation of results should be carried out considering the goal, scope, system boundaries, and assumptions made. The quality of data gives information regarding the uncertainty of results and is significant when addressing the following stage. Results and its interpretation must be exhaustively reported when the goal of the study is to serve as a tool for managers, as is the case with the study presented in this article.
3. Results
Following the PDCA cycle described in the previous section, once planned, the index has been defined (Section 3.1) and applied to the case study (Section 3.2). The DQR has been assessed, and the results of the case study have been analyzed. In this section, the results of applying the methodology described in the previous section are presented. The interpretation and discussion of results, along with the proposal of new actions and predictions are described in Section 4.
3.1. Proposal of RUE INDEX
The concept of RUE is proposed, defined as substantial energy consumption that classifies the potential for improving energy performance according to ISO 50001. To obtain the RUE for each process considered, a set of four parameters was defined and evaluated by an expert panel:
- RM: relative magnitude
- EE: the energy efficiency or energy classification of the machinery/equipment involved
- R: Recoverability
- PRE: Potential use of renewable energy
The assessment of the relative magnitude (RM) relativizes the consumption value with respect to the total energy consumption by means of the percentage value obtained after 80/20 analysis of the consumption of the energy aspects evaluated in a category or process. A five-level scale is provided to allocate in an aggregate manner those aspects whose relative consumption represents from 1% to 5% of consumption, from 5% to 10% in the second, from 10% to 15% in the third, from 15% to 20% in the fourth and finally all the energy aspects that exceed 20% of consumption. Those aspects that represent 80% of the global consumption evaluated are scored applying the Pareto rule. The weight of this criterion is 50% according to expert evaluation through the application of Saaty’s Analytical Hierarchy Process (AHP). Energy efficiency (EE) is assessed based on the characteristics of the machinery. For better classifications, a degradation in the evaluation is proposed through 5% ranges. The weight of this criterion is 20% according to expert evaluation through the application of the AHP. Recoverability is assessed by thermography or an analysis of the minimum thermal jump necessary to be exploited. Five levels of evaluation are proposed. In those cases where such studies are not available, the maximum is assigned. The weight of this criterion is 15% according to expert evaluation through the application of the AHP. Finally, the potential use of renewable energy index (PRE) is assessed by considering the possibility of introducing this type of energy. The lowest score is for those processes where it is not possible to implement renewable energy. The weight of this criterion is 15% according to expert evaluation through the application of the AHP. The scale for each parameter is shown in Table 1.

Table 1.
RUE: parameters assessment scale.
The final score is assessed using Equation (3):
RUE = 50 × RM + 20 × EE + 15 × R + 15 × PRE
If RUE is less than 40%, it is classified as “less important”, if it is equal or between 40% and 70% is considered “outstanding”, if it is higher than 70% is “significant”.
The use of results obtained for a certain year is an input to the general management system in this case study as it is part of the decision-making process to define new projects to improve the performance of the organization. In this stage, opportunities for improvement are highlighted, and predictions can be made over different scenarios as information for the management board. All analyses related to possible projects must be properly documented as it is valuable information even if projects are not developed for some reason. The final stage, once projects are chosen, is the planning and implementation, followed by a new assessment to see the benefits. The return of investment is a key indicator of any management board. It is the decision of the organization if this information is public or private.
3.2. Case Study: Valencia Port
The energy consumption of all the processes and machinery included in the organization’s activity is needed to assess the energy intensity of an organization. A rigorous internal system that registers data and statistics for the annual report and Carbon Footprint Assessment of the PAV has allowed the compilation of this information with sufficient detail on an annual basis. The analysis of the results of a certain period has allowed the organization to define new projects to improve the EE of their activities.
Hereafter, the tool described in the previous section is developed and applied to the case study of a container port in the Mediterranean Sea, the second main port in Spain. It can be applied for the period 2008–2016 on an annual basis because starting in 2008; the organization has rigorously recorded its energy consumption with the aim of assessing its carbon footprint under the ISO 14064 standard [29].
3.2.1. Goal and Scope Definition
The goal of the energy intensity assessment for PAV is to improve the environmental performance of the organization along with the financial results, by minimizing the energy costs to enhance competitiveness. This goal is linked to the previous assessment of the carbon footprint. The scope of the study includes all the processes developed by the organization and managed under their internal management system. System boundaries are defined within the process where the organization has operational control to apply improvement measures.
The definition of the functional unit for a container port such as the Port of Valencia has been discussed with several stakeholders and managers of the port authorities and the port terminals as it is the aim of this system to serve as a tool for decision-making. The operations in this type of terminal are quantified in tons or Twenty-foot Equivalent Units (TEU). Therefore, the functional unit for this study has been defined as the “number of TEU” although the cargo handled and the number of container ships, are also considered.
When possible, direct measures are preferred to ensure high-quality data. Any assumption should be clearly described and justified. The DQR index is assessed for all variables considered.
3.2.2. Inventory Analysis
The inventory analysis of this case study describes all the processes involved within the system boundaries and identified in the energy review carried out by the energy management system. As mentioned before, the period between 2008 and 2016 was considered. However, between 2008 and 2012, the system gathered information every 2 years, whereas between 2013 and 2016, the system gathered data annually due to the need for monitoring the implemented measures. Figure 3 shows the energy consumption by energy type. Energy consumption associated with diesel comprised 83.6% of the total energy consumption in 2008. As this study will show, the electrification of machinery and consumption optimization reduced diesel consumption to 74.1% in 2016.
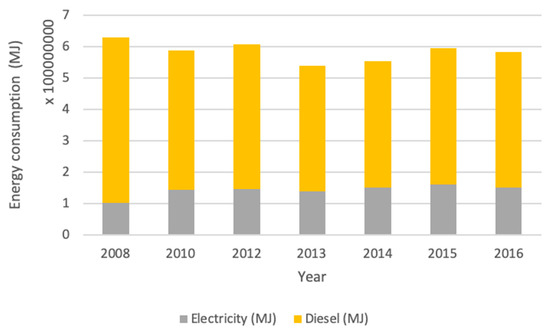
Figure 3.
Energy consumption by energy type from 2008 to 2016.
Operation Processes
Under this category, all operational processes developed in the stockyard are considered. The energy consumption of storage depends mainly on 4 variables:
- Type of machinery/vehicle used (fuel/electric, age, etc.)
- Distance (from the mooring point to the stockpile, from the vehicles’ parking to the mooring point or stockpile, etc.)
- Stock requirements of the container (if it is refrigerated it will require plugged electricity)
- Storage time
It is in this area where the movements of containers take place. To carry these movements, the organization uses 5 different vehicles/machines for different maneuvers:
- Electric gantry crane: mooring (ship/port)
- Rubber Tired Gantry crane (RTG): movements along the stockyard
- Trucks: Free movements in the stockyard
- Forklifts: Free movements in the stockyard
- Empty container handlers (ECH): Free movements in the stockyard
Except for gantry cranes, powered by electricity, all types of machinery are mainly powered by diesel. RTG, trucks, and Forklifts are mainly used to move loaded containers. Another significant process is the electrical supply of refrigerated containers, commonly called reefers. The inventory of the fleet of each type of machinery and the number of plugs for reefers (reefer points) during the period under analysis is shown in Table 2.
Table 2.
Inventory of working machinery and plugs.
Figure 4 shows the energy consumption of each type of vehicle/machine for the period 2008–2016. Forklifts and ECH are presented together due to a limitation of the energy management system. However, it should be considered that it has a low contribution concerning the other machines (between 4% and 7%). Machines are highlighted as the main energy consumers: RTGs and Trucks. Together, they consume over 70% of the energy.
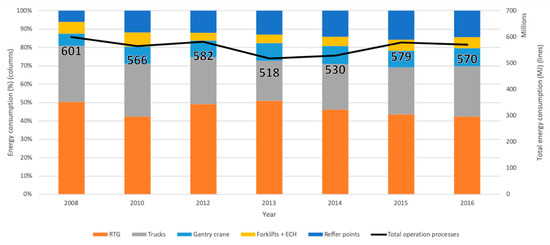
Figure 4.
Energy consumption by type of machine 2008–2016.
Infrastructure
The Port of Valencia had 5 docks during the studied period. However, the docking line and the storage area have changed during the analyzed period. Table 3 shows the evolution of the port infrastructures. It should be noticed that some dredging and expansion work has been carried out between 2012 and 2014, reducing both the docking line and the stockyard surface with a significant increase of the stockyard surface in 2015.
Table 3.
Inventory of working machinery and plugs.
Two different areas can be clearly identified in a container terminal regarding its infrastructure: the stockyard, offices, and workshops including, changing rooms for personnel. The energy consumption of the stockyard is caused by two processes: lighting and electricity for reefers. However, the last one is considered an operational process and has been mentioned in the previous section.
The type of lights and the time that those lights are on are the two factors that determine the consumption of electricity associated with this process. The time is variable as it depends on the operations that take place in the stockyard. If no night shifts are needed, the lighting is minimized to security services; if the terminal is working during the night, different lighting systems will be required to be on. Therefore, lighting at the stockyard depends on the volume of operations and how/when those take place.
Almost all organizations have offices and some personnel facilities, such as changing rooms, canteen or dining rooms, etc. Electricity for lighting, computers, and air conditioning and sometimes fuel or gas for heating systems is the energy consumers of these facilities. For the case study, no fuel or gas consumption is needed, because the offices, as well as all the other systems, are powered by electricity. Figure 5 shows the energy consumption of infrastructures for the period under analysis.
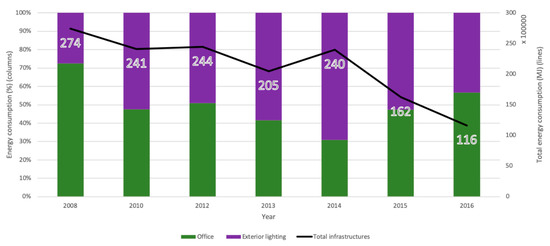
Figure 5.
Energy consumption of infrastructures.
TEU, Cargo, and Container Ships (Functional Unit)
As previously described, the functional unit defined for this case study is the number of TEU managed in the port. The number of containers varies regarding the business volumes of the companies that require these services. Although it is not the objective of this study, it is important to highlight that the global economy and its crisis directly influence the number of containers moved between ports.
Table 4 shows the number of TEU managed in the Port of Valencia for the period 2008–2016, where the business growth in recent years can be observed. Cargo and container ships that operated in this period are also included. It is important to notice that container ships do not have a linear relationship with TEU as cargo ships do. The definition of TEU is strictly related to cargo ships. However, the number of ships that operate in the port is not directly linked. It is expected that a higher number of ships implies a higher amount of TEU. However, ships also move empty containers, although it is not desirable. This is the reason the number of ships that have an influence on the operation processes of the port is also considered in this study for analysis purposes. In the period under study, there has also been an evolution of the fleet. Now, bigger ships carrying more containers are often seen. Thus, a direct relationship cannot be established between the TEU, or cargo handled and the number of ships.
Table 4.
TEU, cargo, and container ships.
DQR Index
The DQR index is calculated to assess data quality. The energy management system and the accounting system have allowed the collection of all the data required for this assessment. Table 5 shows the result of the data quality analysis, where it can be seen that a high-quality index is the most frequent. It can be noticed that except for two types of machinery (Forklifts and ECH), the DQR is high as the energy management system allows a detailed and complete data acquisition. The energy consumption of Forklifts and ECH is treated as one unique indicator. This is the reason the parameters C and M are assessed with the representativeness of 50%. The overall DQR index for these inputs is basic quality.
Table 5.
DQR index.
3.2.3. Energy Intensity
The results of this case study include both the assessment of the energy intensity and the application of the RUE Index. Results are discussed considering the projects related to EE and environment implemented in the Port of Valencia during the period under analysis.
Once the inventory is complete, and an adequate quality of data is ensured, the energy intensity assessment can be developed. Figure 6 and Figure 7 show the results per year obtained where total results in megajoules (MJ) per functional unit are shown as a line with data labels.
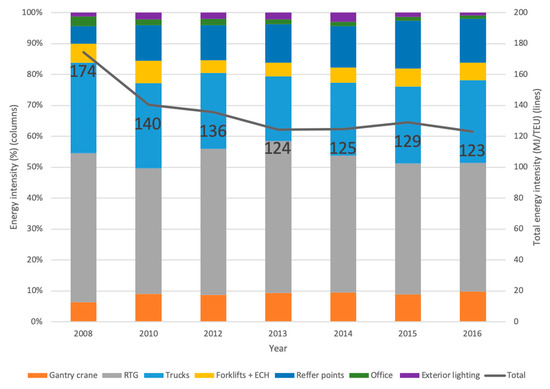
Figure 6.
Energy intensity results for the case study using TEU as the functional unit.
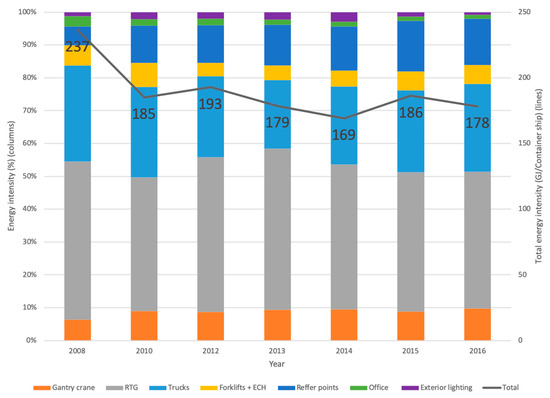
Figure 7.
Energy intensity results for the case study using container ships as the functional unit.
In both cases, the main contributors are RTG and trucks, as expected due to their consumption. However, the total energy intensity behaves differently depending on the functional unit applied. The port activity is not only linked to the amount of TEUs but also to the traffic of container ships as there are some fixed costs in terms of energy required for the maintenance of the stockyard and for cargo movements, both loaded and empty.
3.2.4. RUE Index
Table 6 shows the result of the RUE Index applying the methodology described in Section 2 for the period 2008–2016. Results highlight the processes with a relevant environmental impact due to their energy consumption. The tool has been applied yearly, with data supplied by the energy management system and disclosing significant information to the management board in order to boost those projects, which guarantee that the investment return will include environmental as well as economic benefits.
Table 6.
RUE for processes.
4. Discussion
Once the energy intensity and the RUE Index have been assessed, results are discussed. The results of the projects implemented by PAV are considered for the interpretation of results. Furthermore, applying the index presented in the study, a proposal for new actions, and the prediction of its impact are presented.
4.1. Interpretation of Results
Three relevant projects were implemented before the period under analysis. They are included in the table just for information purposes, although the benefits could not be assessed due to lack of data. Table 7 shows projects implemented since 2008, although the first projects were registered in 2010. The table includes the benefits in terms of reduction of energy consumption over the consumption of the process/infrastructure before the implementation of the project.
Table 7.
PAV Projects.
EFICONT project was financed by the Spanish National R+D+I Plan with the goal of improving EE on container terminals facilities. CLIMEPORT Project [30] focused on the assessment of different methodologies to fight global climate change, financed by the MED program (Europe in the Mediterranean). The GREEN CRANES project [31] main goal was the improvement of the eco-efficiency of port cranes; it was financed by the European Commission. SEATERMINALS [32] is focused on integrating smart and energy-efficient technologies in ports. State law allowed project funding since 2011 [33]. The law allowed bonus port taxes if part of that bonus is invested in projects aimed at improving EE or the port’s environmental performance.
Regarding Figure 6, gantry crane, RTG, trucks, and reefer points are classified as significant for all the years under analysis. Although improvements were made, the RUE does not change during this period. Forklifts and ECH are classified as outstanding. Office and exterior lighting have changed their classification along the period under analysis, due to the implementation of certain projects directly related to these areas.
For an in-depth analysis, the relationship between energy intensity and the functional unit is assessed. Figure 8 shows the evolution of the energy intensity in both functional units and the evolution of the functional units during the period under study. The increase of only 23% in TEU was not proportional to the increase in container ships. The optimization of cargo load and operation during the period under study is evident. Results show that between 2008 and 2016, the organization has decreased its energy consumption by 29%, with 31% of TEU increase.
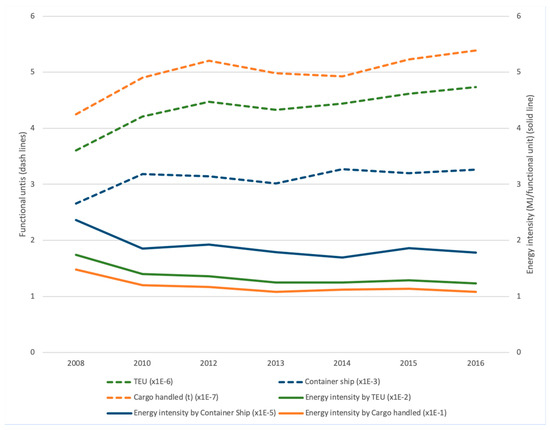
Figure 8.
Energy intensity and functional units.
Figure 9 shows the evolution of the energy intensity variation where the influence of projects described in Table 7 overall energy consumption is assessed. The benefits of the implementation of energy-related projects are shown. It should be noticed that although the number of TEU between 2012 and 2013 was reduced by 3.2% due to the economic crisis, the energy intensity was reduced by 8.3% over that period. Even when the stockyard surface increased by 11.4% in 2014, the increase of energy consumption was only 7.6%. Therefore, an increase in 3.9% in TEU generated an increase of 3.6% in energy intensity.
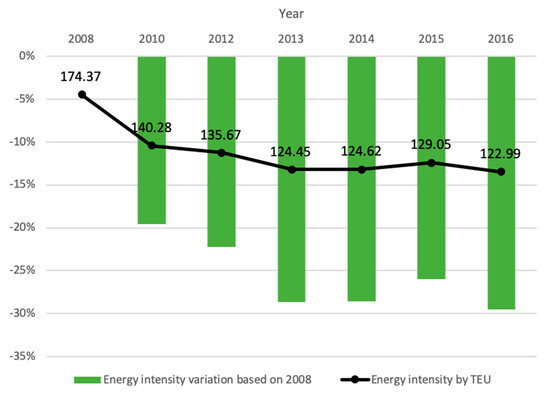
Figure 9.
Energy intensity variation.
The energy intensity was reduced by 29.5% during the full period. The general trend is the reduction of energy intensity regardless of the cargo handled by the port. The implemented measures increased machinery efficiency; thus, the same cargo can be managed with less energy consumption. The installed capacity needed for the same activity was significantly reduced.
The savings in monetary terms are also important to consider the feasibility of projects. Figure 10 shows the cost of energy per functional unit on the period under analysis. Energy cost has been normalized by applying the Consumer Price Index (CPI) of Spain for 2008 (year base). The total number of TEU handled are also represented. It can be seen that the investments made to improve the EE based on the results of the RUE Index have reduced the cost of the energy per functional unit. In monetary terms, PAV reduced the cost of energy per TEU a 40% and 38% considering the cost per cargo handled (tons).
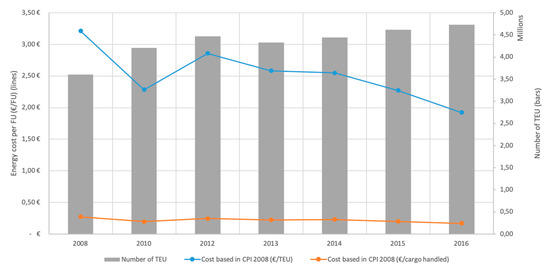
Figure 10.
Cost variation.
4.2. Proposal of Future Actions and Prediction of Results
There is still room for improvement, so considering the priorities, the following measures are proposed:
- Implementation of start-stop systems in trucks with the goal of reducing fuel consumption by 10%.
- Hybridization of RTG aiming at reducing 70% of their energy consumption.
- LED lighting installation on trucks and RTG, reducing their consumption an additional 2%.
- Implementation of energy criteria in operational protocols, reducing the fuel consumption an extra 1%.
- Implementing systems designed to recover heat from combustion engines.
Regarding electricity consumption, the installation of LED lighting in all offices may reduce energy consumption by 44%. Furthermore, the installation of photovoltaic panels in reefers platforms, over roofs, and cranes to reduce electricity consumption may add a decrease of nearly 16%.
The implementation of these measures would account for a relevant improvement in the RUE Index results for the processes, as shown in Table 8.
Table 8.
RUE Index prediction when applying new measures proposed.
5. Conclusions
The energy management system provides direct data. Having an ISO 50001 verified energy management system ensured not only good data quality but also the availability of all data required.
This new methodology aimed at assessing the relevance of the use of energy by each process has allowed project prioritization and has proven to be a useful tool in daily management. The minimization of energy costs has improved the competitiveness of container terminals. Terminals reduced their energy cost per TEU by 40%. The identification of the machinery and installations which generated a significant impact on energy consumption was crucial. The quality of the data used gave confidence to the port management board during the definition of projects and investments required for the implementation of the proposed measures. The project portfolio has proven to be efficient as the implementation of these projects allowed significant changes in energy consumption, both energy intensity and cost.
Based on the RUE analysis, there is still room for improvement. A proposal has been made along with a prediction of the improvement that can be achieved.
Regarding related previous studies, although there are some energy consumption assessments that have been previously carried out, these studies present results with a different approach focusing on the carbon footprint of the terminal (t CO2). Also, their focus is only on one terminal and not in the port itself. The functional unit also changes; therefore, results are not comparable. However, it is important to highlight that these studies where energy consumption data is required to produce estimations applying simulations or mathematical models, pointed out the relevance of having quality data and the significance of being able to have an environmental impact assessment.
Further research within the same case study might address the carbon footprint of this Spanish terminal, where some comparisons can be made.
Author Contributions
Conceptualization, V.C.-B., V.G.L.-I.-F. and S.F.C.-R.; methodology, V.C.-B. and V.G.L.-I.-F.; validation, V.C.-B., V.G.L.-I.-F. and S.F.C.-R.; formal analysis, V.G.L.-I.-F.; investigation, V.C.-B. and V.G.L.-I.-F.; resources, V.C.-B. and M.Á.A.-R.; data curation, V.C.-B.; writing—original draft preparation, V.G.L.-I.-F.; writing—review and editing, V.G.L.-I.-F.; visualization, V.G.L.-I.-F.; supervision, S.F.C.-R. and M.Á.A.-R.; project administration, V.C.-B.; funding acquisition, V.C.-B. All authors have read and agreed to the published version of the manuscript.
Funding
This research received no external funding.
Acknowledgments
Special thanks to the Valencia Port Authority for their collaboration in the data collection process.
Conflicts of Interest
The authors declare no conflict of interest.
References
- European Commission. Communication from The Commission to The European Parliament, The European Council, The Council, The European Economic and Social Committee, The Committee of the Regions and The European Investment Bank. A Clean Planet for all. A European Strategic Long-Term Vision for a Prosperous, Modern, Competitive and Climate Neutral Economy. COM(2018) 773 Final. Brussels. 28 November 2018. Available online: https://eur-lex.europa.eu/legal-content/EN/TXT/PDF/?uri=CELEX:52018DC0773&from=EN (accessed on 15 July 2019).
- Martínez-Moya, J.; Vazquez-Paja, B.; Giménez Maldonado, J.A. Energy efficiency and CO2 emissions of port container terminal equipment: Evidence from the Port of Valencia. Energy Policy 2019, 131, 312–319. [Google Scholar] [CrossRef]
- Acciaro, M. Corporate responsibility and value creation in the port sector. Int. J. Logist. Res. Appl. 2015, 18, 291–311. [Google Scholar] [CrossRef]
- European Sea Ports Organisation. Port Environmental Review 2016. Insight on Port Environmental Performance and its Evolution over Time. ESPO, Brussels. Available online: https://www.espo.be/media/news/ESPO_EcoPorts%20Port%20Environmental%20Review%202016.pdf (accessed on 15 July 2019).
- Krackeler, T.; Schipper, L.; Sezgen, O. Carbon dioxide emissions in OECD service sectors; the critical role of electricity use. Energy Policy 1998, 25, 1137–1152. [Google Scholar] [CrossRef]
- Autoridad Portuaria de Valencia (Valencia Port Authority). Memoria Verificación Gases Efecto Invernadero. Puerto de Valencia; Valencia. Year 2016. Available online: https://www.valenciaport.com/en/publicaciones/ (accessed on 15 July 2019).
- Cascajo, E.; García, E.; Quiles, E.; Correcher, A.; Morant, F. Integration of Marine Wave Energy Converters into Seaports: A Case Study in the Port of Valencia. Energies 2019, 12, 787. [Google Scholar] [CrossRef]
- Liao, C.H.; Tseng, P.H.; Cullinane, K.; Lu, C.S. The impact of an emerging port on the carbon dioxide emissions of inland container transport: An empirical study of Taipei port. Energy Policy 2010, 38, 5251–5257. [Google Scholar] [CrossRef]
- Bergqvist, R.; Egels-Zandén, N. Green port dues—The case of hinterland transport. Res. Transp. Bus. Manag. 2012, 5, 85–91. [Google Scholar] [CrossRef]
- Lättilä, L.; Henttu, V.; Hilmola, O.P. Hinterland operations of sea ports do matter: Dry port usage effects on transportation costs and CO2 emissions. Transp. Res. Part E Logist. Transp. Rev. 2013, 55, 23–42. [Google Scholar] [CrossRef]
- Kontovas, C.; Psaraftis, H.N. Reduction of emissions along the maritime intermodal container chain: Operational models and policies. Marit. Policy Manag. 2011, 38, 451–469. [Google Scholar] [CrossRef]
- Chang, C.C.; Wang, C.M. Evaluating the effects of green port policy: Case study of Kaohsiung harbor in Taiwan. Transport. Res. Transport Environ. 2012, 17, 185–189. [Google Scholar] [CrossRef]
- Rigot-Muller, P.; Lalwani, C.; Mangan, J.; Gregory, O.; Gibbs, D. Optimising end to-end maritime supply chains: A carbon footprint perspective. Int. J. Logist. Manag. 2013, 24, 407–425. [Google Scholar] [CrossRef]
- Gibbs, D.; Rigot-Muller, P.; Mangan, J.; Lalwani, C. The role of sea ports in end-to end maritime transport chain emissions. Energy Policy 2014, 64, 337–348. [Google Scholar] [CrossRef]
- Johnson, H.; Styhre, L. Increased energy efficiency in short sea shipping through decreased time in port. Transport. Res. Policy Pract. 2015, 71, 167–178. [Google Scholar] [CrossRef]
- Tichavska, M.; Tovar, B. Environmental cost and eco-efficiency from vessel emissions in Las Palmas Port. Transport. Res. E Logist. Transport. Rev. 2015, 83, 126–140. [Google Scholar] [CrossRef]
- Winnes, H.; Styhre, L.; Fridell, E. Reducing GHG emissions from ships in port areas. Res. Transport. Bus. Manag. 2015, 17, 73–82. [Google Scholar] [CrossRef]
- Mamatok, Y.; Jin, C. An Integrated Framework for Carbon Footprinting at Container Seaports: The Case Study of a Chinese Port. Marit. Policy Manag. 2016, 44, 1–19. [Google Scholar] [CrossRef]
- Chang, Y.T. Environmental efficiency of ports: A data envelopment analysis approach. Marit. Policy Manag. 2013, 40, 467–478. [Google Scholar] [CrossRef]
- Papaefthimiou, S.; Sitzimis, I.; Andriosopoulos, K. A methodological approach for environmental characterization of ports. Marit. Policy Manag. 2017, 44, 81–93. [Google Scholar] [CrossRef]
- IMO (1972) Convention on the Prevention of Marine Pollution by Dumping of Wastes and Other Matter. Adoption: 13 November 1972; Entry into force: 30 August 1975. Available online: http://www.imo.org/en/About/Conventions/ListOfConventions/Pages/Convention-on-the-Prevention-of-Marine-Pollution-by-Dumping-of-Wastes-and-Other-Matter.aspx (accessed on 1 April 2020).
- Di Vaio, A.; Varriale, L. Management Innovation for Environmental Sustainability in Seaports: Managerial Accounting Instruments and Training for Competitive Green Ports beyond the Regulations. Sustainability 2018, 10, 783. [Google Scholar] [CrossRef]
- ESPO. ESPO Environmental Report 2019 EcoPortsinSights 2019. Available online: https://www.espo.be/media/Environmental%20Report-2019%20FINAL.pdf (accessed on 1 April 2020).
- Ignaccolo, M.; Inturri, G.; Le Pira, M. Framing stakeholder involvement in sustainable port planning. Trans. Marit. Sci. 2018, 7, 136–142. [Google Scholar] [CrossRef]
- International Organization for Standardization. Energy Management Systems—Requirements with Guidance for Use; International Organization for Standardization: Geneva, Switzerland, 2018. [Google Scholar]
- Asociación Española de Normalización y Certificación. UNE 66175:2003 Quality Management System. Guide to Implementation of Indicators Systems; Asociación Española de Normalización y Certificación: Madrid, Spain, 2003. [Google Scholar]
- European Commission. International Reference Life Cycle Data System (ILCD) Handbook—General Guide for Life Cycle Assessment—Detailed Guidance, 1st ed.; Publications Office of the European Union: Luxembourg, 2010. [Google Scholar]
- International Standard Organization. ISO 14040:2006 Environmental Management—Life Cycle Assessment — Principles and Framework; International Standard Organization: Geneva, Switzerland, 2006. [Google Scholar]
- International Standard Organization. ISO 14064-1:2018 Greenhouse Gases—Part 1: Specification with Guidance at the Organization Level for Quantification and Reporting of Greenhouse Gas Emissions and Removals; International Standard Organization: Geneva, Switzerland, 2018. [Google Scholar]
- Clima Port Project. Available online: https://www.programmemed.eu/en/the-projects/project-focus/climeport.html (accessed on 1 April 2020).
- Green Cranes. Available online: http://www.greencranes.eu/ (accessed on 1 April 2020).
- Sea Terminals. Available online: http://www.seaterminals.eu/ (accessed on 1 April 2020).
- Boletin Oficial del Estado. Available online: https://www.boe.es/eli/es/rdlg/2011/09/05/2 (accessed on 1 April 2020).
© 2020 by the authors. Licensee MDPI, Basel, Switzerland. This article is an open access article distributed under the terms and conditions of the Creative Commons Attribution (CC BY) license (http://creativecommons.org/licenses/by/4.0/).