1. Introduction
Most people spend 90% of the day indoors, increasing electricity consumption derived from the use of heating, ventilation, and air-conditioning (HVAC) equipment and home appliances. The percentage of building energy consumption in the United States of America has increased from 33.7% in 1980 to 41.4% in 2010. China had an increase of 40% in a 20 year period (1990 to 2009). Europe registered 55% of the total energy consumption in buildings in 2012. An increase in worldwide energy consumption in buildings is expected because of population and economic growth. Due to this continual growth, different technologies have been developed, allowing clean energy generation in buildings, such as thermal heaters for water, biodigesters, and photovoltaic (PV) systems [
1].
PV systems are the most popular technology for clean electricity generation in buildings [
2]. They present many advantages, such as the availability of the solar resource, the modularity that allows systems of any capacity to be installed, low maintenance, absence of noise, or even the ability to replace diesel generators at times of power cuts [
3]. However, one of the main issues with this kind of application is the moderate efficiency of PV modules, typically in the range from 15% to 20%. Many rooftops have limited area for installing a PV generator and, thus, the electricity generation can be lower than the building needs.
This highlights the importance of increasing the generated energy per unit collector area, which can be achieved by implementing PV sun trackers. Sun tracking systems increase the irradiance incident on the PV modules by performing a motion following the sun path over the day and, therefore, allowing the electricity output to be increased in comparison to a fixed PV generator [
4].
Nowadays, building-integrated sun trackers typically use built-in microprocessors for controlling the movement of the structure. Closed-loop algorithms use the feedback provided by one or more photosensors, while open-loop algorithms control the movement based on date–time variables and do not require sensors.
Smart homes are automated buildings with installed detection and control devices, such as air conditioning and heating, ventilation, lighting, hardware, and security systems [
5]. Energy generation systems can also be automated in a smart home. A smart home is a domain of the Internet of Things (IoT), a network of devices and other items embedded with sensors, electronics, software, and connectivity. Recently, there has been a surge in the development of smart devices that can connect to the Internet and be controlled using applications remotely [
6].
Building-integrated PV sun trackers offer the possibility of incorporation into the smart home through IoT. This would represent some advantages, such as remote monitoring via a tablet, mobile phone or computer, integration of many sun trackers into the same network, ease of operation of the sun tracker without the need to access the physical device, ease of configuration or security. However, to the best of our knowledge, no prototype of sun tracker through the IoT for smart home integration has been reported in the literature.
In this paper, the development of a PV sun tracker through the IoT for building integration is presented. The sun tracker is single-axis to simplify the mechanics and control and uses a north–south inclined axis with tilt equal to latitude, which is the type of single-axis sun tracker that provides the best energy gains with respect to a fixed system in most regions worldwide (see
Section 3). The control algorithm is open-loop to avoid the use of photosensors, which would need to be maintained and calibrated, and the computing of the instantaneous turning angle of the structure is performed in the cloud based on date, time, and location. The proposed sun tracker has all the benefits mentioned above. It was built, installed, and tested in Aguascalientes, central Mexico, during an experimental campaign of 9 days, in which the energy gains compared to a fixed structure PV system were measured to demonstrate its functionality.
The rest of the document is structured as follows: In
Section 2, the state-of-the-art of sun trackers, their classification, and the existing prototypes based on open-loop algorithms are reviewed; in
Section 3, the theoretical energy gains achievable by different types of sun-trackers are calculated and discussed; in
Section 4, the prototype design and its implementation are described, including the physical components, the webserver structure, and the tracking algorithm; in
Section 5, the experimental results are presented, along with an analysis of the collected measurements; in
Section 6, conclusions are presented.
2. State-of-the-Art
The sun trackers can be classified according to different criteria, such as the type of movement, the degrees of freedom, and the control method [
7].
Regarding the type of movement, sun trackers are classified into passive and active. Passive sun trackers are based on the difference of density that results when a substance changes its temperature and do not require electronic components to control the tracker motion. As a commercial example of these types of trackers, Zomeworks Corporation has manufactured them since 1969 [
8]. However, these trackers show a high dependence on weather conditions, which can make them inefficient. Because of this, active sun trackers are the most widely used option nowadays. Active trackers rely on motors, gears, and other controllers to perform the movement of the structure.
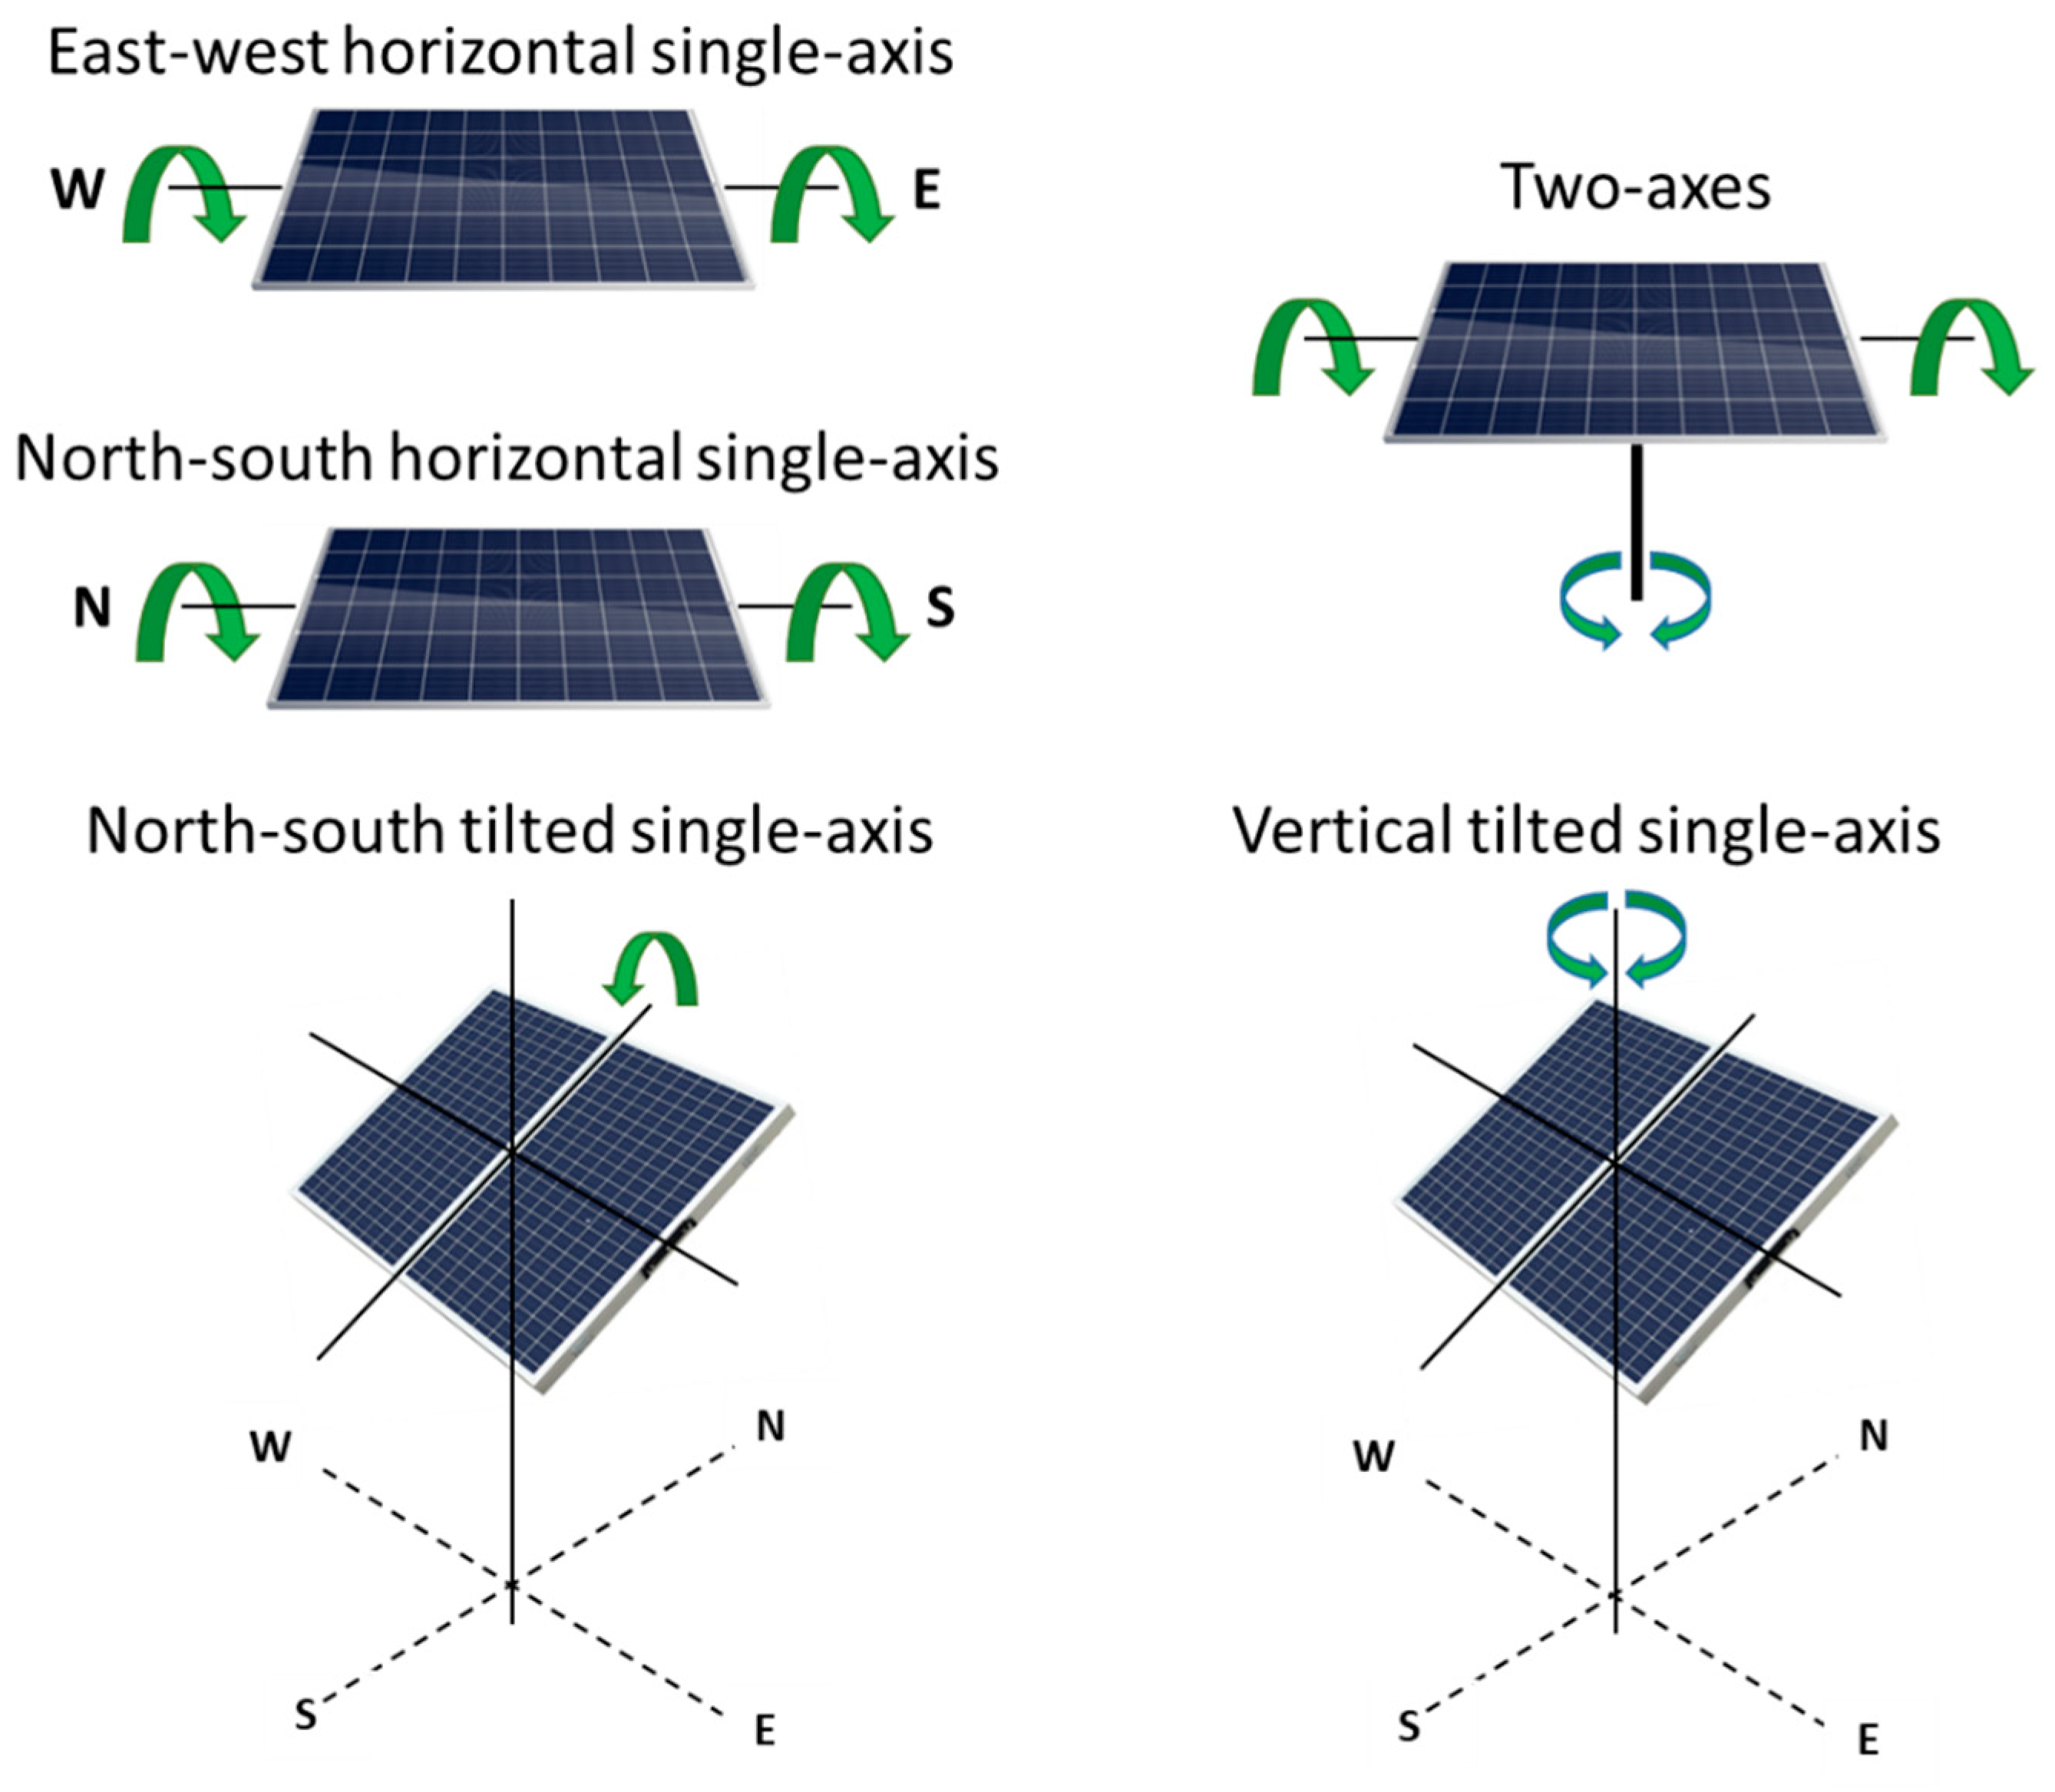
Regarding the degrees of freedom, sun trackers are classified into single-axis and two-axes. Different configurations can be designed for each of these types. The main configurations are (
Figure 1):
- -
East–west horizontal single-axis.
- -
Vertical single-axis with tilt equal to latitude.
- -
North–south horizontal single-axis.
- -
North–south inclined single-axis with tilt equal to latitude.
- -
Two-axes.
The two-axes tracker is the one that allows the percentage energy gains compared to a fixed system to be maximized because it keeps the PV modules perpendicular to the solar rays over the day. However, the double rotatory movement adds cost and difficulty of maintenance. To simplify the structure and control, single-axis trackers are used more for building integration.
Regarding the control method, sun trackers are classified into sensor driver systems, microprocessor driver systems, open-closed loop driver systems, intelligent driver systems, and a combination of any of these systems mentioned.
Sensor driver systems employ photosensors that give a feedback signal (voltage or current) that can be used to drive the solar tracker. Microprocessor driver systems use algorithms and mathematical equations to calculate the position of the sun and usually employ Arduino or Peripheral Interface Controller (PIC) microprocessors. A combination of microprocessor and photosensors can be used to reduce the tracking errors of microprocessor-only systems. The control algorithm can be open-loop or closed-loop. Open-loop algorithms do not require sensors as they use date and time as variables, while closed-loop algorithms rely on the feedback provided by the sensors. Intelligent driver systems use algorithms based on fuzzy logic or artificial neural networks to improve the control characteristics.
Open-loop systems are a good option for active control in applications that do not require high tracking precision, such as flat-plate PV systems. This method avoids the need for maintenance of sensors and is very stable, even in cloudy conditions. As the design proposed in this study is open-loop, we next summarize the prototypes reported in the literature for open-loop tracking systems.
An open-loop 3-position single-axis sun tracker was designed and tested in [
9]. It used a PIC microprocessor, with a timer integrated circuit (IC), a direct current (DC) motor controlling the movement of the tracker, and additional electronic components mounted on a printed circuit board (PCB). A fixed hour was defined for each of the three angles of inclination, and a rotating-type resistor was used to detect the angular position of the PV module.
An open-loop two-axes sun tracker for its implementation with a Fresnel lens to concentrate sunlight on a Stirling engine was proposed in [
10]. A single-chip microprocessor (AT89S52) was used to store the information provided by a global positioning system (GPS) module (EM-406A) and a real-time clock (RTC) and to calculate the corresponding altitude and azimuth angles. Two different stepper motors adjusted the axes’ positions, and additional PV modules supplied the power for moving the structure.
A small open-loop two-axes sun tracker prototype was tested in [
11] by implementing two different algorithms that control the intervals between readjusting movements: one algorithm using a fixed time interval, while the other calculating the difference between the actual sun position and the position at the last movement to decide if a new movement is required. The differences in the performance of both open-loop algorithms were very small for daily searches numbered greater than five.
An automated positioning two-axes sun tracking system was proposed in [
12] controlled by a microcontroller unit (MCU) and with peripherals, such as an encoder and a GPS. The MCU consisted of a master controller (PIC18f4680) in charge of performing the algorithm, arithmetic calculations, and database generation, with two additional slave microcontrollers in charge of controlling the motor drivers and getting feedback from the encoders for both altitude and azimuth adjustment. A compass was added to provide the system a true north reference so that, along with the GPS, the tracking system could be implemented anywhere around the world.
The energetic performance of open-loop 2-position and 3-position north–south horizontal single-axis sun trackers was analyzed in [
13] for 22 locations with latitudes up to 50°. These trackers change the position at fixed hours, and the position angles themselves are predefined, simplifying to the maximum the tracker control. The 3-position tracker performed near the analogous tracker with continuous movement.
A 3-position north–south inclined single-axis sun tracker was designed and tested in [
14], and a low concentration ratio reflector was incorporated to increase the collected irradiation. The experimental results showed an appreciable energy gain compared to a fixed system at an affordable cost.
A 2400 Wp north–south inclined single-axis sun tracker was implemented in Turkey [
15], with complete monitoring through a microcontroller and a PC and a hybrid grid-connected with batteries configuration.
An open-loop two-axis sun tracker was evaluated and compared to a fixed system [
16]. A three-phase alternating current (AC) motor was used for the east–west axis, while a DC motor was used for the north–south axis. An encoder that provides feedback to an Input/Output (I/O) data card was used to record measurements for storage on a computer.
The review of the technical characteristics of existing open-loop sun trackers reveals that the IoT technology has not been applied in this field for integrating the sun trackers in smart homes. The current study tries to fill in this knowledge gap.
3. Theoretical Analysis of Sun Tracking Energy Gains
The percentage of energy gains of a tracking system compared to a fixed system are dependent on the type of tracker, location, and season. The ideal energy collected by the different types of sun trackers was analyzed for Aguascalientes, central Mexico (21.9° N, –102.3° E). The description of the methodology used is as follows.
Inputs of the method were the twelve values of monthly average daily global horizontal irradiation (
GHId) in kWh/(m
2 day) taken from the National Aeronautics and Space Administration Prediction of Worldwide Energy Resources (NASA POWER) website [
17]. The typical profiles of global horizontal irradiance (
G(0)) in kW/m
2 for the day in the middle of each month at 5-min intervals were calculated as [
18]:
where ω is the solar hour angle in radians, and
ωs is the solar hour angle at sunrise for the considered day. The trigonometric terms are expressed in radians. The sun position for each
ω value was determined by the elevation angle (
γs) and the azimuth angle (
ψs) as [
19]:
where
δ is the Earth’s declination angle, and
ϕ is the site latitude. The diffuse (
D(0)) and beam (
B(0)) horizontal irradiances were then calculated. First, the extraterrestrial horizontal irradiance (
Bo(0)) was obtained by:
Bo being the solar constant and
ε the eccentricity of the Earth’s orbit at the day considered. The clearness index was defined as:
The
D(0) was then estimated by using a correlation proposed by Iqbal [
20]:
And the
B(0) component is the difference between
G(0) and
D(0). The next step consists of the calculation of the position angles of the PV modules: orientation relative to the south (
α) and tilt (
β). These angles can be obtained for each sun position (
γs,
ψs) considering the type of sun tracker [
21]:
- East–west horizontal single-axis:
- Vertical tilted single-axis:
- North–south horizontal single-axis:
- North–south tilted single-axis:
Once the position angles of PV modules were known, the method estimated the beam (
B), diffuse (
D), and albedo (
A) components of solar irradiance on the plane of the collectors.
B was obtained by:
where
θ represents the angle of solar rays with respect to the normal of PV modules. For the calculation of
D, the anisotropic sky diffuse model of Hay was used [
22]:
And A was obtained by an isotropic model with 0.2 albedo coefficient:
The sum of B + D + A is the global irradiance incident on the plane of the PV modules (G). G can be integrated over time to get the collected irradiation on a daily, monthly, or annual simulation.
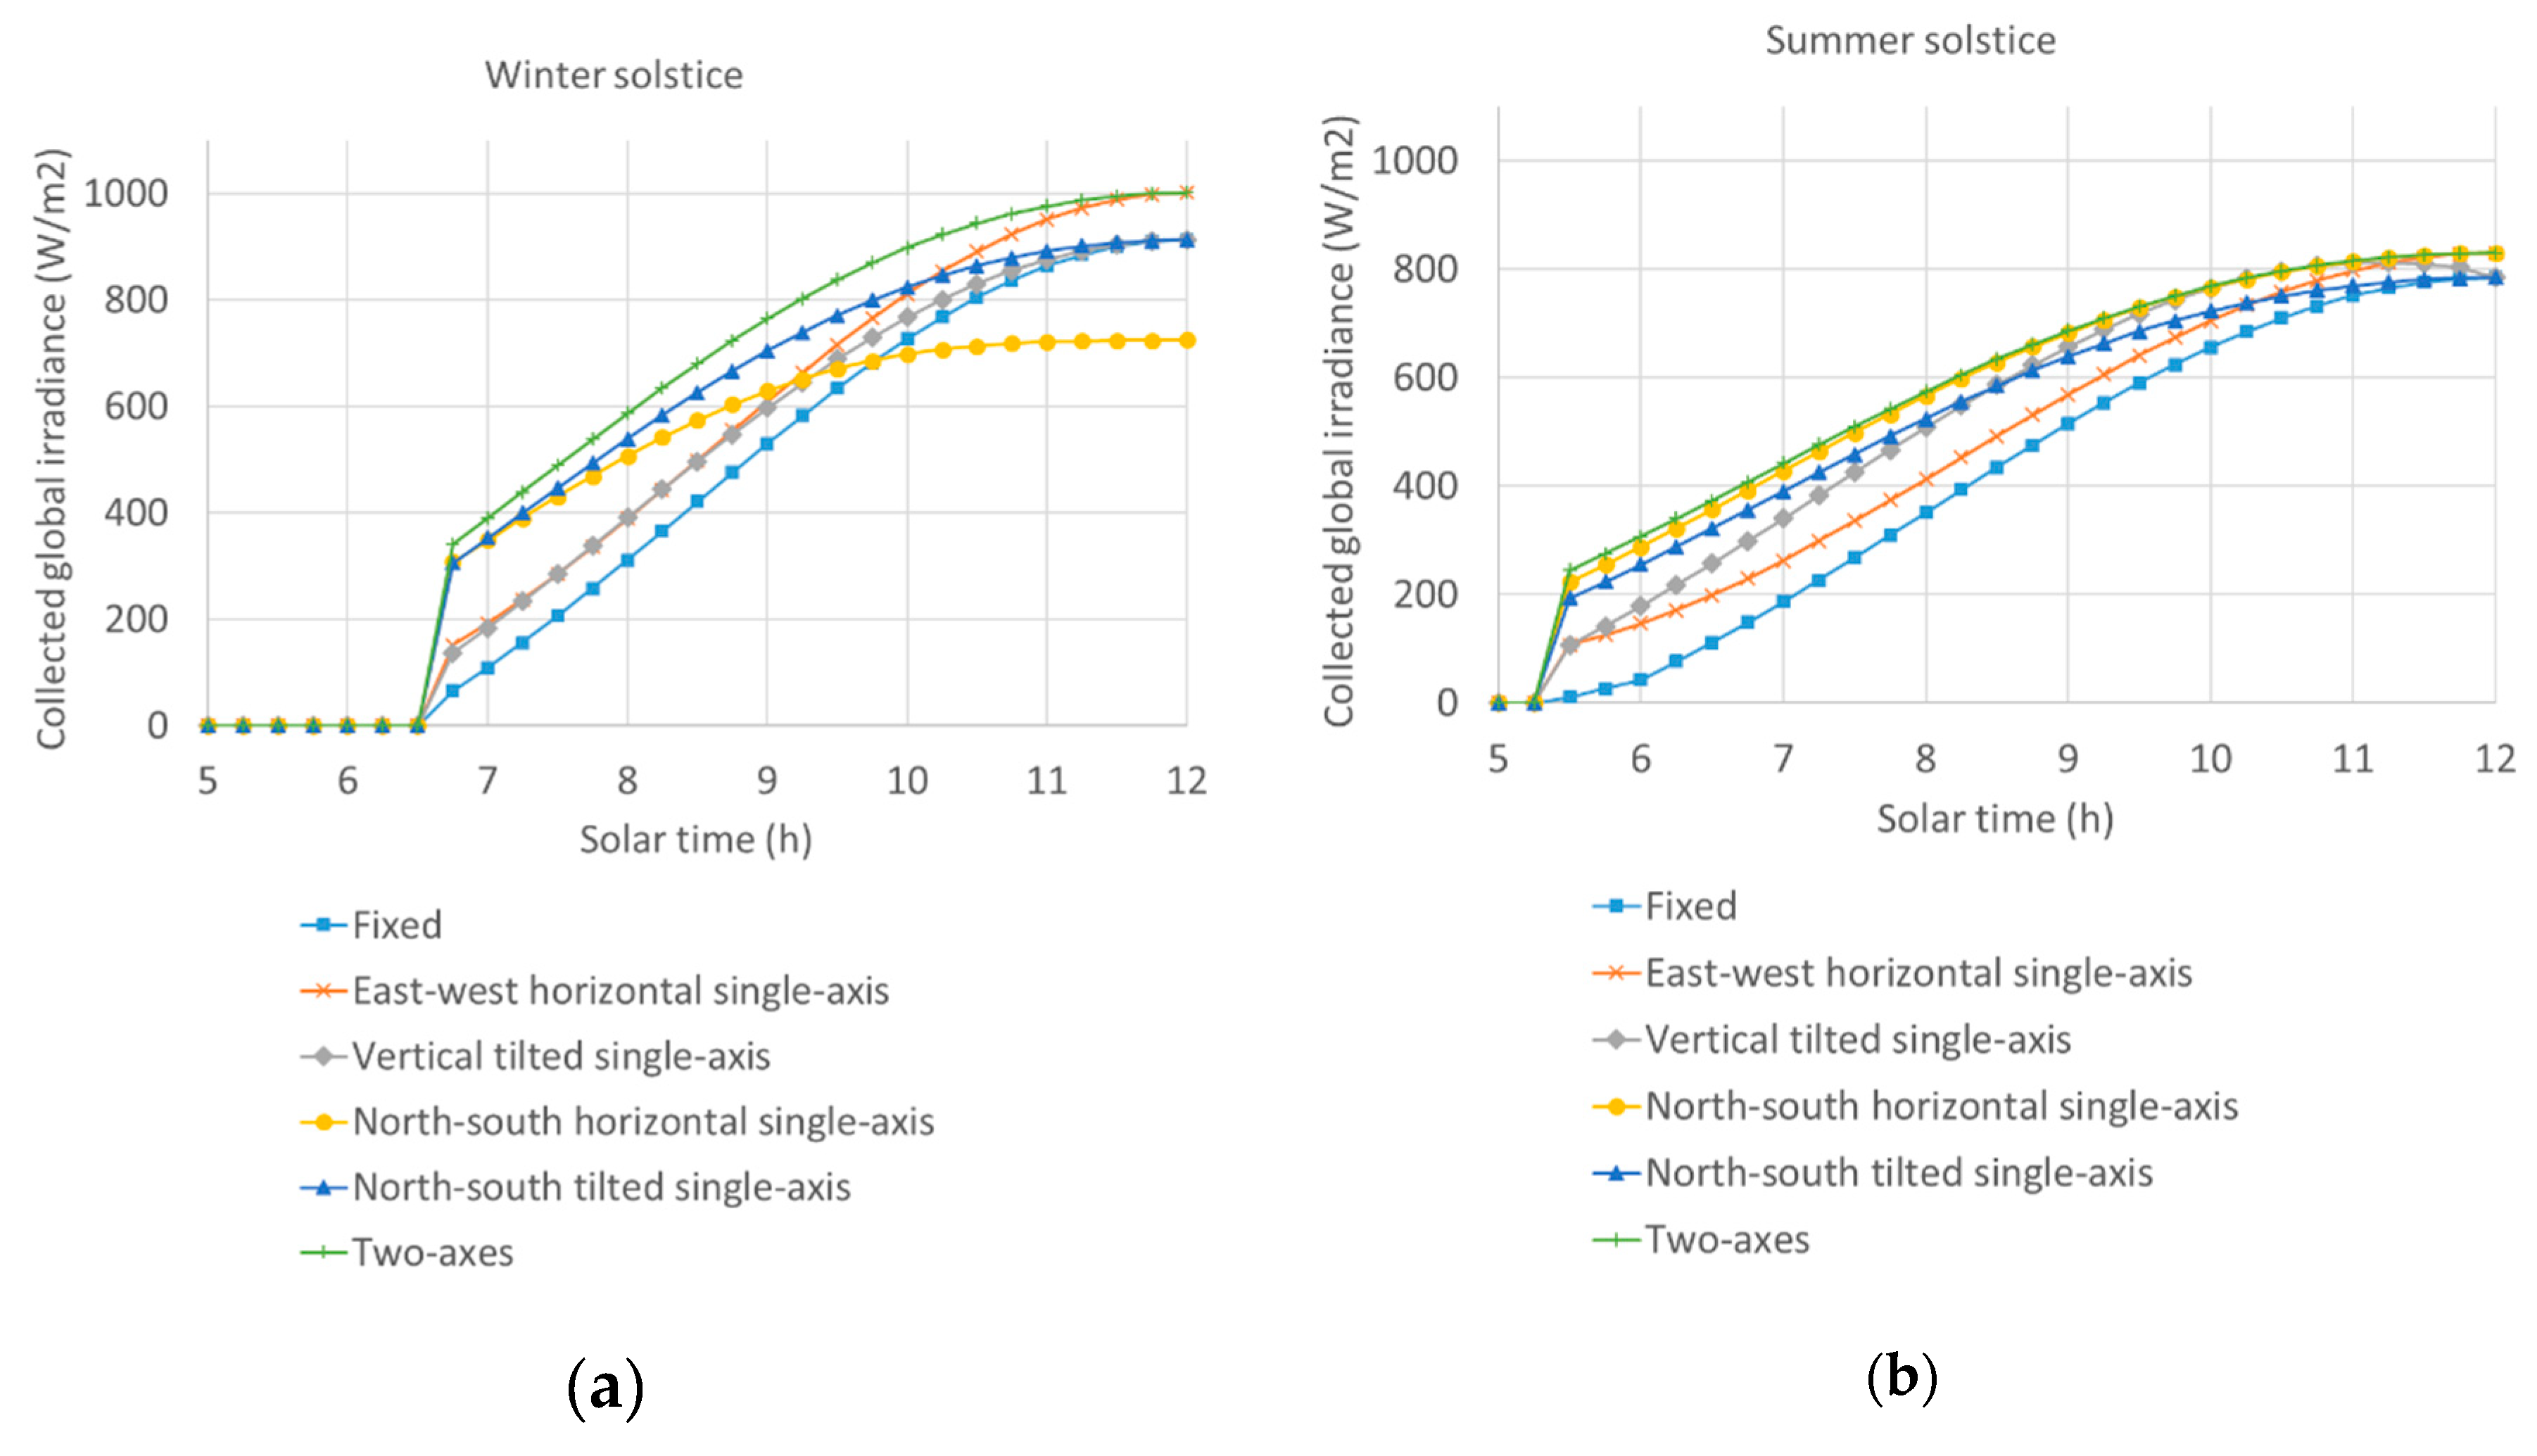
The collected irradiance over the winter and summer solstices has been plotted for Aguascalientes and is shown in
Figure 2, compared to a south-oriented fixed structure system with tilt equal to latitude. The daily collected irradiation and percentage gains are indicated in
Table 1. It can be seen that the best sun tracker, excluding the two-axes, depended on the season: for the winter solstice, the best single-axis tracker was the north–south tilted single-axis with a 24.1% gain, while for the summer solstice, it was the north–south horizontal single-axis with a 37.6% gain. Therefore, an annual simulation was required to know which type of single-axis tracker performs better in the location. The monthly behavior of the sun trackers is represented in
Figure 3. It can be seen that from April to August, the best single-axis tracker was the north–south horizontal single-axis, while in the rest of the months, it was the north–south tilted single-axis. If we observe the annual percentage gains,
Table 2, the best single-axis sun tracker was the north–south tilted single-axis with a 27.7% gain, followed by the north–south horizontal single-axis with a 23.9% gain. The selected single-axis tracker in this study was the north–south tilted single-axis with tilt equal to latitude as it provides the best annual energy gains in central Mexico. Although the designed tracker can be configured at any location, it will be commercialized in a first stage in this region.
4. Prototype Design and Implementation
The prototype construction can be divided into four areas: the support and movement structure, the control circuit, the Firebase-based tracking algorithm, and the monitoring system. Each area will be described in the following sub-sections.
4.1. Physical Design
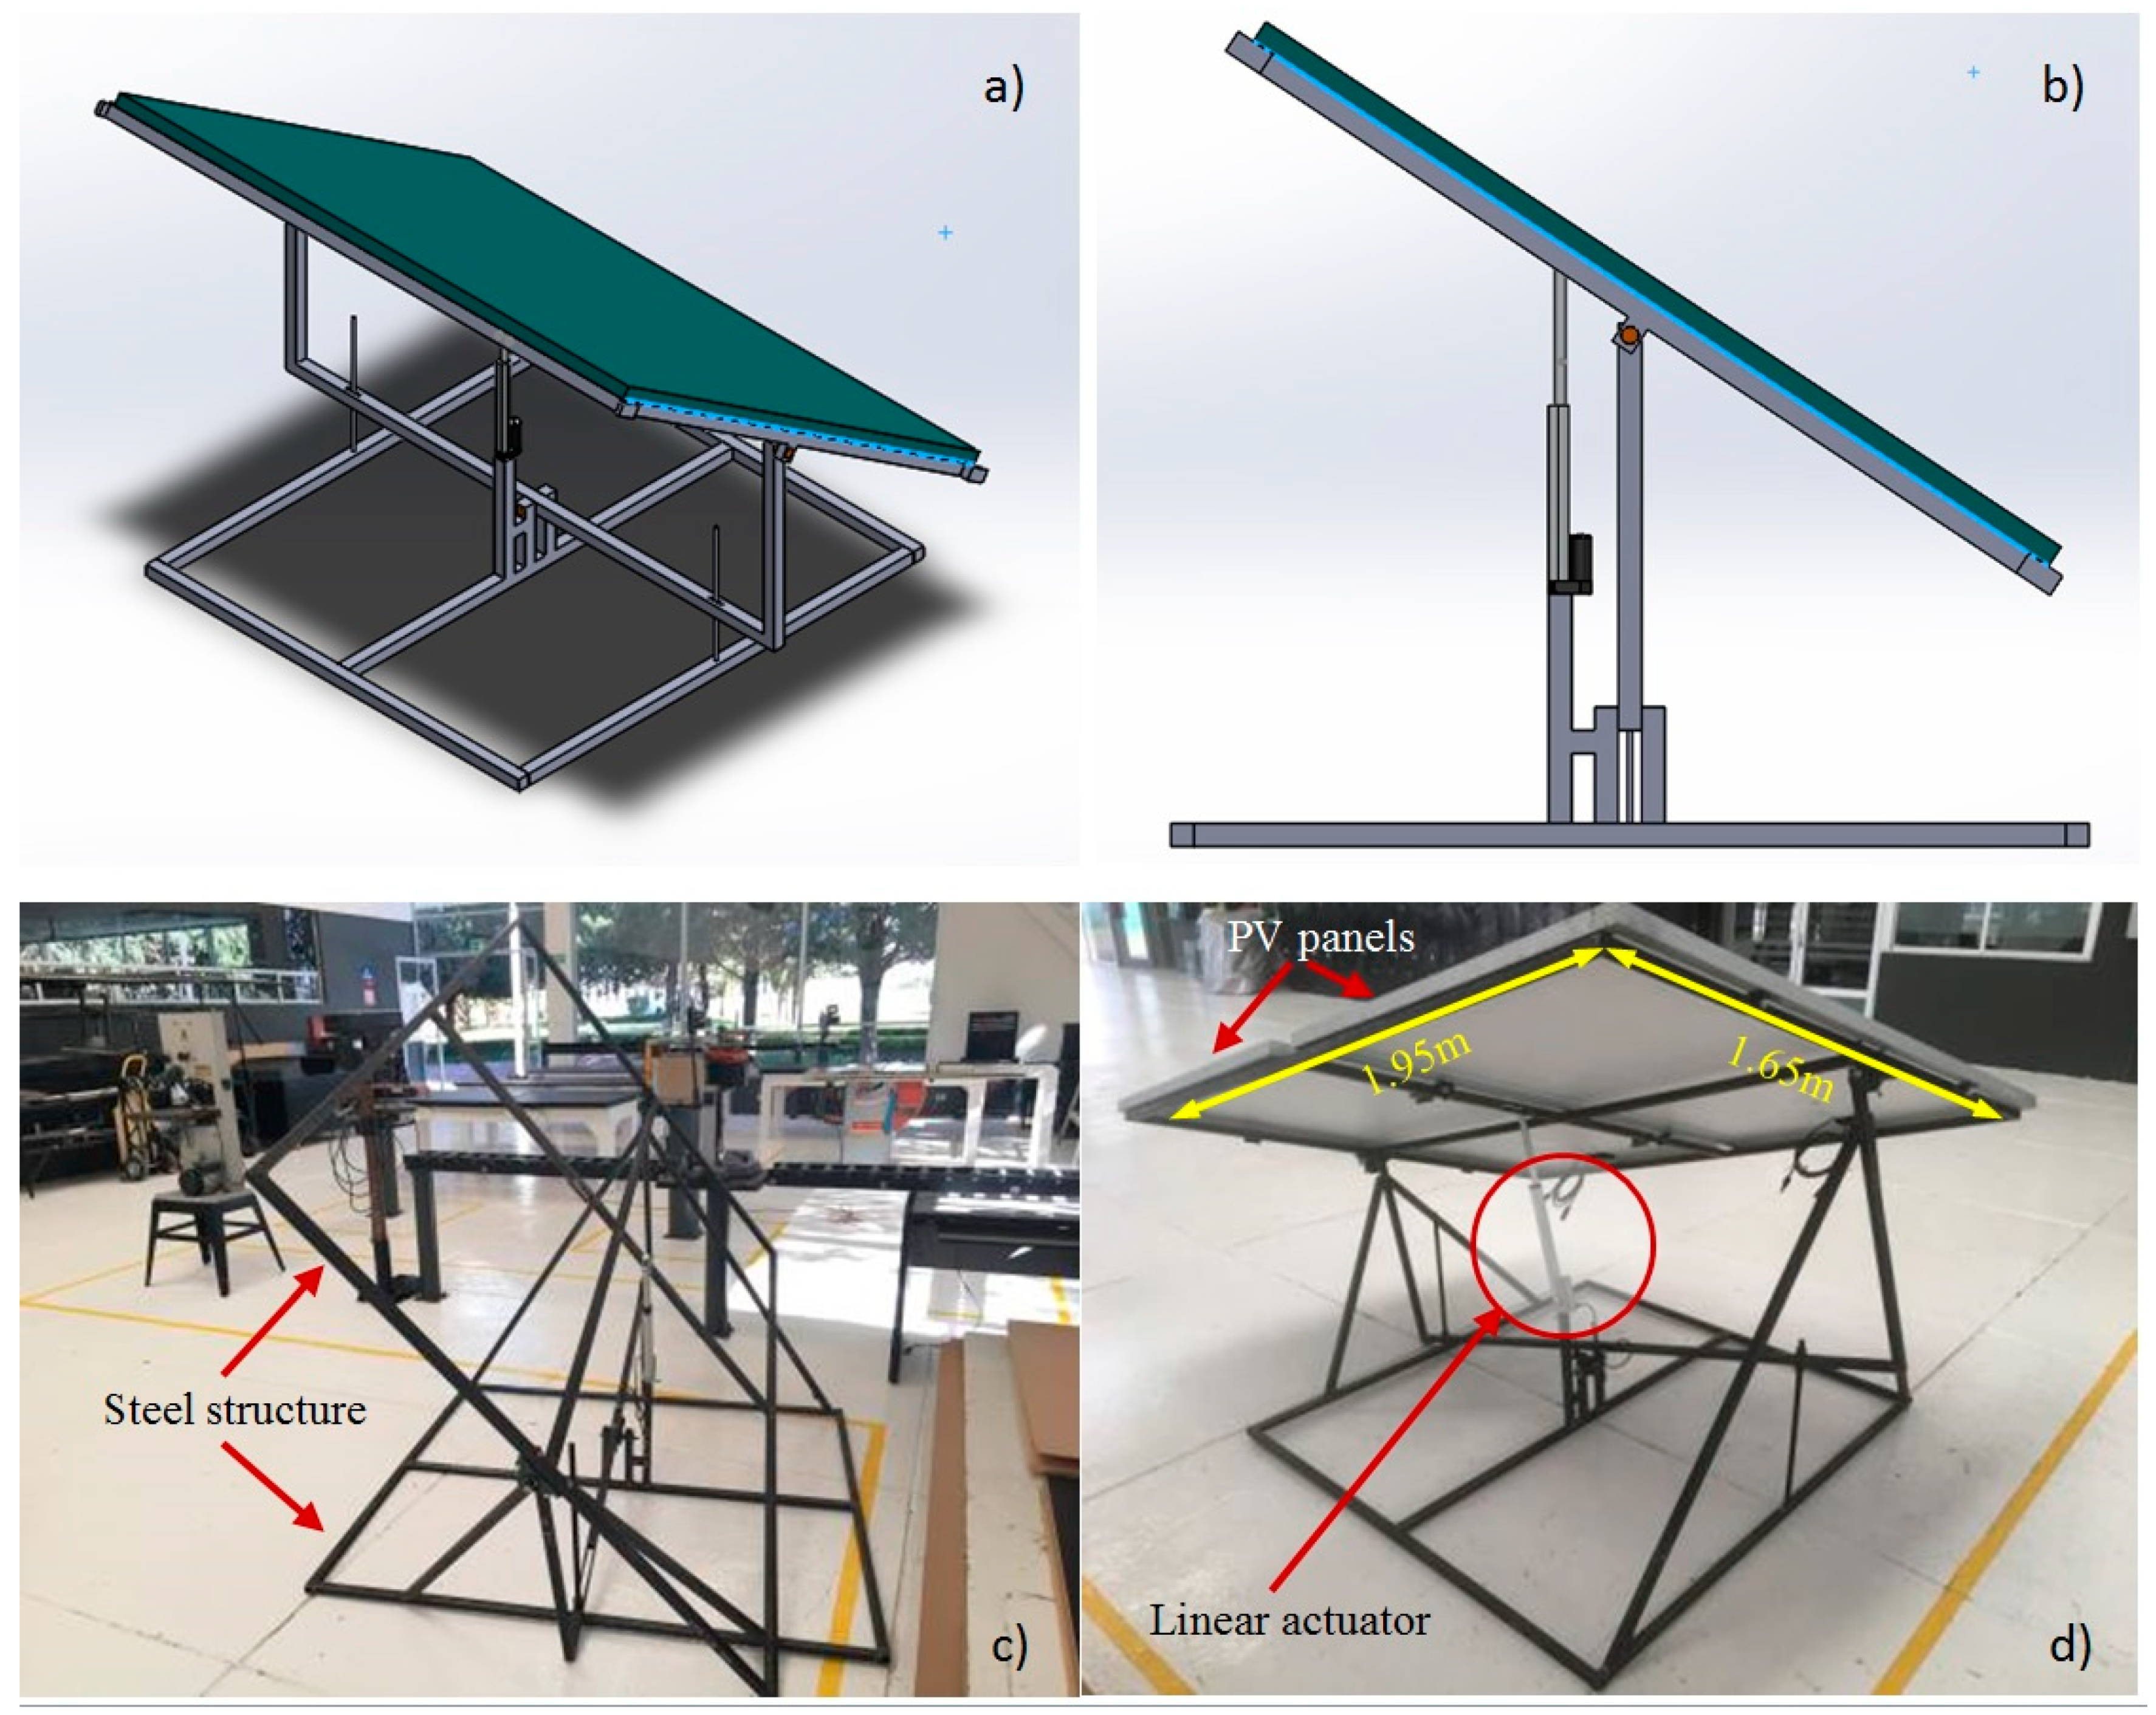
Regarding the support and movement structure, it was designed using the SolidWorks software, considering the dimensions of the PV modules used, see
Table 3. It was decided that a structure capable of supporting two PV modules would be manufactured, seeking to create an economically more efficient and simple design to implement as a commercial product.
Figure 4a and b represent a 3D CAD model of the proposed sun-tracking prototype. The isometric and side views of the designed structure are shown.
The construction of the base was carried out with structural steel rectangular tubular profile, which was subsequently painted to adapt it for outdoor use. Regarding design criteria, the stroke length and force of the electric actuator used to rotate the PV modules were considered to assess the range of rotation that the tracker would have. In this case, it was considered that the best option would be to contemplate a range of −45° to 45°, considering the angle 0° as the position at solar noon. Additionally, the structure has the functionality to adjust the inclination of the modules manually up to 45°, which allows the use of this same structure in different parts of the world.
Figure 4c,d show the implementation of the physical structure with the PV panels and the linear actuator.
4.2. Control System
As for the control circuit, a NodeMCU board that has an ESP8266 module was used to enable connectivity to Wi-Fi networks [
24]. This board has input and output pins that allow the connection of additional components and allows for coding using the Arduino IDE platform, widely recommended for IoT applications [
25,
26,
27,
28]. In this case, the use of the H-bridge CJMCU-7960 for the control of the electric actuator that rotates the structure that supports the PV modules was considered. To control the movement and set the position of the tracker, a gyroscope MPU-6050 was used to feedback the physical position of the tracker to the control code. One of the characteristics sought for this prototype was the possibility of using it in different sites worldwide, which is allowed by the design of the structure and by the variables considered in the tracking algorithm. In this way, a GPS module U-Blox GY-GPS6MV2 was implemented to obtain the latitude and longitude values, which are then fed to the algorithm in Firebase, and that allows the calculation of the angle of rotation. It was also decided to connect it to the board through an SRD-05VDC-SL-C relay, looking to turn it off once having obtained the aforementioned values. In
Figure 5, the connection diagram of the control circuit is presented.
The flowchart in
Figure 6 represents the routine followed by the control circuit.
4.3. IoT Architecture
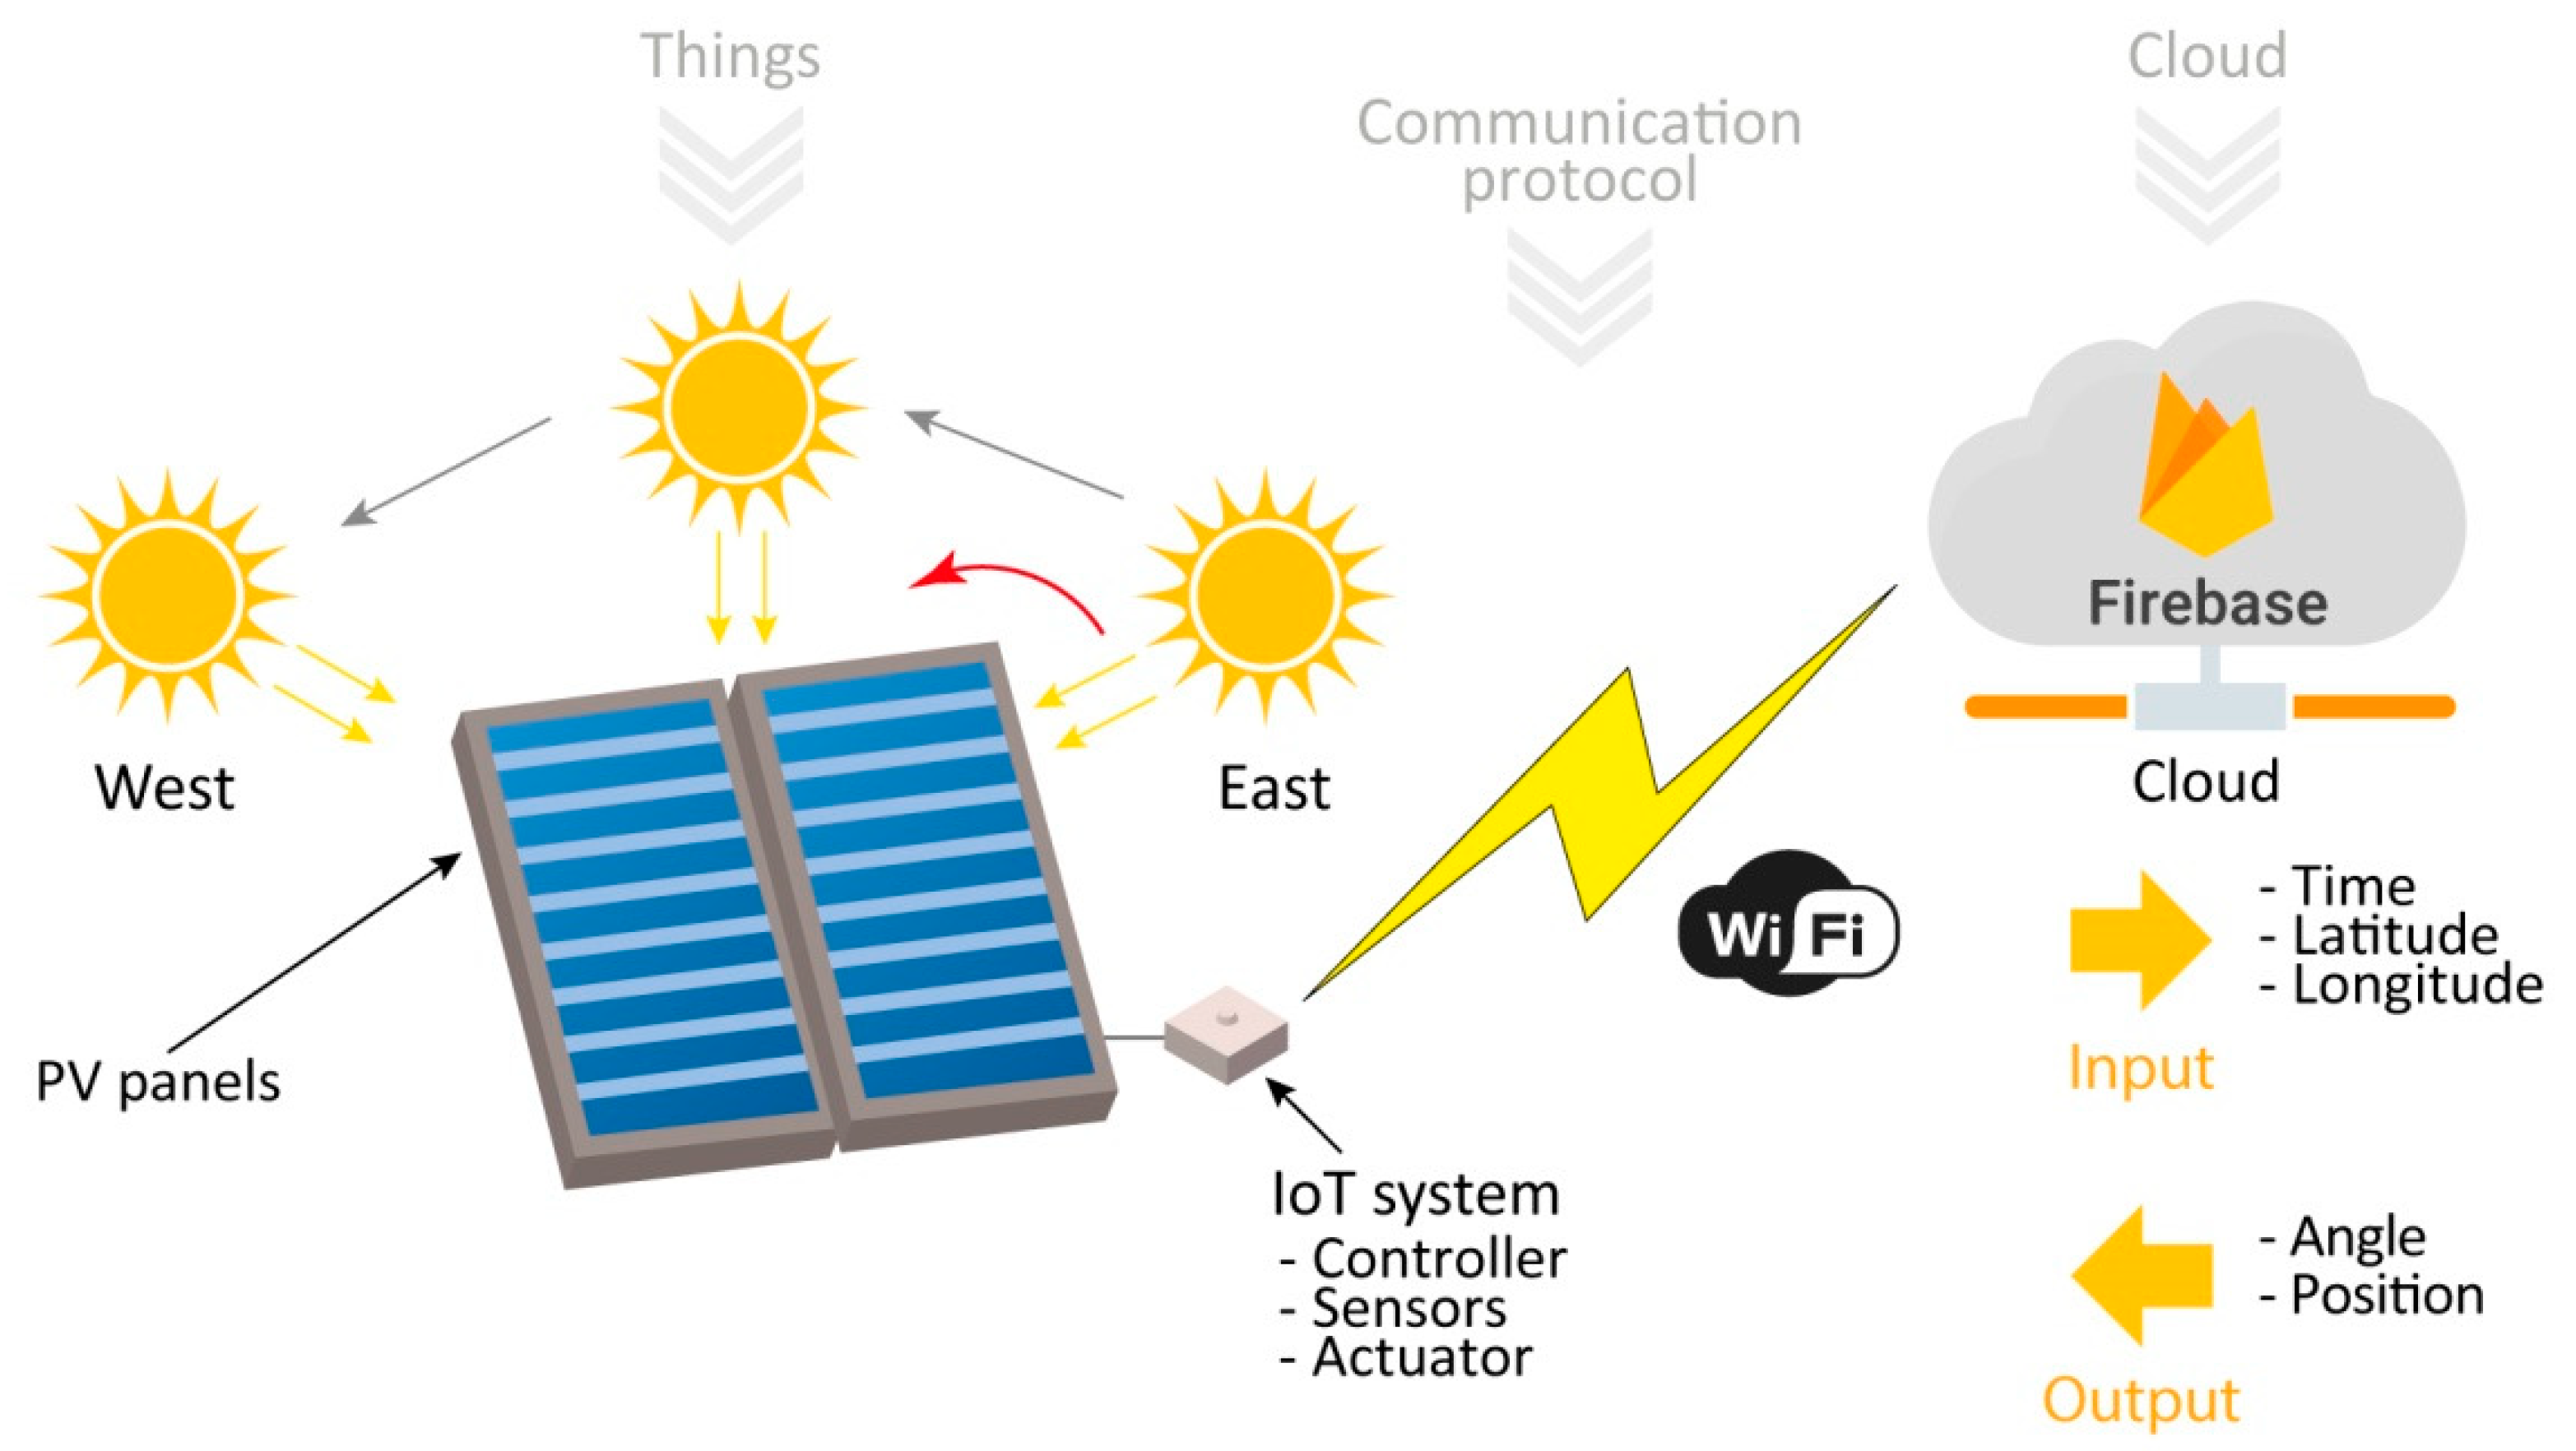
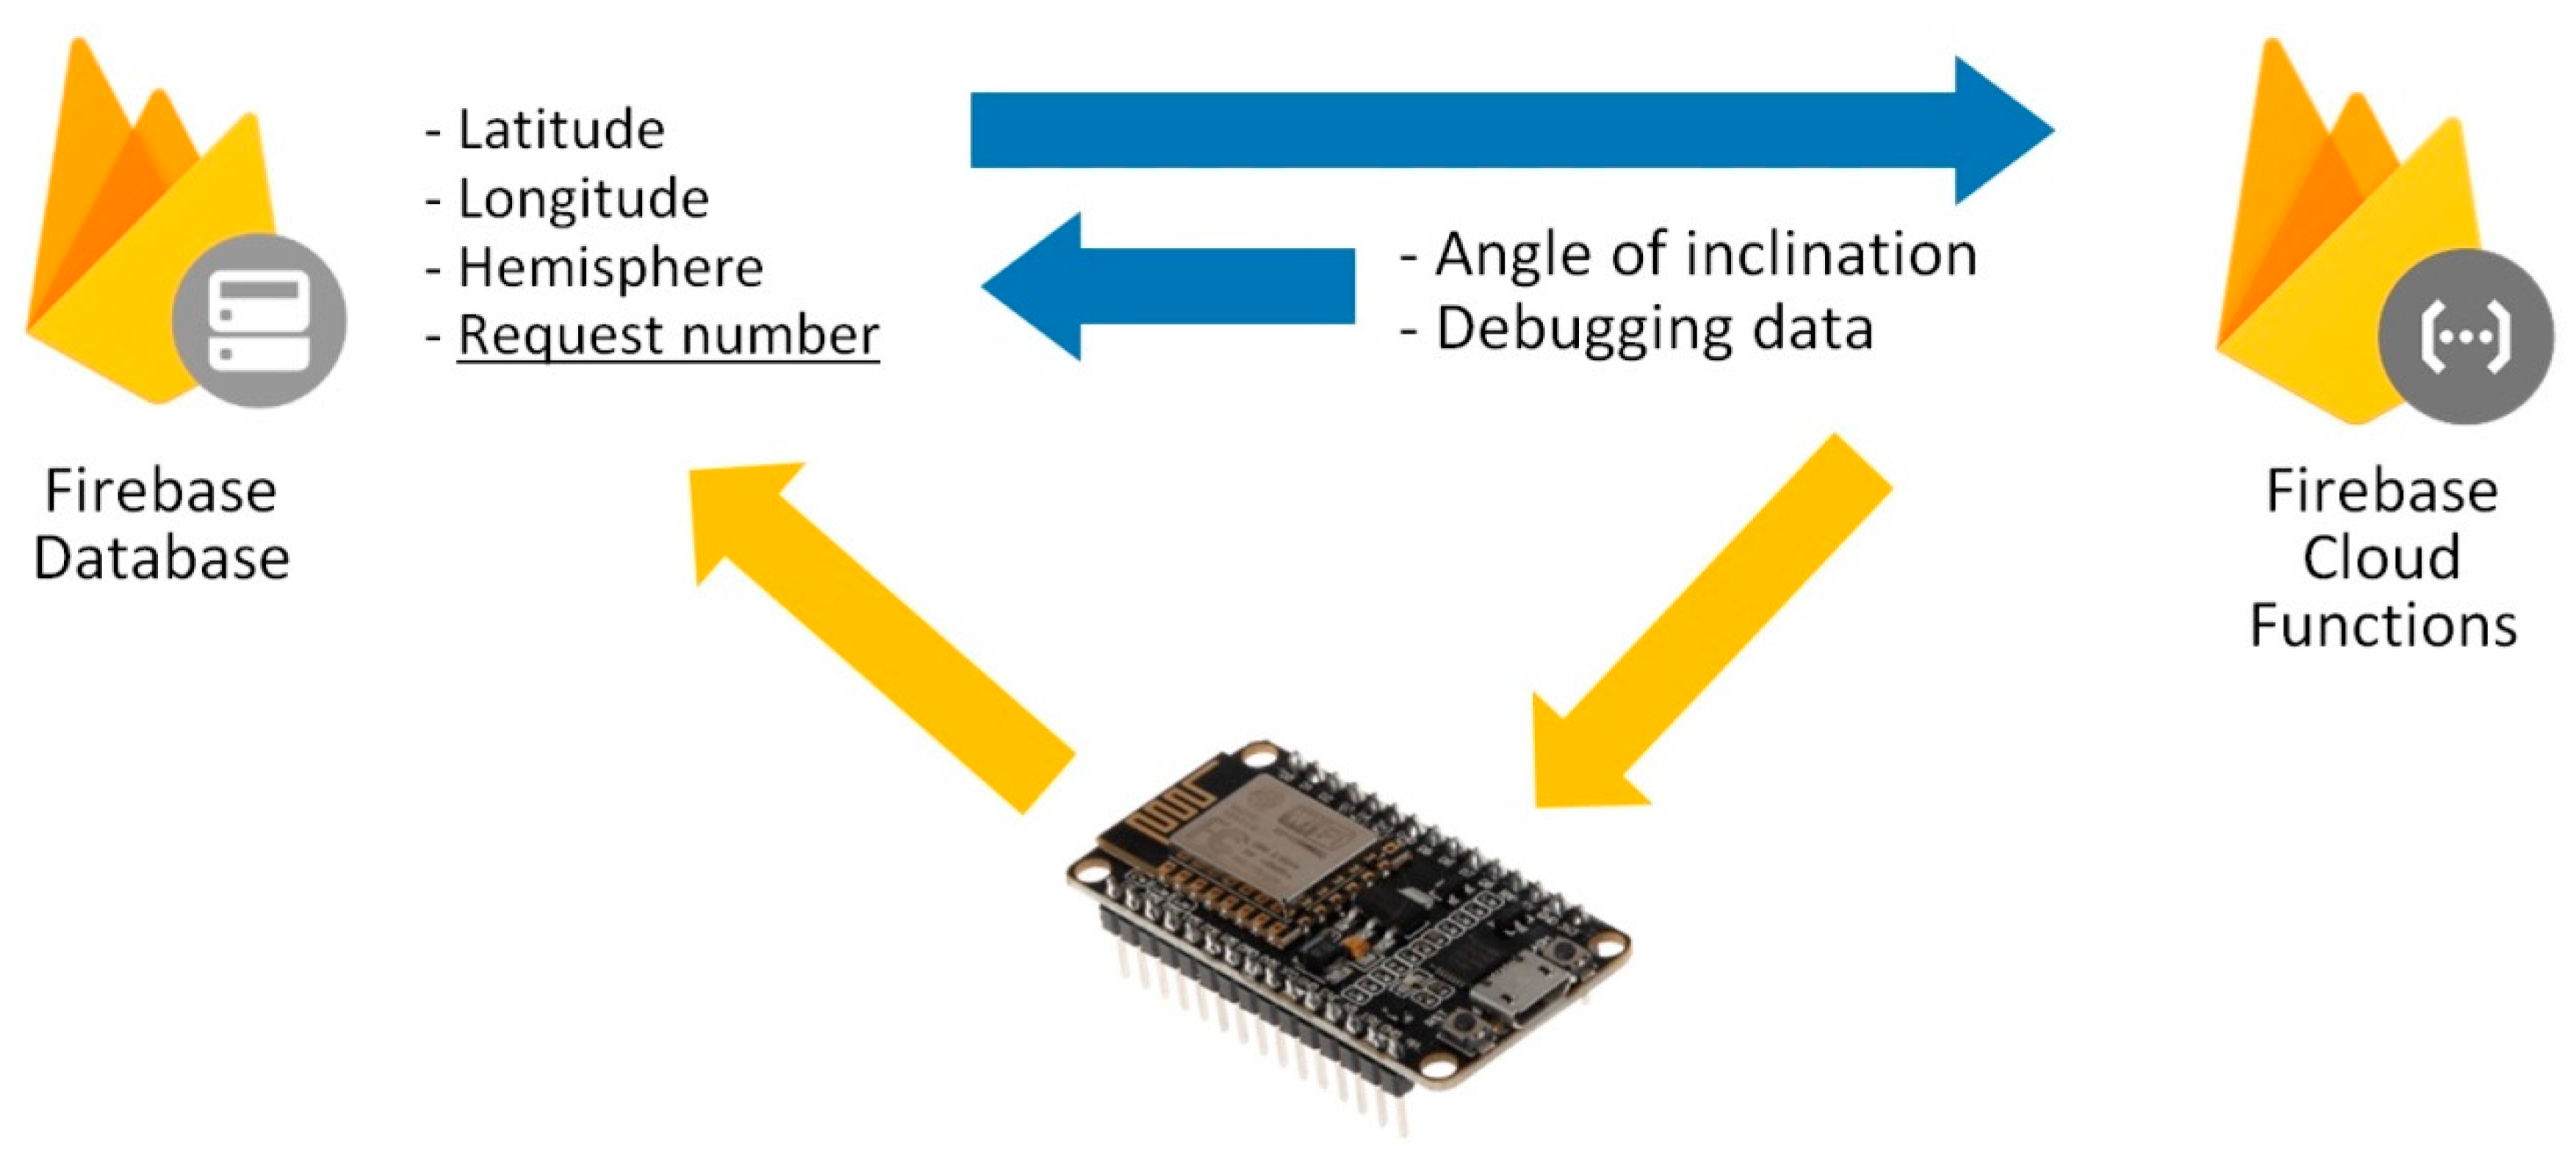
The architecture of the system as a whole was considered within the scope of IoT, since, as mentioned above, the NodeMCU board has a Wi-Fi module that allows connection to web services. In this case, it was decided to work with the Google Firebase platform, where the tracking algorithm is mounted.
Figure 7 shows the general IoT architecture of the system.
Through simple commands in the code of the NodeMCU board, such as read, write, and set commands, it is possible to connect to a specific Firebase service, as well as exchange information with it. In this way, it is possible to save computing power in the physical devices while performing all the algorithm operations in the cloud, and only request the value of the angle already processed for handling on the board, which reduces the costs in system components.
Figure 8 shows the principal components of the IoT architecture system.
A consideration made for the angle adjustment was that, due to the physical limits of rotation of the tracker, any angle obtained from Firebase with a value less than –45° would be taken as –45°, and for any angle obtained from Firebase with a value greater than 45° would be considered as 45°.
4.4. Tracking Algorithm in Firebase
Firebase offers different types of solutions and web services for managing applications with hosts and clients. The capabilities of Firebase are focused on being easy, secure, and compatible with most systems. For the prototype, two extensions of Firebase were used: Cloud Functions and Firebase Database.
Cloud Functions is a backend code used for managing the applications with functions triggered by Firebase functions. The functions are executed in the cloud servers allowing the host to maintain a simple system on the applications. Functions are coded in JavaScript and are executed when an event on the Firebase products is activated.
Firebase Database is a cloud database managed in JSON format. The data are stored in the server and synchronized when the client starts and regains a connection with the server. The organization of the database allows the client to set or listen to data in different branches. The database was structured as seen in
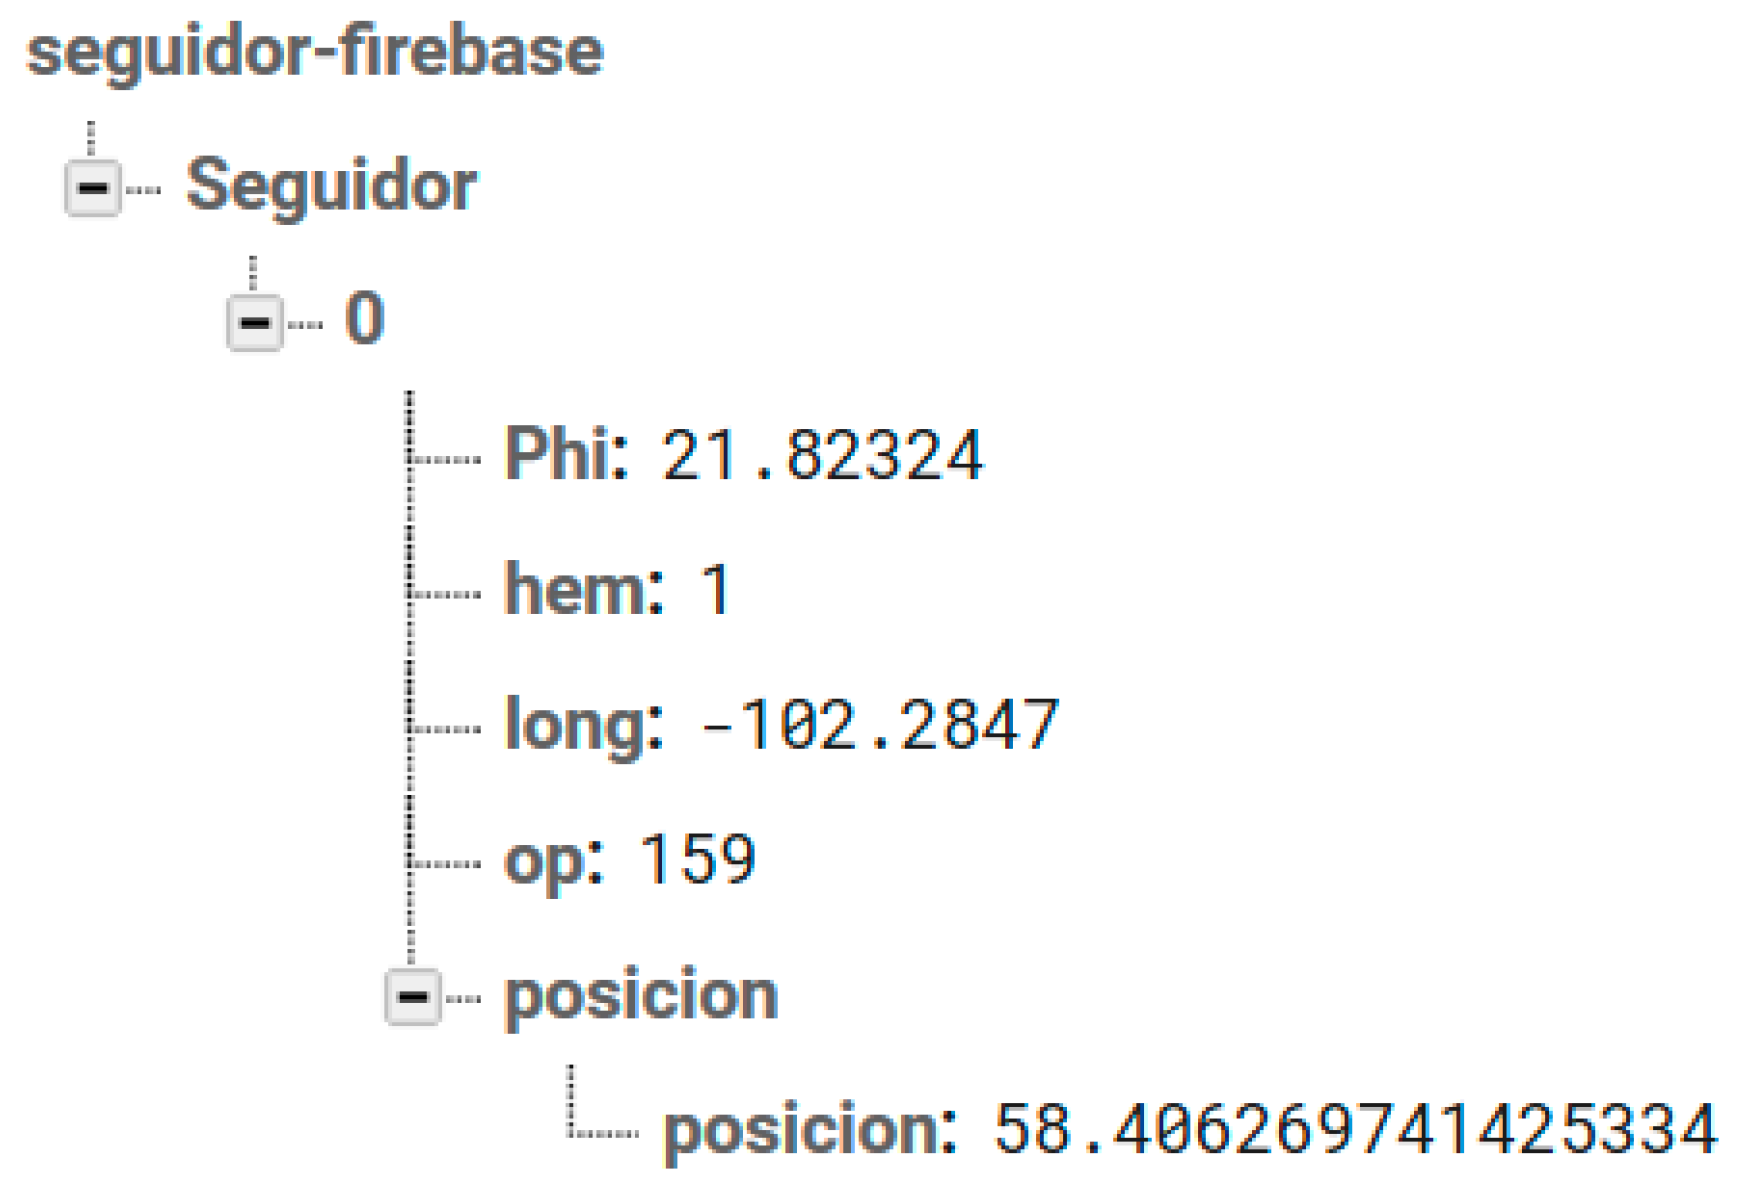
Figure 9, where an identifier was assigned to each user and each registered tracker. Each identifier had the data of each tracker, in this case, Phi (latitude), hem (northern = 1 or southern = −1 hemisphere), long (longitude), and op (operation number). The angle of rotation was returned in a result category (position) to obtain the results of the functions performed. For a normal operation case, only the angle of rotation (position) would be obtained, being able to display other results of interest for testing and debugging.
For a simple IoT application, the NodeMCU board connects to the server, sets a database with the global position obtained by GPS, and starts a counter for controlling the angle request each day. The database expects four inputs: the longitude, latitude, hemisphere, and the request number. When the database is synchronized, the request number triggers a function in Cloud Functions with the algorithm for calculating the angle of inclination of the solar tracker. This angle is returned to the database as the output of the function, and the NodeMCU board waits for reading the synchronized angle in the database. The function (
Figure 10) takes from the database, once initiated the event, the data of the tracker, latitude, longitude, and hemisphere, and within the same function, the UTC time is obtained to calculate the angle of rotation of the tracker at the time of change in the operation number. This angle is updated in the results and can be read by the solar tracker.
Firebase functions were prepared and programmed for backend execution. The angle of rotation of the sun-tracker was obtained from the following input data:
Latitude (ϕ).
Hemisphere (hem): Positive or negative unity value for Northern or Southern hemisphere, respectively.
Longitude (long).
Day of the year (n, from 1 to 365).
UTC Time (HUTC): UTC time in decimal format.
The calculation of the solar time was required for the location of the tracker. The civil hour, Hc, was obtained first by considering the longitude coordinate of the site (correction of 1 h per 15° of change in longitude compared to the Greenwich meridian). Then the equation of time for the day considered was used to calculate the solar time, as it expresses the difference between the civil hour and the solar hour.
From the solar time, and considering the declination angle of the Earth at the day (
δ) and the site latitude, it was possible to obtain the solar height and azimuth, according to Equations (4) and (5). Once the solar position was known, Equations (15) and (16) allow the target orientation and tilt of the PV modules to be calculated. Finally, the rotation angle of the sun-tracker (
ag) was obtained by:
The photovoltaic tracker system received this value through the database and made its adjustment for the position obtained. The system was controlled and received feedback for its position through an accelerometer to the ESP8266, which performed the main interactions with the systems.
4.5. Monitoring System
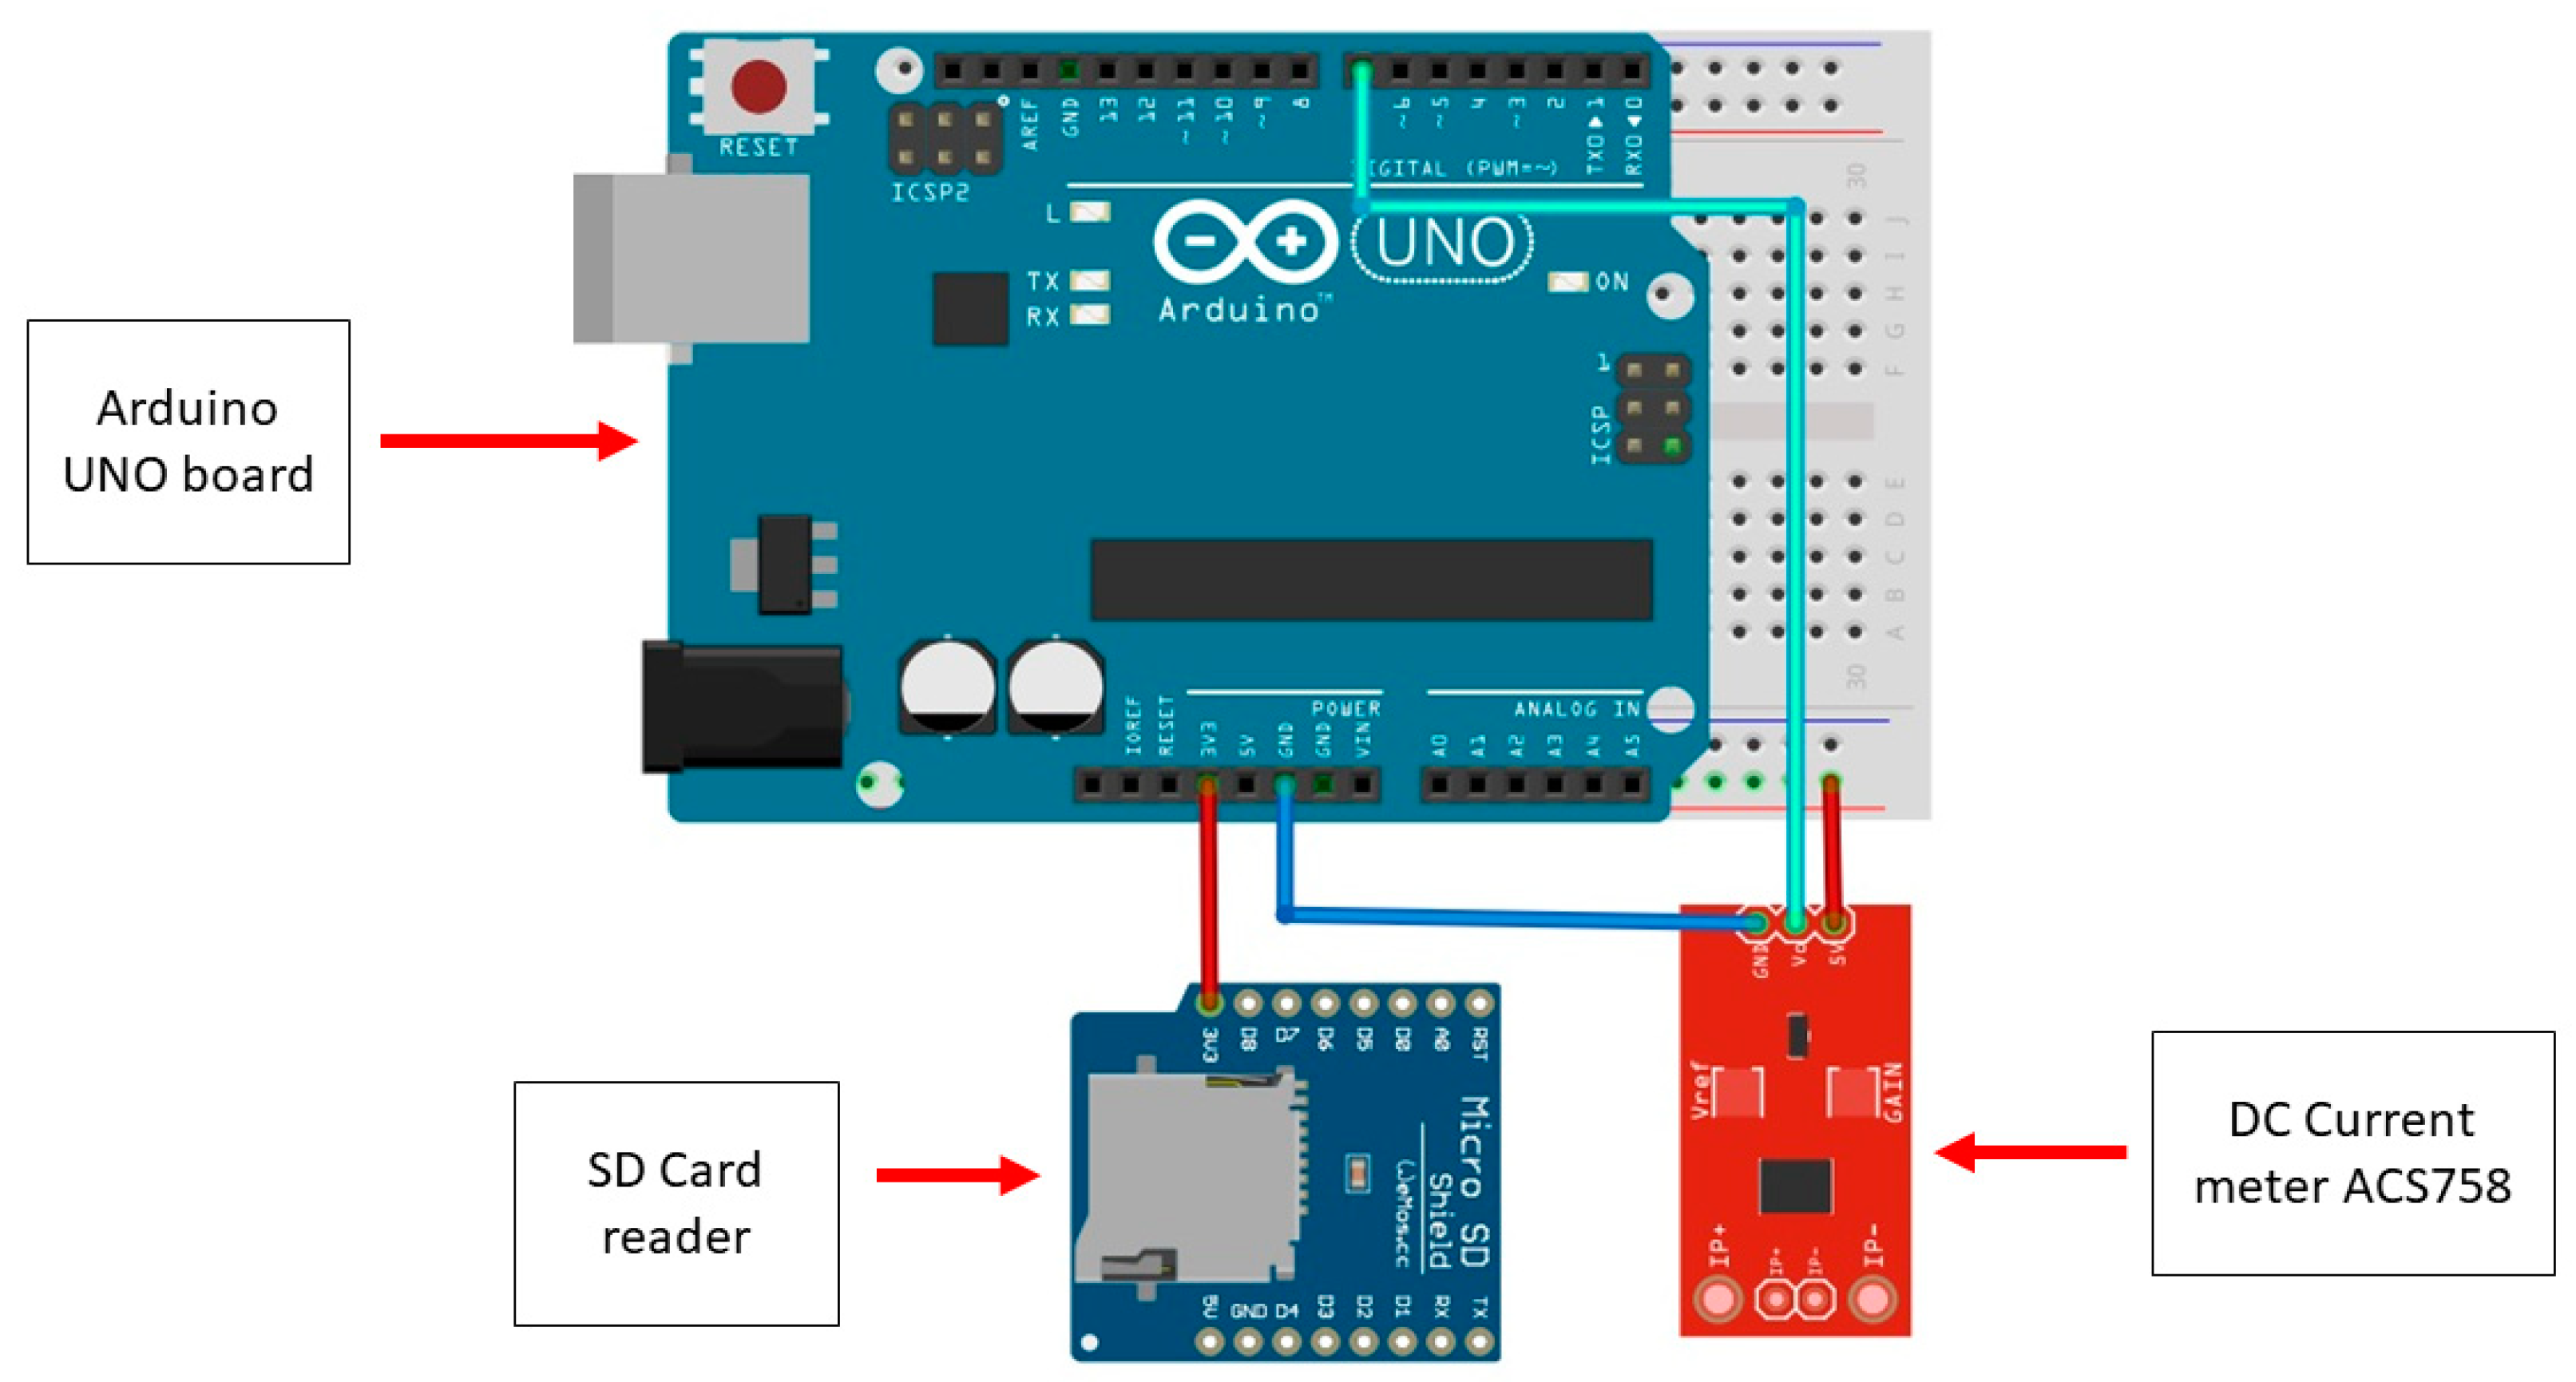
To evaluate the performance of the tracker, electrical output short-circuit current was measured for one of the installed PV modules. For this system, an Arduino UNO board was used, to which an ACS758 current meter connected to the outputs of the monitored module was connected. This meter was previously calibrated, which ensured that the measurements were reliable. Through this calibration, a precision level of two decimal places with 0% error was reached, for values found between 0 and 20 A.
It was decided that current measurements would be taken every 15 min. The collected values were saved in a txt file generated on an SD card, located inside a reader connected to the Arduino board, which allowed for easy retrieval of the collected data. It is important to mention that the monitoring system was independent of the control system.
Figure 11 shows the connection diagram of the monitoring system.
5. Experimental Results
As mentioned before, the experimental campaign took place in Aguascalientes, central Mexico. Aguascalientes’ climatic conditions fall inside the semi-desert ones. It is a dry and usually sunny climate. During the year, the temperature generally remains within the range of 4 °C to 30 °C and rarely falls below 0 °C or rises above 33 °C. The measurements were made during nine days in the month of May 2019, corresponding to days 11, 12, 13, 14, 17, 19, 20, 21, and 22. These days were selected because of the absence of clouds, which facilitated the measurement of the energy gains. Solar noon took place at 12:45 pm local time on these days, rising a solar height angle between 85.9°and 88.5°.
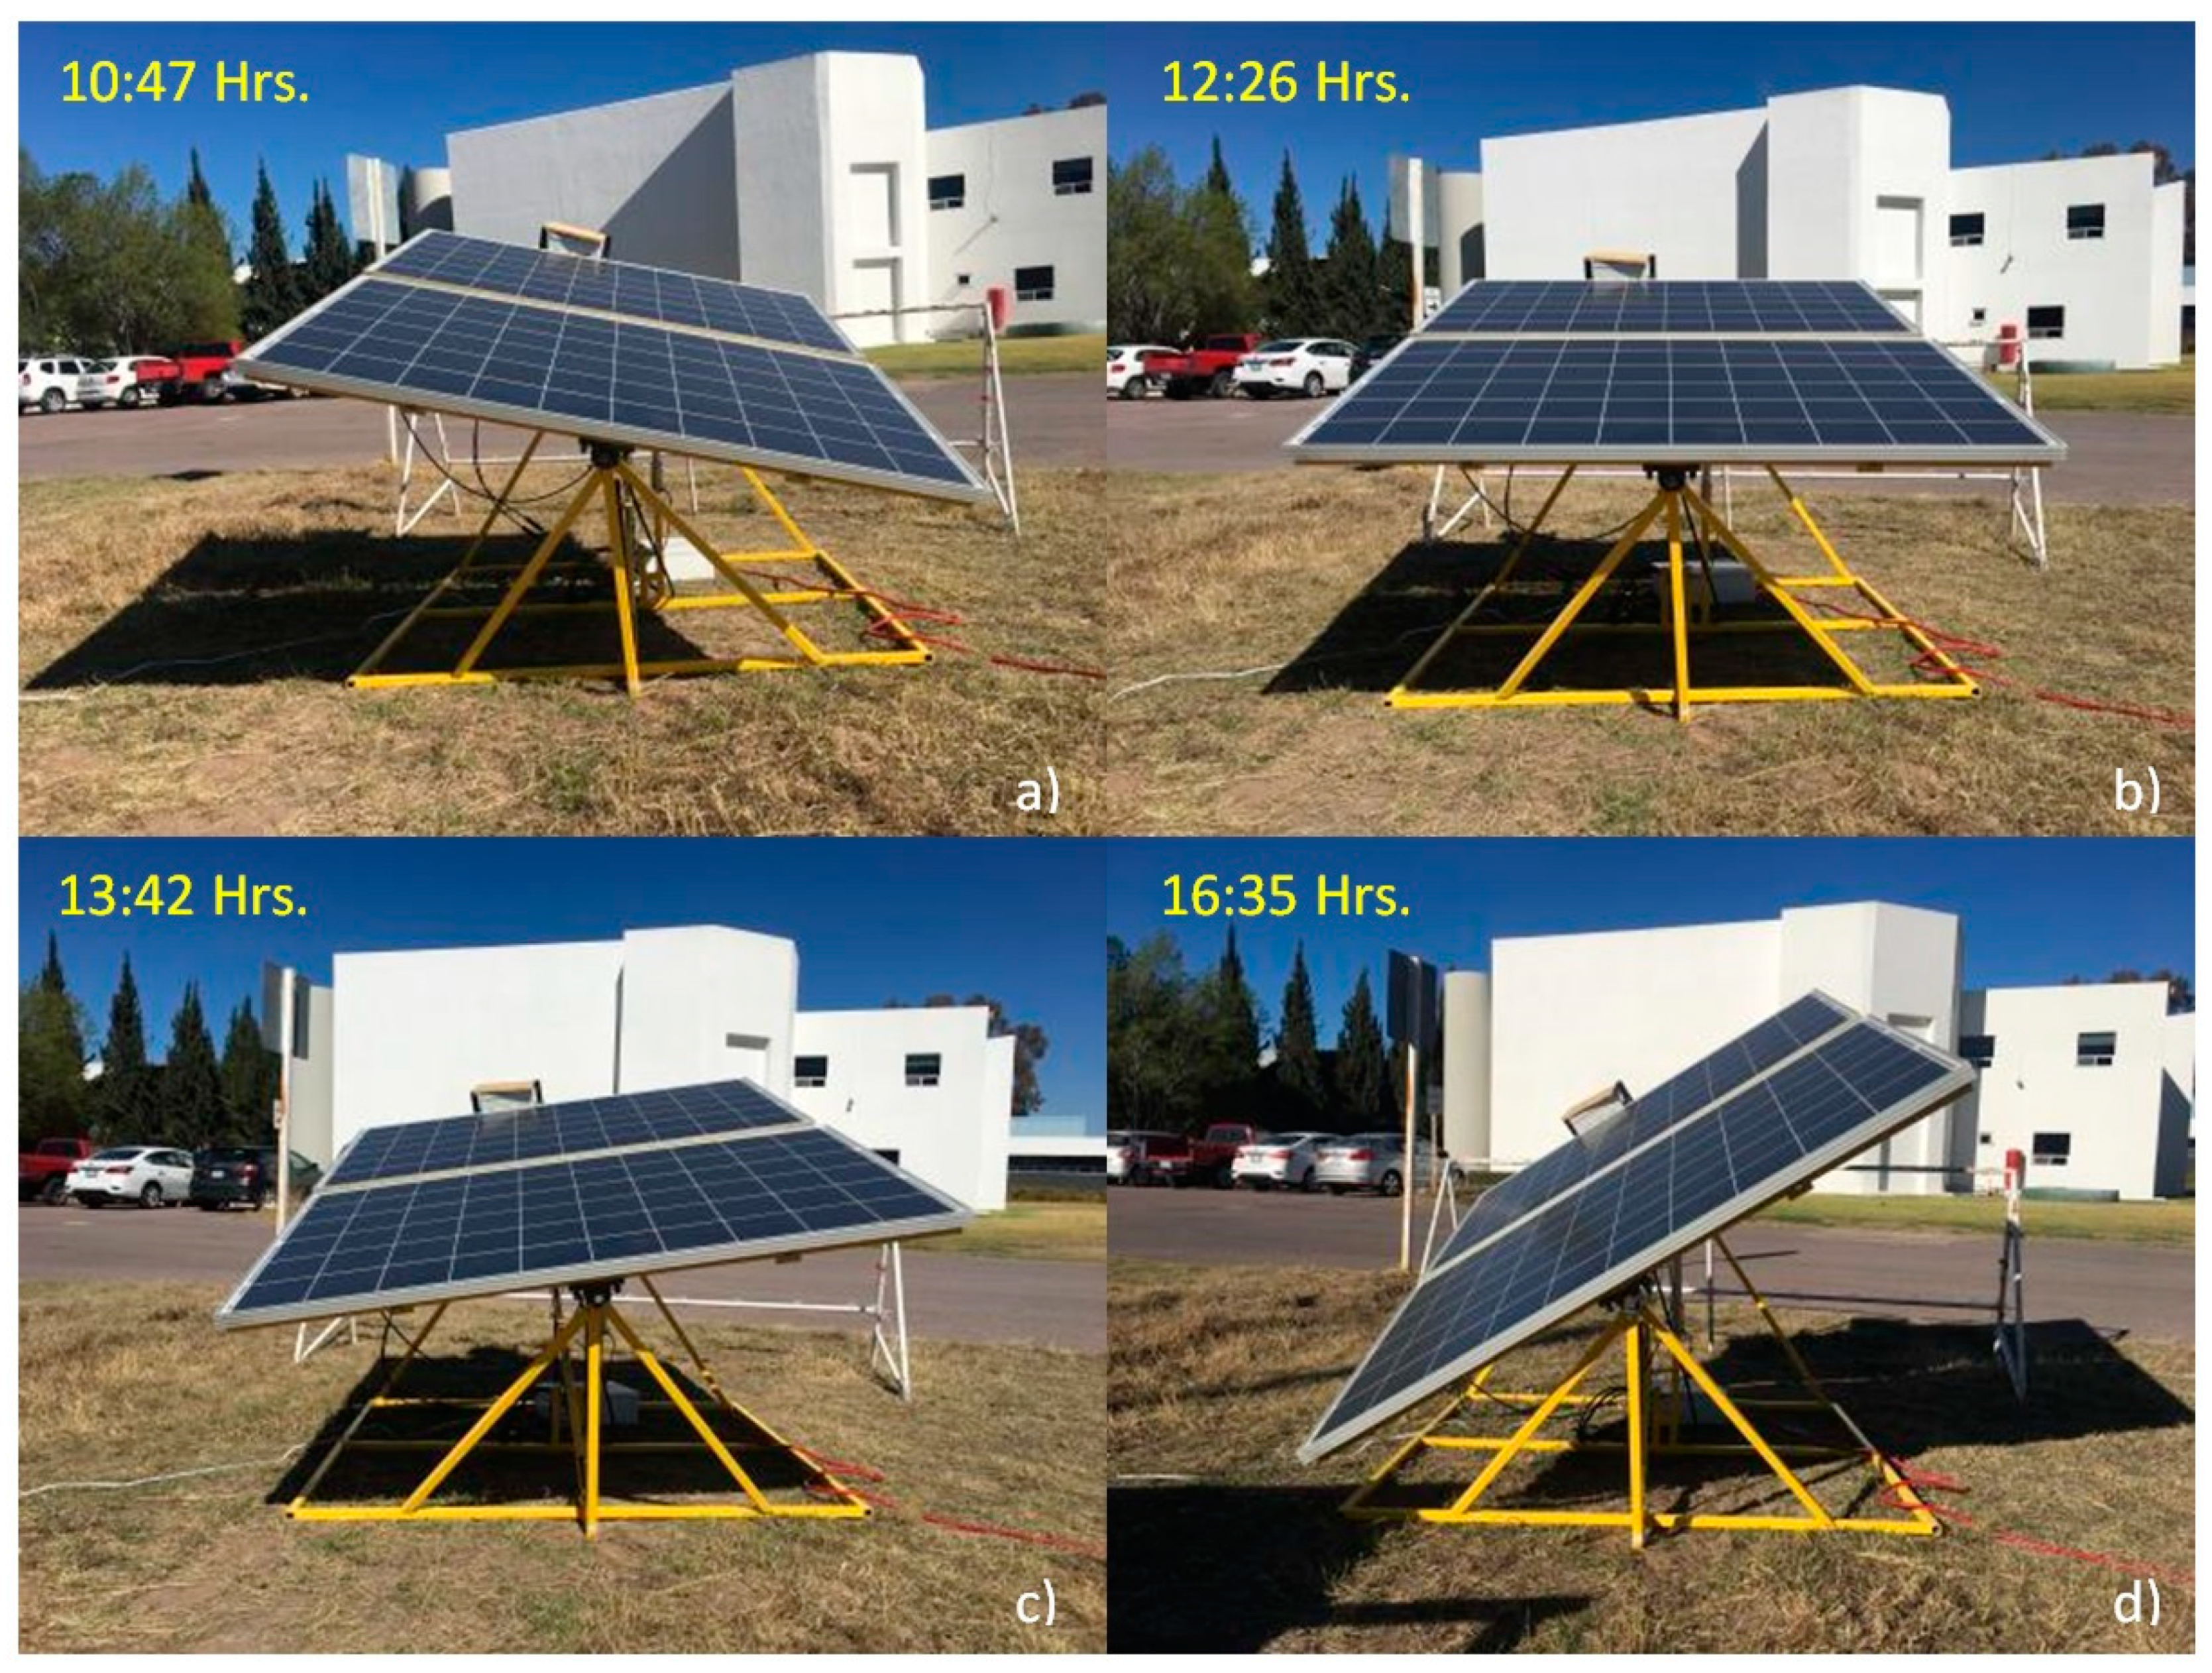
Figure 12 shows the movement of the solar tracker over a working day, at 10:47, 12:26 (near solar noon), 13:42, and 16:35.
A fixed south-oriented PV module (same manufacturer and model to those installed on the tracking structure) was installed close to the sun-tracking prototype with the same tilt as the tracker axis to compare the irradiation collected by the tracking and the fixed system (
Figure 13). This fixed module was mounted on a structure that supports three modules, but only one was monitored in this study (the clean module is shown in
Figure 13). The structure was located approximately five meters from the tracking system and at the same height (directly on the ground). This fixed module was monitored in the same way as the tracking system. The measurement of the short-circuit current of the PV modules allowed an indirect estimation of the irradiance collected by each system, because short-circuit current is approximately proportional to the irradiance in PV modules (taking into account that the temperature coefficient of short-circuit current is very small for crystalline silicon modules, <0.05%/°C). Therefore, the irradiance incident on a PV module (
G) can be expressed as:
Isc,meas being the measured short-circuit current, I
sc,STC the reference short-circuit current at standard test conditions (STC), and 1000 W/m
2 the reference irradiance at STC. The collected irradiation over one day (
H) can be estimated by a summation:
where
Δt is 1/4 h in this study.
The measurements registered during two example days are shown in
Figure 14a,b. These days have been selected randomly and are shown as examples because all the days show similar curves. The superior performance of the tracking system compared to the fixed system can be observed mainly in the morning and afternoon periods, while at noon, both systems were identically oriented and collect the same irradiance.
With the data registered over the experimental campaign, it is possible to compare the daily irradiation collected by the fixed and tracking systems. The numerical results are presented in
Table 4, as well as the percentage of irradiation gains obtained by the tracking system for each measured day. These results exhibit that the percentage gains of the tracking system were in the range 26.6–33.4% at this time of year in Aguascalientes. The average irradiation gain was 29.9% for the experimental campaign. The difference in the percentage gains compared to the average gain is also indicated in the table for each measured day. Six days showed positive differences (gains higher than the average), while three days showed negative differences. These three days exhibited an absolute value of the difference higher than the six days with a positive difference, being responsible for a decay of the average gain.
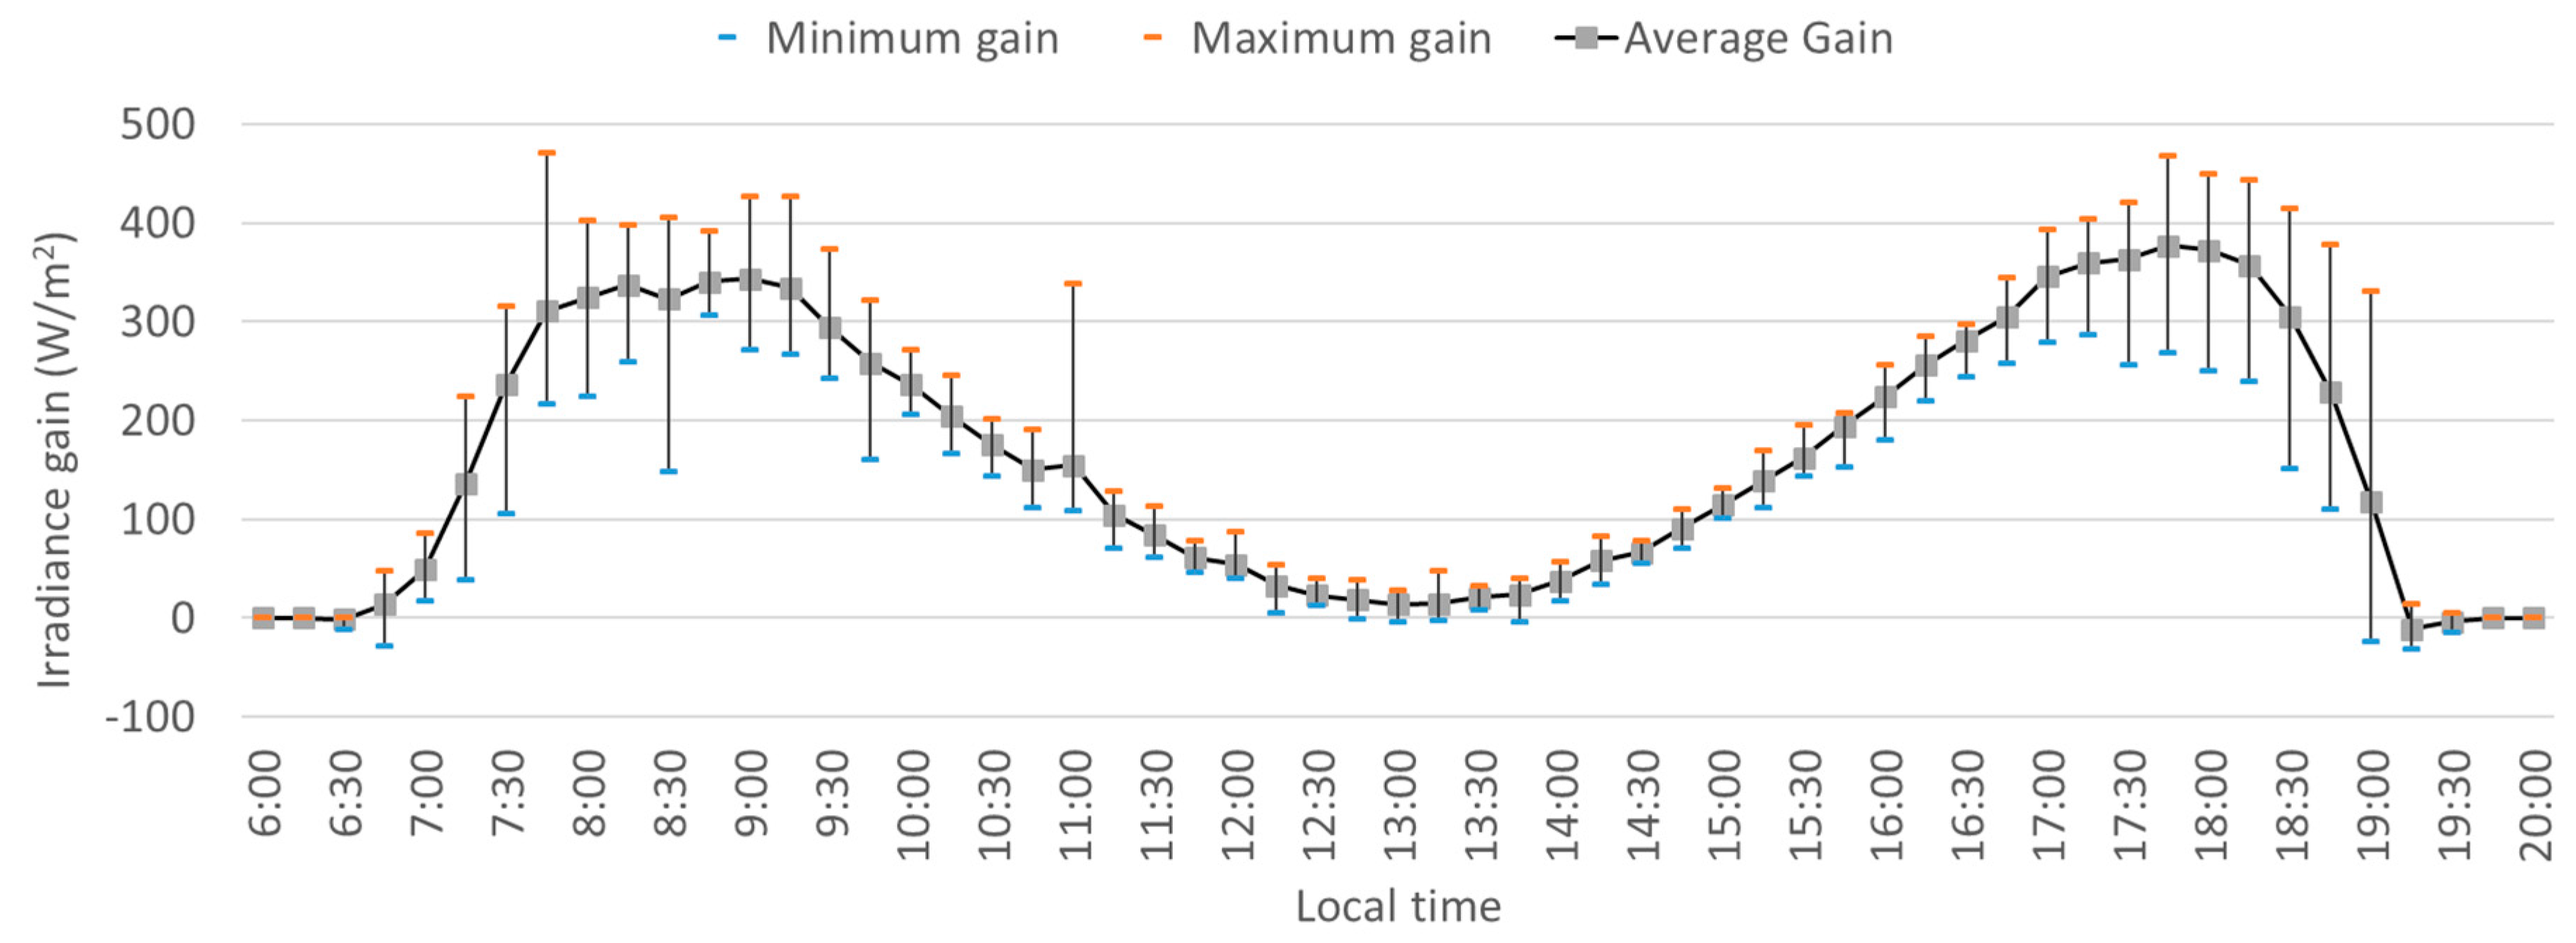
The irradiance gains of the tracking system compared to the fixed system over the 9 days of the experimental campaign can be analyzed more in detail by examining the minimum, average, and maximum gains over local time (
Figure 15). It can be seen that the average gain curve had two maxima (located approximately in the 8:00–9:00 am and the 5:30–6:30 pm ranges). These were the operating points with the best performance improvement due to the tracking movement. These points differed from sunrise (around 6:30 am) and sunset (around 7:15 pm) because the limits in the rotatory angle avoided more perpendicularity compared to the solar rays during these events. It can also be highlighted that the uncertainty in the measurements (understood as the difference between the minimum and maximum gain at a given local time) was higher in the first and last hours of the day compared to the interval around noon. This can be due to low irradiance errors inherent to the current sensors and to the fast change in the irradiance level during the first and last hours of the day. As can be seen, the uncertainty bars were quite small in the interval around noon, in which most of the energy was generated by the PV system.
The experimental value of the average irradiation gain (29.9%) can be compared with the ideal irradiation gain of a tilted north–south single-axis sun tracker in the site at this time of year, which can be calculated following the procedure described in
Section 3. The ideal percentage gain was 32.3%. Therefore, the prototype obtained irradiation gains somewhat lower than the ideal percentage. The difference can be due to the limits in the angle of rotation of the mechanical structure (between −45° and 45°). However, the obtained irradiation gains are relevant for an energy generation device for building integration.
6. Conclusions
First, it is possible to observe that the proposed first-of-its-kind sun tracking system through IoT for building integration can provide a substantial increase in energy production (29.9% in May in Aguascalientes), showing an expected behavior close to that found in the ideal solar tracking system of the same type (32.3% in May in Aguascalientes). This, in addition to the low cost of implementation and the design of the control system, which due to the algorithm, can operate anywhere in the world automatically, makes this system very innovative and flexible in terms of implementation. Although the sun-tracker mechanical structure is not novel, the Internet of Things architecture is innovative, and such an approach cannot be found in the literature. The proposed system is suitable for integration in buildings, which often have a Wi-Fi connection available. In addition, the inclined axis makes the proposal for its implementation in small sun-trackers more suitable.
Another advantage of the system is the possibility of displaying its behavior through Firebase since this platform allows visualizing the number of requests made by the control circuit, as well as the value delivered. In this way, it is possible to know the position of the tracker at any time.
A drawback that arises from the use of this system is the need for a Wi-Fi connection. Although in applications for houses or buildings, this may not be very limiting, it is so if for large-scale applications for power generation on solar farms. In addition, a Wi-Fi signal drop would result in losses in the energy generation (in these periods, the sun tracker would not be optimally oriented).
An improvement area that could be identified was the construction of the structure that supports the photovoltaic modules, especially focused on cost reduction. This can be achieved using cheaper, similar performing materials, or even better, through a redesign of the structure, managing to find a cheaper design that has the same level of support as the structure used.
Author Contributions
Conceptualization, S.G. and P.M.R.; methodology, S.G., P.M.R., and J.A; software, A.M.; validation, J.A. and A.A.; formal analysis, P.M.R.; writing—original draft preparation, S.G., P.M.R., and J.A; writing—review and editing, P.M.R.; project administration and funding acquisition, S.G. All authors have read and agreed to the published version of the manuscript.
Funding
This research was funded by the Panamericana University Aguascalientes Campus, grant number UP-CI-2017-ING-AGS-05.
Acknowledgments
Pedro M. Rodrigo and Sebastian Gutierrez acknowledge the Science and Technology National Council of México (CONACYT) for the economic support as members of the National System of Researchers.
Conflicts of Interest
The authors declare no conflict of interest.
References
- Berardi, U. Building Energy Consumption in US, EU, and BRIC Countries. Procedia Eng. 2015, 118, 128–136. [Google Scholar] [CrossRef]
- Chen, F.; Pao, F.; Yin, H. 14—Advanced Building Integrated Photovoltaic/Thermal Technologies. In A Comprehensive Guide to Solar Energy Systems; Letcher, T.M., Fthenakis, V.M., Eds.; Academic Press: Cambridge, MA, USA, 2018; pp. 299–319. ISBN 978-0-12-811479-7. [Google Scholar]
- Singh, Y.; Pal, N. Obstacles and comparative analysis in the advancement of photovoltaic power stations in India. Sustain. Comput. Inform. Syst. 2020, 25, 100372. [Google Scholar] [CrossRef]
- Hafez, A.Z.; Yousef, A.M.; Harag, N.M. Solar tracking systems: Technologies and trackers drive types—A review. Renew. Sustain. Energy Rev. 2018, 91, 754–782. [Google Scholar] [CrossRef]
- Alaa, M.; Zaidan, A.A.; Zaidan, B.B.; Talal, M.; Kiah, M.L.M. A review of smart home applications based on Internet of Things. J. Netw. Comput. Appl. 2017, 97, 48–65. [Google Scholar] [CrossRef]
- Mocrii, D.; Chen, Y.; Musilek, P. IoT-based smart homes: A review of system architecture, software, communications, privacy and security. Internet Things 2018, 1–2, 81–98. [Google Scholar] [CrossRef]
- AL-Rousan, N.; Isa, N.A.M.; Desa, M.K.M. Advances in solar photovoltaic tracking systems: A review. Renew. Sustain. Energy Rev. 2018, 82, 2548–2569. [Google Scholar] [CrossRef]
- Randall, J.; Lieberman, M. Passive trackers for photovoltaics. In Proceedings of the Annual Meeting—American Section of the International Solar Energy Society, New Orleans, LA, USA, 7–12 October 1984; pp. 529–533. [Google Scholar]
- Huang, B.-J.; Huang, Y.-C.; Chen, G.-Y.; Hsu, P.-C.; Li, K. Improving solar PV system efficiency using one-axis 3-position sun tracking. Energy Procedia 2013, 33, 280–287. [Google Scholar] [CrossRef]
- Yang, C.-K.; Cheng, T.-C.; Cheng, C.-H.; Wang, C.-C.; Lee, C.-C. Open-loop altitude-azimuth concentrated solar tracking system for solar-thermal applications. Sol. Energy 2017, 147, 52–60. [Google Scholar] [CrossRef]
- Melo, A.G.; Filho, D.O.; De Oliveira Júnior, M.M.; Zolnier, S.; Ribeiro, A. Development of a closed and open loop solar tracker technology [Desenvolvimento de tecnologia de rastreamento solar com controle em malha fechada e em malha aberta]. Acta Sci. Technol. 2017, 39, 177–183. [Google Scholar] [CrossRef]
- Sidek, M.H.M.; Azis, N.; Hasan, W.Z.W.; Ab Kadir, M.Z.A.; Shafie, S.; Radzi, M.A.M. Automated positioning dual-axis solar tracking system with precision elevation and azimuth angle control. Energy 2017, 124, 160–170. [Google Scholar] [CrossRef]
- Gutiérrez, S.; Rodrigo, P.M. Energetic analysis of simplified 2-position and 3-position North-South horizontal single-axis sun tracking concepts. Sol. Energy 2017, 157, 244–250. [Google Scholar] [CrossRef]
- Huang, B.J.; Sun, F.S. Feasibility study of one axis three positions tracking solar PV with low concentration ratio reflector. Energy Convers. Manag. 2007, 48, 1273–1280. [Google Scholar] [CrossRef]
- Sefa, I.; Demirtas, M.; Çolak, I. Application of one-axis sun tracking system. Energy Convers. Manag. 2009, 50, 2709–2718. [Google Scholar] [CrossRef]
- Şenpinar, A.; Cebeci, M. Evaluation of power output for fixed and two-axis tracking PVarrays. Appl. Energy 2012, 92, 677–685. [Google Scholar] [CrossRef]
- NASA Prediction of Worldwide Energy Resources (NASA POWER). Available online: https://power.larc.nasa.gov/ (accessed on 20 February 2019).
- Whillier, A. The determination of hourly values of total solar radiation from daily summations. Arch. Meteorol. Geophys. Bioklimatol. Ser. B 1956, 7, 197–204. [Google Scholar] [CrossRef]
- Walraven, R. Calculating the position of the sun. Sol. Energy 1978, 20, 393–397. [Google Scholar] [CrossRef]
- Iqbal, M. An Introduction to Solar Radiation; Academic Press: Toronto, ON, Canada, 1983. [Google Scholar]
- Kalogirou, S.A. Solar Energy Engineering: Processes and Systems, 2nd ed.; Academic Press: Cambridge, MA, USA, 2014. [Google Scholar]
- Hay, J.E. Calculation of monthly mean solar radiation for horizontal and inclined surfaces. Sol. Energy 1979, 23, 301–307. [Google Scholar] [CrossRef]
- ENF Solar RISEN RSM60-6-260P Photovoltaic Module Datasheet. Available online: https://es.enfsolar.com/pv/panel-datasheet/crystalline/29989 (accessed on 24 April 2020).
- Espressif Systems ESP8266EX. Available online: https://www.espressif.com/en/products/hardware/esp8266ex/overview (accessed on 13 February 2020).
- Alvarez, J.; Acero, A.; Gutierrez, S.; Rodrigo, P.M.; Lay-Ekuakille, A. A low cost presence detection system for smart homes. In Proceedings of the 2018 3rd IEEE International Conference on Research in Intelligent and Computing in Engineering, RICE 2018, San Salvador, El Salvador, 22–24 August 2018; Volume 2018. [Google Scholar]
- Estrada, E.; Moreno, M.; Martin, K.; Mever, A.L.; Rodrigo, P.M.; Gutierrez, S. Low cost CO detector integrated with IoT. In Proceedings of the 2019 IEEE International Conference on Engineering Veracruz, ICEV 2019, Boca del Rio, Veracruz, 14–17 October 2019. [Google Scholar]
- Gutierrez, E.; Gutierrez, S.; Becerril, J.A.; Rodriguez, F. Low cost prototype for monitoring and remote control in greenhouse for homes. In Proceedings of the 2018 IEEE International Autumn Meeting on Power, Electronics and Computing, ROPEC 2018, Ixtapa, Mexico, 14–16 November 2018. [Google Scholar]
- Ochoa, I.Z.; Gutierrez, S.; Rodriguez, F. Internet of things: Low cost monitoring beehive system using wireless sensor network. In Proceedings of the 2019 IEEE International Conference on Engineering Veracruz, ICEV 2019, Boca del Rio, Veracruz, 14–17 October 2019. [Google Scholar]
Figure 1.
Scheme of the main types of sun trackers.
Figure 1.
Scheme of the main types of sun trackers.
Figure 2.
Ideal collected global irradiance of the different types of sun trackers over the winter (a) and summer (b) solstices in Aguascalientes, and comparison to a south-oriented fixed structure system with tilt equal to latitude.
Figure 2.
Ideal collected global irradiance of the different types of sun trackers over the winter (a) and summer (b) solstices in Aguascalientes, and comparison to a south-oriented fixed structure system with tilt equal to latitude.
Figure 3.
Monthly behavior of the different types of sun trackers in Aguascalientes, and comparison to a south-oriented fixed structure system with tilt equal to latitude.
Figure 3.
Monthly behavior of the different types of sun trackers in Aguascalientes, and comparison to a south-oriented fixed structure system with tilt equal to latitude.
Figure 4.
Isometric (a) and side (b) views of the support structure. Steel structure (c) and structure with photovoltaic (PV) panels (d).
Figure 4.
Isometric (a) and side (b) views of the support structure. Steel structure (c) and structure with photovoltaic (PV) panels (d).
Figure 5.
Connections diagram of the control circuit.
Figure 5.
Connections diagram of the control circuit.
Figure 6.
Flow diagram representing the algorithm used by the control circuit.
Figure 6.
Flow diagram representing the algorithm used by the control circuit.
Figure 7.
General Internet of Things (IoT) architecture of the system.
Figure 7.
General Internet of Things (IoT) architecture of the system.
Figure 8.
Principal components of the IoT architecture system.
Figure 8.
Principal components of the IoT architecture system.
Figure 9.
JSON data structure.
Figure 9.
JSON data structure.
Figure 10.
Database function.
Figure 10.
Database function.
Figure 11.
Connections diagram of the monitoring system.
Figure 11.
Connections diagram of the monitoring system.
Figure 12.
Movement of the solar tracker over a day. Morning position (a), noon position (b), afternoon position (c) and (d).
Figure 12.
Movement of the solar tracker over a day. Morning position (a), noon position (b), afternoon position (c) and (d).
Figure 13.
Photo of the fixed and tracking systems.
Figure 13.
Photo of the fixed and tracking systems.
Figure 14.
Irradiance measurements over May 11 (a) and May 17 (b) for the tracking and the fixed systems.
Figure 14.
Irradiance measurements over May 11 (a) and May 17 (b) for the tracking and the fixed systems.
Figure 15.
Analysis of average irradiance gains of the tracking system compared to the fixed one over the day for the 9-days experimental campaign and, difference between the maximum and minimum gains represented by the bars.
Figure 15.
Analysis of average irradiance gains of the tracking system compared to the fixed one over the day for the 9-days experimental campaign and, difference between the maximum and minimum gains represented by the bars.
Table 1.
Daily collected irradiation and percentage gains relative to a south-oriented fixed structure system with tilt equal to latitude of the different types of sun trackers for the winter and summer solstices in Aguascalientes.
Table 1.
Daily collected irradiation and percentage gains relative to a south-oriented fixed structure system with tilt equal to latitude of the different types of sun trackers for the winter and summer solstices in Aguascalientes.
| Type of PV System | Winter Solstice | Summer Solstice |
|---|
| Collected Irradiation (Wh/m2/day) | Percentage Gain (%) | Collected Grradiation (Wh/m2/day) | Percentage Gain (%) |
|---|
| Fixed | 5967 | 0.0 | 5801 | 0.0 |
| East–west horizontal single-axis | 6849 | 14.8 | 6645 | 14.6 |
| Vertical tilted axis | 6489 | 8.8 | 7338 | 26.5 |
| North–south horizontal single-axis | 6424 | 7.7 | 7982 | 37.6 |
| North–south tilted single-axis | 7407 | 24.1 | 7456 | 28.5 |
| Two-axes | 8110 | 35.9 | 8083 | 39.3 |
Table 2.
Annual collected irradiation and percentage gains relative to a south-oriented fixed structure system with tilt equal to latitude of the different types of sun trackers in Aguascalientes.
Table 2.
Annual collected irradiation and percentage gains relative to a south-oriented fixed structure system with tilt equal to latitude of the different types of sun trackers in Aguascalientes.
| Type of PV System | ANNUAL |
|---|
| Collected Irradiation (kWh/m2/year) | Percentage Gain (%) |
|---|
| Fixed | 2292 | 0.0 |
| East–west horizontal single-axis | 2462 | 7.5 |
| Vertical tilted single-axis | 2669 | 16.4 |
| North–south horizontal single-axis | 2840 | 23.9 |
| North–south tilted single-axis | 2927 | 27.7 |
| Two-axes | 3067 | 33.8 |
Table 3.
Photovoltaic module technical data as supplied by the manufacturer [
23].
Table 3.
Photovoltaic module technical data as supplied by the manufacturer [
23].
| Model: RISEN RSM60-6-260P |
|---|
| Maximum power | 260 W |
| Voltage at maximum power point | 30.6 V |
| Current at maximum power point | 8.5 A |
| Open-circuit voltage | 37.8 V |
| Short-circuit current | 9.04 A |
| Length | 1650 mm |
| Width | 992 mm |
Table 4.
Daily irradiation collected by the tracking and the fixed systems for the 9 days of the experimental campaign, percentage gain of irradiation obtained by the tracking system, and difference of the percentage gain from the average gain.
Table 4.
Daily irradiation collected by the tracking and the fixed systems for the 9 days of the experimental campaign, percentage gain of irradiation obtained by the tracking system, and difference of the percentage gain from the average gain.
| Day | Tracking System (kWh/m2) | Fixed System (kWh/m2) | Percentage Gain (%) | Difference from the Average (%) |
|---|
| 1 | 10.51 | 8.02 | 31.07 | 1.18 |
| 2 | 10.95 | 8.21 | 33.36 | 3.47 |
| 3 | 10.40 | 7.91 | 31.48 | 1.59 |
| 4 | 10.26 | 7.85 | 30.65 | 0.76 |
| 5 | 9.95 | 7.86 | 26.55 | –3.34 |
| 6 | 10.63 | 8.12 | 30.99 | 1.10 |
| 7 | 9.61 | 7.57 | 26.91 | –2.98 |
| 8 | 10.16 | 7.80 | 30.32 | 0.43 |
| 9 | 9.55 | 7.50 | 27.23 | –2.66 |
| Daily average: | 10.22 | 7.87 | 29.89 | 0.00 |
© 2020 by the authors. Licensee MDPI, Basel, Switzerland. This article is an open access article distributed under the terms and conditions of the Creative Commons Attribution (CC BY) license (http://creativecommons.org/licenses/by/4.0/).
