1. Introduction
As part of the global energy transition and to avoid climate change, the Paris Agreement envisages a reduction of greenhouse gas emissions to 40% by 2040, starting from the base year 1990 [
1]. There is a growing interest in companies to solve the question of their own climate neutrality in a transparent and sustainable way. In addition to their own motivation, customer demands for climate neutrality are becoming increasingly important from an economic point of view. Industry has a sector goal of reducing emissions by 49% to 51% (compared to 1990) by 2030 in Germany. To reach these goals industrial processing companies need to perform three steps. The first step is minimizing the energy demand by energy efficiency measures and secondly substituting fossil fuels by changing processes or implementing renewable energies. Compensating unavoidable emissions should only be the last step.
Process steam is widely used in the industry and is one of the main consumers of thermal energy. It is currently still often produced with fossil-fired steam boilers for economic reasons. In 2016, around 21.4% of Germany’s total energy consumption was needed for processing heat. The share of renewable energies in this consumption was only 5.2% [
2]. By 2050, the share of renewable energies in industry must rise to over 63% [
3].
Bühler et al. [
4] showed that an industrial integration of renewable energy based generation technologies is a complex problem due to many assumptions which have to be made as well as numerous statistical uncertainties. Therefore, different case studies from different industrial sectors and production system types are crucial to elucidate challenges and propose solutions for the energy transition. The paper does not consider solar thermal or biomass energy sources. Besides, it is focused on costs not emissions. For choosing the best energy supply for industrial sites top-down models often struggle to include technological explicitness [
5]. This is especially important for batch processes with a fluctuating steam demand. For industrial sites, the most attractive renewable energy sources are are biomass, solar radiation (thermal or photovoltaics), ground heat and wind [
6]. This indicates an electrification of the steam supply via heat pumps (HP) and electric boilers (EB) or a substitution of fossil fuels with renewable energy sources.
To reach a 100% renewable energy supply in New Zealand and California for milk production plants, Walmsley et al. [
7] analysed geothermal steam and renewable electricity for the mechanical vapor recompression, a biomass boiler with a two-stage ammonia heat pump using the boiler flue gases and solar thermal energy. Also, the integration of solar thermal energy for a Danish milk powder factory was analysed [
8]. For the state of California, 48 TWh per year for industrial heating demands below 260 °C can be covered by solar power technologies [
9]. Solar thermal energy offers a good solution especially in sunny states like Spain, like Silva et al. [
10] showed for saturated steam at 7 bar. Stark et al. [
11] investigated a pharmaceutical production facility with several overlapping steam batch processes. The majority of the steam demand is supplied from a biomass CHP plant. By utilising a steam accumulator, the share of bio-steam can be increased and the supply stability is improved. Further, the design parameters and the influence on the turbine system of the plant were investigated by Stark et al. [
12]. To process stability as well as the share of bio-steam which is used in the supply system can be improved. Pérez-Uresti et al. [
13] presented a method for calculating levelised steam costs based on solar thermal energy, biomass or biogas. For medium pressure (MP) steam and a plant capacity of 30 kg/s the presented steam costs for biomass are 19.36 €/t, for solar thermal 30.65 €/t and biogas 25.73 €/t.
Peesel et al. [
14] showed that the
-emissions can be reduced by up to 42% by the transition to a solid biomass-fuelled boiler system and up to 27% using a biomethane fuelled solid oxide fuel cell but the operating costs increase significantly. A bottom up methodology for assessing electrification options for industrial process was presented by Wiertzemena et al. [
15]. The authors highlighted that the energy and carbon footprint consequences of electrification are hard to predict and therefore detailed simulation studies are required. For the year 2050, Johansson et al. [
16] estimated the
-emissions reduction potential for the European petroleum refining industry including energy efficiency measures, fuel switching and carbon capture and storage. For a complex oil refinery four pathways for
-emissions reduction were analysed [
17]. Energy efficiency measures followed by biomass gasification with carbon capture and storage is the most cost-effect pathway. Besides, industrial sites with an almost constant energy demand, part load characteristic may change the energy efficiency and cost calculation for steam systems. The part load performance of boilers and steam turbines is considered by Sun et al. [
18] for analysing the steam costs by using a cumulative cost profile based on the marginal cost of steam.
However, a variety of technologies has to be investigated and different pathways should be investigated and implemented [
6]. This is especially important as new developments can trigger significant cost reductions in certain technologies, like for example, optimized control [
19] or load management. A system approach should be not restricted to certain technologies. Hybrid approaches are an option, for example, direct steam generation with solar collectors combined with biomass boilers [
20].
In the food processing industry, the sterilisation process is the main energy consumer. For providing the steam often natural gas boilers are implemented. The short reaction times of the boilers help to manage the fluctuating steam demand due to batch sterilisation processes. A literature review and analysis of the present process revealed that sterilisation processes have been optimized in terms of temperature, time, material properties, heating medium and heat transfer coefficient [
21]. To reduce high peak demands thermal process scheduling is possible [
22]. Furthermore, a detailed analysis of the starting temperature and heat recovery potential has been carried out [
23]. For batch processes, the time aspect and accumulators have to be considered as well. Especially for fluctuating renewable energy sources and fluctuating production energy demands [
24]. For the technical requirements for the different steam utility systems the start up times are highly relevant especially for batch steam processes [
25].
Although, alternative process steam generation technologies with renewable energies have already been investigated, there is a lack for the special requirements of batch processes. In addition, the volatile energy supply and energy demand require a dynamic simulation to represent the interaction of main supply technologies, steam accumulators and peak load boilers with sufficient accuracy. Furthermore, the cost and energy efficiency are highly depending on the steam’s temperature, pressure and quality. This paper analyses the ratio of emissions savings and costs via a dynamic simulation for a total of seven technologies including specific investment and energy costs for a food processing plant with MP steam in Spain.
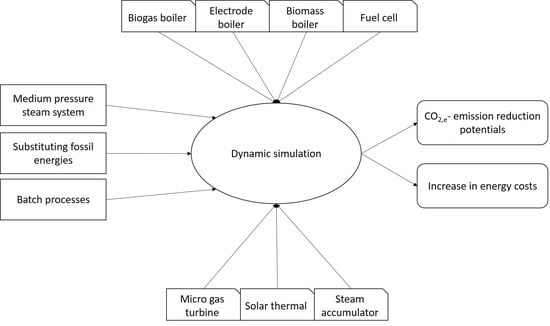
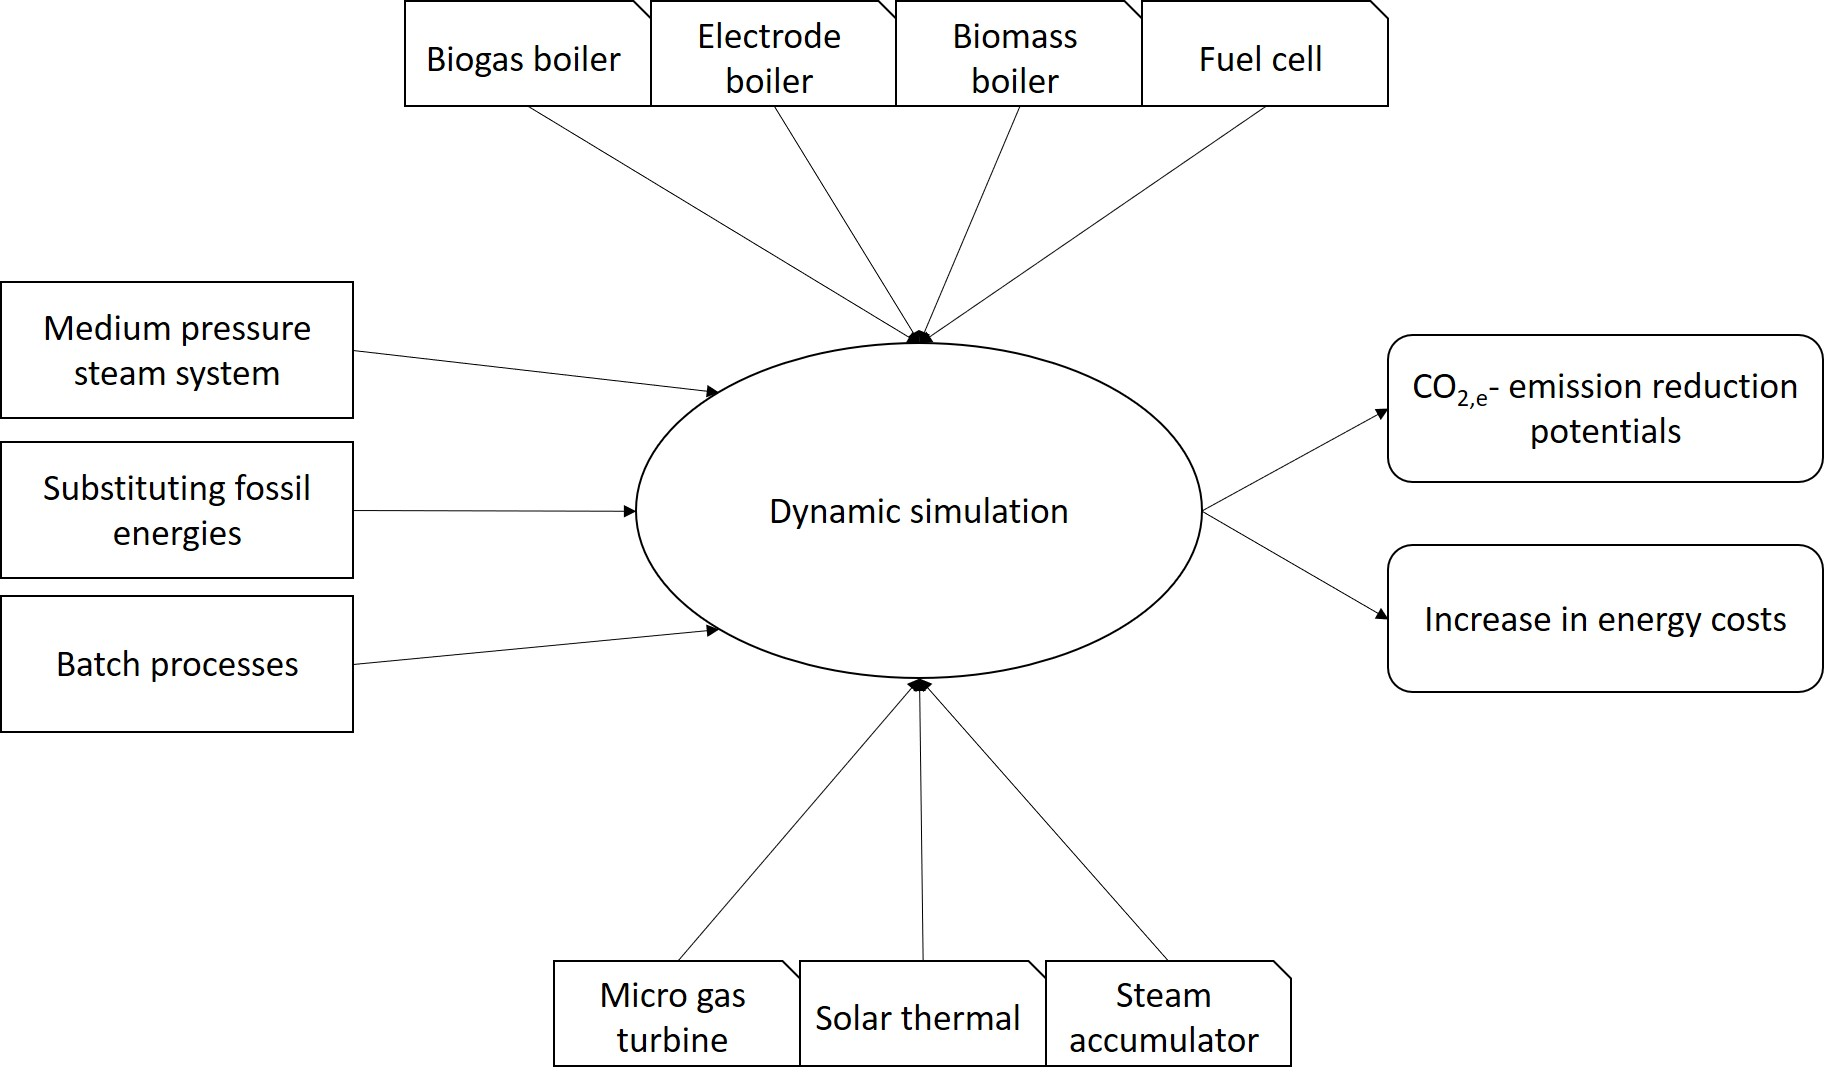
The purpose of this study is to highlight the -emission reduction potentials and related economic consequences for changing the steam supply system to renewable energies. The seven different concepts include biomethane-fuelled solid oxide fuel cells (FC), biomass-fuelled boilers (BMB), biogas (BGB) or biomethane-fuelled boilers, micro gas turbines (MGT), EB, solar energy systems (SES) and HP are evaluated for their different implementation options in combination with load management measures, including a steam accumulator. In addition, the concepts are optimized in terms of the costs per saved emissions per annum.
2. Description of Technologies
In this section the technical functionality of seven different technologies for substituting the fossil fuel fired steam boilers are briefly described and an overview of the technical and economical data is given. Peculiarities for the integration into a steam system with fluctuating steam demand are explained and the models for the simulation study are described.
2.1. Biogas and Biomethane Boiler
Steam is often used in industry as a heat transfer medium. In order to be able to provide steam safely and continuously, a complex plant structure consisting of burner, boiler, water treatment, condensate treatment and pumps is required, mostly economisers and, if necessary, other thermal apparatuses with the respective control technology are necessary [
26]. The efficiency of a steam system depends on numerous factors due to its complexity. The main factors contributing to the reduction in efficiency are flue gas losses through the chimney, desalination and blow down losses during regeneration of the boiler water, radiation losses over the boiler surface and ventilation losses when starting the burner [
27]. The part load efficiency of natural gas and Biogas and Biomethane Boiler (BGB) varies between 94% and 95% with an economiser. For substituting natural gas, biomethane or biogas can be used for firing the boilers. In case of biogas a specific burner is necessary. Biogas must be used at the place of production or in the immediate vicinity. Biomethane, on the other hand, is fed into the public gas grid. Biomethane is produced by upgrading biogas. In a number of process steps all components other than methane are separated from the gas mixture. Before being fed into the gas grid, further steps can be taken to achieve local feed-in requirements [
28]. If biogas is not available, the switch to biomethane offers a convenient option for users of natural gas to reduce
emissions regardless of the place of production of the biomethane. For this purpose the quantity of gas or energy withdrawn must be measured and balanced by the feed-in of biomethane into the grid.
2.2. Electrode Boiler
Electrode Boiler (EB) convert electrical energy into thermal energy through electrical resistance heating. In conventional EB metallic heating elements are heated, in the EB water is electrified to heat or vaporize it [
29]. The electrodes are immersed in a triangular arrangement in weakly conductive water. The immersion depth of the electrodes into the water and thus the power of the boiler is regulated by a pump. EB can react very quickly and precisely to load changes. Starting from the “keep-warm” operation the maximum power is reached within seconds. The power range is variable and there is no minimum load. EB convert electrical energy into thermal energy with an efficiency of over 99%. Exhaust and ventilation losses omitted, there are only radiation losses [
30].
According to Gruber et al. (2015), the substitution of conventional, fuel-based heat supply by electric boilers up to temperatures of 240 °C is relatively easy to implement [
31]. That indicates a large technical potential for electricity generation and flexibility of heat in the industrial sector.
2.3. Solid Biomass-Fuelled Boiler
For providing steam by solid biomass, it is burned in a modern BMB. The heat, generated in the combustion chamber, is transferred to water via a heat exchanger and evaporated accordingly. The amount of steam to be produced is regulated by the amount of fuel supplied. If the amount is reduced or increased, there is a delay in the supply of steam. Although a reduction in the steam demand results in a lower fuel supply, the remaining fuel in the combustion chamber is still used and provides steam to the system. With an increase of the steam, more biomass is fed into the combustion chamber, which ignites with a delay due to the increased quantity [
32]. With these plants a wide range of performance can be covered, whereby strict regulations exist in Germany and plants larger than 1000 kW are subject to legal approval [
33]. These legal requirements are caused by the emission of nitrogen oxides and ashes, among other things, whereby large plants must be equipped with special exhaust gas purification filters. Besides, the amount of occurring pollutants depends on the choice of biomass and the moisture content of the fuel [
34].
It exists a variety of biomass energy sources, from which wood pellets and chips are most widely used. These are characterised by their good storage properties and their relatively high energy content (5.21 kWh/m³). Irrespective of the energy source, a continuously operated system requires both a corresponding storage area and a supply chain for the fuel. Due to the low energy content of the biomass fuels, a large amount of fuel is required, depending on the plant design. The fuel demand of the BMB
depends on the steam demand
for the boiler and the part load efficiency
of the operating state of the boiler. This is presented by Equation (
1).
2.4. Fuel Cell
The number of newly installed Fuel Cells (FCs) has been rising steadily for several years. Although the number of FC in use is still relatively low compared to conventional energy generators, the constant research and development of the cells, for example in the automotive industry, contributes to the constant growth. Since the use of FC does not lead to combustion or gasification, the emissions are limited to a minimum. In addition, FC are usually operated as a combined heat and power (CHP) plant [
32]. They provide both waste heat and electricity. Disadvantages are the very high investment costs and the short service life [
35]. Depending on the electrolyte used, five different FC types can be distinguished: Alkaline Fuel Cell (AFC), Polymer Electrolyte Fuel Cell (PEFC), Phosphoric Acic Fuel Cell (PAFC), Molten Carbonate Fuel Cell (MCFC) and Solid Oxide Fuel Cell (SOFC). The electrolyte has an influence on the operating temperatures, efficiencies and the costs of the fuel cell. For example, the operating temperature of a PEFC is approx. 65–85 °C, while an SOFC is operated at approx. 700–1000 °C and MCFC at approx. 600–700 °C. Accordingly, only the MCFC and SOFC are suitable for the steam supply. In this paper a SOFC is used. It has good prerequisites for steam production due to its high temperatures and efficiencies. The amount of heat generated depends on the area of use and density of the cell, which varies depending on the operating point of the cell. Simplified, this represents the so-called heat-to-power ratio (HTPR), which describes the ratio of the electrical energy produced to the thermal energy [
36]. In the SOFC in particular, biomethane/- gas is usable. Biomethane/-gas contains small amounts of hydrogen, hydrogen sulphide and other trace gases. These pollutants contained in the gas can damage both the components of the FC and normal engines and turbines. Therefore, it is necessary to pretreat the gas. For high-temperature FC, the removal of the sulphur compounds is sufficient. Typical processes for desulphurisation include fermenters, bioscrubbers and activated carbon filters. In addition to desulphurisation and processing, it is necessary for most FC types to reform the gas before use. This means that the methane is converted into hydrogen. For a SOFC, this process is not necessary because the reforming can take place within the cell. The fuel demand of the FC
depends on the steam demand
for FC and the part load efficiency
(Equation (
2)). The electricity provided by the FC
is defined by HTPR and the thermal power of the FC
(Equation (
3)).
The simulation model is based on measurement data retrieved from an energy monitoring system. In addition, the simulation scenarios are designed for a constant load and the FC system is not exposed to fluctuations and behavioural changes. The created FC model is limited to the output data of a FC, which are defined and influenced by the heat-to-power ratio, the electrical and thermal efficiency as well as the reaction, heat and start up times.
2.5. Micro Gas Turbine
Micro Gas Turbines (MGTs) are compact power-heat-coupling systems with a small power range. MGT as a CHP technology are expressly suitable for the use of alternative fuels, such as low calorific gases like biogas [
37]. A comprehensive description of the technology with a focus on the possible applications in small and medium-sized companies is found in Lucas et al. (2004) emphasizing the suitability for providing steam, heating thermal oil and drying [
38].
MGTs are highly suitable for joint use with steam boilers since the heat contained in the turbine exhaust gas can be used directly in the boiler’s burner due to the high oxygen content. This enables very high waste heat utilisation rates of up to 97%. To increase the overall power capacity and flexibility, several MGTs can be combined.
As cogeneration plants, MGTs provide the two co-products electrical energy and heat. If the fuel input is to be assigned to the individual products, for example to split costs and
, different allocation methods are available. This paper uses the Finnish method. The reference efficiency for separate generation of heat using gaseous fuels (biogas or biomethane) for steam production is
= 0.87, for electrical energy
= 0.53 [
39].
The fuel demand of the MGT
depends on the steam demand
for MGT and the part load efficiency
(Equation (
4)). The electricity provided by the MGT
is defined by HTPR and the thermal power of the MGT
(Equation (
5)).
2.6. Solar Thermal Systems
The Linear Fresnel Reflector (LFR) technology is based on an array of linear mirror strips that concentrate the solar rays coming from the sun onto a linear fixed receiver. The advantage of this technology is the construction of large absorber tubes. Secondary reflectors are mounted above the receiver to reflect the solar irradiation that does not impact directly on it from the primary reflectors. This fact can considerably increase the optical efficiency of the system.
The concentrated radiation reaching the receiver tube heats the liquid circulating through it and converts the solar radiation into useful heat. Water or thermal oil is used as the working fluid. Furthermore, a selective coating layer is applied to the absorber tube to improve solar absorption. LFRs can effectively generate heat at temperatures between 50–400 °C. [
40].
Collectors are manufactured by bending a reflective sheet material into a parabolic shape. In operation, the receiver tube moves at the same time as the parabolic collector due to a solar-tracking system. Besides, its surface is covered with a selective coating with high absorbance for solar radiation but low emittance for thermal radiation losses.
Parabolic Trough Collectors (PTC) are widely used in process heat application in the industry and it is also the most mature technology for Heliostat Field Collectors to generate heat for processes or solar thermal electricity generation. The PTCs reach high temperatures up to 400 °C with better efficiency than LFRs [
40]. To improve efficiency of the process, a thermal oil with good properties is used instead of water as the working medium. A glass cover tube around the receiver tube reduces the convective heat loss from the receiver. Besides, the space between the glass cover and the receiver tube can be evacuated to achieve lower convective heat losses. However, small transmittance losses occur when the reflected light pass through the glass to reach the absorber.
The operating costs are determined as follows, depending on size and investment [
41]:
LFR small-sized (100 m2) = 5% of capital investment
LFR large-sized (15,000 m2) = 4% of capital investment
PTC small-sized (100 m2) = 5% of capital investment
PTC large-sized (15,000 m2) = 4% of capital investment
Both solar thermal systems require a steam accumulator and provide steam for the baseload.
2.7. Heat Pump
The operating principle of HP is based on the supply of high temperature heat to a heat sink thanks to the heat supplied by a low temperature source combined with mechanical work performed by a compressor. The sum of the heat supplied by the source plus the mechanical work of the compressor is the useful thermal heat obtained.
Currently commercial high temperature heat pumps can reach sink temperatures of at least 90 °C up to 165 °C with heating capacities ranging between 20 kW and 20 MW. The heat source temperatures range between 20–65 °C from brine, water or waste heat [
42].
Because of the limited maximum temperature of 165 °C a closed cycle for a heat pump system is technically not possible for the sterilisation process of pet food which is analysed in the following case study. In food processing plants, there is an opportunity to take advantage of a large amount of water with still a high energy potential from waste heat that is available after cooling the processes. This water is stored in a reservoir at about 70–80 °C. To take advantage of this potential, a steam recovery system with a multi-stage of 8 blowers for the open cycle simulation has been designed. Commercial industrial heat pumps can achieve coefficients of performance (COP) ranging between 2 and 6.
2.8. Steam Accumulator
It is fundamental to consider the implementation of a steam accumulator for BMB, biomethane—fuelled FC, SES and HP due to the difference between the steam demand of the process and the steam supply. When the production is higher than the demand, the steam accumulator is charged, increasing the pressure inside while at the same time part of the steam condenses. When the steam accumulator is discharged due to a deficit of steam production, the pressure inside decreases and part of the water evaporates. Hence, the pressure level of the steam accumulator defines the load-level of the storage. To estimate the behaviour of the steam accumulator, the equilibrium model of Stevanovic et al. [
43] is chosen (Equation (
6)). Even, a more complex and detailed non equilibrium model is available, Biglia et al. [
44] proposed the utilisation of the equilibrium model. Depending on the mass and energy balance of the steam accumulator, the pressure change and the pressure
p inside of the vessel with a constant Volume
V can be calculated. The mass balance
and the energy balance
for liquid and vapourous considers the system boundaries as evaporation enthalpy
is also considered to depicture the evaporation and condensation inside of the accumulator. With the specific volume the saturated liquid
and vapourous
state, the total mass
M is calculated.
The steam accumulator is operated within a maximum pressure of 13 bar and a minimum pressure of 9 bar. A pressure difference of 4 bar is utilized. This pressure difference has a significant influence on the storage capacity of the steam accumulator. For the simulation runs, different storage vessel volumes should therefore be considered.
2.9. Summary of Technical and Economical Data
The following two
Table 1 and
Table 2 give an overview of the technical and economical data of the different technologies. The described parameters are the basis for the technical and economical analyses of substituting a steam system with natural gas fired boilers. The two tables include more technologies than analysed in the upcoming case study. For this reason the compared technologies are marked bold in the tables.
3. Methods
This section presents the methods and concepts for analysing the steam production costs and -emission reduction potentials via a dynamic simulation for one year. First, the different integration concepts for the technologies are described, followed by a description of dynamic simulation. The last section describes the basics of the economic analyses.
3.1. Steam Utility Concepts
Since the seven different technologies have different technical restrictions in terms of availability of steam supply and start up time, different concepts of implementation have been analysed. Except the BGB and the EB, all technologies only provide base load steam which therefore requires an additional peak load boiler for the fluctuating steam demand. In addition, the MGT and FC provide electrical energy as a byproduct. This electrical energy is first used to meet the plant’s electrical energy demand and only excess energy is sold at the stock market.
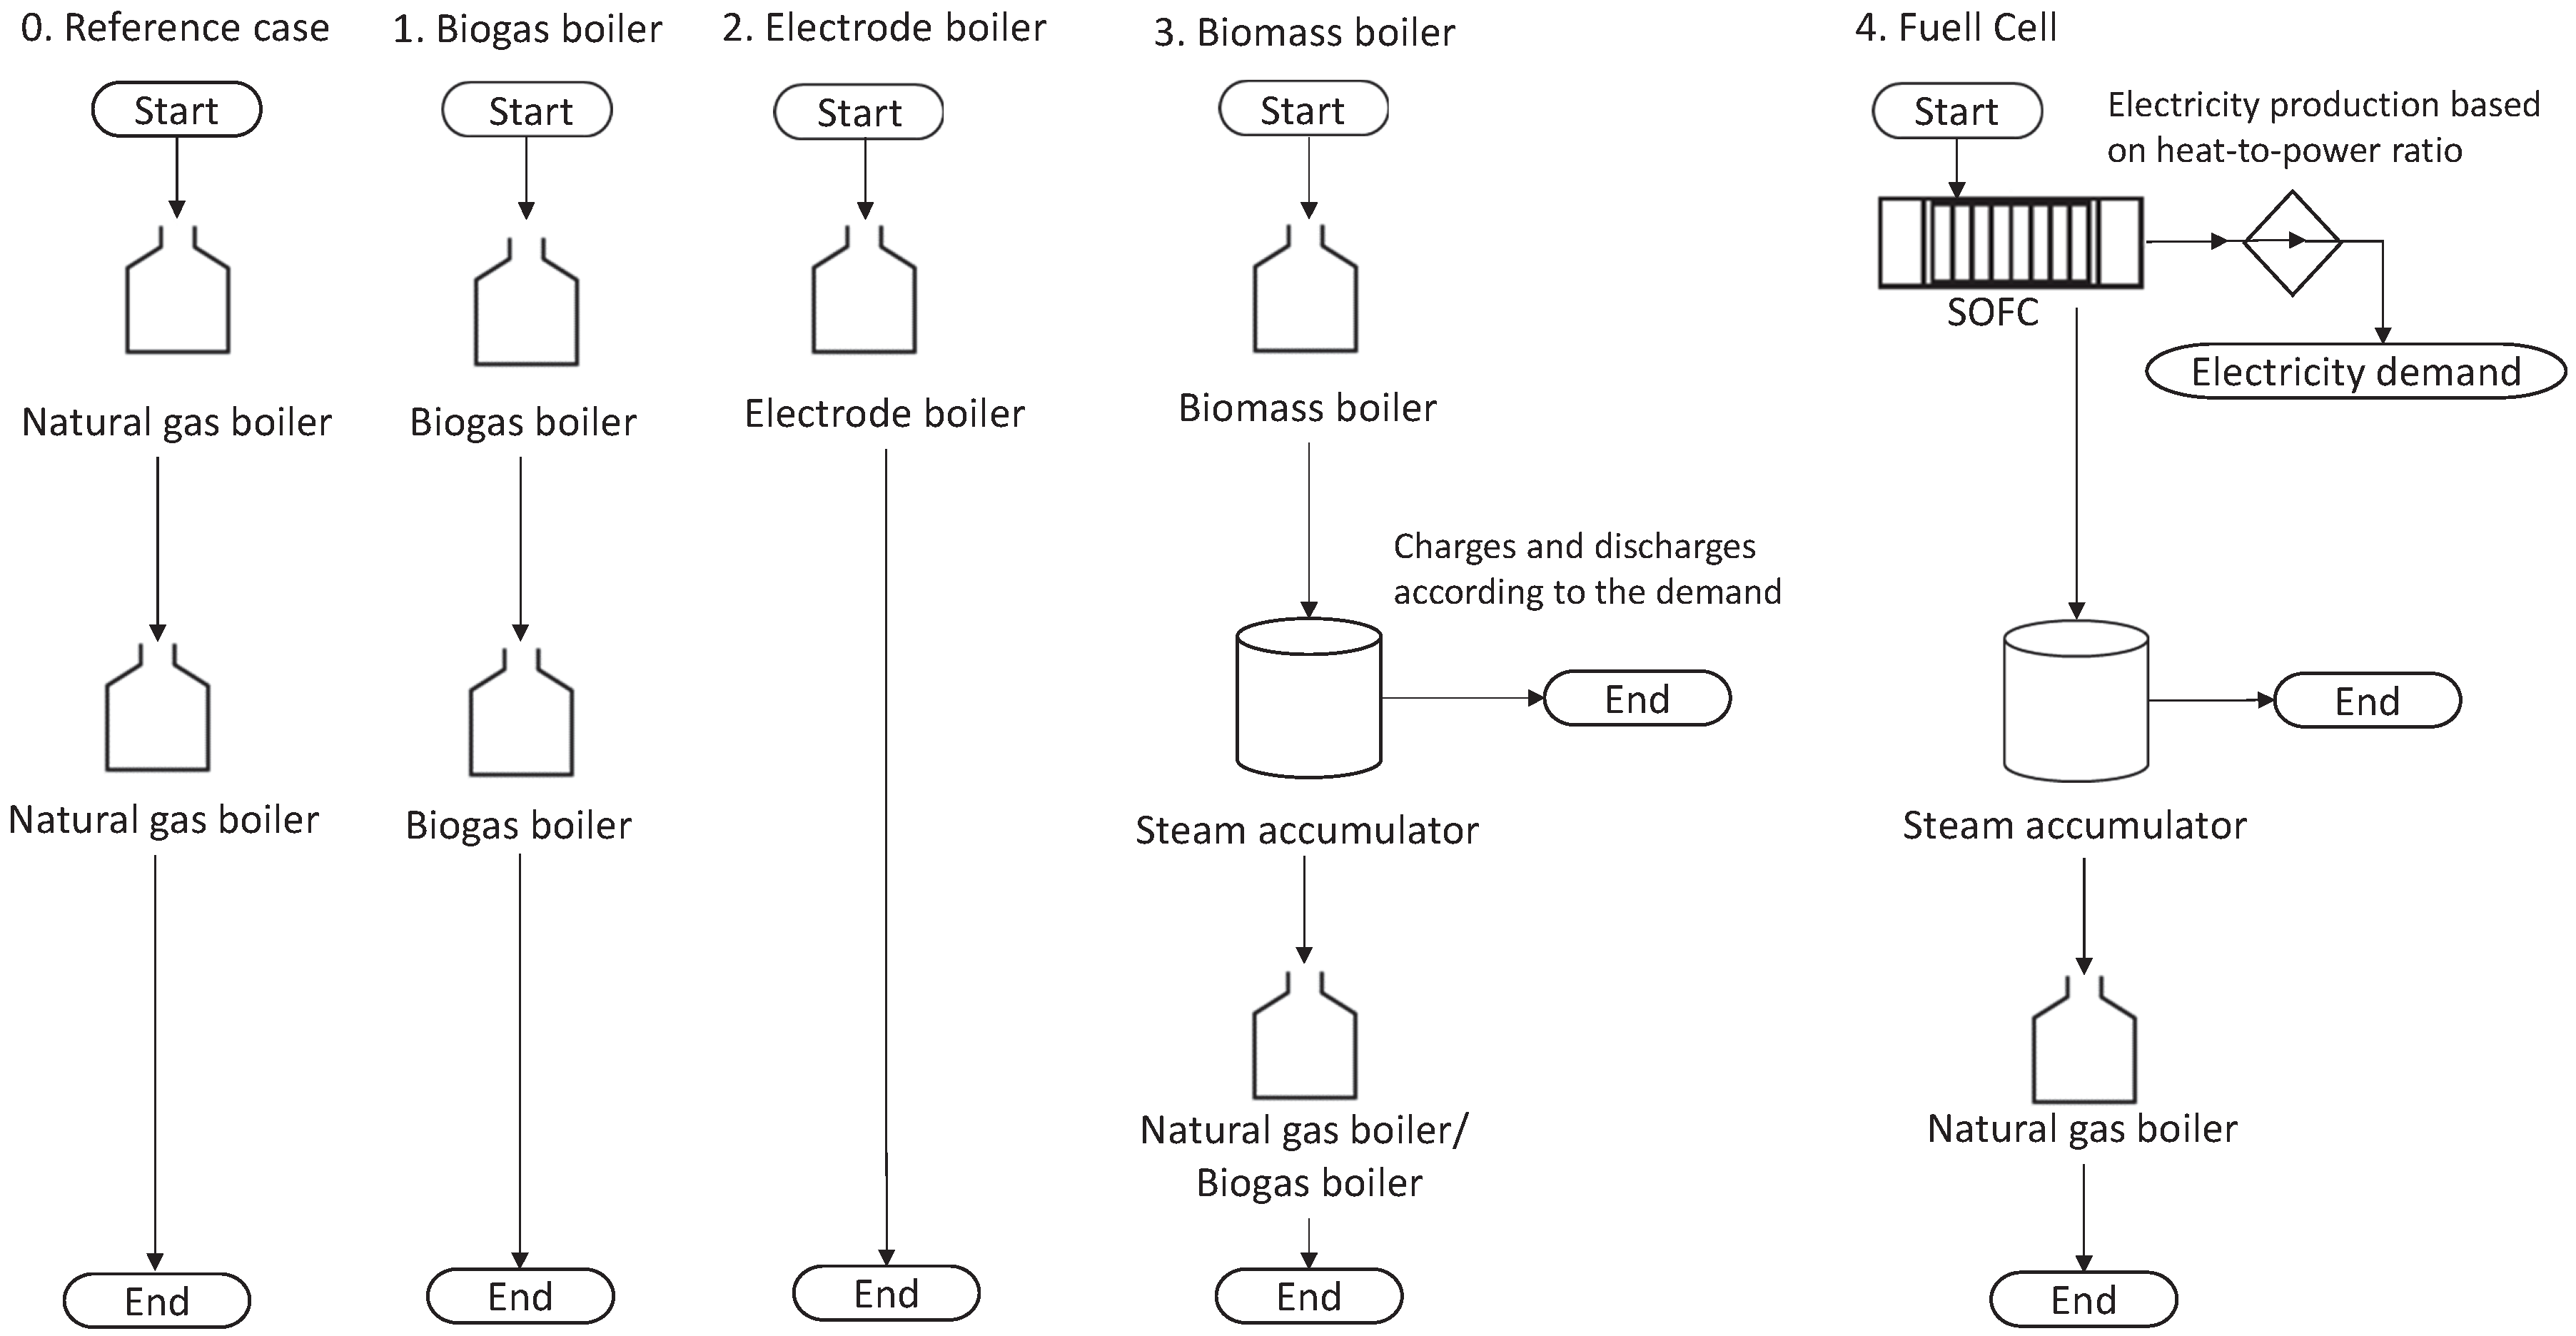
Figure 1 gives an overview of the set up of the reference case and first four concepts and subconcepts which are compared to the
-emission reduction potentials and related economic consequences for changing the steam generation from fossil to renewable energy.
The first concept is split into two subconcepts. Subconcept 1.1 replaces the two natural gas boilers with two BGB by changing the burner of the existing boilers. Subconcept 1.2 uses biomethane instead of natural gas. In the second concept one EB replaces both natural gas boilers due to the quick reaction times of the EB a back up is not necessary. Both, subconcepts 3.1 and 3.2, integrate a BMB into an existing utility system. In subconcept 3.1 a natural gas boiler is used as a backup boiler and in 3.2 a BGB is used accordingly. The fourth concept uses a biomethane-fuelled FC for the baseload and a natural gas boiler as a backup boiler.
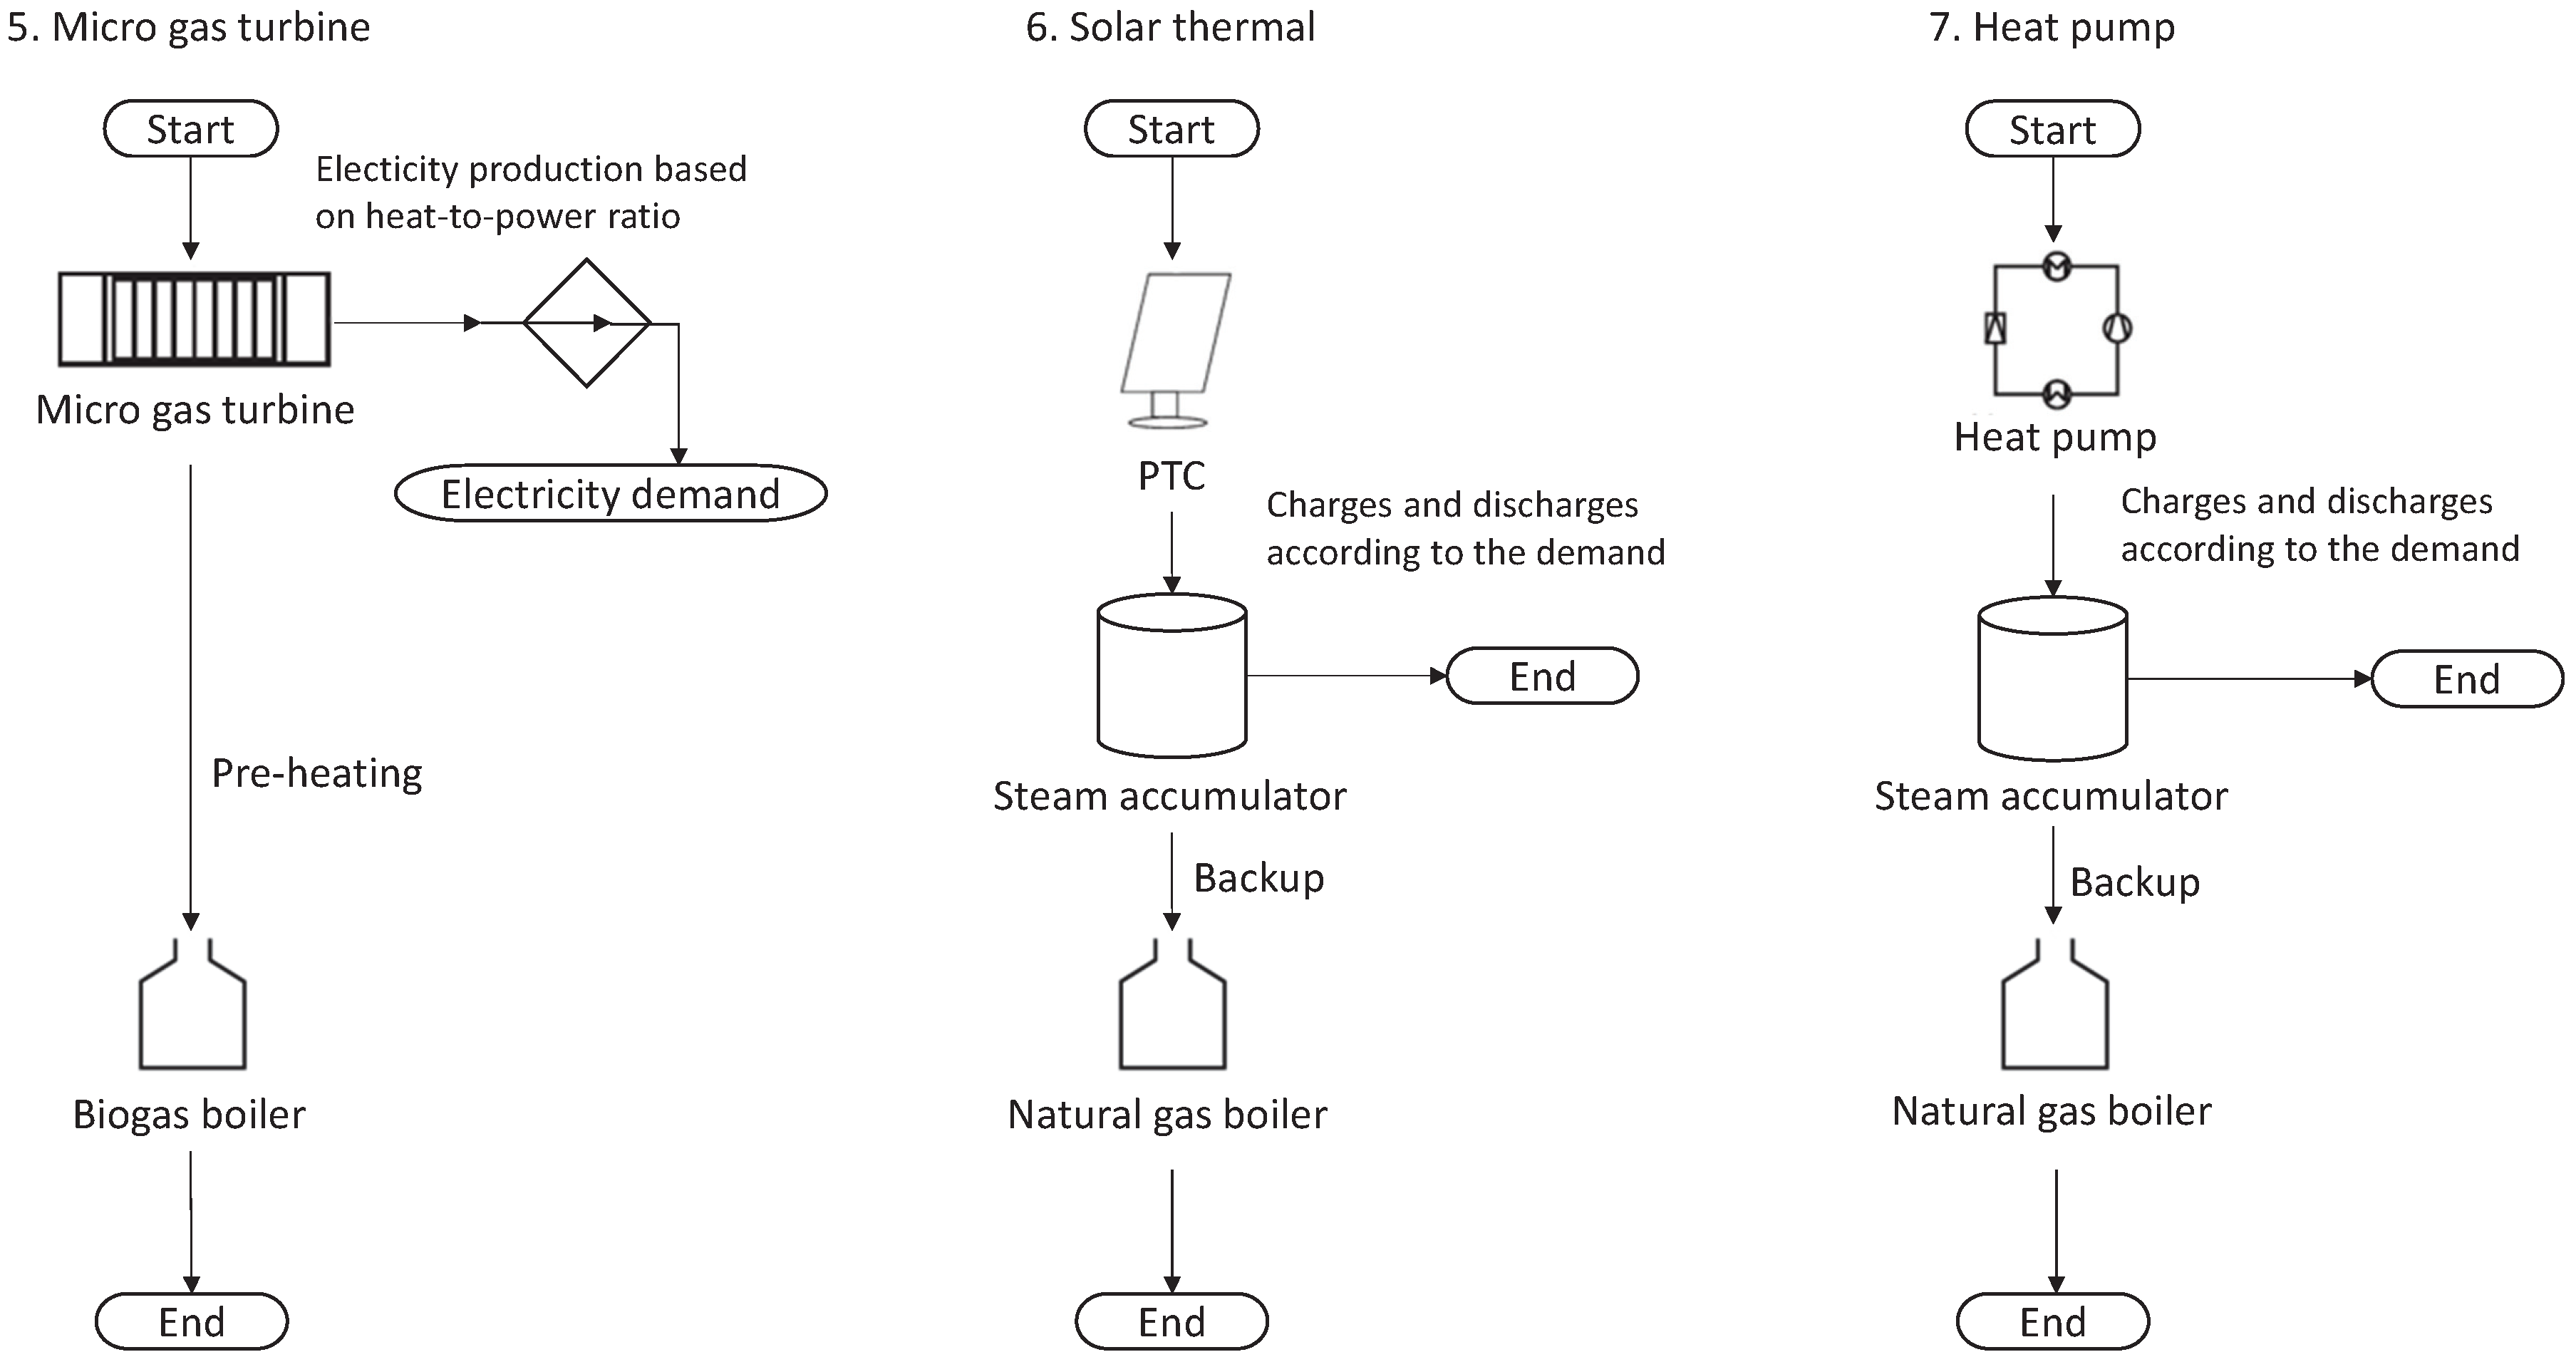
Figure 2 shows the concepts 5, 6 and 7 in order to substitute the two natural gas boilers.
In fifth concept, the MGT is used to pre-heat the combustion air of a BGB and the produced electricity is sold to the market. The PTC and HP are integrated as baseload technologies which charge the steam accumulator. Both, PTC and HP, use a natural gas boiler for backup and peak loads.
3.2. Simulation
A dynamic annual simulation in Matlab/Simulink [
57] is used to determine the effects of the volatile steam demand profile on energy demand and costs. The modelling is based on the energy balance of the system, whereby for the technologies the part load efficiency in each operating state and the thermal inertia must be determined. The technical characteristics of the models are described in
Section 2. The Runge-Kutta method with a variable step size is used to solve the energy balance. In the energy model, the main utility and the backup boiler are connected in series, each with an internal storage component. The stored energy is calculated from the masses of water and steam and the respective enthalpies at the given pressure. To determine energy demand, costs and
, the operating point of the utility is determined at the current output. On the basis of the operating point, the efficiency is determined, which leads to the energy demand for the thermal output. The absolute costs and
-emissions are calculated using the current values of the energy carrier demand and the related costs and
-emissions. Energy losses and restrictions in the start up time or part-load performance of the different utility systems are considered in the modelling.
Due to the strongly fluctuating demand profile of the considered application, the steam storage size is optimised. The accumulator is dimensioned based on the average maximum overload and the maximum overload. These measures aim at offsetting all surplus and overload intervals by analysing all recorded intervals for one year. For all concepts including a steam accumulator, it is charged if there is a surplus of produced steam and the pressure in the storage is below 13 bar. It is discharged, if the produced steam of steam supply utility is less than the demand and the pressure in the storage is higher than 9 bar. In case the total produced steam by both one steam utility and the accumulator is less than the demand, the backup boiler supports.
For the electricity provided by the FC or MGT, both a cost-oriented and an emission-oriented variant are investigated. For this purpose, the costs and emissions of the generated electricity are allocated via the Finish Method. These values are compared to the current market values. Whether the electrical energy generated is used for own consumption or sold and fed into the grid depends on the aforementioned trade-off between minimising emissions or costs. The corresponding process type of electricity generation results in accounting effects for the recorded -emissions as well as economic effects for sale and purchase of electricity.
3.3. Economical Analyses
Due to varying investment costs depending on supplier and client, several offers for the described technologies were obtained to determine the costs for the case study and the mean value was chosen for further consideration. The investment costs include all associated costs as well as set-up and commissioning cost. For the annual costs of the investment the straight-line depreciation for a period of 15 years for the boiler and 10 for all other technologies and the steam accumulator is applied. The annual costs for the technologies
are the sum of depreciation costs
, the fuel costs for biomass
, natural gas
, biogas
, biomethane
and electricity
. Equation (
7) shows an example for calculating the costs for the concept with the biomass boiler. All technologies without electricity generation are calculated accordingly.
The electricity generation costs for the FC
and the MGT
are added to the annual costs and the earnings from the usage of the generated electricity or selling
it to the grid are subtracted from the annual costs (Equation (
8)).
4. Use Case Wet Pet Food
In this section the production process of wet pet food is introduced and the basic condition for the case study are presented.
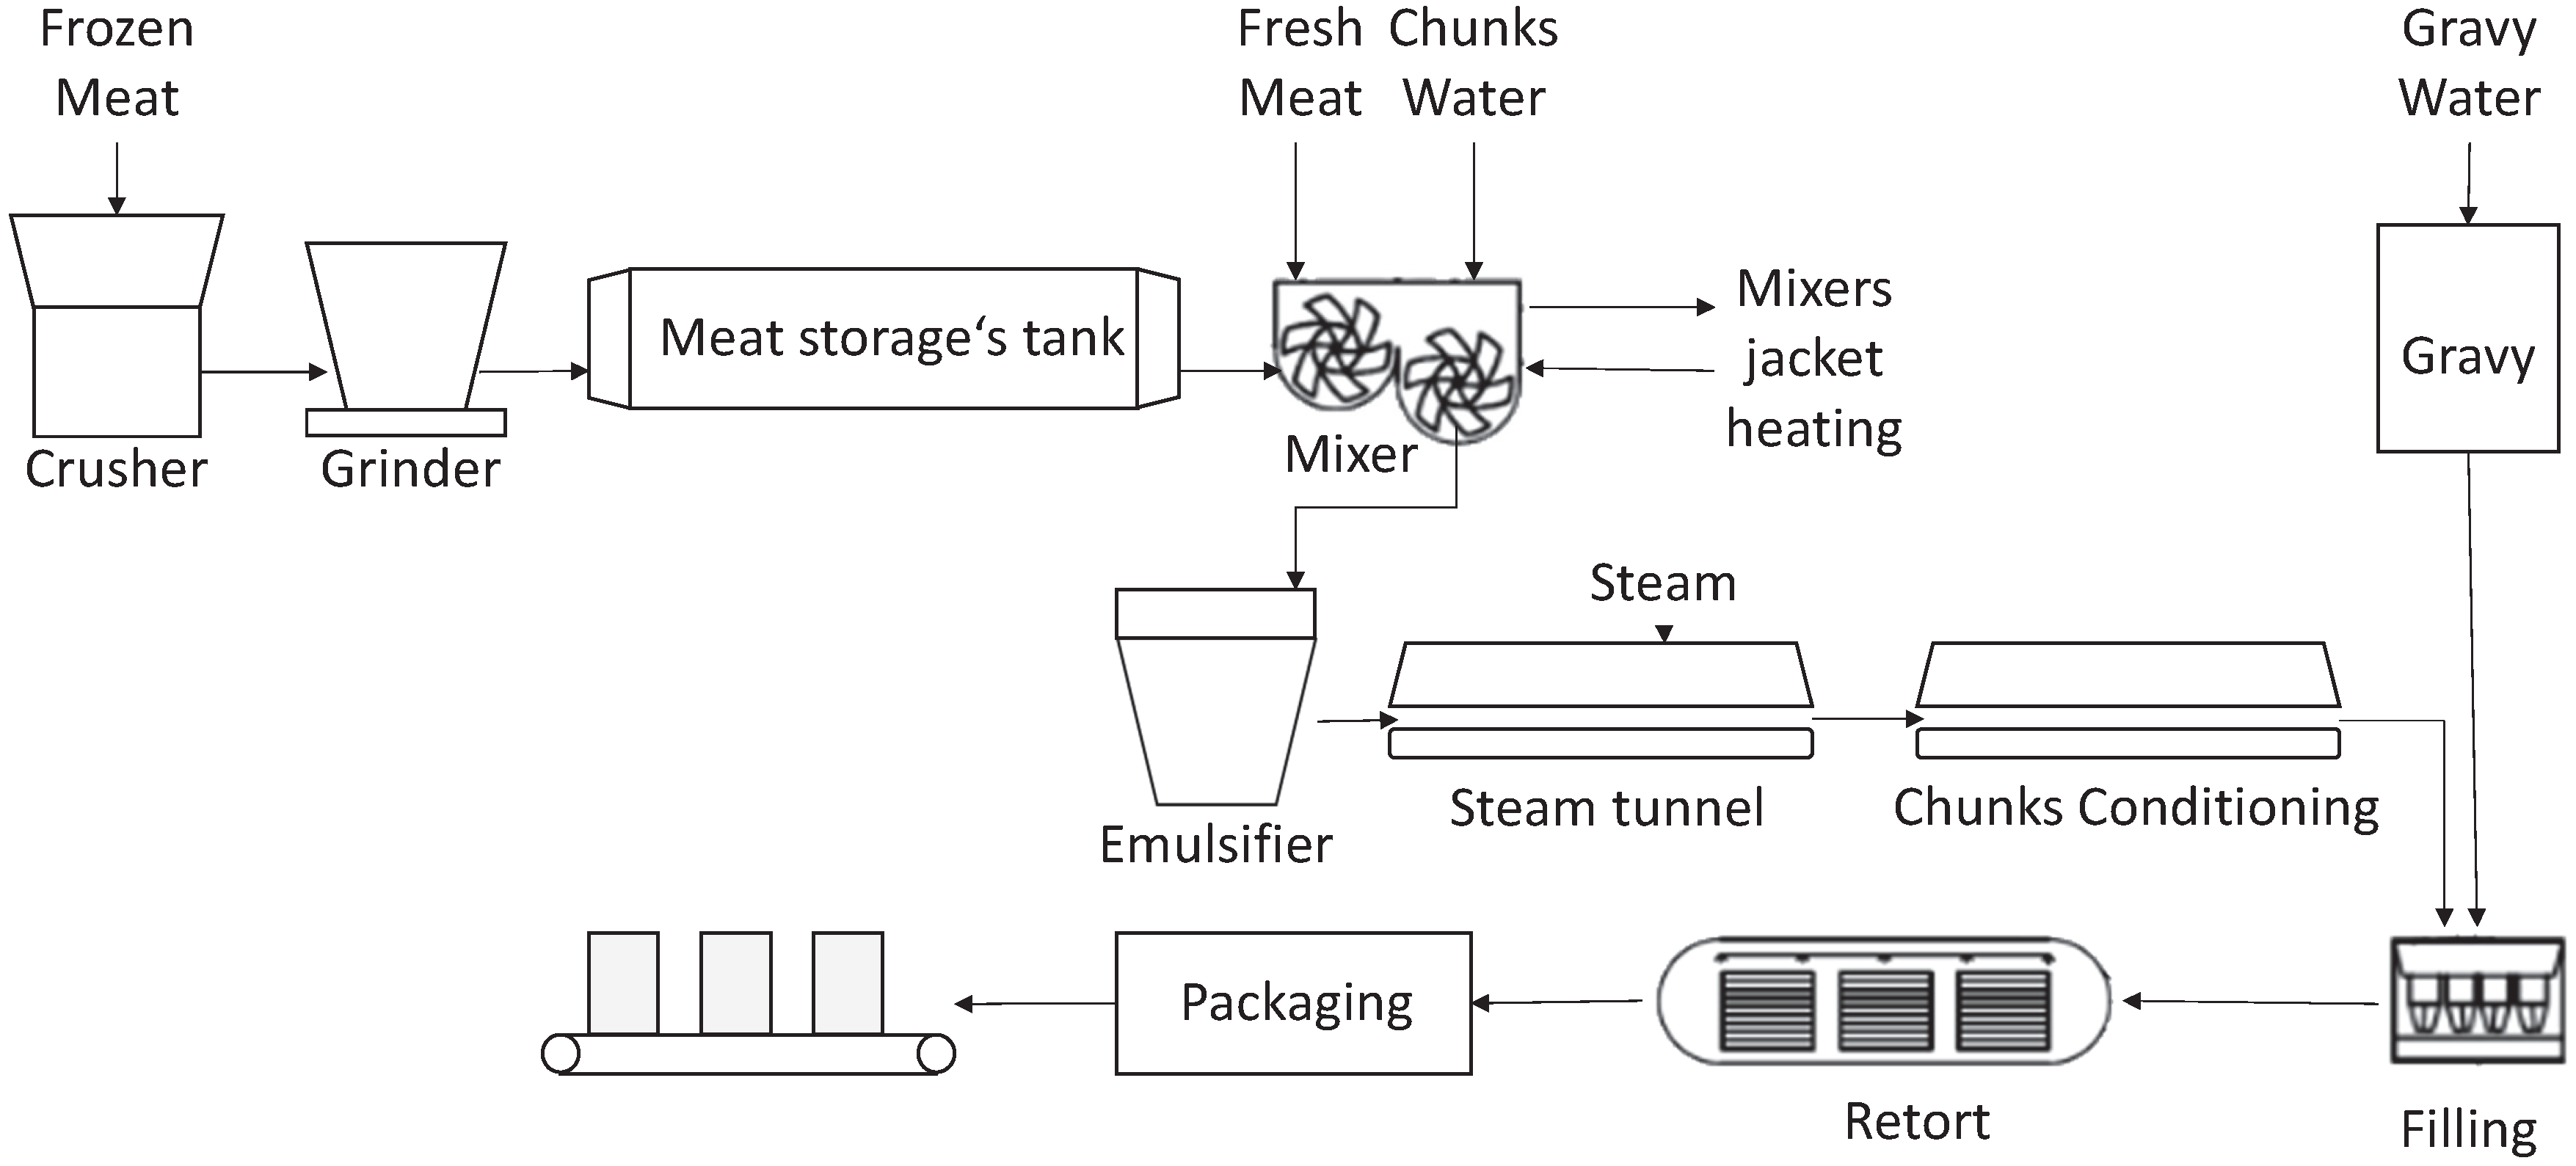
Figure 3 shows the process flow diagram for wet pet food.
The frozen meat is first crushed and then processed in the grinder to a homogeneous mass. In the mixer, fresh meat and water are added. The mixing process requires thermal energy at a temperature level between 65 and 80 °C. The water-meat mixture is then emulsified and cooked in the steam tunnel and then cooled. Together with the gravy water, the mixture is filled into pouches and then sterilized in the retorts. The process concludes with the packaging of the pouches in boxes and cartons. Over 60% of the steam is used for the sterilisation process, while 6–8% are needed for the steam tunnels at 3 bar. Around 18% are required for the mixing, cleaning, hot water and other processes. The rest are losses and demands for pre-heating the fresh boiler water. Depending on the level of heat recovery and the set up of the production plant these values may differ.
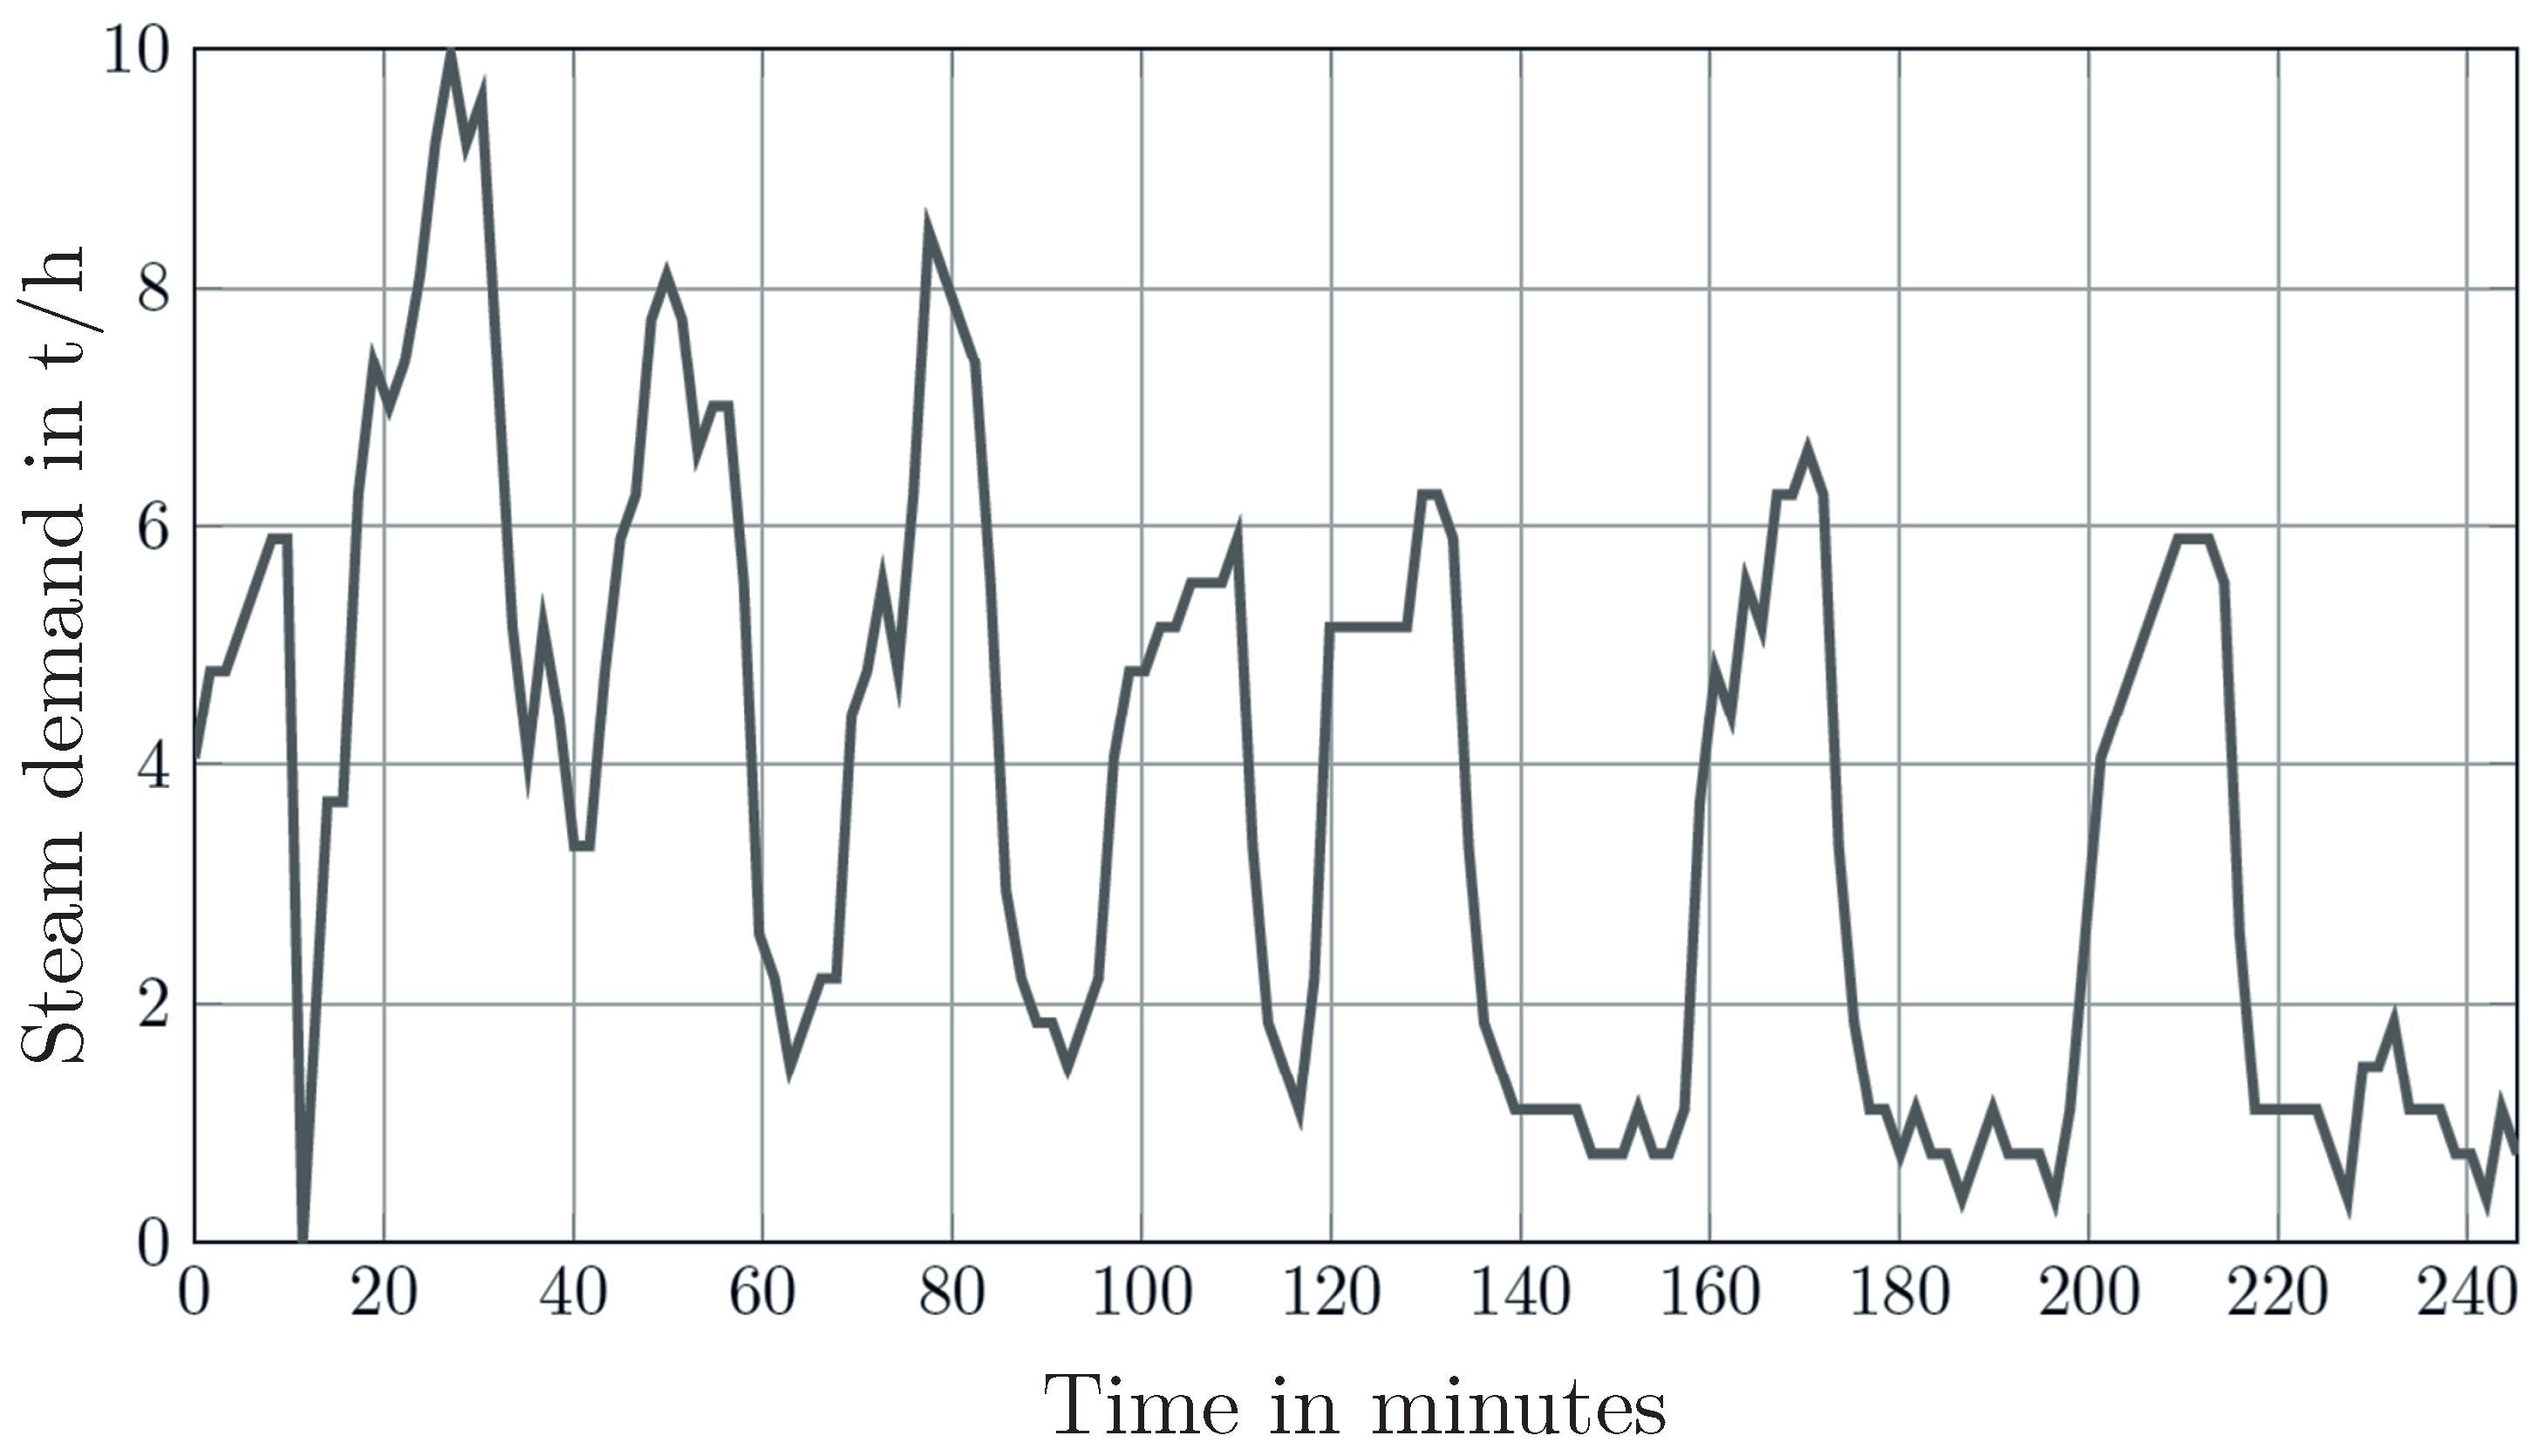
In the following, the process data of a wet pet food processing plant located in Spain is used within a simulation study to analyse different integration concepts for the presented technologies. Approximately 27,440 t of steam and 7800 MWh of electricity are required annually at this location. The steam is supplied at 9 bar and approximately 175 °C. The average steam demand is 3.1 t/h. However, the demand fluctuates between 1 t/h and 7 t/h. Higher peak demands up to 10 t/h occur rarely during the year.
Figure 4 shows an example of the steam demand for four hours. Both, the minimum of 0 t/h and the maximum mass flow of 10 t/h as well as the strong fluctuations caused by the batch operation of the sterilization process are clearly visible. The irregularity in the steam demand places high requirements on the flexibility of steam production, which not every technological alternative can meet without restrictions.
In the reference case, the steam is produced by two conventional natural gas boilers. One acts as the leading boiler and the other one is a backup boiler. When the steam demand cannot be entirely satisfied by the leading boiler and its storage, the backup boiler supplies the rest. For the comparison of the different technologies the dimensions of power and steam accumulator has been optimised in a previous step.
Table 3 shows the thermal and electrical energy demands, the corresponding energy costs and the
emission for the described reference case.
For the calculation of the operating costs, the natural gas price varies between 0.027 €/kWh and 0.031 €/kWh. These natural gas prices were retrieved from the annual bill of the industrial site. For the case study, the prices are assumed to be fixed—biomass 0.028 €/kWh [
54], biogas 0.0644 €/kWh and biomethane 0.095 €/kWh. For self-used electricity and sold electricity the Spanish stock market price [
58] of 2017 in each time step is considered. The chosen values for emissions of natural gas are 241 g/kWh, of biomass 27 g/kWh [
55], biogas 135 g/kWh [
59], biomethane 146 g/kWh [
59] and the emission for electricity are based on the grid electricity mix in each time step. This value varies between 90.13 g/kWh and 486.49 g/kWh [
60]. For year 2017, the Spanish electricity mix is divided as follows—hydro 6.89%, wind 17.88%, solar photovoltaic 3.14%, other renewables 3.68%, nuclear 20.73%, combined cycle 13.84%, coal 16.81%, cogeneration 10.53%, others 3.08% and cross-border exchange 3.42% [
61].
Table 4 summarises the investigated scenarios for the steam accumulator volumes, the size of the new technologies and the size of the backup boiler fired by natural gas or biogas.
5. Results
For the dynamic simulations of one year, the results show that maximal reduction of
emissions is limited to 63.75%. This maximal reduction is reached by using a BMB for base load and a BGB for peak load.
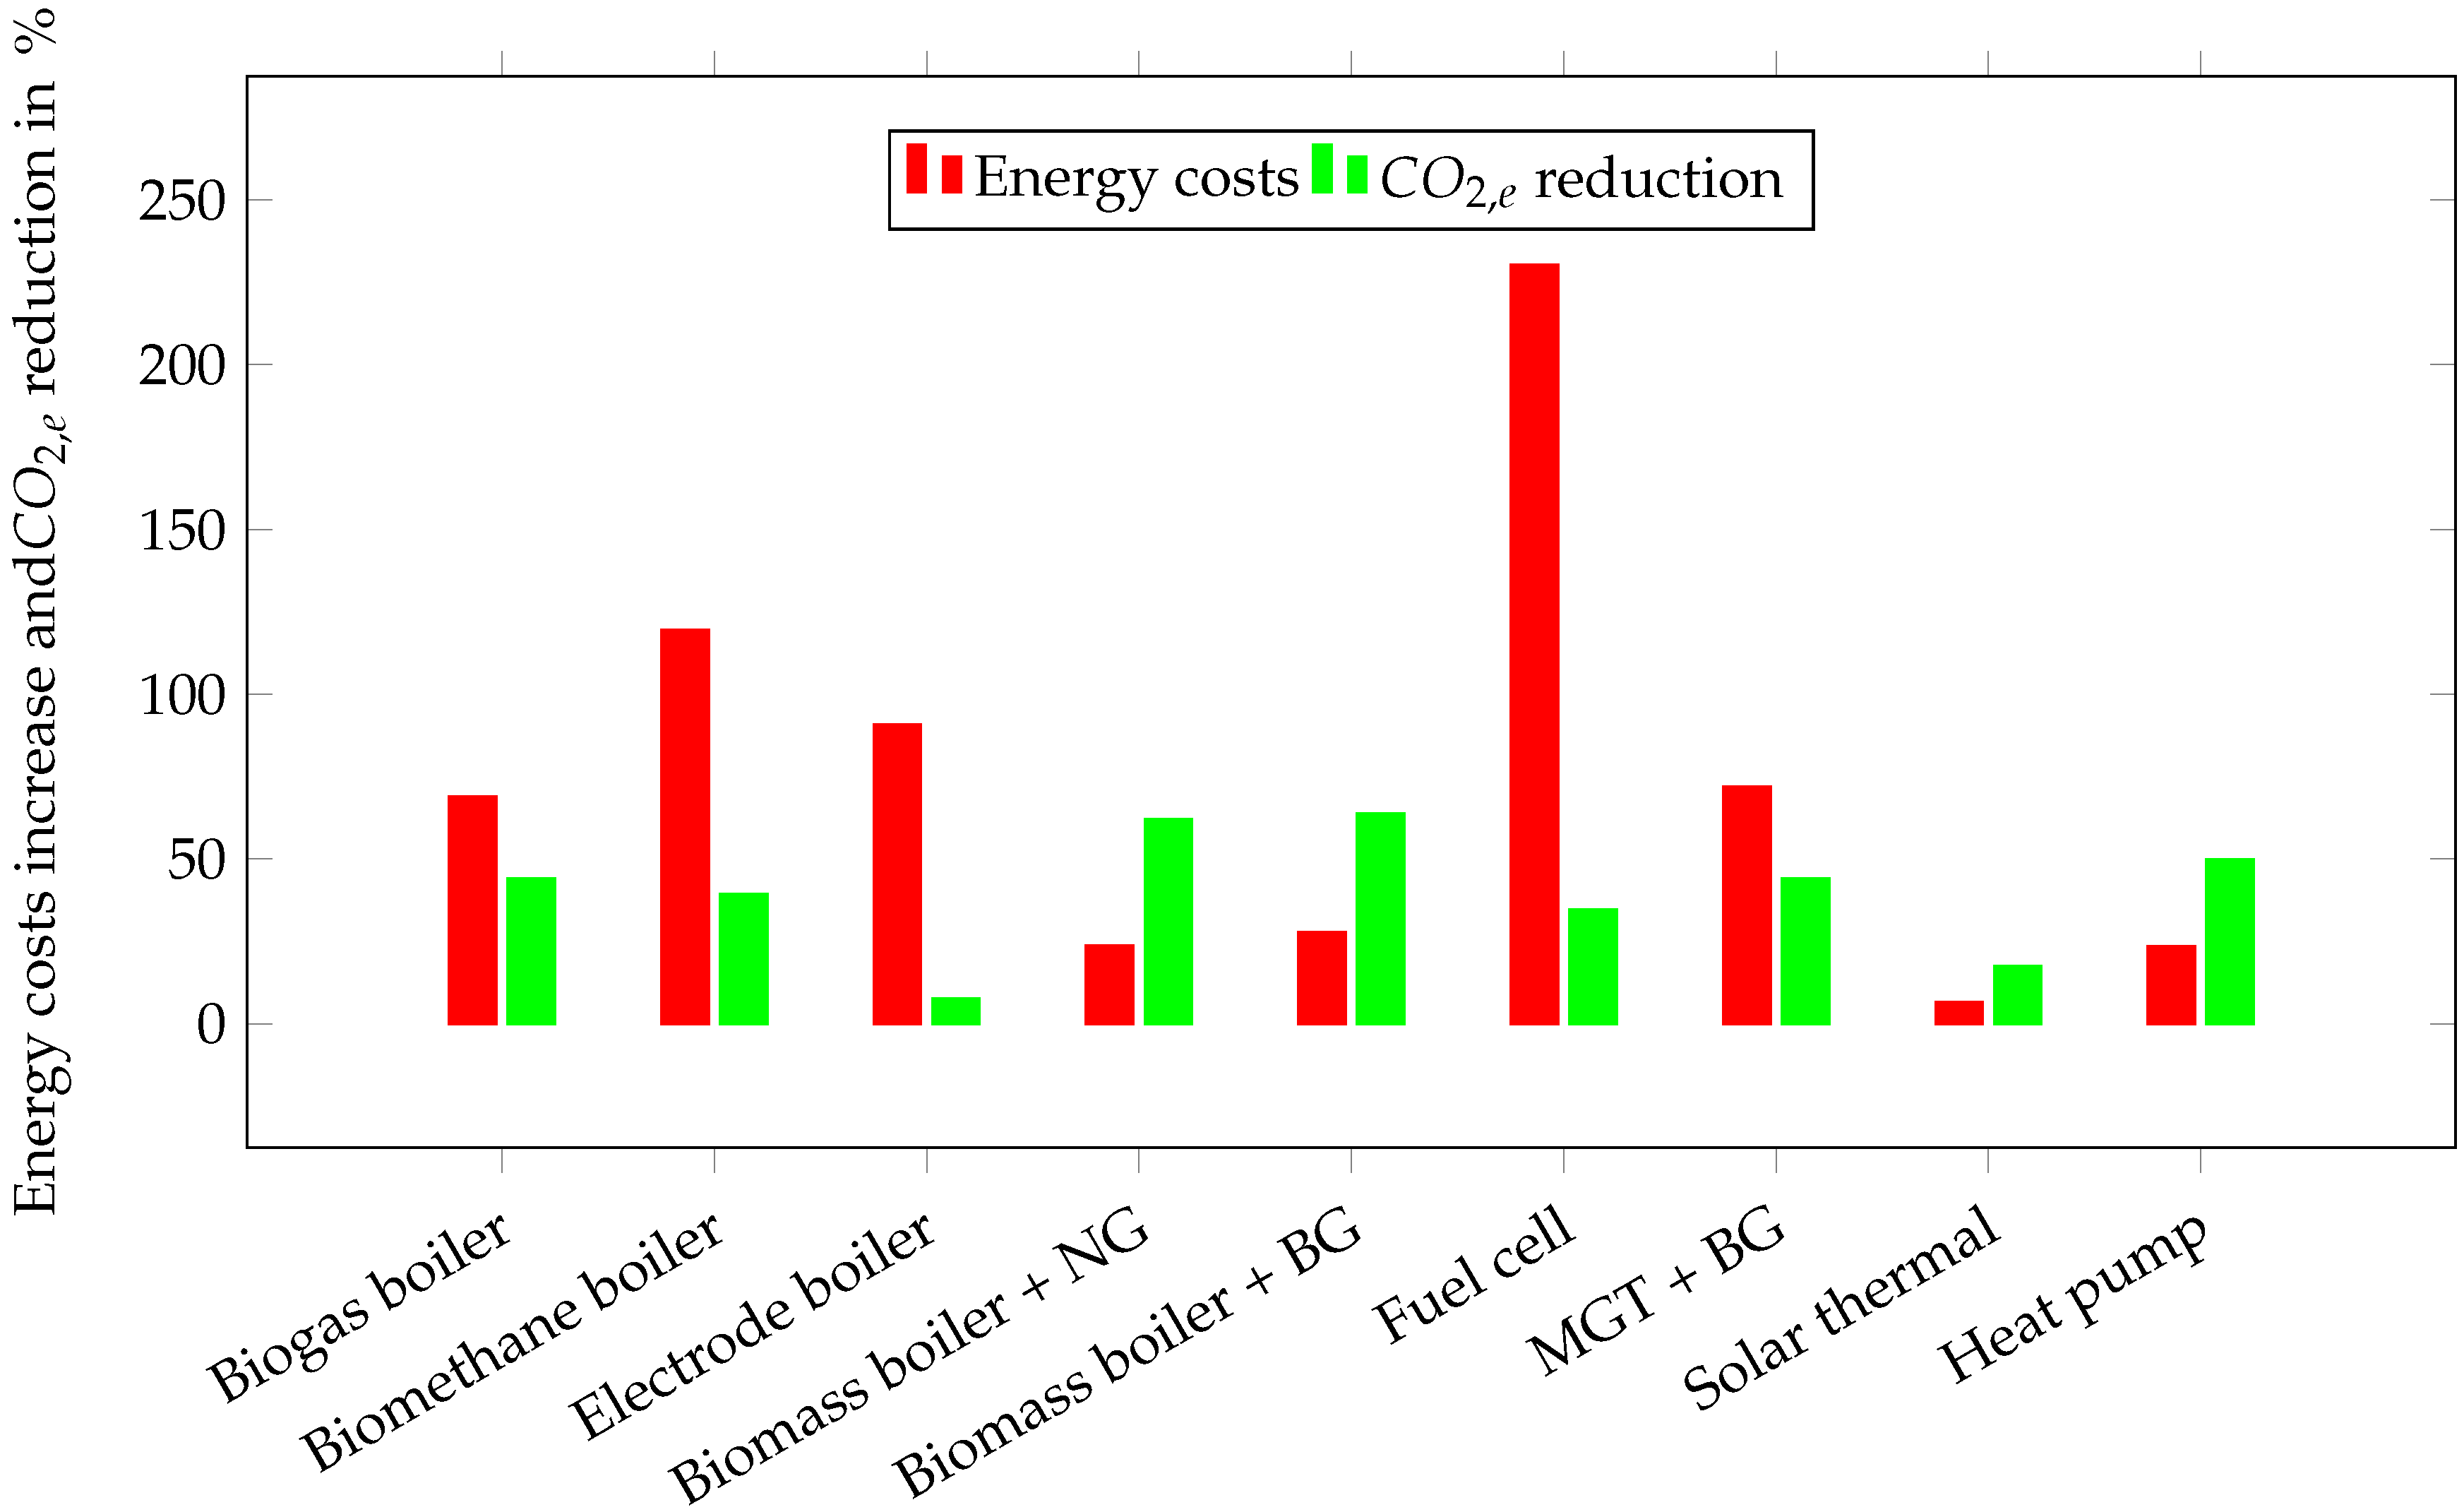
Figure 5 shows the increase of the total energy costs for the steam supply and electricity supply in comparison to the reference case for one year. In addition, the
emission reduction is visualised. The installation of PTC results in the lowest cost increase by 6.6%. Since only the depreciation and maintenance costs are determining the energy costs, the increase is very small compared to other technologies.
However, the limited availability during a day and a year leads to high running hours of the conventional backup boiler. This is the reason why the emission reduction is only 17.51%.
Both, BMB with a natural gas fired or biogas fired backup boiler take advantage of the low fixed price for biomass of 0.028 €/kWh. This results in an energy costs increase of 23.61% for the combination biomass system/conventional boiler and 27.81% for the combination with a BGB backup. Also, the emission reductions of 62.12% and 63.75% are the highest of all concepts. The low carbon footprint of biomass and the high steam supply share of the BMB explain the high emission reduction.
The use of an HP results in a similar cost increase of 23.53%. The share of the conventional backup boiler of more than 25% leads to emissions of 2612 t which results in a reduction of 49.80%.
Because of the fuel price ratio between natural gas and biogas, the retrofit to a biogas burner increases the energy costs by 68.96%. The emissions are reduced by 43.97%.
The MGT needs to be fired with biogas to reduce emissions. A reduction of 43.97% is possible with an energy cost increase of 71.9%. When operated with natural gas, the simulation shows an annual savings potential of about 33,000 €. These savings can be explained by the cheaper supply of electrical energy. However, emissions increase due to production of electricity and the low average electricity grid emissions of 267 g/kWh in Spain.
The EB has 7.71% lower emissions than the natural gas-fired boilers of the existing system, although the assumed average emissions of electrical energy per kilowatt hour are greater than those of natural gas. The savings can be explained by the higher efficiency, the elimination of switching losses and heat losses of the second boiler. These low emission savings are offset by significantly higher costs of 90.66%.
In the simulation study, the implementation of a FC has the highest increase in costs and only a emission reduction by 34.65%. High investment costs of over 6.8 million € and low thermal efficiency compared to other technologies result in very high steam production costs. Because of the limited flexibility, a secondary peak load boiler needs to provide a significant share of the overall steam demand. Therefore, the emissions reduction is limited.
The results for the forms of energy conversion show that higher energy costs do not automatically lead to the highest
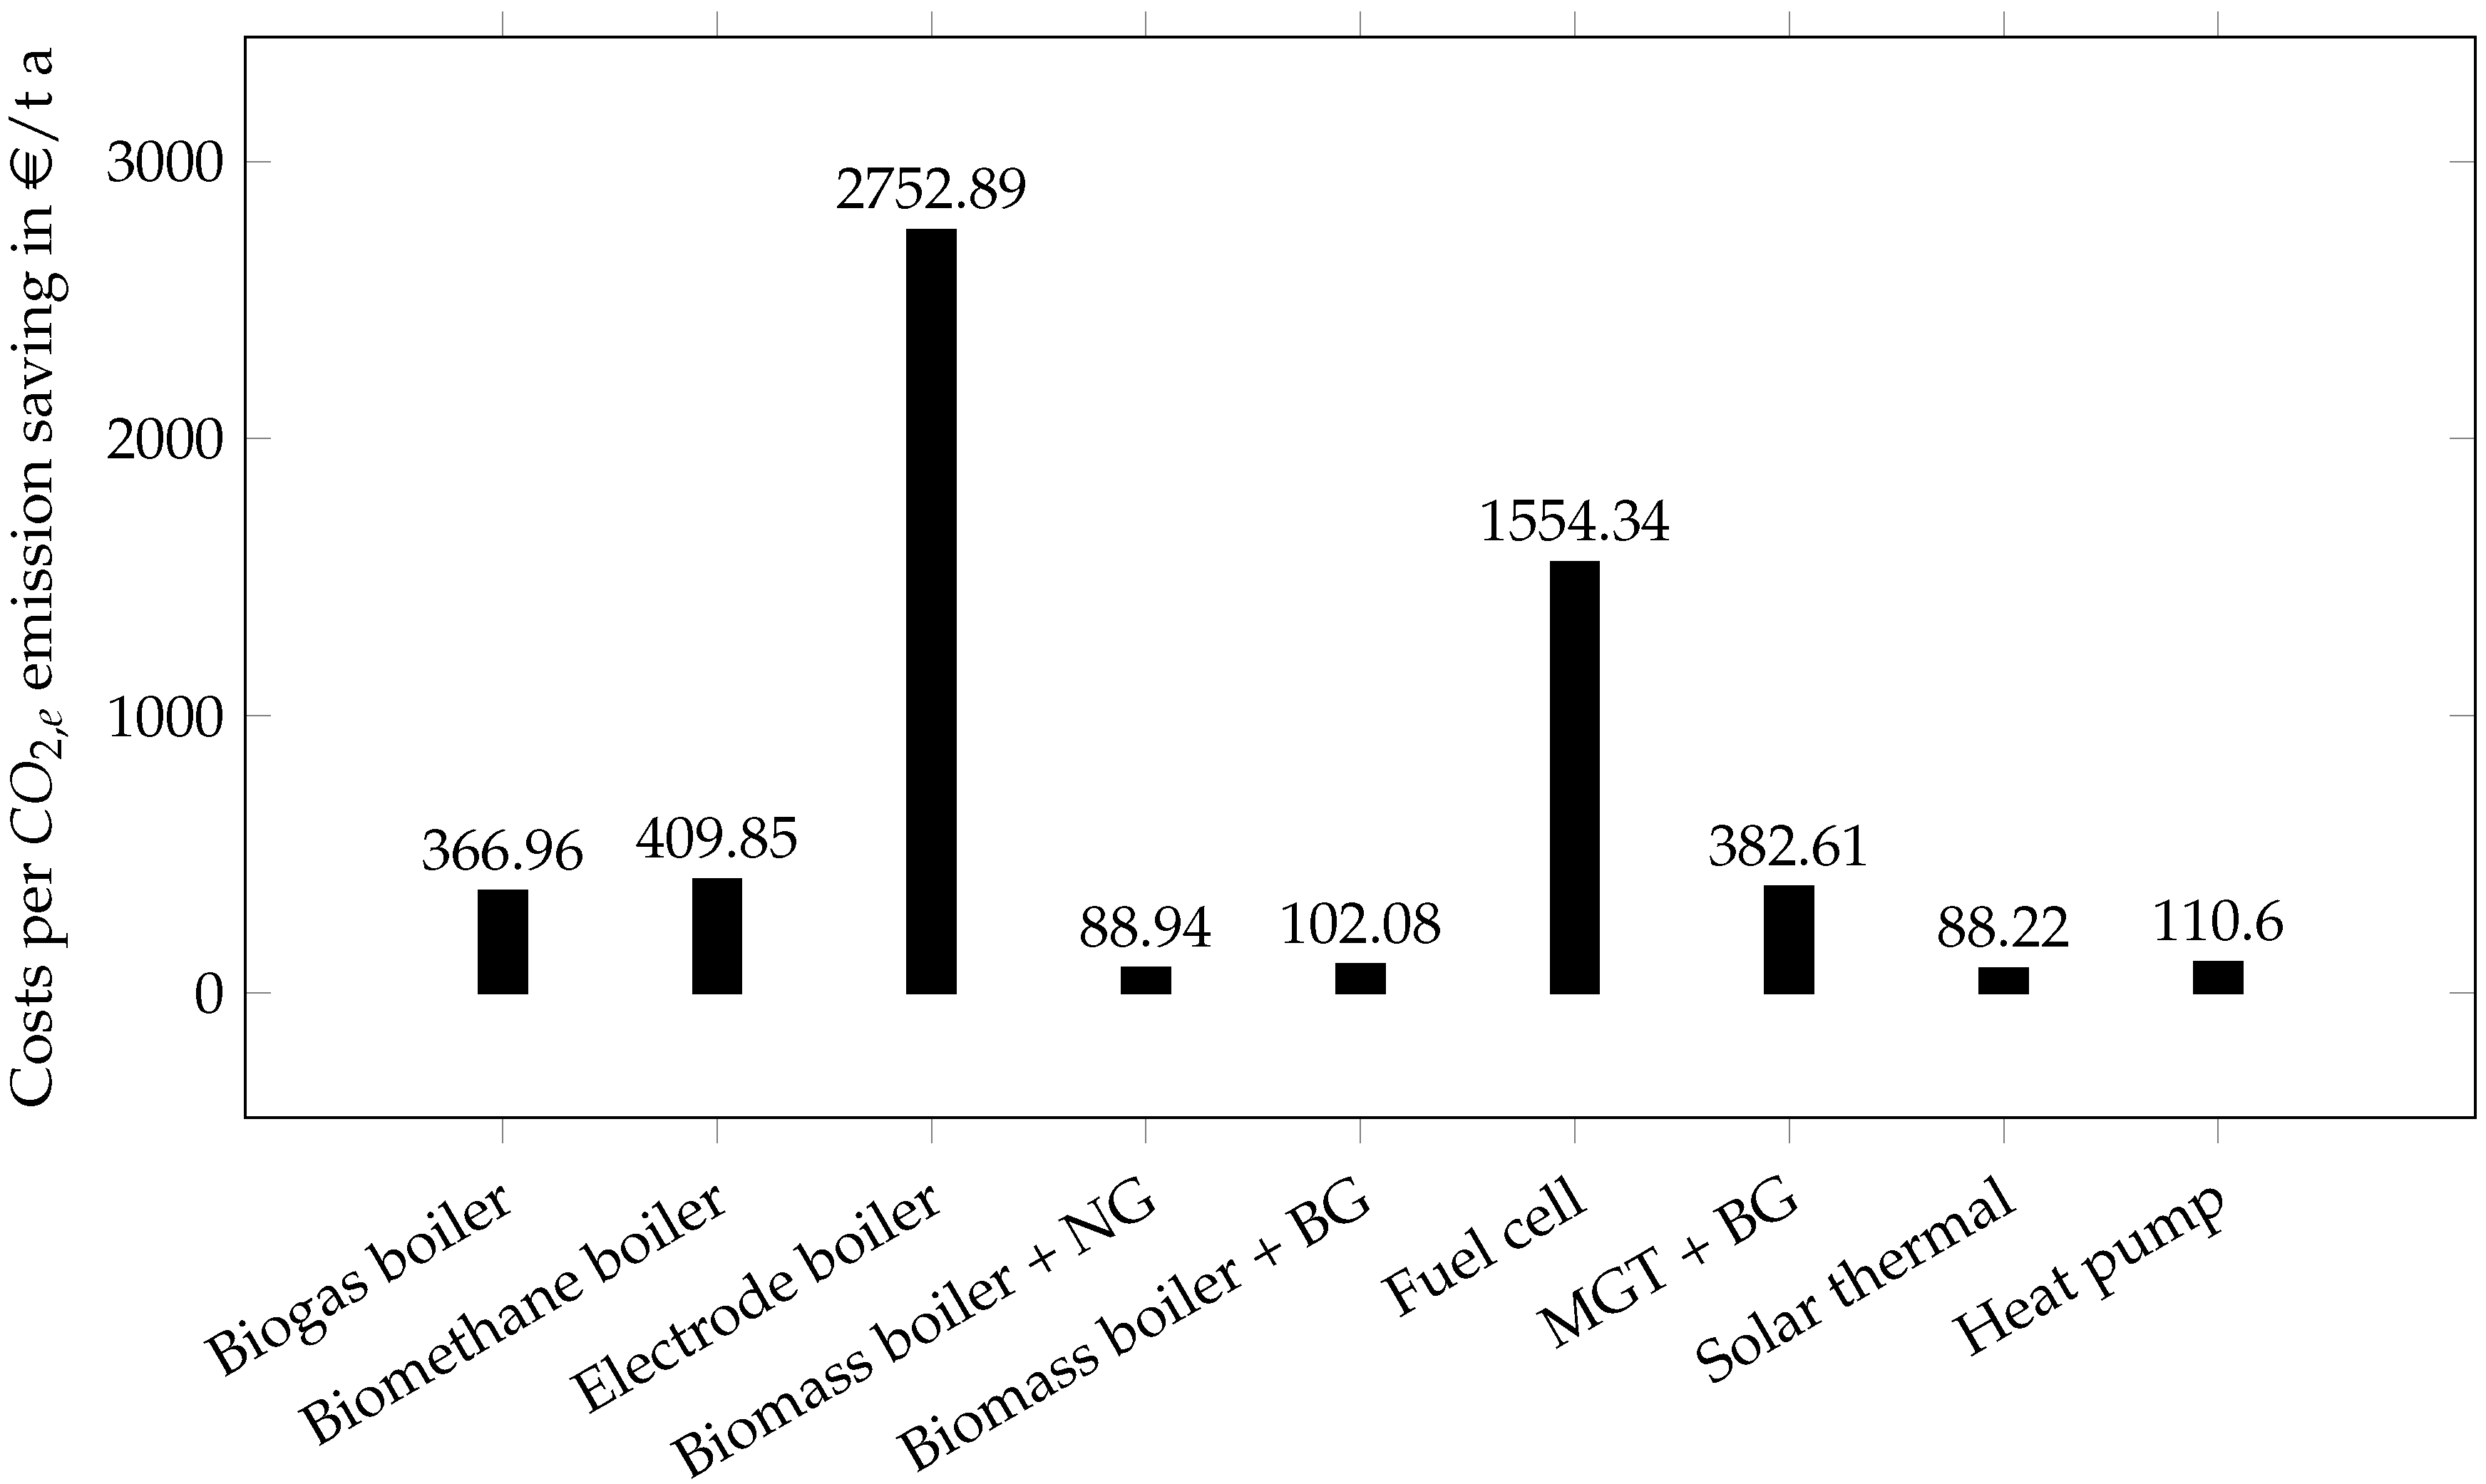
emission savings. To evaluate the best technology for the presented case study the ratio of additional costs to emission savings is essential. In
Figure 6, the costs are offset against the corresponding
emission reduction to obtain the costs per tons of
saved for one year.
The costs per saved ton of per year are between 89 € and 2753 €. According to this, the use of a BMB and PTC are the most efficient ways of providing steam in terms of economic efficiency and -emissions avoided. The installation of a EB results in the highest costs per ton -emissions avoided under the assumed circumstances of relative high electricity costs and -emissions of the electricity mix.
Table 5 summarises the costs and
emissions for all technologies and the corresponding used types of fuel.
6. Discussion
The results indicate that the BMB with natural gas or BGB have the highest emission reduction and the lowest increase in cost. Although the steam production costs of around 30 €/t are higher than those presented by Pérez-Uresti et al. [
13], the statement that biomass is the most economical alternative in 2019 is consistent. The comparison between the steam production costs of the BGB and the BMB shows that the investment costs with an assumed depreciation between 10 to 15 years have a very small impact on the steam production costs. For production plants with a high thermal energy demand the fuel prices is determining the overall steam production costs. The depreciation period should be reduced for production plants with frequently changing products and changes in thermal processes. Thus the influence of investment costs increases linearly with the reduction. However, a complete substitution of all thermal steam processes with BMB may exceed the sustainable supply. This can lead to an increase in the cost of biomass, which is not yet included in the model. For example, Börjesson et al. [
62] showed that an increasing forest fuel demand by 30–40 TWh for Sweden for the upcoming decades exceeds the potential increase in sustainable supply of logging residues.
The implementation of SES and HP results in a relatively low increase in the overall energy costs. The limited flexibility impede a complete reduction of emissions Therefore, these technologies can only be auxiliary technologies for reducing the
emissions of a steam supply system. For the SES, the high space demand for the installation of the solar field reduces the potential for a decentralised solution. For a closed cycle HP, the fluctuating steam demand and steam temperature exceed current available options in the market for industrial and high temperature HP. Furthermore, in accordance with Bühler et al. [
4] and Apargaus et al. [
42], the potential of HP for energy-efficient electrification for steam supply is estimated to be high once temperatures above 165 °C are reached. In addition, for the food processing industry the steam temperature level is not given by the process (e.g., sterilisation), which usually need temperatures below 150 °C. The temperature restrictions are set by the required quick reaction time of the control system. A process adaption focusing on lower
emissions and resulting in lower steam supply temperatures may increase the implementation potential for HP and SES.
Regarding the still relatively high emissions of EB, an increase of renewable energies in the electricity mix leads to a further reduction of
emissions as well as probably electrical energy costs reductions. There is already the option of providing and purchasing electrical energy without emissions, at least on the balance sheet, thus the compensation of the total
emissions is possible. However, to achieve the planned reduction of
emissions through electrification in the food processing industry, a significant increase in the installed capacity of renewable energies is required. As Philipp et al. [
63] showed, the timing and the share of renewable electricity in the respective country is decisive for a positive
emission reduction effect. Besides BMB, EB have the potential to reduce the emissions significantly if the electricity mix is dominated by wind power. Short start up times and a very flexible load control offer a solution in the future if electrical energy costs and electrical grid emissions are reduced.
The fuel switch to biogas or biomethane results in the lowest investment costs and implementation effort. Therefore, both concepts are very sensitive to a change in the fuel prices. For biomethane the fuel price varies between 60–95 €/MWh depending on costs for conditioning and grid. For a low fuel price level, a steam production cost reduction of 35% is possible and a boiler fired with biomethane is an easy and cost attractive option to reduce
emissions. Biogas is produced from various substrates, mainly renewable raw materials, excrements, municipal biowaste and residual materials from industry, trade and agriculture. The substrates differ in price, methane yield and the resulting related state subsidies. For this reason, producer prices and emissions of biogas can also vary strongly from plant to plant [
55]. In order to assess the economic and ecological effects, special attention must be paid to local conditions. For locally produced biogas, it is possible to achieve favourable prices and low
emissions.
For the MGT, a fuel price reduction is also necessary to be competitive with the BMB. However, CHP technologies increase the overall fuel demand significantly. The amount of available biomethane or biogas might limit integration potential of MGT and FC.
7. Conclusions
The investigations in this paper show the significant potential of reducing emissions in industrial facilities. Especially, the combination of biomass boilers and steam accumulator leads to an adequate ratio of emissions reduction and steam production costs. Due to an expected future increase in the volatility of the power supply system, the characteristics of batch processes, start-up times and partial load are of crucial importance when planning a steam supply system. In contrast to previous research work, an annual dynamic simulation model was developed which takes these characteristics as well as a variety of new technologies into account. It was applied to a practical case study which demonstrates the complex relationships of steam supply systems in batch processes.
The steam supply in industrial plant systems is defined by their steam demand load profile. The results from this work cannot be transferred directly to any other case. So, a detailed investigation of various steam demand situations should be considered to transfer this results into other concepts. Similar results are expected for other industries, that is, dairy and galvanic, with a discontinuous steam demand and steam temperatures below 175 °C. Before changing the steam supply, a substitution of the steam demand by hot water processes should be analysed. This increases the integration potential of renewable energies and leads to higher emission reductions.
Since energy cost increase and the emission reduction are strongly dependent on the demand profile, the optimum design size for each individual utility must be determined. For the detailed evaluation and analysis of the transmission of energy supply sector in accordance with load management of steam processes, it is necessary to investigate technology combinations such as electrode boilers and micro gas turbines in future research. These could bring further advantages, especially regarding load management and grid stabilisation. Due to the inertia of the biomass boiler, fuel cell, solar thermal system and heat pump, these technologies do not show any potential for grid stabilisation. Soon, concepts of the fuel cell will become more attractive. Due to the strong development and research in this area, significantly decreasing investment costs and increasing efficiencies are predicted until 2030.

 ,
, 


