Article

Toward a Low-Carbon Transport Sector in Mexico

by
Jorge M. Islas-Samperio
*,
Fabio Manzini
and
Genice K. Grande-Acosta
Instituto de Energías Renovables, Universidad Nacional Autónoma de México, Priv. Xochicalco s/n, Col. Centro, Temixco 62580, Morelos, Mexico
*
Author to whom correspondence should be addressed.
Energies 2020, 13(1), 84; https://doi.org/10.3390/en13010084
Submission received: 23 July 2019 / Revised: 6 December 2019 / Accepted: 18 December 2019 / Published: 23 December 2019
(This article belongs to the Special Issue Advances in Low Carbon Technologies and Transition)

Abstract

:
Considering that the world transport sector is the second largest contributor of global greenhouse gas (GHG) emissions due to energy use and the least decarbonized sector, it is highly recommended that all countries implement ambitious public policies to decarbonize this sector. In Mexico the transport sector generates the largest share of greenhouse gas emissions, in 2014 it contributed with 31.3% of net emissions. Two original scenarios for the Mexican transport sector, a no-policy baseline scenario (BLS) and a low carbon scenario (LCS) were constructed. In the LCS were applied 21 GHG mitigation measures, which far exceeds the proposals for reducing transport sector GHG emissions that Mexico submitted in its National Determined Contributions (NDC). As a result, the proposed LCS describes a sector transformation path characterized by structural changes in freight and passenger mobility, new motor technologies for mobility, introduction of biofuels, price signals, transportation practices and regulations, as well as urban planning strategies, which altogether achieve an accumulated reduction of 3166 MtCO2e in a 25 year period, producing a global net benefit of 240,772 MUSD and a GHG emissions’ reduction of 56% in 2035 in relation to the BLS.

Graphical Abstract

1. Introduction

On a global scale, the world transport sector generates the second largest share of GHG emissions. In 2014, this sector contributed 21% of global GHG emissions generated by energy use [1]. The rapid growth of the global transport sector’s GHG emissions has been driven by road transport, which increased by 71% between 1990 and 2016, and represented 75% of the sector’s global emissions in 2016 [2]. If this trend continues, this sector will generate 10,317 million tons of CO2e (MtCO2e) by the year 2040, which would represent a growth of 38% compared to transport GHG emissions in 2014 [3].
To know which substantive measures are being implemented currently for mitigating GHG emissions from transport sector that can help us to construct the LCS scenario, a survey of literature from national and international cases was carried out, specially selecting China, Germany, India and USA. Our search process and criteria to define the selection of these countries were the following: first, they are among the eight top world transport sector GHG emitters (see Table 1); second, their road transport sector represented more than 60% of their transport sector GHG emissions according to data available for 2010, third they have prospective studies with great ambition to reduce GHG reductions above 40% in their transport sector by year 2035 in relation to a baseline scenario or a reference year and finally, they present at least two future scenarios and five transport sector mitigation measures. Table 1 shows the four countries and the studies that were selected after applying this search process and mentioned criteria.
Consequently, this review considered the following four country studies with ambitious mitigation scenarios in the transport sector: USA [4], China [5], India [6] and Germany [7]. The proposed mitigation measures of these four studies are diverse and have high potential for reducing GHG emissions. They include traffic optimization; bus rapid transit; light urban train; railways and waterways; subways; increase of public and non-motorized transport, such as the bicycle; vehicle sales’ restriction; mode shift; efficient vehicles and trucks; plug-in electric vehicles; plug-in hybrid electric vehicles; battery electric vehicles; fuel cell electric vehicles; electric trains; hybrid buses; diesel hybrid cars; hydrogen hybrid cars; and use of ethanol and biodiesel to substitute fossil fuels.
In relation to GHG emissions from fuel combustion, in 2014 Mexico was ranked eleventh in the world, generating 1.6% of the global volume, equivalent to 422 MtCO2e, of which 78% came from two sectors: transport and energy (electricity and fossil fuels) [10]. Transport sector contributed with 31.6% followed by electricity generation with 23.1%.
In year 2013, due to concerns about the growth of criteria air pollutants generated by automobiles in Mexican big cities, which have negative effects on public health, an Official Mexican Standard (NOM in Spanish) was published NOM-163-SEMARNAT-ENER-SCFI-2013 [11], with the purpose of obliging automotive manufacturers to increase the fuel efficiency of light vehicles, thereby reducing the unit consumption of energy and, consequently, the emissions of SOx, NOx, particles, and CO2e. Public concern about the problem of the growing emissions of the Mexican transport sector has also led to various studies that include GHG emissions’ reduction in the transport sector, [12,13,14,15]. These studies consider mitigation measures, such as hybrid and electric cars; biofuels such as ethanol and biodiesel; and management measures and practices for the efficient use of energy, such as the implementation of efficiency standards, increased use of rail for freight transport, and a public bus rapid transport system. Together, these measures from these studies [12,13,14,15] have the potential to reduce CO2 emissions by the year 2030 by between 16% to 38%, which is equivalent to 48 and 131 MtCO2e of avoided emissions.
In year 2015, Mexico signed the Paris agreement, a non-mandatory commitment to comply with its national determined contributions (NDC) [16] where Mexico obliges itself to reduce its national GHG emissions by 22% in its unconditioned goal, and 36% GHG reduction in its conditioned goal (that implies greater foreign investment and technology transfer), in relation to an official baseline GHG emissions, which in year 2030 would have emissions of 762 MtCO2e; in addition to achieving a maximum emission peak in 2026. In the Mexican NDCs, the transport sector is compelled to achieve 18% reduction in GHG emissions by 2030 as an unconditioned goal, according to its official baseline GHG emissions, which represents a reduction of 48 MtCO2e.
According to the literature review on Mexican studies, the National Institute of Ecology and Climate Change (INECC by its acronym in Spanish), carried out a study in 2018 [15] analyzing 8 measures that will reduce emissions by 48 MtCO2e by 2030, to comply with the Mexican NDC commitments; nevertheless, this constitutes the least ambitious scenario among the mentioned authors. Other, more specific studies, cover only one type of measure at a national level, such as focusing on CO2 mitigation through mixing liquid biofuels as additives to fossil fuels in different proportions, either ethanol with gasoline or biodiesel with diesel [17,18,19,20]. For studies at cities level with some mitigation measures see [21,22,23].
This paper describes the construction of a very ambitious but feasible scenario to establish a low carbon transport sector in Mexico through the integration of 21 GHG mitigation measures. To shape the range of measures, both international and domestic experiences that might contribute to increasing mitigation ambition in the proposed new NDC to be reviewed in 2020 were considered. The main objective of this article was developed through the following structure: in the introduction section an overview of world transport sector was displayed, then the literature review findings and the followed steps to determine the selected transport sector prospective studies were described along with the current situation of Mexican transport sector. Then, the general methodology is described: starting from explaining how the original model was implemented using Excel spreadsheets and LEAP software, as well as a clarification of the scope of this article. Subsequently, once defined the reference year, the baseline scenario (BLS) and the alternative low carbon scenario (LCS) were constructed including input data, assumptions for both scenarios and a description of the 21 mitigation measures to the LCS were added. Next, the evolution of the vehicle fleet and the energy consumption calculation model as well as the cost benefit analysis model are described. Finally, results and conclusions are presented.

2. Mexican Transport Sector Current Situation

The energy consumption of the Mexican transport sector increased at an average annual growth rate of 4.4% between 1965–2014, consuming 2246 PJ in 2014, that represented a share of 45.9% of the country´s final energy consumption. Road transport energy consumption was 91.3% of the whole sector, air transport contributed 6% of total consumption, maritime contributed 1.3%, rail contributed 1.2%, and electric transport contributed 0.2%. In terms of fuel type, gasoline was the most consumed fuel, contributing 65% of the total transport energy, followed by diesel, at 27%, kerosene, at 6%, liquefied petroleum gas (LPG), at 1.76%, electricity, at 0.18%, and dry gas and fuel oil together at 0.06% [24]. The number of vehicles increased at an average annual growth rate (AAGR) of 5.9% between 1995–2014, totaling 38 million by the end of that period. Private vehicles accounted for 67.2% of the total, followed by cargo trucks, at 25.9%, motorcycles, at 6.0%, and passenger buses, at 0.9% according to [25]. Carbon dioxide (CO2) emissions due to road transport increased at an AAGR of 2.4% between 1990–2014, reaching 153.5 MtCO2e by the end of the period, with 71.7% of the total due to gasoline burning, 25.5% to diesel, and 2.5% to LPG. Therefore, gasoline road transport is responsible for 67% of the GHG emissions of the transport sector, with passenger vehicles contributing 38% and cargo trucks contributing 29% [10].

3. General Methodology

The following general methodology is used:
  • The year 2010 is established as the reference year, since for that year it was possible to combine all the information needed to represent the Mexican transport sector demand, especially because for this year, the road transport fleet by vehicle type and its survival curves data were available [26], which facilitated the BLS development.
  • A BLS is constructed for the period 2011–2035, in which the amount of the most consumed energy carriers, gasoline and diesel, is estimated through an evolution model of the road transport vehicle fleet. Meanwhile, for other transport fuels or energy carriers used, such as kerosene, fuel oil, electricity, natural gas, and liquefied petroleum gas (LPG), their future consumption in this sector is estimated assuming the official consumption prospective of each of these fuels [27,28]. Subsequently, the annual CO2 emissions are calculated for each of the fuels mentioned in the BLS.
  • A low carbon scenario (LCS) is constructed with the 21 mitigation measures, as will be described in the section covering the LCS construction, where the main assumptions are stated.
  • Finally, a cost-benefit analysis is carried out to determine the economic viability of the LCS scenario in relation to the BLS scenario. Table 2 shows the fuels levelized prices assumed to be representative of fuels price evolution between 2011–2035 which were incorporated into our calculations in Excel spreadsheets as constants. Last column shows fuel’s information sources. All monetary values in this study are expressed in constant year 2007 US dollars (USD).
Each phase of the methodology was simulated first in individual Excel spreadsheets, and later, energy results were exported to the Long-Range Energy Alternatives Planning System (LEAP) software [35] to obtain the aggregated energy and GHG emissions in the BLS and LCS scenarios.

3.1. Methodology Development in Excel Spreadsheets

a) Baseline scenario (BLS)
  • The vehicle stock was classified according to the following vehicle types: Light Duty Vehicles (LDV): subcompact, compact, luxury and sport cars, SUVs and light trucks all gasoline vehicles, and Heavy Freight Vehicles (HDV): freight transport and passenger buses that use diesel (see Table 3).
  • For the reference year 2010, the existing vehicle stock was structured in terms of age, type of vehicle and fuel type according to [36] to obtain the vehicle stock in the reference year in the format required by LEAP.
  • New vehicle sales specified by type of vehicle and fuel were obtained from [36], then, they were projected with an AAGR of 6% equivalent to the global rate of historical annual sales between 1995 and 2009, according to this same author.
  • It was considered that in the reference year 771,135 used vehicles were imported according to [26], an AAGR of 5% after the reference year was adopted according to [36]. It was also assumed from [26], that from total annual imported used vehicles per year, 48% were light trucks, 31% compact cars and SUVs the remaining 21%. Finally, an age composition of vehicles per year of entry was estimated (see Supplementary Material).
  • Once this is done, the corresponding vehicle survival curves shown in Figure 1 is used to calculate the stock of vehicles in each year.
  • To obtain the annual energy consumption of vehicle stock (existing, new and imported used vehicles) by vehicle type and fuel, was estimated considering the fuel economy and traveled kilometers values showed in Tables 4 and 5, according to model in Section 6.1.
b) Low carbon scenario (LCS)
  • The LCS was constructed from BLS described previously. For each of the first 17 measures described in Section 5, input data and assumptions were integrated impacting the fuel economy and traveled kilometers, and also to obtain the energy consumed for each of the mitigation measures in the analyzed period. In this simulation the number of vehicles is mostly not affected by modal changes, except in few specified cases.
  • For each of these 17 mitigation measures the incremental costs investment, maintenance and fuel (positive or negative) and cost-benefit were calculated according to the assumptions, the economic input data and the calculation model in Section 6.2, also, results were obtained in terms of stock vehicle by type and consumption by energy type.
  • In relation to the last four mitigation measures described in Section 5.1, according to [37] the consumptions by biofuel were calculated based on input data and assumptions made to replace gasoline and diesel with biofuels. Likewise, using the economic assumptions and input data from [37], the results of incremental investment, maintenance and fuel costs as well as the cost-benefit were estimated, applying the model of Section 6.2.

3.2. Methodology Development in LEAP Software

The LEAP software [35] is a bottom-up model that allows the energy supply and demand to be tied in a friendly way in trend and alternative scenarios. LEAP is also an accounting framework that allows to be fed with exogenous technical and economic data, contains also an environmental database from the IPCC. These features allow LEAP to carry out the analysis of the trend and alternative scenarios in terms of energy, economic and greenhouse gas emissions from different levels of aggregation. LEAP also allows the analysis of different mitigation measures to be represented in individual scenarios (one for each measure) and later, aggregated to represent an alternative global scenario. So, taking advantage of these features, in this article the LEAP software was used as follows:
  • The transport sector was divided into five subsectors, following the National Energy Balance [38], namely: (1) road transport, (2) air, (3) rail, (4) maritime, and (5) electric public transport (subway, trams and trolleybuses).
  • The transport sector total energy consumption in 2010 the reference year, was reproduced in LEAP from the energy consumption data of each one of the previously mentioned sub-sectors obtained from [38], so that the aggregate energy consumption of subsectors coincides with the official total energy consumption of the transport sector for that year.
  • The BLS was constructed in LEAP representing the future fuel consumption between 2011 and 2035 of each subsector, and was estimated as follows: (1) For road transport subsector, the prospective fuel consumption was estimated in Excel spreadsheets as explained in the previous section and whose results were exported to LEAP. It should be noted that the LEAP software has a module called Transport Analysis which has a similar calculation model as the model in Section 6.1, but it was not used because it was necessary to model the imported used vehicles that are legally introduced to the country and these imported used vehicles currently are not considered in the LEAP transport model, that´s why our model was developed in Excel spreadsheets. (2) In the case of the air, rail, maritime and electric public transport subsectors, the future demand for energy from the BLS was projected using future energy consumption rates obtained from the official prospective [27,28], the annual growth rates obtained were introduced into LEAP exogenously.
  • Once the energy consumption is obtained in the reference year and the BLS, the GHG emissions in the reference year and the BLS were calculated using emission factors obtained from the technology and environmental database (TED) of LEAP (see Table 6).
  • The LCS was also constructed in LEAP applying its characteristic of allowing scenarios aggregation, in this case, one scenario for each mitigation measure was developed; the results of the new energy demands in each mitigation measure calculated, as we mentioned in the previous section, were imported for each subsector specifying the energies involved in the addressed mitigation measure. Finally, from the sum of the 21 scenarios, one for each mitigating measure, the LCS was created combining the results of these 21 scenarios which gives rise to a new total energy demand where the demand for each energy type involved was specified.
  • Once calculated the future energy demand, the GHG emissions from the LCS are calculated using the aforementioned TED database.

3.3. Assumptions about the Interaction, Additivity and Linearity of the Transport Systems

Given this methodology, this article does not consider the interactivity or the effects of additionality that real transport systems have, either in the BLS or in the LCS, except for the interactions that are described precisely and clearly in the description of the 21 mitigation measures. Thus, in this article that deals with Mexican transport systems, it is considered that both in the BLS and in particular in the LCS, it is assumed that different transport systems have a dynamic of a linear nature, independent of other transport systems evolution. For this reason, there are no effects of interaction or additionality between Mexican transport systems in most of the 21 mitigation measures analyzed, in this way the demand for energy estimated in each of the transport systems as well as GHG emissions are not influenced by the interaction between transport systems, except for those required in the description of mitigation measures in Section 5, nor by the additive effects that may exist in these systems.
Consequently, this article considers for most of the 21 mitigation measures only direct interventions within the same transport system, except in certain measures where it is explicitly established that there are interactions with other transport systems. These considerations about the low interactivity, the null additionality and the linearity in the dynamics of transport systems could lead to conservative results in the reduction of GHG and in the economic calculations presented in this article, both for each mitigation measure as above all for the evaluation of the LCS.

4. Reference Year Establishment and Construction of Baseline Scenario (BLS)

Table 3 shows the structure of Mexican road transport vehicle fleet in the reference year 2010. From this year´s structure, the energy demand was estimated using equations 1, 2, and 3 toward the year 2035 for each type of vehicle. To do so, first it was necessary to estimate the evolution of the age of the vehicle fleet, the annual national sales and imported used vehicles by type of vehicle, the survival factors, the vehicle fuel economy and the annual average distance travelled by each type of vehicle.
The AAGR used to estimate the growth of sales of new LDVs in Mexico was obtained from the historical sales’ analysis for the 1995–2009 period, coming to an average annual rate of approximately 6.0%. Concerning the introduction of imported used vehicles to Mexico, an AAGR of 4.3% from 2010 to 2035 was assumed for both light and heavy vehicles.
The survival curves (f) from [26] for the different vehicle types is shown in Figure 1. The f values for vehicles are relatively optimistic because they reflect the conditions and times in which the vehicle stock is used in Mexico and whose main feature is a slow renewal of the vehicle stock, especially the HDV freight, because users try to delay the purchase of new trucks due to their relatively high costs. This situation is worse for the imported used vehicles from the United States to Mexico. Thus, in 2009, the vehicle stock of vehicles that have been sold in Mexico had an average age of 12.98 years while that of imported used vehicles was 18.01 years old, which resulted in a vehicle stock being in circulation that had an average age of 16.34 years according to [39].
Regarding fuel economy by vehicle type, the values in Table 4 from [36] were used in the energy consumption calculations in the BLS. These values represent the average performance of the future vehicle fleet comprising: existing, new and imported used vehicles. These values are relatively low because this work is considering a high growth percentage of imported used vehicles (5% per year) and comparable to that of new vehicles (6% per year) as well as the high survival factors that characterize the existing Mexican vehicle fleet. Finally, these values allow that the total volume calculation of gasoline and diesel are in accordance with the official prospective of these fuels [27].
Finally, Table 5 shows the evolution of annual kilometers travelled by vehicle type for the period 2010–2035.
The data in this table come from [36] which considers the introduction of a degradation factor in the use intensity that depends on vehicle age (see Supplementary Material), which is associated with the high survival factors that characterize the Mexican vehicle fleet. Altogether these assumptions result in a conservative growth in the annual kilometers travelled by LDVs and even a decrease in this parameter by HDVs.
Regarding other fuels that are used for transportation in Mexico, such as Natural Gas, LP gas, fuel oil, kerosene, and electricity, their consumption in this sector in the BLS was estimated following the official consumption outlook of each of these fuels in the transport sector [27,28]. Finally, CO2 emissions were estimated considering the emission factors shown in Table 6.

5. Construction of a Low Carbon Scenario (LCS)

The following paragraphs will give information on descriptions, assumptions, and costs of the 21 mitigation measures proposed. These measures have been classified into three important groups: those that favor increasing energy efficiency, those that use biofuels, and those that introduce new technologies using electric motors.

5.1. Energy Efficiency

5.1.1. Fuel Economy Standard for Light Duty Vehicles (LDV)

Implementation of fuel economy standards for new LDVs that foster the improvement of LDV energy efficiency by increasing fuel economy by 5% yearly departing from year 3 to 7, generating a 35% increase in relation to the reference year where the LDVs have a fuel efficiency of 12 km/lt. An additional average investment cost of 918 USD is assumed per improved vehicle throughout the first five years [41]. This additional cost was calculated, according to this author, by estimating the global cost for manufacturers to comply with this standard which resulted in a value of 4526 MUSD, which was divided by the number of vehicles sold during those first 5 years of this measure summing up 4.9 million LDV according to [36]. In subsequent years, an average annual performance growth of 2.3% is assumed as an inertial improvement due to the manufacturer´s new infrastructure installed to comply with this standard and which was amortized as mentioned in the first 5 years of LDV sales, so that new LDVs from the sixth year on, no longer have an extra unit cost. Finally, the maintenance (M) costs are considered to be similar to those of existing LDVs in the BLS.

5.1.2. Fuel Economy Standard for Heavy Duty Vehicles-Freight (HDV-F)

This measure encourages the implementation of a performance standard that increases the fuel economy of HDV-F by 20% by the fifth year of operation of the regulations, assuming an annual increase of 4% in the fuel economy departing from year 4 to 8. An additional average investment cost of 378 USD per improved vehicle is assumed throughout the mentioned five years, emulating the USA draft fuel economy standard for heavy duty vehicles class 2B-8 according to [42]. This additional cost was calculated, according to [36] by estimating the global cost for manufacturers to comply with this standard which resulted in a value of 160 MUSD, which was divided by the number of vehicles sold during those 5 years of this measure summing up 423,155. An average annual performance increase of 2.5% after the eighth year is assumed as an inertial improvement due to the manufacturer´s new infrastructure installed to comply with this standard and which was amortized in the 5 years mentioned of HDV-F sales, so that new HDV-F from the eighth year on, no longer have an extra unit cost. Finally, the maintenance costs are like those of used vehicles in the BLS.

5.1.3. Gasoline Price without Subventions

In this scenario, with the purpose of reaching a gasoline price without subventions, we assume according to [36] an annual gasoline price increase of 5% over inflation during the first eleven years between 2011 and 2022, thereafter, gasoline price remains constant until the last year of the analyzed period. Under this assumption, a 17% reduction in intensity is achieved; this reduction is calculated using a price–gasoline elasticity of −0.31 according to [43].

5.1.4. Verification and Circulation Restriction in the Main 20 Metropolitan Areas and Five Border Metropolitan Areas

The aim of this measure is the implementation of inspection and maintenance programs, with traffic restriction for highly-polluting vehicles in the 20 Mexican cities with the largest vehicle fleets and also in the five metropolitan zones on the United States Border. This measure consists in establishing a periodic verification of engine performance, this implies a decrease in the use of fuel due to a more efficient combustion and fewer vehicles in circulation, therefore, a decrease in traffic congestion and an increase in the vehicles average speed is expected. It is assumed that this measure applies to 29% of existing national vehicles, which includes 42.2% of imported used vehicles. It is also assumed that 16% of existing national vehicles, including vehicles older than 8 years and 100% of imported used vehicles introduced to the metropolitan areas involved in the program, are verified and necessarily rest one day a week [36]. Finally, it is assumed a verification annual cost per vehicle of 49 USD for verification and 58 USD for maintenance [13].

5.1.5. Border Environmental Customs for Vehicles

This measure aims to establish a vehicle inspection program at the border to prevent the importation of those vehicles that do not comply with the national emissions’ regulation. It is assumed that, in the border states, 16% of imported used vehicles do not meet the established standards. This percentage is estimated from a study conducted by [44] which reports that 84% of the inspected vehicles (56% of the total imported vehicles) were in good physical and mechanical condition. Based on this it is inferred that the remaining 16% did not have this condition and consequently, they are the ones that would not comply with the vehicle verification proposed by this measure. Therefore, the proposed environmental customs should prevent the annual importation of that 16% of used vehicles. Finally, it is considered an annual verification cost of 98 USD per imported used vehicle [13].

5.1.6. Optimization of Public Transport Routes in Urban Areas

It is assumed according to [38] that the optimization of public transport routes would result, on the one hand, in a reduction of the urban bus fleet by 20% in large cities (greater than 1 million inhabitants [45]); this process begins in the second year of the period of analysis and the goal is reached gradually in the year 2030. And, on the other hand, in a reduction of public transport by 44% in medium cities (between 500 thousand and 1 million inhabitants [45]) by 2030. This reduction was taken from [46] where it is proposed that this value is feasible for this medium-sized city in Mexico.

5.1.7. Introduction of Hybrid Buses

This article states that the hybrid buses measure is more important than the electric public transport systems (subway and trams -see the following measure 5.1.8), although the electric option has a greater mitigation potential, especially when the GHG emission factor of the power grid is high, and for this reason it is considered as the most important and aggressive low-carbon scenario to achieve in public transport systems. However, in this article, it is considered that hybrid buses have a much greater development than the electric option because the hybrid option avoids the high investments of the development of the rail infrastructure and the acquisition of trains, so from the economic and financial point of view it has a greater viability for a country like Mexico. Hybrid buses are presented in our article as a transition option that has an important development while lowering the costs of electric trains and developing the rail infrastructure to use them.
The introduction of hybrid buses, with the goal of constituting 15% of the total vehicle fleet of passenger buses in medium and large cities by 2035 has been considered. It is assumed that 30% of new buses by the year 2035 will be hybrid [36] and that their fuel economy will be 30% higher than that of conventional engines [47]. It is assumed that this measure applies only to 46% of the national bus fleet for urban use (HDV-P) and that the hybrid bus fleet increases from 41 vehicles in 2012 to 7694 in the year 2035, which implies an average annual growth rate of 25.6%. This measure implies an average differential cost of 282,491 USD for each hybrid bus relative to conventional buses. Finally, M cost for hybrid buses represents 10.7% of the incremental investment cost according to [36].

5.1.8. Electric Public Transport Systems

This measure promotes electric public transport systems (subway and trams) to reduce emissions and noise. According to [36], subway trains are promoted in the largest and most polluted cities in Mexico: Guadalajara, Monterrey, and the Metropolitan Area of Mexico City, and in the rest of the country, extension of the tram network is promoted. It is considered that from the second year, a total of 2.6 km of subway per year would be built in the three mentioned cities. This data is estimated observing the increase in the length of the metro in Mexico City between 1969–2012, during which it extended 226 km over a period of 43 years, according to [48], that is 5.2 km per year. It is assumed that half the extension per year is considered for the mentioned three cities. In the case of trams, 89 wagons were considered in 2012 reaching 960 in 2035 [36]. According to this author, it is assumed that 95% of transport users demand comes from public transport users and 5% from private car users. Also, for subway trains and trams investment costs of 0.371 and 1.297 USD per kilometer travelled per year, respectively, were considered. Finally, a subway and tram systems are assumed to expand to an average of 0.36 and 4.2 million kilometers travelled per year, respectively.

5.1.9. Public Bicycle Systems

The assumption of this measure is to change 0.6% per year of trips made by the sources shown in Table 7 to bicycle trips. It will start in the second year and reach progressively up to 3% in the sixth year and maintain 3% of these annual total trips to bicycle trips for the rest of the period [36]. According to this author, in this article we considered a bicycle average speed of 18 km/h, an average distance of 6 km per trip, and an average 7.1 trips per bicycle, an annual maintenance cost of 42 USD and a cost of 1250 USD for each new bicycle. Finally, it is considered that there is enough infrastructure to incorporate these new bicycle trips, where the new bicycles cost includes improvements of the infrastructure.

5.1.10. Bus Rapid Transit Systems (BRT)

This measure promotes Bus Rapid Transit (BRT) systems fueled by diesel. According to [36] it is considered that 15% of BRT system passengers stopped using their private vehicle and the other 85% change from using conventional public transport to BRT which is more efficient. In addition, these passengers benefit from shorter transfer times. It is also considered, according to the same author, an occupation of 100 passengers per bus used in the BRT, a performance of 1.45 km/L, and a constant traveled kilometers per vehicle per person in all transport modes. Also, a gradual increase in BRT corridors, from 130 km in the reference year to 650 km in the last year of the analysis period, an average cost of 3.9 MUSD per km of corridor, were considered according to [36]. Finally, it is also assumed that the M costs are similar to those of conventional buses in the baseline case.

5.1.11. Clean Freight Transport Program

It is assumed that at the federal level, all new freight vehicles are obliged through a standard to incorporate three technologies to improve performance of new HDV-F vehicles based on [49]: i) improvement in aerodynamics to achieve a 6.9% increase in efficiency; ii) improvement in inflating tire technology, with which an increase in efficiency of 2% is achieved; and iii) installation of an auxiliary power unit for air conditioning when the vehicle is not moving (energy independent of the truck engine), which reduces energy consumption by 75% for this use. For this last technology according to the information from [49], it is considered that the air conditioning unit consumes an average of 5,443 liters of diesel per truck per year, due to the vehicle’s engine is turned on idle mode to power it. The implementation of these measures would start from the ninth year of the analysis period. According to the information from [49], we assumed a unitary investment costs of 624 USD due to the new aerodynamic design, 87 USD costs for tire inflating technology, this value is estimated as an average between 58 and 117 USD for class 7 and class 8 trailers, and 4,286 USD cost of an air conditioning unit integrated with an independent auxiliary power unit for class 8 trailers by year 2020.

5.1.12. Urban Development Oriented to Sustainable Transportation (DOST)

According to the study [50] related to urban development in three cities in Mexico, and specifically Mérida, it is assumed that urban development policies may achieve an average improvement of 30% in each of the following four urban indicators applied to new urban developments: population density, mixed land uses index, jobs per house, and employment-workers balance. According to this author, it is assumed that new urban policies affect only new houses and the new population travel patterns, this assumption is conservative as it does not consider interactions with population living outside the new urban developments. The new population growth is estimated considering historical annual growth rates of 56 Mexican urban areas, whose average is 1.5%, according to [51], and a population of 63.8 million people in 2010 [52]. With these data and considering the prospective 2011–2015 of new housing loans [53], projecting the data for 2015 towards the rest of the analysis period, and a constant occupancy of 3.95 persons per housing throughout the period; throughout these assumptions it is possible to obtain the number of new national homes and the number of new homes in the mentioned 56 urban areas, the latter in terms of the percentage of new dwellers in the period. In order to reach a 30% increase in the mixed land use index, it is assumed a 4.3% increase in the area built per person, when compared to the base case, which represents an extra cost of 291.2 USD/m2 [54]. This is the only additional investment cost considered in this measure.
It is also according to [36] assumed that new houses share, designed with DOST criteria, increases from 1% in the year 1, to 35% in the year 3, to 60% in the year 5, to 90% in year 7 and to 100% from year 9 and forward. In order to quantify the effects of the 4 aforementioned indicators in the travel patterns, both in the average distance and frequency of daily trips, the elasticities in Table 8 were used, originally estimated for the city of Merida by [50]. Finally, the suggested urban development policies have the effect on the trip pattern departing from 2.59 daily trips per person and an average time per trip of 52.73 minutes [55]. Modal changes are not assumed.

5.1.13. Freight Rail Systems

This measure assumes promotion of this transport system and its growth in terms of transported freight and reduction in the use of other less efficient road transport modes. It is assumed that the railway network grows by 450 km/year according to the national infrastructure program 2007–2012 [56], therefore grows at an AAGR of 2.57% with an average load of 79.9 tons per wagon, this value was calculated according to the relationship of each type of wagon existing in 2010 (gondolas, hoppers, vans, autoracks, tanks, platforms, piggy back and others) [57] and the estimated average capacity for each type of wagon, based on information from [58,59]. It is also assumed that the fuel performance annual improvement showed between 1999–2009 years, through a linear interpolation departing from 115 ton-km/L [57] in 2010 and increasing at an AAGR of 1.8%. Finally, a cost of investment (including infrastructure and equipment) of 1278 MUSD/year [56] is assumed. From the first to the sixth year, investment costs, including infrastructure and equipment, are assumed at 1,278 MUSD/year and the cost of diesel consumption is 0.61 USD/L.

5.1.14. Freight Transport Companies Integration

In this measure, two actions are undertaken, first, transport companies are integrated to improve travel logistics. In Mexico 36.8% of total freight trips are empty according to [36]. And second, training ecodriving programs for drivers are assumed to save fuel on travel. It is assumed, that there will be a reduction of 15% in diesel consumption in 10 years due to driver training, this value is the average of improvements by training of 9% to 23% indicated by [60], it is also assumed, based on [61] that by the end of year 5 there will be a reduction of 50% of empty trips, starting from the second year of the analyzed period; in this article we consider that after year five the percentage of empty trips will remain constant for the rest of the period. A total of 84 annual ecodriving workshops for 50 drivers each one, are proposed to be held in each one of the 33 Mexican states. A cost of 8333 USD for each course is assumed according to [36].

5.2. Liquid Biofuels

See Table 9 for technical assumptions and assumed costs for these measures.

5.2.1. Sugarcane Ethanol

This option considers ethanol produced from sugarcane as a partial substitute for gasoline by mixing up to 10% (in volume basis) of the gasoline, which is an ethanol widely used for blending around the world [62]. In this measure we adopted the technical assumptions used in [37], published in its supporting information appendix (see Table 9), where a surface of 2.9 million hectares (Mha) is required to establish sugarcane crops to introduce sugarcane ethanol. The ethanol production is planned to begin in year 4 with a processing plant that produces 170 million liters (ML)/year and this capacity grows to a total of 139 plants with the same capacity by year 25. Finally, the cost structure given by [37] it is also assumed for this measure.

5.2.2. Sorghum Grain Ethanol

This measure considers the partial substitution of gasoline with ethanol produced from grain sorghum, through gasoline-ethanol blends. In this measure we adopted the technical assumptions used in [37] (see Table 9) for this measure, where it is observed that a surface of 2.6 Mha is required to grow sorghum grain crops to introduce grain sorghum ethanol. The ethanol production is planned to begin in year 6 with a processing plant that produces 190 ML/year and this capacity grows to a total of 28 plants with the same capacity by year 25. Finally, the cost structure given by [37] it is also assumed for this measure.

5.2.3. Jatropha curcas Biodiesel

This measure considers partial substitution of diesel with biodiesel produced from Jatropha curcas oil, through diesel-biodiesel blends. In this study we adopted the technical assumptions used in [37] (see Table 9), where a surface required of 3.2 Mha can be used to establish Jatropha curcas crops dedicated to biodiesel production. The introduction of Jatropha biodiesel is planned to begin in year 8 with a processing plant that produces 93,750 t seed/year and this capacity grows to a total of 29 plants with the same capacity by year 25. Finally, the cost structure given by [37] it is also assumed for this measure.

5.2.4. Palm Oil Biodiesel

This measure considers partial substitution of diesel with biodiesel from oil palm, through diesel-biodiesel blends. In this study we adopted the technical assumptions used in [37] (see Table 9), where a surface required of 1.85 Mha can be used to establish oil palm crops dedicated to biodiesel production. The introduction of oil palm biodiesel is planned to begin in year 8 with a processing plant that produces 140,171 t fruit/year and this capacity grows to a total of 117 plants with the same capacity by year 25. Finally, the cost structure given by [37] it is also assumed for this measure.

5.3. New Electric Motor Technologies

5.3.1. Hybrid Electric Vehicles

This measure promotes the use of hybrid electric vehicles (HEV), which increases the efficiency of fuel use by up to 50% according to [63]. It is assumed that HEV in Mexico will reach 35% of the new vehicle sales by 2035. This percentage is higher than the one estimated for USA [64], where a 24% market share for year 2030 is proposed. Comparing our value with a 40% share in a strong hybrid scenario proposed for USA [65] by 2035, our value is 5% lower but still is an ambitious goal. It is also assumed that the additional investment cost with respect to conventional internal combustion vehicles will be 6250 USD. This value was estimated as follows: according to [66] that proposes an incremental value is 7945 USD which contrasts with the value presented by [67] that proposes an incremental value of 5050 USD, both in year 2010, in our article we propose to use a value close to the average between these two references. Finally, we consider that the incremental value is reduced to 3125 USD by year 2035, which is very close to the estimated by [68], in its electric and hybrid vehicles section, which establishes a value of 3231 USD in 2030.

5.3.2. Plug-in Hybrid Electric Vehicles

This measure assumes a penetration of plug-in hybrid electric vehicles (PHEVs) according to a logistic function that saturates at 40% of the number of LDVs sold in the last year of the period. From a study made for USA by EPRI [64], we found that this market share is near 50% by year 2030, therefore, assuming a 40% PHEV share of new vehicle sales by year 2035 seems ambitious but appropriate for the case of Mexico. It is assumed that the additional investment cost related to conventional internal combustion vehicles is 14,100 USD at the beginning of the period, which is close to the value of 15,000 USD estimated for that same year by [69], and by year 2030 they expect a cost reduction to 7500 USD, this value is not far from to the assumed in this study of 7050 USD by year 2035. Finally, maintenance costs are assumed similar to those of a conventional vehicle.

5.3.3. Battery Electric Vehicles (BEV)

This measure assumes a penetration of battery-powered electric vehicles (BEVs) according to a logistic function which saturates at 10% of the number of new LDVs sold in 2035, this value is between the 7% in 2030 estimated by [70] and 16% by 2035 estimated by [71]. It is also assumed that the additional investment cost related to conventional internal combustion vehicles is 20,000 USD in year 1 as published in [72] and that it decreases by half by 2035 as estimated by [70]. Finally, we assume that the maintenance costs are like those of a conventional vehicle.

6. Calculation Models

6.1. Model Developed to Calculate the Evolution of the Vehicle Fleet and its Energy Consumption

The evolution of the vehicle fleet and the energy consumption by fuel type in the BLS is estimated from the following equations:
S t o c k t f n = S t o c k t f n 1 + V t f n S t f n + I t f n S t z f n
where: S t o c k t f n 1 : Remaining vehicle fleet of type t, using fuel f in year n − 1; V t f n : Sales of vehicle type t, using fuel f in year n; I t f n : Number of imported used vehicles type t, using fuel f in year n.
S t f n : Survival percentage of vehicles type t, using fuel f in year n; S i t z f n : Survival percentage of imported used vehicles type t and model year z, using fuel f in year n.
A l l S t o c k n = S t o c k t f n
A l l S t o c k n = Total number of vehicles in year n.
E t = S t o c k t f n K t f n L t f n
where: Et: Energy consumption in year n by vehicle type t; S t o c k t f n : Vehicle fleet of type t, using fuel f in year n; K t f n : Average fuel economy per kilometer travelled for vehicle type t, using fuel f by year n; L t f n : Average annual distance travelled in kilometers by vehicle type t, using fuel f by year n.

6.2. Cost-Benefit Assessment and Mitigation Costs

The following calculation model was used to obtain the cost-benefit and mitigation cost based on [73]:
C B L C S B L S = I C L C S B L S + O M C L C S B L S + E C L C S B L S
where: I C L C S B L S : Overall incremental investment costs for all alternative measures in the LCS in present value; O M C L C S B L S : Overall incremental costs of operation and maintenance for all alternative measures in the LCS scenario in present value; E C L C S B L S : Overall avoided costs of energy for all alternative measures in the LCS in present value.
With:
I C L C S B L S = i = 1 M n = 1 P I C L C S B L S n i ( 1 + r ) n
where: I C L C S B L S n i : Annual incremental investment costs in relation to the implementation of the mitigation measure i for any year n in the period P; n: Year, n = 1,…, P; i: Mitigating measure, i = 1,…, M; r: Discount rate (10%); P: Analyzed period (25 years); M: Number of mitigation measures in LCS (21 measures).
O M C L C S B L S = i = 1 M n = 1 P O M C L C S B L S n i ( 1 + r ) n
where: O M C L C S B L S n i : Incremental costs of operation and maintenance for mitigating measure i in year n:
E C L C S B L S = i = 1 M n = 1 P E C L C S B L S n i ( 1 + r ) n
where: E C L C S B L S n i : Annual cumulative incremental costs of operation and maintenance (O&M) for the mitigating measure i accumulated in the year n in the period P:
M C L C S B L S i = T C L C S B L S i G H G L C S B L S i
where: T C L C S B L S i : Total incremental costs for the mitigating measure i in the LCS in present value; G H G L C S B L S i : Total avoided GHG emissions for mitigating measure i in the BLS.
With:
T C L C S B L S i = n = 1 P ( I C L C S B L S n i 1 + r n + O M C L C S B L S n i 1 + r n + E C L C S B L S n i 1 + r n )
G H G L C S B L S i = f ( E S L C S B L S f i E F f )
where: E S L C S B L S f i : Total avoided energy from energy carriers f (gasoline, diesel, fuel oil, NG, LPG, kerosene and electricity), use of which generates emissions in the implementation of measure i during the considered period; E F f : Carbon Dioxide Emission Factor from fuel f.

7. Results

7.1. Baseline Scenario (BLS)

Table 10 shows the evolution in terms of AAGR of the stock by vehicle category in the BLS in the period 2010–2035 and its comparison with the corresponding historical AAGR in the period 1990–2010.
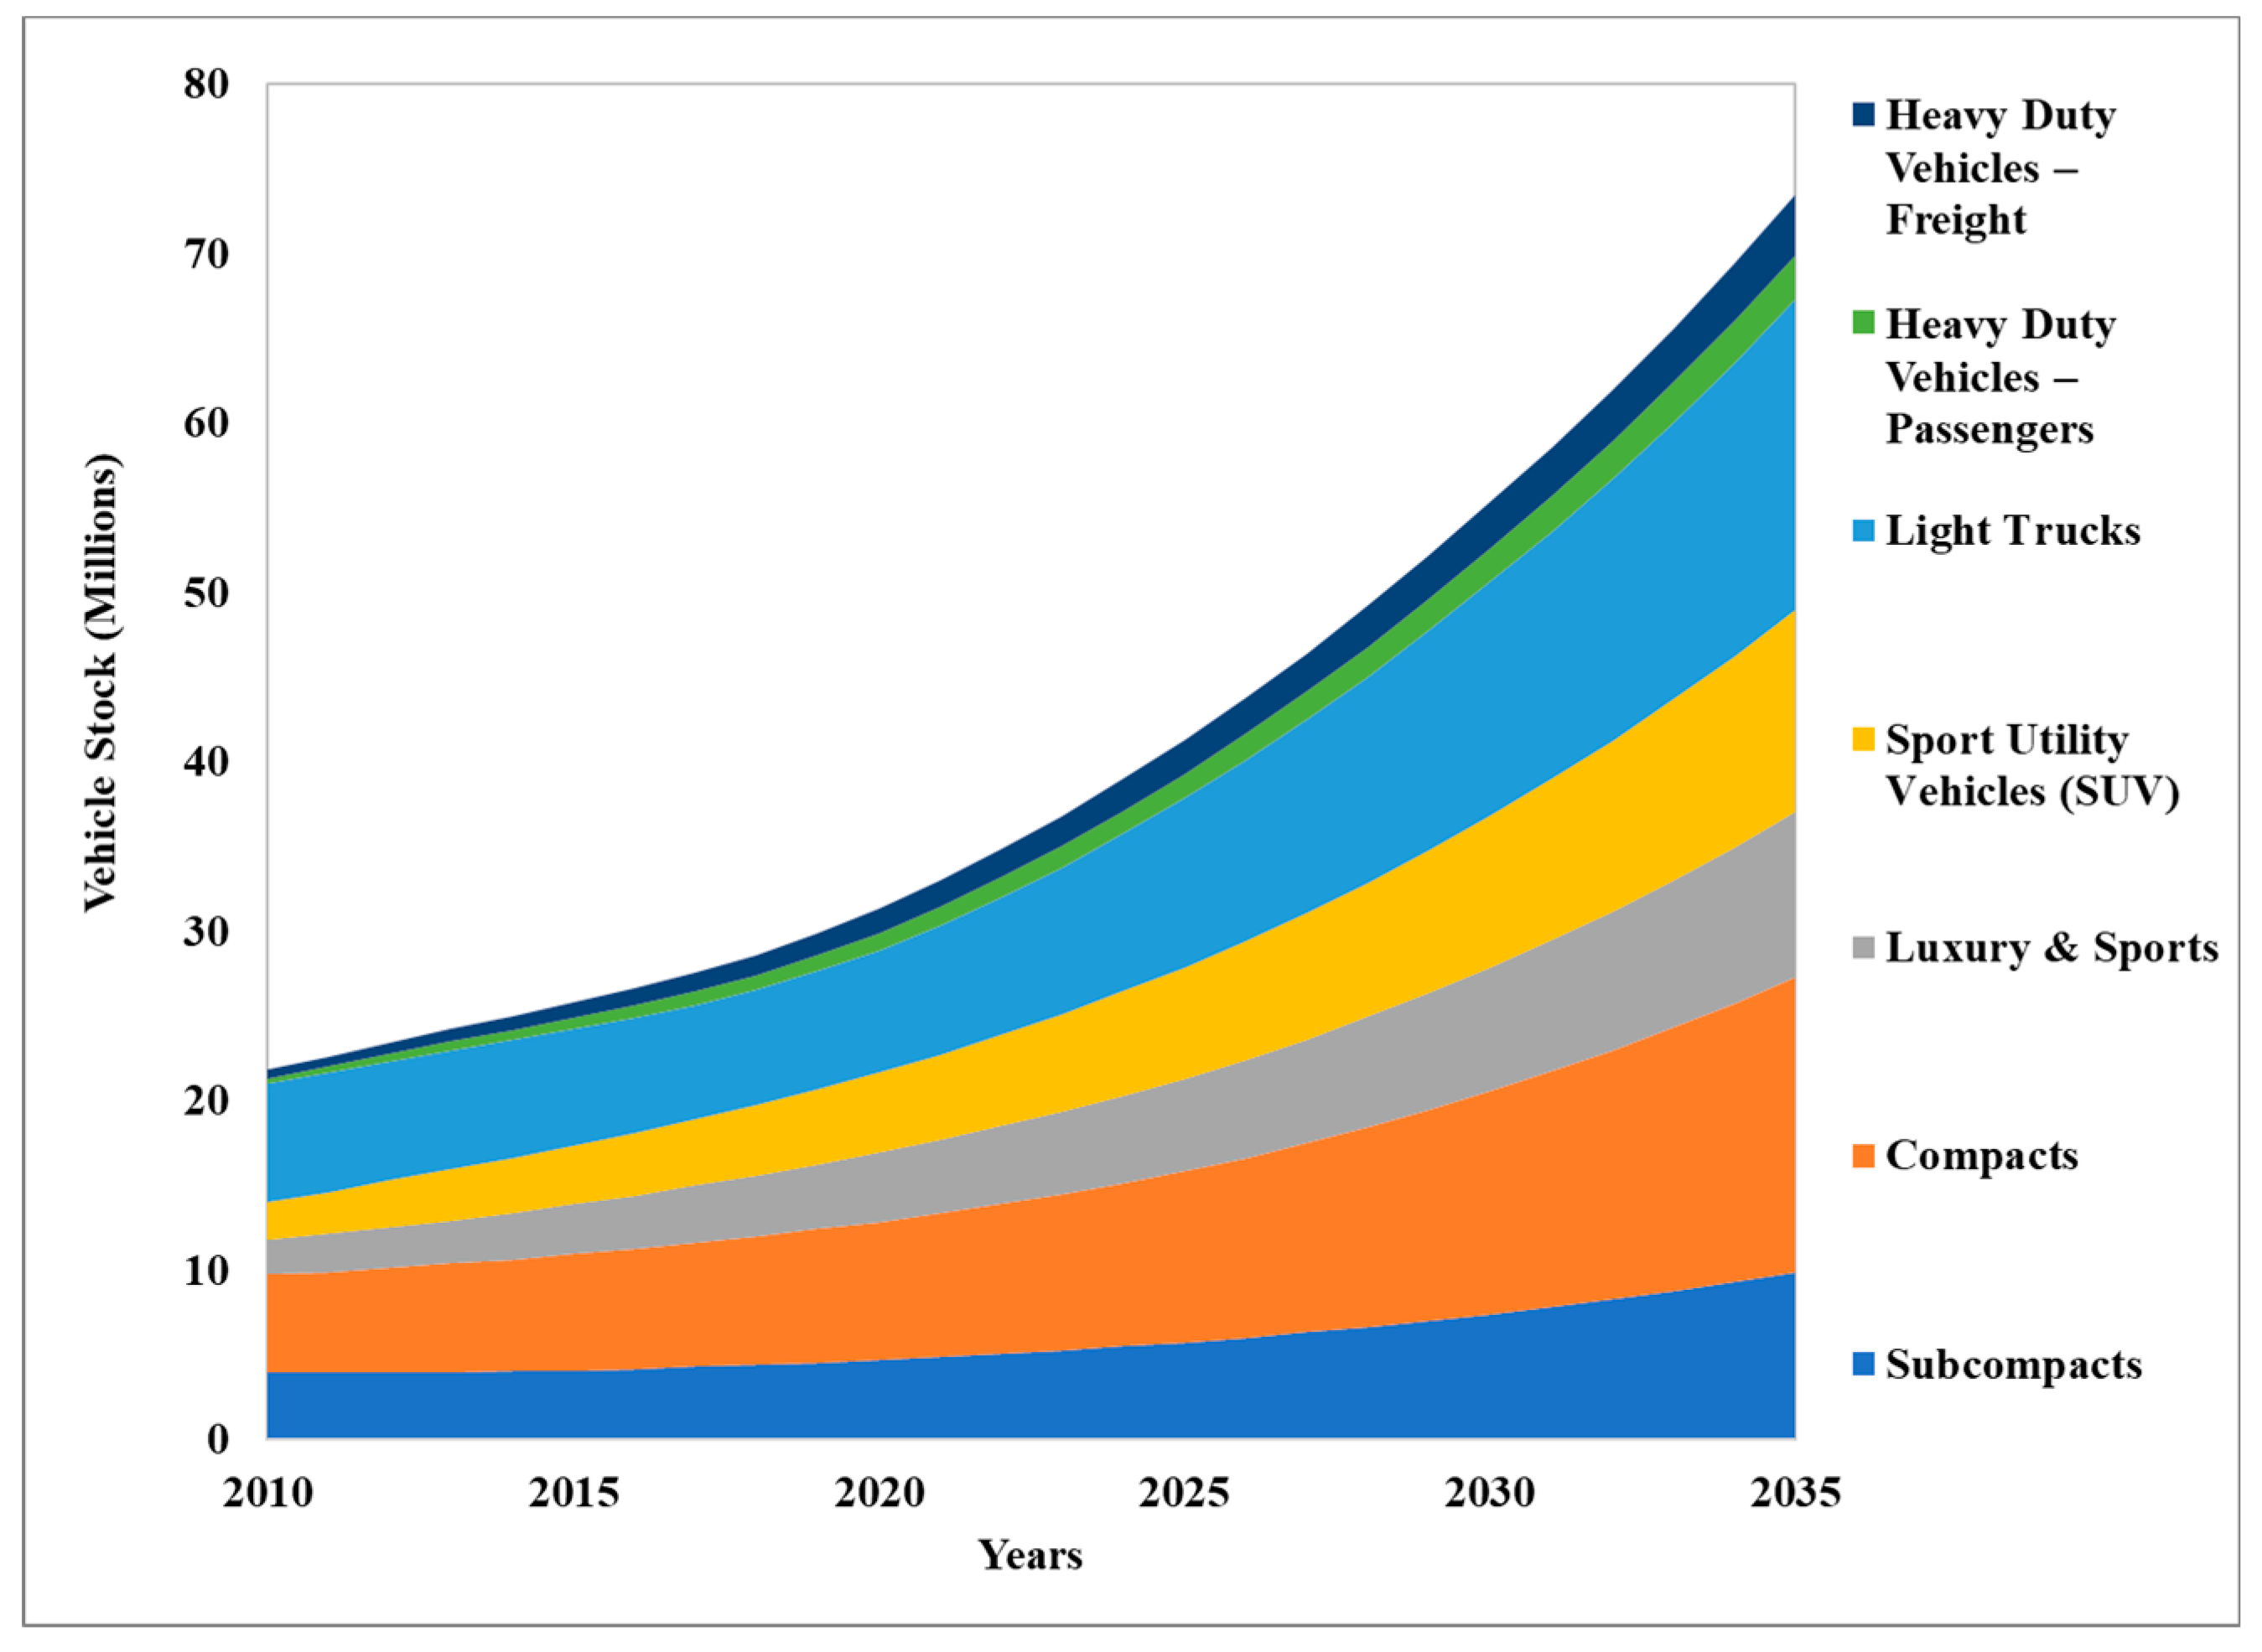
Figure 2 shows results of the Mexican vehicle fleet projection in the BLS, which triples by year 2035, reaching 67.3 million vehicles (MVEH): Light trucks go from 6.8 MVEH in 2010 to 18.3 MVEH, compact cars go from 5.5 to 17.4 MVEH, SUVs go from 1.9 to 11.9 MVEH, subcompacts go from 4.1 to 9.9 MVEH, and luxury cars go from 1.9 to 9.8 MVEH. Passenger buses increase from 0.2 to 2.6 MVEH, and heavy trucks go from 0.3 to 3.6 MVEH.
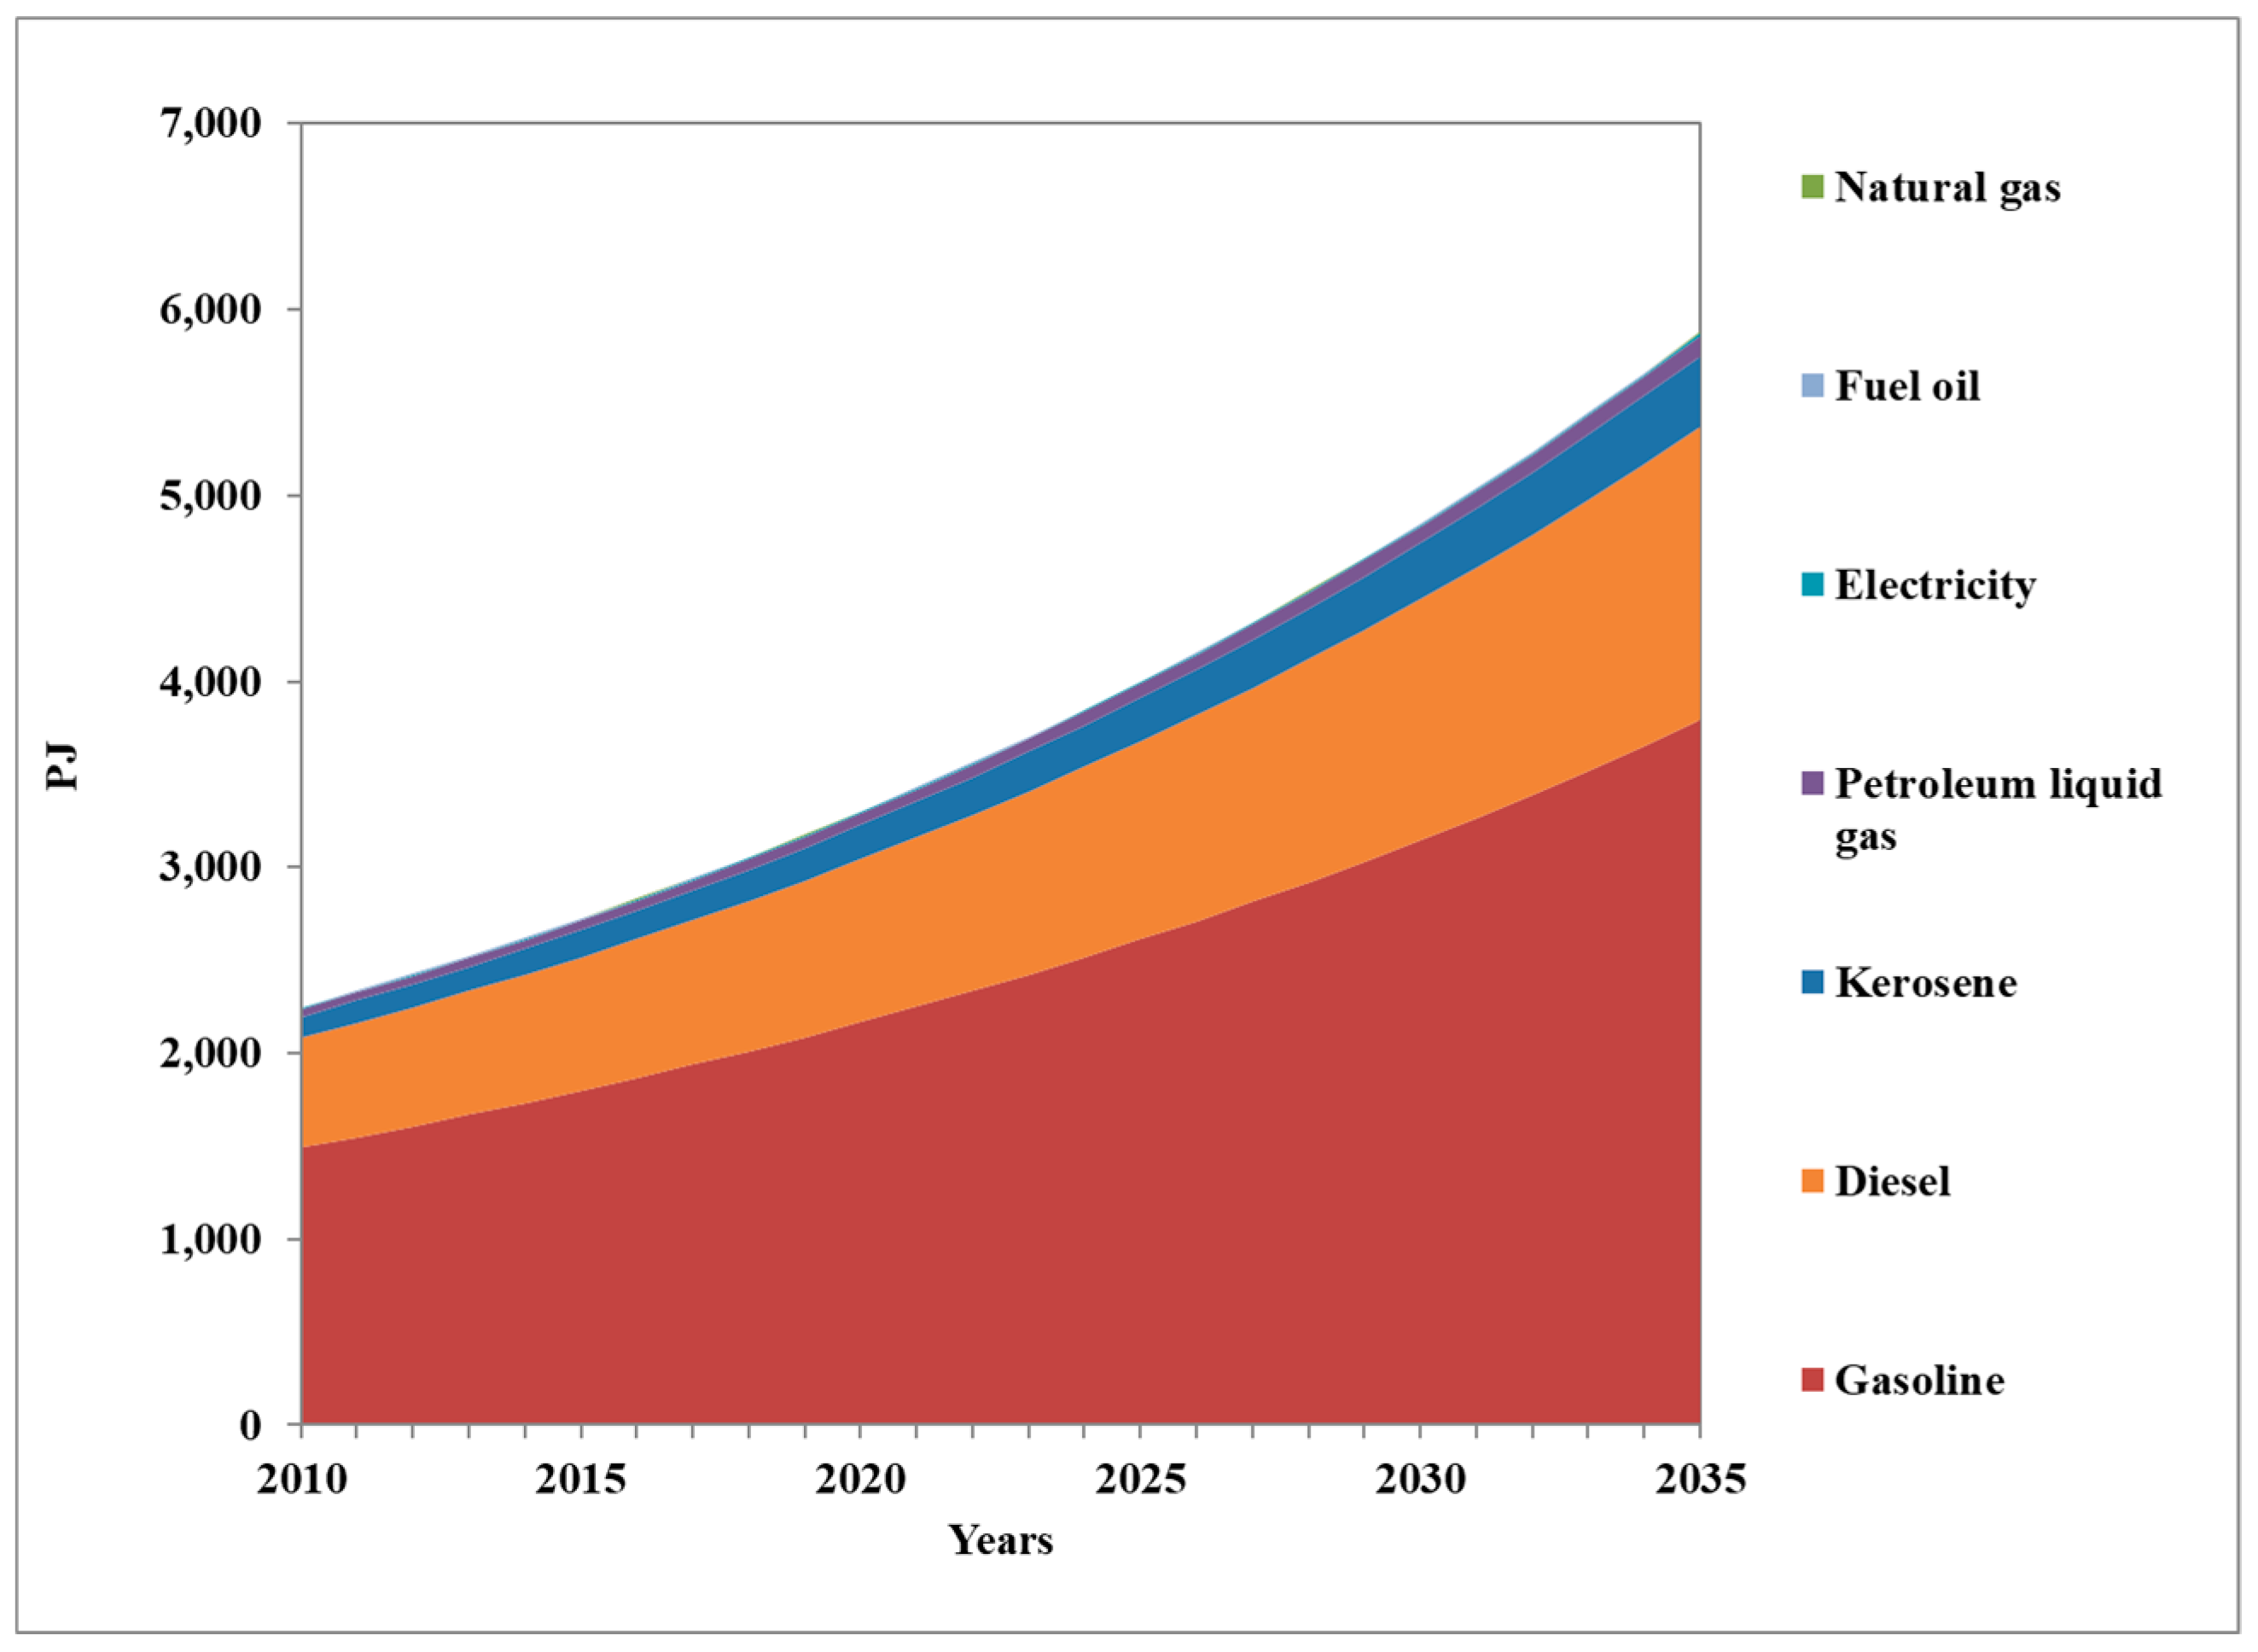
Energy consumption (see Figure 3) continues with the predominance of gasoline and diesel, which represent 65% and 27%, respectively, of total energy consumption in this sector, and the energy requirements total 5879 PJ in 2035, representing a 253% increase when compared to 2010.
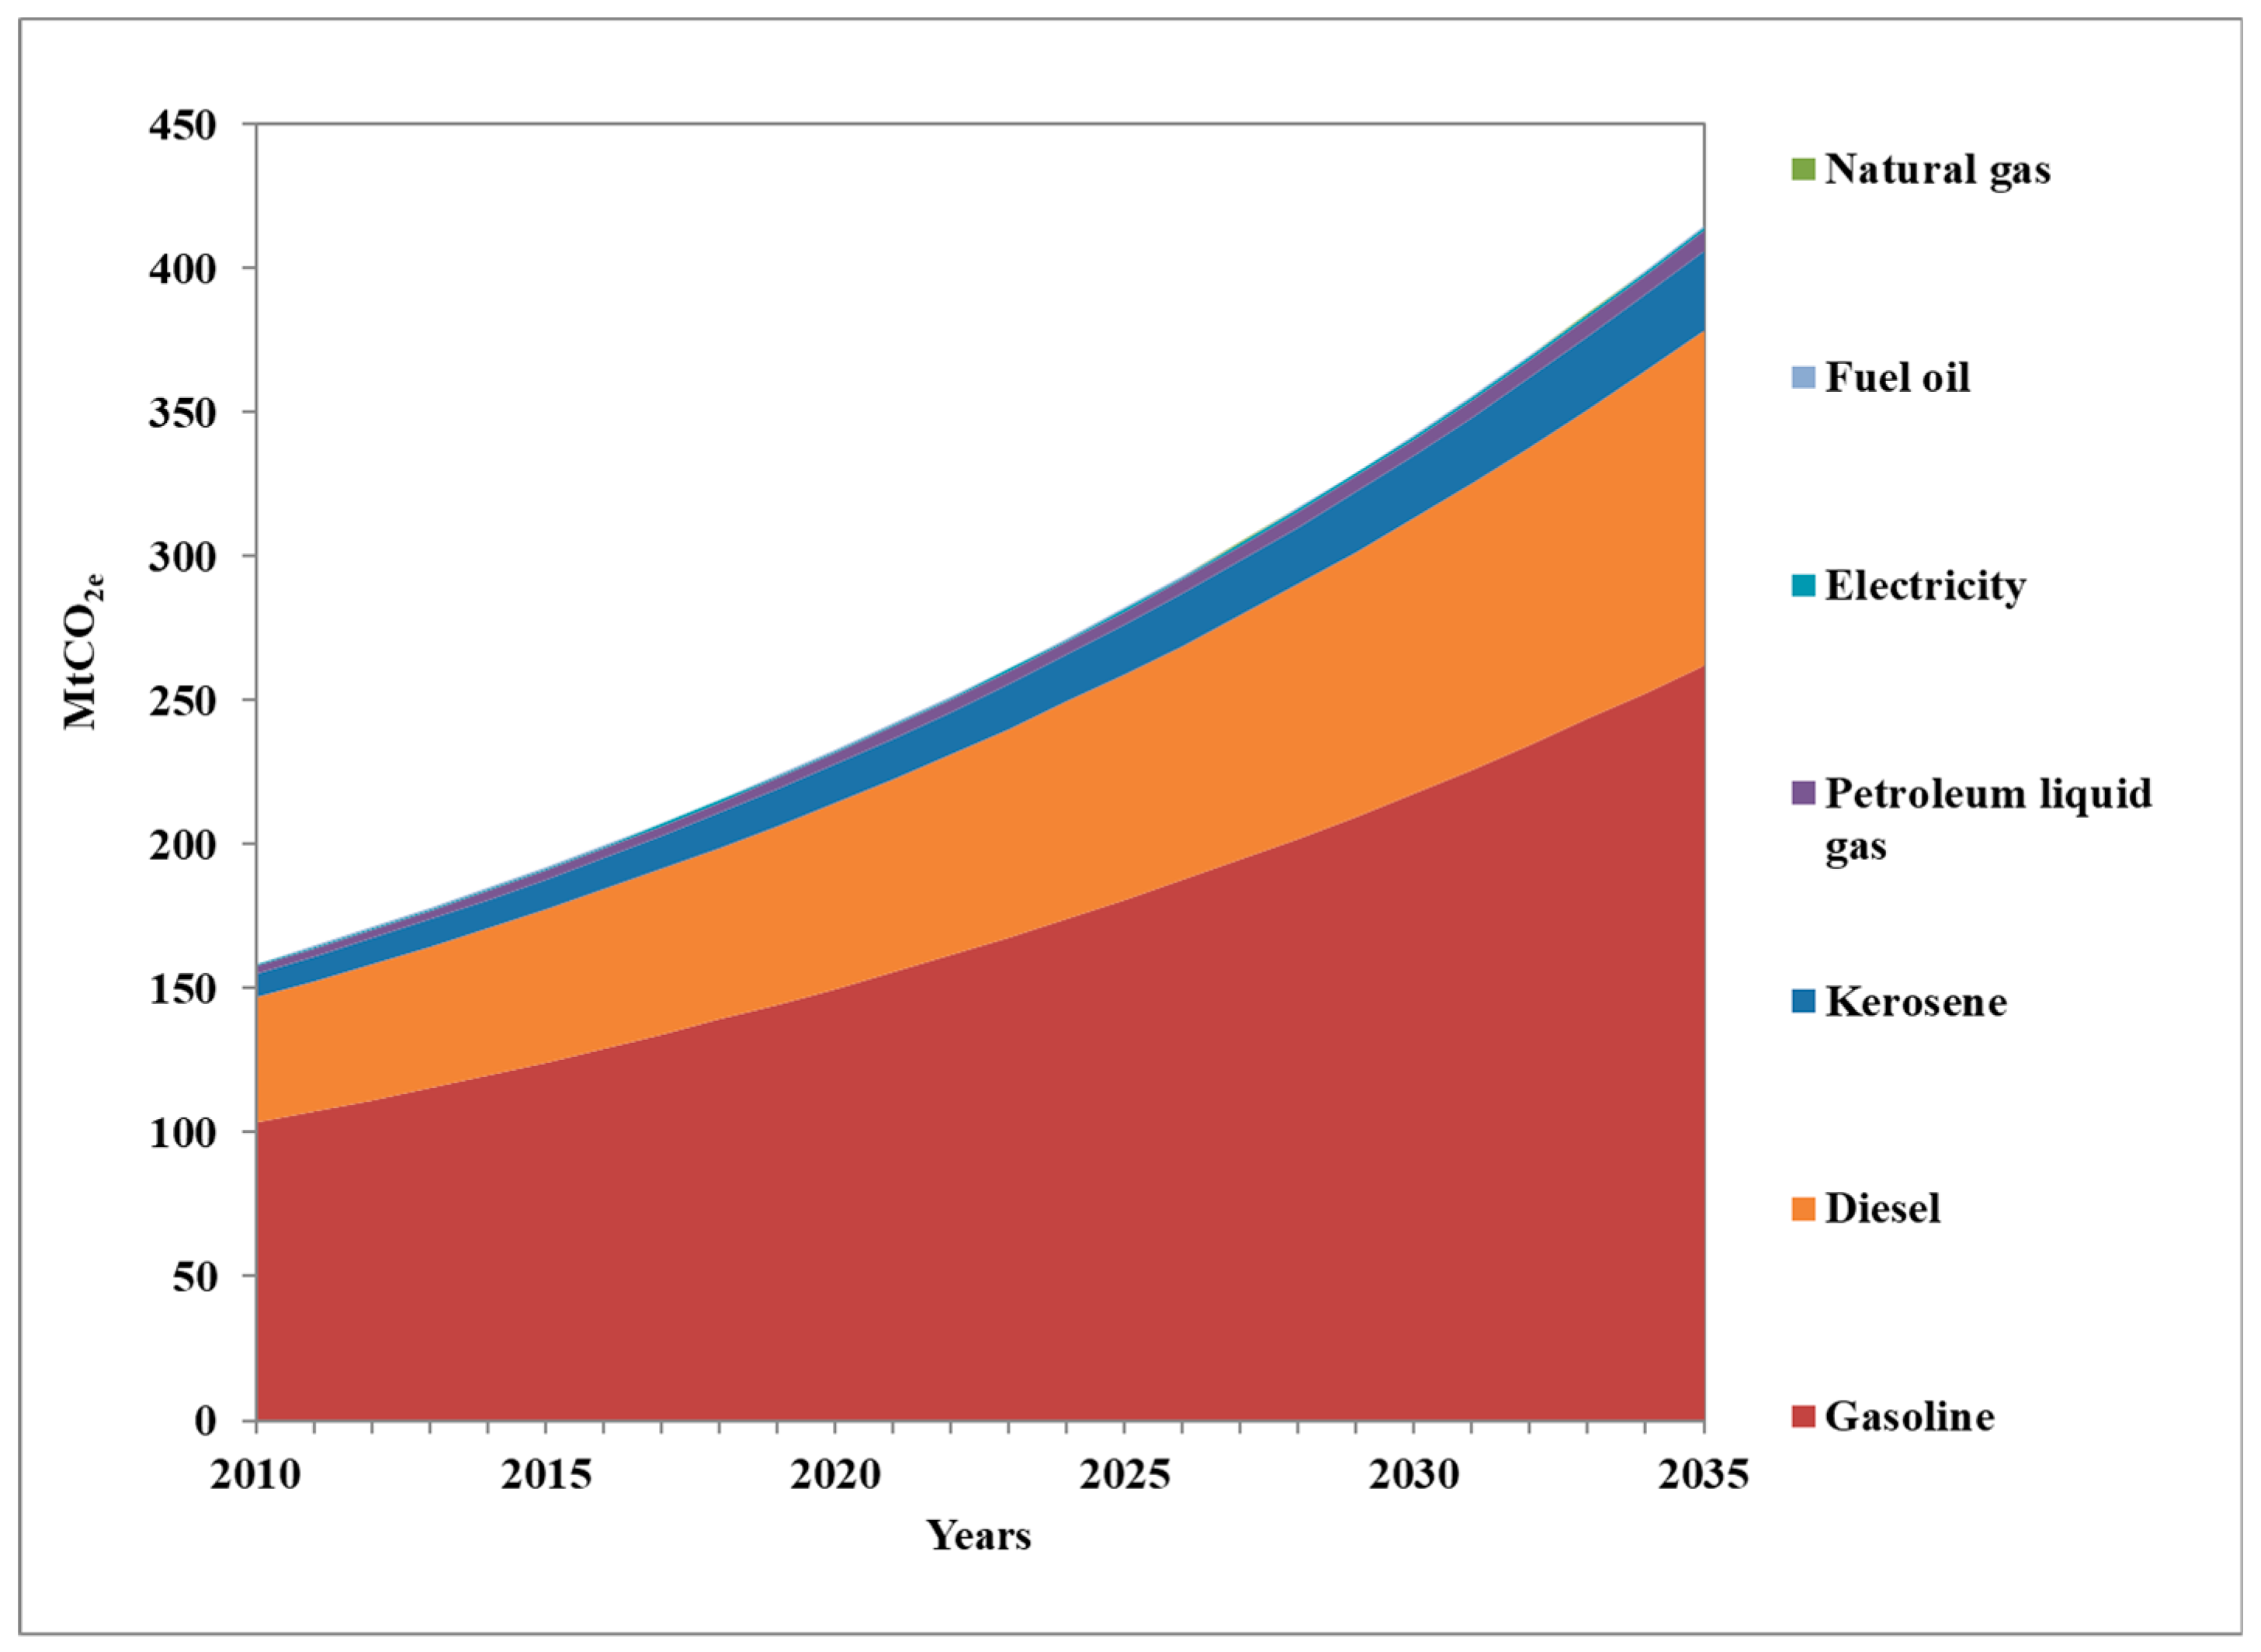
GHG emissions (see Figure 4) will reach a total 415.1 MtCO2e by 2035, an increase of 259% compared to 2010, of which 63% and 28% come from gasoline and diesel, respectively.

7.2. Low Carbon Scenario (LCS)

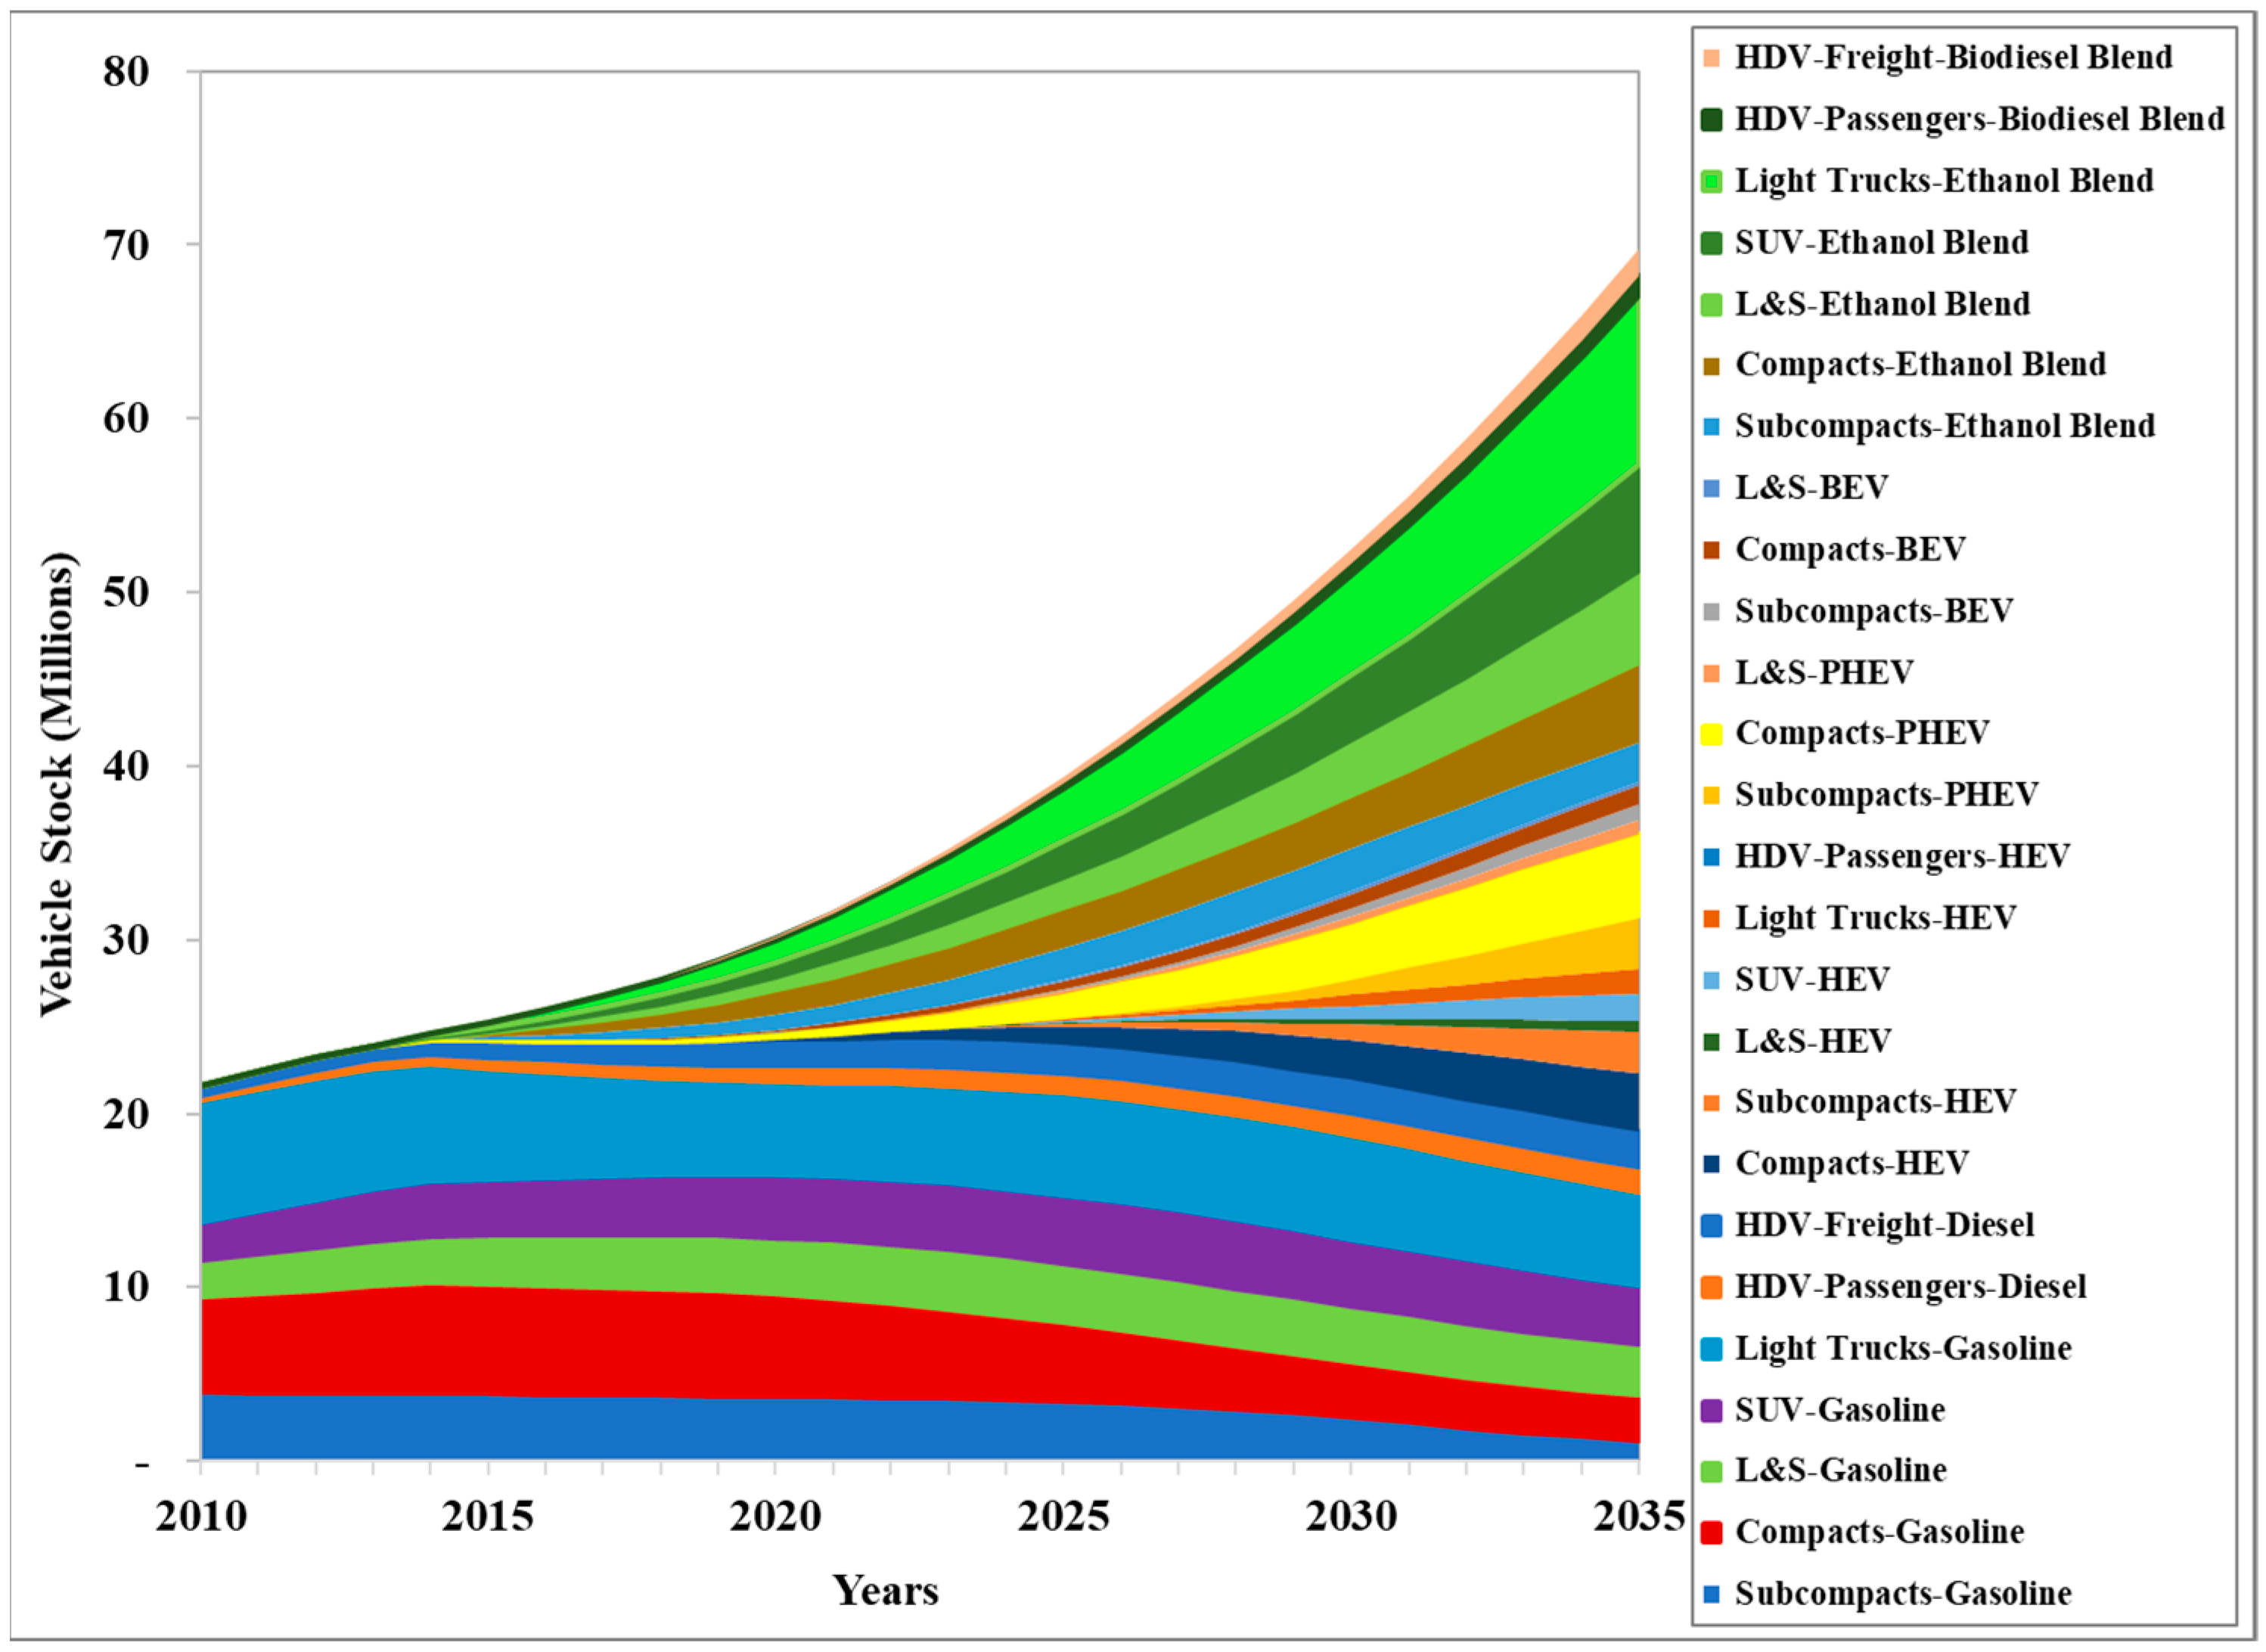
Figure 5 shows the vehicle stock evolution in the LCS, as can be seen the total volume reaches almost 70 million vehicles, 3.7 million vehicles less than BLS.
In addition, there is a significant technological change in the LCS, towards the year 2035, 29% (20.1 million vehicles) are based on new technologies, 44% (30.7 million vehicles) use mixtures with biofuels and the rest 27% (18.9 million vehicles) remain with conventional technologies.
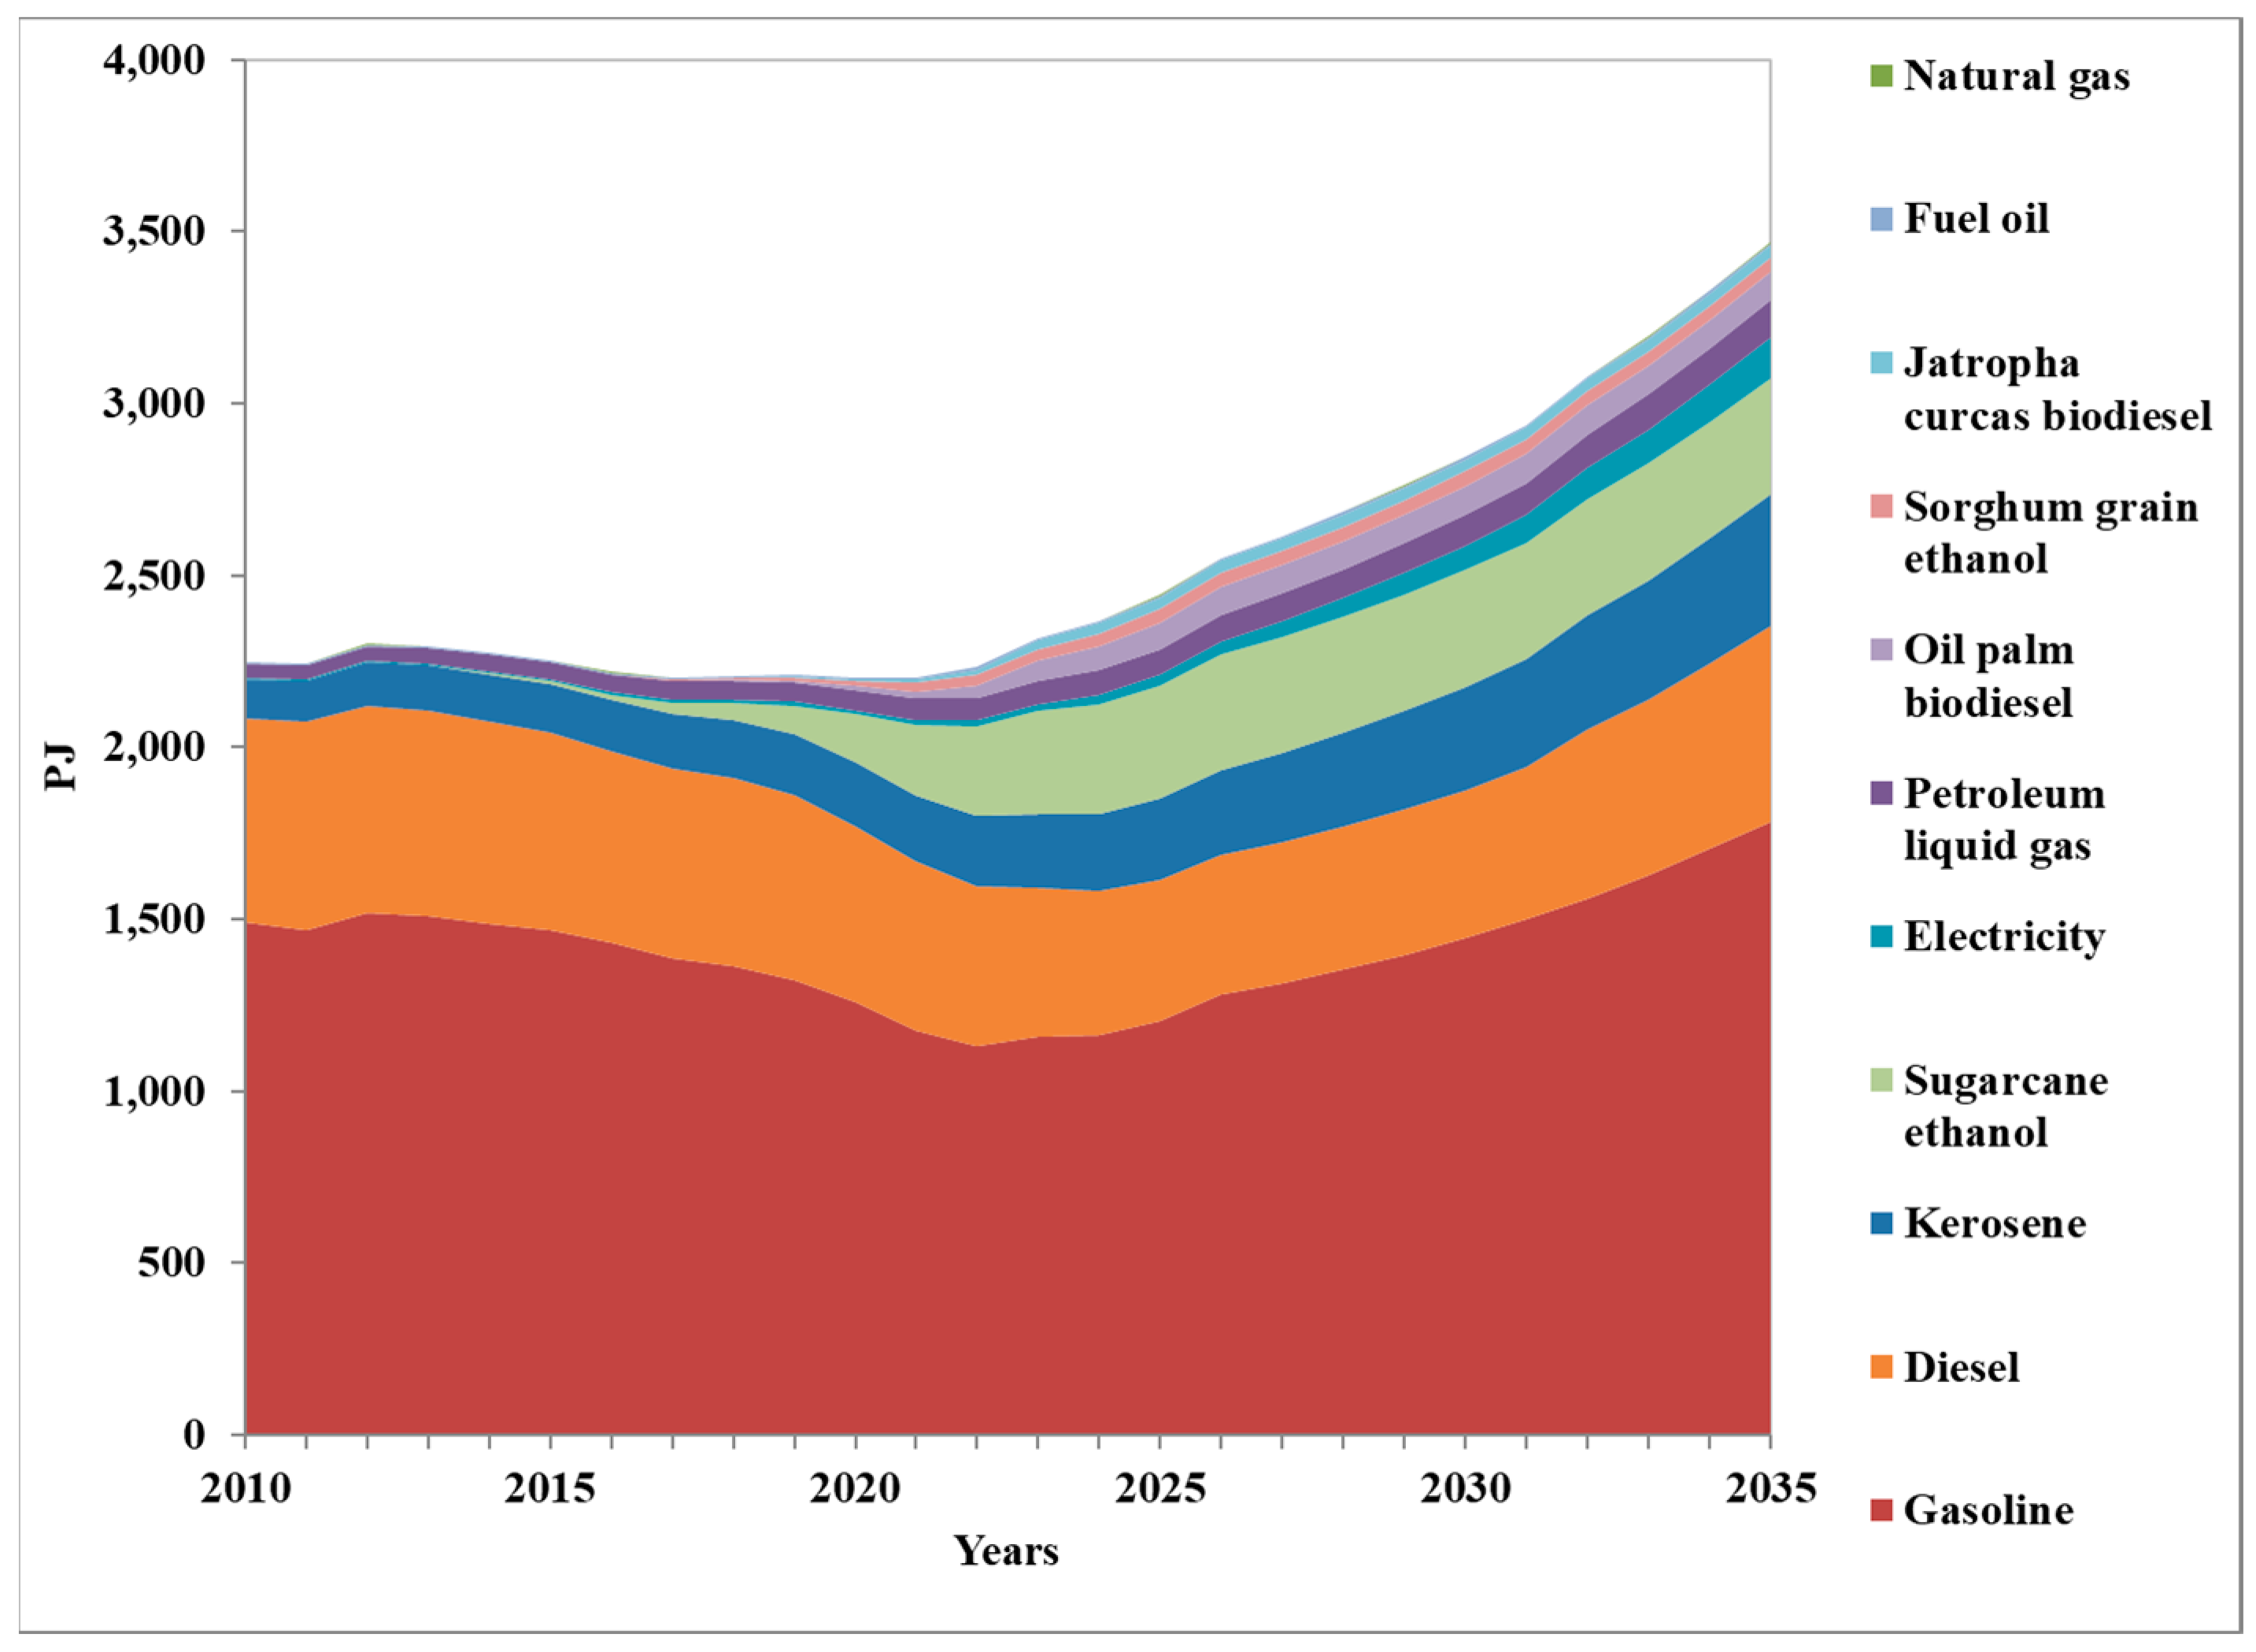
Figure 6 shows energy consumption results of the LCS, where gasoline and diesel contribute 51.4% and 16.4% of total energy consumption, respectively, followed to a lesser extent by kerosene, at 11.1%; sugarcane ethanol, at 9.8%; electric power, at 3.3%; LPG, at 3.1%; sorghum ethanol, at 1.2%; and jatropha biodiesel, at 1.0%. Fuel oil and NG contribute 0.18% and 0.04%, respectively. By year 2035, transport sector energy requirements total 3,468 PJ in the LCS, which represents a reduction of 41% compared to the BLS.
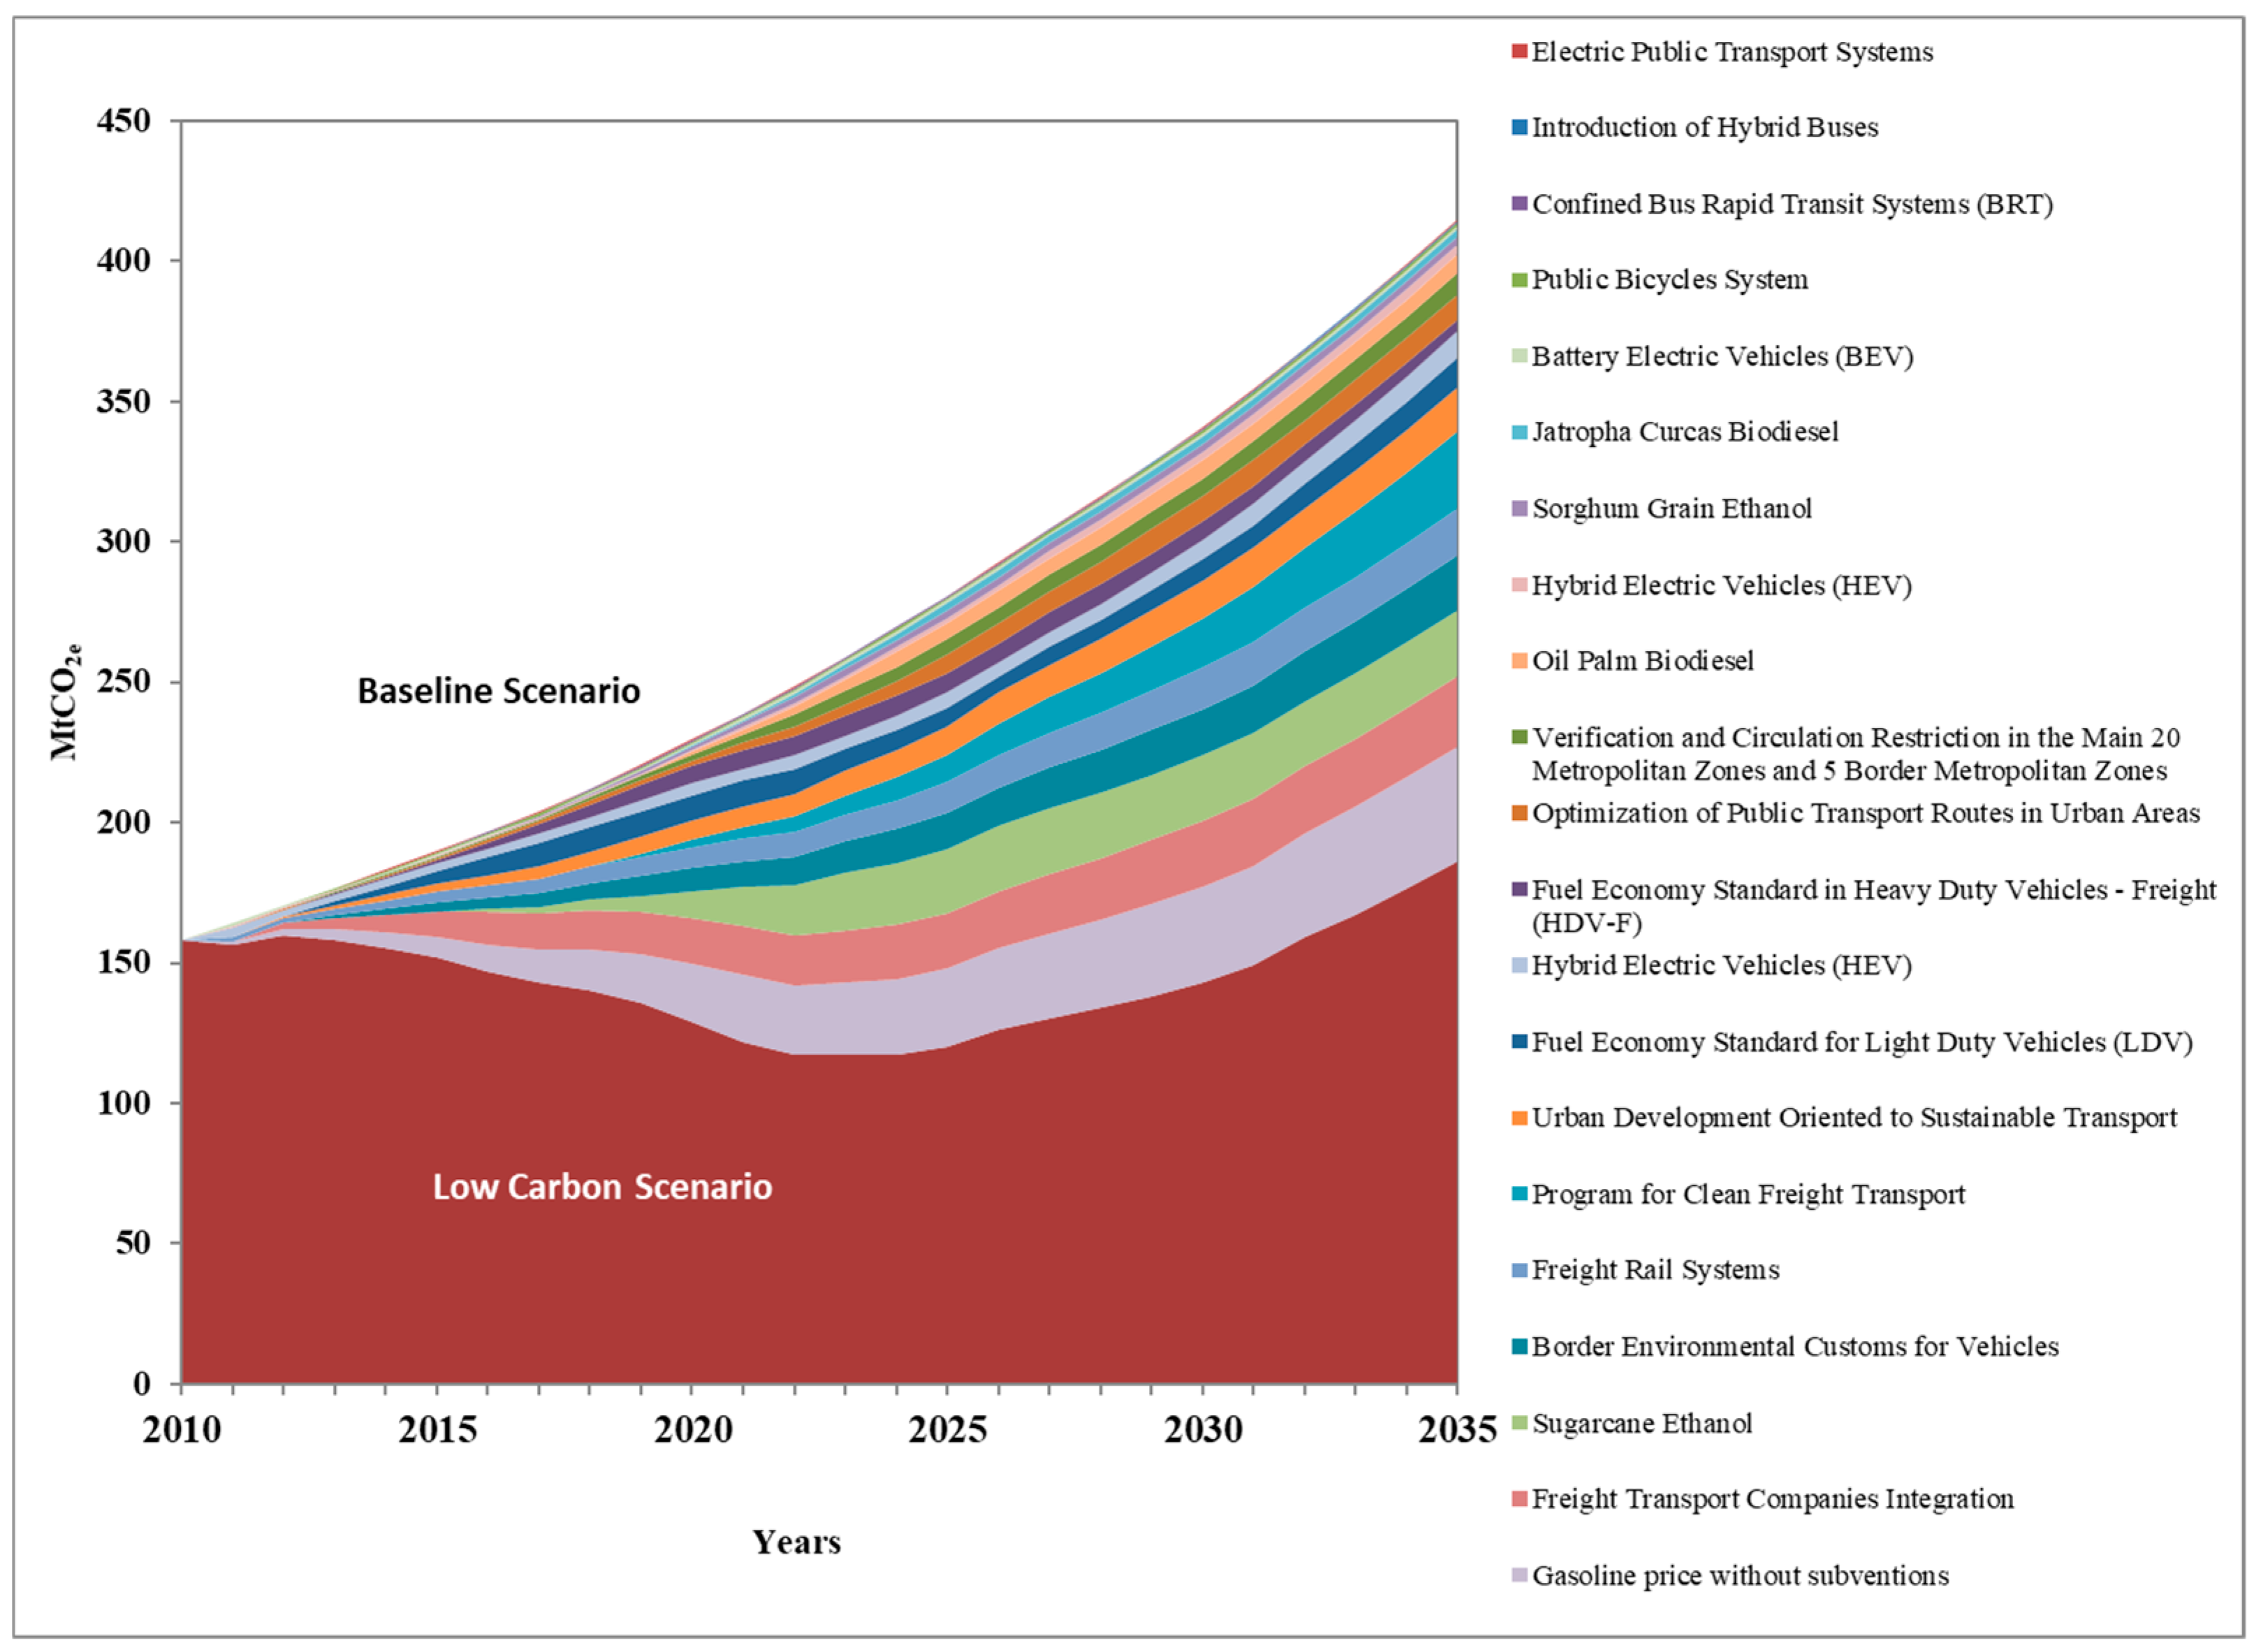
Figure 7 shows results of the GHG reductions in the LCS scenario. In terms of energy efficiency measures, gasoline price without subventions contributes most, at 571 MtCO2e, followed by the integration of transport companies, at 415 MtCO2e; Customs vehicular environmental in the border, at 259 MtCO2e; rail systems for cargo, at 236 MtCO2e; federal clean transportation program, at 226 MtCO2e; sustainable oriented transport development, at 210 MtCO2e; performance standard for light vehicles, at 120 MtCO2e; performance standard for cargo vehicles, at 116 MtCO2e; optimization of public transportation routes, at 98 MtCO2e; verification and restriction of traffic in the main 20 metropolitan zones and 5 border metropolitan zones, at 17 MtCO2e; public bicycle system, at 9 MtCO2e; rapid transport systems, at 5 MtCO2e; introduction of hybrid buses, at 5 MtCO2e and, finally, public transport electric systems, at 3 MtCO2e.
Regarding biofuels’ use, the one that reduces GHG most is sugarcane ethanol, at 355 MtCO2e, followed by palm oil biodiesel, at 82 MtCO2e; ethanol from sorghum grain, at 43 MtCO2e; and biodiesel from Jatropha curcas, at 35 MtCO2e.
Regarding the new electric motor technologies, the HEV reduces GHG by 127 MtCO2e, followed by the PHEV, at 45 MtCO2e; and, finally, the BEV, at 23 MtCO2e.
To summarize, the cumulative total of the emissions avoided in the analysis period amounted to 3165.9 MtCO2e in the LCS, which represents a total mitigation potential of 46.3% when compared to the emissions from the BLS. At 2035 levels, 229 MtCO2e are mitigated, which corresponds to a 59.3% GHG emissions’ reduction relative to a BLS.
The resulting 10 best GHG mitigation measures in the Mexican transport sector, representing a total of 85% of avoided emissions, are: the gasoline price without subventions, at 18.0%; freight transport companies integration, at 13.1%; sugarcane ethanol, at 11.2%; border environmental customs for vehicles, at 8.2%; freight rail systems, at 7.5%; program for clean freight transport, at 7.1%; urban development oriented to sustainable transport, at 6.6%; fuel economy standard for LDV, at 5.4%; HEV, at 4.0%; and, finally, fuel economy standard in freight HDV, at 3.8%.
Considering the classification from the study by [6], in relation to an ambitious transport sector low carbon scenario in India, and adding our results according to this classification, Table 11 was developed in order to compare our results for Mexico with that of this author.
According to the percentage data shown in the mentioned table, in the mitigation measures related to sustainable mobility, our results are similar with respect to the mentioned study. The same can be said about the measures that concern the fuel economy, however, the set of mitigation measures of our work is more ambitious regarding freight logistic and biofuels measures of the low-carbon scenario carried out for the India’s transport sector, achieving in the first case a higher mitigation by a factor of 5 and in the second case, higher by a factor of 3, in percentage terms. Finally, it is observed that our measures concerning electric vehicles have less ambition to mitigate in the Mexican transport sector than that established for the study of India mentioned, being smaller by a factor of almost 6, in percentage terms.
In global terms, the two low-carbon scenarios of the two countries show important similarities in terms of ambition to mitigate. When comparing CO2 reductions in year 2035 in percentage terms, we can observe that the mitigation potential identified for Mexico represents a 56% of CO2 reduction when compared to the BLS, while for the case of India, this CO2 reduction is 51% compared to a baseline scenario.
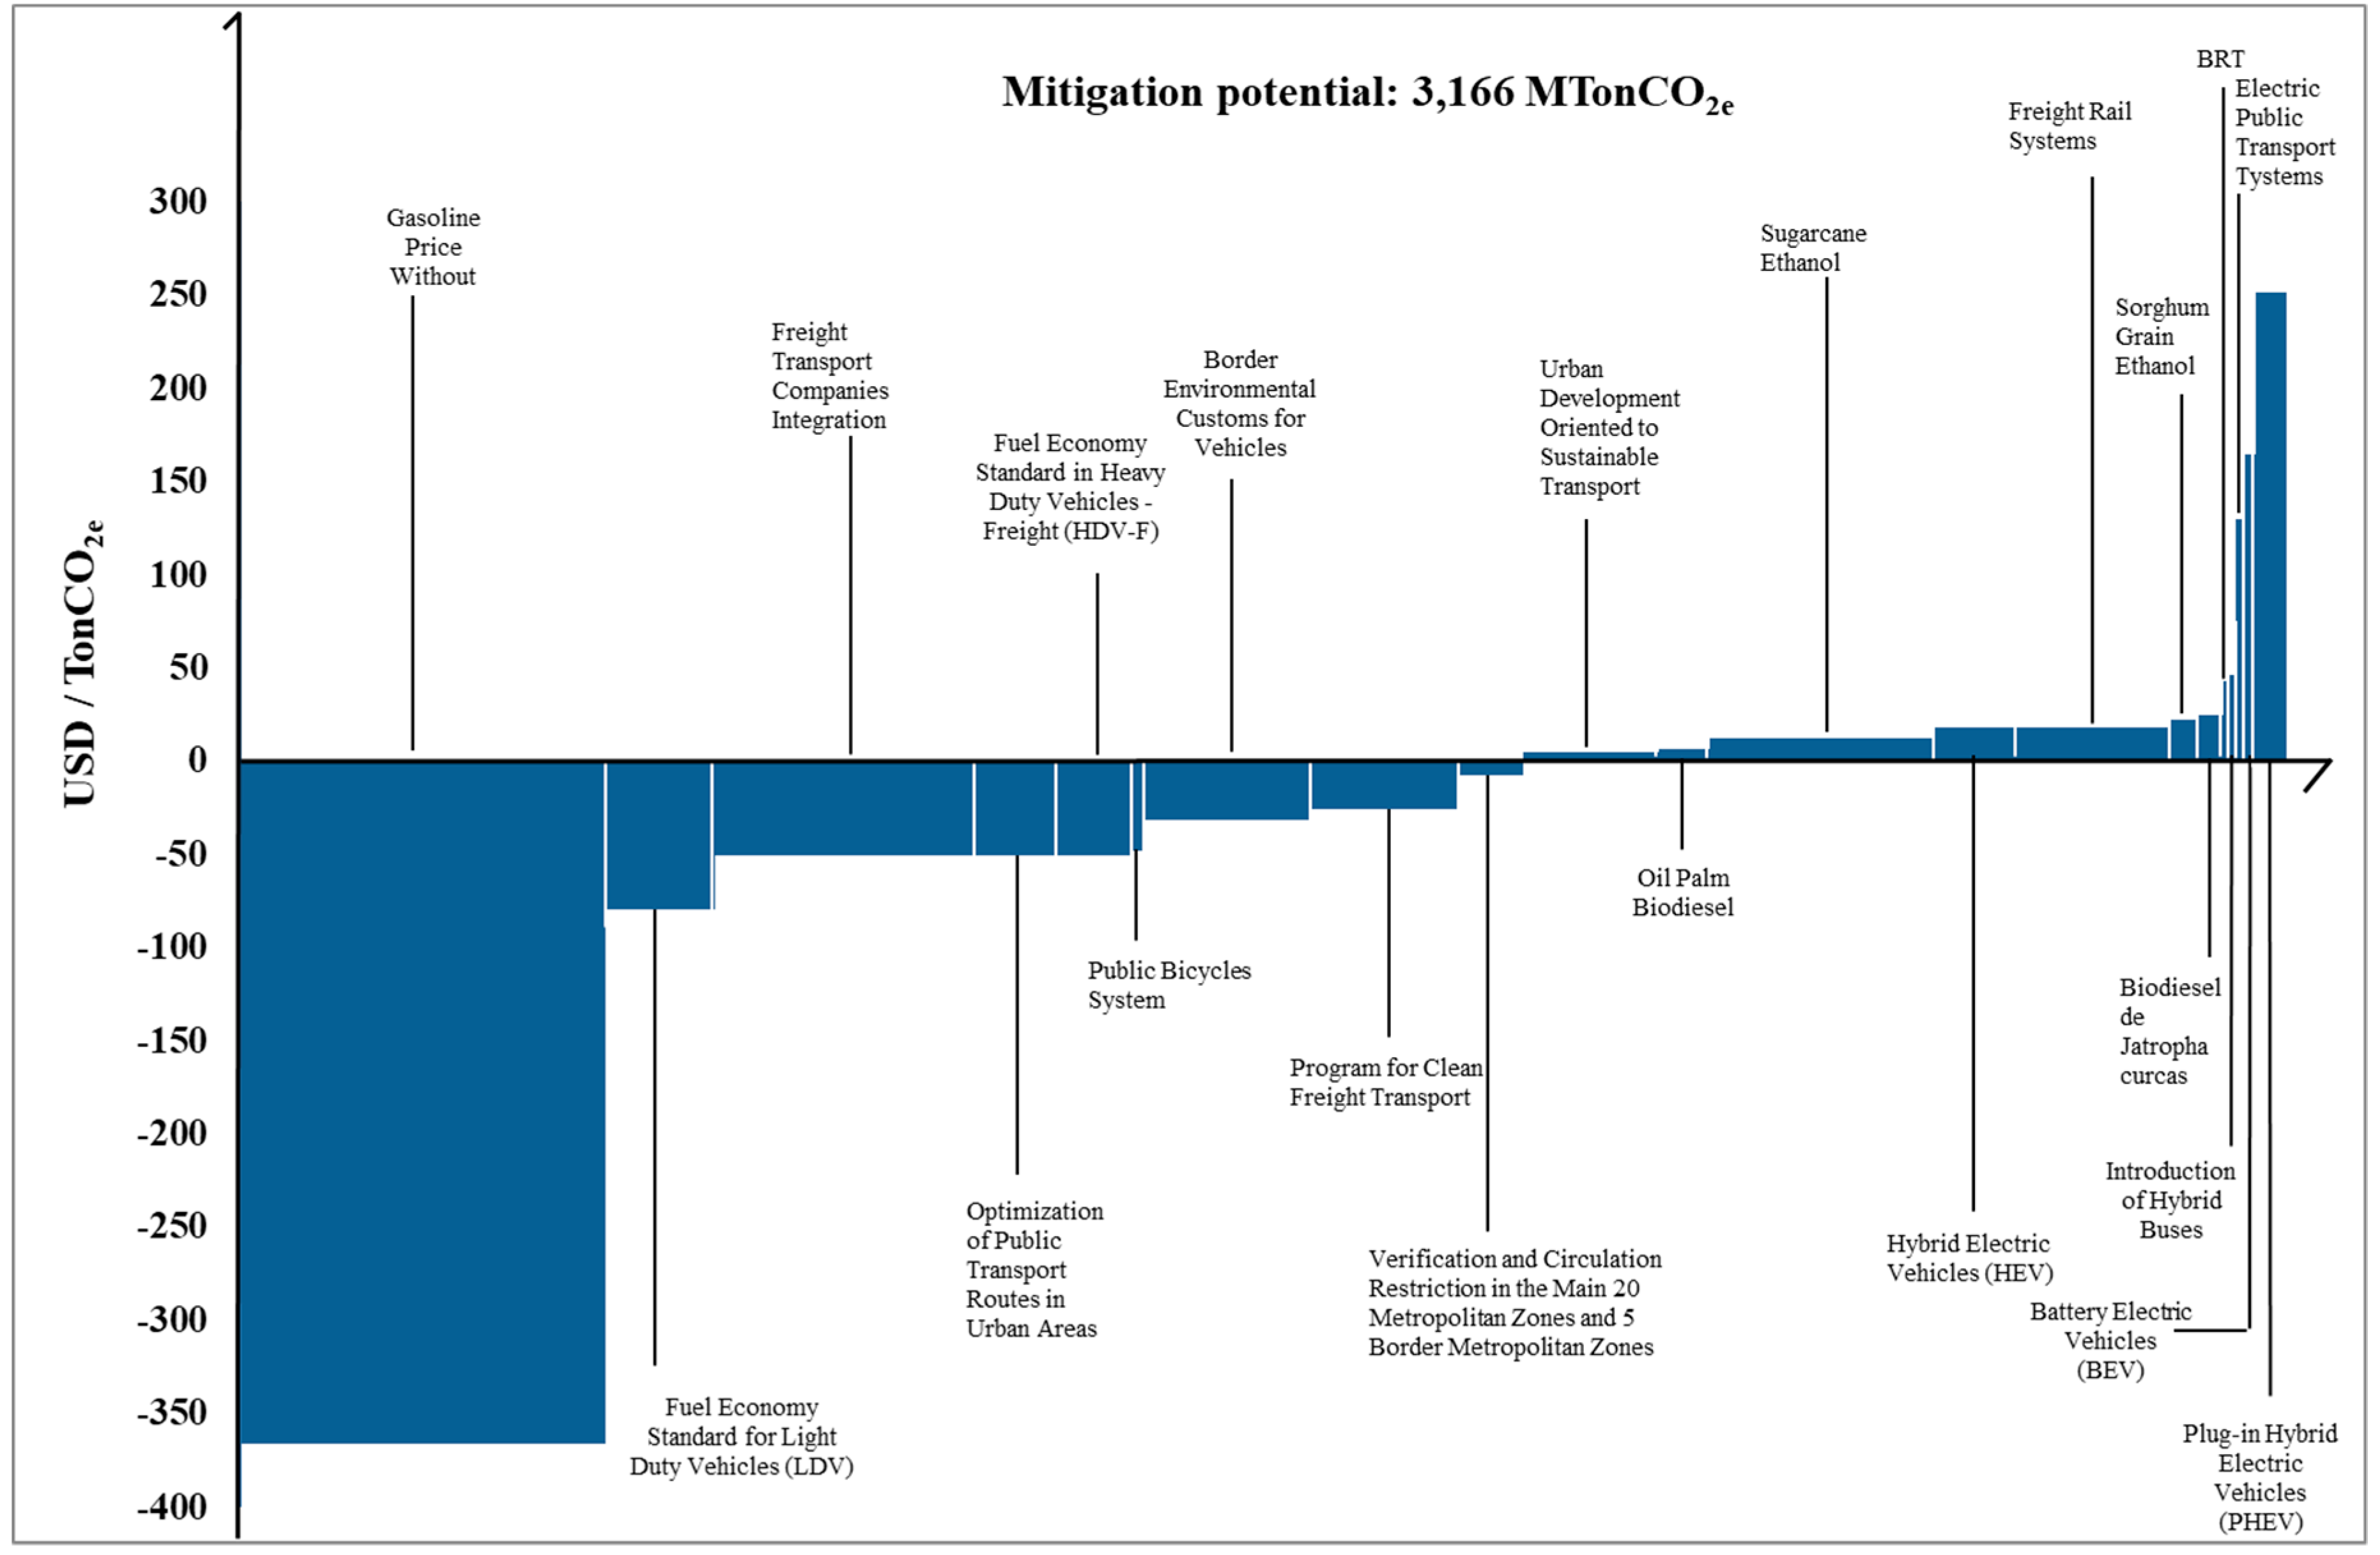
Table 12 shows the results of the incremental costs of investment, maintenance, avoided fuel, avoided subsidies, co-benefits, cost-benefit, mitigation cost, and avoided emissions from the 21 mitigation measures considered. According to this table, only 11 measures have a net investment cost; these are Introduction of hybrid buses, electric public transport systems, confined BRT systems, urban development oriented to sustainable transport, in addition to all measures corresponding to the use of liquid biofuels and those of new electric mobility technologies.
The rest of the measures considered have no net investment cost, and they have benefits; these are fuel economy standard for LDVs, gasoline price without subventions, verification and circulation restriction in the main 20 metropolitan zones and five border metropolitan zones, fuel economy standard in HDV-F, border environmental customs for vehicles, optimization of public transport routes in urban areas, public bicycles system, program for clean freight transport, and freight transport companies’ integration. To summarize, the 21 measures studied represent an investment cost of 13,135 MUSD, a maintenance cost of 6867 MUSD and an avoided fuel cost of −120,209 MUSD. From the economic analysis results a cost-benefit of −271,265 MUSD and mitigation costs from −366 to −7 USD/tCO2e. Finally, the cumulative mitigation potential is 1994 MtCO2e.
Figure 8 shows the marginal cost curve of the measures analyzed and, in turn, indicates a route to follow for the implementation of mitigation measures based mainly on those that have no cost but have great potential for reducing emissions, which could initiate a transition toward a low carbon transport sector.

8. Conclusions

In this article, a low carbon scenario (LCS) is proposed for the Mexican transport sector through the integration of 21 greenhouse gas (GHG) mitigation measures. As a result, we have an LCS that describes a transport sector transformation path characterized by structural changes in passenger and freight mobility; use of new mobility technologies, with electric motors; biofuels’ introduction; price signals; and changes in transport practices, emission regulations, and urban planning.
The economic and environmental analysis of joint and parallel implementation of the selected mitigation measures shows, in year 2035, accumulated benefits for −240,772 MUSD, an average mitigation cost of −76.0 USD / tCO2e, and an accumulated value of GHG emissions’ reduction of 3166 MtCO2e (equivalent to a reduction of accumulated GHG emissions of 46.3% when compared to BLS, an average annual reduction of 126.7 MtCO2, and a 59.3% reduction of GHG emissions relative to the BLS in the year 2035). We believe that the GHG reductions’ portfolio of mitigation measures analyzed in this article will help Mexico, and other countries in the world, to establish more robust, more ambitious, and faster energy transitions to limit GHG emissions in this key sector to restrain global climate change. However, this article shows that the great challenge is to raise the significant investment required to achieve this energy transition in a very capital-intensive sector such as the transport sector, as shown by the Mexican case, where an accumulated investment of 64,326 MUSD is needed to establish a low carbon transport sector that will contribute to the actions to restrain climate change.
These results should be considered carefully since the interaction between the 21 mitigation measures is limited and restricted to one or two modes of transport at best, and the possible additivity effects of these measures were not studied and considered in this article. The representations of the measures were consequently assumed of linear nature, so our results turn out to be conservative and do not necessarily represent what could happen in the real-world transport systems. Taking into account the additive effects of the 21 mitigation measures analyzed, which would reflect the greater interactivity between transport systems and their non-linear nature, would result in an improvement in the overall results (cumulative emissions, emissions to the year 2035, cost-benefit, mitigation costs and investments) that we have presented in this article.

Supplementary Materials

The following are available online at https://www.mdpi.com/1996-1073/13/1/84/s1, Figure S1: Degradation factor in the use intensity per vehicle age, Table S1: Age composition of imported used vehicles per year of entry.

Author Contributions

J.M.I.-S. and F.M. conceived the presented study. Jorge Islas developed energy, economic and environmental assessment methodology, G.K.G.-A. performed the computations in LEAP, Jorge Islas supervised the study, F.M. wrote the original manuscript, J.M.I.-S. and F.M. performed the formal analysis of the mitigation measures. All authors discussed the results and contributed to the final manuscript.

Funding

Authors thank SENER CONACyT Energy Sustainability Fund projects 117808 and 246911.

Acknowledgments

Authors thank María de Jesús Pérez Orozco for the technical support in scenario simulation using LEAP model. Also, we thank to the editor Johnson Wang and the three anonymous reviewers for their valuable commentaries.

Conflicts of Interest

The authors, Jorge M. Islas-Samperio, Fabio Manzini and Genice K. Grande-Acosta declare no conflict of interest, also we declare that the funders had no role in the design of the study; in the collection, analyses, or interpretation of data; in the writing of the manuscript, an in the decision to publish the results.

References

  1. World Research Institute (WRI). CAIT Climate Data Explorer. 2015. Available online: http://cait.wri.org (accessed on 11 August 2017).
  2. International Energy Agency (IEA). World Energy Outlook 2016. 2016. Available online: https://www.iea.org/publications/freepublications/publication/WorldEnergyOutlook2016ExecutiveSummaryEnglish.pdf (accessed on 15 June 2018).
  3. International Energy Agency (IEA). Statistics Key CO Emissions Trends. Excerpt from CO2 Emissions From Fuel Combustion. 2016. Available online: http://www.iea.org/publications/freepublications/ (accessed on 18 November 2018).
  4. Melaina, M.; Heath, G.; Sandor, D.; Steward, D.; Vimmerstedt, L.; Warner, E.; Webster, K.W. Alternative Fuel Infrastructure Expansion: Costs, Resources, Production Capacity, and Retail Availability for Low-Carbon Scenarios. Transportation Energy Futures Series; U.S. Department of Energy by National Renewable Energy Laboratory: Golden, CO, USA, 2013. Available online: https://www.nrel.gov/docs/fy13osti/55640.pdf (accessed on 15 October 2019).
  5. Hao, H.; Geng, Y.; Li, W.; Guo, B. Energy Consumption and GHG Emissions from China’s Freight Transport Sector: Scenarios through 2050. Energy Policy 2015, 85, 94–101. [Google Scholar] [CrossRef]
  6. Dhar, S.; Shukla, P.R. Low Carbon Scenarios for Transport in India: Co-Benefits Analysis. Energy Policy 2015, 81, 186–198. [Google Scholar] [CrossRef] [Green Version]
  7. Schmid, E.; Knopf, B. Ambitious Mitigation Scenarios for Germany: A Participatory Approach. Energy Policy 2012, 51, 662–672. [Google Scholar] [CrossRef]
  8. World Resources Institute (WRI). Climate Watch; World Resources Institute: Washington, DC, USA, 2018; Available online: https://www.climatewatchdata.org/ghg-emissions (accessed on 18 October 2019).
  9. International Transport Forum (ITF); Organisation for Economic Co-Operation and Development (OECD). Transport Greenhouse Gas Emissions: Country Data 2010. 2011. Available online: https://www.itf-oecd.org/sites/default/files/docs/10ghgcountry.pdf (accessed on 19 October 2019).
  10. Instituto Nacional de Ecología y Cambio Climático (INECC). Inventario Nacional de Gases y Compuestos de Efecto Invernadero. Tabla del INEGyCEI 1990–2015. 2018. Available online: http://www.inecc.gob.mx/descargas/cclimatico/INEGEI_2014_EMISIONES_QUEMA_COMBUSTIBLES_FOSILES_1.pdf (accessed on 26 March 2018).
  11. Diario Oficial de la Federación (DOF). NOM-163-SEMARNAT-ENER-SCFI-2013, Emisiones de Bióxido de Carbono (CO2) Provenientes del Escape y su Equivalencia en Términos de Rendimiento de Combustible, Aplicable a Vehículos Automotores Nuevos de peso Bruto Vehicular de Hasta 3857 kg. 2013. Available online: http://dof.gob.mx/nota_detalle.php?codigo=5303391&fecha=21/06/2013 (accessed on 19 June 2019).
  12. Secretaría de Medio Ambiente y Recursos Naturales (SEMARNAT). El Cambio Climático en México y El Potencial de Reducción de Emisiones Por Sectores; Secretaría de Medio Ambiente y Recursos Naturales (SEMARNAT): Mexico City, Mexico, 2008. [Google Scholar]
  13. Johnson, T.; Alatorre, C.; Romo, Z.; Liu, F. Mexico: Estudio Sobre La Disminución de Emisiones de Carbono; The International Bank: Washington, DC, USA, 2009; p. 185. [Google Scholar]
  14. Solís Ávila, J.C.; Sheinbaum Pardo, C. Consumo de Energía y Emisiones de CO2 del Autransporte En México y Escenarios de Mitigación. Rev. Int. Contam. Ambient. 2016, 32, 7–23. [Google Scholar]
  15. Instituto Nacional de Ecología y Cambio Climático (INECC). Costos de las Contribuciones Nacionalmente Determiandas de México. Medidas Sectoriales no Condicionadas. 2018. Available online: https://www.gob.mx/cms/uploads/attachment/file/330857/Costos_de_las_contribuciones_nacionalmente_determinadas_de_M_xico__dobles_p_ginas_.pdf (accessed on 19 June 2019).
  16. Gobierno de la República. Intended Nationally Determined Contribution. Gobierno de la República, México. Available online: https://www.gob.mx/cms/uploads/attachment/file/162973/2015_indc_ing.pdf (accessed on 20 October 2019).
  17. García, C.; Manzini, F.; Islas, J. Air Emissions Scenarios from Ethanol as a Gasoline Oxygenate in Mexico City Metropolitan Area. Renew. Sustain. Energy Rev. 2010, 14, 3032–3040. [Google Scholar] [CrossRef]
  18. Lozada, I.; Islas, J.; Grande, G. Environmental and Economic Feasibility of Palm Oil Biodiesel in the Mexican Transportation Sector. Renew. Sustain. Energy Rev. 2010, 14, 486–492. [Google Scholar] [CrossRef]
  19. García, C.; Manzini, F. Environmental and Economic Feasibility of Sugarcane Ethanol for the Mexican Transport Sector. Sol. Energy 2012, 86, 1063–1069. [Google Scholar] [CrossRef]
  20. García, C.; Riegelhaupt, E.; Masera, O. Escenarios de Bioenergía En México: Potencial de Sustitución de Combustibles Fosiles y Mitigación de GEI. Rev. Mex. Física 2013, 59, 93–103. [Google Scholar]
  21. Manzini, F. Inserting Renewable Fuels and Technologies for Transport in Mexico City Metropolitan Area. Int. J. Hydrog. Energy 2006, 31, 327–335. [Google Scholar] [CrossRef]
  22. Argelia, M.; Margarito, Q.; Moisés, G. Análisis de Las Estrategias de Mitigación y Adaptación Del Sector Transporte En La Ciudad de Mexicali. Estud. Front. 2013, 14, 79–105. [Google Scholar]
  23. Jazcilevich, A.D.; Reynoso, A.G.; Grutter, M.; Delgado, J.; Ayala, U.D.; Lastra, M.S.; Zuk, M.; Oropeza, R.G.; Lents, J.; Davis, N. An Evaluation of the Hybrid Car Technology for the Mexico Mega City. J. Power Sour. 2011, 196, 5704–5718. [Google Scholar] [CrossRef]
  24. Secretaría de Energía (SENER). Balance Nacional de Energía 2014. 2015. Available online: https://www.gob.mx/cms/uploads/attachment/file/44353/Balance_Nacional_de_Energ_a_2014.pdf (accessed on 15 August 2018).
  25. Instituto Nacional de Estadística y Geografía (INEGI). Vehículos de Motor Registrados en Circulación. 2018. Available online: https://www.inegi.org.mx/sistemas/olap/Proyectos/bd/continuas/transporte/vehiculos.asp?s=est# (accessed on 6 June 2018).
  26. Instituto Mexicano del Petróleo (IMP). Información de Autotransporte para la Prospectiva Energética; Dirección de Estudios Económicos; Instituto Mexicano del Petróleo (IMP): Mexico City, Mexico, 2011. [Google Scholar]
  27. Secretaría de Energía (SENER). Prospectiva de Petrolíferos 2010–2025; Secretaría de Energía (SENER): Mexico City, Mexico, 2011.
  28. Secretaría de Energía (SENER). Prospectiva del Sector Eléctrico 2010–2025, México; Secretaría de Energía (SENER): Mexico City, Mexico, 2011.
  29. Secretaría de Energía (SENER). Sistema de Información Energética; Precios de los Petróliferos. 2011. Available online: http://sie.energia.gob.mx (accessed on 24 January 2011).
  30. US Energy Information Administration (US EIA). Petroleum and Other Liquids. 2011. Available online: http://tonto.eia.doe.gov/dnav/pet/hist/LeafHandler.ashx?n=pet&s=eer_epd2dxl0_pf4_rgc_dpg&f=a (accessed on 27 January 2011).
  31. Comisión Federal de Electricidad (CFE). Evolución de Precios Entregados y Fletes de Combustibles 2003–2004, México; Comisión Federal de Electricidad (CFE): Mexico City, Mexico, 2005. [Google Scholar]
  32. Secretaría de Energía (SENER). Pronóstico de Precios de los Petrolíferos; Secretaría de Energía (SENER): Mexico City, Mexico, 2005.
  33. Comisión Federal de Electricidad (CFE). Costos y Parámetros de Referencia para la Formulación de Proyectos de Inversión; Generación; Escenario de Precios Medio; Subdirección de Programación, Comisión Federal de Electricidad: Mexico City, México, 2012. [Google Scholar]
  34. US Energy Information Administration (US EIA). World Energy Outlook 2010. 2010. Available online: https://www.iea.org/publications/freepublications/publication/weo2010.pdf (accessed on 15 December 2010).
  35. Heaps, C. Long-Range Energy Alternatives Planning (LEAP) System; Version 2008.0.0.33 2008; Environment Institute: Stockholm, Sweden, 2008. [Google Scholar]
  36. Centro de Transporte Sustentable; Instituto de Energías Renovables; Universidad Nacional Autónoma de México (CTS-IER-UNAM). Sector Transporte: Identificación de Acciones y Medidas de Mitigación de GEI. Evaluación Económica y Ambiental de Escenarios al 2030 de la Inserción de Fuentes Alternas de Eficiencia Energética en el Sistema Energético Mexicano en Base a Potencial de Reducción de GEI, Reporte Final para CONACYT-SENER Sustentabilidad—Energética; Proyecto No. 117808; Centro de Transporte Sustentable: Mexico City, Mexico; Instituto de Energías Renovables: Temixco, Mexico; Universidad Nacional Autónoma de México: Mexico City, Mexico, 2013. [Google Scholar]
  37. García, C.A.; Riegelhaupt, E.; Ghilardi, A.; Skutsch, M.; Islas, J.; Manzini, F.; Masera, O. Sustainable bioenergy options for Mexico: GHG mitigation and costs. Renew. Sustain. Energy Rev. 2015, 43, 545–552. [Google Scholar] [CrossRef]
  38. Secretaría de Energía (SENER). Balance Nacional de Energía 2010; Secretaría de Energía (SENER): Mexico City, Mexico, 2011.
  39. Centro de Estudios Sociales y de Opinión Pública (CESOP). Los Vehículos Usados de Procedencia Extranjera en México. Cámara de Diputados, LX Legislatura, México. 2012. Available online: https://www.google.com/url?sa=t&rct=j&q=&esrc=s&source=web&cd=1&ved=2ahUKEwj9z5-Wt9vlAhVHnp4KHQ6nCoEQFjAAegQIARAC&url=http%3A%2F%2Fwww3.diputados.gob.mx%2Fcamara%2Fcontent%2Fdownload%2F293625%2F956425%2Ffile%2FVehiculos-usados-extranjeros-docto142.pdf&usg=AOvVaw0nimoK2k_w27RMfxejLk6a (accessed on 10 October 2019).
  40. Intergovernmental Panel on Climate Change (IPCC). Guidelines for National Greenhouse Gas Inventories. Chapter 2: Stationary Combustion. 2006. Available online: https://www.ipcc-nggip.iges.or.jp/public/2006gl/pdf/2_Volume2/V2_2_Ch2_Stationary_Combustion.pdf (accessed on 12 June 2018).
  41. Centro de Transporte Sustentable de México (CTS). Modelo de Evaluación Económica para Norma de Eficiencia en Vehículos Ligeros; EMBARQ-CTS México: Mexico City, Mexico, 2011. [Google Scholar]
  42. Federal Register. Rules and Regulations. On Line via the Government Publishing Office; 2011. Available online: https://www.epa.gov/regulations-emissions-vehicles-and-engines/regulations-greenhouse-gas-emissions-passenger-cars-and (accessed on 3 October 2019).
  43. Haro, R.A.; Ibarrola, J.L. Cálculo de la elasticidad precio de la demanda de gasolina en la zona fronteriza norte de México. Gac. Econ. 2000, 6, 237–262. [Google Scholar]
  44. Secretaría del Medio Ambiente y Recursos Naturales (SEMARNAT). Importación Definitiva de Vehículos Usados. Consecuencias e Impactos Ambientales. 2008. Available online: http://207.248.177.30/mir/uploadtests/24183.177.59.1.Importaci%C3%B3n_de_veh%C3%ADculos_usados_Versi%C3%B3n_Noviembre_2008.pdf (accessed on 31 May 2013).
  45. Secretaría de Desarrollo Social, Consejo Nacional de Población (SEDESOL-CONAPO). Catálogo. Sistema Urbano Nacional 2012. 2012. Available online: https://www.gob.mx/cms/uploads/attachment/file/112772/Catalogo_Sistema_Urbano_Nacional_2012.pdf (accessed on 15 March 2015).
  46. Gobierno de Querétaro. Plan Integral de Transporte Colectivo de la Zona Metropolitana de Querétaro; Reporte Técnico; Gobierno de Querétaro: Querétaro, México, 2005. [Google Scholar]
  47. Macías, J.; Martínez, H.; Unal, A. Bus Technology Analysis; CTS-EMBARQ: Mexico City, Mexico, 2007. [Google Scholar]
  48. Gobierno de la Ciudad de México. Operación. Cronología del Metro. 2019. Available online: https://www.metro.cdmx.gob.mx/cronologia-del-metro (accessed on 26 September 2019).
  49. Environmental Protection Agency (EPA). Draft Regulatory Impact Analysis. Proposed Rulemaking to Establish Greenhouse Gas Emissions Standards and Fuel Efficiency Standards for Medium- and Heavy-Duty Engines and Vehicles. 2010. Available online: https://tinyurl.com/y3mvr9re (accessed on 30 September 2019).
  50. Centro de Transporte Sustentable de México (CTS). Hacia Ciudades Competitivas Bajas en Carbono; Centro de Transporte Sustentable: Mexico City, Mexico, 2011. [Google Scholar]
  51. Secretaría de Desarrollo Social; Consejo Nacional de Población; Instituto Nacional de Estadística; Geografía e Informática (SEDESOL-CONAPO-INEGI). Delimitación de las Zonas Metropolitanas de México 2005. 2007. Available online: http://www.conapo.gob.mx/work/models/CONAPO/zonas_metropolitanas/completoZM2005.pdf (accessed on 20 October 2019).
  52. Secretaría de Desarrollo Social; Consejo Nacional de Población; Instituto Nacional de Estadística; Geografía e Informática (SEDESOL, CONAPO, INEGI). Delimitación de las Zonas Metropolitanas de México 2010. 2012. Available online: https://www.gob.mx/cms/uploads/attachment/file/112786/1_DZM_2010_PAG_1-34.pdf (accessed on 15 October 2019).
  53. Instituto del Fondo Nacional de la Vivienda para los Trabajadores (INFONAVIT). Infonavit. Resultados y Perspectivas. Programas y Acciones de Financiamiento al Sector de la Vivienda. 2011. Available online: http://www.shcp.gob.mx/ApartadosHaciendaParaTodos/banca_desarrollo/vivienda/5_infonavit_11012011_perspectivas_sector_vivienda.pdf (accessed on 23 October 2013).
  54. Instituto del Fondo Nacional de la Vivienda para los Trabajadores (INFONAVIT). Plan Financiero 2016–2020. 2015. Available online: https://portal.infonavit.org.mx/ (accessed on 23 October 2016).
  55. Instituto Nacional de Geografia y Estadistica (INEGI). Encuesta Origen-Destino de la Zona Metropolitana del Valle de Mexico 2007. 2007. Available online: https://es.slideshare.net/borisdahl/encuesta-origen-destino-zmvm-2007 (accessed on 12 March 2014).
  56. Secretaría de Comunicaciones y Transporte (SCT). Programa Nacional de Infraestructura 2007–2012. 2007. Available online: http://www.sct.gob.mx/fileadmin/ProgramaNacional/pni.pdf (accessed on 12 November 2018).
  57. Secretaría de Comunicaciones y Transportes (SCT). Anuario Estadístico Ferroviario 2010. 2011. Available online: http://www.sct.gob.mx/fileadmin/DireccionesGrales/DGTFM/Anuarios_DGTFM/Anuarios_pdf/Anuario_2010.pdf (accessed on 20 August 2012).
  58. Ferromex. Equipos que Utilizamos para Mover tu Carga. Ferromex, 2015. Available online: https://www.ferromex.com.mx/ferromex-lo-mueve/flota.jsp (accessed on 15 May 2015).
  59. Secretaría de Comunicaciones y Transportes (SCT). Capítulo 4. Modos de Transporte. 2000. Available online: https://www.puertoensenada.com.mx/upl/sec/Capitulo_04_Modos_de_Transporte.pdf (accessed on 31 August 2015).
  60. Secretaría de Medio Ambiente y Recursos Naturales (SEMARNAT). Guía del Taller Transportista Eficiente (Como Ahorrar Diesel en el Autotransporte). 2010. Available online: https://www.gob.mx/cms/uploads/attachment/file/210345/Transportista_eficiente.pdf (accessed on 25 November 2015).
  61. Secretaría de Comunicaciones y Transportes; Instituto Mexicano del Transporte (SCT-IMT). Base de Datos del Estudio Estadístico de Campo del Autotransporte Nacional. 2011. Available online: https://www.imt.mx/micrositios/seguridad-y-operacion-del-transporte/estadisticas/consulta-del-eecan.html (accessed on 26 November 2015).
  62. Chen, L.; Stone, R.; Richardson, D. A study of mixture preparation and PM emissions using a direct injection engine fuelled with stoichiometric gasoline/ethanol blends. Fuel 2012, 96, 120–130. [Google Scholar] [CrossRef]
  63. US DOE. Vehicle Technologies Office. 2014. Available online: https://www.energy.gov/eere/vehicles/vehicle-technologies-office (accessed on 30 November 2014).
  64. Electric Power Research Institute (EPRI). Environmental Assessment of Plug-In Hybrid Electric Vehicles. Volume 1: Nationwide Greenhouse Gas Emissions. 2007. Available online: https://www.energy.gov/sites/prod/files/oeprod/DocumentsandMedia/EPRI-NRDC_PHEV_GHG_report.pdf (accessed on 10 January 2013).
  65. Bandivadekar, A.P. Evaluating the Impact of Advanced Vehicle and Fuel Technologies in US Light-Duty Vehicle Fleet. Ph.D. Thesis, Massachusetts Institute of Technology, Cambridge, MA, USA, 2008. [Google Scholar]
  66. Electric Power Research Institute (EPRI). Comparing the Benefits and Impacts of Hybrid Electric Vehicle Options. 2001. Available online: http://www.ourenergypolicy.org/wp-content/uploads/2011/11/2001_07_EPRI_ComparingHybridElectricVehicleOptions.pdf (accessed on 15 January 2013).
  67. Carlsson, F.; Johansson-Stenman, O. Costs and Benefits of Electric Vehicles. A 2010 Perspective. J. Transp. Econ. Policy 2003, 37, 1–28. [Google Scholar]
  68. McKinsey Global Institute. Resource Revolution: Meeting the World’s Energy, Materials, Food, and Water Needs. 2011. Available online: https://www.mckinsey.com/~/media/McKinsey/Business%20Functions/Sustainability/Our%20Insights/Resource%20revolution/MGI_Resource_revolution_full_report.ashx (accessed on 20 January 2013).
  69. International Energy Agency (IEA). World Energy Outlook 2007; International Energy Agency (IEA): Paris, France, 2007. [Google Scholar]
  70. International Energy Agency (IEA). World Energy Outlook 2009; International Energy Agency (IEA): Paris, France, 2009. [Google Scholar]
  71. International Energy Agency (IEA). World Energy Outlook 2010; International Energy Agency (IEA): Paris, France, 2010. [Google Scholar]
  72. US National Research Council (NRC). Transitions to Alternative Transportation Technologies—Plug-in Hybrid Electric Vehicles; US National Research Council (NRC): Washington, DC, USA, 2010.
  73. Grande-Acosta, G.; Islas-Samperio, J. Towards a Low-Carbon Electric Power System in Mexico. Energy Sustain. Dev. 2017, 37, 99–109. [Google Scholar] [CrossRef]
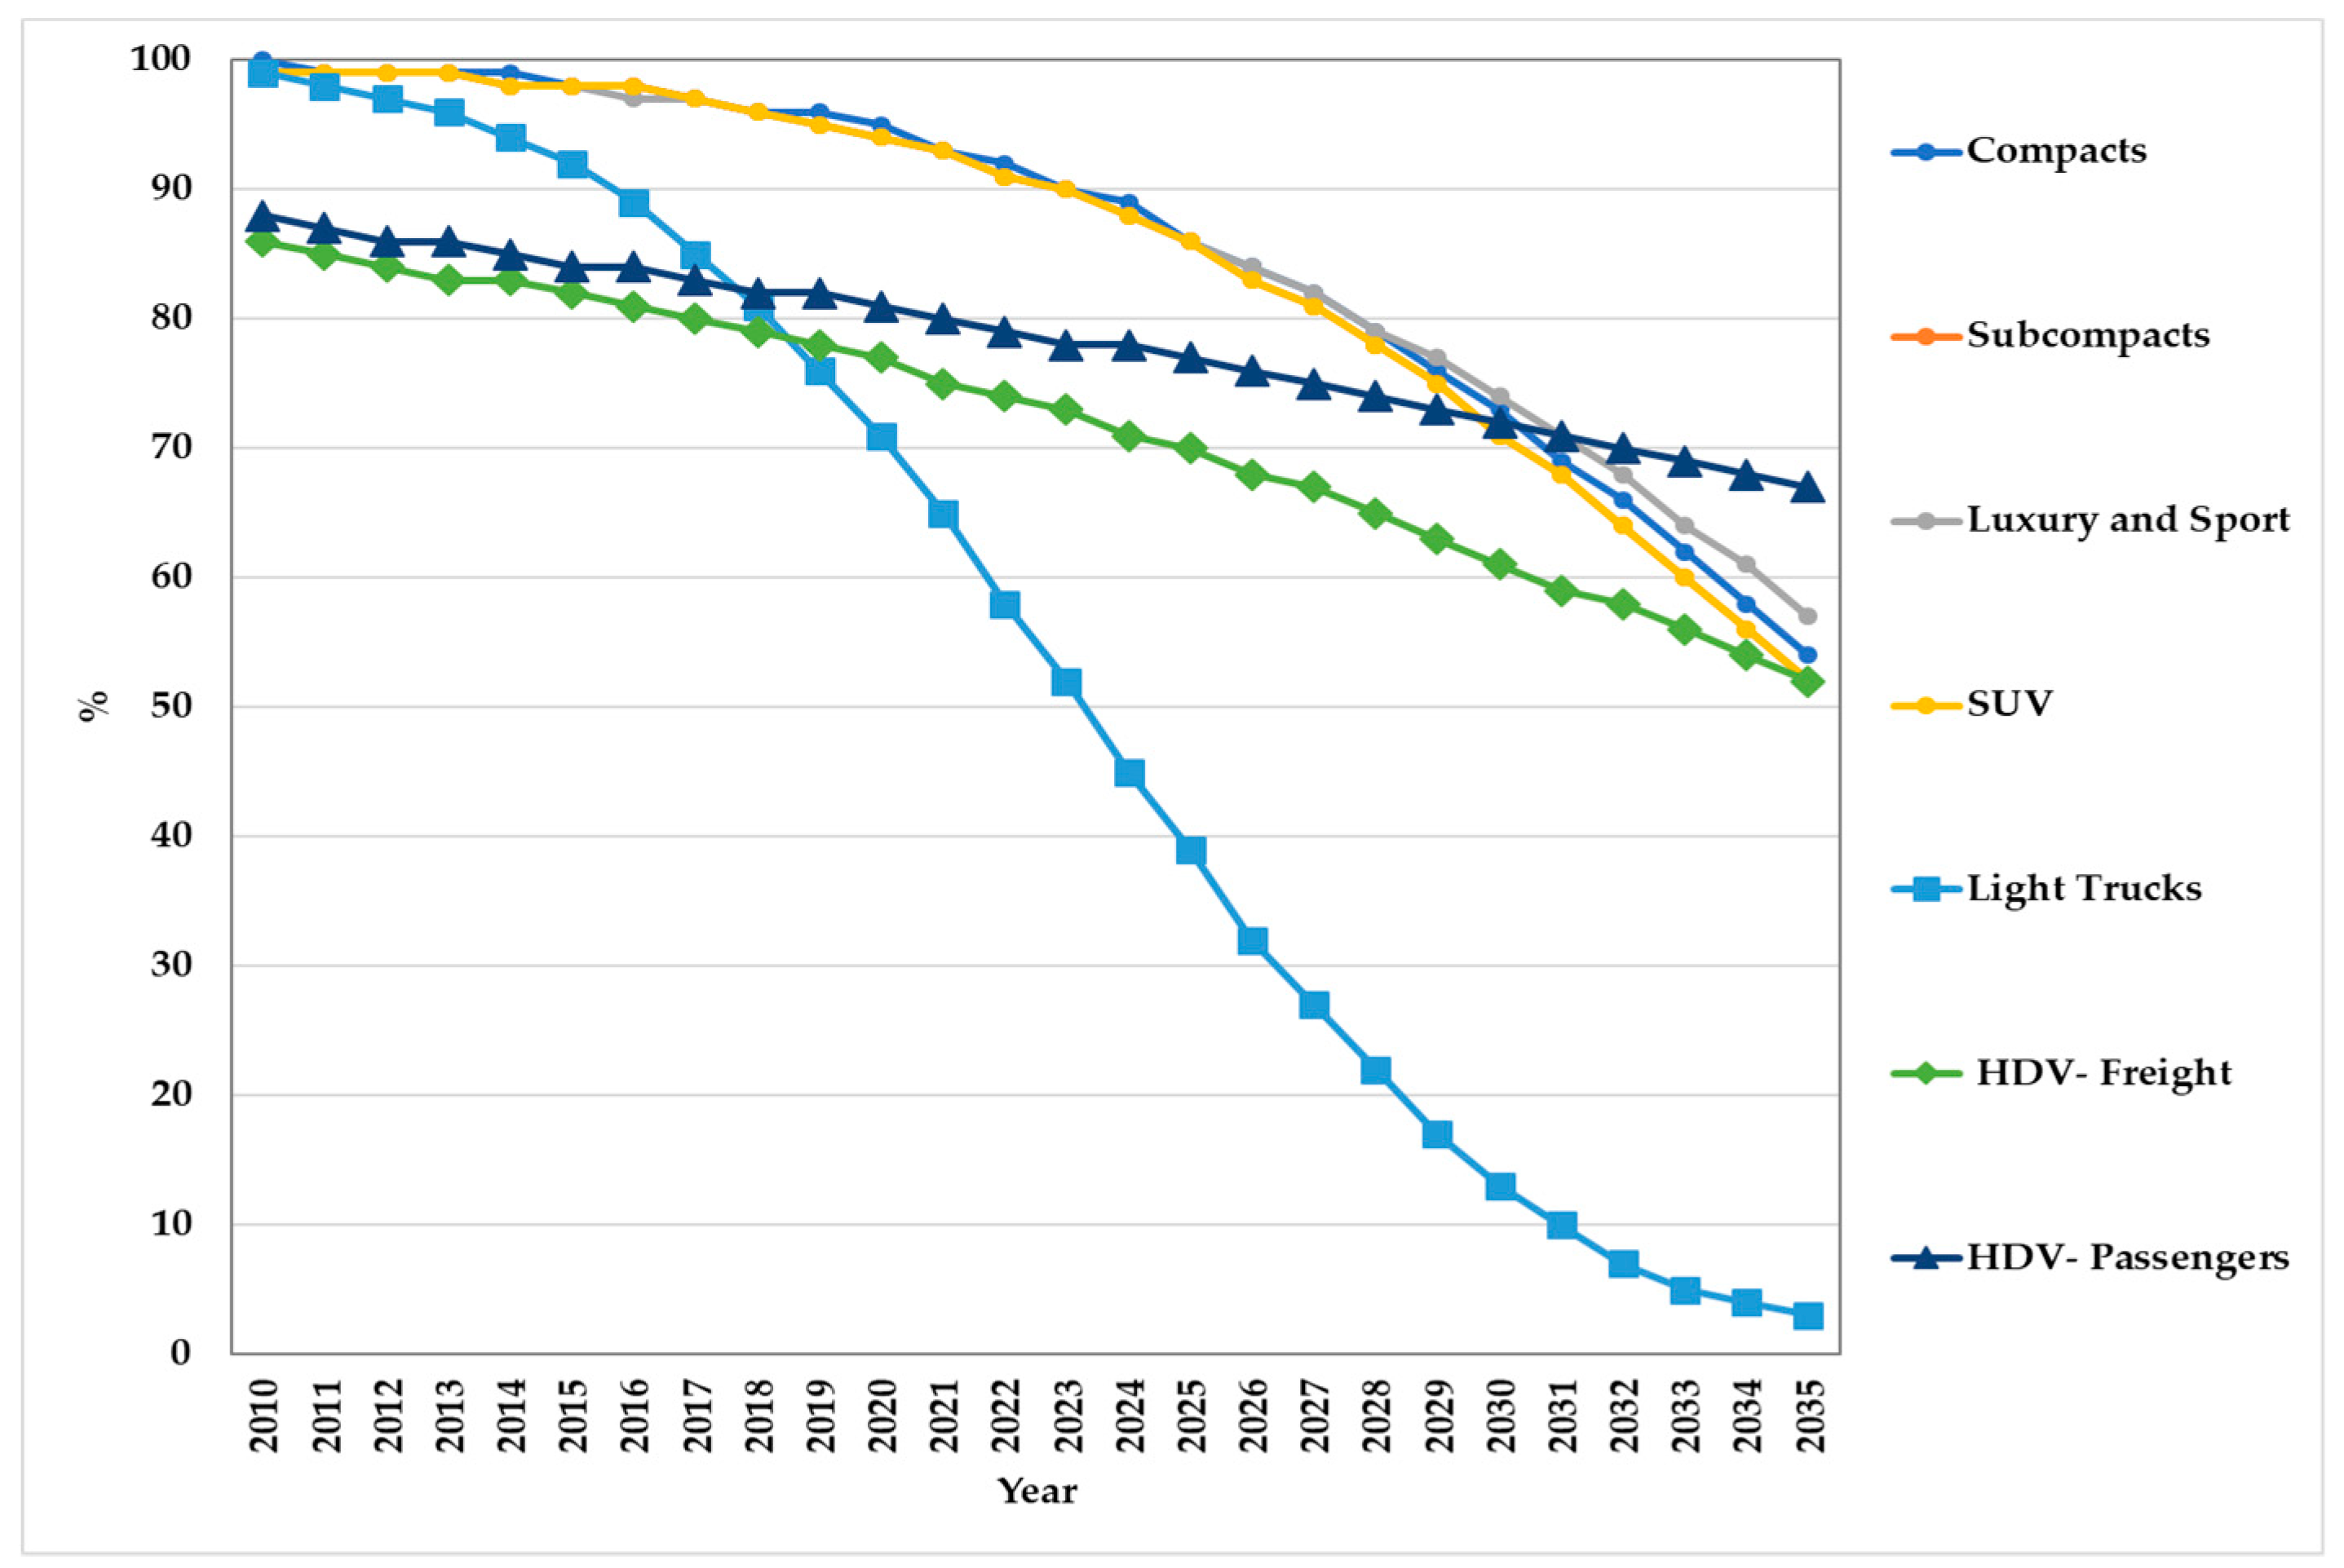
Figure 1. Survival curves by vehicle type. Source: [26].
Energies 13 00084 g001
Figure 2. Evolution of the Mexican vehicle fleet in the BLS.
Energies 13 00084 g002
Figure 3. Energy consumption by energy carrier in the BLS.
Energies 13 00084 g003
Figure 4. GHG emissions by energy carrier in the BLS.
Energies 13 00084 g004
Figure 5. Evolution of the Mexican vehicle fleet in the low carbon scenario.
Energies 13 00084 g005
Figure 6. Energy consumption by energy carrier in the LCS.
Energies 13 00084 g006
Figure 7. GHG emissions’ reduction by measure in the LCS.
Energies 13 00084 g007
Figure 8. Marginal abatement cost curve for transport sector in Mexico.
Energies 13 00084 g008
Table 1. Countries with the highest proportion of global greenhouse gas (GHG) emissions in the world transport sector and the high ambition GHG reduction prospective country studies in this sector.
Country (World Ranking GHG From Transport Sector) *GHG Transport Sector Emissions, 2014 * (MtCO2)GHG Road Transport/ GHG Total Transport Emissions, 2010 **ScenariosMeasures2035 GHG Reduction from Baseline or Base Year (MtCO2e)2035 GHG Reduction from Baseline or Base YearProspective Country Studies
USA (1)1,72979%271,59556%[4]
CHINA (2)78164%71133544%[5]
INDIA (3)23283%2534651%[6]
GERMANY (8)15578%3714888%[7]
* [8]; ** [9]. Source: Based on [4,5,6,7,8,9].
Table 2. Levelized price of fuels used in Transport sector.
FuelUSD/GJOwn Data Based on:
Gasoline19.0[29]
Diesel16.5[30,31]
Fuel oil11.2[30,31,32]
Natural Gas (NG)5.1[33]
Liquid Petroleum Gas (LPG)20.9[29,31,34]
Electricity30.6[28]
Source: Based on [28,29,30,31,32,33,34].
Table 3. Mexican vehicle fleet structure and fuel type in year 2010 (millions).
Vehicle TypeMillions
Compacts (gasoline)5.7
Subcompacts (gasoline)4.0
Luxury & Sport (gasoline)2.1
Sport Utility Vehicles (SUV) (gasoline)2.2
Light Trucks (gasoline)7.0
Heavy Duty Vehicles-Freight (HDV-F) (diesel)0.5
Heavy Duty Vehicles-Passengers (HDF-P) (diesel)0.3
Source: Data from [26].
Table 4. Fuel economy evolution by vehicle type.
Vehicle Type20102035AAGR
(km/lt)(%)
Compacts7.09.01.0
Subcompacts9.615.11.9
Luxury and Sport6.78.71.0
SUV5.57.11.0
Light Trucks5.55.90.3
HDV-F3.37.73.4
HDV-P3.37.43.3
Source: [36].
Table 5. Evolution of annual kilometers travelled by vehicle type.
Vehicle Type2010 *2035AAGR
(km/year)(%)
Compacts11,29014,9641.10%
Subcompacts11,05215,6261.40%
Luxury and Sport11,96415,6311.10%
SUV12,37815,8041.00%
Light Trucks12,21815,2290.90%
HFV-F65,55749,977−1.10%
HDV-P55,43841,096−1.20%
* Reference year. Source: [36].
Table 6. Emission factors by fuel type.
Fuel Type(tCO2/TJ)
Gasoline68.6
Diesel73.3
Liquid Petroleum Gas (LPG)62.7
Natural Gas (NG)55.8
Fuel oil 72.5
Kerosene72.5
Source: [40].
Table 7. Bicycle passenger sources by transport mode.
Bicycle Passenger Sources
Original Transport ModeTrips Share
Private car (sedan)20%
Bus26%
Taxi15%
Non-motorized transport19%
Not from other transport (new trips)20%
Source: [36].
Table 8. Effects of new urban development on mobility pattern.
Urban IndicatorsDaily Trips Per PersonAverage Distance Per Trip
Population density−0.199−0.101
Mixed land use index0.337−0.177
Jobs per house-0.106
Employment-workers balance−0.336-
Source: [50].
Table 9. Main technical assumptions and cost structure for biofuels.
Sugarcane EthanolSorghum Grain EthanolUnitsJatropha curcas BiodieselPalm Oil BiodieselUnits
Technical Assumptions
Surface Required2.92.6Mha3.21.85Mha
Crop Yield642.6t/ha0.71.5t/ha/year
Load Factor0.850.80-0.820.82-
Plant Capacity (One Plant)170190ML/plant-year93,750140,171t seed or fruit/year
Annual Production145152ML/plant37.541.6ML
Industrial Performance83.2396.0L/t sugarcane or sorghum grain---
Number of Plants13928-29117-
Transesterification Efficiency---97%97%-
Cost Structure (one plant)
Investment$ 56.9$ 70.4MUSD$ 25.9$ 25.9MUSD
O & M$ 7.91$ 10.0MUSD/year$ 0.38$ 0.38MUSD/year
Raw Material$ 28.2$ 224.0USD/ton$ 397.0$ 313.4USD/ton
Source: [37].
Table 10. Evolution of the Mexican vehicle fleet structure in the BLS and its comparison with the historical evolution.
Vehicle CategoryVehicle TypeBLS AAGR 2010–2035 (%)Historical AAGR 1990–2010 (%) *
Motor vehiclesCompacts, subcompacts, L&D and SUV5.16.0
Passenger busesHeavy Duty Vehicles-Passengers8.66.2
Light Trucks and Heavy Duty Vehicles-FreightLight Trucks and Heavy Duty Vehicles-Freight4.45.7
Total-5.05.9
* Source: [25].
Table 11. Comparison of mitigation results of similar transport sector´s Low Carbon Scenarios in 2035 from India [6] and Mexico (this work) in absolute and relative values relative to a baseline scenario.
Measures CategoryINDIAMEXICO
[6]This Work
Absolute GHG ReductionsAbsolute GHG Reductions
MtCO2%MtCO2%
Sustainable Mobility *507%266%
Freight Logistics **183%6917%
Fuel Economy ***12018%8320%
Biofuels ****183%358%
Electric Vehicles *****14020%154%
Total GHG Reductions from a Baseline Scenario34651%22956%
* Sustainable mobility: Public bicycles system, confined bus rapid transit systems (BRT), urban development planning oriented to sustainable transportation, optimization of public transport routes in urban areas; ** Freight logistics: Program for clean freight transport, freight rail systems, freight transport companies’ integration; *** Fuel economy: Fuel economy standard for light duty vehicles (LDV), gasoline price without subventions, verification and circulation restriction in the main 20 metropolitan areas and five border metropolitan areas, fuel economy standard in heavy duty vehicles-freight (HDV), border environmental customs for vehicles; **** Biofuels use: Sugarcane ethanol, sorghum grain ethanol, Jatropha curcas biodiesel, oil palm biodiesel; ***** Electric mobility: Hybrid electric vehicles (HEV), plug-in hybrid electric vehicles (PHEV), battery electric vehicles (BEV), introduction of hybrid buses, electric transport systems.
Table 12. Avoided GHG costs and emissions from mitigation measures in the transport sector in Mexico during 2010–2035 period.
Mitigation MeasureIMSCPSAFC-BMCAE
MUSDUSD/tCO2eMtCO2e
Energy Efficiency35,8976905−171,0570−136,631−264,888−1082457
Fuel Economy Standard for LDV3085000−16,727−13,642−79172
Gasoline Price Without Subventions00−171,0570−38,175−209,232−366571
Verification and Circulation Restriction in the Main 20 Metropolitan Zones and 5 Border Metropolitan Zones0477500−5498−723−798
Fuel Economy Standard in HDV-F90000−6101−6011−50120
Border Environmental Customs for Vehicles6522209200−16,787−8174−32259
Optimization of Public Transport Routes in Urban Areas0000−5835−5835−50116
Introduction of Hybrid Buses3563800−152242485
Electric Public Transport Systems656000−2094461493
Public Bicycles System544000−1375−832−4817
Confined BRT Systems1275000−893382439
Program for Clean Freight Transport2730000−8482−5751−25226
Urban Development Oriented to Sustainable Transport2231000−115010815210
Freight Rail Systems18,244000−14,018422618236
Freight Transport Companies Integration164000−21,229−21,065−51415
Liquid Biofuels304835,9120−3662−28,487681413514
Sugarcane Ethanol237124,9840−1930−20,928449813355
Sorghum Grain Ethanol36945760−1500−24979492243
Jatropha curcas Biodiesel23223400−202−15198522435
Oil Palm Biodiesel7640120−30−3543515682
New Electric Mobility Technologies25,559000−825817,30289194
Hybrid Electric Vehicles (HEV)6297000−4047225018127
Plug-in Hybrid Electric Vehicles (PHEV)13,218000−192211,29625145
Battery Electric Vehicles (BEV)6044000−2289375616322
Totals64,50442,817−171,057−3662−173,376−240,772−76.053166
Note: I: Investment cost, M: Maintenance cost, S: Subsidies, CPS: Co-products and Sales incomes, AF: Avoided Fuel cost, C-B: Cost Benefit, MC: Mitigation Cost and AE: Accumulated Avoided Emissions.