Article

Macroeconomic Effects of EU Energy Efficiency Regulations on Household Dishwashers, Washing Machines and Washer Dryers

by
Paola Rocchi
*,
José Manuel Rueda-Cantuche
,
Alicia Boyano
and
Alejandro Villanueva
European Commission, Joint Research Centre (JRC), Spain. C/Inca Garcilaso, 3, 41092 Sevilla, Spain
*
Author to whom correspondence should be addressed.
Energies 2019, 12(22), 4312; https://doi.org/10.3390/en12224312
Submission received: 5 August 2019 / Revised: 31 October 2019 / Accepted: 8 November 2019 / Published: 12 November 2019
(This article belongs to the Special Issue Advances in Low Carbon Technologies and Transition)

Abstract

:
Testing the relationship between economic performance and energy consumption is of utmost importance in nearly all countries. Taking the European Union as scope, this paper analyses the impacts of energy efficiency legislation on a selection of household appliances. In particular, it analyses the employment and value added impacts of the stricter energy efficiency requirements for dishwashers, washing machines, and washer dryers. To do so, this paper combines a bottom-up stock model with a macro-econometric dynamic general equilibrium model (FIDELIO) to quantify the direct and indirect value added and employment impacts in the European Union. The analysis shows that stricter energy efficiency requirements on household dishwashers, washing machines, and washer dryers have a net negative macroeconomic impact on value added (roughly 0.01 % of the total European Union value added) and a slightly net positive impact on employment. In fact, the regulations cause a shift in the composition of the household consumption basket that seems to favor labor-intensive industries.

Graphical Abstract

1. Introduction

This paper (The views expressed are purely those of the authors and may not in any circumstances be regarded as stating an official position of the European Commission) focuses on the relationship between energy efficiency policies and macroeconomic performance. A better understanding of this relationship is of key importance due to the increasing volume of regulated energy related products, as well as the number of countries implementing energy efficiency standards. In particular, the aim of the analysis is to add new empirical evidence regarding the macroeconomic impact of specific energy efficiency regulations on three household appliances: dishwashers, washing machines, and washer dryers in the European Union (EU). These appliances contribute approximately 2.8% to the residential energy consumption of the EU [1].
Nowadays, energy efficiency policies are one of the key measures to reduce the impact of human activities on the environment and the climate. Looking at the EU current growth strategy, climate change and energy sustainability priorities establish, for instance, the need of a 32.5% energy efficiency improvement for 2030. The improvement of energy efficiency has key impacts on the efforts that the EU undertakes to reduce energy consumption and greenhouse gas (GHG) emissions [2].
Theoretically speaking, energy efficiency policies are expected to have impacts not only on the environmental footprint of human activities, but also on the economic system through different channels [3]. In a first instance, these policies create incentives for certain economic sectors to introduce new production technologies, with possible consequent changes in the costs and product prices. On the other hand, energy efficiency technologies imply a reduction in energy consumption and, therefore, a consequent reduction in energy expenditure. These two direct effects will then have repercussions in the entire economy, through changes in the distribution of productive resources or changes in the composition of end-user spending.
The growing attention and use of energy efficiency policies has given rise to a growing body of literature that seeks to provide scientific evidence on the economic impact of these policies. These studies propose different methodologies, and can be classified into two main approaches: analyses that use partial models, and analyses that instead use general equilibrium models.
When considering the first approach, in recent years a growing number of analyses [4,5,6,7] focus on the effects of the implementation of energy efficiency measures on household appliances by using engineering approaches and bottom-up stock models. For example, there are some scientific studies analyzing and projecting the electricity use, water use, pollutant emissions, and consumer welfare implications for household appliances in Europe [8,9]. McNeil et al. (2013) [10] use a bottom-up stock accounting model that predicts the energy consumption of different equipment in 11 EU countries according to engineering-based estimates of the annual unit energy consumption. The authors model a high-efficiency policy scenario and conclude that significant energy savings can be achieved by adopting the current best practices of appliance energy efficiency policies. Braungardt et al. (2016) [11] investigate the impact of eco-innovations on the EU residential electricity demand (excluding heating) while using a detailed bottom-up modelling approach and find out that energy savings are achieved through the development of technologies with efficiencies beyond the status quo. Studies on the market penetration of high energy efficiency appliances in the residential sector are carried out by Radpout et al. (2017) [12]. These authors develop a model based on econometrics and time series analysis combined with the cost models. They find that government incentives to encourage people to buy higher energy efficient appliances are more effective than electricity price policies. Yilmaz et al. (2019) [6] publish a study that describes the development and application of a stock model that allows for quantifying the changes in the number of household appliances in stock, the related evolution of energy efficiency, as well as the changes/projections of electricity consumption between 2000 and 2035 in Switzerland. From the methodological point of view, this bottom-up stock model addresses the limitations of other previous models [13,14] that offer insight into demand dynamics but provide scarce information regarding the evolution of key parameters, such as new technologies, systems, or practices or the forecasting of the sales and stock. Specifically, for washing machines, washer-dryers, and dishwashers, Boyano et al. (2017) [15,16] analyze the environmental, employment, and economic impacts in the EU of stricter energy efficiency requirements for these appliances. The authors built-up a bottom-up stock model that projects stock sales, lifespans, and related evolution of energy efficiency classes. They estimate the electricity consumption, water consumption, and consumer welfare between 2015 and 2030. The authors find a decrease in the employment, but they were unable to quantify indirect, supply-chain, or cross-sectorial impacts.
While using a general equilibrium framework, other studies focus instead on the economic and environmental impact of energy efficiency policy while considering all interlinkages and dependences of the economic system. Hanson and Laitner (2004) [17] use the All Modular Industry Growth Assessment (AMIGA) system to analyse the policies that increase investment in energy-efficient technologies in the United States (U.S.) economy. They find that the policies would lead to substantial domestic reduction of carbon emissions and a net positive impact on the economy. Rose and Wei (2012) [18] analyse the impacts of the Florida Energy and Climate Change Action Plan that was introduced in 2001. Using the econometric general equilibrium REMI model, they find that most of the recommended options individually—as well as the combined recommendations—have positive impacts on the state’s economy. Barker et al. (2016) [19] analyse four different policies that the International Energy Agency suggests in order to close the 2020 emissions gap. They estimate the GDP and employment effect while using the econometric general equilibrium model Global Energy-Environment-Economy Model (E3MG), finding that the policies are not enough to reach the required emissions reduction, although presenting positive impacts on GDP and employment.
There is finally a third group of studies that combine the two approaches using hybrid models. These analyses integrate detailed bottom-up technical descriptions of specific industries affected by the policies with a broader economic perspective provided by the macroeconomic framework. Barker et al. (2007) [20] analyze the UK Climate Change Agreements and related energy efficiency policies for energy-intensive industrial sectors. They combine bottom-up estimates of the effects of these policies and the dynamic econometric model of the UK economy Multisectoral Dynamic Model- Energy-Environment-Economy (MDM-E3). They find final energy reduction and a slight increase in economic growth through improved international competitiveness. Ringel et al. (2016) [21] use a hybrid approach—bottom-up model together with the Assessment of Transport Strategies (ASTRA) model—to analyze the environmental and socio-economic impacts of Germany’s latest energy efficiency and climate strategies for the year 2020. They find that enhanced green energy policies bring about economic benefits in terms of GDP and employment, even in the short term. Additionally, the European Commission uses a hybrid approach in the impact assessment of the proposal for the revision of the energy efficiency directive [22]. The analysis uses bottom-up models— Price-Induced Market Equilibrium System (PRIMES), Greenhouse gas - Air pollution Interactions and Synergies (GAINS), Global Biosphere Management Model - Global Forest Model (GLOBIOM-G4M), Prometheus, Common Agricultural Policy Regional Impact (CAPRI)—together with two different general equilibrium macroeconomic models: the computational general equilibrium model GEM-E3 and the dynamic econometric global model E3ME. While the E3ME model presents positive impacts GDP and employment in all analyzed scenarios, the results for the GEM-E3 models are mixed. Finally, Hartwig et al. (2017) [3] present a case study for Germany, where a scenario including ambitious energy efficiency measures for building, household appliances, industry, and the service sector is compared to a reference scenario with respect to the macroeconomic impacts. Connecting the energy demand models Forecast and invert/EE-lab with the macroeconomic model ASTRA-D is undertaken to analyze the effects of the policy scenarios. The authors conclude that the macroeconomic effects of ambitious energy efficiency policies in Germany have considerable positive impacts on employment (particularly in those that produce energy efficiency technologies and construction and manufacturing sector, as well as in real-state and consulting) and GDP.
In this paper, we follow the third approach to use the technical information that is offered by bottom-up models, while going beyond the direct impacts on employment and value added of the energy efficiency regulations to analyze their impacts across industries and countries. In particular, we use a hybrid framework combining the detailed bottom-up energy demand stock based model that Boyano et al. developed [15,16], together with the macro-econometric dynamic general equilibrium model FIDELIO [23]. The resulting hybrid model is used to provide new empirical evidence on a specific energy efficiency policy, which is the revision of the energy efficiency regulatory framework for dishwashers, washing machines, and washer dryers. In particular, the overarching regulatory framework for energy efficiency products is the combination of two policies: The Energy Labelling Regulation (EU) 2017/1369 [24], which defines the process of determination of energy label to be displayed in new appliances, and the Eco-design Directive 2009/125/EC [25], which specifies the process of defining minimum energy performance levels. Acting in combination as a pull-push effect, these regulatory measures have improved the average energy efficiency of the household appliance stock over the years in the EU [26]. Regarding the analyzed appliances, their specific regulations are: (1) for washing machines, Regulation EU No 1061/2010 on energy label and Regulation EU No 1015/2010 on Eco-design requirements, (2) for washer dryers Regulation EU No 96/60/EC on energy label, and (3) for dishwashers, Regulation EU No 1060/2010 on energy label and Regulation EU No 1016/2010 on Eco-design requirements. These regulations have been revised in 2014–2018, and adopted in 2019. The revision introduces stricter energy efficiency requirements of the products that enter the EU market from March 2021, and a rescaling of the energy efficiency classes. Additionally, some changes in the testing programs are introduced to bring the energy efficiency developments of the products closer to the end-user behavior. This paper quantifies the EU-wide economic (in terms of value added) and employment impacts between 2020 and 2030 of such proposed changes to the EU energy efficiency regulations on the aforementioned household’s appliances. The analysis provides results by countries and for most of the economic sectors in the EU.
The paper is organized as follows. Section 2 provides an overview of the methods and materials that were used in the study. Section 3 presents the impacts from changes in the EU regulations estimated using FIDELIO. Section 4 discusses a range of implications of the empirical results, while Section 5 draws some concluding remarks.

2. Methods and Materials

The modelling tool that is proposed in this analysis has two main components: a bottom-up approach, used together with the top-down macro-economic Fully Interregional Dynamic Econometric Long-term Input-Output model (FIDELIO). In this section, we first describe the two models (in Section 2.1 and Section 2.2, respectively). Next, Section 2.3 describes the necessary further steps to link the two approaches, and it offers a graphic representation of the methodological proposal.

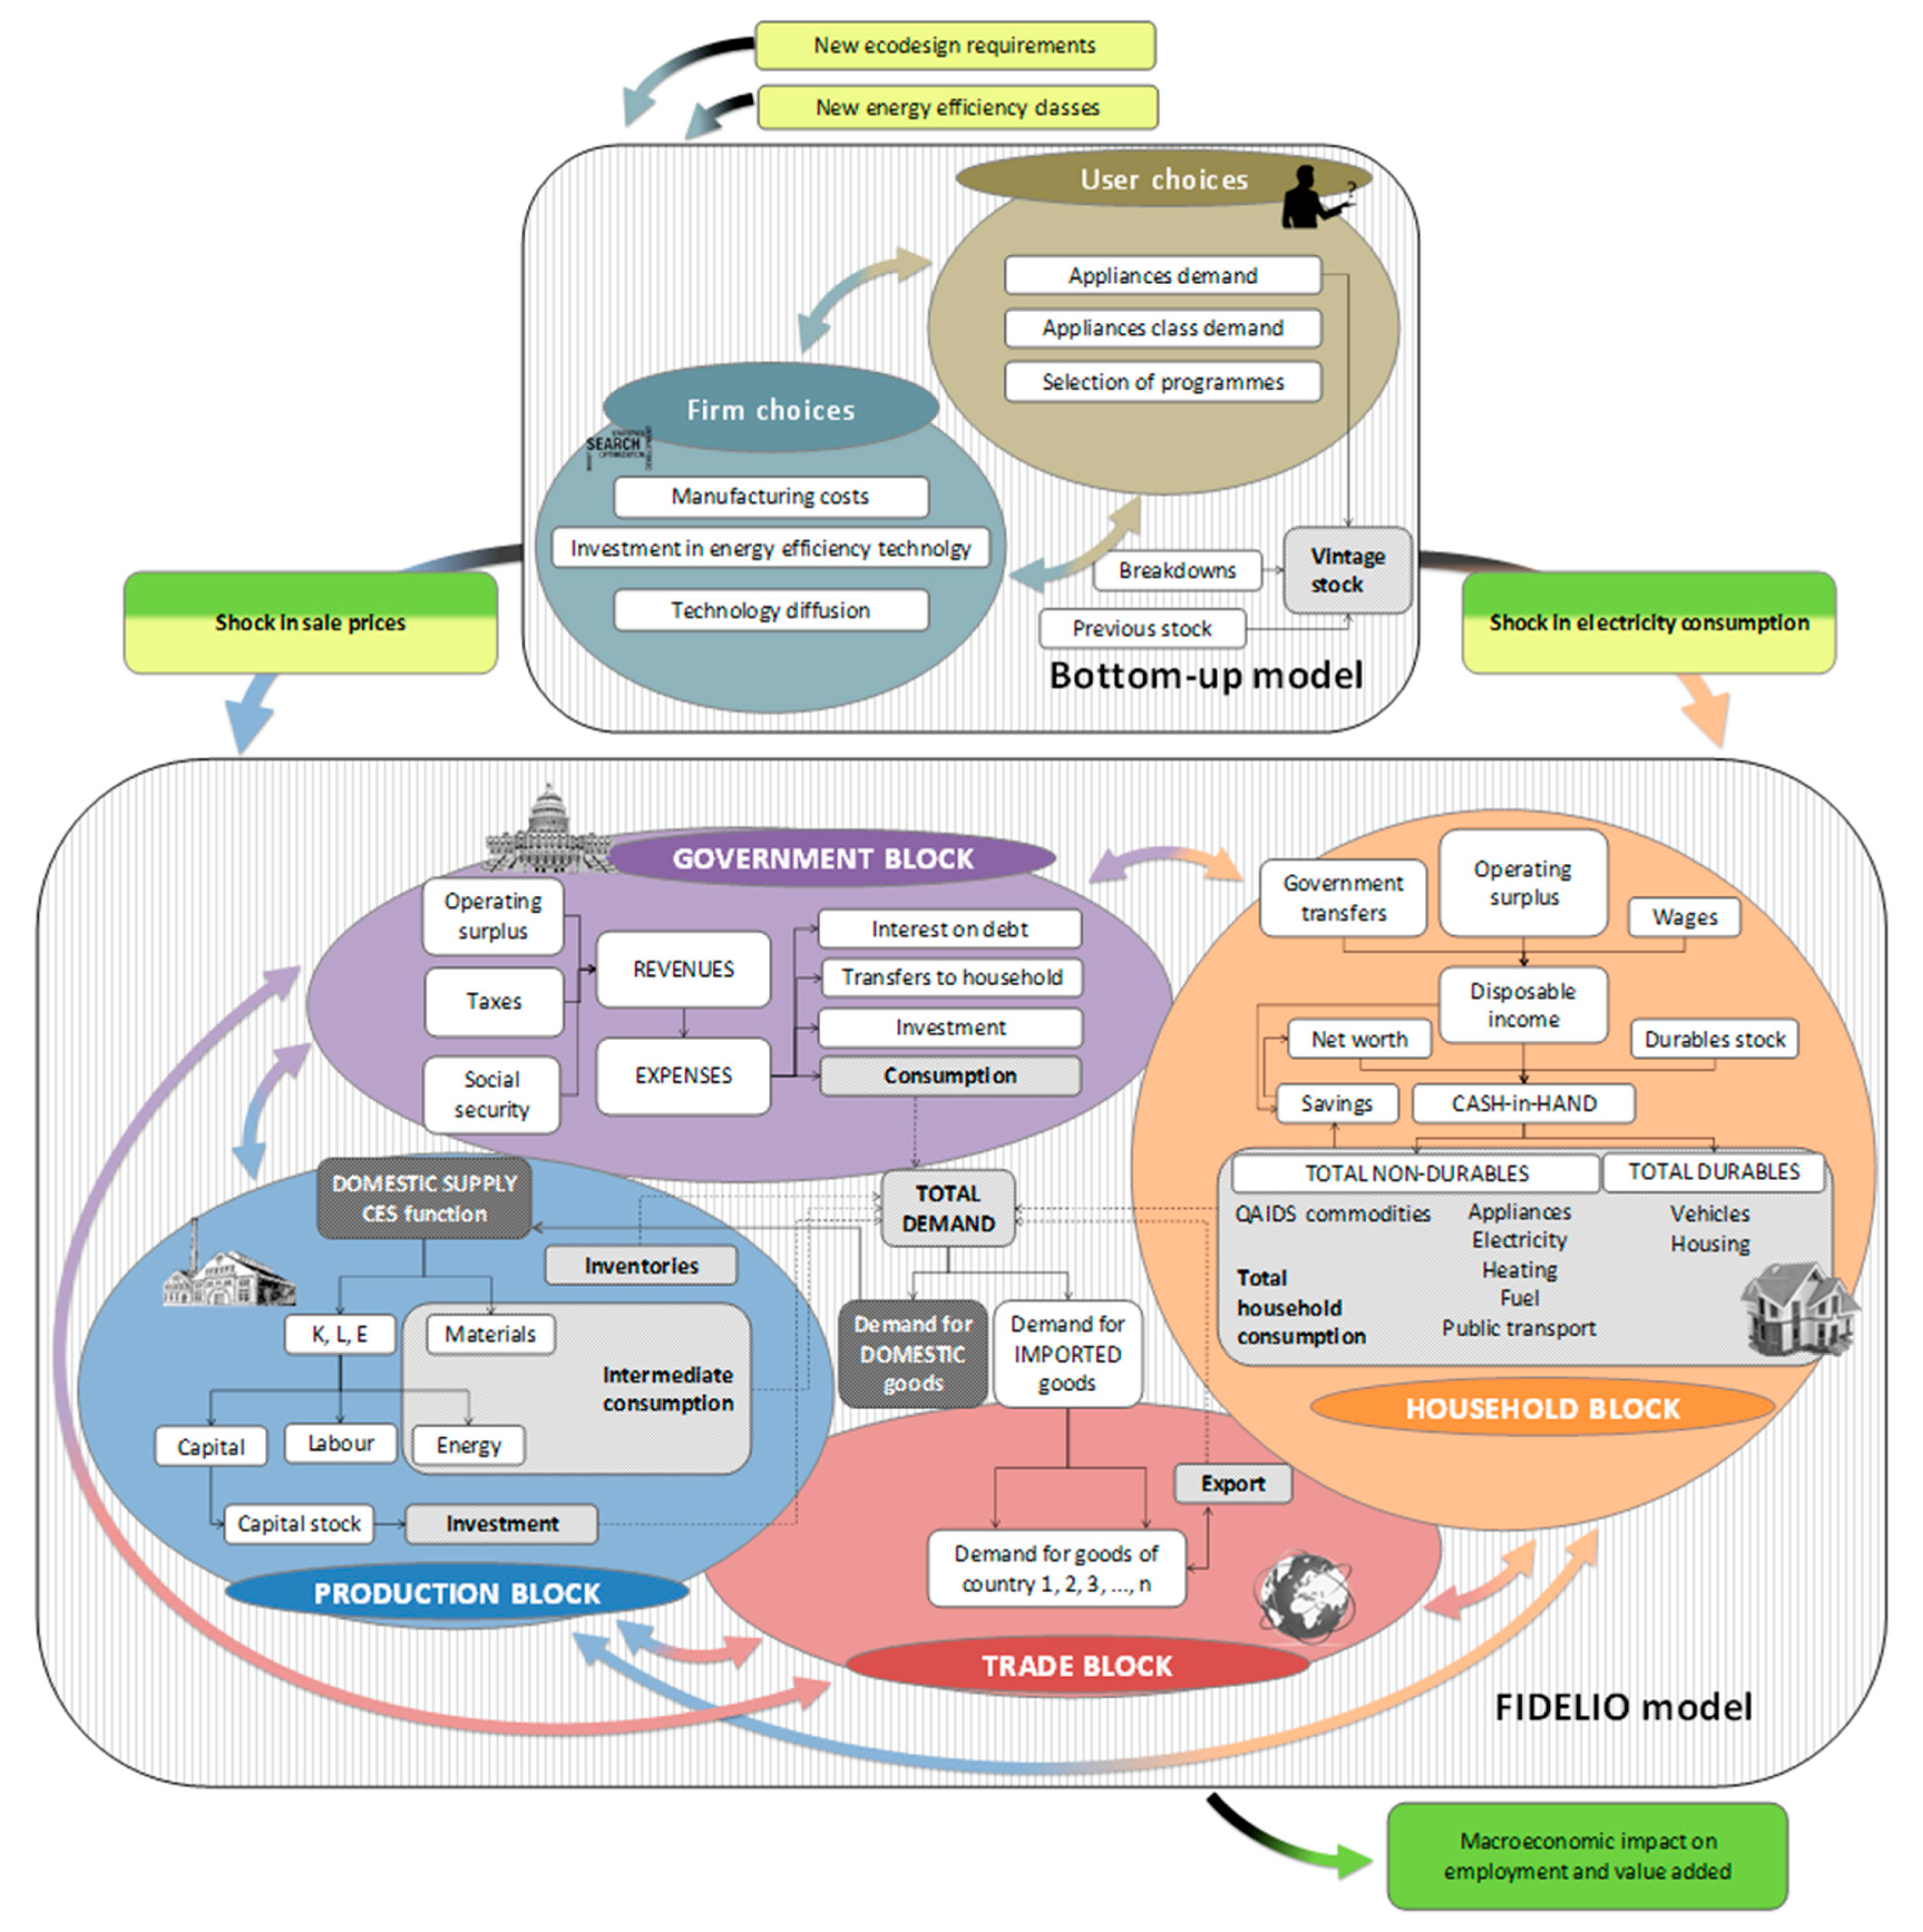
2.1. Bottom-Up Approach

We use a bottom-up energy demand model covering all EU countries. In this model, the EU electricity consumption and sale prices of dishwashers, washing machines, and washer dryers are based on the related energy efficiency technological improvements, which are estimated while using an engineering approach.
The technological improvements that were triggered by the implementation of the new regulations have an effect on the sales price of the appliances as well as in the electricity consumption of the overall stock at EU level. The sales price of each machine is estimated based on the manufacturing costs, manufacturers and retailers’ mark-ups, the value added tax, and, wherever appropriate, the additional costs of the improvement options that are added to the basic models to achieve a better energy efficiency and, therefore, a better energy efficiency label classification. The manufacturing costs are provided by the manufacturers and assumed to decrease over time according to the experience curve [27], experience gained by the manufacturer in producing the machines. This correction is applied to the sale prices beyond 2015.
The annual electricity consumption of the overall stock at the EU level is estimated based on the average unitary electricity consumption of one appliance. Data regarding the energy consumption of the appliances are based on the performance data provided by the manufacturers, data from consumer surveys on how the appliances are used, and the evolution of technology. This unitary electricity consumption also depends on the sales distribution over the energy efficiency classes of the year when the appliance is purchased. The annual market share of each energy efficiency class is based on the historical data series and the influence that labelling has on the investment decisions of consumers, directing preference towards more energy efficiency appliances [28].
The way that this bottom-up model calculates the energy consumption is similar to that used by Yilmaz et al. [6], as both models estimate the number of replaced machines throughout a Weibull distribution. However, Yilmaz et al. [6] disregard the effect of the users when using the appliances and assumed the testing program energy consumption as the average value. For a complete description of the calculations and the assumptions that were considered in this bottom-up stock model, see [15,16].
A variety of studies have addressed the rebound effects for appliances, including an increase in operation hours, appliance size, or ownership rate [11,29,30]. The direct rebound effect related to dishwashers, washing machines, and washer dryers has been estimated to be negligible. The most recent user surveys [10,13] report that consumers remain using these appliances in the same way, regardless of their energy efficiency class, and this behavior has been stable in the last years. For example, the annual number of cycles of use of the appliances is stable and it mainly depends on the household size. The laundry load has remained constant through the last years at approx. 3.4 kg laundry/cycle, and the number of washing machines per household has remained constant, which indicates a saturated market.

2.2. Top-Down Model: FIDELIO

FIDELIO is based on a neo-Keynesian demand-driven non-optimization macroeconomic framework in the line of the E3ME (Cambridge Econometrics) model. This family of models is frequently compared to another set of macroeconomic models that are often used for policy and environmental analysis that is computational general equilibrium (CGE) models. One of the main broad differences between the two types of models is that CGE models are based on neoclassical assumptions in line with economic theory of optimization. Prices adjust to market clearing, aggregate demand adjusts to meet potential supply, and output is determined by available capacity. Instead, macro-econometric models assume that agents lack perfect knowledge and do not optimize their decisions. They provide a more empirically grounded approach and the alternative assumption ruling agents’ choices is represented by econometric estimations. The parameters are estimated from time-series databases; therefore, they are validated against historical relationship: agents behave as they did in the past. Differently from CGE models, market imperfections exist and the economy is not assumed to be in equilibrium. There is no guarantee that all available resources are used. The level of output is a function of the level of demand and it might be less than potential supply.
Besides offering a relatively strong empirical grounding, the use of FIDELIO offers two additional advantages for the analysis carried out. First, the model offers a fairly high level of geographical and sectorial disaggregation. FIDELIO covers 35 regions (the 28 EU Member States plus Brazil, China, India, Japan, Russia, Turkey, and the United States), with each of them being disaggregated in 56 industries and products (see in Appendix A, Table A1, the list of industries available in FIDELIO).
Second, the model offers a useful instrument to analyze policies that influence household consumption. In fact, while the supply side is described in a relatively simple way—it is characterized by an input-output core enlarged with nested constant-elasticity-of-substitution production function—the household block is modelled with relatively high detail. In FIDELIO, households receive three sources of income: wages, a share of the firms’ gross operating surplus, and some government transfers. This income, after taxes, is either used for consumption or saved. In particular, households consume different categories of products: durable products (housing rents and vehicles) and non-durable products, such as appliances, electricity, heating, fuel for private transport, public transport, food, clothing, furniture and equipment, health, communication, recreation and accommodation, financial services, and other products. For almost all consumption categories—including also appliances and electricity consumption—the demand is characterized through econometric estimations with different consumption categories modelled with different functional forms. For a complete description of the characteristics, the assumptions and equations of the FIDELIO model, see [23]. Appendix B offers a short description of the data sources that are needed to build the FIDELIO database.

2.3. Bridging Bottom-Up and Top-Down Approaches

Introducing the shock values into the FIDELIO model requires additional information. In fact, both shocks—to the sale prices of appliances and to the electricity requirements—are separately estimated for each specific appliance: dishwashers, washing machines, and washer dryers. However, the FIDELIO model only operates with one single household consumption category, which includes these and all other appliances together. Therefore, additional information is required to weigh the estimated shocks and calculate the corresponding equivalent shocks that are to be introduced in the FIDELIO model.
As regards the shock of the sale prices of appliances, we use the penetration rates that were estimated in [31] for dishwashers, washing machines, and washer dryers to weigh each (exogenously estimated) sales price shock and compute the single weighted equivalent sales price shock that includes all three household appliances. Next, we use information from the 2010 Household Budget Survey (HBS) micro-data produced by Eurostat in the COICOP (Classification of Individual Consumption According to Purpose) classification at the five-digit level. In particular, the survey provides information on the household total consumption of appliances and the household consumption of “clothes washing machines, clothes drying machines, and dish washing machines”. Using this information, for each EU country, we compute the share of “clothes washing machines, clothes drying machines, and dish washing machines” over the broader category “household appliances”. Eventually, we compute the sales price variations that are to be used in the FIDELIO model by using the weighted equivalent price shock for washing machines, washer dryers, and dishwashers, and the weights based on the HBS data. These price variations are introduced as shock parameters into the endogenously determined prices of appliances of FIDELIO. We implicitly assume that the shock in the sales price affects both domestic and imported products since the price of appliances in FIDELIO is computed as an average of the price of the domestic products and the price of the imported products. This is how the policy is actually expected to operate.
We use a similar approach to combine the electricity consumption shock related to each appliance into an aggregate shock in the value of the household total electricity consumption. First, we use the weights based on the penetration rates previously described to compute a weighted variation in the value of electricity consumed for dishwasher, washing machine and washer-dryer appliances. Next, to know the share of electricity consumption that households use for dishwashing, washing machine and washer-dryer appliances over the household total consumption of electricity we use data from the European Environment Agency [32] and from the ODYSSEE database [33]. These databases distinguish among different uses of household electricity (for electrical large appliances, other appliances, lighting, space heating, water heating, cooking, and air cooling). These shares are used to compute the final variations in household total electricity consumption used as a shock in FIDELIO. In FIDELIO, household electricity consumption depends on the stock of appliances, the electricity price, an exogenous index capturing the efficiency of appliances, the previous year’s electricity consumption and stock of appliances, and the demand for energy that is needed for heating. We impose a shock in the efficiency parameter that would be equivalent, ceteris paribus, to the exogenously computed shock in the electricity consumed to simulate the electricity consumption variation computed through the bottom-up model. Appendix CTable A2, Table A3, Table A4, Table A5 and Table A6—presents the cost variations and the household total electricity consumption variations that were introduced in FIDELIO, and the weights used to compute them.
Given how consumers’ choices are described in FIDELIO, the model takes indirect rebound effects into account. By reducing their energy consumption, households might use their additional savings to buy other goods and services that require additional use of electricity, partially offsetting the initial electricity reduction.
Figure 1 provides a graphical description of the two models used for the analysis and of the input (in yellow) and outputs (in green) flows between the two models. As the figure shows, the revised ecodesign requirements and the new energy efficiency classes are inputs for the bottom-up model that computes the shock in the appliances sale prices and household electricity consumption. These outputs of the bottom-up model are inputs for FIDELIO that simulates the policy revision impacts on employment and value added.

3. Results

We shock the model in 2020 and run it up to 2030 for a baseline scenario (no new regulatory measures) and for a scenario with the proposed stricter EU energy efficiency regulations. The results that are presented hereafter correspond to variations of value added and employment with respect to the baseline scenario, in 2030. The results are very similar for the other years. While Section 3.1 focuses on the macroeconomic impact of the policies, Section 3.2 provides an overview of the environmental impact in terms of CO2-equivalent emissions.

3.1. Economic Impact

Table 1 shows the variations in value added and in employment in the EU economy as a whole.
While the value added decreases by 1.9 billion euros, employment increases in around 24,000 jobs. In relative terms, with 0.01%, none of these two results represents a significant share of the total value added and the total employment in the EU.
Section 3.1.1 and Section 3.1.2 provide more detailed results at the industry and country level, respectively, in order to give more insight into the EU (negative) value added effects and the EU (positive) employment effects.

3.1.1. Industry Level Analysis

Input-output based models typically provide results that are broken down by economic activities or industries (also sometimes denoted as sectors). Even if the analyzed policies aim at influencing the energy efficiency of some specific household appliances, produced by some specific industries, FIDELIO simulates the indirect impacts that these policies would also have on other industries. These impacts can be caused, for example, by an indirect effect of regulations—such as the reduction of electricity consumption, or by changes in the quantity of intermediate inputs necessary to produce the appliances, or by changes in the households’ bundle of goods and services consumed.
Table 2 shows the absolute and relative variations in the EU value added, broken down by industry. The left hand side of Table 2 shows industries with value added increases, while the right hand side shows industries that are worse off. In both sides, the industries are ranked based on their share over the total variation in value added, in decreasing order.
Even when the total value added decreases, it does not shrink in all industries. The value added of the household appliances producer industry (electrical equipment) increases by 90 million euros. However, the positive impact in other industries is even greater. In fact, 60% of the value added growth takes place in the accommodation and food services (360 million euros), retail trade (343 million euros), food and beverages (253 million euros), and other services (290 million euros), including activities, such as repairing services, art, entertainment, and recreation services, among others.
A possible reason why these sectors are increasing their production and, consequently, their value added, can be found in the way consumers’ choices are modelled in FIDELIO. Households increase their demand of these products mainly due to savings made in electricity consumption. In fact, 50% of the value added reduction takes place in the electricity production industry (and corresponds to around two-billion euros). However, this decrease only represents 0.69% of the value added of the electricity industry.
Regarding employment, the results present a positive effect in the EU economy, in contrast to the value added decrease. The reason lies in the fact that the industries that show an increase in production, value added, and employment are more labor intensive than the industries that are worse off. Table 3 shows the absolute and relative variations in employment at the EU level, broken down by industry (with the same structure as Table 2).
The total positive impact on employment (ca. 72,000 jobs) in some sectors more than compensates the negative impact (ca. 48,000 jobs) in others. The positive impacts mainly come from the agricultural sector, accommodation and food services, retail trade, and other services. On the negative side, the electricity industry is the one that suffers most in terms of employment (25% of the total impact), although much less than in terms of value added (50% of the total impact). Other industries that show a decrease in employment are, for example, construction, mining and quarrying, and forestry and logging.

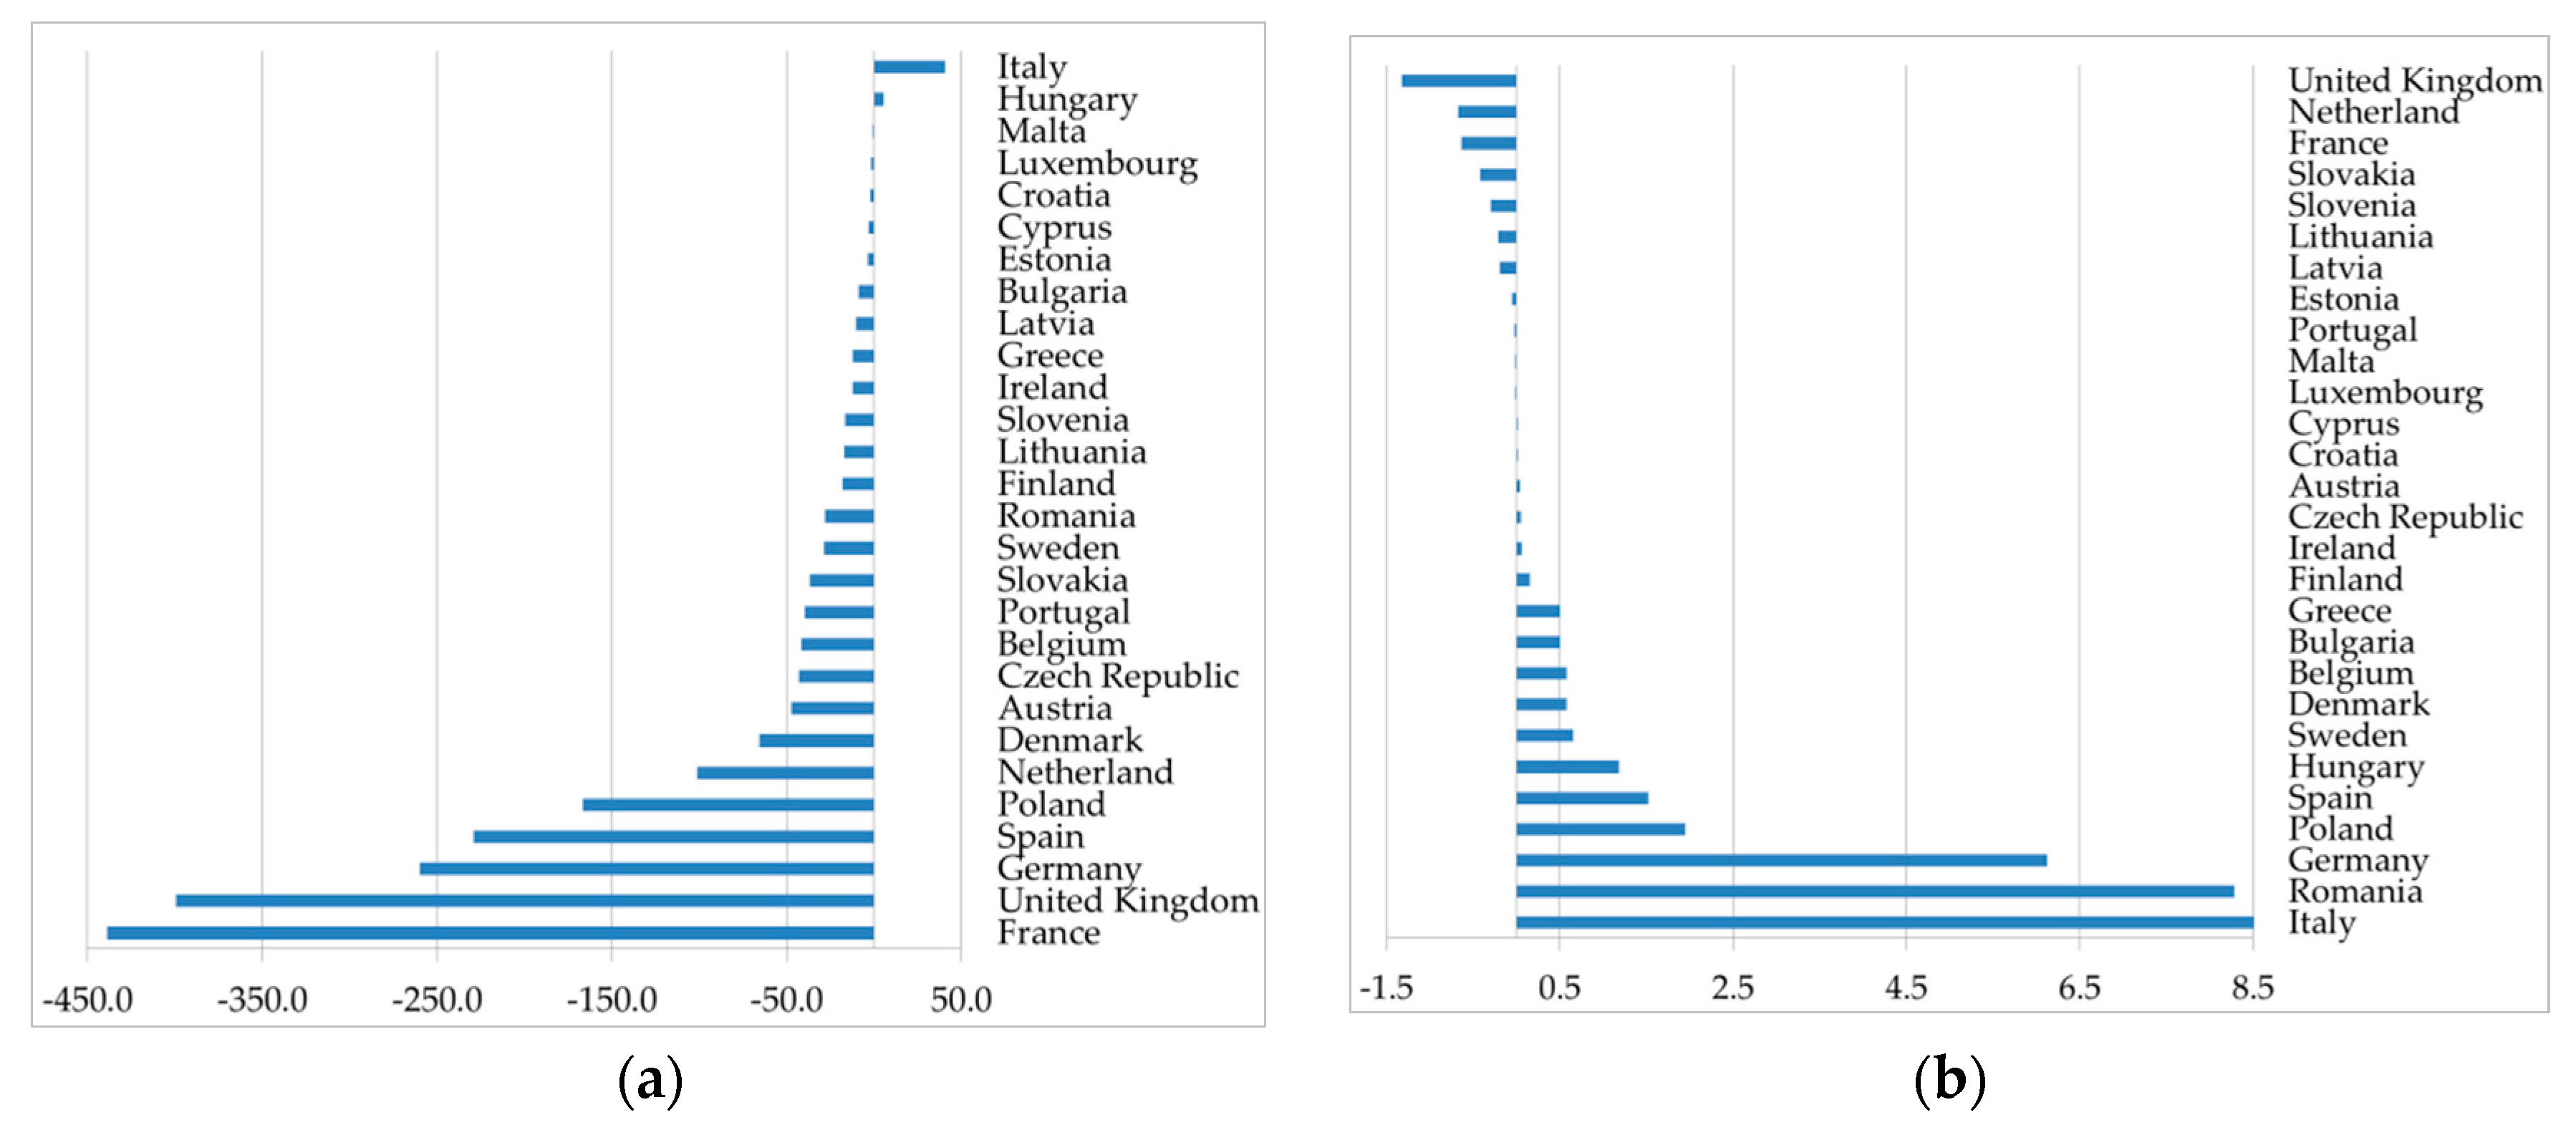
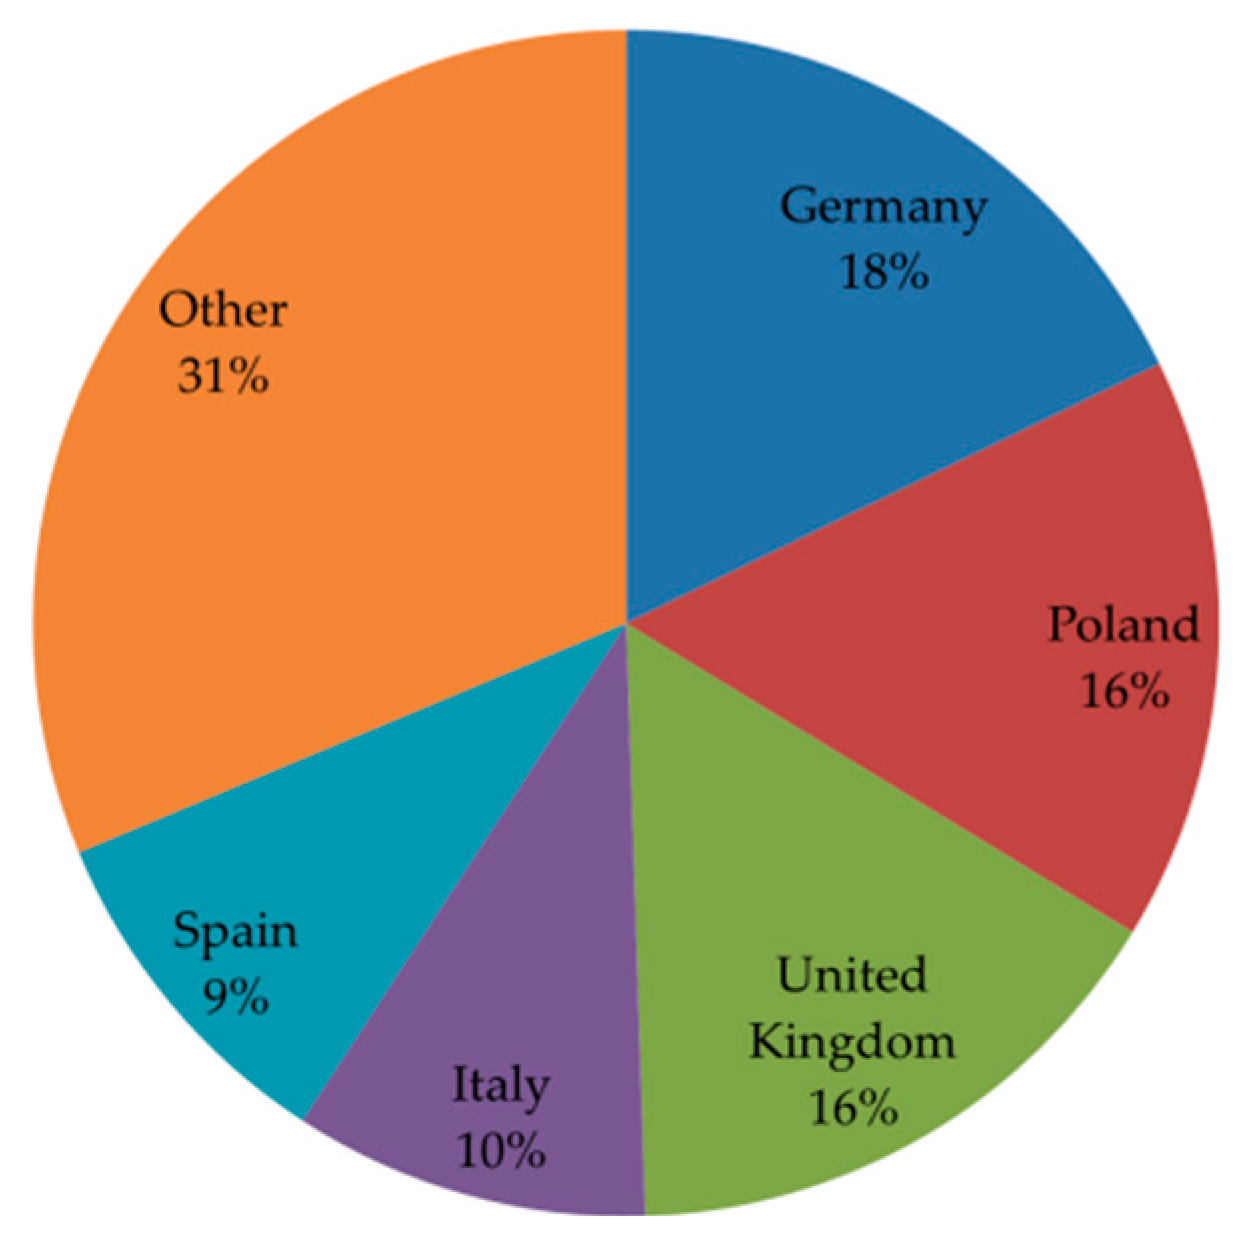
3.1.2. Country-Level Analysis

In addition to the analysis at the industry level, in this section we analyze how the impact is distributed among the different EU countries. Figure 2 shows the absolute variation in value added and employment by country.
All EU countries would see their total value added reduced, except Hungary and Italy. However, these reductions would represent very small values in relative terms with respect to their total national levels, with most of them being close to zero. The maximum value is −0.05% for Lithuania, Latvia and Slovakia.
In absolute terms, the countries absorbing most of the value added decrease are Germany, Spain, France, United Kingdom, and Poland. For these countries, between 31% and 54% of the value added decrease occurs in the electricity industry. However, this just corresponds to a 1% value added of the electricity industry in France, Poland, Spain, and United Kingdom. Other industries contributing to the overall value added decrease are the mining sector and the construction sector.
Although not representing relevant variations in absolute terms, there are other industries that show higher value added decreases, between 1% and 3%—the relatively most affected sectors, these are the manufacture of transport equipment in Cyprus (1%); the electricity industry in Denmark (1.1%), Lithuania (1.3%), Slovakia (1.3%), and Greece (1.6%); the forestry and logging industry in Greece (3%), Romania (1.9%), Lithuania (1.1%), Slovenia (1.1%), and Italy (1%); and, the refined oil products industry in Slovenia (1.3%).
The positive impact in Italy and Hungary is driven by industries, such as accommodation, repairing, retail trade, agriculture, and manufacture of food products.
The employment effects are positive in most of the countries. The three countries showing the biggest employment increase are Germany (ca. 6100 jobs), Italy (ca. 8600 jobs), and Romania (ca. 8300 jobs). In Germany and Italy, the industries that mostly drive the employment increase are accommodation, retail trade, agriculture, and manufacture of food products. For Romania, 70% of the employment increase is in the agricultural sector, followed by the manufacture of food products and the manufacture of textiles.
For some countries, such Estonia, France, Lithuania, Latvia, the Netherlands, Slovenia, and Slovakia, employment (slightly) decreases around less than 1000 jobs in all cases. The exception is United Kingdom, where the employment decrease was around 1300 jobs.

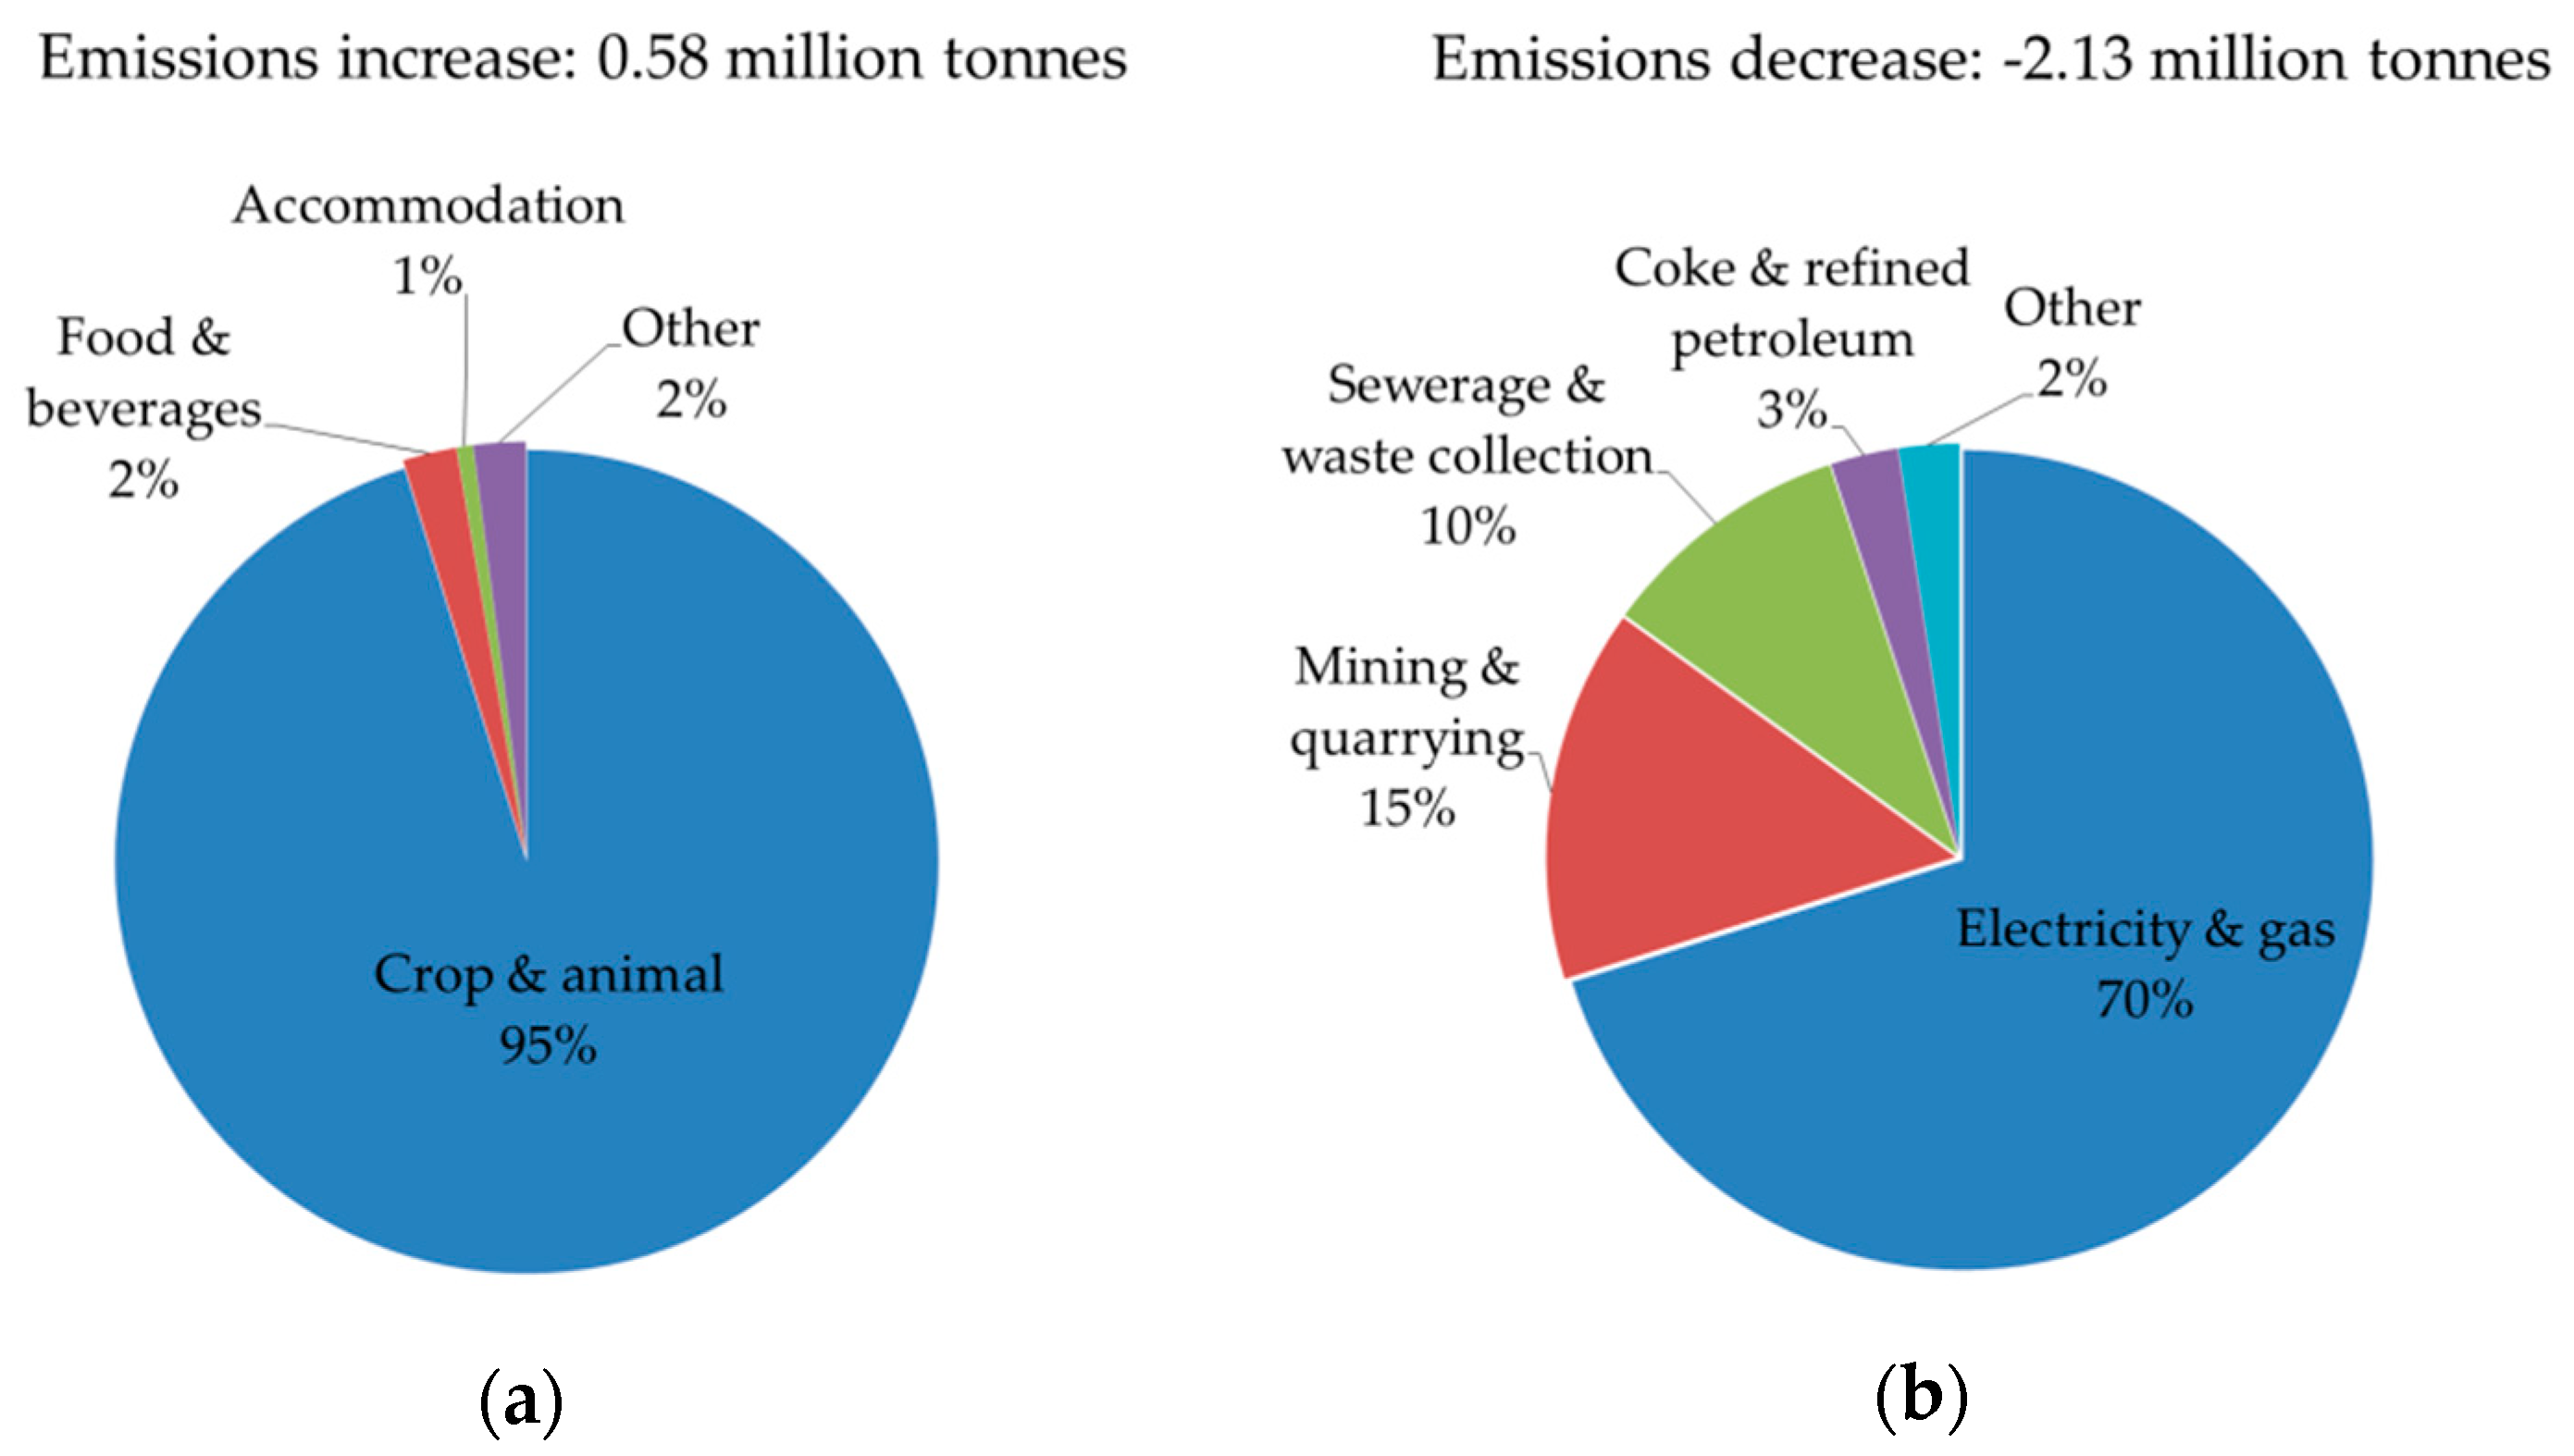
3.2. Environmental Impact

In FIDELIO, the monetary value of energy that is consumed by firms and households is linked to energy consumption and is then used to compute emissions of carbon dioxide (CO2), methane (CH4), and nitrous oxide (N2O) related to energy production and consumption (see [23] for a description of the conversion factors from primary energy consumption to emissions). To describe the environmental impact of the proposed stricter energy efficiency requirements, we look at the variation of GHG emissions. In particular, for a synthetic measure of the GHG effect, the emissions are converted into CO2-equivalent units while using the Global Warming Potential (GWP), as in [34]. Conversion factors are 1 for CO2, 265 for N2O and 28 for CH4.
The emissions increase is, in absolute terms, smaller than the emission reduction that is driven by stricter energy efficiency requirements (as expected), and the net effect is a decrease in GHG emissions equal to 1.5 million tonnes. This reduction is driven by the industry producing electricity that is responsible for the 70% of the total reduction, followed by mining and quarrying (15%), sewerage and waste collection and treatment (10%), and the manufacture of coke and refined petroleum products (3%).
Figure 3 shows the industries that are responsible for the resulting increase in emissions and those industries that are responsible for emission reductions.
The three main industries showing the biggest shares of emission increases are the agriculture industry, the manufacture of food and beverages, and accommodation services. Together, they would cause GHG emissions to increase in around half a million tonnes, out of which 95% would correspond to the agriculture industry. This effect might be considered as rebound effects, a reduction in the expected environmental gains of the regulation caused by behavioral responses.
Figure 4 shows the distribution of emissions decrease among EU countries. Germany, Poland, and the United Kingdom are responsible of half of the total reduction of GHG emissions that are caused by the proposed stricter energy efficiency requirements on dishwashers, washing machines, and washer dryers.

4. Discussion

One of the main findings of our analysis is that energy efficiency regulations on household dishwashers, washing machines, and washer dryers have a net negative macroeconomic impact on value added (roughly 0.01 % of the total EU value added) and a slightly net positive impact on employment (ca. 24,000 jobs). In both cases, energy efficiency regulations have positive and negative economic effects, depending on the industry sector analyzed. Most of the negative impact comes from the reduction in the consumption of energy due to the implementation of more energy-efficient technologies in household appliances. Positive impacts are derived from the new investments on more efficient technologies, and the shift in the composition of the household consumption basket, while using less energy in favor of goods and services that are produced by more labor-intensive industries.
While the most part of studies analyzed in the literature review find positive impacts of energy efficiency policies on both GDP and employment, these analyses usually consider the impact of a bundle of policies together. On the contrary, our results are consistent with the findings of Barker et al. (2016) [19]. The authors test whether energy efficiency measures contribute to closing the 2020 emissions gap without a loss in GDP and employment, and they offer the results disaggregated by different policy measures. One of the policy measures that they analyze is the use of more efficient appliances and lighting in residential and commercial buildings. For this specific measure, in line with our results, they find negative economic impacts for the EU, particularly in Germany and positive economic impacts in Italy. These authors also reported net positive employment effects. Therefore, it seems useful to specifically analyze individual energy efficiency policies, given that different measures may have different impacts on the economy.
In any case, it would be important to validate the results that were obtained using alternative theoretical frameworks to check the sensitivity of the results that were obtained to the assumptions underlying the used approach. For instance, following the findings of [11,29,30], in the bottom-up approach, we assume no relevant direct rebound effects induced by the revised regulations. A further extension of the analysis might corroborate how the results change relaxing this assumption. It is also important to note that one of the strengths of the FIDELIO model is its capacity to re-allocate household consumption across different goods and services in reaction to price changes, based on a relatively simple description of the electricity market and the electricity production function. Thus, the model is neither able to consider strategic choices that the electricity industry can make to accommodate the new energy efficiency policies nor the possible incentives towards innovative business models. Therefore, it would be interesting to deepen the analysis that was carried out with complementary approaches, for instance through microeconomic analyses of the electricity sector, or through energy models.
The revised energy efficiency regulations on household appliances that are studied in this paper are part of the EU initiatives to reach the EU targets on energy efficiency and GHG emissions reduction. Even if the main aim of the regulation is environmental, in the political discussion it is necessary to add information regarding economic and social impacts.
In particular, the energy efficiency policies force producers’ and consumers’ intertemporal choices. Whenever technological improvements are already available, but not used, stricter regulations create incentives for firms to anticipate investments that bring future revenues. For consumers, the revision of the regulations implies an increase in the purchase cost of the appliances, but a decrease in the future spending in electricity. Further research could dwell on the alternative investments not realized by producers and consumers, as a consequence of forced investments in energy efficiency.
The approach that is used to address the quantification of indirect impacts of product energy efficiency policies has the potential to expand and nuance the policy-making discussion. Assuming that the proposed changes are required to reach the EU environmental targets therefore they are appropriate per se, the analysis shows that they are expected to have negative but small economic impact (with a small 0.01% decrease in the EU GDP) and a small positive social impact on employment. Indeed, the economic brake that a reduction in the use of energy could cause is compensated by other trade-off in the economic system, such as a change in the household consumption basket or the economic growth that is driven by the new investments induced by the revised regulations. The presented hybrid approach provides quantitative information that complements the policy discussion of energy saving policy, enriching this discussion with knowledge of the indirect impacts and tradeoffs between the economy sectors and countries/regions in the EU. Being able to highlight which sectors and countries are most benefited and which bear the weight of the policy the most adds relevant information. This information can indeed be used during the policy process to adjust the reform, for example by introducing some compensation mechanism for countries or sectors that are more disadvantaged.
Further research might look more in depth to distributional issues across the EU countries and regions, as well as non-EU trade issues. Additionally, another important aspect to be investigated could be the impacts of these regulations not only on the energy efficiency requirements, but also on the lifetime of the appliances. In fact, some papers demonstrate that an extension of the lifetime of durable goods has a positive effect on the overall lifecycle energy consumption and GHG emissions, as long as the production and end of life stages require less energy than the use phase [35,36,37,38]. Moreover, in a background of progressive greening and de-carbonization of the economy, the incentives behind energy efficiency policy are transforming. In a new metric of social welfare, carbon footprint and intensity might deserve further analysis to articulate the narrative for and/or against stricter product efficiency policies.

5. Conclusions

Many studies support a positive correlation between income growth and energy consumption [39]. This implies that policies aimed at improving energy efficiency and decreasing energy consumption can have a negative impact on economic growth. With respect to this topic, the study that is reported in this article provides additional insights and granularity on the energy-growth relationship, at EU level, and it suggests two main outcomes.
First, the analysis shows that stricter energy efficiency requirements of three household appliances—washing machines, dishwashers, and washer-dryers—have a negative macroeconomic impact on value added, a decrease of around two-billion euros. The order of magnitude of the changes that the regulations introduce is small as compared to the whole EU economy since these appliances constitute around 20% of total household appliance energy use. In terms of value added, with 0.01% of the total EU value added, the impact is very small. The reasons behind this result are manifold. Firstly, the stricter requirements are expected to cause an increase in the cost of manufacturing and, consequently, the sales price of appliances, which increases by ca. 10%. Secondly, the result is also due to a change in the composition of household spending: households’ savings resulting from a reduction in energy demand can be used to consume other goods and services. Although the energy market is a key industry for economic development, the negative impact that the proposed changes in the EU regulations are expected to have on this industry is partially compensated by the increase in other industries’ production.
The second main outcome is that while the impact on value added is negative, the impact on employment is small but positive. Again, the shift in the composition of the household consumption basket seems to mainly favor industries that use relatively more labor than the industries that are negatively affected by the analyzed policies.
In terms of industry distribution, the sector that has the greatest negative impact on value added is the electricity industry, and this effect is quite homogenous among European countries. This result is straightforward: policies that aim at controlling emissions by improving energy efficiency have a negative impact on the electricity production, which is one of the main sectors responsible for GHG emissions. According to the European Environment Agency, in 2017 electricity production generated the largest share of GHG emissions (23.3% of total GHG emissions) [40].
Finally, our results suggest that the proposed changes in the EU regulations would cause a reduction in emissions of around 1.5 million tonnes of CO2-equivalent emissions. As expected, this reduction is driven by the industry producing electricity, but the 30 % of total GHG emissions reduction comes from other industries, such as mining and quarrying, sewerage and waste collection and treatment, or manufacture of coke and refined petroleum products.

Author Contributions

Conceptualization, P.R., J.M.R.-C., A.B. and A.V.; methodology, P.R., J.M.R.-C. and A.B.; software, P.R.; formal analysis, P.R. and A.B.; data curation, P.R. and A.B.; writing—original draft preparation, P.R., J.M.R.-C., and A.B.; writing—review and editing, P.R., J.M.R.-C., A.B. and A.V.

Funding

This research received no external funding.

Acknowledgments

We would like to thank Frédéric Reynes and Jinxue Hu for their fruitful comments and support.

Conflicts of Interest

The authors declare no conflict of interest.

Appendix A

Table A1. List of NACE Rev. 2 industries in FIDELIO.
SectorDescription
A01Crop and animal production, hunting and related service activities
A02Forestry and logging
A03Fishing and aquaculture
BMining and quarrying
C10T12Manufacture of food products, beverages and tobacco products
C13T15Manufacture of textiles, wearing apparel and leather products
C16Manufacture of wood and of products of wood and cork, except furniture; manufacture of articles of straw and plaiting materials
C17Manufacture of paper and paper products
C18Printing and reproduction of recorded media
C19Manufacture of coke and refined petroleum products
C20Manufacture of chemicals and chemical products
C21Manufacture of basic pharmaceutical products and pharmaceutical preparations
C22Manufacture of rubber and plastic products
C23Manufacture of other non-metallic mineral products
C24Manufacture of basic metals
C25Manufacture of fabricated metal products, except machinery and equipment
C26Manufacture of computer, electronic and optical products
C27Manufacture of electrical equipment
C28Manufacture of machinery and equipment n.e.c.
C29Manufacture of motor vehicles, trailers and semi-trailers
C30Manufacture of other transport equipment
C31_32Manufacture of furniture; other manufacturing
C33Repair and installation of machinery and equipment
D35Electricity, gas, steam and air conditioning supply
E36Water collection, treatment and supply
E37T39Sewerage; waste collection, treatment and disposal activities; materials recovery; remediation activities and other waste management services
FConstruction
G45Wholesale and retail trade and repair of motor vehicles and motorcycles
G46Wholesale trade, except of motor vehicles and motorcycles
G47Retail trade, except of motor vehicles and motorcycles
H49Land transport and transport via pipelines
H50Water transport
H51Air transport
H52Warehousing and support activities for transportation
H53Postal and courier activities
IAccommodation; food and beverage service activities
J58Publishing activities
J59_60Motion picture, video and television program production, sound recording and music publishing activities; programming and broadcasting activities
J61Telecommunications
J62_63Computer programming, consultancy and related activities; information service activities
K64Financial service activities, except insurance and pension funding
K65Insurance, reinsurance and pension funding, except compulsory social security
K66Activities auxiliary to financial services and insurance activities
L68Real estate activities
M69_70Legal and accounting activities; activities of head offices; management consultancy activities
M71Architectural and engineering activities; technical testing and analysis
M72Scientific research and development
M73Advertising and market research
M74_75Other professional, scientific and technical activities; veterinary activities
NAdministrative and support service activities
O84Public administration and defense; compulsory social security
P85Education
QHuman health and social work activities
R-SArts, entertainment and recreation. Other service activities
TActivities of households as employers; undifferentiated goods and services producing activities of households for own use
UActivities of extraterritorial organizations and bodies

Appendix B

To build the FIDELIO database, many different data sources are used. The core of the database is the IO data, which is the main source of information that feed the production block and the trade block. The IO core is built mainly using the World Input Output Database [41] (WIOD, 2016 release). In particular, the model uses the WIOD international and national supply and use tables. Whenever the WIOD database does not provide all the necessary information, other databases, such as Eurostat supply and use tables or OECD data are used.
Besides the IO core, other databases are necessary in order to compile data for the other blocks of the model. For the household block, the main data sources come from Eurostat. The main datasets used are “non-financial transactions of households and non-profit institutions serving households” (nasa_10_nf_tr), “final consumption expenditure of households by consumption purpose—COICOP 3 digit” (nama_10_co3_p3), “heating degree-days by NUTS 2 regions—annual data under Energy statistics” (nrg_esdgr_a) and “financial balance sheets of households and non-profit institutions serving households” (nasa_10_f_bs). Other datasets come from the OECD—“simplified non-financial accounts” (no. 13), “final consumption expenditure of households” (no. 5) and “financial balance sheets—consolidated” (no. 710)—and from the National Statistical Institutes of Belgium, China, Czech Republic, Hungary, India, Slovakia, Turkey and the United Kingdom. Some data on household energy consumption are taken from the EU Reference Scenario 2016 on energy, transport and GHG emissions containing trends to 2050 [42]; population demographics from United Nations projections [43]. As regards the government block, the main sources come from Eurostat datasets—the main datasets used are: “non-financial transactions” (nasa_10_nf_tr), “government revenue, expenditure and main aggregates” (gov_10a_main) and “government deficit/surplus, debt and associated data” (gov_10dd_edpt1)—, WIOD data, the OECD dataset on general government debt—“general government debt – Maastricht” (no. 750)—and data from the World Bank. The labor market is described using the WIOD social accounts, and other data from Eurostat, World Bank, and CEDEFOP. Finally, for the energy block data comes from the WIOD (2019) energy accounts (https://europa.eu/!Un47Cp), the POLES model, the Eurostat table on “air emissions accounts by NACE Rev. 2 activity” (env_ac_ainah_r2), the ODYSSEE database [33], the EXIOBASE database [44] and the KLEMS database [45]. A detailed description of all the data sources and methods used to build the FIDELIO database can be found in [23].

Appendix C

This appendix show the information used to weight the exogenous shocks in the price of each appliance and the exogenous shocks in the total electricity consumption as described in Section 2.2.
Table A2. Penetration rates (Unit: percentage).
DishwashersWashing MachinesWasher Dryers
202052.592.06.9
202153.892.06.8
202255.292.06.8
202356.592.06.8
202457.892.06.8
202559.092.06.8
202660.192.06.7
202761.292.06.7
202862.292.06.7
202963.292.06.7
203064.192.06.7
Table A3. Share of washing and drying machines over total appliances from Eurostat HBS (Unit: percentage).
CountryShare
Austria20
Belgium21
Bulgaria2
Croatia16
Cyprus20
Czech republic9
Denmark35
Estonia20
Finland18
France28
Germany20
Greece19
Hungary19
Ireland39
Italy12
Latvia22
Lithuania4
Luxembourg15
Malta3
Netherland20
Poland19
Portugal19
Romania3
Slovakia5
Slovenia19
Spain19
Sweden20
United Kingdom12
Table A4. Share of electricity used by large appliances over total electricity use from EEA and ODYSSEE databases (Unit: percentage).
CountryShare
Austria28
Belgium26
Bulgaria19
Croatia22
Cyprus22
Czech republic15
Denmark29
Estonia14
Finland17
France21
Germany23
Greece24
Hungary22
Ireland20
Italy32
Latvia23
Lithuania32
Luxembourg27
Malta19
Netherland34
Poland28
Portugal15
Romania38
Slovakia36
Slovenia14
Spain29
Sweden23
United Kingdom20
Table A5. Price variation for the aggregate household consumption category “appliances” (unit: percentage).
20202021202220232024202520262027202820292030
Austria1.31.41.51.61.71.91.81.91.92.02.0
Belgium1.31.51.61.71.81.91.92.02.02.12.1
Bulgaria0.10.10.10.10.10.20.10.20.20.20.2
Croatia1.01.11.21.31.31.51.41.51.51.61.6
Cyprus1.31.41.51.61.71.81.81.91.92.02.0
Czech Republic0.60.60.70.70.80.80.80.90.80.90.9
Denmark2.22.42.52.82.93.13.13.33.23.43.4
Estonia1.21.31.41.61.61.81.81.81.81.91.9
Finland1.11.21.31.41.51.61.61.71.71.71.8
France1.81.92.02.32.32.52.52.62.62.72.8
Germany1.31.41.51.61.71.91.81.91.92.02.0
Greece1.21.31.41.51.61.71.71.81.71.81.9
Hungary1.21.31.41.61.61.81.71.81.81.91.9
Ireland2.52.72.93.23.33.63.53.73.63.83.9
Italy0.80.80.91.01.01.11.11.21.11.21.2
Latvia1.41.51.61.81.92.12.02.12.12.22.2
Lithuania0.20.30.30.30.30.30.30.40.30.40.4
Luxembourg0.91.01.11.21.21.41.31.41.41.41.5
Malta0.20.20.20.20.20.30.30.30.30.30.3
Netherland1.31.41.51.61.71.91.81.91.92.02.0
Poland1.21.31.41.51.51.71.71.71.71.81.8
Portugal1.21.31.41.51.61.71.71.81.81.81.9
Romania0.20.20.20.20.20.20.20.30.30.30.3
Slovakia0.30.40.40.40.50.50.50.50.50.50.5
Slovenia1.31.41.51.61.71.91.81.91.92.02.0
Spain1.21.31.41.61.61.81.71.81.81.91.9
Sweden1.21.31.41.51.61.71.71.81.81.81.9
United Kingdom0.80.80.91.01.01.11.11.21.11.21.2
Table A6. Shock in household total electricity consumption (unit: percentage).
20202021202220232024202520262027202820292030
Austria−3.1−3.4−3.6−3.9−4.4−4.6−4.7−4.9−5.0−5.2−5.5
Belgium−3.0−3.2−3.4−3.8−4.2−4.4−4.5−4.7−4.8−5.0−5.2
Bulgaria−2.2−2.3−2.5−2.7−3.0−3.2−3.3−3.4−3.5−3.6−3.8
Croatia−2.5−2.7−2.9−3.2−3.5−3.7−3.8−4.0−4.1−4.2−4.4
Cyprus−2.4−2.7−2.8−3.1−3.4−3.6−3.7−3.8−3.9−4.1−4.3
Czech Republic−1.7−1.9−2.0−2.2−2.4−2.6−2.6−2.7−2.8−2.9−3.1
Denmark−3.3−3.6−3.8−4.2−4.6−4.9−5.0−5.2−5.3−5.5−5.8
Estonia−1.6−1.7−1.8−2.0−2.2−2.3−2.4−2.5−2.6−2.6−2.8
Finland−2.0−2.1−2.3−2.5−2.7−2.9−3.0−3.1−3.2−3.3−3.5
France−2.3−2.6−2.7−3.0−3.3−3.4−3.5−3.7−3.8−3.9−4.1
Germany−2.6−2.8−3.0−3.2−3.6−3.8−3.9−4.0−4.1−4.3−4.5
Greece−2.7−3.0−3.1−3.4−3.8−4.0−4.1−4.2−4.4−4.5−4.8
Hungary−2.5−2.7−2.9−3.2−3.5−3.7−3.8−3.9−4.0−4.2−4.4
Ireland−2.3−2.5−2.7−2.9−3.2−3.4−3.5−3.6−3.7−3.8−4.0
Italy−3.6−3.9−4.2−4.6−5.1−5.3−5.5−5.7−5.8−6.1−6.4
Latvia−2.6−2.9−3.1−3.3−3.7−3.9−4.0−4.1−4.3−4.4−4.6
Lithuania−3.6−4.0−4.2−4.6−5.1−5.3−5.5−5.7−5.9−6.1−6.4
Luxembourg−3.1−3.4−3.6−3.9−4.4−4.6−4.7−4.9−5.0−5.2−5.5
Malta−2.2−2.4−2.5−2.8−3.1−3.2−3.3−3.4−3.5−3.7−3.8
Netherland−3.8−4.1−4.4−4.8−5.3−5.6−5.8−6.0−6.1−6.4−6.7
Poland−3.2−3.5−3.7−4.0−4.4−4.7−4.8−5.0−5.1−5.3−5.6
Portugal−1.7−1.9−2.0−2.2−2.4−2.5−2.6−2.7−2.8−2.9−3.0
Romania−4.3−4.6−4.9−5.4−5.9−6.2−6.4−6.7−6.9−7.1−7.5
Slovakia−4.1−4.5−4.8−5.2−5.8−6.1−6.2−6.5−6.7−6.9−7.2
Slovenia−2.6−2.9−3.0−3.3−3.7−3.9−4.0−4.1−4.2−4.4−4.6
Spain−3.3−3.6−3.8−4.1−4.6−4.8−4.9−5.1−5.3−5.4−5.7
Sweden−1.5−1.7−1.8−2.0−2.2−2.3−2.3−2.4−2.5−2.6−2.7
United Kingdom−2.3−2.5−2.6−2.9−3.2−3.3−3.4−3.6−3.7−3.8−4.0

References

  1. Eurostat. Energy Consumption in Households. Available online: https://ec.europa.eu/eurostat/statistics-explained/index.php/Energy_consumption_in_households (accessed on 1 August 2019).
  2. European Commission. Communication from the Commission, Ecodesign Working Plan 2016–2019. (COM(2016) 773 Final). 2016. Available online: https://ec.europa.eu/energy/sites/ener/files/documents/com_2016_773.en_.pdf (accessed on 1 August 2019).
  3. Hartwig, J.; Kockat, J.; Schade, W.; Braundardt, S. The macroeconomic effect of ambitious energy efficiency policy in Germany—Combining bottom-up energy modelling with a non-equilibrium macroeconomic model. Energy 2017, 124, 510–520. [Google Scholar] [CrossRef]
  4. Jollands, N.; Waide, P.; Ellis, M.; Onoda, T.; Lautsen, J.; Tanaka, K.; de T’Serclaes, P.; Barnsley, I.; Bradley, R.; Meier, A. The 25 IEA energy efficiency policy recommendations to plan of action. Energy Policy 2010, 38, 6409–6418. [Google Scholar] [CrossRef]
  5. Lund, P.D. Exploring past energy changes and their implications for the pace of penetration of new energy technologies. Energy 2010, 35, 647–656. [Google Scholar] [CrossRef]
  6. Yilmaz, S.; Majcen, D.; Heidari, M.; Mahmoodi, J.; Brosch, T.; Patel, M.K. Analysis of the impact of energy efficiency labelling and potential changes on electricity demand reduction of white goods using a stock model: The case of Switzerland. Appl. Energy 2019, 239, 117–132. [Google Scholar] [CrossRef]
  7. Bertoldi, P.; Atanasiu, B. Electricity Consumption and Efficiency Trends in the Enlarged European Union- Status Report 2006; Publications Office of the European Union: Luxembourg, 2007; ISBN 978-92-79-05558-4.
  8. Bucher, M.; Koch, S.; Andersson, G. A dynamic household appliance stock model for load management introduction strategies. In Proceedings of the 8th International Conference on the EU Energy Market (EEM), Zagreb, Croatia, 25–27 May 2011; pp. 717–722. [Google Scholar]
  9. Cabeza, L.F.; Urge-Vorsatz, D.; Urge, D.; Palacios, A.; Barreneche, C. Household appliances penetration and ownership trends in residential buildings. Renew. Sustain. Energy Rev. 2018, 98, 1–8. [Google Scholar] [CrossRef]
  10. McNeil, M.A.; Letschert, V.E.; De la Rue du Can, S.; Ke, J. Bottom-up energy analysis (BUENAS)—An international appliance efficiency policy tool. Energy Effic. 2013, 6, 191–217. [Google Scholar] [CrossRef]
  11. Braungardt, S.; Elsland, R.; Eichhammer, W. The environmental impact of eco-innovations: The case of the EU residential electricity use. Environ. Eco Policy Stud. 2016, 18, 213–228. [Google Scholar] [CrossRef]
  12. Radpour, S.; Mondal, M.A.H.; Kumar, A. Market penetration modeling of high energy efficiency appliances in the residential sector. Energy 2017, 134, 951–961. [Google Scholar] [CrossRef]
  13. O’Doherty, J.; Lyons, S.; Tol, R. Energy-using appliances and energy-saving features: Determinants of ownership in Ireland. Appl. Energy 2008, 85, 650–662. [Google Scholar] [CrossRef]
  14. Zhan, L.; Yaun, Z.; Bi, J.; Huang, L. Estimating future generation of obsolete household appliances in China. Waste Manag. Resour. 2012, 30, 11. [Google Scholar]
  15. Boyano Larriba, A.; Cordella, M.; Espinosa Martinez, M.; Villanueva Krzyzaniak, A.; Graulich, K.; Rüdinauer, I.; Alborzi, F.; Hook, I.; Stamminger, R. Ecodesign and Energy Label for Household Washing Machines and Household Washer-Dryers; EUR 28809 EN, JRC108604; Publications Office of the European Union: Luxembourg, 2017; ISBN 978-92-79-74183-8.
  16. Boyano, A.; Moons, H.; Villanueva, A.; Graulich, K.; Rüdenauer, I.; Alborzi, F.; Hook, I.; Stamminger, R. Follow-Up for the Preparatory Study for Ecodesign and Energy Label for Household Dishwashers; Publications Office of the European Union: Luxembourg, 2017; ISBN 978-92-79-73895-1.
  17. Hanson, D.; Laitner, J.A.S. An integrated analysis of policies that increase investments in advanced energy-efficient/low-carbon technologies. Energy Econ. 2004, 26, 739–755. [Google Scholar] [CrossRef]
  18. Rose, A.; Wei, D. Macroeconomic impact of the Florida Energy and Climate Change Action Plan. Clim. Policy 2012, 12, 50–69. [Google Scholar] [CrossRef]
  19. Barker, T.; Alexandri, E.; Mercure, J.F.; Ogawa, Y.; Pollitt, H. GDP and employment effects of policies to close the 2020 emissions gap. Clim. Policy 2016, 16, 393–414. [Google Scholar] [CrossRef]
  20. Barker, T.; Ekins, P.; Foxon, T. Macroeconomic effects of efficiency policies for energy-intensive industries: The case of the UK Climate Change Agreement, 2000–2010. Energy Econ. 2007, 29, 760–778. [Google Scholar] [CrossRef]
  21. Ringel, M.; Schlomann, B.; Krail, M.; Rohde, C. Towards a green economy in Germany? The role of energy efficiency. Appl. Energy 2016, 179, 1293–1303. [Google Scholar] [CrossRef]
  22. European Commission. Impact Assessment Accompanying the Document Proposal for a Directive of the European Parliament and of the Council Amending Directive 2012/27/EU on Energy Efficiency (COM (2016) 761 Final). 2016. Available online: https://eur-lex.europa.eu/legal-content/EN/TXT/?uri=CELEX%3A52016SC0405 (accessed on 22 October 2019).
  23. Rocchi, P.; Salotti, S.; Reynès, F.; Hu, J.; Bulavskaya, T.; Rueda Cantuche, J.M.; Valderas Jaramillo, J.M.; Velázquez Afonso, A.; Amores, A.F.; Corsatea, T. FIDELIO 3 Manual: Equations and Data Sources; Publications Office of the European Union: Luxembourg, 2019; ISBN 978-92-79-98872-1.
  24. European Parliament and Council. Regulation 2017/1369 of the EU Parliament and of the Council of 4 July 2017 Setting a Framework for Energy Labelling and Repealing Directive 2010/30/EU: 2017. Available online: https://eur-lex.europa.eu/legal-content/EN/TXT/PDF/?uri=CELEX:32017R1369 (accessed on 1 August 2019).
  25. European Parliament and Council. Directive 2009/125/EC of the EU Parliament and of the Council of 21 October 2009 Establishing a Framework for the Setting of Ecodesing Requirements for Energy-Related Products (Recast) 2009. Available online: https://eur-lex.europa.eu/LexUriServ/LexUriServ.do?uri=OJ:L:2009:285:0010:0035:en:PDF (accessed on 1 August 2019).
  26. VHK. Ecodesign Impact Accounting, Overview Report. 2016. Available online: https://ec.europa.eu/energy/sites/ener/files/documents/eia_ii_-_overview_report_2016_rev20170314.pdf (accessed on 1 August 2019).
  27. McNeil, M.; Bojda, N. Cost effectiveness of high efficiency appliances in the US residential sector: A case study. Energy Policy 2012, 45, 33–42. [Google Scholar] [CrossRef]
  28. Bull, J. Loads of green washing—Can behavioral economics increase willingness-to-pay for efficient washing machines in UK? Energy Policy 2012, 50, 242–252. [Google Scholar] [CrossRef]
  29. Antal, M.; van den Bergh, J.C.J.M. Is there an energy efficiency gap? J. Econ. Perspect. 2012, 26, 3–28. [Google Scholar]
  30. Barker, T.; Dagoumas, A.; Rubin, J. The macroeconomic rebound effect and the world economy. Energy Effic. 2009, 2, 411–427. [Google Scholar] [CrossRef]
  31. CLASP. Estimating Potential Additional Energy Savings from Upcoming Revisions to Existing Regulations Under the Ecodesign and Energy Labelling Directives: A Contribution to the Evidence Base. 2013. Available online: http://www.clasponline.org/en/Resources/Resources/PublicationLibrary/2013/CLASP-and-eceee-Point-To-Additional-Savings-from-Ecodesign-and-Energy-Labelling.aspx (accessed on 8 April 2019).
  32. European Environmental Energy Agency. Final Household Electricity Consumption by Use. Available online: https://www.eea.europa.eu/data-and-maps/daviz/final-household-electricity-consumption-by-use#tab-chart (accessed on 1 August 2019).
  33. ODYSSEE Database. Available online: https://www.odyssee-mure.eu/project.html (accessed on 1 August 2019).
  34. IPCC. Climate Change 2014: Synthesis Report. Contribution of Working Groups I, II and III to the Fifth Assessment Report of the Intergovernmental Panel on Climate Change; Pachauri, R.K., Meyer, L.A., Eds.; IPCC: Geneva, Switzerland, 2014; p. 151. [Google Scholar]
  35. Kagawa, S.; Kudoh, Y.; Nansai, K.; Tasaki, T. The Economic and Environmental Consequences of Automobile Lifetime Extension and Fuel Economy Improvement: Japan’s Case. Econ. Syst. Res. 2008, 20, 3–28. [Google Scholar] [CrossRef]
  36. Kagawa, S.; Nansai, K.; Kondo, Y.; Hubacek, K.; Suh, S.; Minx, J.; Kudoh, Y.; Tasaki, T.; Nakamura, S. Role of Motor Vehicle Lifetime Extension in Climate Change Policy. Environ. Sci. Technol. 2011, 45, 1184–1191. [Google Scholar] [CrossRef] [PubMed]
  37. Nishijima, D. Product Lifetime, Energy Efficiency and Climate Change: A Case Study of Air Conditioner in Japan. J. Environ. Manag. 2016, 181, 582–589. [Google Scholar] [CrossRef] [PubMed]
  38. Nakamoto, Y.; Nishijima, D.; Kagawa, S. The Role of Vehicle Lifetime Extensions of Countries on Global CO2 Emissions. J. Clean. Prod. 2019, 207, 1040–1046. [Google Scholar] [CrossRef]
  39. Belke, A.; Dobnik, F.; Dreger, C. Energy consumption and economic growth: New insights into the cointegration relationship. Energy Econ. 2011, 33, 782–789. [Google Scholar] [CrossRef]
  40. European Environment Agency. Greenhouse Gas Emissions. Available online: https://www.eea.europa.eu/data-and-maps/data/data-viewers/greenhouse-gases-viewer#tab-based-on-data (accessed on 1 August 2019).
  41. WIOD. World Input Output Database Project (2016 Release). Available online: http://www.wiod.org/home (accessed on 1 August 2019).
  42. Capros, P.; De Vita, A.; Tasios, N.; Siskos, P.; Kannavou, M.; Petropoulos, A.; Evangelopoulou, S.; Zampara, M.; Papadopoulos, D.; Paroussos, L.; et al. EU Reference Scenario 2016—Energy, Transport and GHG Emissions Trends to 2050; Publications Office of the European Union: Luxembourg, 2016; ISBN 978-92-79-52374-8. [CrossRef]
  43. United Nations, DESA Population Division. Population Data. Available online: https://population.un.org/wpp/Download/Standard/Population/ (accessed on 1 August 2019).
  44. EXIOBASE Database. Available online: https://www.exiobase.eu/ (accessed on 1 August 2019).
  45. KLEMS Database. Available online: http://www.euklems.net/ (accessed on 1 August 2019).
Figure 1. Graphical representation of the hybrid model used in the analysis. For more details, see [15,16,23].
Energies 12 04312 g001
Figure 2. Impact at a country level: (a) Variation in value added (million euros); and, (b) Variation in employment (thousand jobs).
Energies 12 04312 g002
Figure 3. CO2-equivalent emissions variation: (a) Distribution of emissions increase by industry; and, (b) Distribution of emissions decrease by industry (unit: percentage).
Energies 12 04312 g003
Figure 4. Distribution of CO2-equivalent emissions decrease among EU countries (unit: percentage).
Energies 12 04312 g004
Table 1. Absolute and relative variation of value added and employment.
Value AddedEmployment
Absolute Variation
(Million Euros)
Relative Variation
(%)
Absolute Variation
(Thousand Jobs)
Relative Variation
(%)
−1901.5−0.0123.90.01
Table 2. Value added variation in the European Union (EU) by industry.
Increase in Value AddedDecrease in Value Added
IndustryVariation
(Million Euros)
Relative Variation
(%)
Share over VA Increase
(%)
IndustryVariation
(Million Euros)
Relative Variation
(%)
Share over VA Decrease
(%)
Accommodation360.30.0917Electricity, gas−1945.6−0.6949
Retail trade342.60.0616Mining and quarrying−484.5−0.3412
Other services290.70.0714Construction−271.7−0.047
Food, beverages253.20.0912Public administration−146.3−0.014
Crop and animal175.10.098Sewerage; waste collection−103.7−0.13
Telecommunications97.80.045Forestry and logging−96.7−0.422
Electrical equipment89.70.084Machinery and equipment−79.2−0.042
Financial service activities87.80.024Chemicals−72−0.052
Human health activities78.40.014Coke and refined petroleum−71.4−0.242
Activities of households770.124Architectural and engineering−66.4−0.032
Insurance and pension69.10.063Land transport−64.4−0.022
Auxiliary to financial33.70.032Fabricated metal products−62.1−0.032
Motion picture production30.60.041Rental and leasing−59.7−0.011
Textiles21.20.031Legal and accounting activities−53.9−0.011
Publishing activities18.20.021Repair−53.8−0.061
Furniture13.60.011Real estate activities−53.601
Wholesale trade11.901Warehousing−40.8−0.021
Wholesale and retail (vehicles)900Basic metals−31.8−0.041
Fishing7.10.090Other non-metallic products−31.7−0.041
Printing and reproduction5.10.010Computer, electronic products−30.8−0.031
Other professional4.90.010Computer programming−25.2−0.011
Paper and paper products3.10.010Other transport equipment−22.7−0.031
Advertising2.700Wood and of products of wood−20.6−0.051
Postal activities2.400Motor vehicles−18.9−0.010
Pharmaceutical products000Scientific research−16.5−0.020
Education−1600
Water collection and supply−15.1−0.050
Rubber and plastic products−13.5−0.010
Air transport−6.3−0.020
Water transport−6.2−0.010
Pharmaceutical products−5.700
TOTAL2085.20.02100TOTAL−3986.7−0.03100
Table 3. Employment variation in the EU by industry.
Increase in EmploymentDecrease in Employment
IndustryVariation
(Thousand Jobs)
Relative Variation
(%)
Share Over Total Increase
(%)
IndustryVariation
(Thousand Jobs)
Relative Variation
(%)
Share Over Total Decrease
(%)
Crop and animal190.1426Electricity, gas,−12.2−0.7525
Accommodation12.10.0917Construction−7.4−0.0415
Retail trade100.0414Mining and quarrying−5−0.4110
Other services8.10.0711Forestry and logging−3.1−0.526
Food, beverages60.18Public administration−2.9−0.026
Activities of households5.80.138Land transport−1.9−0.034
Human health activities2.30.013Fabricated metal products−1.6−0.043
Textiles1.70.052Rental and leasing−1.6−0.013
Electrical equipment1.60.092Sewerage; waste collection−1.5−0.13
Financial service activities0.90.021Architectural and engineering−1.4−0.043
Insurance and pension0.80.071Machinery and equipment−1.3−0.043
Telecommunications0.70.051Repair−1−0.062
Furniture0.60.021Legal and accounting activities−1−0.012
Auxiliary to financial0.60.031Wood and of products of wood−0.7−0.051
Motion picture production0.40.040Other non-metallic products−0.7−0.041
Publishing activities0.30.030Chemicals−0.6−0.041
Fishing0.20.090Basic metals−0.6−0.051
Printing and reproduction0.20.020Warehousing−0.6−0.021
Postal activities0.20.010Coke and refined petroleum−0.4−0.241
Paper and paper products0.10.010Computer programming−0.4−0.011
Wholesale and retail (vehicles)0.100Rubber and plastic products−0.3−0.011
Pharmaceutical products000Computer, electronic products−0.3−0.021
Wholesale trade000Motor vehicles−0.3−0.011
Advertising000Other transport equipment−0.3−0.031
Other professional000Scientific research−0.2−0.021
Water collection and supply−0.2−0.050
Real estate activities−0.2−0.010
Air transport−0.1−0.020
Pharmaceutical products000
Water transport0−0.010
Education000
TOTAL71.70.03100TOTAL−47.80.02100

