Article

Experimental and Numerical Study on the Cooling Performance of Fins and Metal Mesh Attached on a Photovoltaic Module

1
Department of Architectural Engineering, Pusan National University, 2 Busandaehak-ro 63, Geomjeong-gu, Busan 46241, Korea
2
POSCO, 100, Songdogwahak-ro, Yeonsu-gu, Incheon 21985, Korea
*
Author to whom correspondence should be addressed.
Energies 2020, 13(1), 85; https://doi.org/10.3390/en13010085
Submission received: 28 October 2019 / Revised: 14 December 2019 / Accepted: 23 December 2019 / Published: 23 December 2019
(This article belongs to the Special Issue Photovoltaic Modules)

Abstract

:
The electrical efficiency and durability of a photovoltaic (PV) cell degrades as its temperature increases. Accordingly, there have been continued efforts to control the cell temperature by cooling the PV module. Generally, passive PV cooling using heat sinks attached on the back of the PV module can improve the electrical efficiency. However, few experimental studies have evaluated the effect of the heat sink shape on PV cooling. Therefore, this study proposed a passive cooling technology using meshes made of iron and aluminum, and performed indoor tests using a solar simulator to analyze the cooling performance. The experimental results demonstrated that iron and aluminum meshes reduced the PV module temperature by approximately 4.35 °C and 6.56 °C, respectively. Additionally, numerical studies were performed using a computational fluid dynamics (CFD) simulation to compare the cooling fins and meshes. The numerical results showed that the cooling fins exhibited a better cooling performance than the metal mesh. However, meshes can be mass-produced and have a high structural stability against wind loads. Meshes are more likely be applied to PV systems than cooling fins if adhesion were improved.

Graphical Abstract

1. Introduction

The energy sector has recognized an increasing trend in sustainable development as the demand for limited primary energy continues to increase in various sectors (Figure 1). Meanwhile, countries around the world have implemented policies supporting reductions in the primary energy demand and C O 2 emissions, and the International Energy Agency (IEA) has led the development of technology roadmaps to accelerate the technological improvement in renewable energy utilization. In line with these changes, the demand for renewable energy is expected to increase.
Solar energy, which is clean and abundant, is the most widely used renewable energy source. In the past decade, the average annual installation of solar energy systems has increased by 49% [2]. However, they are significantly affected by environmental conditions, and achieving a stable performance can be hardly expected. The photovoltaic (PV) cell, which is a semiconductor that can convert solar irradiation into electricity, loses most of the energy it absorbs through waste heat. Hence, the PV module generally only has 5–15% of electrical efficiency. Therefore, it is necessary to improve the performance of PV cells to obtain a feasible and wide-spread application. Numerous solutions to enhance the PV cell performance have been proposed and investigated. A novel solution involves organic-inorganic lead halide perovskite solar cells (PSCs), which have recently attracted great interest in the field of solar energy due to their high energy conversion efficiency (i.e., up to 22.1%) [3].
The performance of the PV cell and the durability of the PV module degrade with a rising temperature [Table 1]. Generally, the PV module can reach up to 110 °C under peak solar irradiation conditions, which reduces its power generation efficiency by 43% [4]. Accordingly, a technology to control the temperature of the PV cells is crucial to ensure a sufficient power generation in the PV system. Various cooling technologies have been proposed to prevent a decrease in the power generation efficiency.
Cooling technologies are classified into either active or passive cooling [7]. Active cooling uses a coolant such as air or water and generally requires power for a motor or fan. Whether or not the increase in power production by active cooling is enough to offset the power consumption is an important economic consideration. Teo et al. [8] conducted experiments on a polycrystalline PV module cooled by fan-forcing air through ducts with fins attached on its back. Without air circulation, the module had an operating temperature of 68 °C and electrical efficiency of 8.6%. In contrast, with air circulation, the module’s operating temperature was 38 °C, and its electrical efficiency was 12.5%. Potuganti and Ponnapalli [9] suggested to cool PV cells by forming a thin layer of water on the surface of the PV module. The refractive index (η) of water is 1.3; thus, it is the most valid interface between glass (η = 1.5) and air (η = 1.0). Hence, the layer of water increased the convective heat transfer on the PV cell surface. Simulations showed that the energy conversion efficiency of the proposed system increased by about 7.5%. Irwan et al. [10] carried out indoor tests to compare the performance PV modules with and without water cooling. Spraying water on the PV module clearly reduced its temperature and light reflection, which increased the electrical efficiency.
Unlike active cooling, passive cooling reduces the PV cell temperature without consuming power. Hence, passive cooling technologies are considered efficient for reducing the PV cell temperature. Cuce et al. [11] analyzed the effect of passive cooling on silicon PV cells and evaluated improvements in the electrical efficiency and maximum power output. They conducted experiments under various ambient temperatures and illumination intensities. The experimental results showed that the electrical power increased by 20% due to the proposed heat sink. Wu and Xiong [12] suggested a passive cooling method that uses rainwater as a coolant and a gas expansion device to distribute the rainwater on the roof of a domestic house. A heat transfer model was used to analyze the performance of the PV module with the suggested method. The results indicated that the PV module’s electrical efficiency was reduced by 8.3% with the passive cooling system.
In addition, there are other cooling technologies that use heat pipes and phase change materials. Wu et al. [13] proposed a heat pipe photovoltaic/thermal (PV/T) hybrid system and predicted its overall thermal-electrical conversion performance theoretically. The results indicated that the overall thermal, electrical and exergy efficiencies of the system reached up to 63.65%, 8.45% and 10.26%, respectively. Indartono et al. [14] presented a passive cooling using alternative phase change materials (PCM), which was yellow petroleum jelly, for cooling a PV module. The experiment was conducted in order to analyze the cooling effect of the PCM. It was clear that the surface temperature of the PV decreased as the power increased with the PCM.
Among the proposed passive cooling systems, the attachment of heat sinks on the PV cell emerge as a straightforward and economic approach to regulate the temperature. However, there are few experimental studies on the passive PV cell cooling method using heat sinks. Moreover, studies on various shapes of the attached heat sink are rare. Wire mesh is a potential cooling structure that can be readily attached on PV cells. Compared to fins, which have a shape that is prone to structural deformation during a strong wind load, wire mesh is more compact and durable. Moreover, wire meshes are widely available due to mass production. Therefore, this study aimed to determine the impact of fins and meshes attached on the back side of the PV module on the power generation efficiency. The cooling effects of iron and aluminum meshes were analyzed through a laboratory-scale experiment involving an indoor solar simulator. The heat distribution in a PV cell with fins and mesh were modeled using computational fluid dynamics (CFD).

2. Experimental Study

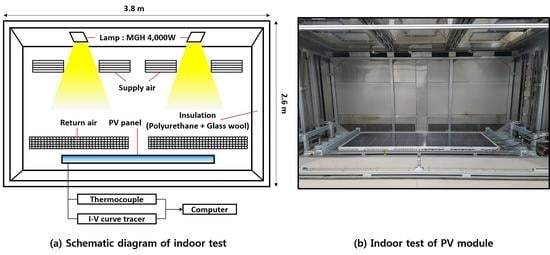
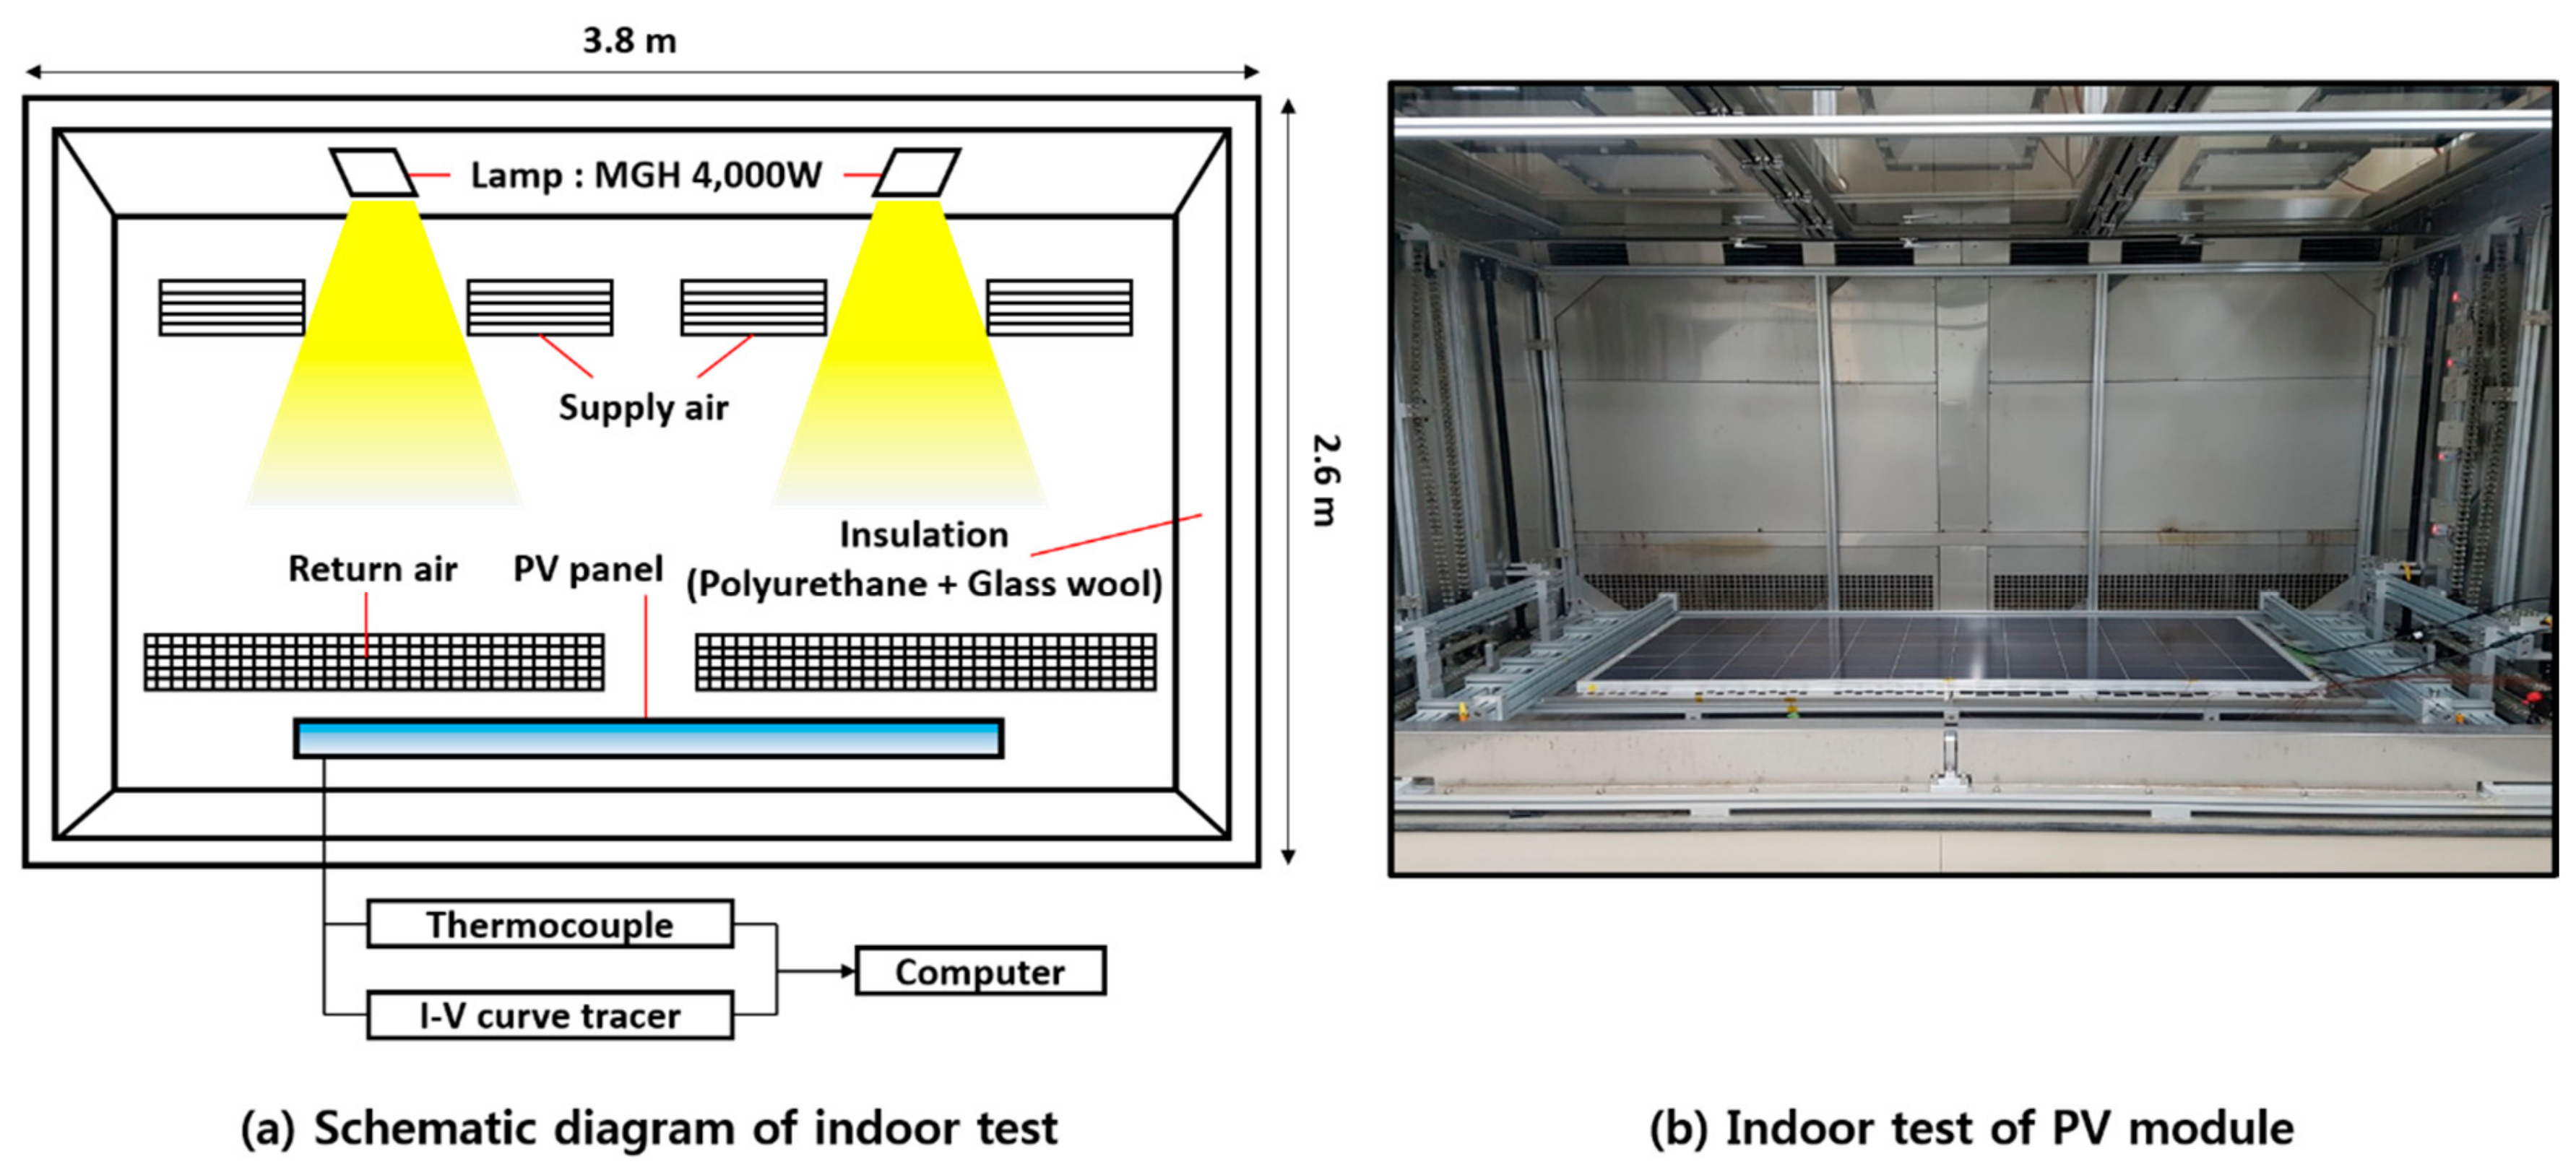
2.1. Experimental Setup

In this study, the cooling effects of the iron and aluminum meshes were evaluated using an International Electrochemical Commission (IEC) standard chamber [15]. The experiments were performed under standard test conditions (STC), i.e., an ambient temperature of 25 °C and solar irradiation of 1000 W / m 2 [16]. The chamber (Figure 2) had a dimension of approximately 2600 (width) × 2200 (depth) × 1800 (height) mm. Four lamps (MGH 4000 W) were used to reproduce the solar irradiance. The reproducible irradiance range was 800–1200 W / m 2 at wavelengths of 280–3000 nm. The total area exposed to solar irradiance was 16,000 cm 2 (Table 2). The specifications of the PV module installed in the solar simulator are shown in Table 3. A thermocouple and I-V curve tracer were used to measure the temperature distribution and power generation of the PV module (Figure 3). To ensure a uniform irradiation, the thermocouples were attached to the same three points on the frontside and backside of the module. The data were recorded as the average of three measurements. (Figure 4) To analyze the change in the power generation efficiency due to cooling, the cell temperature ( T c e l l ) was taken as the average of the frontside and backside module temperature (Equation 1). The power generation efficiency ( η ) of the PV module was calculated by using the maximum power output per square meter (P) and solar irradiance (G) measured by the I-V curve tracer (Equation 2).
T c e l l =   T F . s i d e +   T B . s i d e 2
η =   P G

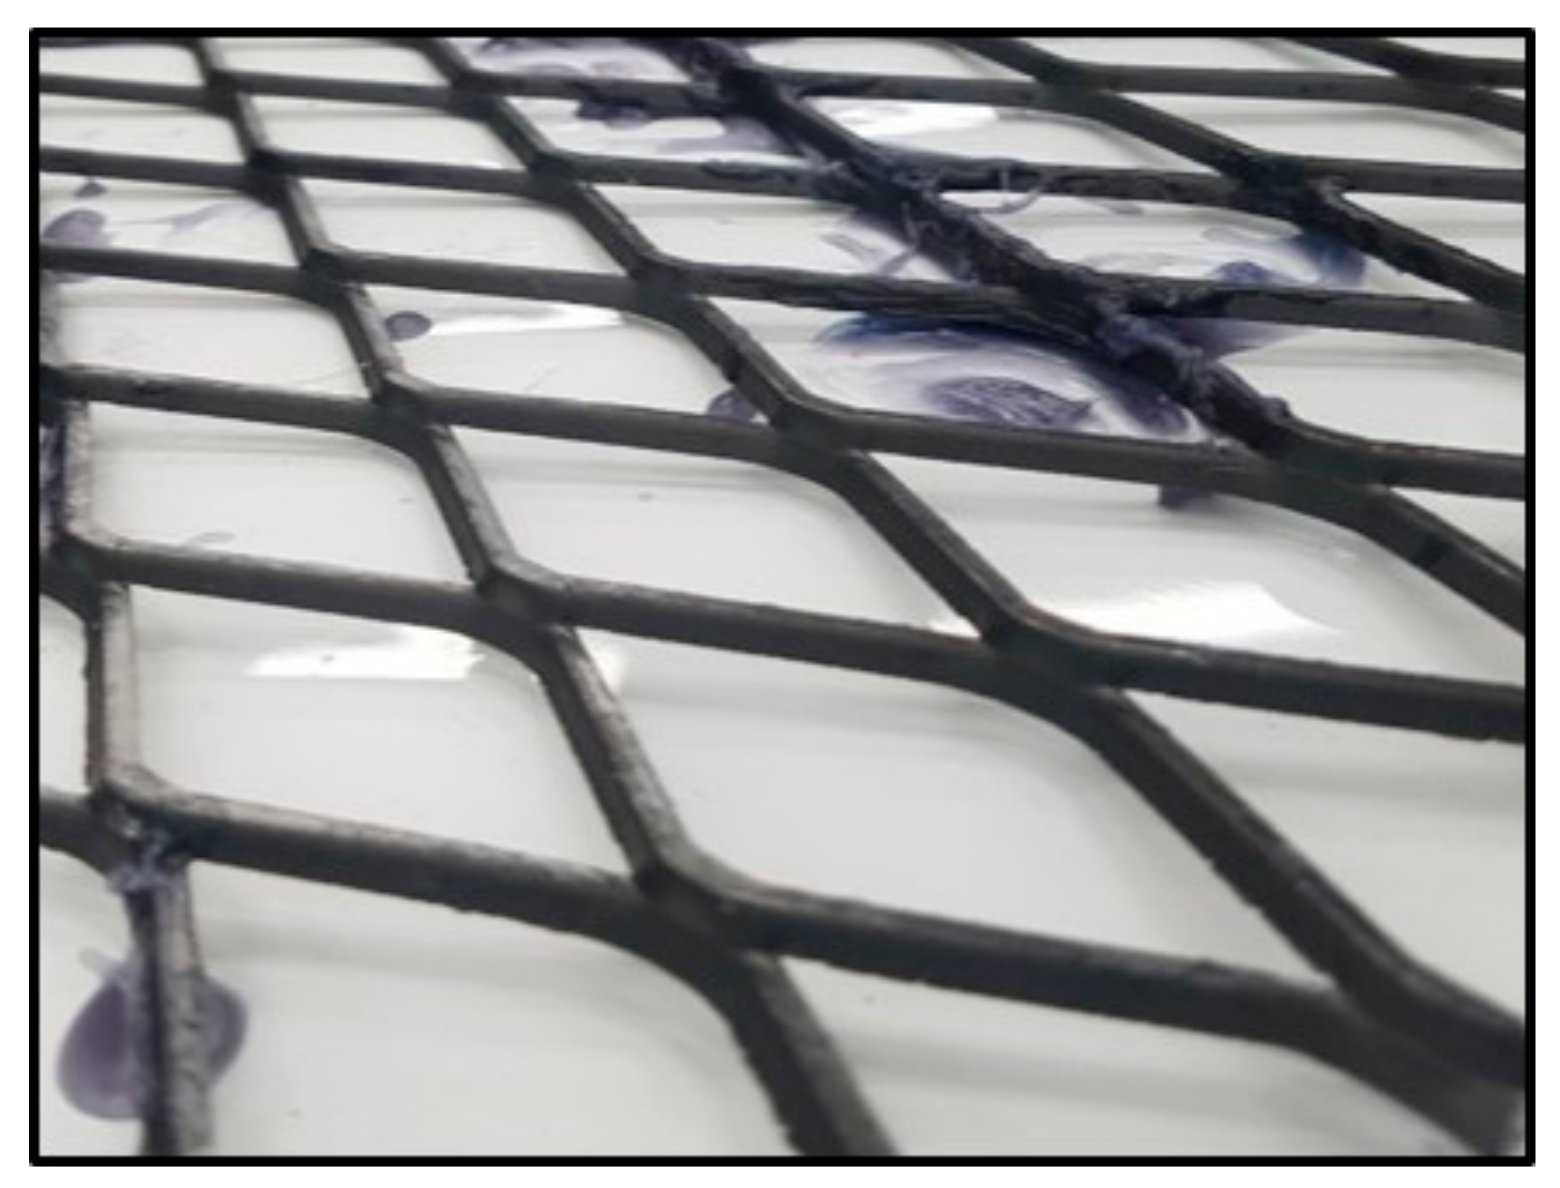
2.2. Mesh Specifications

The iron mesh used in this study had a short way of mesh (SWM) of 50 mm, and a long way of mesh (LWM) of 152.4 mm. The wires of the iron mesh had a width of 5 mm and thickness of 4.5 mm. The density of the iron mesh was relatively high (7850 kg / m 3 ), hence a considerable weight (5.70 kg) was attached to the backside of the PV module with structural adhesive. Consequently, it was difficult to attach the iron mesh using an adhesive. Therefore, this study also examined the cooling performance of the aluminum mesh, which was lighter than the iron mesh. The aluminum mesh had an SWM of 5 mm and LWM of 10 mm. Its wires had a width and thickness of 1 mm. The density of the aluminum mesh was approximately 2702 kg / m 3 , hence relatively less weight (0.025 kg) was attached to the PV module with double-sided tape. The weight of the aluminum mesh was approximately 0.43 % that of the iron mesh. (Figure 5 and Figure 6). In addition, the contact areas of the iron and aluminum mesh between the PV backside were 0.001062 m 2 and 0.000017 m 2 respectively in the condition of assumptively perfect contact.

2.3. Results

The experiments were performed under STC (25 °C), and the temperatures on the backside of the PV modules were monitored for 30 minutes. The temperature of the different modules became stable after 15 min (Figure 7). The temperature of the modules without cooling, with iron mesh, and with aluminum mesh, stabilized at 52.9 °C, 49.0 °C, and 46.3 °C, respectively. cooling, the modules with iron and aluminum meshes exhibited an improvement in power The average temperature of the modules from 15–30 minutes was 52.7 °C, 48.4 °C, and 46.2 °C, respectively (Table 4). This implies that the cooling effect of the iron and aluminum meshes was 4.35 °C and 6.56 °C, respectively, in terms of the temperature difference. Consequently, the power generation efficiency of the modules also increased as their temperature declined (Table 5). Compared to the module without generation efficiency by approximately 0.11% and 1.44%, respectively. Although the contact surface area of the iron mesh was larger than for the aluminum mesh, the cooling performance of the iron mesh was lower than for the aluminum one, because incomplete contact between the backside of the module and the iron mesh likely had a substantial effect on its cooling performance (Figure 8).
Considering the theoretical PV efficiency, the increase in efficiency should be 3.25% for a temperature reduction of 6.5 °C. However, the efficiency of the case with the iron mesh was 1.44%, which was lower than the theoretical value, as compared to the case without cooling. It was considered that the cell temperature did not decrease as much as the temperature of the surface of the backside of the PV module, due to the contact thermal resistance between the cell and the cooling mesh.

3. CFD Simulation

3.1. Simulation Overview

To analyze the cooling performance of both the fins and metal mesh attached to the backside of a PV module, a three-dimensional and steady-state model that can perform a radiant heat transfer analysis was constructed using Star C C M + , a commercial computational fluid dynamics (CFD) simulation tool. The model simulated a PV module located at the center of an air-filled chamber (2 m × 3 m × 5 m), with constant airflow to maintain a stable ambient temperature similar to that of an actual indoor solar simulator. The boundary conditions were set so that the frontside of the module was vertically exposed to solar radiation (Figure 9). Since the model consisted of multiple layers, a polyhedral mesher capable of a multi-region conformal mesh was applied as the volume mesh. A prismatic layer mesh was applied on the surface of the module to ensure the accuracy of the heat transfer analysis at the air-cell. A thin mesher was applied to prevent the excessive formation of cells on the plate.
Constant solar irradiance and air temperature were used in the simulation. The contact resistance at the interface was set to 0 m 2 K / W based on the assumption that the layers of the PV module were completely in contact (Table 6). Table 7 shows the thermal properties used in the simulation. The optical properties of the regions to which the gray thermal radiation model is applied were assumed to be constant values (Table 8).
A CFD simulation was performed on the PV modules without cooling, with fins, and with metal mesh (Figure 10). All three cases applied PV modules of the same specification, and all physical parameters were identical except for the cooling technologies attached to the bottom of the module (Figure 11). The parameters of the metal mesh were obtained from the manufacturer (described in Section 2.2), while those of the fins were obtained from a previous study [18].

3.2. Simulation Results

The results demonstrate that the PV module can be cooled by attaching fins or metal mesh (Figure 12). The cooling fins performed better than the metal mesh. Particularly, for the metal mesh, the average temperature of the cell decreased by 1.49 °C, whereas for the fins the temperature decreased by 3.18 °C (Table 9). The most important factor affecting the cooling performance was the heat transfer area under the module. The simulation was performed under the assumption that both the metal mesh and the fins were completely in contact with the bottom of the module and that there was therefore no thermal contact resistance. Accordingly, the results indicate that under a similar heat transfer area, the cooling performance of fins was superior to that of the metal mesh. The heat transfer coefficient on the backside of the module was proportional to the heat transfer area. The module with fins had the highest heat transfer coefficient. (Figure 13).

4. Conclusions

In this study, experimental and numerical studies were performed to investigate passive PV module cooling using fins and metal mesh. The key findings are summarized as follows.
(1)
The experimental results showed that the PV module without cooling had an average temperature of 52.7 °C, while the modules with iron and aluminum meshes were at 48.4 °C and 46.2 °C, respectively. Thus, the cooling effect was approximately 4.35 °C for the iron mesh and 6.56 °C for the aluminum mesh.
(2)
Although the iron mesh was thicker than the aluminum (4.5 mm vs. 1 mm), respectively, the aluminum mesh caused a greater improvement in the PV electrical efficiency (0.11% vs. 1.44%).
(3)
The experimental results suggest that the heat transfer area greatly impacts the cooling effect of the wire mesh. The iron mesh was heavy, rigid, and difficult to attach to the backside of the module. Conversely, the aluminum mesh was light, flexible, and easy to attach. Due to a better adhesion, the aluminum mesh performed better than the iron mesh.
(4)
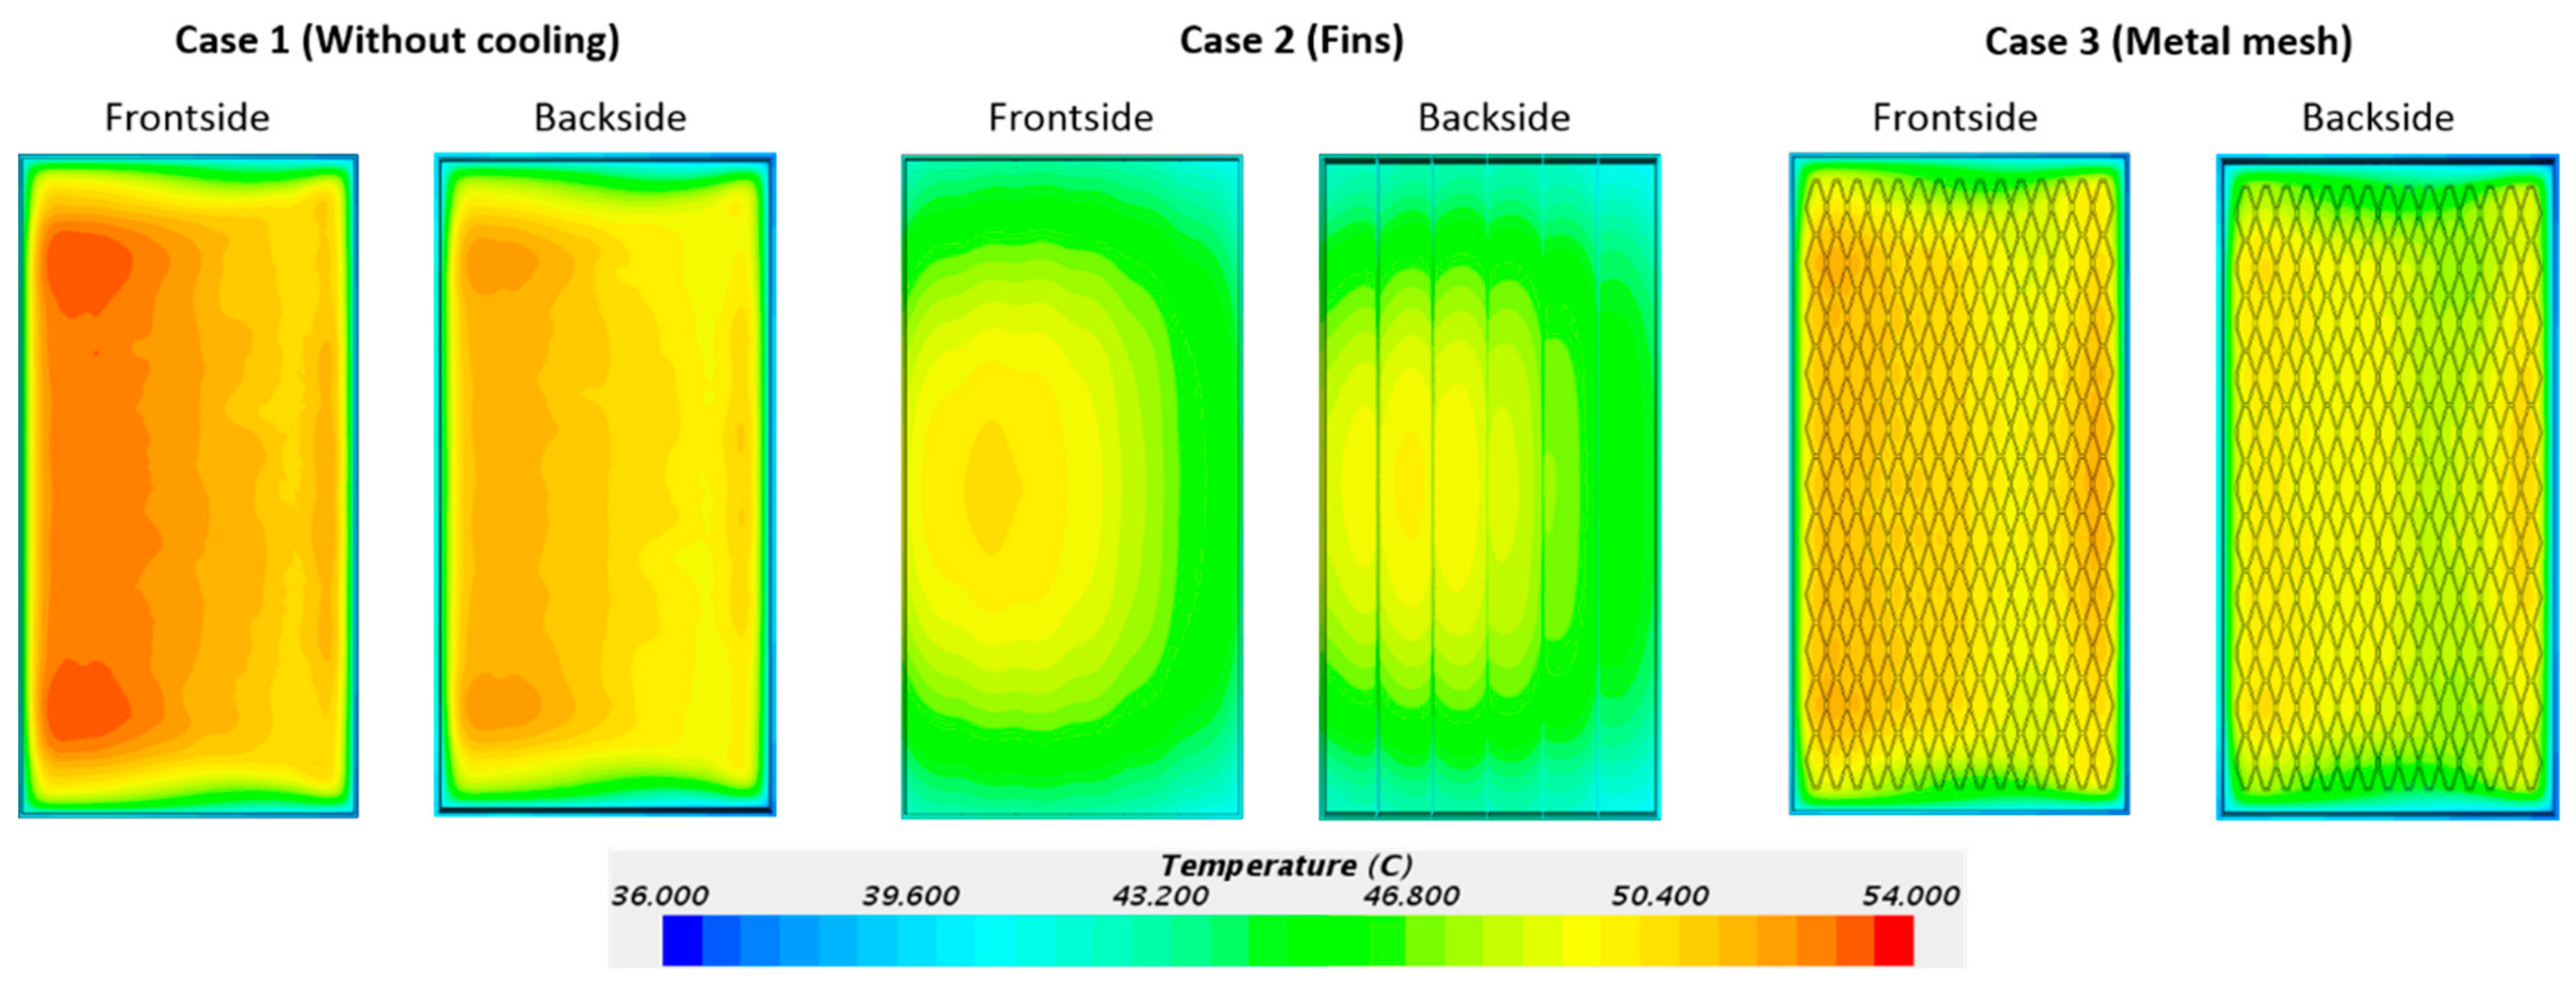
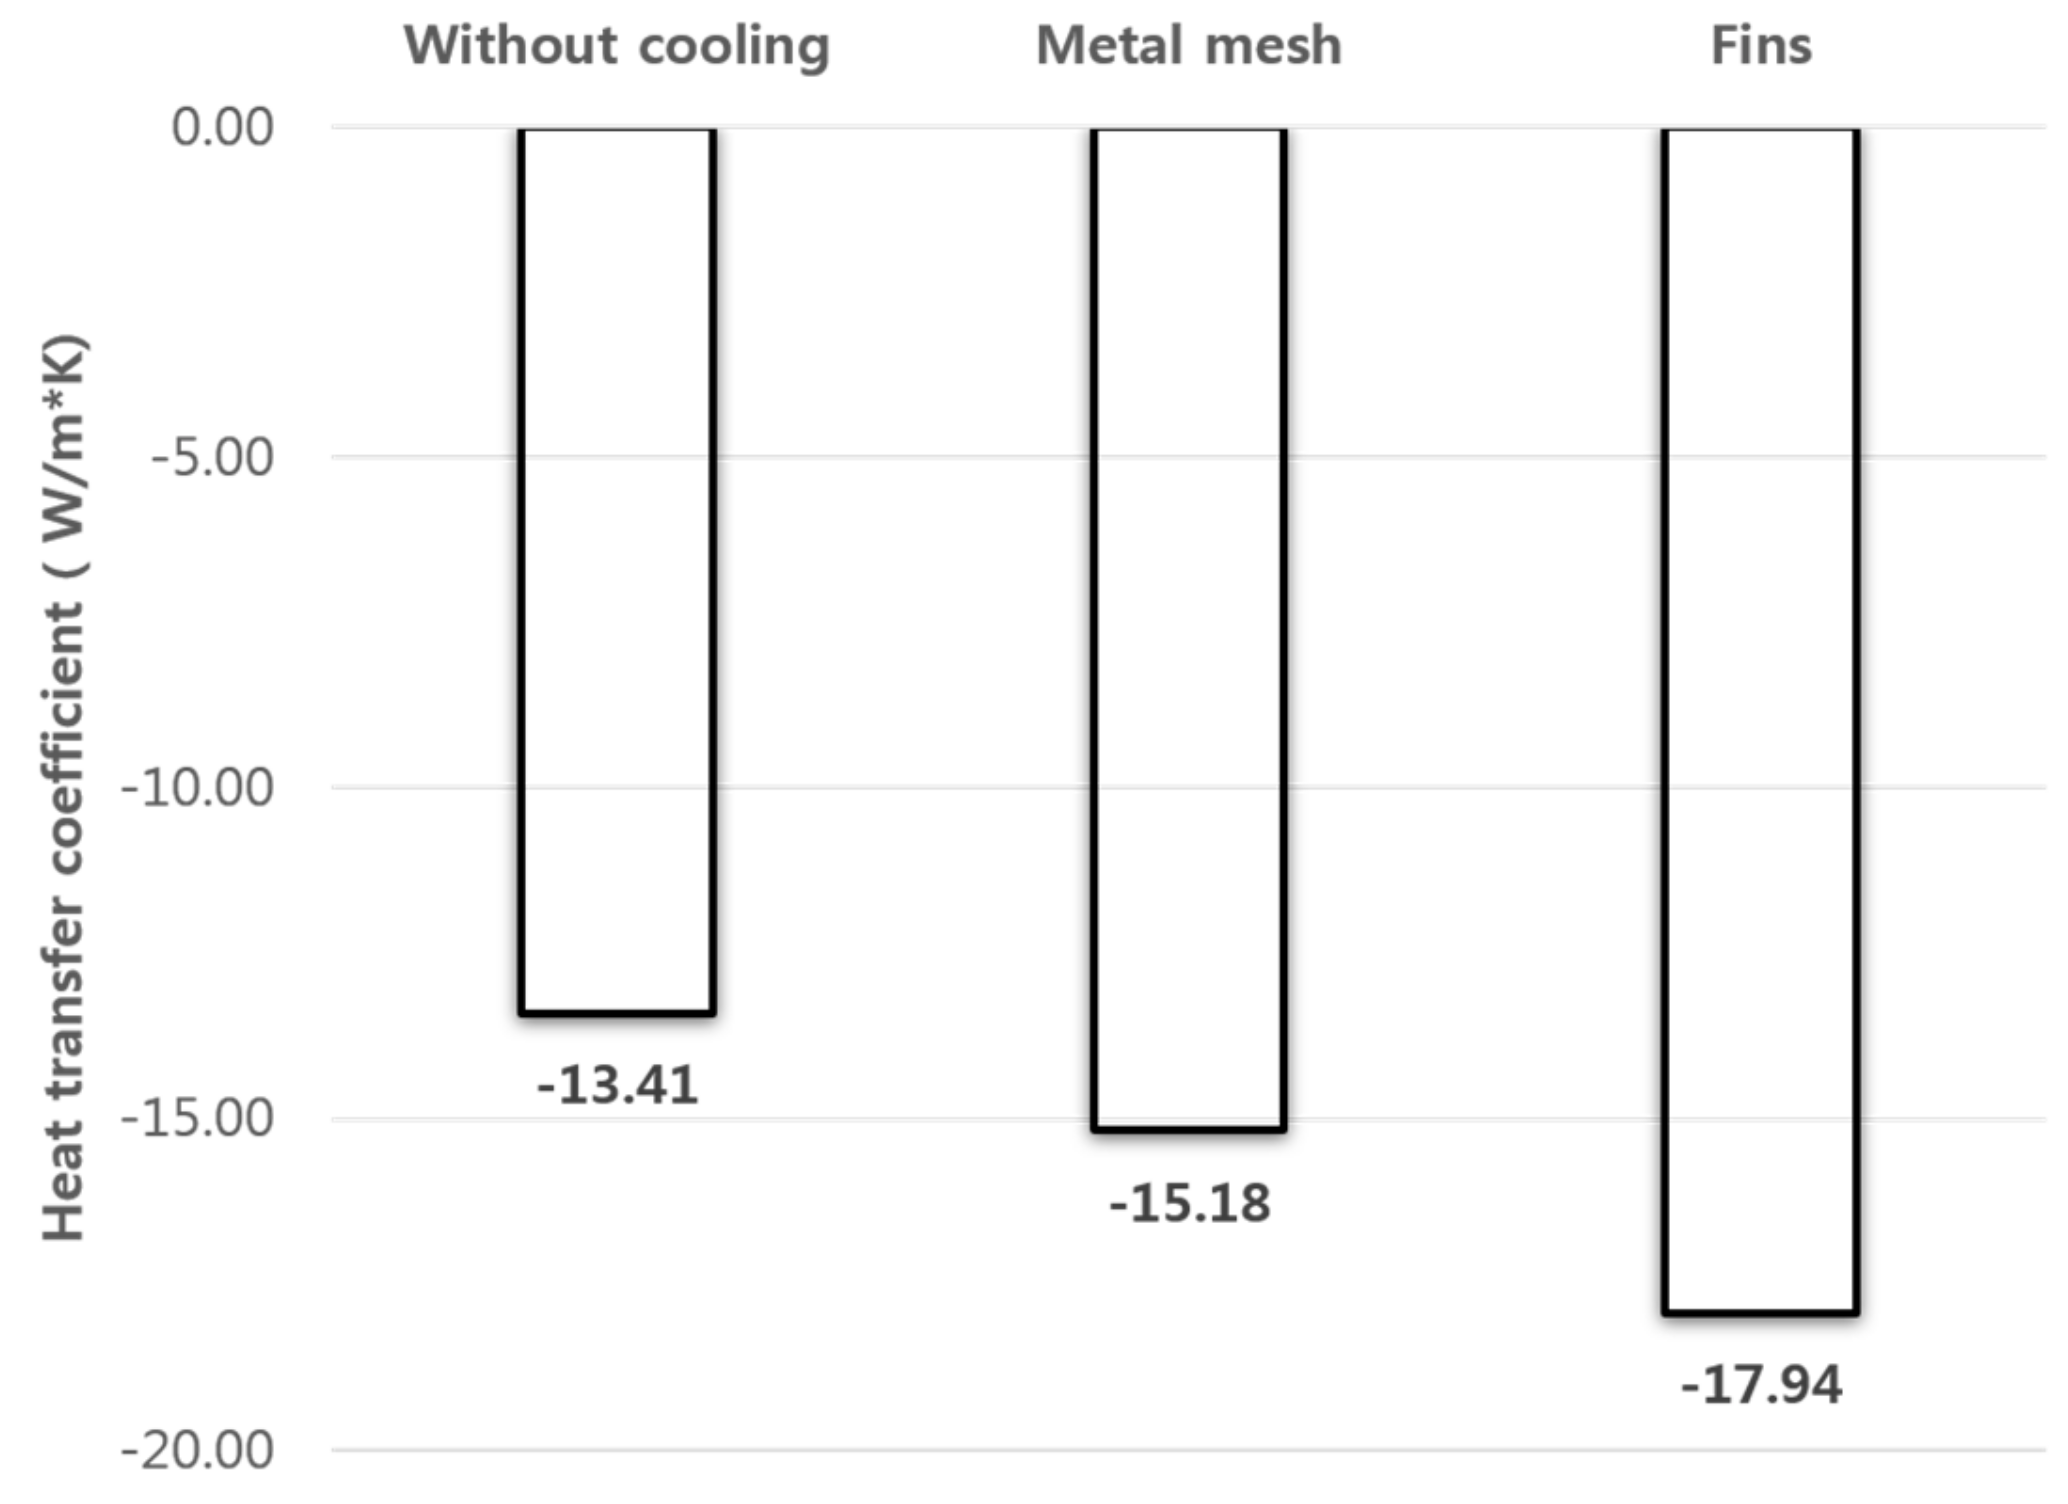
The simulations showed that the fins had greater cooling effect than the metal mesh (1.49 °C vs. 3.18 °C). Additionally, the heat transfer coefficient was directly proportional to the cooling performance.
(5)
The simulations suggested that the heat transfer area at the backside of the module had a substantial impact on the cooling. The cooling fins had a larger heat transfer area than the metal mesh and thus exhibited a superior cooling effect.
Though the metal mesh had a lower cooling effect than the fins, it is more likely to be applied in real operating environments. This is because meshes can be obtained at low prices through existing manufacturers. Moreover, meshes have a greater structural stability than fins. Therefore, a passive cooling technology that is both economical and structurally stable can be developed by enhancing the adhesion of meshes on the PV module.

Author Contributions

The author Y.Y. organized the concept of passive cooling and suggested the steel solution. The author J.K. and S.B. carried out the CFD simulation and the indoor test of PV module with metal mesh. The author Y.N. reviewed results and whole manuscript. All authors have read and agreed to the published version of the manuscript.

Funding

This research was financially funded by the Ministry of Trade, Industry, and Energy (MOTIE), and the Korea Institute for Advancement of Technology (KIAT) through the International Cooperative R&D program (N062000014 _ Economic Solution for Trigeneration System). This research was also supported by the Korea Institute of Energy Technology Evaluation and Planning (KETEP) and the Ministry of Trade, Industry & Energy (MOTIE) of the Republic of Korea (No. 20188550000430).

Acknowledgments

In this section you can acknowledge any support given which is not covered by the author contribution or funding sections. This may include administrative and technical support, or donations in kind (e.g., materials used for experiments).

Conflicts of Interest

The authors declare no conflict of interest.

References

  1. BP Energy Outlook; BP Energy Economics: London, UK, 2018.
  2. Technology Roadmap, Solar Photovoltaic Energy; International Energy Agency: Paris, France, 2014.
  3. Singh, T.; Miyasaka, T. Stabilizing the Efficiency Beyond 20% with a Mixed Cation Perovskite Solar cell Fabricated in Ambient Air under Controlled Humidity. Adv. Energy Mater. 2018, 8, 1–9. [Google Scholar] [CrossRef]
  4. Michael, J.J.; Iniyan, S.; Goic, R. Flat plate solar photovoltaic-thermal (PV/T) systems: A reference guide. Ren. Sustain. Energy Rev. 2015, 51, 62–88. [Google Scholar] [CrossRef]
  5. Seng, A.K. Handbook for Solar Photovoltaic (PV) Systems; Energy Market Authority & Building and Construction Authority: Singapore, 2010. [Google Scholar]
  6. Guo, C. Temperature-dependent device performance of organic photovoltaic cells based on a squaraine dye. Synth. Met. 2016, 222, 293–298. [Google Scholar]
  7. Filip, G.Č.; Sandro, N.; Tina, G.M. Photovoltaic panels: A review of the cooling techniques. Trans. Famena 2016, 40, 63–74. [Google Scholar]
  8. Teo, H.G.; Lee, P.S.; Hawlader, M.N.A. An active cooling system for photovoltaic modules. Appl. Energy 2012, 90, 309–315. [Google Scholar] [CrossRef]
  9. Potuganti, P.; Ponnapalli, C.S. Efficiency improvement of solar PV panels using active cooling. In Proceedings of the 11th International Conference on Environment and Electrical Engineering, Venice, Italy, 18–25 May 2012. [Google Scholar]
  10. Irwan, Y.M.; Leow, W.Z.; Irwanto, M.; Fareq, M.; Amelia, A.R.; Gomesh, N.; Safwati, I. Indoor Test Performance of PV Panel through Water Cooling Method. Energy Procedia 2015, 79, 604–611. [Google Scholar] [CrossRef] [Green Version]
  11. Cuce, E.; Bali, T.; Secucoglu, S.A. Effect of passive cooling on performance of silicon photovoltaic cells. Int. J. Low-Carbon Technol. 2011, 6, 299–308. [Google Scholar] [CrossRef] [Green Version]
  12. Wu, S.; Xiong, C. Passive Cooling Technology for Photovoltaic Panels for Domestic Houses. Int. J. Low-Carbon Technol. 2014, 9, 118–126. [Google Scholar] [CrossRef] [Green Version]
  13. Wu, S.Y.; Zhang, Q.L.; Xiao, L.X.; Guo, F.H. A heat pipe photovoltaic/thermal (PV/T) hybrid system and its performance evaluation. Energy Build. 2011, 43, 3558–3567. [Google Scholar] [CrossRef]
  14. Indartono, Y.S.; Suwono, A.; Partama, F.Y. Improving photovoltaics performance by using yellow petroleum as phase change material. Int. J. Low-Carbon Technol. 2014, 47, 333–337. [Google Scholar] [CrossRef] [Green Version]
  15. Specification for Solar Simulation for Photovoltaic Testing, 60904-9; IEC: Paris, France, 2007.
  16. Crystalline Silicon Terrestrial Photovoltaic (PV) Modules-Design Qualification and Type Approval; 61215-2; IEC: Paris, France, 2016.
  17. Photovoltaic (PV) Module Performance Testing and Energy Rating-Part 1: Irradiation and Temperature Performance Measurements and Power Rating; International Electrotechnical Commission: Paris, France, 2011.
  18. Jaemin, K.; Yujin, N. Study on the Cooling Effect of Attached Fins on PV Using CFD Simulation. Energies 2018, 57, 1–12. [Google Scholar]
Figure 1. Primary energy demand [1].
Energies 13 00085 g001
Figure 2. Experimental setup of the indoor test.
Energies 13 00085 g002
Figure 3. Experimental equipment.
Energies 13 00085 g003
Figure 4. Points of attachment of the thermocouples used for the data measurement [17].
Energies 13 00085 g004
Figure 5. The dimensions of the iron and aluminum meshes.
Energies 13 00085 g005
Figure 6. Three cases of the experimental study.
Energies 13 00085 g006
Figure 7. The temperature on the backside of different PV modules under STC (25 °C).
Energies 13 00085 g007
Figure 8. Contact between the PV module and the attached iron mesh.
Energies 13 00085 g008
Figure 9. The simulation model of the PV module without cooling.
Energies 13 00085 g009
Figure 10. Three cases for the simulation.
Energies 13 00085 g010
Figure 11. The specifications of the fins and metal mesh attached on the backside of the PV module.
Energies 13 00085 g011
Figure 12. Simulated heat map of the PV modules.
Energies 13 00085 g012
Figure 13. Simulated heat transfer coefficient (backside) of the PV modules.
Energies 13 00085 g013
Table 1. Temperature coefficient of various PV cell technologies [5,6].
TechnologyCrystalline SiliconCopper Indium Gallium Selenide (CIGS)Cadmium-Telluride (CdTe)Amorphous Silicon (a-Si)Organic PV
(DIBSQ Based BHJ Cells)
Temperature Coefficient (%/°C)−0.4 to −0.5−032 to −0.36−0.25−0.21−0.015
Module
Efficiency (%)
11–1410–139–125–73–12
Table 2. Specifications of the solar simulator.
DimensionsInternal2600(W) × 2200(D) × 1800(H) mm
External3300(W) × 3800(D) × 2600(H) mm
Irradiation conditionsLampMGH 4000 W × 4set
Solar irradiance800 – 1200 W / m 2
Wavelength280 – 3000 nm
Regularity ± 5%
Exposed Area16,000 cm 2
Temperature controlRange−40 °C – +100 °C
Accuracy ± 1 °C
Uniformity2 °C
Table 3. PV module specifications.
TypeCell DimensionMax Power Efficiency   ( η STC )
Crystalline silicon156 mm × 156 mm340 W17.62%
Table 4. Backside temperature of each PV module.
Without CoolingIron MeshAluminum Mesh
Backside temperature52.72 °C48.37 °C46.16 °C
Table 5. The power generation amount and efficiency according to the use of metal mesh.
PowerElectrical EfficiencyIncrease of
Electrical Efficiency
Without cooling297.4 W15.41%-
Iron mesh299.5 W15.51%0.11%
Aluminum mesh325.3 W16.85%1.44%
Table 6. The environmental parameters of the CFD model.
Solar IrradianceVelocity InletAir TemperatureInitial TemperatureContact Resistance
1000 W / m 2 2.0 m/s25 °C25 °C0 m 2 K / W
Table 7. The thermal properties used in the CFD model.
ComponentsThickness (mm)Thermal Conductivity (W/m∙K) Density   ( k g / m 3 ) Heat Capacity (J/kg °C)
Glass31.83000500
Cell (Si)0.21482330677
EVA0.30.359602090
Back sheet0.010.212001250
Frame (Al)402372702903
Fin (Al)3
Metal mesh (Al)4.5
Table 8. The optical properties of each layer of the PV module used in the CFD model.
ComponentsReflectivityAbsorptivityTransmissivity
Glass0.0180.0320.950
Cell (Si)0.0700.9300
EVA0.03000.970
Table 9. Simulated temperature of the PV modules.
Frontside TemperatureBackside TemperatureCell TemperatureCell Temperature Difference from Case 1
Case 1
(Without cooling)
50.33 °C49.44 °C49.74 °C-
Case 2
(Metal mesh)
48.87 °C47.91 °C48.25 °C1.49 °C
Case 3
(Cooling fins)
46.90 °C46.22 °C46.56 °C3.18 °C

