Abstract
The penetration of photovoltaic (PV) outputs brings great challenges to optimal operation of active distribution networks (ADNs), especially leading to more serious overvoltage problems. This study proposes a zonal voltage control scheme based on multiple spatiotemporal characteristics for highly penetrated PVs in ADNs. In the spatial domain, a community detection algorithm using a reactive/ active power quality function was introduced to partition an ADN into sub-networks. In the time domain, short-term zonal scheduling (SZS) with 1 h granularity was drawn up based on a cluster. The objective was to minimize the supported reactive power and the curtailed active power in reactive and active power sub-networks. Additionally, a real-time zonal voltage control scheme (RZVC) with 1 min granularity was proposed to correct the SZS rapidly by choosing and controlling the key PV inverter to regulate the supported reactive power and the curtailed active power of the inverters to prevent the overvoltage in each sub-network. With the time domain cooperation, the proposed method could achieve economic control and avoid overvoltage caused by errors in the forecast data of the PVs. For the spatial domain, zonal scheduling and zonal voltage control were carried out in each cluster, and the short-term scheduling and voltage controlling problem of the ADN could then be decomposed into several sub-problems. This could simplify the optimization and control which can reduce the computing time. Finally, an actual 10kV, 103-node network in Zhejiang Province of China is employed to verify the effectiveness and feasibility of the proposed approach.
1. Introduction
In recent years, the high penetrated renewable energy source (RES)-based distributed generation (DG) units has converted passive distribution networks into active distribution networks (ADNs) [1]. The operation of current ADNs is adversely influenced by highly penetrated PVs, which can lead to overvoltage, flow reverses, and power quality issues. Among these issues, overvoltage is a high-profile concern that challenges the stable operation of ADNs [2]. Therefore, the investigation of voltage control strategies for ADNs with a high penetration of PVs is necessary to improve the economic efficiency of PVs [3].
In ADNs, two major methods, that is, reactive power compensation (RPC) and active power curtailment (APC), are commonly employed to address overvoltage issues. Reference [4] proposed an APC-based method for PV inverters to avoid overvoltage or imminent violation of upper voltage limit based on short-term PV power forecasts. In [5], an APC-based method for PV inverters was developed to fairly share the required power curtailment among PV inverters during overvoltage periods. The efficiency and feasibility of RPC scheme for voltage regulation were demonstrated in [6,7]. PVs can operate as controllable units by the application of the reactive power compensation of smart PV inverters, thus improving the penetration of PVs. However, due to economic considerations, most of PVs inverters limited reactive power compensation. A better solution by reactive power and active power combined regulation methods has been developed to realize high PV penetration in ADNs. In [8,9], an optimal inverter dispatch (OID) scheme was proposed to find the critical PV inverter, which had the most significant impact on distribution network operation. The optimal reactive power compensation and active power curtailment of the critical inverters could then be dispatched to minimize the economic cost. The OID-based method prevails over RPC-based and APC-based methods [10], and the OID-based method has been commonly employed for dispatching PV inverters in voltage regulation [11]. Nevertheless, the schemes are time-consuming in computation due to they treat the distribution networks as a whole, which lead to that the schemes become difficult to be applied in actual implementation if the network is large. It is worth noting that due to the dispersion nature of PVs, network partition based zonal voltage control is another practical way to regulate the voltage of a distribution network with the high penetrated PVs.
A handful of references [12,13,14] have reported electric power network partition and reconfiguration methods. A k-means algorithm-based network partition method was proposed in [12] for ancillary services in distribution networks. An agglomerative algorithm and power flow tracing based power network partition method was developed in [13] for large power systems to carry out reactive power control. Micro-grid formation method was proposed in [14], after a natural disaster, the distribution network is partitioned so that the electricity for the critical loads in the system could be restored by forming some micro-grids. From the structural point of view, the electrical connection was described by defining the electrical coupling strength (ECS) as a composite-weight coefficient in [15], and the partition quality was estimated by employing an electrical modularity. Rather than taking the topology of electric power network into account, a partitioning scheme which took ownership and the energy policy to be operational constraints was presented in [16]. These partitioning methods were based on structure or state information, were only effective for special purposes, and were unsuitable for general applications. Moreover, the impact of DGs on the partitioning solutions was not considered. In [17,18], a community detection algorithm with the network structure information and the impact of PVs taken into account was proposed. However, it could not restrict the size of the sub-networks, which might result in unreasonable sub-networks and more voltage regulating cost. Therefore, determining how to reasonably partition the distribution network considering the topology of the power grid, as well as the impact of DGs and the size of the sub-networks, is the key to achieving zonal voltage control.
By dividing a complex large distribution network into some clusters or sub-networks, the regulation of the voltage profiles in each sub-network can be conducted in a relatively independent way, and the voltage regulation of the whole distribution network can be fast achieved. Compared with the centralized voltage control of a non-partitioned network, zonal voltage control is carried out by a parallel mode, the number of control dimensions and optimization variables can be significantly reduced. In [19], the steady-state operation of a distribution network was modeled by a Jacobian-based linear method, and the network is partitioned into several voltage regulation zones for reformulating the centralized optimization as a quadratic programming of reduced dimension. A novel Laplacian spectrum-based scheme was proposed in [20], bi-objective network dividing problems could be solved in the scheme, and the resultant Pareto front of the voltage management solution can be obtained. With the increasing penetration of PVs in ADNs, the ability to regulating voltage of PV inverters has been greatly developed, and the control functions of PV inverters have been greatly enriched [17,18]. A combined day-ahead scheduling and real-time control strategy for optimizing the reactive power of PV inverters in sub-networks was proposed in [17]. In the proposed strategy, the uncertainty of solar forecasting could be quickly mitigated by employing zonal control. However, only the reactive power compensation of PV inverters was optimized, the active power curtailment of PV inverters was not taken into account. In [18], a particle swarm optimization algorithm was employed to optimize the reactive power and active power of the PV inverters in each sub-network. Hence, the node voltage could be regulated within the secure operating range. However, this method optimized the reactive power compensation and active power curtailment of PV inverters in the reactive power partitions, which was unreasonable for the active power optimization and resulted more voltage regulating cost. Therefore, after the partitioning of a distribution network, the determination of how to reasonably establish an OID framework of PV inverters under the network partition to achieve zonal voltage control is still in discussion and exploration.
In the light of the abovementioned problems, this study proposes a multiple spatiotemporal characteristics-based zonal voltage control scheme for highly penetrated PVs. The major contributions are summarized as follows: (1) Based on community detection algorithm, a reactive/ active power quality function for network partition is proposed to divide the network into sub-networks, and a complicated optimization was decomposed into several sub- optimization which could be solved in a decentralized way. (2) Based on the network partition, a short-term zonal scheduling with 1 h granularity was drawn up, and the objective was to minimize supported reactive power and the curtailed active power in the reactive and active power sub-networks. Additionally, a real-time zonal voltage control scheme with 1 min granularity was proposed in order to rapidly correct the SZS by choosing and controlling the key PV inverter to manage the reactive/active power of PV inverters and to prevent the overvoltage in each sub-network. With the time domain cooperation, the proposed method could achieve an economic control and avoid overvoltage caused by errors in the forecast data of the PVs. With the spatial domain, parallel processing could reduce the computing time significantly to simplify the optimization and improve the dynamic response of the voltage control.
The rest of the study is organized as follows: Section 2 introduces an optimal network partition based on community detection algorithm. Section 3 proposes and discusses a multiple spatiotemporal characteristics-based zonal voltage control scheme. The application of the proposed scheme for a real distribution network via case studies is discussed in Section 4. The discussion and conclusion are given in Section 5.
2. Optimal Network Partition Based on Reactive/Active Power Quality Function
As the penetration level of PVs increases in a distribution network, the number of controlled nodes will grow significantly throughout the distribution network, which complicates the voltage regulation. If voltage profiles are still controlled in a centralized way, the computing time for control will not be satisfactory due to the extremely high dimension of the control variables. If a reasonable partition algorithm is used to partition the ADN into several relatively independent clusters or sub-networks to carry out the zonal voltage control, a parallel computation among the various partitions can be achieved. Moreover, after the partition, the voltage management in a specific sub-network and the change of the parameters of the sub-network will have the least influence on the other sub-networks, which facilitates the independent control of the PV inverters in each sub-network. In this way, distributed PV can have the ability to flexibly respond to the scheduling and controlling of power dispatching. Based on the power–voltage sensitivity matrix, the reactive and active power partitions can be decoupled to achieve a two-level partitioning of the reactive power and the active power.
2.1. Decoupling of the Active Power and Reactive Power Partition
The relationships between the changes in power injections and the changes in node voltages can be represented by following well-known equation [21]:
where ΔP and ΔQ represent the changes in the injections of the active power and the reactive power, respectively. Δδ represents the incremental change in the voltage phase angle and ΔU is the incremental change in the voltage magnitude. The Jacobian matrix consists of APδ, BPU, CQδ, and DQU. Inverting the matrix form given in Equation (1), Equation (2) can be obtained:
where SPU and SQU represent the voltage magnitude sensitivities of the active power and the reactive power, respectively. SPδ and SQδ represent the voltage angle sensitivities of the active power and the reactive power, respectively:
where ΔP = [ΔP1, ΔP2, …, ΔPN]T, and ΔQ = [ΔQ1, ΔQ2, …, ΔQN]T. Additionally, the regulation of ΔP and ΔQ will be limited by the power factor of PV inverters:
where Smax represents the apparent capacity of a PV inverter and φmax is the maximum permissible power factor angle of the PV inverter.
When NPV nodes are connected with PVs of different capacities, the voltage of node i is affected by its own power and by the ΔPj and ΔQj of other nodes. The voltage of node i can be expressed as follows:
where is the voltage of node i without management of PV inverters, and are the (i, j)-th elements of the matrices SPU and SQU, respectively.
In Equations (3) and (5), the voltage magnitude sensitivities SPU and SQU represent the influence of the active power and the reactive power on the nodal voltage. When the active power is constant and the unit reactive power has been injected, the variation of the voltage amplitude is only related to the reactive power-voltage sensitivity matrix. Similarity, when the reactive power is constant and the unit active power has been injected, the variation of the voltage amplitude is only related to the active power-voltage sensitivity matrix. Therefore, the decoupling for the reactive and active power partitions is achieved by the decoupling.
2.2. Reactive/Active Power Partition Quality Function
Different community-based network partition methods have been proposed for solving complex network partition problems. For example, a modularity function-based method was proposed by Girvan and Newman for network partition [22]. These methods can automatically generate the best partition number without prior setting, which is more reasonable for the adaptive partitioning of complex networks [23]. Considering the influence of network topology and the output of PVs, this study proposes a reactive/active power-based partition quality function to partition a complex ADN with high penetrated PVs.
The reactive/active power partition quality function-based method considers the network topology and groups the nodes with strong couplings of reactive/active power together. Moreover, this partition scheme can keep each sub-network under a reasonable size, as well as prevent an uneven number of PVs, insufficient adjustable power, or excess power in the sub-networks. The reactive/active power partition function proposed in this study is mainly composed of the internal reactive/active power sensitivity function, the external reactive/active power sensitivity function, and the reactive power/active balance function.
2.2.1. Internal Reactive Power Sensitivity Function
The internal reactive power sensitivity function is presented in this work as follows:
where T represents the number of current reactive power sub-networks, represents the q-th reactive power sub-network, N represents the node number in the feeder, represents the node number in the reactive power sub-network , and represents the reactive power weights, which describe the reactive power coupling among the nodes and which are determined by the reactive power-voltage sensitivity matrix SQU:
is mainly based on the network topology, which characterizes the reactive power voltage sensitivity among nodes in the partition. takes a value in the range of (0,1). The reactive power-voltage sensitivity among the nodes within a reactive power sub-network will become higher as increases, which illustrates a higher reactive power coupling between nodes, and the partition will be more reasonable. Additionally, can also restrict the node size within a reactive power sub-network and prevent an excessive number of nodes within a reactive power sub-network due to unreasonable results.
2.2.2. External Reactive Power Sensitivity Function
The external reactive power sensitivity function in this work is defined as follows:
mainly describes the reactive power voltage sensitivity of nodes among different sub-networks, which has a range of (0,1). The smaller is, the lower the reactive power voltage sensitivity of the nodes among different sub-networks will be. In other words, a smaller value of indicates a lower reactive power coupling between nodes in different reactive power sub-networks. Therefore, the partition will be more reasonable. Additionally, the external reactive power sensitivity function can also limit the nodal number in a sub-network, preventing an excessively large or a small nodal number within a reactive power sub-network.
2.2.3. Reactive Power Balance Function
The reactive power balance function is established as follows:
where Qsupplied represents the total reactive power supported by PV inverters in sub-network . The minimum reactive power needed in is given by the following equation:
where is the incremental voltage change of node i. is the reactive-power-voltage sensitivity of i-th PV inverter on the i-th node in sub-network . It should be noted that a local node has the highest reactive-power-voltage sensitivity to itself. Then, the PV inverters installed at a local node, if any, can provide the minimum reactive power compensation to regulate the voltage. The value of falls within the range of (0,1), which characterizes the ability of the reactive power balance by PVs in various sub-networks. The partition quality will be better as increases.
According to Equations (6), (8) and (9), the overall reactive power partition quality function is presented as follows:
To make the quality of reactive power partition grow as becomes higher, (1 − ) is used in Equation (11). Similarly, the active power partition quality function can be obtained as follows:
where represents the internal active power sensitivity function. is the external active power sensitivity function. represents the active power scale balance function. is the active power balance function. The active power partition quality function also considers the network topology and reflects the ability of the active power compensation of the PVs in the sub-networks.
2.3. Network Partition Algorithm
For a complex active distribution network, the network partition algorithm for is employed to carry out the partition, which is summarized as follows (taking the reactive power partition as an example):
- Step 1:
- The forecasted PV outputs and load demand one hour ahead are obtained.
- Step 2:
- The forecasted data of PV outputs and load demands are collected. To initialize the network partition, each reactive power sub-network is set that each sub-network contains only one node. The reactive power partition quality function of each sub-network is computed using Equation (11).
- Step 3:
- For each node i, a new reactive power sub-network is formed by selecting another node from the remaining nodes. The reactive power partition quality function of the new partition is calculated. The partition quality function variation Δ = − is measured for each possible partition where a pair of nodes is merged. After the calculation of partition quality function variation for all node pairs in the network, the two nodes with the highest partition quality function variation are grouped into one sub-network, and the total value of reactive power partition quality function is updated.
- Step 4:
- The newly formed reactive power sub-networks are treated as individual nodes. And by repeating Step 3, the network merge process is conducted, and newly reactive power sub-networks network is updated to form the network.
- Step 5:
- When the nodes can no longer be merged into any reactive power sub-network and the reactive power partition quality function does not increase, the process is stopped. The optimal partition, as well as the associated reactive power partition quality function, is obtained.
- Step 6:
- The forecasted PV outputs and load demand of the next hour period is obtained and the reactive power partition is repeated.
In the existing researches, most of the distribution network partition is mainly determined by state or structure information of the distribution network. However, it should be noticed that the installation and outputs of PVs will also have an impact on the optimal partition. The proposed network partition algorithm can not only consider the state or structure of network, but also provide a reasonable node size in each partition. Furthermore, the algorithm is updated by time-varying PV outputs, which belongs to a dynamic partition algorithm.
3. Multiple Spatiotemporal Characteristics-Based Zonal Voltage Control Scheme
Along with the scale of PVs continue expanding, the penetration of PVs is increasing steadily. Because of the decentralized installation and large scale of PVs in active distribution networks, the voltage management will be more complicated. Taking advantages of zonal voltage control, a short-term zonal scheduling (SZS) was created based on a distribution network partition with 1 h granularity to maintain the economic operation of ADNs in this work. Additionally, a real-time zonal voltage control scheme (RZVC) with 1 min granularity was proposed to rapidly correct the SZS by choosing and controlling the key PV inverter to dispatch the reactive power and the active power of inverters to prevent the overvoltage in each sub-network. The flowchart of the proposed multiple spatiotemporal characteristics-based zonal voltage control scheme for ADNs is shown in Figure 1.
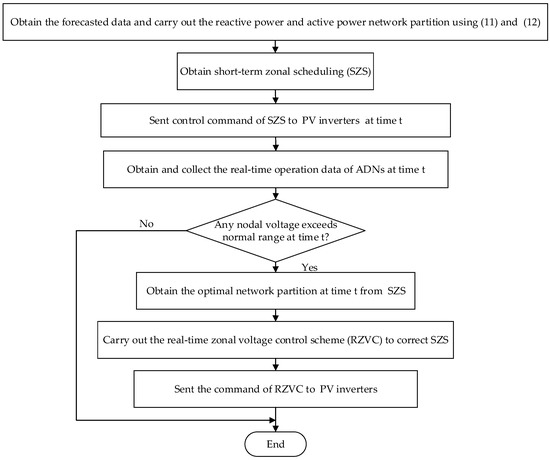
Figure 1.
Flowchart of the proposed scheme.
3.1. Short-Term Zonal Scheduling for Highly Penetrated PVs
It was assumed that an active distribution network had been divided into T reactive power sub-networks and W active power sub-networks by the described network partition algorithm. Because of the weak coupling among the sub-networks, the SZS of each sub-network could be optimized independently.
For a reactive power sub-network, the voltage control is carried out mainly by PV inverters through absorbing or releasing the reactive power. In reactive power sub-networks with c nodes and nq PVs, when PV inverters perform the reactive power regulation, the objective functions of the SZS for reactive power sub-network q and the corresponding constraints are considered, and they are introduced as follows:
where PPV,i, QPV,i are the active power and reactive power generated by PVs. PDi and QDi are the active power and reactive power of load demands, respectively. Vi and Vj are the voltage magnitudes of node i and node j respectively. Bij and Gij are the susceptance and the conductance of the branch consisting of nodes i and j. θij is the phase difference of node i and node j. is the voltage magnitude of node i in . ΔQk is the absorbed reactive power of k-th PV inverter. is the maximum absorbed reactive power of the k-th PV inverter. is the power factor angle of the k-th PV inverter.
Similarly, for active power sub-networks, the voltage control is carried out mainly by PV inverters through curtailing the active power. In active power sub-networks with w nodes and np PVs, when PV inverters perform the active power regulation, the objective functions and the corresponding constraints are given as follows:
where Δ is the curtailed active power of the k-th PVinverter, is the voltage magnitude of node i in , and is the maximum curtailed active power of the k-th PV inverter.
To deal with the optimization of SZS, an improved particle swarm optimization algorithm (IPSO) [24,25] was employed to conduct the SZS. The steps for the optimization are summarized as follows:
- Step 1:
- When the reactive power and active power network partition was done, the reactive power partition was selected to conduct the reactive power voltage control process.
- Step 2:
- In each reactive power sub-network, the model of Equations (13) and (14) was solved by IPSO. The absorbed reactive power of the PV inverters could be obtained using the expression ΔQPV = [ΔQd]1×n. The IPSO method can be introduced as follows [24]:where vs+1 and vs are the velocities of particles at s+1-th and s-th generation, respectively. xs+1 and xs are the positions of the particles at s+1-th and s-th generation, respectively. c0 is the inertia weight factor. c1 and c2 are the accelerating constants, respectively. gi,s is the position of the particle i at iteration s. rs() represent a uniform random value, and rs() ranges from 0 to 1. The gbest term was considered as a “social influence” term. When PSO was removed this effect, the optimization showed an abysmal performance. Therefore, the social interaction was an important factor to help improving the performance of PSO. IPSO modified the velocity and particle position by utilizing some fittest-particle information to enhance the social interactions. Specifically, according to objective values of the particles, the particles were rearranged in descending order at the s-th iteration, and the last n particles were chosen to modify the velocity and particle position. By using the gbest of the neighborhood particles and the best particle solution achieved, each particle of IPSO could modify its velocity and position. This was similar to that a group of leaders could make better decisions in social society. With the usual result becoming the clustering of individuals in the optimal regions, Individuals were drawn towards one another’s successes as the searching of particle swarm population over time.
- Step 3:
- After the reactive power voltage control process, if nodal voltages did not exceed the normal range under the reactive power compensation, thus the PV inverters had sufficient reactive power-voltage control capability. Then, curtailed real power curtailment is no more needed. The SZS was obtained with the expression: ΔQPV = [ΔQk]1×n, ΔPPV = 0. Otherwise, Step 4 was performed next to carry out the active power control.
- Step 4:
- Based on all absorbed reactive power of the PV inverters put into voltage control, the model of Equations (15) and (16) in each active power sub-network was solved by using IPSO to ensure that all the node voltages met the voltage regulation requirement. Then the SZS could be obtained with the expression: ΔQPV = [ΔQk]1×n, ΔPPV = []1×n.
3.2. Real-time Zonal Voltage Control Scheme for Highly Penetrated PVs
With high penetrated PVs, the fluctuation in PV generations will have significant impacts on the operation of the ADNs. When only the SZS is relied on to management the operation of ADNs, it will fail the voltage control due to forecast errors of PV generations. If a real-time voltage control can be formulated to correct the SZS through modifications with real-time operation data, the real-time voltage control can maintain the economic operation of ADNs, as well as reduce the negative influence caused by forecast errors. In this work, a network partition based real-time zonal voltage control scheme was formulated with respect to the 1 min granularity, and it is carried out by choosing and controlling the key PV inverter to dispatch the reactive power and the active power of the inverters to prevent the overvoltage in each sub-network. The RZVC scheme is described in detail as follows:
- Phase 1:
- The sub-networks in the SZS were obtained, and the reactive power sub-networks were denoted as {, , …, , …, }. The existence of overvoltage in all the reactive power sub-networks was checked. If all the node voltage were qualified, the RZVC could be ended. Otherwise, the reactive power sub-networks with overvoltage were denoted as the abnormal voltage sub-networks set ZQ, the other reactive power sub-networks were denoted as the normal voltage sub-networks set CQ, and Phase 2 was begun.
- Phase 2:
- In the abnormal voltage sub-networks set ZQ, the node with the highest voltage magnitude was chosen and it was assumed that the node belonged to . In , a reactive power voltage control was carried out in detail, as follows:By carrying out power flow analyzes for distribution network, the PV control nodes set P, the critical load nodes set , as well as the normal load nodes set , were first set in . It was assumed that contains nq nodes, and all the nodal voltages were sorted in a descending order. The nodes with overvoltage were recorded as the critical load nodes set = {, … }. The nodes with normal voltages was denoted as normal load nodes set = {, … }. It was assumed that there were nodes with controllable PV inverters in the sub-network, which were denoted as the PV control nodes set = {, … }. The three types of node set are shown in Figure 2. The reactive power voltage sensitivity matrices SQU was calculated, and the current reactive power of each PV inverter were gotten through the power flow analyzes. In the critical load nodes set, the load node with the highest voltage magnitude was selected as the critical load node and it was recorded as . The incremental voltage change that exceeded the upper limit of the node voltage was recorded as Δ. According to the reactive power voltage sensitivity matrices SQU, the PV node that had the highest reactive power voltage sensitivity to the critical load node could be determined from , the PV node was recorded as and the highest reactive power voltage sensitivity was recorded as . Then the needed reactive power of the inverter in for regulating to the normal range could be calculated by the following equation:
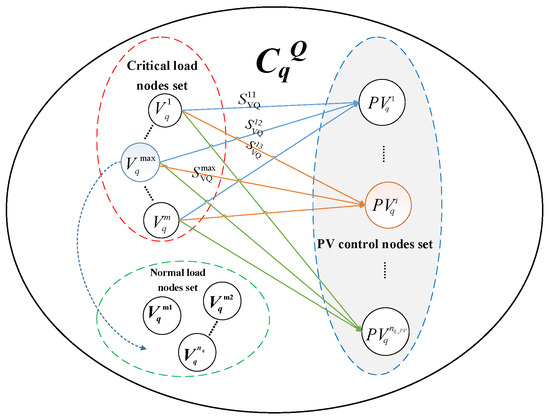 Figure 2. Process of the real-time zonal voltage control.When the reactive power supported by the inverter in was more than , then the inverter in absorbed the reactive power to control the voltage of , and the critical load node was removed from the critical load nodes set and added to the normal load nodes set. A power flow study was carried out to find the next critical load node to repeat the above process. Otherwise, when the reactive power supported by the inverter in was less than , then the inverter in absorbed the reactive power to regulate the voltage of , and the was removed from the PV control nodes set. Additionally, another PV node that had the highest reactive power voltage sensitivity to the critical load node was found from in order to repeat the above process. In the control process, when all the node voltages in were within the voltage limit range or when there was not any reactive power of PV inverters to regulate the voltage, then the reactive power voltage control ended.
 - Phase 3:
- was removed from the abnormal voltage sub-networks set ZQ and added to the normal voltage sub-networks set CQ. A power flow study was carried out. If all the nodal voltages were within the voltage limit range, the voltage control process ended. Otherwise, Phase 2 was repeated until all the node voltages were within the voltage limit range or all the sub-networks were added to the normal voltage sub-networks set CQ. When all the sub-networks were added to the normal voltage sub-networks set C but there was still overvoltage, then Phase 4 began.
- Phase 4:
- The active power sub-networks denoted as {, , …, , …, } were obtained. The active power sub-networks with overvoltage were denoted as the abnormal voltage sub-networks set ZP, the other active power sub-networks were denoted as the normal voltage sub-networks set CP, and Phase 5 began.
- Phase 5:
- In the abnormal voltage sub-networks set ZP, the node with the highest voltage magnitude was chosen, and it was assumed that the node belonged to . In , an active power voltage control was carried out.In , the PV control nodes set P, the critical load nodes set , as well as the normal load nodes set , were first set by analyzing power flow of the ADN. It was assumed that contained np nodes, and all the nodal voltages were recorded in a descending order. The nodes with overvoltage were recorded as the critical load nodes set = {, … }. The nodes with normal voltage were denoted as the normal load nodes set = {, … }. It was assumed that there were nodes with controllable PV inverters in the sub-networks, which were grouped into the PV control nodes set = {, … }. The active power voltage sensitivity matrices SPU were calculated, and by the power flow analyzing, the current active power outputs of each PV inverter were gotten. In the critical load nodes set, the load node with highest voltage magnitude was selected as the critical load node, and it was recorded as . The incremental voltage change that exceeded the upper limit of the node voltage was recorded as . According to the active power voltage sensitivity matrices SPU, the PV node that had the highest active power voltage sensitivity to the critical load node could be found out from , the PV node is recorded as , and the highest reactive power voltage sensitivity was recorded as . Then the active power of the inverter in that was needed to regulate to the normal range could be calculated by the following equation:When the active power supported by the inverter in was greater than , then the inverter in curtailed the active power to regulate the voltage of , and the critical load node was removed from the critical load nodes set and added to the normal load nodes set. A power flow study was carried out to find the next critical load node to repeat the above process. Otherwise, when the curtailed active power supported by the inverter in was less than , then the inverter in curtailed the active power to regulate the voltage of , and the is removed from PV control nodes set. Additionally, another PV node that had the highest active power voltage sensitivity to the critical load node was found from in order to repeat the above process. In the control process, when all the node voltages in were within the voltage limit range, then the reactive power voltage control ended.
- Phase 6:
- was removed from the abnormal voltage sub-networks set ZP and added to the normal voltage sub-networks set CP. A power flow study was carried out. If all the node voltages were within the voltage limit range, the control process ended. Otherwise, Phase 5 was repeated until all the node voltages were within the voltage limit range.
4. Case Study
4.1. Case Study System
To verify the effectiveness and feasibility of the proposed method, an actual three-phase balanced 10 kV radial active distribution network located in Zhejiang Province, China was employed.
As shown in Figure 3, there were 103 nodes with a total load of 22.8 MVA in the ADN. A total of 13.2 MWp PVs were added to the network. Figure 4 gave the location and capacity information of PVs. The PVs was interfaced with the system through a step-up transformer.
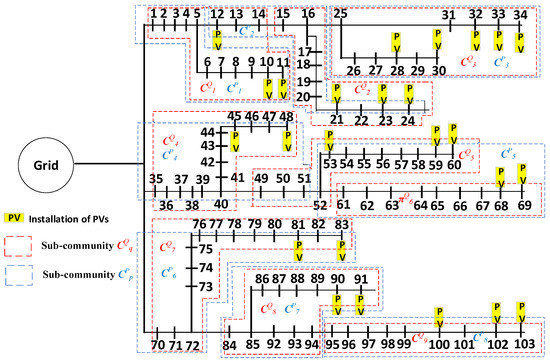
Figure 3.
Topology of the radial ADN under study.
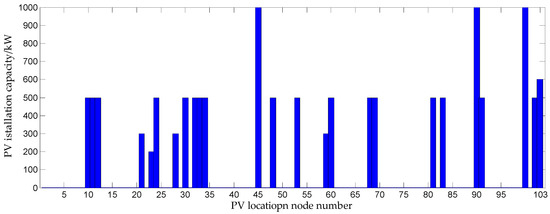
Figure 4.
The location and capacity information of PVs in the ADN.
From the details of this actual radial ADN, the simulation model was established using the OpenDSS program. The results of this study are obtained on a computer with 8 GB of memory and a 2.33-GHz Intel® CoreTM i5–4590 CPU. The base voltage was set to 10 kV, and the base power were set to 100 MVA. The permissible voltage range of the system was (0.95, 1.05) p.u. The day of 2018.7.16, which has the strongest solar irradiance, was chosen to verify the effectiveness and feasibility of the proposed scheme. The real-time data and the of forecasted data solar irradiance (with respect to the reference irradiance of 1500 W/m2) of 2018.7.16, as well as the load demand, are shown in Figure 5; Figure 6. In the simulation studies, the ambient temperature was set to 25°C, the operational power factor of PV inverters is in the range of [−0.95, 0.95]. In order to guarantee sufficient reactive power support, The PV inverter capacity was usually set a little larger than the DC capacity of the PV panels [26,27]. Then, the inverter capacity was set to 105% of the PV installation capacity.
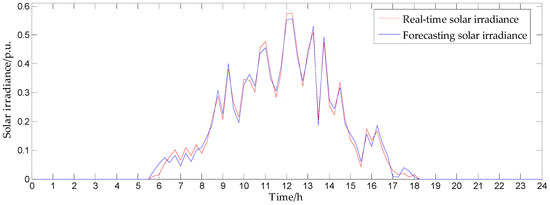
Figure 5.
Forecasted and real-time solar irradiance.
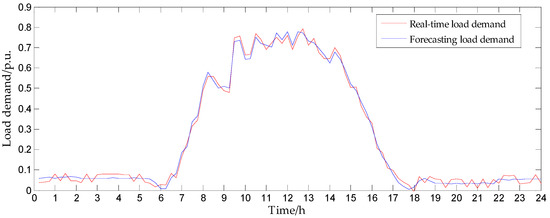
Figure 6.
Forecasted and real-time load demand.
4.2. Result of Multiple Spatiotemporal Characteristics-Based Zonal Voltage Control Scheme
When the ADN integrated all the PVs, overvoltage occurred due to the large excess PV outputs. The voltage profiles without any voltage regulation in one day were shown in Figure 7. The voltage of some nodes exceeded the upper limit during 11:00–11:30 and 12:15–12:45. Therefore, a reasonable and efficient voltage regulation strategy had to be adopted to preserve the economic and stable operation of the ADNs.

Figure 7.
Voltage profiles without any voltage regulation in one day.
First, the partitioning was carried out for the feeder. The distribution network was partitioned by the forecasted PV outputs and the load demands, to as a basis of the SZS and RZVC. The whole day forecasted value of 2018.7.16 was chosen as a reference in this study to carry out the network partition by the proposed partitioning strategy. The actual ADN at 12:30 on 2018.7.16 was selected to analyze the performance of the proposed partitioning strategy. By carrying out the partitioning strategy proposed in Section 2, the value of the reactive power partition quality function and the active power partition quality function versus the number of sub-networks for the actual ADN ware shown in Figure 8. The reactive power partition quality function reached the maximum value = 0.412 when the ADN was divided into nine reactive power sub-networks. Thus, the optimal number of reactive power sub-networks was nine. In Figure 3, the red dashed frame was employed to show the final optimal partitions, which are denoted as {, , , , , , , , }. Likewise, the active power partition quality function reached its maximum value of = 0.4266 when the ADN was divided into eight active power sub-networks, which are denoted as {, , , , , , , } and enclosed by the blue frame in Figure 3. It can be seen from the partition, the geographic attributes of nodes had a significant impact on the partition of the AND. This is because that the impedance between nodes reflected the reactive/active power-voltage sensitivity, and the impedance between nodes was directly related to the geographical attributes.

Figure 8.
Value of the reactive/active power partition quality function versus the number of sub-networks.
After partitioning the actual radial ADN, the multiple spatiotemporal characteristics-based zonal voltage control scheme was applied to regulate the network operation (taking the most serious overvoltage at 12:30 as an example). The SZS at 11:30 was drawn up, and the absorbed reactive power of the PV inverters, as well as the curtailed active power, was shown in Figure 9 and Figure 10, respectively. As shown in Figure 3 and Figure 7, the voltages of the nodes in the reactive power sub-networks {, , , , } were within the normal range, while the reactive power sub-networks {, , , } had overvoltage issues. Then the PV inverters in {, , , } absorbed the reactive power to manage the voltage. After the reactive power voltage control, there was still overvoltage in the active power sub-networks {, , , }. Then active power voltage control was carried out by curtailing the active power of the PVs in {, , , }, which can be seen in Figure 10. It should be noted that no overvoltage occurred in the reactive power sub-networks {, , , , } and the active power sub-networks {, , , }, so the PV inverters in these sub-networks did not participate in the voltage control. To prove that the IPSO in the SZS can give a globally optimal result, Genetic Algorithm (GA) was employed as a comparison to optimize the absorbed reactive power of the PV inverters in SZS, as well as the curtailed active power. The results of the two optimization algorithms were shown in Table 1.
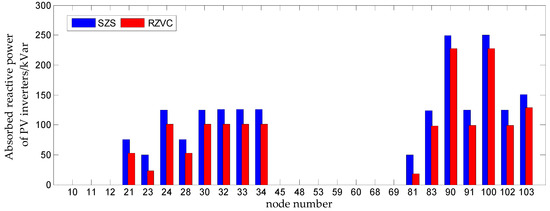
Figure 9.
Absorbed reactive power of PV inverters under SZS and RZVC.

Figure 10.
Curtailed active power of PV inverters under SZS and RZVC.

Table 1.
Comparison of the IPSO and GA.
From Table 1 it can be seen that the absorbed reactive power and the curtailed active power of the PV inverters optimized by IPSO is same with the results optimized by GA, which prove that the IPSO in the proposed scheme can give a globally optimal result. The real-time voltage profile under the SZS is shown in Figure 11. The SZS could not regulate all the nodal voltage within the normal range. This was because the real-time solar irradiance at 12:30 were more than the forecasted data, the PV generations in real-time was more than that based on the forecasted data. Thus the overvoltage in real-time was more serious than the forecasted voltage. If PV inverters controlled the voltage by the SZS, the voltage could not be regulated to a safe operating range. To eliminate the problems caused by forecast errors, the RZVC was carried out to correct the SZS.
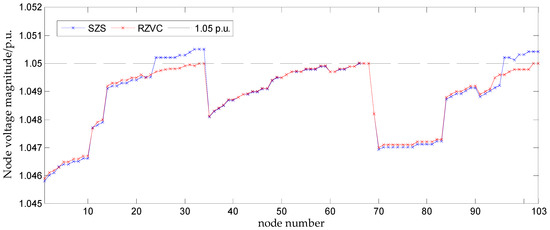
Figure 11.
Active power curtailed by the PV inverters under SZS and RZVC.
For the reactive power sub-networks {, , , }, the proposed RZVC was first employed to control the voltages for the reactive power sub-networks . Then the nodal voltages in the reactive power sub-networks , , and were recalculated for further voltage control. After the reactive power control correction, the overvoltage still could not be solved. Then the active power curtailing of the PVs is corrected by the RZVC in the order of , , , and . When all the overvoltage problems were eliminated, the absorbed reactive power was shown in Figure 9 and the curtailed active power was shown in Figure 10. It can be seen that compare to the SZS, the RZVC reduced the absorbed reactive power of the PV inverters, and increased the curtailed active power of the PV inverters. Because the real-time PV generations were more than forecasted PV generations, and the absorbed reactive power of PV inverters in real-time could not reach the value given by the SZS, the absorbed reactive power of PV inverters was reduced, and the curtailed active power of PV inverters was increased in the RZVC. Moreover, it could be seen that not all the PV inverters participated the voltage control. Some PVs still operated without any reactive power or active power control. After the correction of the RZVC, the voltage profile was as shown in Figure 11. It is shown that the proposed scheme could effectively control the voltages to the permissible voltage range.
4.3. Comparison of the Partition Performance
To illustrate the fact that the proposed improved modularity function could partition the ADNs well with high penetration of PVs, the modularity function [22] was utilized to partition the ADNs (taking the reactive power network partition as an example). The results with proposed strategy and with the modularity function were compared in Table 2, which showed the practicability of the proposed strategy.
Table 2.
Comparison of the Partition Solutions.
Table 2 shows the reactive power network partition and the active power network partition for the ADN with the modularity function. As shown, the feeder was divided into 15 reactive power sub-networks and 13 active power sub-networks. The smallest reactive power sub-network (reactive power sub-network 1) contained five nodes, while the largest (reactive power sub-network 9) contained 12 nodes. There was a large difference in the size of the sub-networks with the modularity function. However, the feeder was divided into nine sub-networks with the proposed method. The smallest sub-network (reactive power sub-network 9) contained nine nodes, while the largest (reactive power sub-network 1, 4, and 7) contained 14 nodes. Compared with the modularity function, the difference in the size of the reactive power sub-networks was much smaller. This was because the internal reactive power sensitivity function and the reactive power sensitivity function in the proposed method could restrict the node size within a sub-network and prevent an excessive nodal number within a sub-network. Then the size of the sub-networks with the proposed strategy was more reasonable. Similarity, it can be seen from Table 2, the node size of the active power sub-networks with the proposed method was much better than that with the modularity function.
In addition to the difference in the size of the sub-networks, reactive power sub-networks 1, 7, 11, and 14 and active power sub-networks 6 and 12 did not have PVs with the modularity function. However, with the proposed method, each reactive power and active power sub-network contained PVs, and adjustable reactive power and active power existed in every sub-network. Therefore, the partition results were more reasonable than the modularity function. The main reason for the difference was the existence of the reactive/active power balance function in the proposed method. The function could evaluate the degree to which the adjustable reactive or active power of PV inverters met the reactive/active power demand in each sub-network. Moreover, the reactive/active power balance function could improve the reactive/active power balance ability of the PV inverters within a sub-network. Then each reactive power cluster contained PVs with the proposed method.
To further illustrate the effectiveness of this proposed strategy, the proposed multiple spatiotemporal characteristics-based zonal voltage control scheme was carried out for the two partition method. The total absorbed reactive power and the curtailed active power of the PV inverters are shown in Table 2. It was shown that the total absorbed reactive power and the curtailed active power of PV inverters with the partition attained by the proposed function were smaller than those attained by the modularity function, which proved that the proposed function could result in a more reasonable partition and produce a more economical voltage control.
From the above analysis, it can be concluded that the proposed partition strategy was more practical than the modularity function in terms of the power balance ability by the PV inverters within a sub-network, the size of the sub-networks, and the economy of the voltage control. This indicated that the proposed method was more suitable for ADNs with high penetration PVs.
4.4. Comparison with a Centralized Control Scheme
To further analyze the advantages of the proposed scheme, a centralized control scheme was compared with the proposed control scheme to provide a comparative assessment. In the centralized method, all the nodes of the feeder were treated as a complete reactive power sub-network and a complete active power sub-network. The multiple spatiotemporal characteristics-based zonal voltage control scheme was conducted based on one reactive power sub-network and one active power sub-network. Under the two control schemes, the voltage profile is shown in Figure 12.
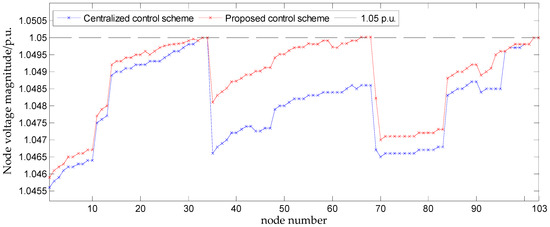
Figure 12.
Voltage profiles under the centralized control scheme and the proposed scheme.
As shown of the voltage profile, both of zonal control and centralized control could manage the voltage to acceptable range. Figure 13 shows the absorbed reactive power and the curtailed active power of the PV inverters under centralized control scheme. It is shown that all the PV inverters participated in voltage control. For nodes 35–69 in particular, no overvoltage occurred among these nodes, but the PV inverters in nodes 45, 48, 53, 59, and 60 absorbed the reactive power for the voltage support. The main reason for this was that under the centralized control, all of the nodes belonged to one sub-network, and all of the PV inverters were involved in the optimization together to regulate the voltage, which was a global optimizing process. However, the proposed scheme involved independent optimizing processes versus sub-networks, and the PV inverters provided voltage support only in sub-networks with overvoltage. Thus, under the proposed scheme, the PV inverters in nodes 45, 48, 53, 59, and 60 did not participate in voltage control.

Figure 13.
Absorbed reactive power and curtailed active power of PV inverters under the centralized control scheme.
The total reactive power supports, the active power curtailments, and the network losses for the two schemes are given in Table 3. Under the centralized control scheme, the absorbed total reactive power by the PV inverters was 2677.28 kVar, the curtailed active power was 315.78 kW, and the network losses were 312.41 kW. However, the total absorbed reactive power by the PV inverters under the zonal control method was 1533.92 kVar, the curtailed active power was 430.19 kW and the network losses were 434.72 kW. In comparison, the centralized control method curtailed less active power and generated less network losses than the proposed method, but it needed much more reactive power for the voltage regulation. It can be seen from Figure 12 and Figure 13 that under the centralized control scheme, the absorbed reactive power in nodes 45, 48, 53, 59, and 60 only apparently reduced the voltage magnitude among nodes 35–69, but it provided very small contributions to the nodes with overvoltage. This was because the PV inverters in nodes 45, 48, 53, 59, and 60 had strong reactive power-voltage sensitivity with the nodes in {, , }, but for the nodes in other sub-networks, the reactive power-voltage sensitivity was weekly. Then the absorbed reactive power in nodes 45, 48, 53, 59, and 60 had very little effect on the overvoltage, which could be regarded as a waste of the reactive power. However, with the proposed method, the nodes belonging to the same sub-network had strong power-voltage sensitivity to each other. Additionally, the PV inverters regulated the voltage of nodes with strong voltage sensitivity, so the absorbed reactive power, as well as the curtailed active power by PV inverters could be efficiently utilized to solve the overvoltage within the same sub-network, which produced less power waste than the centralized control scheme. Therefore, the proposed scheme is acceptable for practical applications.
Table 3.
Comparison of the Two Schemes.
An important index, which is used to evaluate the quality of the voltage control, is the magnitude of the voltage. However, the number of PVs has increased rapidly in ADNs, and the penetration of PVs has increased. Considering the requirements of voltage control, the computing time of a control scheme is another important index for evaluating the quality of voltage control, especially for real-time voltage control. Table 3 shows the computing time for the two schemes, and the computing time that was gotten by the MATLAB simulation.
Table 3 shows the computing time under the two schemes. Under the centralized control scheme, the computing time was 67.62 s. However, the computing time under the proposed scheme was 10.41 s. Compared to the centralized control scheme, the computing time of the proposed scheme was greatly reduced. The main reason for this was that, when the overvoltage was managed by the centralized control scheme, all PV inverters were involved in the optimization, and optimization complexity was greatly increased. By contrast, the network partition could divide the ADN into several sub-networks under the proposed scheme. The optimization scale for the PV inverters could be reduced from the whole ADN to the selected sub-networks. And when the voltage control was carried out, the only the selected sub-networks achieved optimization or control of their PV inverters. And the impact of other sub-networks was no need to be considered. Consequently, under the proposed method, the number of control nodes could be greatly reduced and the optimization process can be simplified. Promising over the computing time, the proposed scheme will show more advantages compared with centralized control scheme as the penetration of PVs increasing. Thus, the proposed method will be more suitable for voltage control in the ADNs with the high penetrated PVs.
The analysis revealed that, the proposed multiple spatiotemporal characteristics-based zonal voltage control scheme could increase the utilization of the PV inverters in voltage regulation, simplify the optimization by reducing controlled nodes, and manage the voltage of the ADN rapidly. Therefore, the proposed multiple spatiotemporal characteristics-based zonal voltage control scheme could satisfy the actual voltage control requirements, and the scheme could be applied to the actual ADN with a high penetrated PVs.
5. Conclusions
As the penetration of PVs increases, the overvoltage in ADNs will become more serious. Additionally, the scale and capacity of PVs will grow significantly. The traditional centralized voltage control methods will not satisfy the computing time requirements of voltage control. To solve the overvoltage, this study proposes a zonal voltage control scheme based on multiple spatiotemporal characteristics. In the spatial domain, a reactive/active power quality function based community detection algorithm was introduced in order to partition the ADN into reactive/active power sub-networks. In the time domain, a short-term zonal scheduling with 1 h granularity was drawn up based on the cluster. The objective was to minimize the supported reactive power and the curtailed active power of PV inverters in reactive and active power sub-networks. A real-time zonal voltage control scheme with 1 min granularity was proposed in order to rapidly correct the SZS by choosing and controlling the key PV inverter to dispatch the reactive power and active power of PV inverters to correct the SZS in each sub-network. Simulation studies were carried out on an actual 10 kV, 103-node network in Zhejiang Province of China to verify effectiveness and feasibility. The analyses show that the proposed method could give a more reasonable partition result for the zonal control. In addition, the proposed scheme could simplify the optimization by reducing the controlled nodes, and manage the voltage of the ADN rapidly. On the basis of this work, to further improve the PV hosting capacity in future AND, the uncertainty of PV outputs in the partition of ADNs, as well as the uncertainty of PV outputs in zonal voltage control, will be further addressed in future work, thereby promoting a sustainable development of PVs.
Author Contributions
C.X. helped to analyze the data, design the study, and write the manuscript. L.S. helped to analyze the data and edit the manuscript. M.D. helped conduct the study. All authors have read and agreed to the published version of the manuscript.
Funding
This work was supported by the National Natural Science Foundation of China (No. 51207140) and the Fundamental Research Funds for the Central Universities of China (No. PA2019GDPK0085).
Conflicts of Interest
The authors declare no conflict of interest.
References
- Koutsoukis, N.; Georgilakis, P.; Hatziargyriou, N. Multistage Coordinated Planning of Active Distribution Networks. IEEE Trans. Power Syst. 2018, 33, 32–44. [Google Scholar] [CrossRef]
- Riffonneau, Y.; Bacha, S.; Barruel, F.; Ploix, S. Optimal Power Flow Management for Grid Connected PV Systems with Batteries. IEEE Trans. Sustain. Energy 2011, 2, 309–320. [Google Scholar] [CrossRef]
- Ding, M.; Wang, W.; Wang, X.; Song, Y.; Chen, D.; Sun, M. A Review on the Effect of Large-Scale PV Generation on Power Systems. Proc. CSEE 2014, 34, 1–14. [Google Scholar]
- Ghosh, S.; Rahman, S.; Pipattanasomporn, M. Distribution Voltage Regulation through Active Power Curtailment with PV Inverters and Solar Generation Forecasts. IEEE Trans. Sustain. Energy 2017, 8, 13–22. [Google Scholar] [CrossRef]
- Zeraati, M.; Golshan, M.E.H.; Guerrero, J.M. A Consensus-Based Cooperative Control of PEV Battery and PV Active Power Curtailment for Voltage Regulation in Distribution networks. IEEE Trans. Smart Grid 2019, 10, 13–22. [Google Scholar] [CrossRef]
- Safayet, A.; Fajri, P.; Husain, I. Reactive Power Management for Overvoltage Prevention at High PV Penetration in a Low-Voltage Distribution System. IEEE Trans. Ind. Appl. 2017, 53, 5786–5794. [Google Scholar] [CrossRef]
- Padullaparti, H.V.; Nguyen, Q.; Santoso, S. Advances in Voltvar Control Approaches in Utility Distribution Systems. In Proceedings of the 2016 IEEE Power and Energy Society General Meeting (PESGM) 2016, Boston, MA, USA, 17–21 July 2016; pp. 1–5. [Google Scholar]
- Dall’Anese, E.; Dhople, S.V.; Giannakis, G.B. Optimal Dispatch of Photovoltaic Inverters in Residential Distribution Systems. IEEE Trans. Sustain. Energy 2014, 5, 487–497. [Google Scholar] [CrossRef]
- DallAnese, E.; Dhople, S.V.; Johnson, B.B.; Giannakis, G.B. Decentralized Optimal Dispatch of Photovoltaic Inverters in Residential Distribution Systems. IEEE Trans. Energy Convers. 2014, 29, 957–967. [Google Scholar] [CrossRef]
- Dall’Anese, E.; Dhople, S.V.; Johnson, B.B.; Giannakis, G.B. Optimal Dispatch of Residential Photovoltaic Inverters under Forecasting Uncertainties. IEEE J. Photovolt. 2015, 5, 350–359. [Google Scholar] [CrossRef]
- Weckx, S.; Gonzalez, C.; Driesen, J. Combined Central and Local Active and Reactive Power Control of PV Inverters. IEEE Trans. Sustain. Energy 2014, 5, 776–784. [Google Scholar] [CrossRef]
- Biserica, M.; Foggia, G.; Chanzy, E.; Passelergue, J.C. Network Partition for Coordinated Control in Active Distribution Networks. In Proceedings of the 2013 IEEE Grenoble, PowerTech (POWERTECH), Grenoble, France, 16–20 June 2013. [Google Scholar]
- Gong, Y.; Wu, H.; Yang, K. A Network Partition Method for Power System Reactive Power Control Based on Power Flow Tracing. Autom. Electr. Power Syst. 2013, 37, 29–33. [Google Scholar]
- Chen, C.; Wang, J.; Qiu, F.; Zhao, D. Resilient Distribution System by Microgrids Formation After Natural Disasters. IEEE Trans. Smart Grid 2016, 7, 958–966. [Google Scholar] [CrossRef]
- Xu, X.; Xue, F.; Lu, S.; Zhu, H.; Jiang, L. Structural and Hierarchical Partitioning of Virtual Microgrids in Power Distribution Network. IEEE Syst. J. 2019, 13, 823–832. [Google Scholar] [CrossRef]
- Balasubramaniam, K.; Abdlrahem, A.; Hadidi, R.; Makram, E.B. Balanced, Non-Contiguous Partitioning of Power Systems Considering Operational Constraints. Electr. Power Syst. Res. 2016, 140, 456–463. [Google Scholar] [CrossRef]
- Zhao, B.; Xu, Z.; Xu, C.; Wang, C.; Lin, F. Network Partition Based Zonal Voltage Control for Distribution Networks with Distributed PV Systems. IEEE Trans. Smart Grid 2018, 9, 4087–4098. [Google Scholar] [CrossRef]
- Xiao, C.; Zhao, B.; Ding, M.; Li, Z.; Ge, X. Zonal Voltage Control Combined Day-Ahead Scheduling and Real-Time Control for Distribution Networks with High Proportion of PVs. Energies 2017, 10, 1464. [Google Scholar] [CrossRef]
- Di Fazio, A.; Russo, M.; De Santis, M. Zoning Evaluation for Voltage Optimization in Distribution Networks with Distributed Energy Resources. Energies 2019, 12, 390. [Google Scholar] [CrossRef]
- Jia, Y.; Xu, Z. A Direct Solution to Biobjective Partitioning Problem in Electric Power Networks. IEEE Trans. Power Syst. 2017, 32, 2481–2483. [Google Scholar] [CrossRef]
- Zeng, L.; Wang, L. Maximum Penetration of DG Based on Voltage Sensitivity. East China Electr. Power 2013, 41, 1175–1180. [Google Scholar]
- Girvan, M.; Newman, M.E.J. Community Structure in Social and Biological Networks. Proc. Natl. Acad. Sci. USA 2002, 99, 7821–7826. [Google Scholar] [CrossRef]
- Leon, D.; Díaz-Guilera, A.; Arenas, A. The Effect of Size Heterogeneity on Community Identification in Complex Networks. J. Stat. Mech. Theory Exp. 2006, 11, P11010. [Google Scholar]
- Zhao, B.; Guo, C.X.; Cao, Y.J. Improved Particle Swam Optimization Algorithm for OPF Problems. IEEE Power Syst. Conf. Exp. 2004, 2004, 233–238. [Google Scholar]
- Zhao, B.; Guo, C.X.; Cao, Y.J. An Improved Particle Swarm Optimization Algorithm for Optimal Reactive Power Dispatch. In Proceedings of the IEEE 2005 Power Engineering Society General Meeting, Francisco, CA, USA, 12–16 June 2005; pp. 272–279. [Google Scholar]
- Fuller, J.C.; McHann, S.E.; Sunderman, W. Using Open Source Modeling Tools to Enhance Engineering Analysis. In Proceedings of the 58th IEEE Rural Electric Power Conference (REPC), Fort Worth, TX, USA, 18–21 May 2014; pp. 41–45. [Google Scholar]
- Sunderman, W.; Dugan, R.C.; Smith, J. Open Source Modeling of Advanced Inverter Functions for Solar Photovoltaic Installations. In Proceedings of the 2014 IEEE PES T&D Conference and Exposition, Chicago, IL, USA, 14–17 April 2014; pp. 1–5. [Google Scholar]


© 2020 by the authors. Licensee MDPI, Basel, Switzerland. This article is an open access article distributed under the terms and conditions of the Creative Commons Attribution (CC BY) license (http://creativecommons.org/licenses/by/4.0/).