Hydrate Formation and Decomposition Regularities in Offshore Gas Reservoir Production Pipelines


Abstract

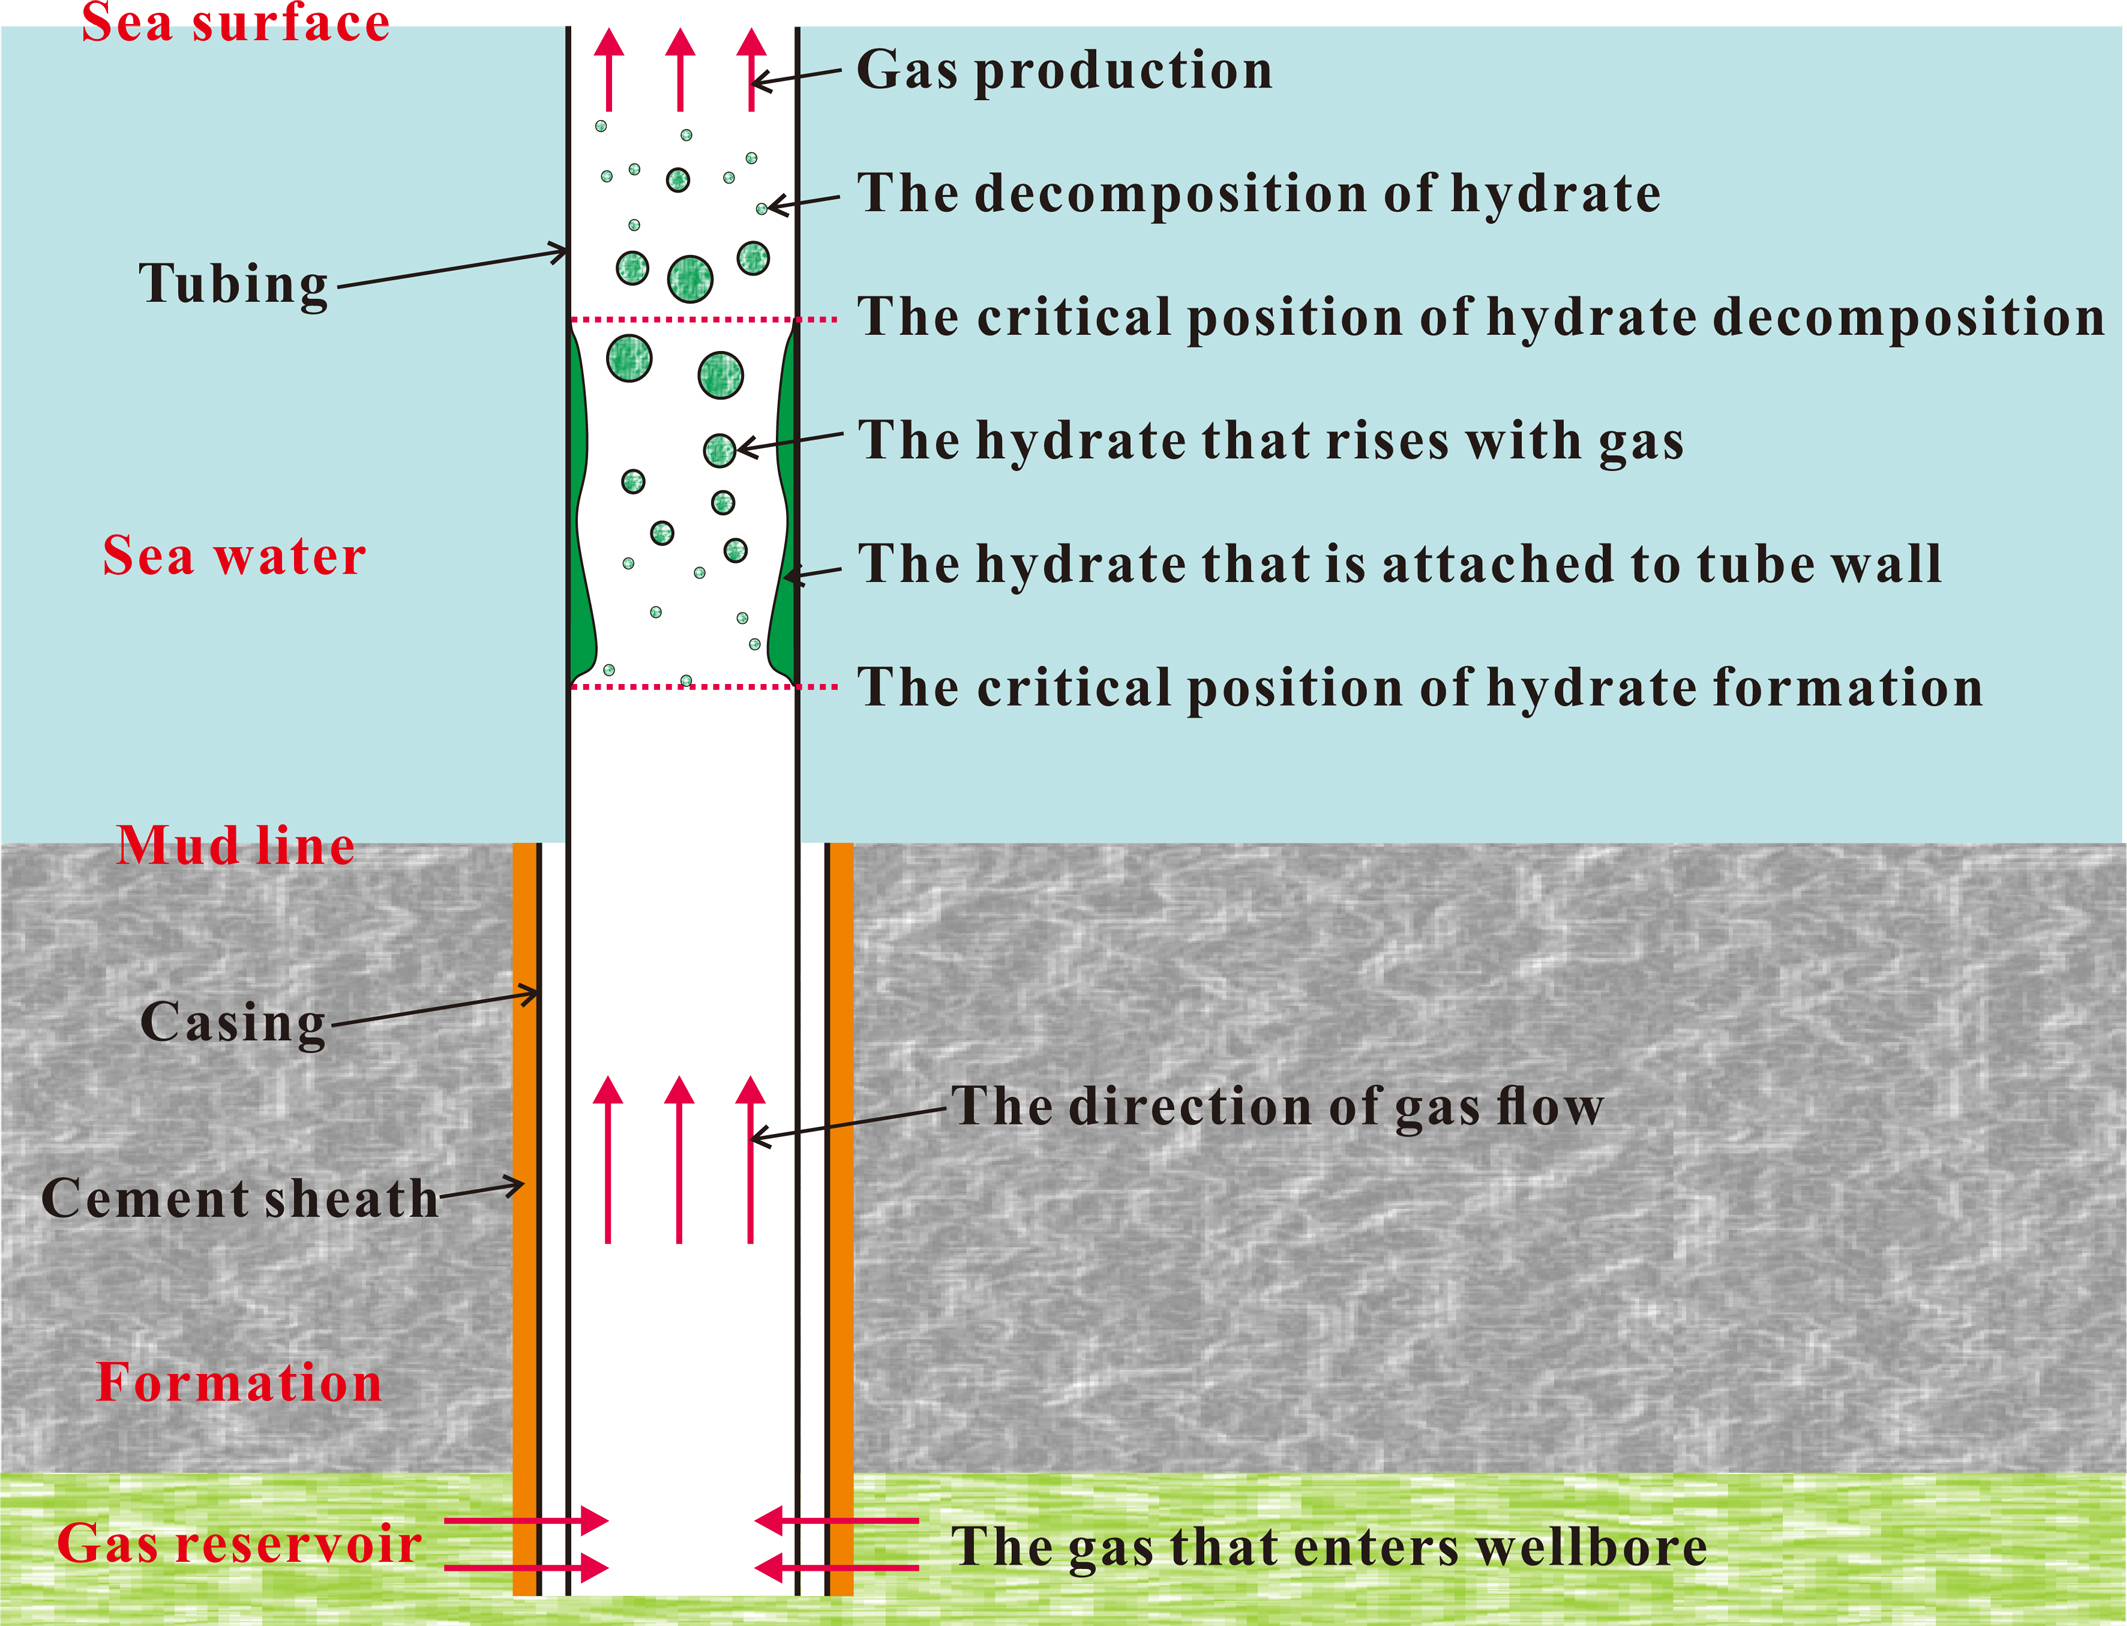
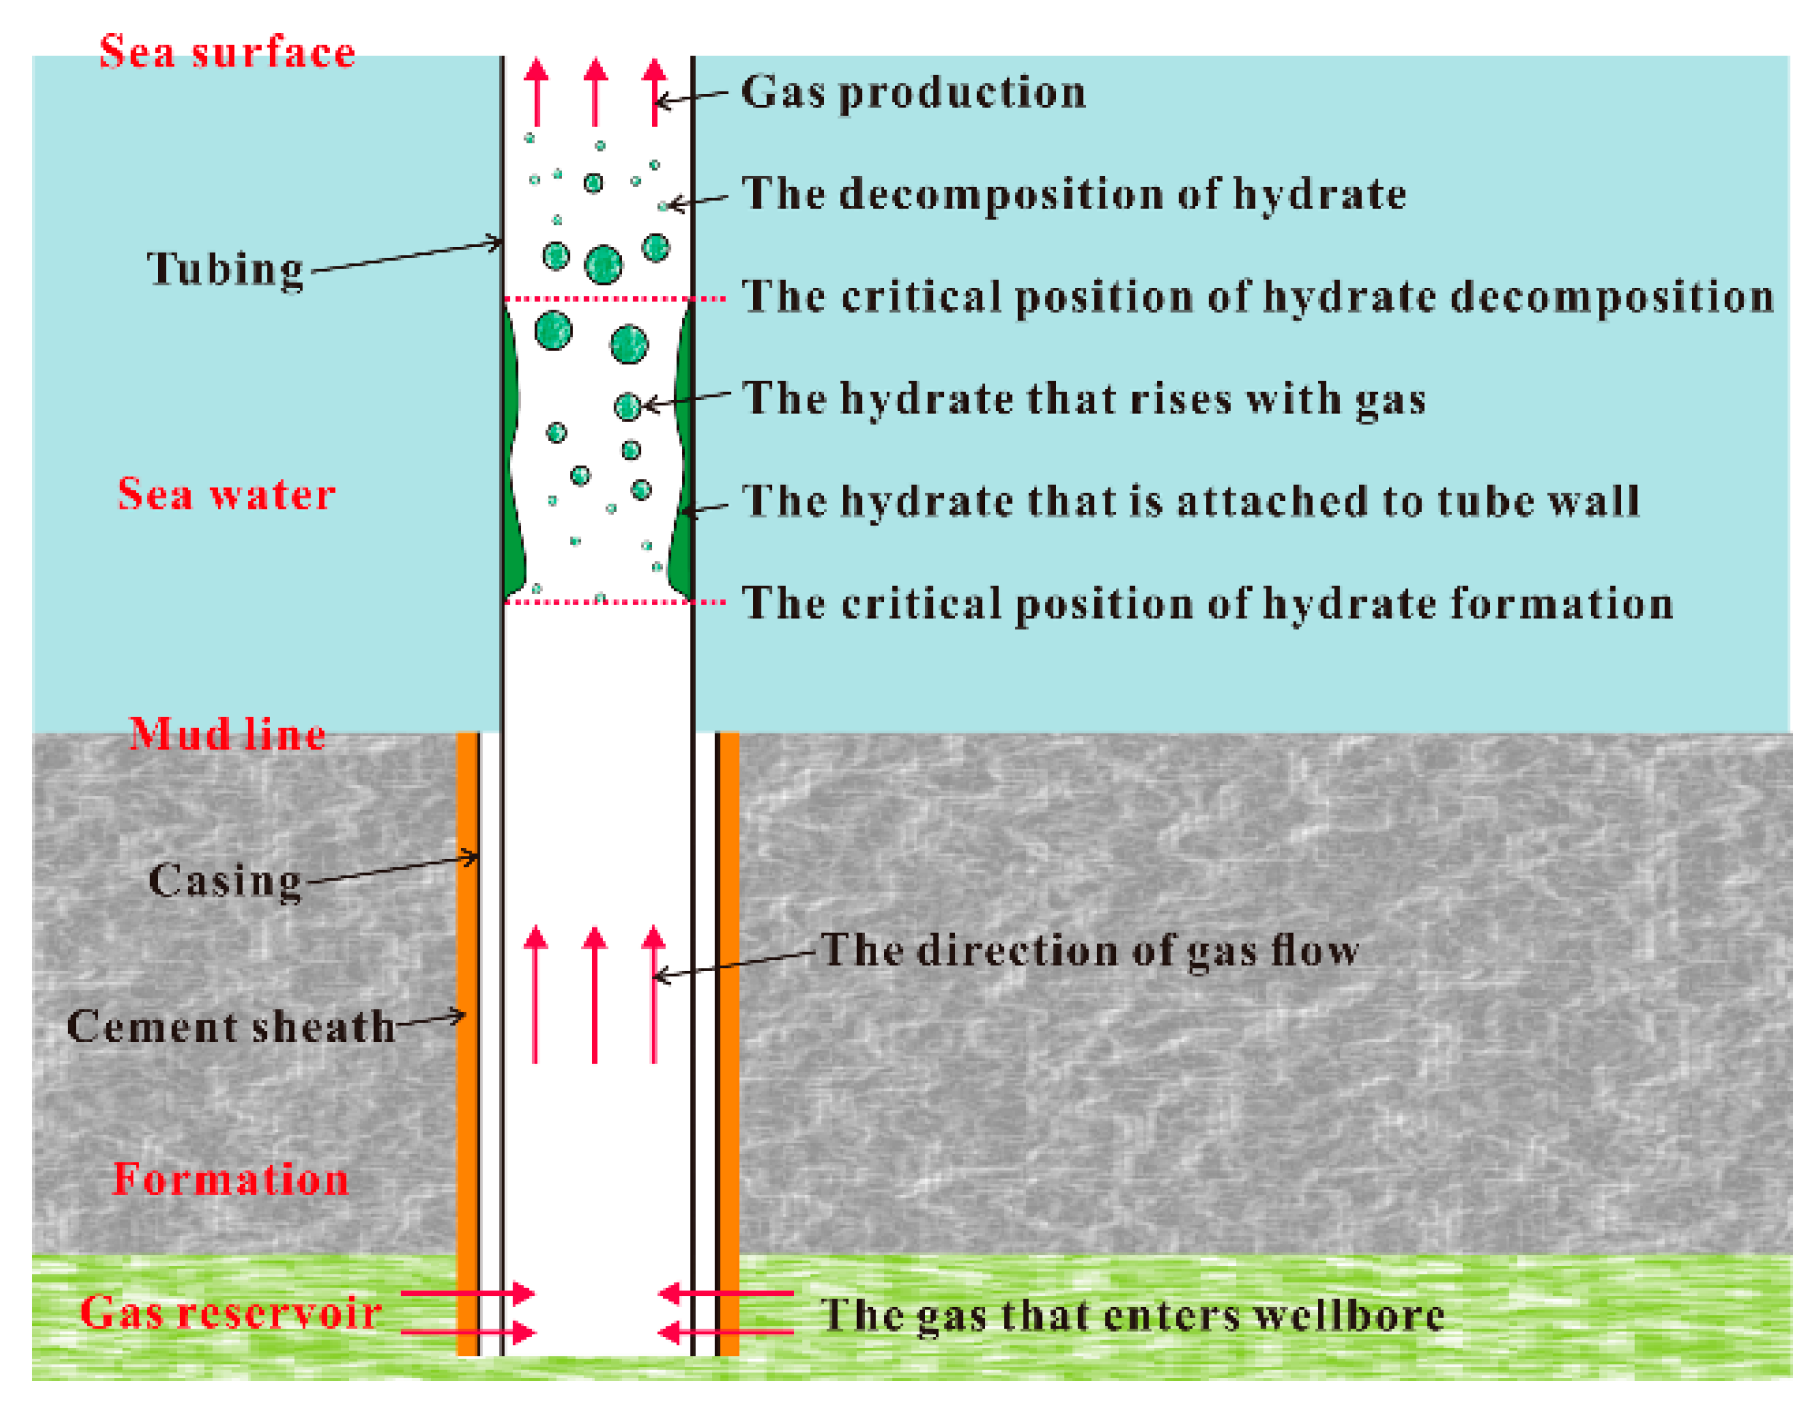
1. Introduction
2. Theoretical Models
2.1. Phase Equilibrium Model of Natural Gas Hydrate
2.2. Wellbore Temperature Model
2.3. Wellbore Pressure Model
2.4. Formation and Decomposition Models of Natural Gas Hydrate
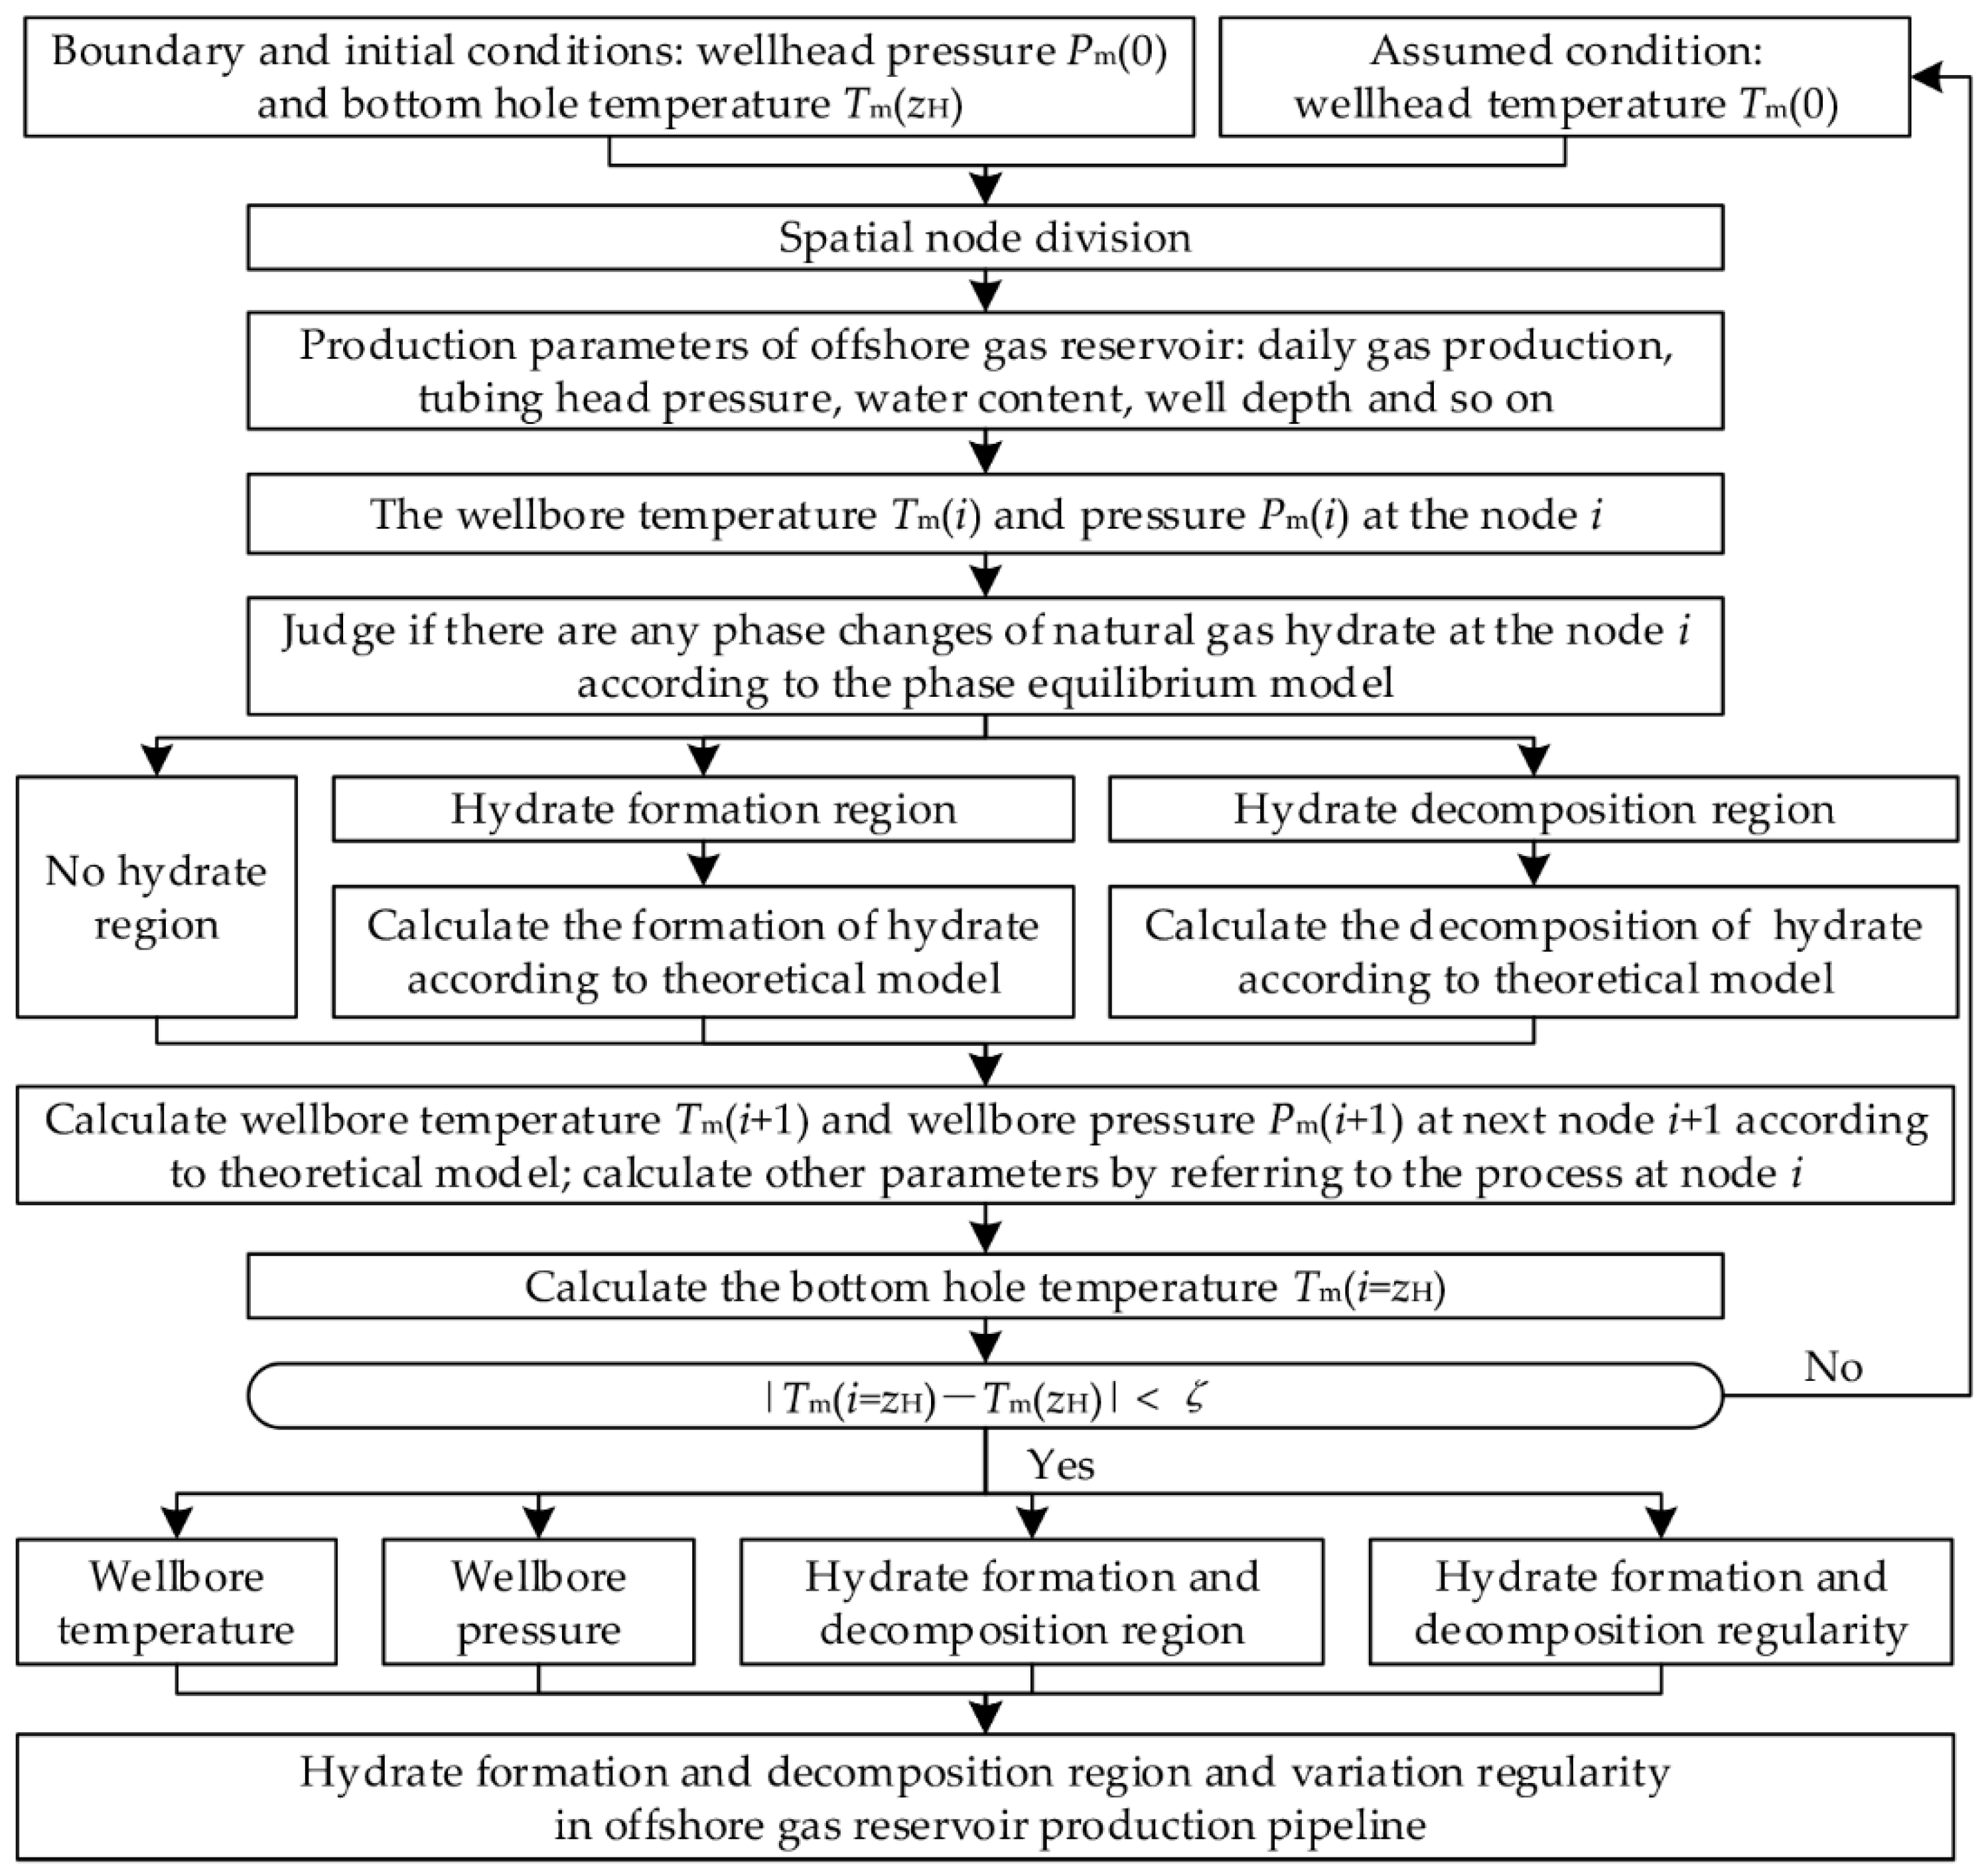
3. Numerical Simulation
4. Results and Analysis
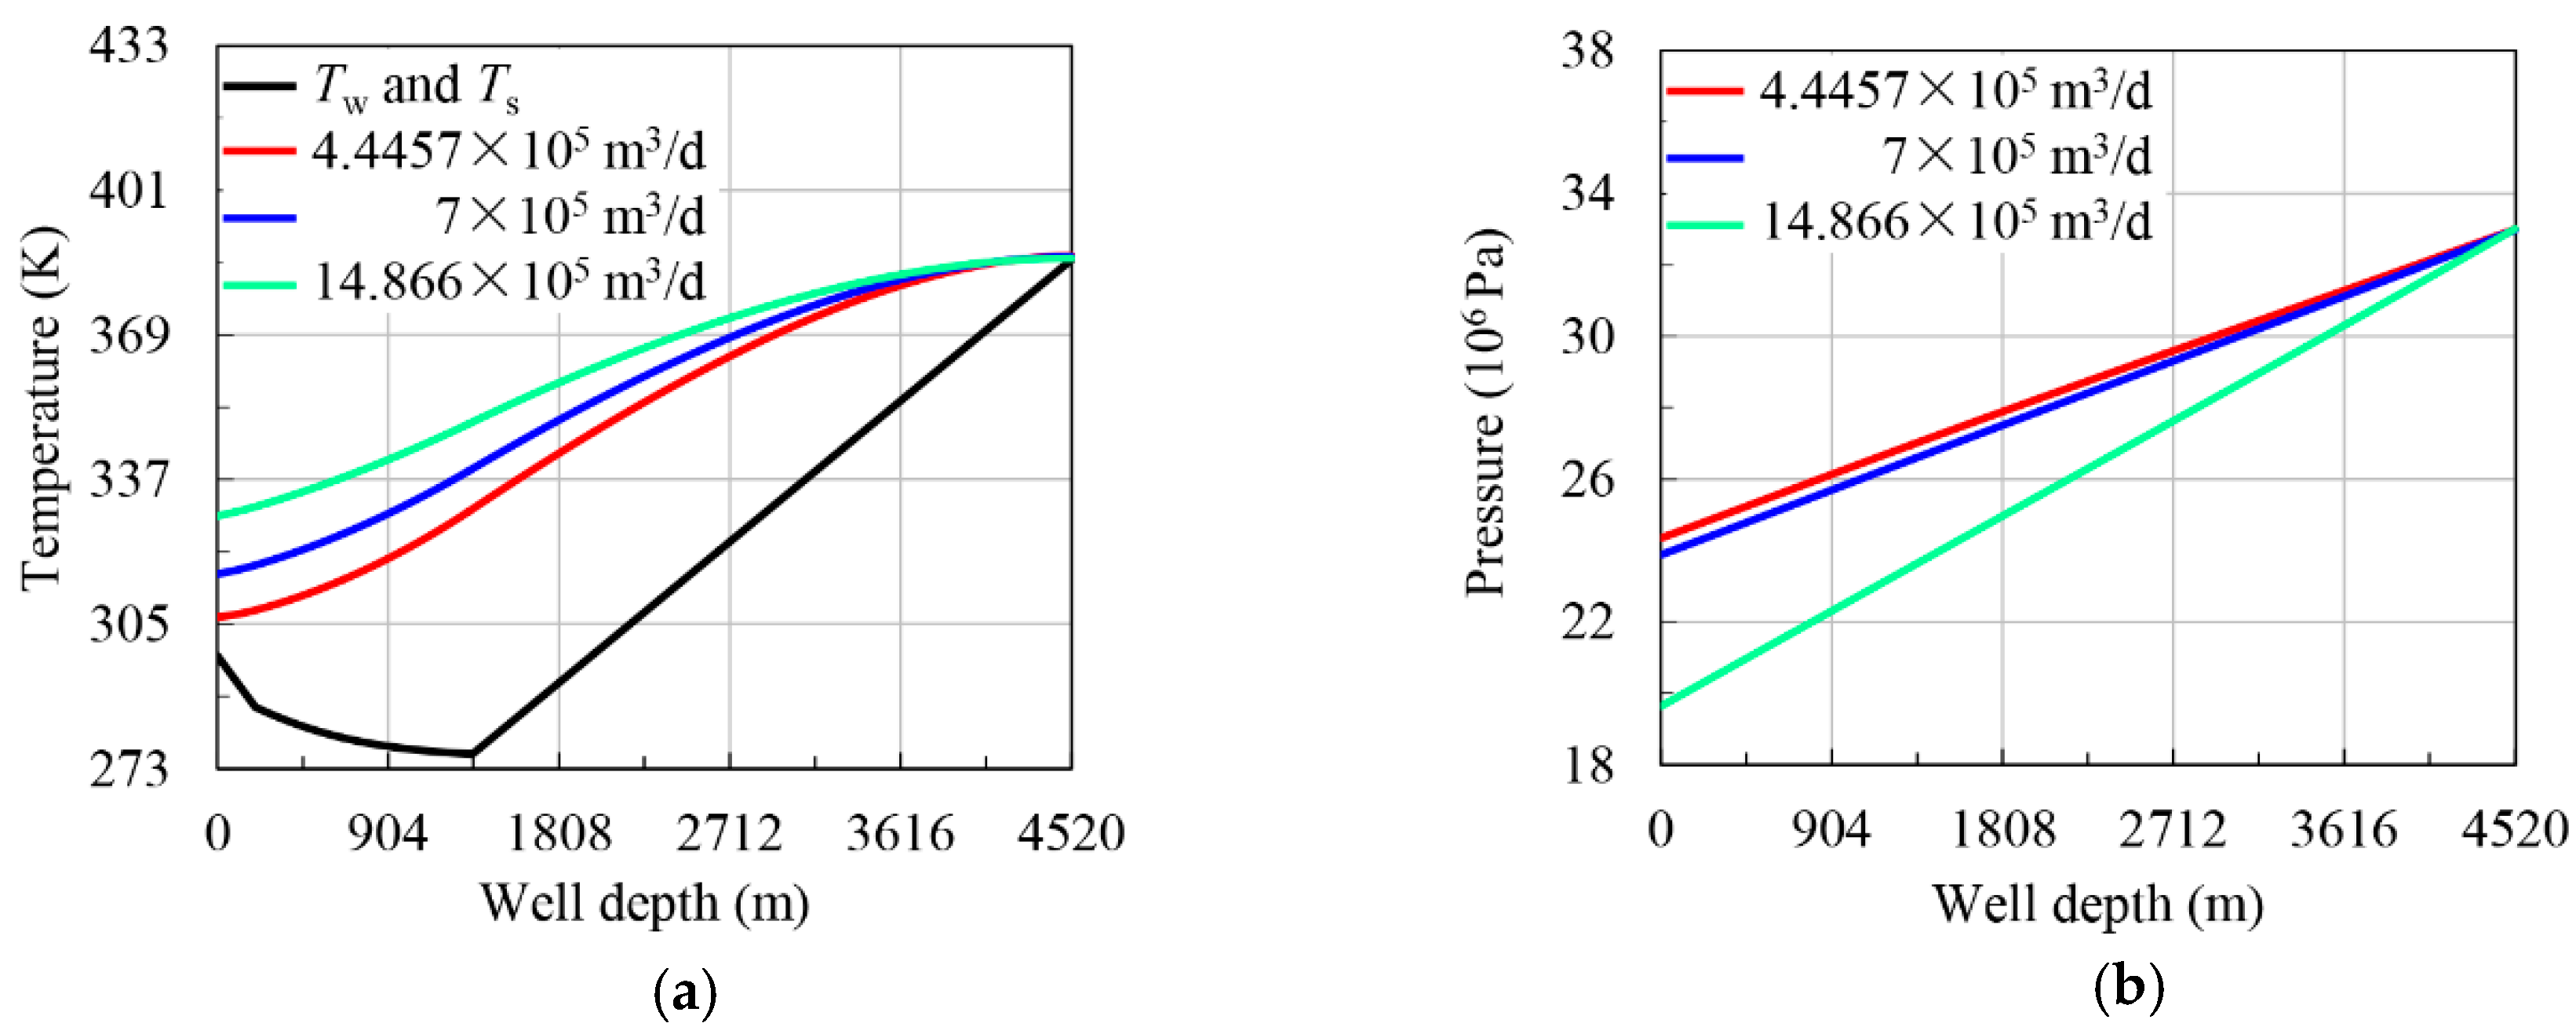
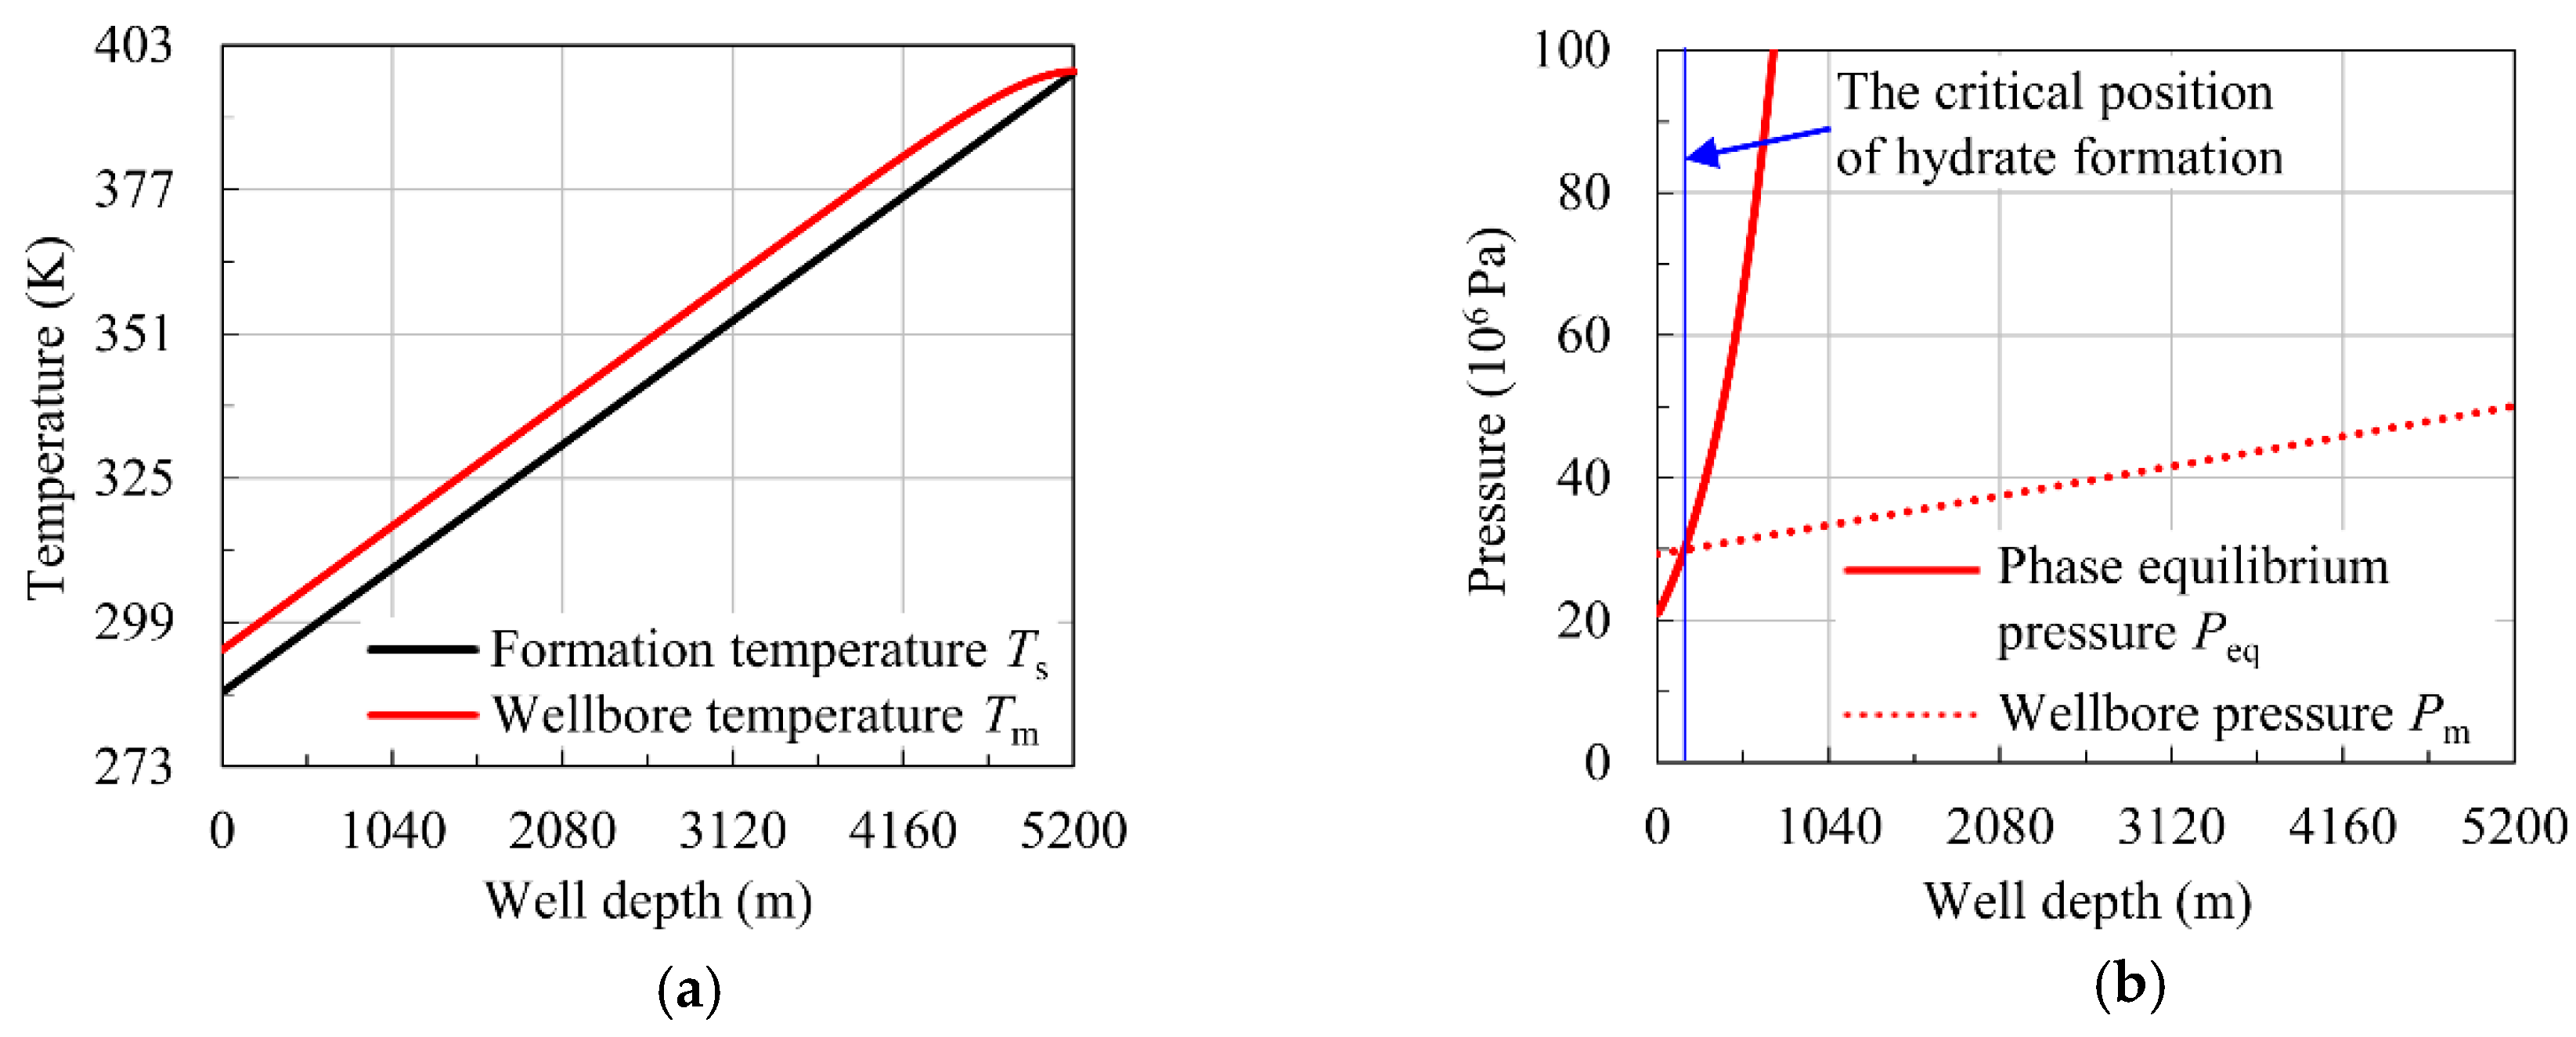
4.1. Model Verification
4.2. Influence Factors Analyses
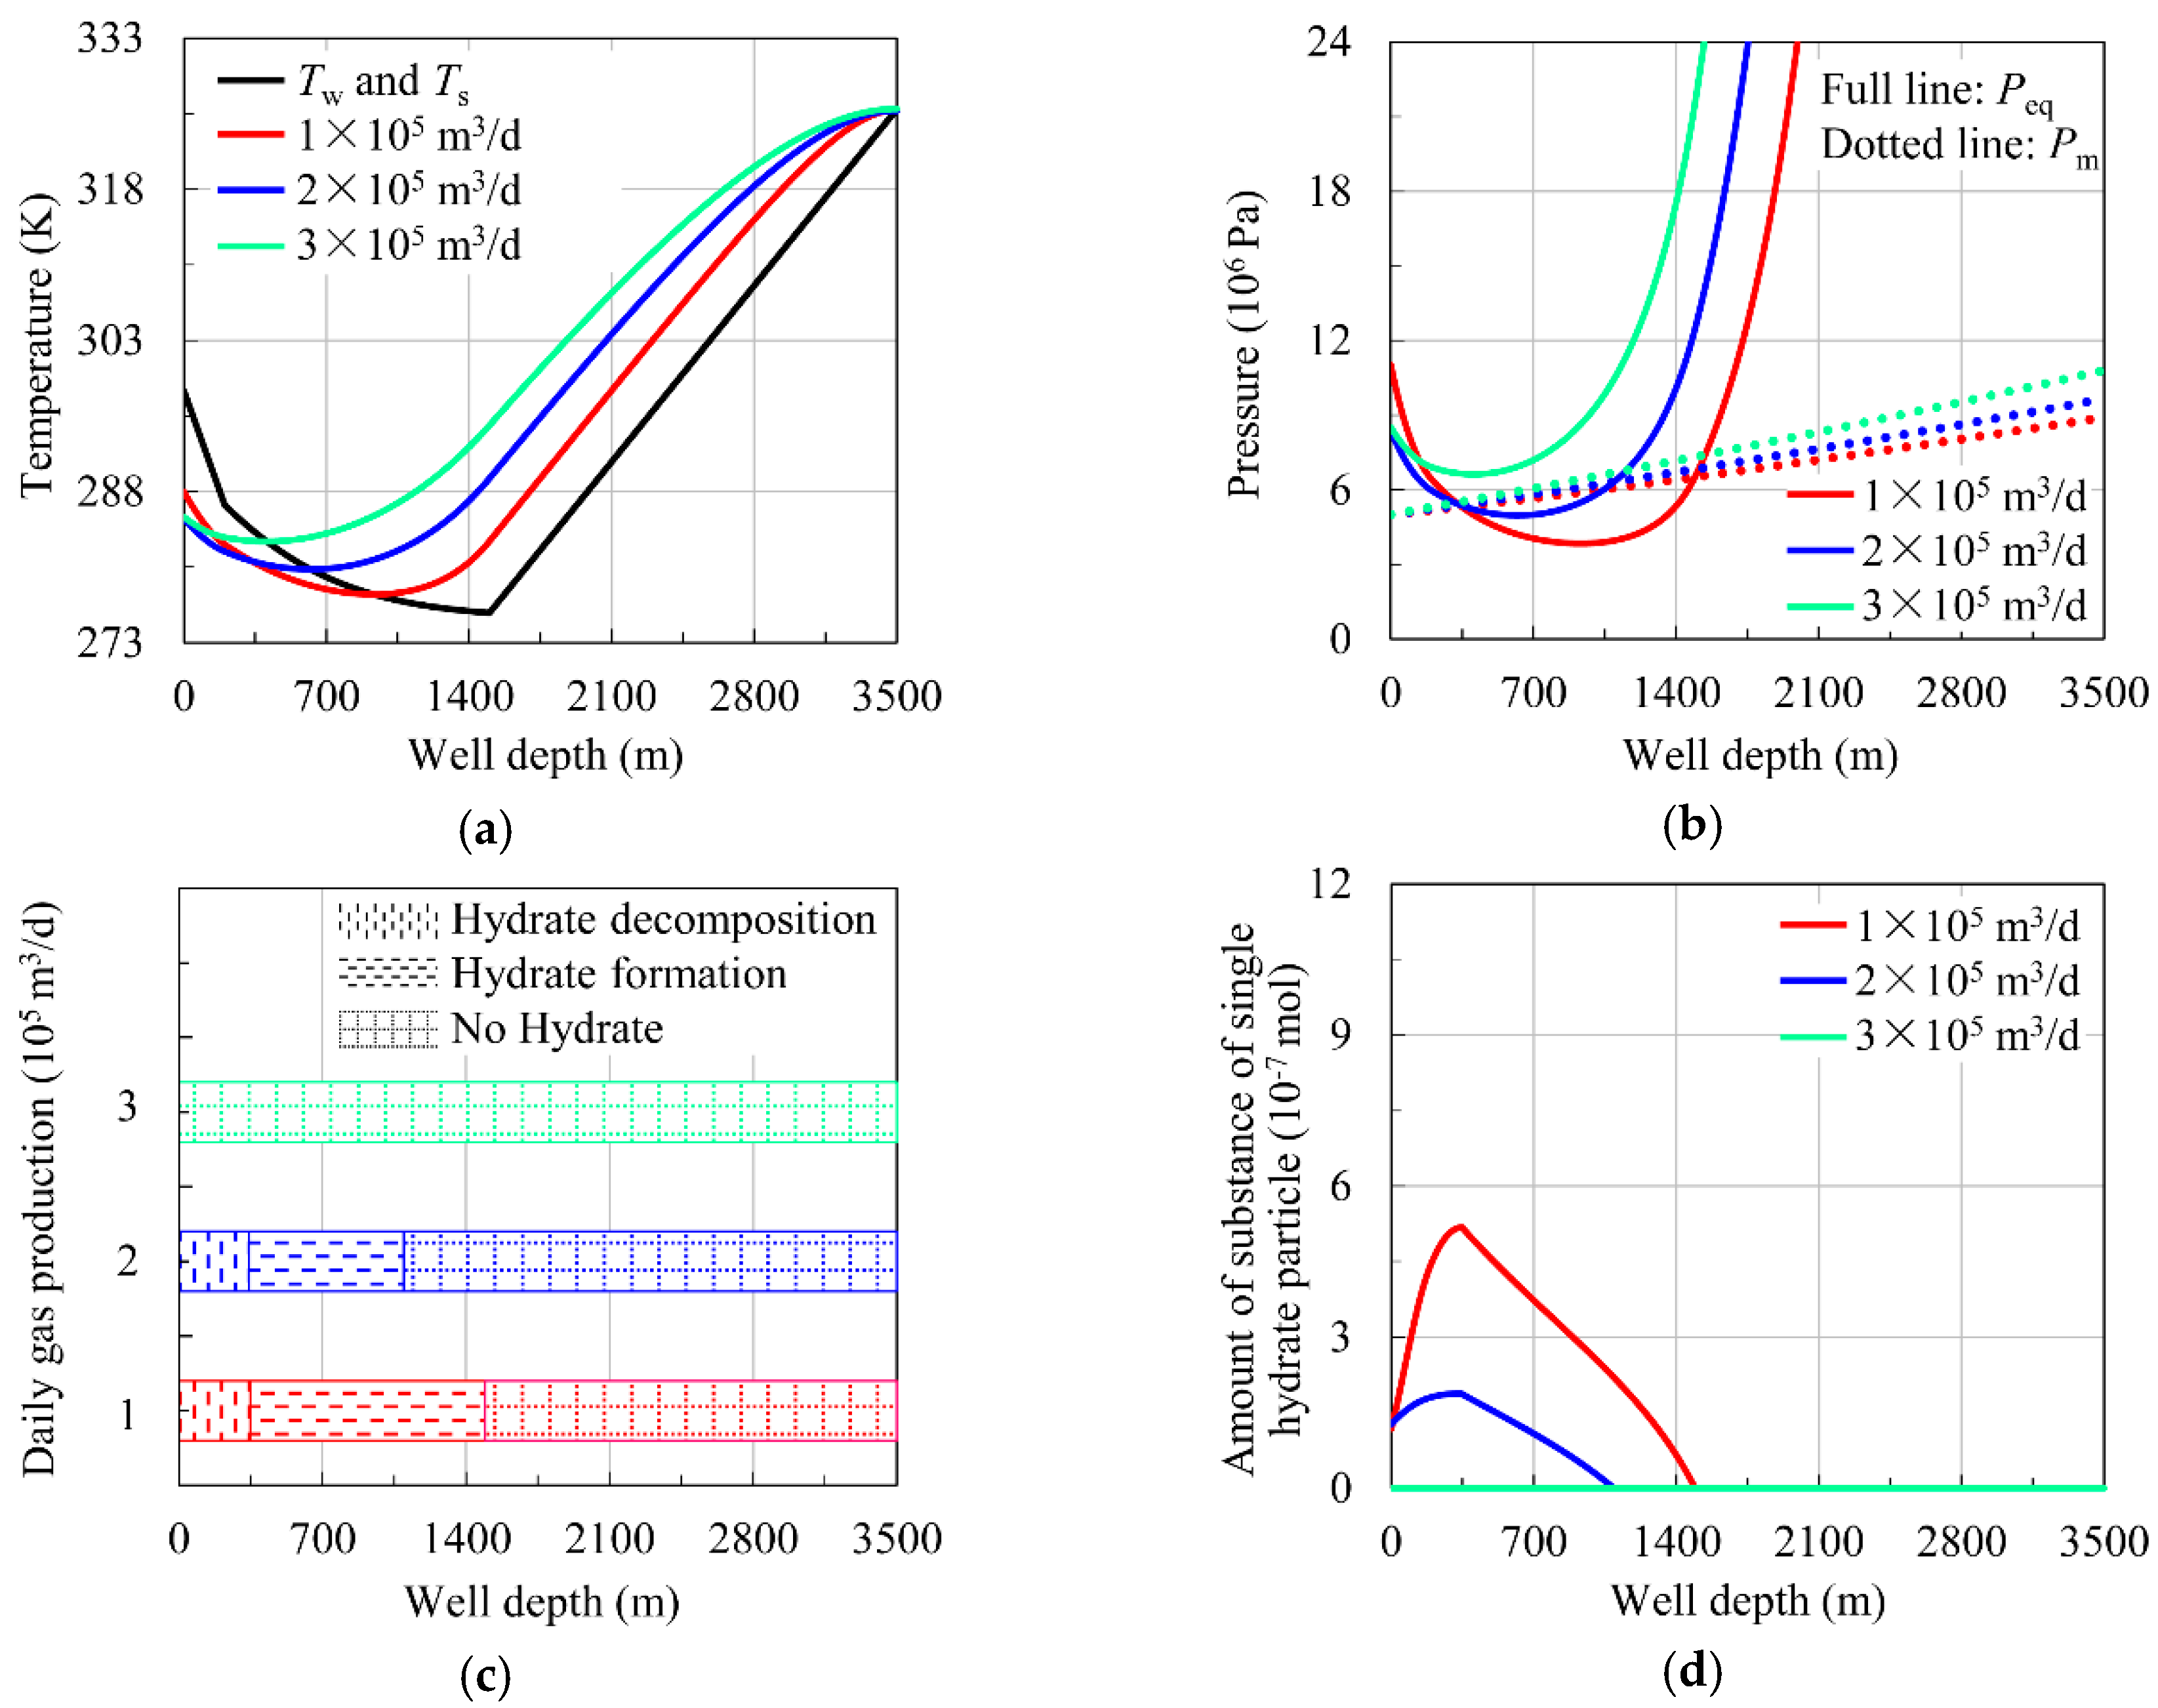
4.2.1. Influence of Daily Gas Production
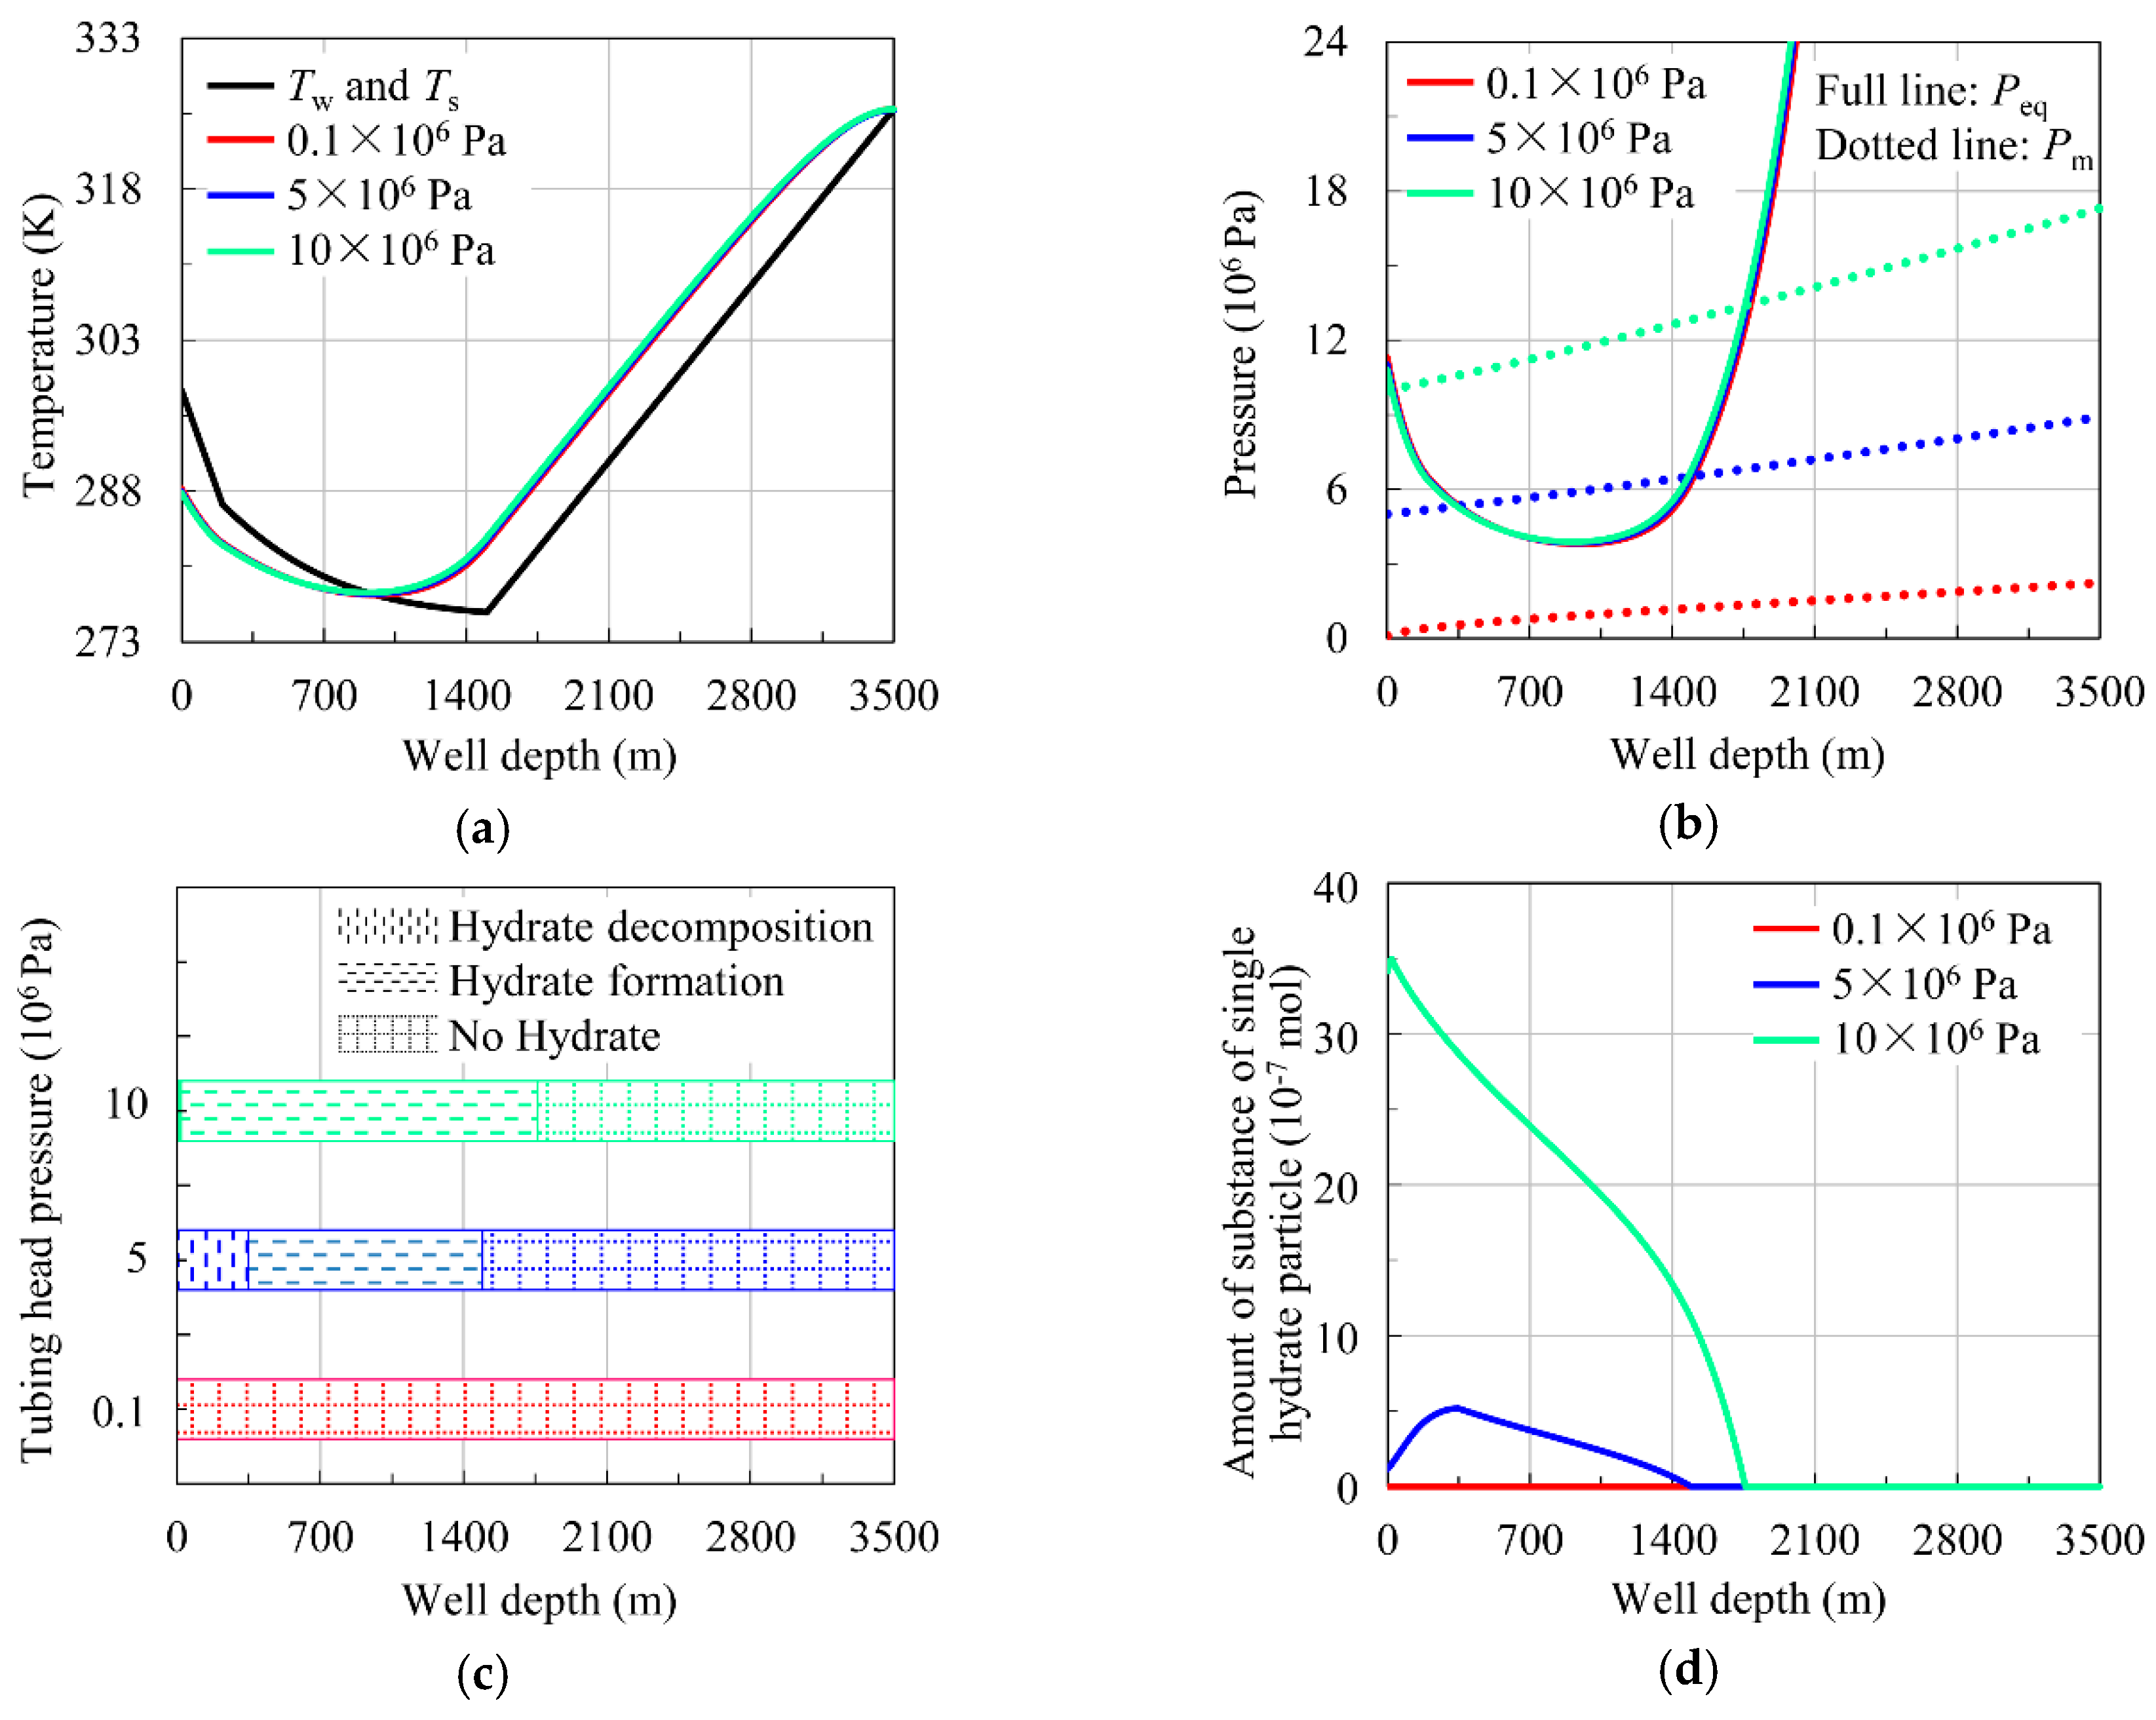
4.2.2. Influence of Tubing Head Pressure
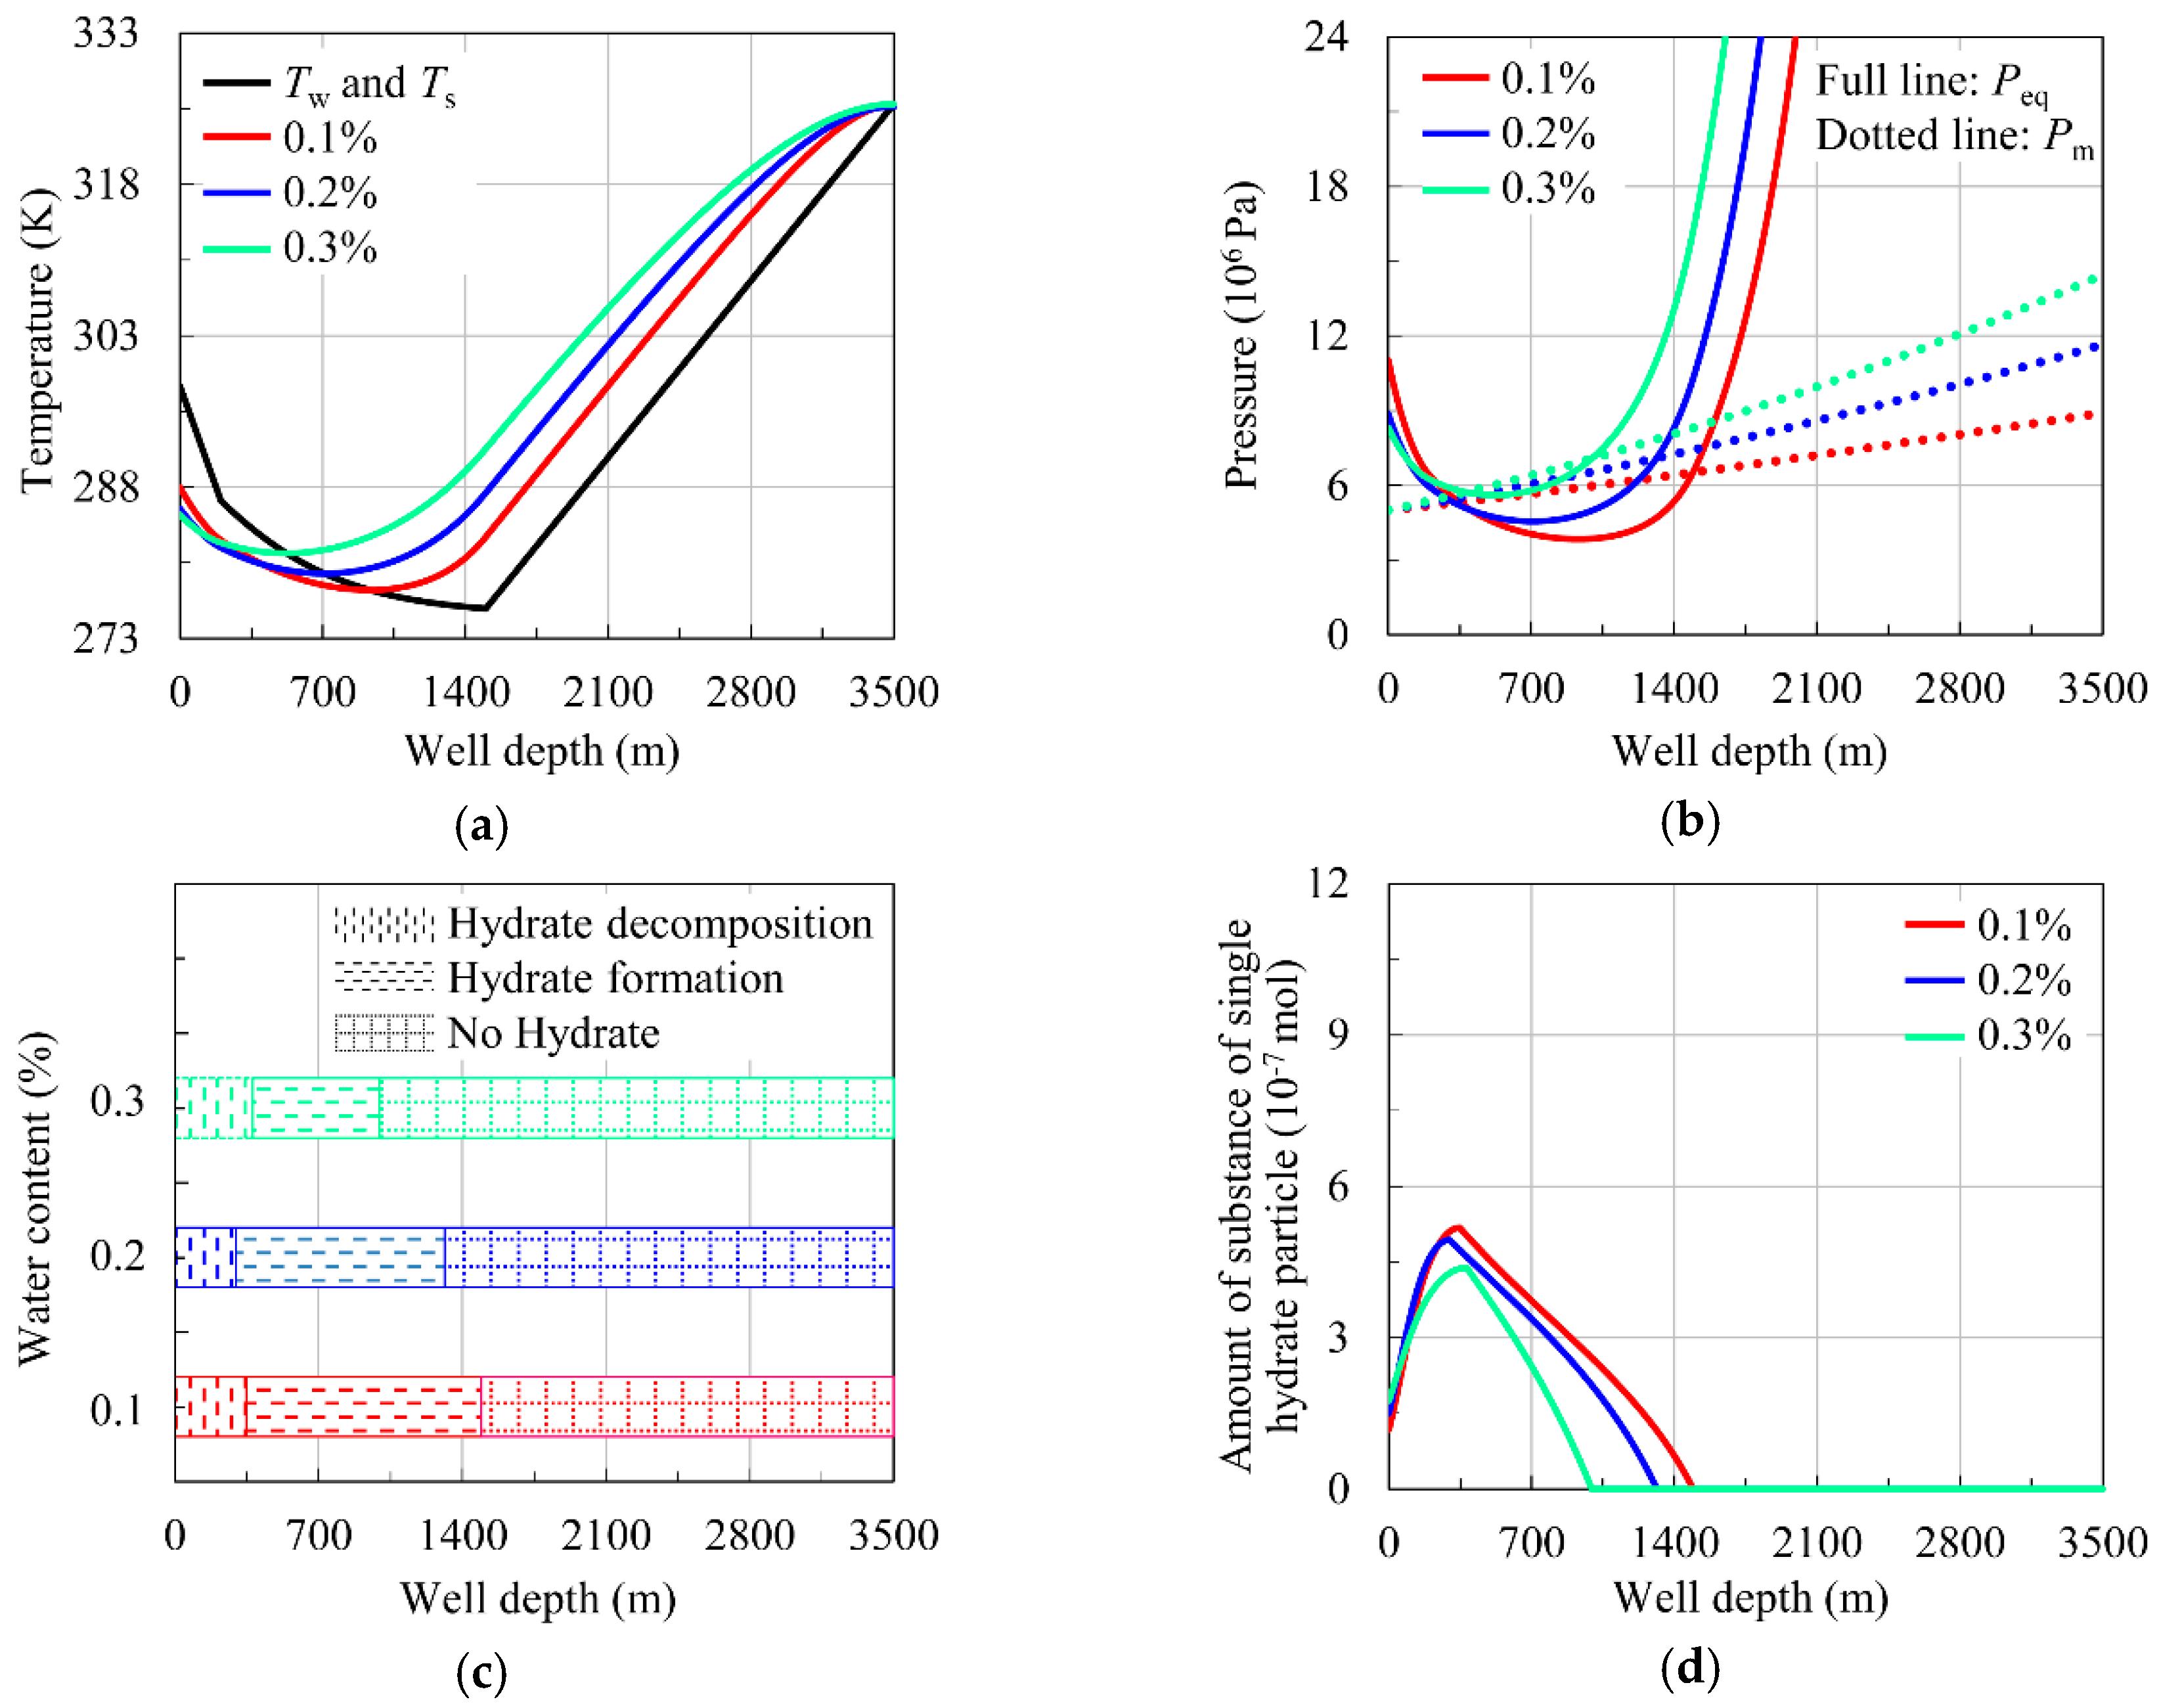
4.2.3. Influence of Water Content
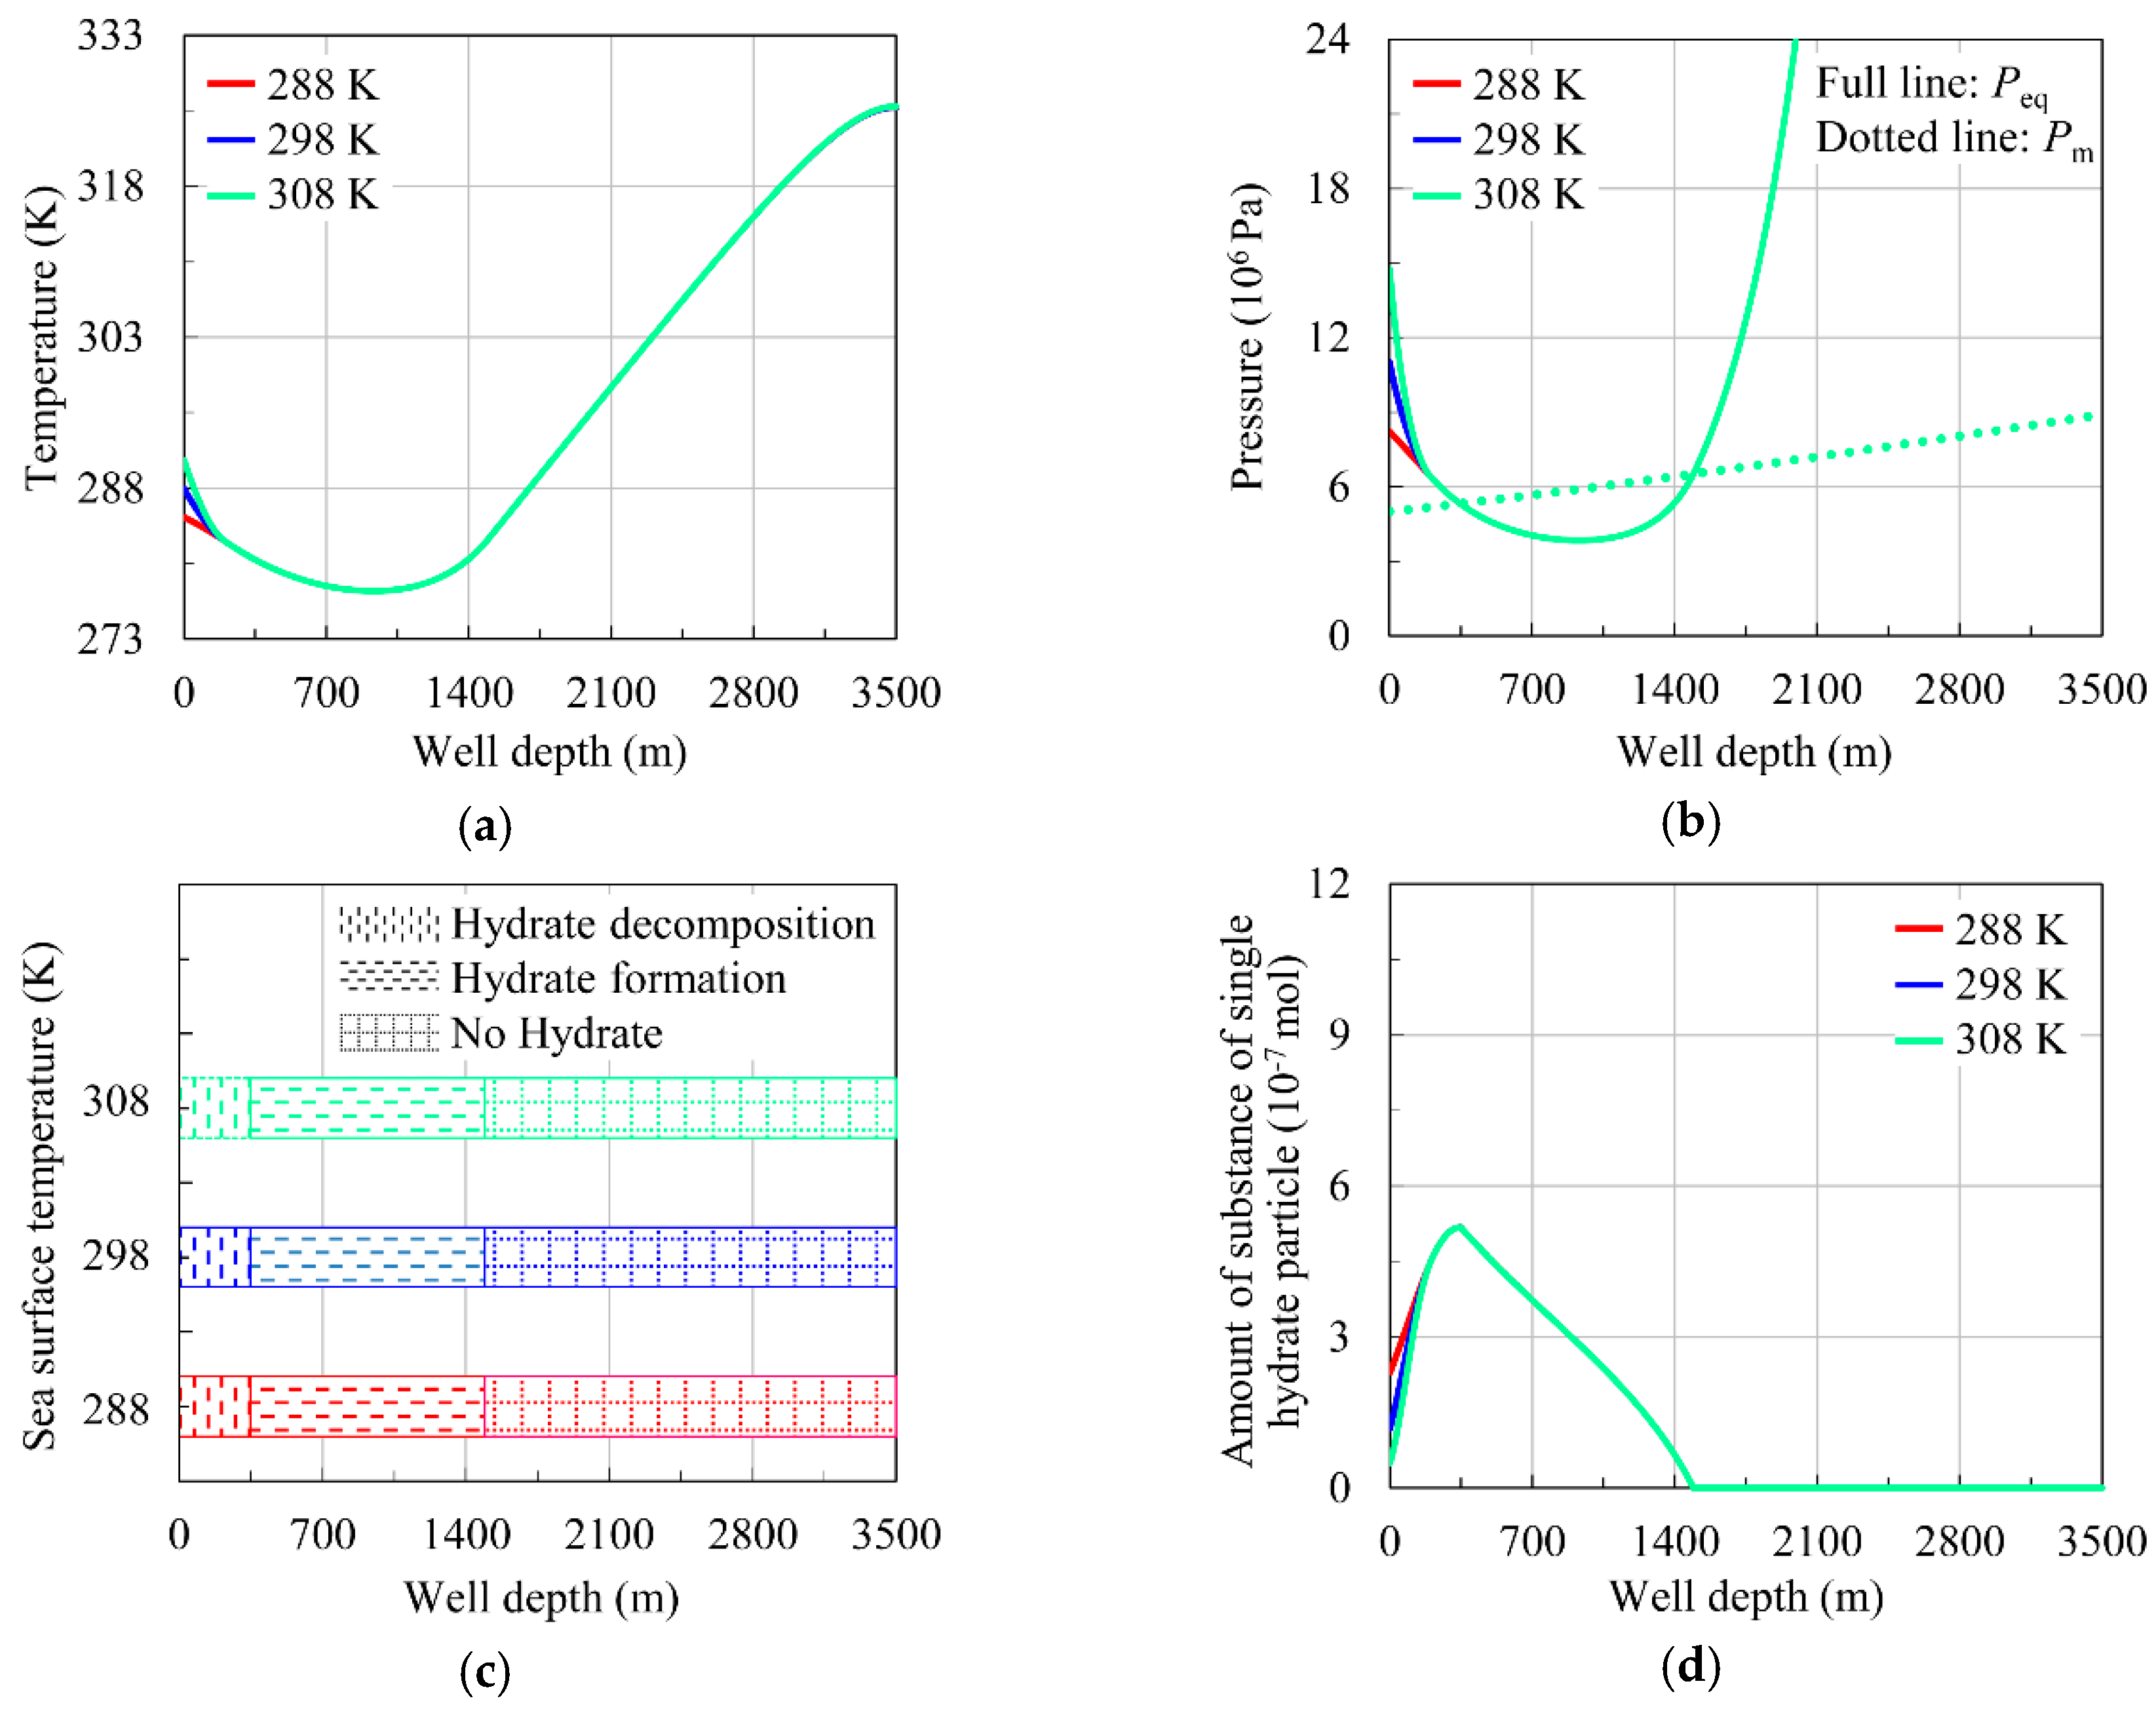
4.2.4. Influence of Sea Surface Temperature
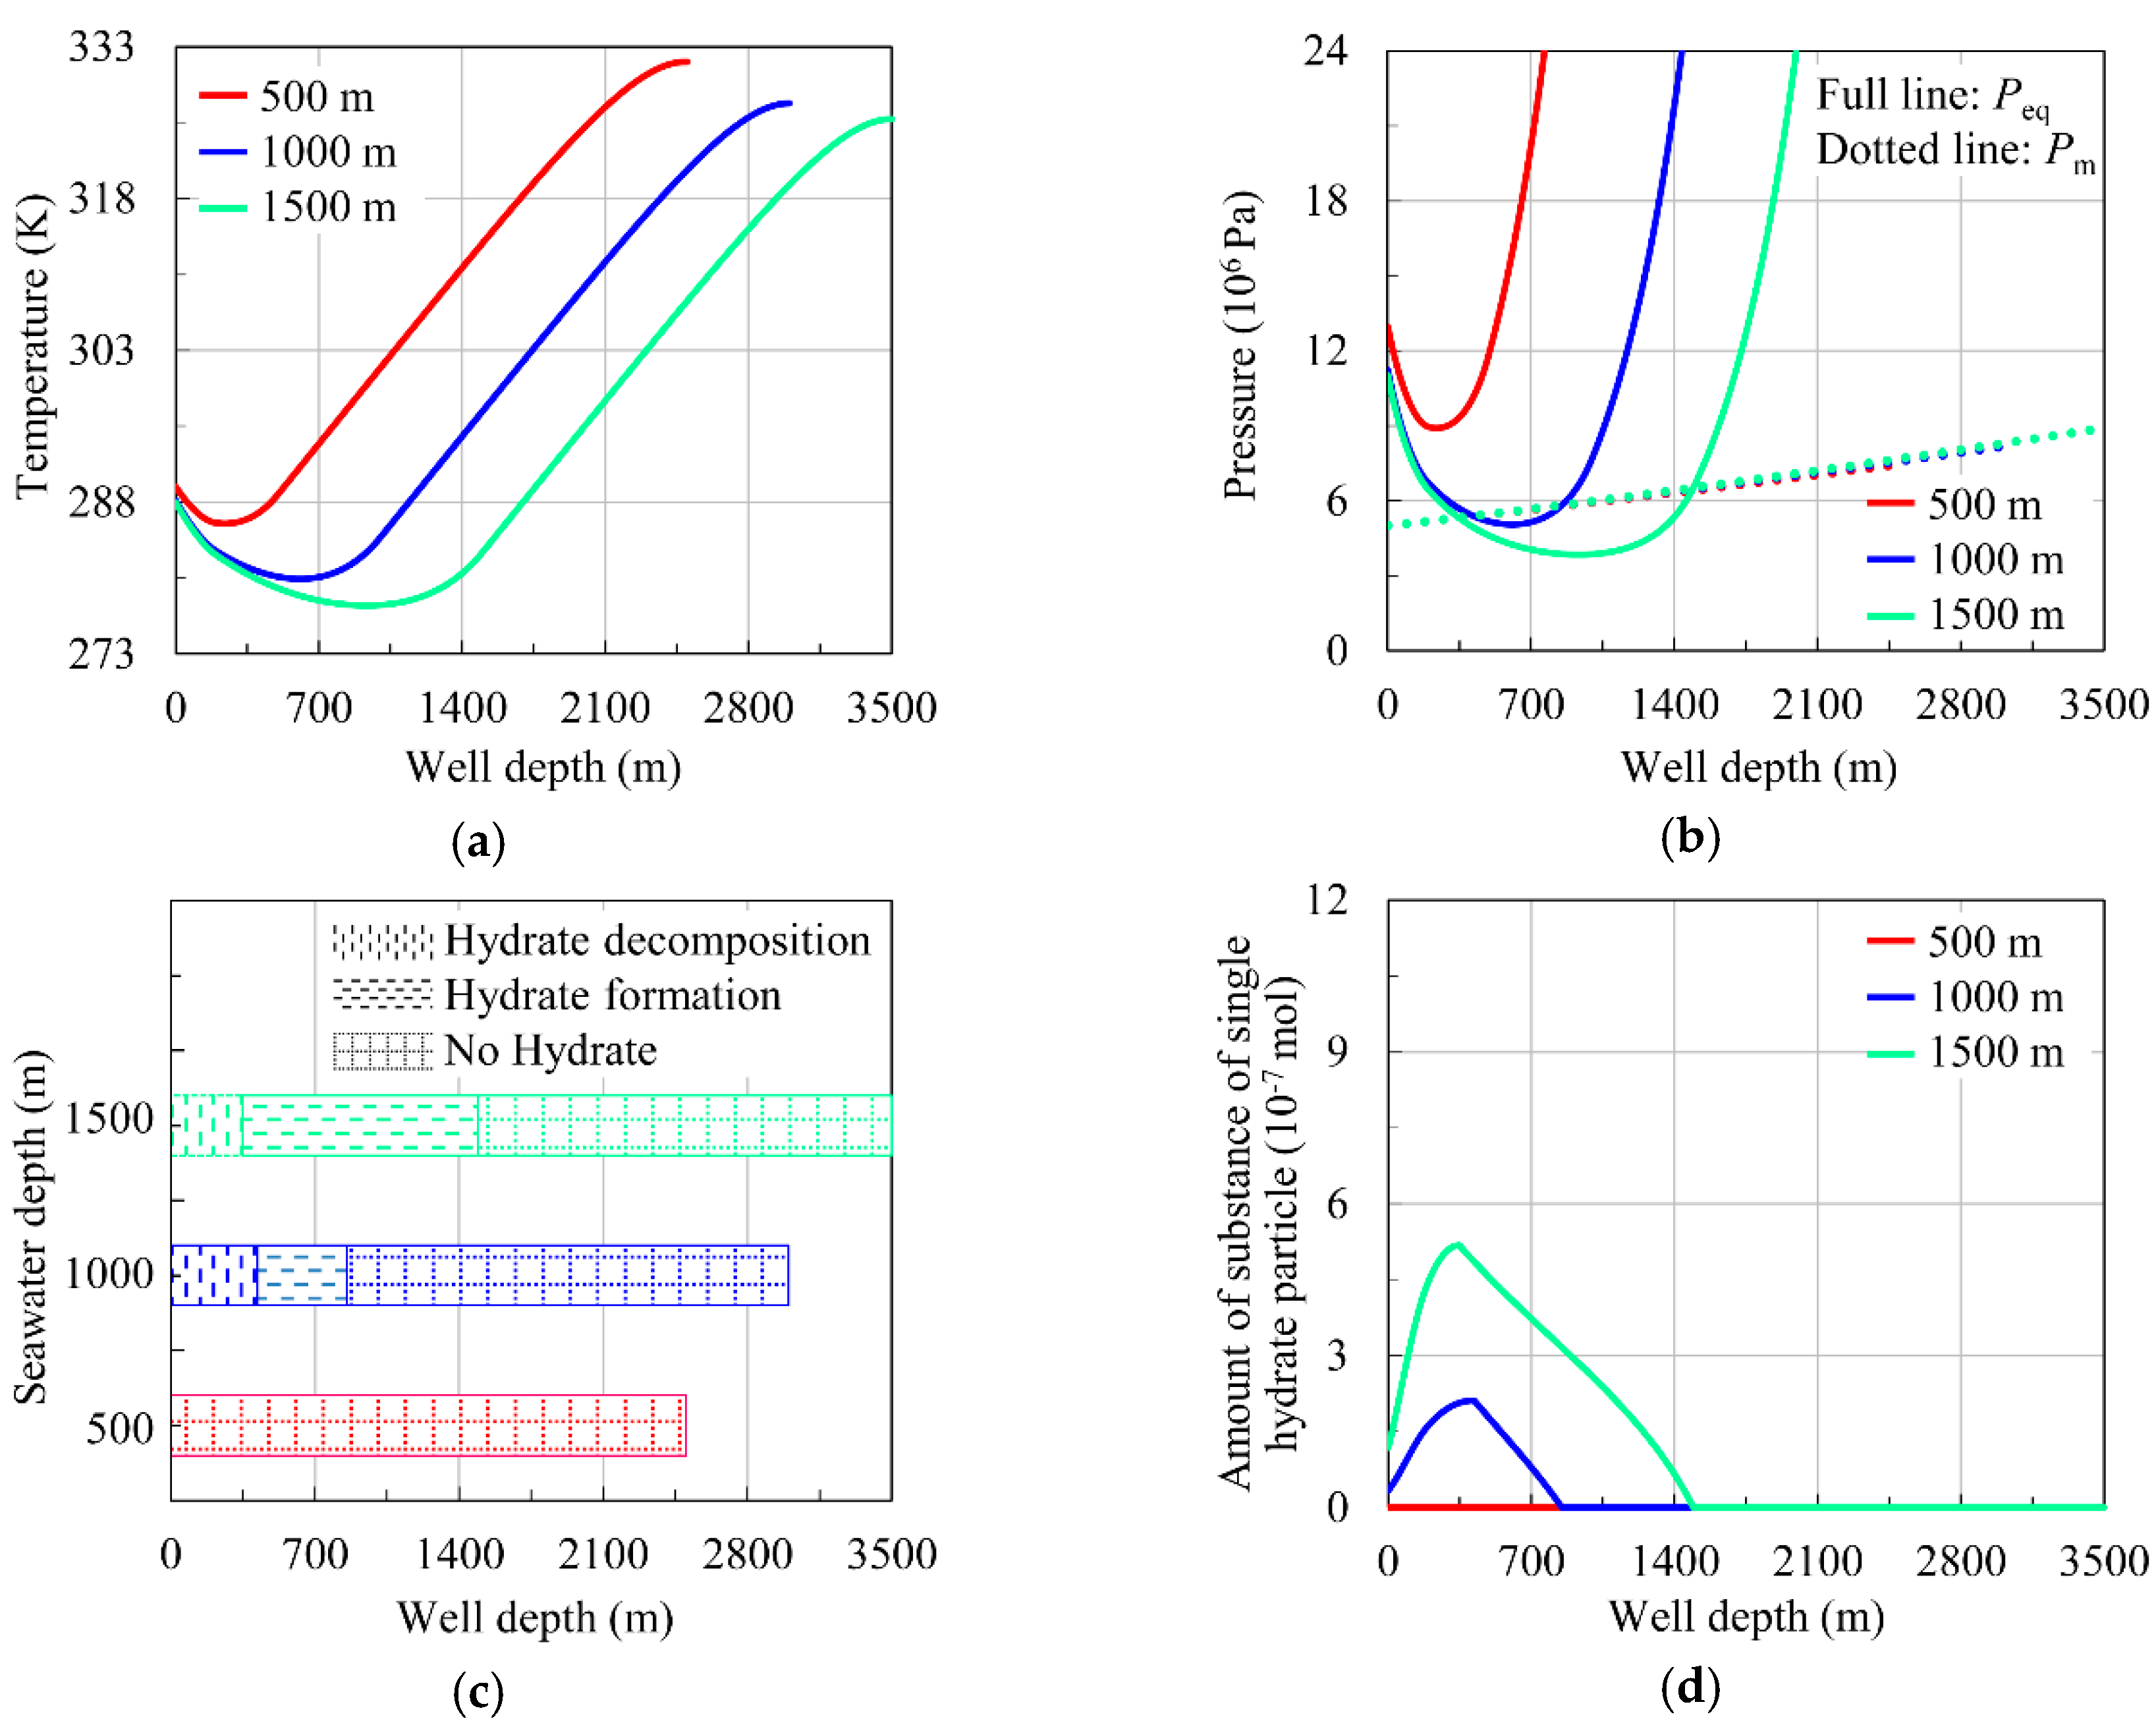
4.2.5. Influence of Seawater Depth
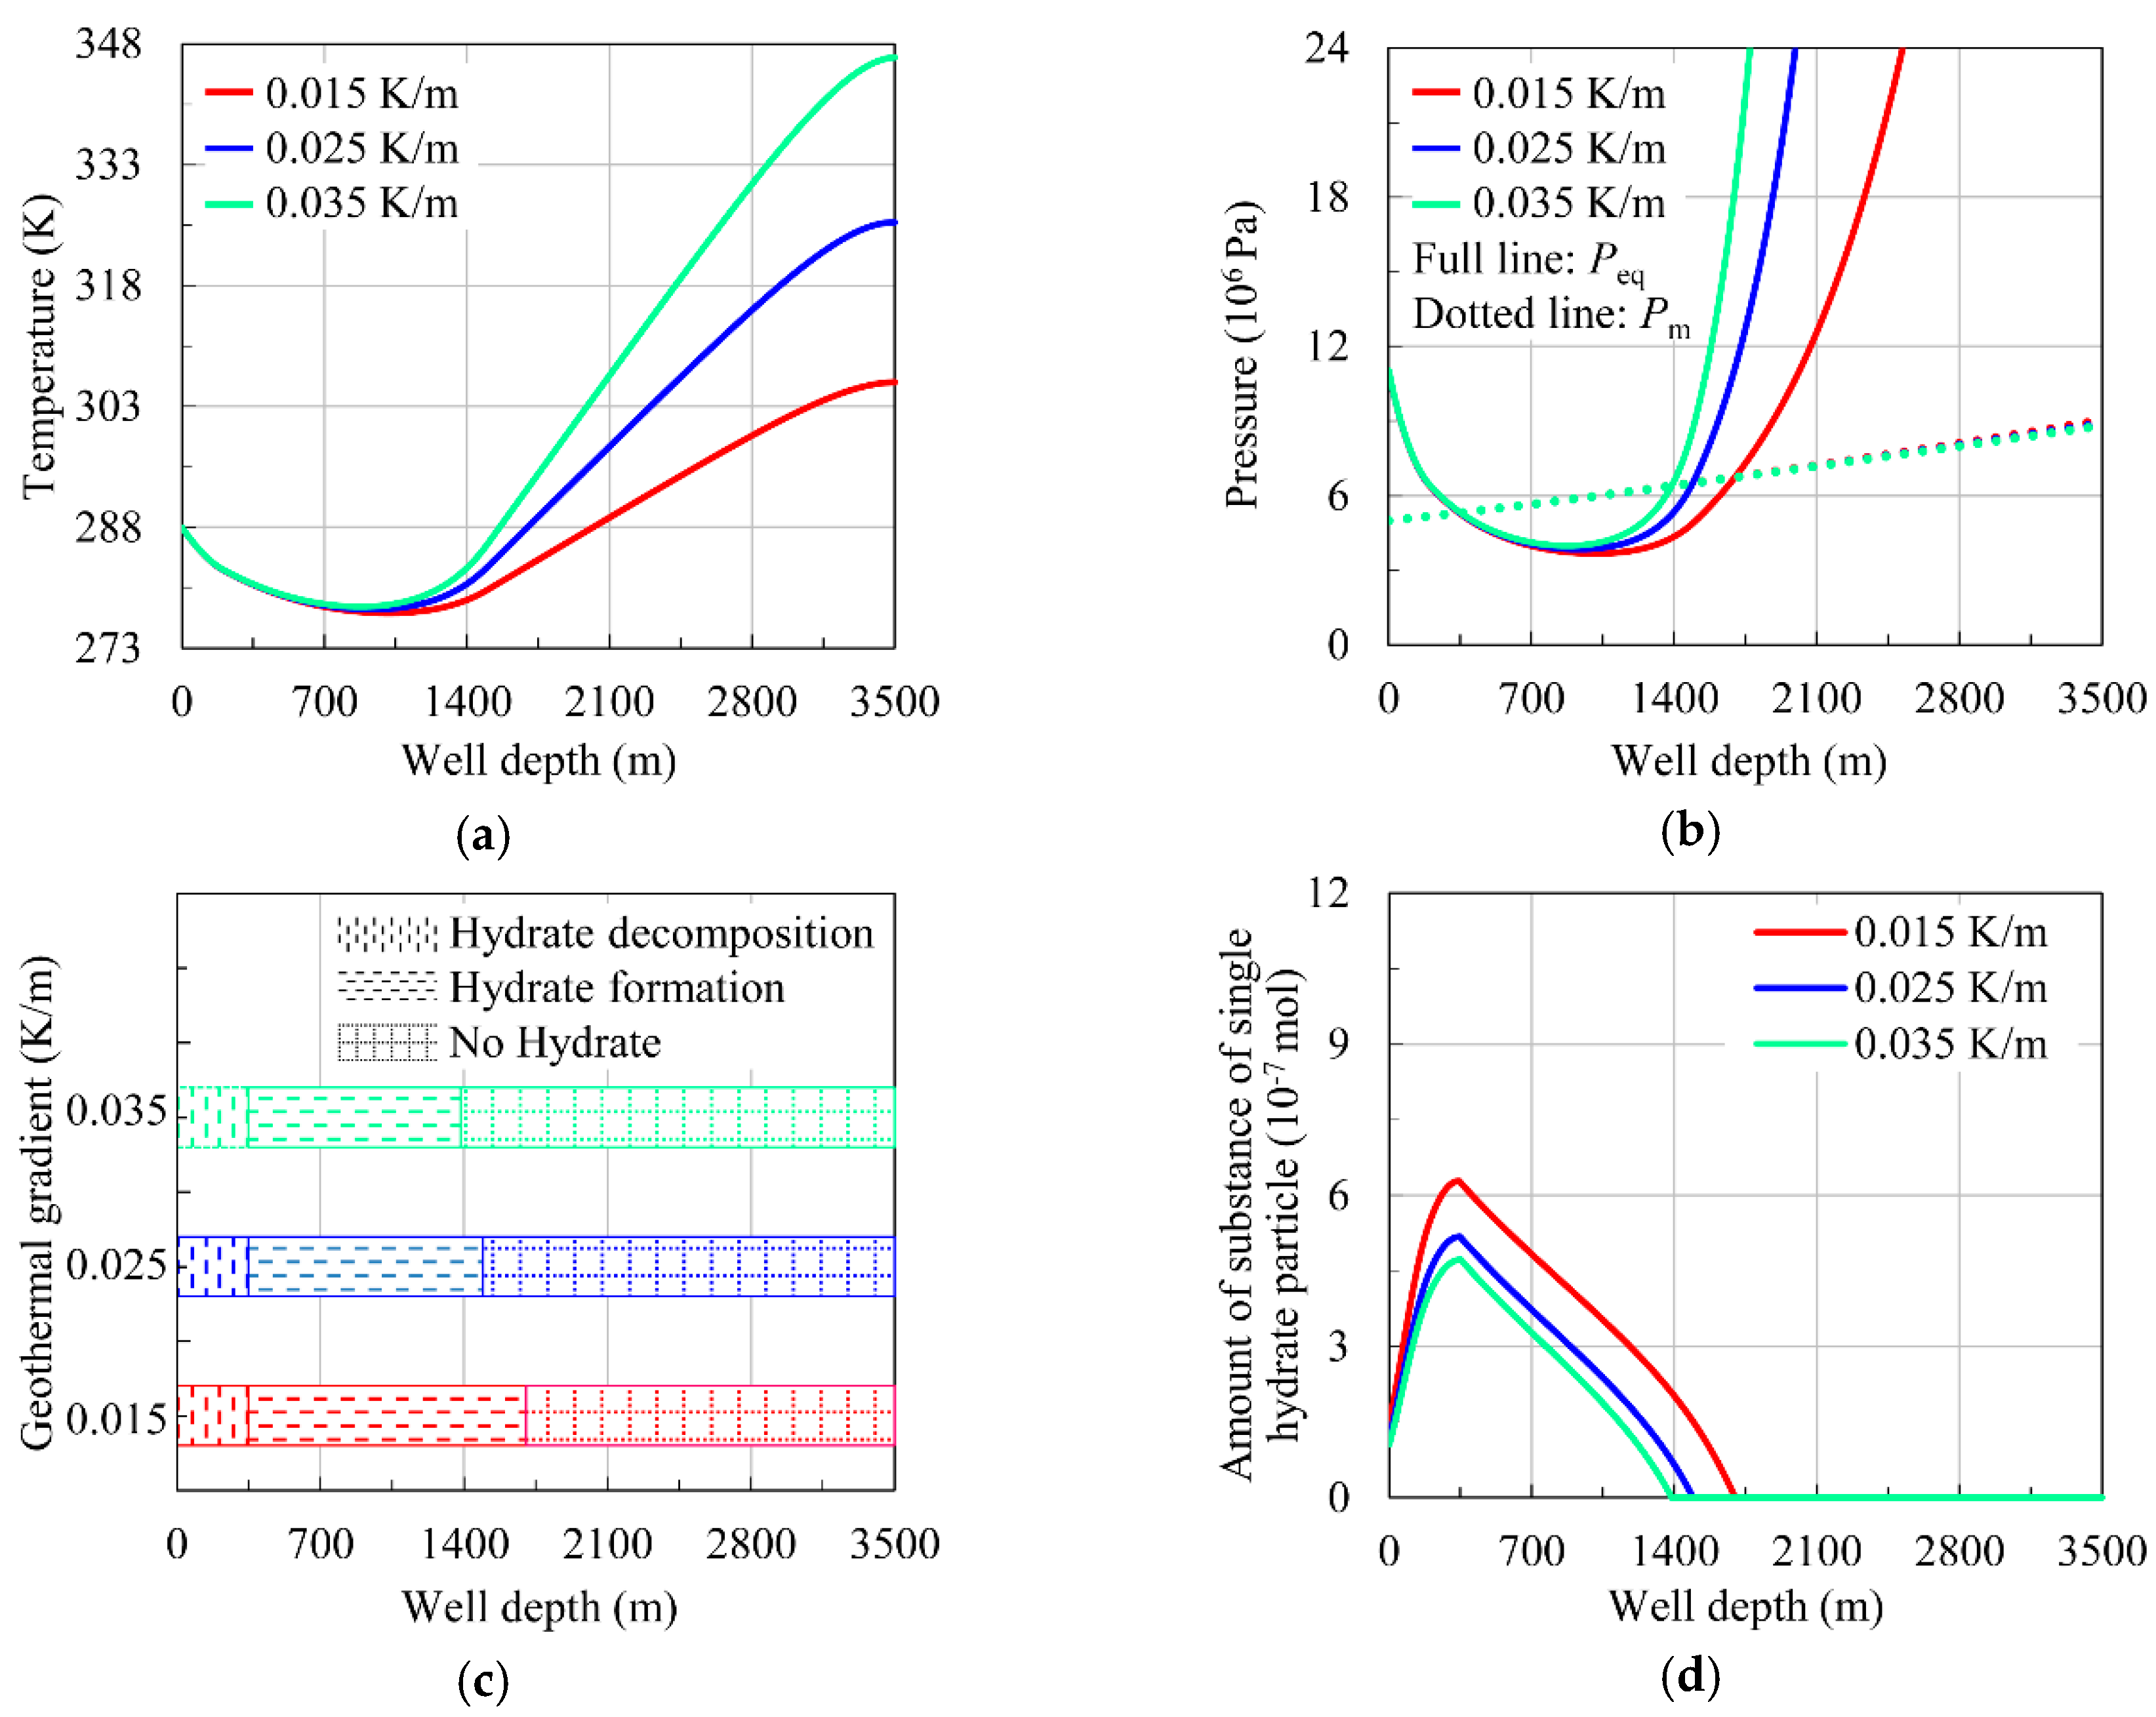
4.2.6. Influence of Geothermal Gradient
5. Conclusions
Author Contributions
Funding
Acknowledgments
Conflicts of Interest
References
- Tan, L.; Zuo, L.H.; Wang, B.B. Methods of decline curve analysis for shale gas reservoirs. Energies 2018, 11, 552. [Google Scholar] [CrossRef]
- Li, X.S.; Xu, C.G.; Zhang, Y.; Ruan, X.K.; Li, G.; Wang, Y. Investigation into gas production from natural gas hydrate: A review. Appl. Energy 2016, 172, 286–322. [Google Scholar] [CrossRef]
- Gao, D.P.; Liu, Y.W.; Wang, D.G.; Han, G.F. Numerical analysis of transient pressure behaviors with shale gas MFHWs interference. Energies 2019, 12, 262. [Google Scholar] [CrossRef]
- Liu, B.; Yuan, Q.; Su, K.H.; Yang, X.; Wu, B.C.; Sun, C.Y.; Chen, G.J. Experimental simulation of the exploitation of natural gas hydrate. Energies 2012, 5, 466–493. [Google Scholar] [CrossRef]
- Thomson, H.; Corbett, J.J.; Winebrake, J.J. Natural gas as a marine fuel. Energy Policy 2015, 87, 153–167. [Google Scholar] [CrossRef]
- Zhang, J.M.; Li, X.S.; Chen, Z.Y.; Zhang, Y.; Li, G.; Yan, K.F.; Lv, T. Gas-lifting characteristics of methane-water mixture and its potential application for self-eruption production of marine natural gas hydrates. Energies 2018, 11, 240. [Google Scholar] [CrossRef]
- Van der Waals, J.H.; Plateeuw, J.C. Clathrate Solutions. In Advances in Chemical Physics, 1st ed.; Prigogine, I., Ed.; John Wiley & Sons, Inc.: Hoboken, NJ, USA, 1958; Volume 2, pp. 1–57. [Google Scholar]
- Kvamme, B.; Tanaka, H. Thermodynamic stability of hydrates for ethane, ethylene, and carbon dioxide. J. Phys. Chem. 1995, 99, 7114–7119. [Google Scholar] [CrossRef]
- Clarke, M.A.; Poolladi, D.M.; Bishnoi, P.R. A method to predict equilibrium conditions of gas hydrate formation in porous media. Ind. Eng. Chem. Res. 1999, 38, 2485–2490. [Google Scholar] [CrossRef]
- Clennell, M.B.; Hovland, M.; Booth, J.S.; Henry, P.; Winters, W.J. Formation of natural gas hydrates in marine sediments: 1. Conceptual model of gas hydrate growth conditioned by host sediment properties. J. Geophys. Res. 1999, 104, 22985–23003. [Google Scholar] [CrossRef]
- Henry, P.; Thomas, M.; Clennell, M.B. Formation of natural gas hydrates in marine sediments: 2. Thermodynamic calculations of stability conditions in porous sediments. J. Geophys. Res. 1999, 104, 23005–23022. [Google Scholar] [CrossRef]
- Wilder, J.W.; Seshadri, K.; Smith, D.H. Modeling hydrate formation in media with broad pore size distributions. Langmuir 2001, 17, 6729–6735. [Google Scholar] [CrossRef]
- Kvamme, B.; Kuznetsova, T.; Kivelæ, P.-H. Adsorption of water and carbon dioxide on hematite and consequences for possible hydrate formation. Phys. Chem. Chem. Phys. 2012, 14, 4410–4424. [Google Scholar] [CrossRef] [PubMed]
- Van Cuong, P. Transport and Adsorption of CO2 and H2O on Calcite and Clathrate Hydrate. Ph.D. Thesis, University of Bergen, Bergen, Norway, 2012. [Google Scholar]
- Mohammad, N. Heterogeneous Hydrate Nucleation on Calcite {1014} and Kaolinite {001} Surfaces: A Molecular Dynamics Simulation Study. Master’s Thesis, University of Bergen, Bergen, Norway, 2016. [Google Scholar]
- Østergaard, K.; Anderson, R.; Llamedo, M.; Tohidi, B. Hydrate phase equilibria in porous media: Effect of pore size and salinity. Terra Nova 2002, 14, 307–312. [Google Scholar] [CrossRef]
- Kvamme, B. Environmentally friendly production of methane from natural gas hydrate using carbon dioxide. Sustainability 2019, 11, 1964. [Google Scholar] [CrossRef]
- Kvamme, B. Enthalpies of hydrate formation from hydrate formers dissolved in water. Energies 2019, 12, 1039. [Google Scholar] [CrossRef]
- Kvamme, B.; Coffin, R.B.; Zhao, J.Z.; Wei, N.; Zhou, S.W.; Li, Q.P.; Saeidi, N.; Chien, Y.-C.; Dunn-Rankin, D.; Sun, W.T.; et al. Stages in dynamics of hydrate formation and consequences for design of experiments for hydrate formation in sediments. Energies 2019, 12, 3399. [Google Scholar] [CrossRef]
- Kvamme, B.; Førrisdahl, O.K. Polar guest—Molecules in natural gas hydrates. Fluid Phase Equilibria 1993, 83, 427–435. [Google Scholar] [CrossRef]
- Kvamme, B.; Iden, E.; Tveit, J.; Veland, V.; Zarifi, M.; Qorbani, K. Effect of H2S content on thermodynamic stability of hydrate formed from CO2/N2 mixtures. J. Chem. Eng. Data 2017, 62, 1645–1658. [Google Scholar] [CrossRef]
- Kvamme, B.; Selvåg, J.; Saeidi, N.; Kuznetsova, T. Methanol as a hydrate inhibitor and hydrate activator. Phys. Chem. Chem. Phys. 2018, 20, 21968–21987. [Google Scholar] [CrossRef]
- Vysniauskas, A.; Bishnoi, P.R. A kinetic study of methane hydrate formation. Chem. Eng. Sci. 1983, 38, 1061–1072. [Google Scholar] [CrossRef]
- Englezos, P.; Kalogerakis, N.; Dholabhai, P.D.; Bishnoi, P.R. Kinetics of formation of methane and ethane gas hydrates. Chem. Eng. Sci. 1987, 42, 2647–2658. [Google Scholar] [CrossRef]
- Sloan, E.D.; Fleyfel, F. A molecular mechanism for gas hydrate nucleation from ice. AIChE J. 1991, 37, 1281–1292. [Google Scholar] [CrossRef]
- Lekvam, K.; Ruoff, P. A reaction kinetic mechanism for methane hydrate formation in liquid water. J. Am. Chem. Soc. 1993, 115, 8565–8569. [Google Scholar] [CrossRef]
- Kashchiev, D.; Firoozabadi, A. Nucleation of gas hydrates. J. Cryst. Growth. 2002, 243, 476–489. [Google Scholar] [CrossRef]
- Kashchiev, D.; Firoozabadi, A. Induction time in crystalliz-ation of gas hydrates. J. Cryst. Growth 2003, 250, 499–515. [Google Scholar] [CrossRef]
- Kvamme, B.; Graue, A.; Aspenes, E.; Kuznetsova, T.; Gránásy, L. Kinetics of solid hydrate formation by carbon dioxide: Phase field theory of hydrate nucleation and magnetic resonance imaging. Phys. Chem. Chem. Phys. 2004, 6, 2327–2334. [Google Scholar] [CrossRef]
- Talaghat, M.R.; Esmaeilzadeh, F.; Fathikaljahi, J. Experimental and theoretical investigation of simple gas hydrate formation with or without presence of kinetic inhibitors in a flow mini-loop apparatus. Fluid Phase Equilibria 2009, 279, 28–40. [Google Scholar] [CrossRef]
- ZareNezhad, B.; Varaminian, F. A generalized macroscopic kinetic model for description of gas hydrate formation processes in isothermal—Isochoric systems. Energ. Convers. Manag. 2012, 57, 125–130. [Google Scholar] [CrossRef]
- Kvamme, B.; Kuznetsova, T.; Bauman, J.M.; Sjöblom, S.; Kulkarni, A.A. Hydrate Formation during transport of natural gas containing water and impurities. J. Chem. Eng. Data 2016, 61, 936–949. [Google Scholar] [CrossRef]
- Kim, H.C.; Bishnoi, P.R.; Heidemann, R.A.; Rizvi, S.S.H. Kinetics of methane hydrate decomposition. Chem. Eng. Sci. 1987, 42, 1645–1653. [Google Scholar] [CrossRef]
- Kamath, V.A.; Holder, G.D. Dissociation heat transfer characteristics of methane hydrates. AIChE J. 1987, 33, 347–350. [Google Scholar] [CrossRef]
- Clarke, M.A.; Bishnoi, P.R. Determination of the intrinsic rate of ethane gas hydrate decomposition. Chem. Eng. Sci. 2000, 55, 4869–4883. [Google Scholar] [CrossRef]
- Clarke, M.A.; Bishnoi, P.R. Measuring and modeling the rate of decomposition of gas hydrates formed from mixtures of methane and ethane. Chem. Eng. Sci. 2001, 56, 4715–4724. [Google Scholar] [CrossRef]
- Goel, N.; Wiggins, M.; Shah, S. Analytical modeling of gas recovery from in situ hydrates dissociation. J. Petrol. Sci. Eng. 2001, 29, 115–127. [Google Scholar] [CrossRef]
- Wei, N.; Sun, W.T.; Meng, Y.F.; Zhou, S.W.; Li, G.; Guo, P.; Dong, K.; Li, Q.P. Sensitivity analysis of multiphase flow in annulus during drilling of marine natural gas hydrate reservoirs. J. Nat. Gas Sci. Eng. 2016, 36, 692–707. [Google Scholar] [CrossRef]
- Wei, N.; Sun, W.T.; Meng, Y.F.; Liu, A.Q.; Zhou, S.W.; Guo, P.; Fu, Q.; Lv, X. Analysis of decomposition for structure I methane hydrate by molecular dynamic simulation. Russ. J. Phys. Chem. 2018, 92, 840–846. [Google Scholar] [CrossRef]
- Wei, N.; Sun, W.T.; Meng, Y.F.; Liu, A.Q.; Zhao, J.Z.; Zhou, S.W.; Zhang, L.H.; Li, Q.P. Multiphase nonequilibrium pipe flow behaviors in the solid fluidization exploitation of marine natural gas hydrate reservoir. Energy Sci. Eng. 2018, 6, 760–782. [Google Scholar] [CrossRef]
- Dzyuba, A.V.; Zektser, I.S. Variations in submarine groundwater runoff as a possible cause of decomposition of marine methane–hydrates in the artcic. Water Resour. 2013, 40, 74–83. [Google Scholar] [CrossRef]
- Wang, Z.M.; Hao, X.N.; Wang, X.Q.; Xue, L.; Guo, X.L. Numerical simulation on deepwater drilling wellbore temperature and pressure distribution. Petrol. Sci. Technol. 2010, 28, 911–919. [Google Scholar] [CrossRef]
- Wei, N.; Sun, W.T.; Meng, Y.F.; Zhou, S.W.; Fu, Q.; Guo, P.; Li, Q.P. Annular phase behavior analysis during marine natural gas hydrate reservoir drilling. Acta Pet. Sin. 2017, 38, 710–720. (In Chinese) [Google Scholar]
- Wei, N.; Sun, W.T.; Meng, Y.F.; Liu, A.Q.; Zhao, J.Z.; Xu, C.Y.; Li, H.T.; Jiang, L.; Xu, H.M. Change mechanism of transient gas-liquid two-phase flow in wellbore during marine natural gas hydrate reservoir drilling. Therm. Sci. 2019, 23, 2179–2187. [Google Scholar] [CrossRef]
- Deangeli, C.; Omwanghe, O.O. Prediction of mud pressures for the stability of wellbores drilled in transversely isotropic rocks. Energies 2018, 11, 1944. [Google Scholar] [CrossRef]
- Franses, E.I. Thermodynamics with Chemical Engineering Applications, 1st ed.; Cambridge University Press: Cambridge, MA, USA, 2014; pp. 86–193. [Google Scholar]
- PTC Mathcad. Available online: https://www.mathcad.com/en (accessed on 1 January 2019).
- Rapp, B.E. Finite Difference Method. In Microfluidics: Modeling, Mechanics and Mathematics, 1st ed.; William Andrew: Norwich, CT, USA, 2017; pp. 623–631. [Google Scholar]
- Wang, Z.Y.; Sun, B.J.; Wang, X.R.; Zhang, Z.N. Prediction of natural gas hydrate formation region in wellbore during deepwater gas well testing. J. Hydrodyn. 2014, 26, 568–576. [Google Scholar] [CrossRef]
- Liu, M.S. The Study of Natural Gas Hydrate Formation in Deepwater Well Drilling. Ph.D. Thesis, Southwest Petroleum University, Chengdu, China, 2017. (In Chinese). [Google Scholar]


| Daily Gas Production (105 m3/d) | Wellhead Temperature (K) | Wellhead Pressure (106 Pa) | ||||||
|---|---|---|---|---|---|---|---|---|
| Measured Data | Calculated Data | Relative Error | Average Error | Measured Data | Calculated Data | Relative Error | Average Error | |
| 4.4457 | 305.93 | 306.57 | 0.21% | 0.17% | 25.11 | 24.352 | 3.02% | 3.27% |
| 7 | 315.93 | 316.1 | 0.05% | 24.64 | 23.882 | 3.08% | ||
| 14.866 | 328.15 | 328.92 | 0.23% | 20.64 | 19.873 | 3.72% | ||
| Spud-In Number | Well Section (m) | Hole Diameter (m) | Casing Outer Diameter (m) | Casing Wall Thickness (m) |
|---|---|---|---|---|
| First section | 0–600 | 0.3112 | 0.2445 | 0.01199 |
| Second section | 600–5000 | 0.2159 | 0.1778 | 0.01036 |
| Third section | 5000–5200 | 0.1524 | – | – |
| Daily Gas Production (104 m3/d) | Hydrate Formation Region (m) | ||
|---|---|---|---|
| Measured Data | Calculated Data | Relative Error | |
| 4 | 0–180 | 0–175 | 2.78% |
© 2020 by the authors. Licensee MDPI, Basel, Switzerland. This article is an open access article distributed under the terms and conditions of the Creative Commons Attribution (CC BY) license (http://creativecommons.org/licenses/by/4.0/).
Share and Cite
Wei, N.; Sun, W.; Meng, Y.; Zhao, J.; Kvamme, B.; Zhou, S.; Zhang, L.; Li, Q.; Zhang, Y.; Jiang, L.; et al. Hydrate Formation and Decomposition Regularities in Offshore Gas Reservoir Production Pipelines. Energies 2020, 13, 248. https://doi.org/10.3390/en13010248
Wei N, Sun W, Meng Y, Zhao J, Kvamme B, Zhou S, Zhang L, Li Q, Zhang Y, Jiang L, et al. Hydrate Formation and Decomposition Regularities in Offshore Gas Reservoir Production Pipelines. Energies. 2020; 13(1):248. https://doi.org/10.3390/en13010248
Chicago/Turabian StyleWei, Na, Wantong Sun, Yingfeng Meng, Jinzhou Zhao, Bjørn Kvamme, Shouwei Zhou, Liehui Zhang, Qingping Li, Yao Zhang, Lin Jiang, and et al. 2020. "Hydrate Formation and Decomposition Regularities in Offshore Gas Reservoir Production Pipelines" Energies 13, no. 1: 248. https://doi.org/10.3390/en13010248
APA StyleWei, N., Sun, W., Meng, Y., Zhao, J., Kvamme, B., Zhou, S., Zhang, L., Li, Q., Zhang, Y., Jiang, L., Li, H., & Pei, J. (2020). Hydrate Formation and Decomposition Regularities in Offshore Gas Reservoir Production Pipelines. Energies, 13(1), 248. https://doi.org/10.3390/en13010248