1. Introduction
Due to a growing concern regarding environmental sustainability [
1], increasing CO
2 emissions and the struggle to meet renewable energy production targets, the need for new, innovative and more efficient ways to harness clean and renewable energy arises. As key contributors to the economy of nations with access to the ocean [
2], seaports are important infrastructures built to provide adequate sheltering conditions for moored ships. Since wave energy represents a large and mainly untapped energy source [
3], with a theoretical resource estimated at circa 2.1 TW [
4], integrating wave energy converters (WECs) into seaports’ breakwaters has gained increasing interest in the field of coastal engineering [
5]. Aside from the inherent possibility of exploring a sustainable and renewable energy source capable of meeting a relevant part of ports’ energy demand, several synergies can be explored, including cost sharing on construction, installation, maintenance and operation during its life-cycle [
5,
6], water desalination projects [
7] and onshore grid connectivity, as well as reducing the volume of water that overtops the breakwater [
8]. This is further justified by mitigating the adverse impact of port activities, namely pollution, which has a very negative social and health impact as well as undesirable environmental consequences [
9,
10,
11].
There are many WEC technologies being developed, but some of them are more suitable for integration into breakwaters, namely the oscillating water column (OWC) and the overtopping device (OWEC) [
12]. A few devices integrated into breakwaters are already at advanced stages of development, at Technology Readiness Level (TRL) 7/8, and being demonstrated at full-scale, such as the Mutriku OWC [
13], in the Port of Mutriku, Spain, the resonant wave energy converter 3 (REWEC3) in the Port of Civitavecchia [
14], Italy, and the overtopping breakwater for energy conversion (OBREC) [
15], in the Port of Naples, Italy. The innovative structures described above and the port activities have the dual-purpose of energy production and harbor sheltering, in order to create suitable conditions for the moored ships. The integration of WEC devices into breakwaters and other coastal structures is an approach that can bring benefits relative to standalone devices [
16] whilst ensuring the main functions of these coastal structures. The most challenging issues in the development of technologies for WEC-breakwater integration are:
The survivability of the devices when subjected to harsh maritime conditions;
Their potential impact on the functional performance of the breakwaters;
The reliability of the system’s components;
The lack of appropriate power take-off (PTO) control strategies able to deal with the well-known variability of wave characteristics in several temporal scales (from wave-to-wave, during one hour, day, month or even inter-annually); and,
Insufficient expertise of full-scale devices over long-term applications.
These issues also have a strong effect on the levelized cost of energy (LCoE), which must be reduced to speed up the time to market of ocean energy technologies and improve their chances of successfully reaching a viable commercial stage. Consequently, the design of these technologies requires large efforts in different research fields, the input from specialized industry being vital to their success.
A promising approach to tackle some of these challenges involves the hybridization between two or more wave harnessing technologies. Research in the field of renewable energy (e.g., wind, solar, hydropower and wave energy) have yielded positive results through the combination of harvesting principles [
17,
18,
19,
20], as it allows for the overall performance of the resulting hybrid technologies to be bolstered beyond that achieved by standalone devices. Looking within the particular case of the wave energy sector itself, however, there are not many studies considering a hybrid approach integrating different WEC technologies, in detriment of developing individual device solutions. Nonetheless, recent analytical studies have explored the possibility of combining an OWC with oscillating floats [
21], or a single rotational float [
22], hinged around it, and the research bore positive results. Some of the advantages of this hybrid WEC (HWEC) compared to the use of isolated devices are: wider bandwidth of frequency response with a higher peak value of the maximum power capture factor; greater efficiency of the OWC for long waves and of the hinged floats for short waves, resulting in a broader spectrum of wave conditions with an associated high energy efficiency; and a positive effect on power absorption from the hydrodynamic interaction between the OWC and the floats for certain wave conditions.
In this context, the SE@PORTS project aimed at assessing existing WECs with an intermediate TRL on their suitability to be integrated into seaports’ sheltering structures, to combine them in novel hybrid technologies and bring them to the next TRL. For that purpose, two innovative HWEC modules, merging two different working principles, were designed to be integrated into a breakwater and then experimentally tested, having as case studies the Nelson Mandela vertical breakwater of the Port of Las Palmas (Spain) and the north rubble-mound breakwater of the Port of Leixões (Portugal). This paper focuses on the solution developed for the Port of Leixões. This disruptive approach aims at harnessing wave energy more efficiently by combining two different, yet complementary, concepts in a single hybrid module.
Previous studies concluded that the best working principles to be merged in a hybrid device and integrated into a seaport breakwater were the OWEC and the OWC [
23], and thus the two WEC technologies considered were the sea-wave slot-cone generator (SSG) [
16,
24,
25] and a shore based OWC [
26,
27]. It has also been established that the integration of the HWEC module into the breakwater does not significantly affect neither its effectiveness nor its stability [
28,
29]. Furthermore, the overtopping flow over the structure was considerably reduced by the integration of the HWEC module [
8].
The scope of this paper is to present the physical model study of the proposed HWEC module, at a 1:50 geometrical scale, to analyze the performance of the wave harnessing technologies and to discuss the differences and potential advantages of this hybrid device over its individual components. To that end,
Section 2 will start by describing the principal methods and materials used during the experimental stage, namely the wave basin, the equipment, the characteristics of the physical model and the tested wave conditions.
Section 3 presents and discusses the most relevant results, compares the different geometries proposed for the HWEC in terms of overall efficiency and analyzes in detail the performance of the individual WEC technologies. Lastly, in
Section 4 conclusions are drawn from the study and recommendations are made for future studies.
2. Characterization of the Case Study and Experimental Setup
2.1. Case Study and Technology Description
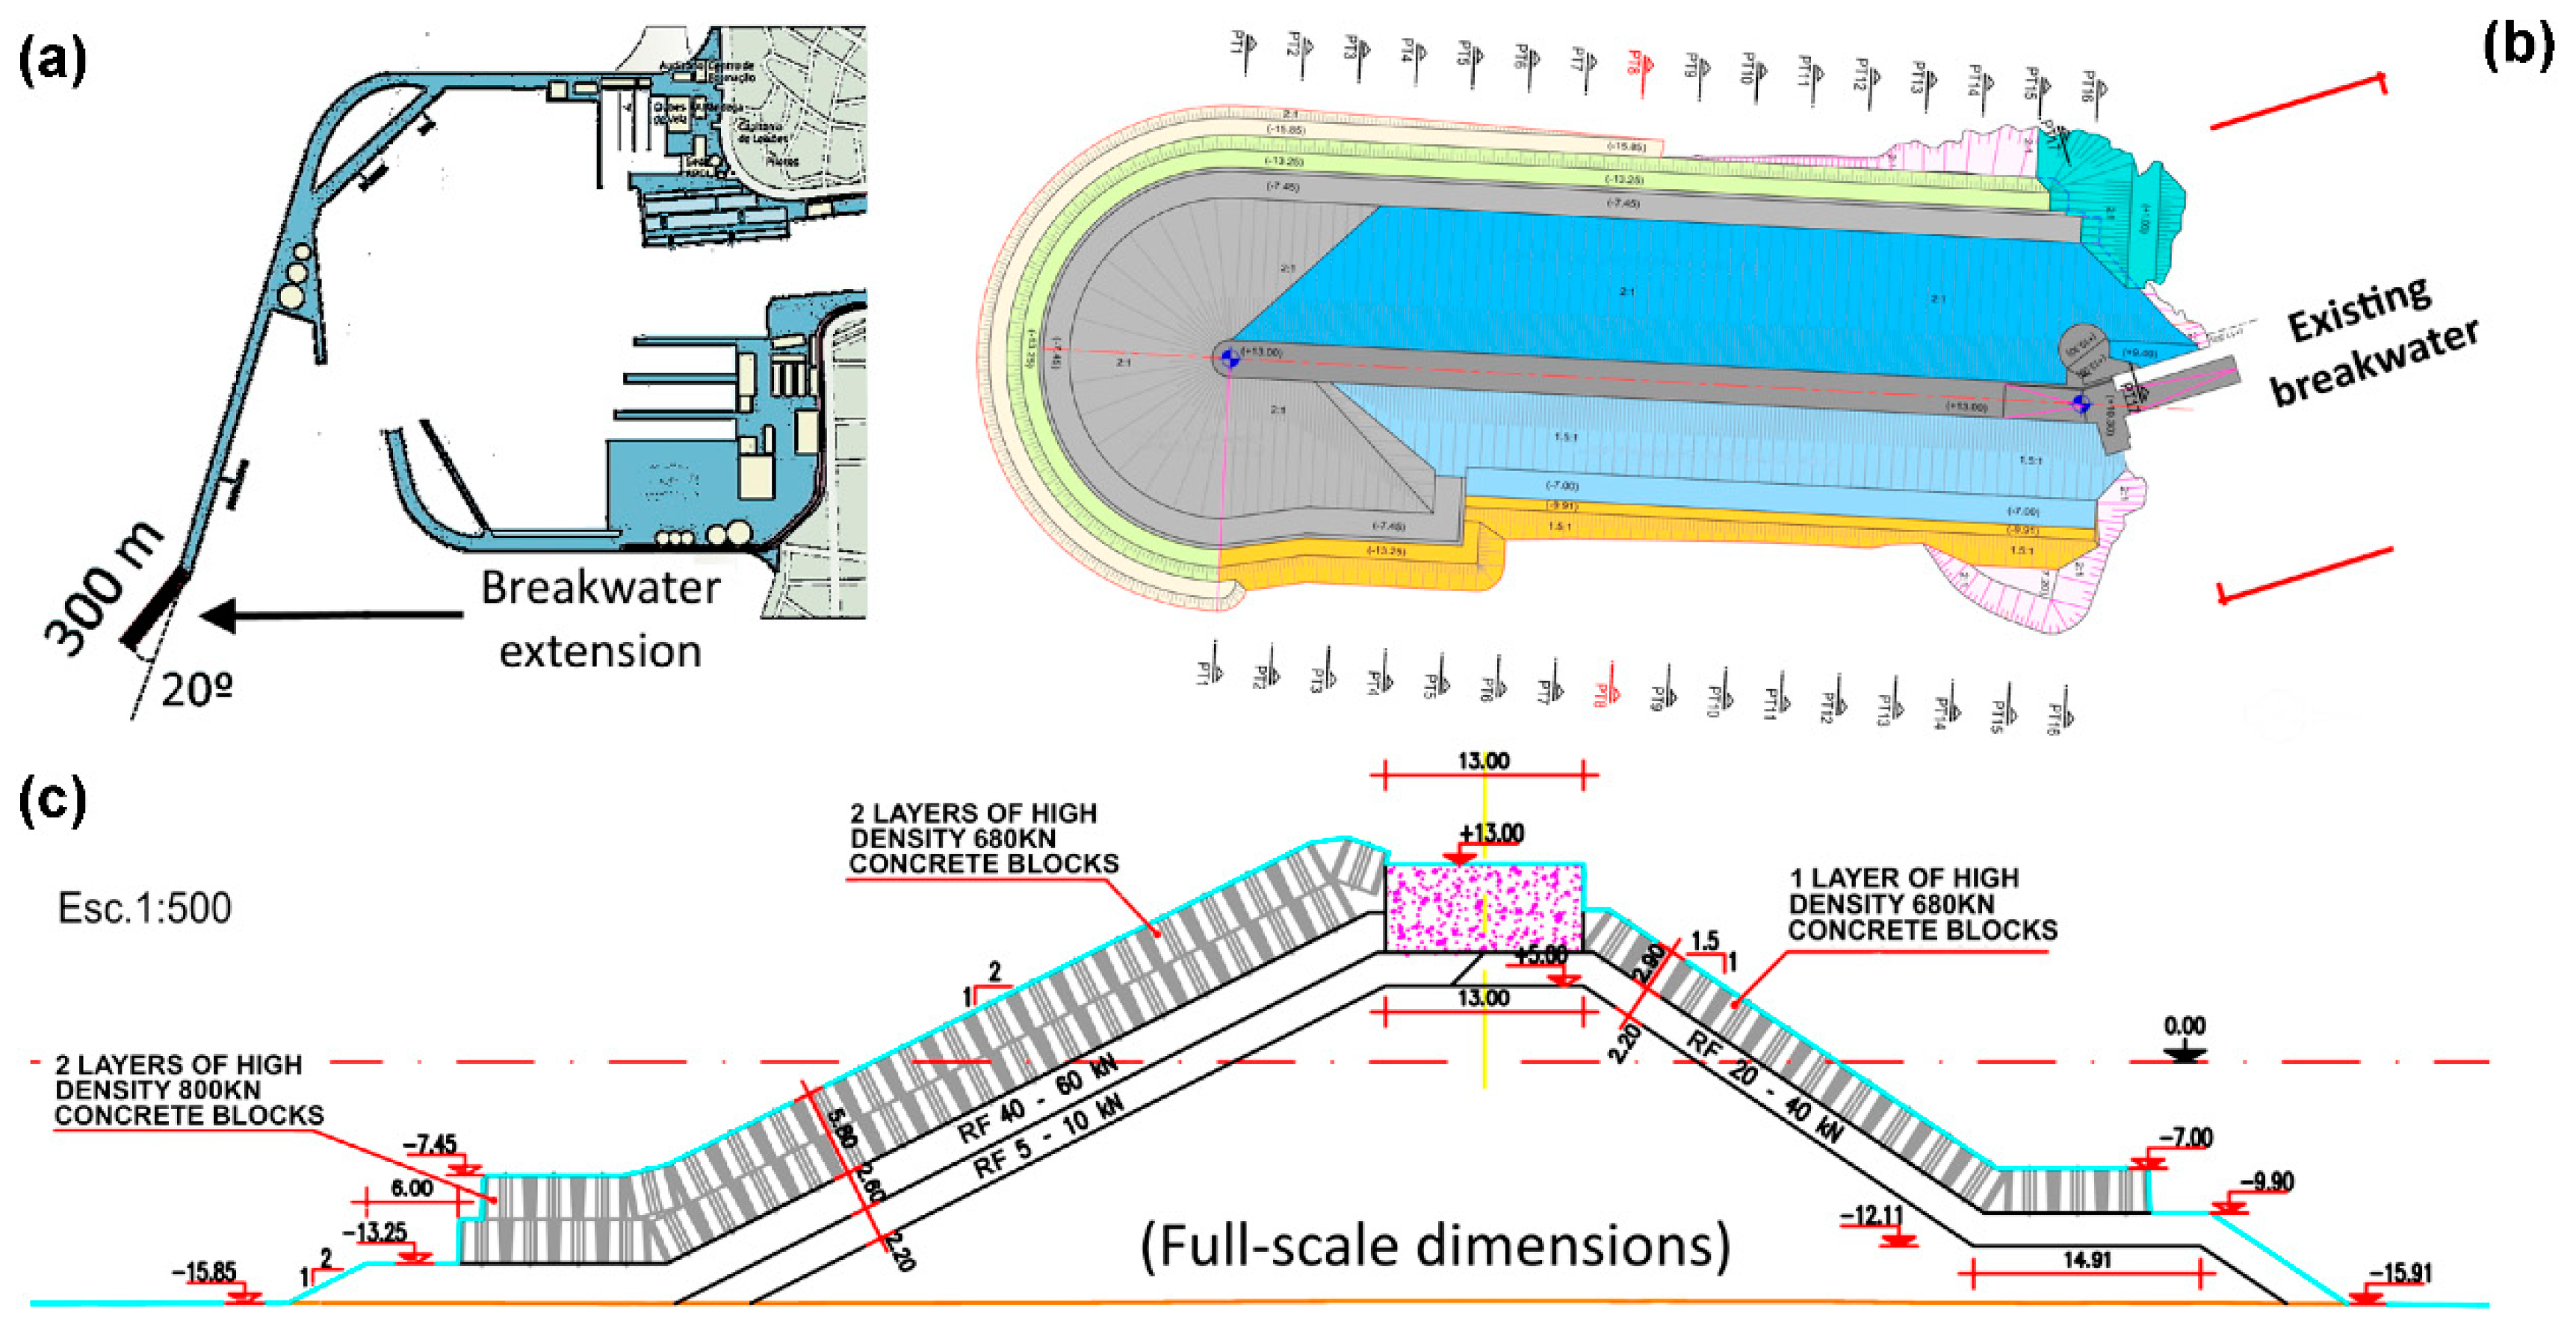
Recently, the Port Authority of Douro, Leixões and Viana do Castelo (APDL) deemed necessary to increase the North breakwater’s length by 300 m [
30] in order to be able to receive larger container ships (
Figure 1). The cross-section of the structure proposed for the extension consisted of a tout-venant core, two rubble mound internal layers and an armor layer with two rows of Antifer blocks on the seaward side. The inland side was made of one rubble mound internal layer and one row of Antifer blocks. The crest level of the breakwater is equal to 14.75 m (C.D.).
The Port of Leixões’ energy consumption has increased by 14.8% from 2014 to 2016, and the port is expected to improve and enlarge its facilities in the near future [
26]. Consequently, the development of sustainable solutions for meeting the increasing energy demand in the port is desired. The extension of Leixões North breakwater is a key component of the port’s development plan, and constitutes an opportunity for the integration of a WEC in the structure, as the installation cost should be lower and the adaption of the breakwater’s design simpler if the integration is considered upon the design phase. For that reason, the SE@PORTS project studied the integration of a HWEC into this harbor structure, namely by assessing its power output for several wave conditions and HWEC configurations, as well as by studying the impact of the HWEC on the structure’s stability and functionality.
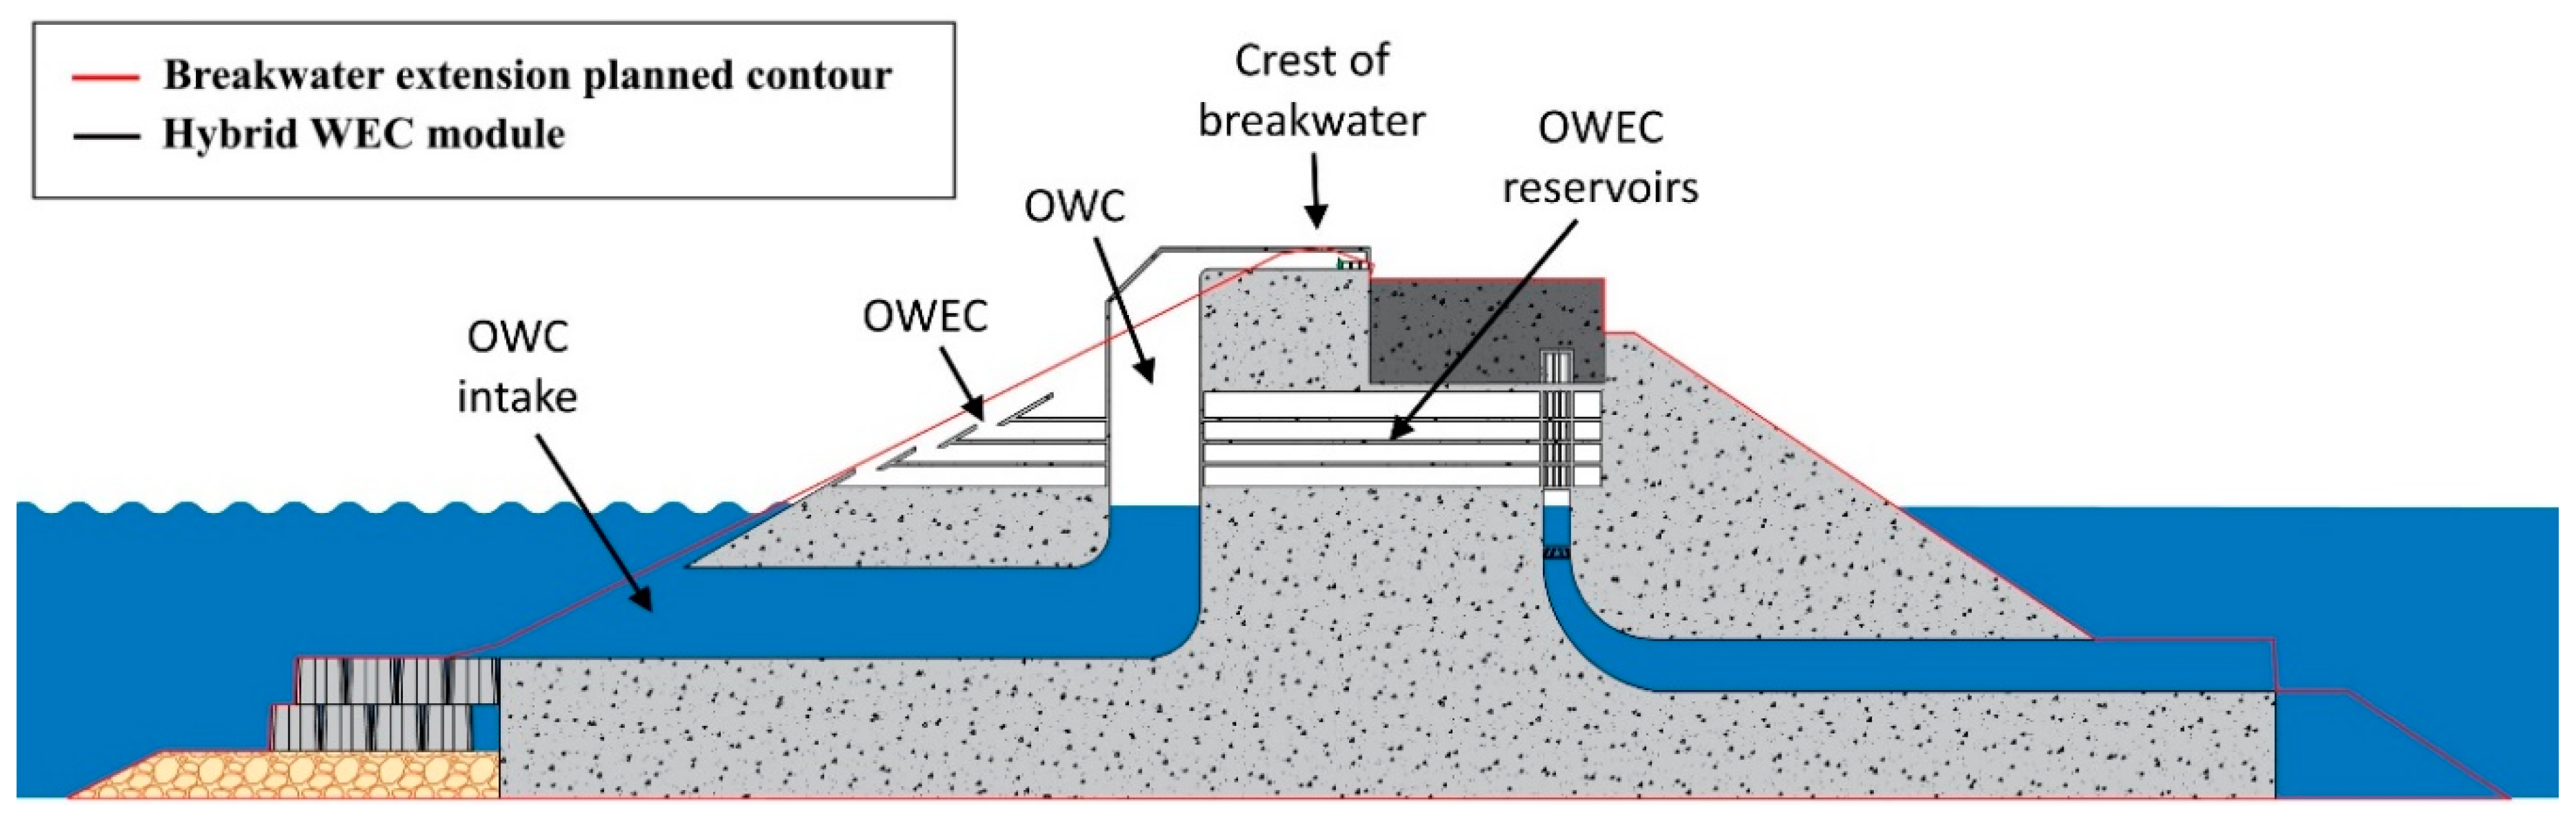
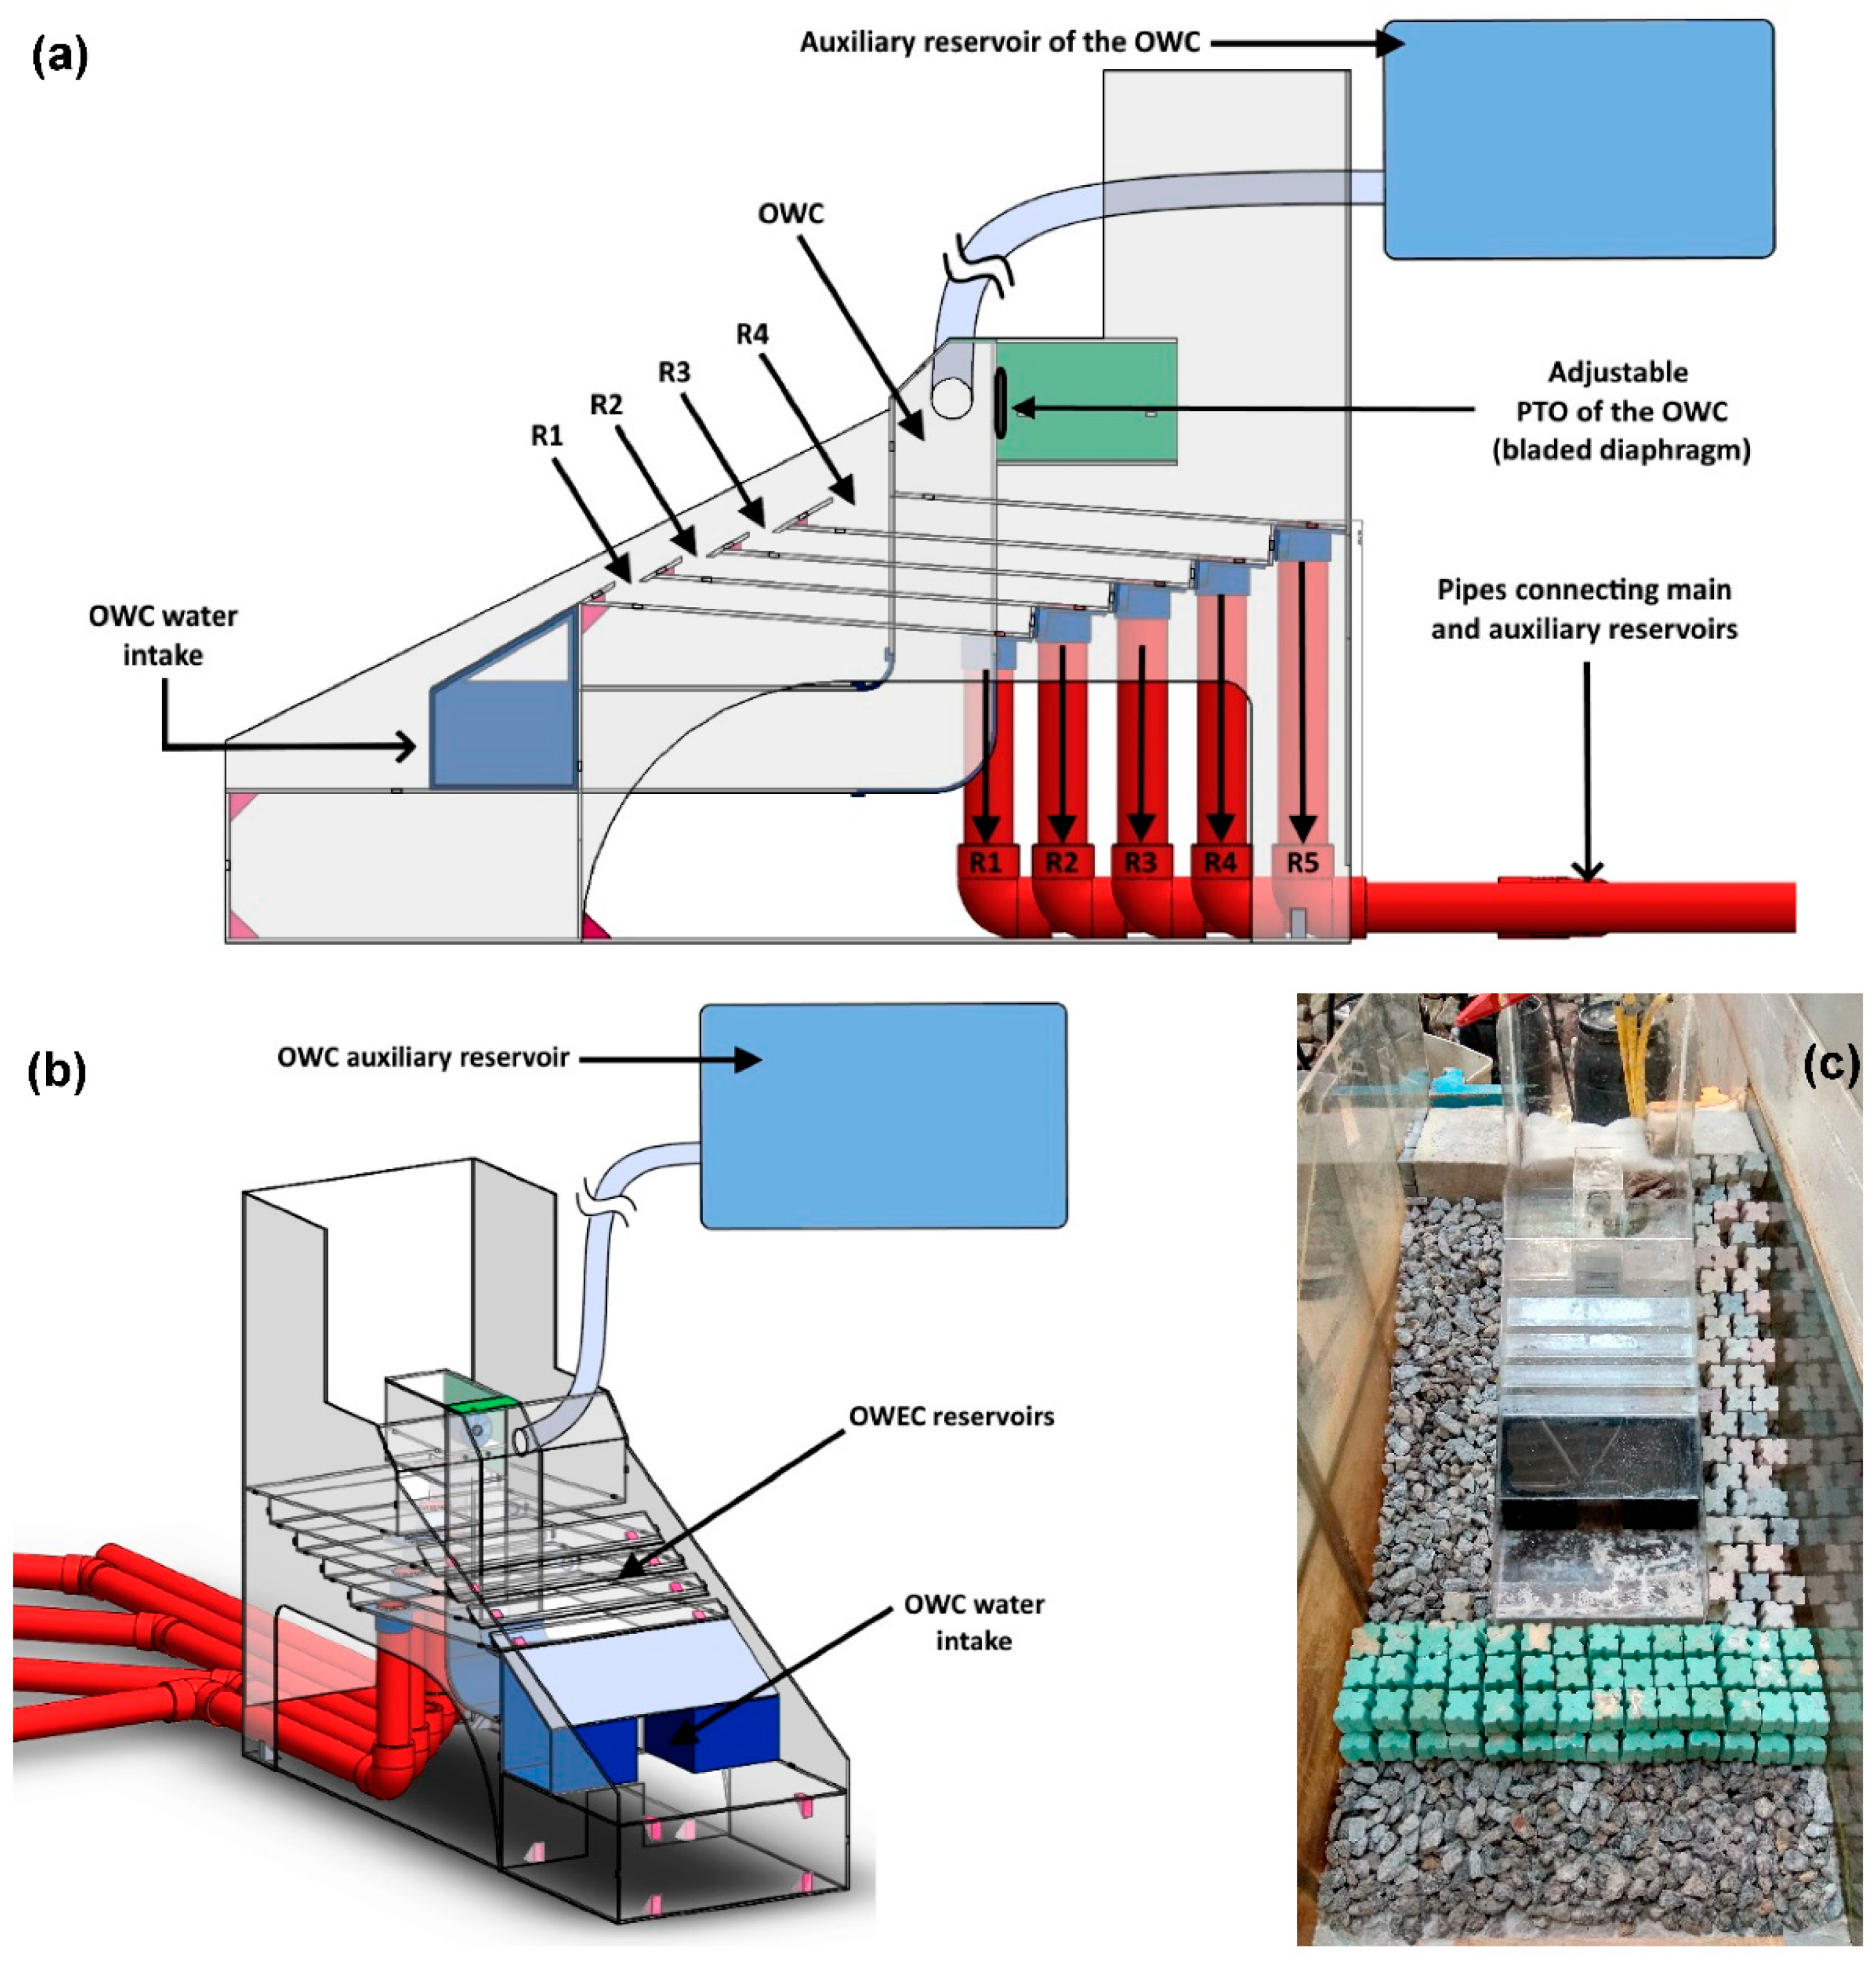
In this project, the combination of two well-known WEC technologies, a fixed OWC and the SSG, which is a multi-reservoir overtopping device, was considered to create a HWEC module and to determine its advantages over single-technology devices. The OWEC turns the kinetic energy of waves into potential energy by storing the water that runs up the reservoirs’ front ramp and into the reservoirs above the still water level. The water is then returned to the sea passing through hydraulic turbines to produce electrical energy.
The preliminary design of the HWEC [
23] had to be adapted in order to be merged into the cross-section of the planned north breakwater extension of the Port of Leixões with the least amount of modifications to the preliminary design,
Figure 2.
The geometry of the HWEC module was numerically optimized, namely the OWC’s chamber entrance design, the number of reservoirs of the OWEC and their crest height, as well as the length of the reservoirs. The OWC was mainly studied in this preliminary phase using the ANSYS Fluent CFD model [
32], and the OWEC using WOPSim v3.11 software [
33], a simulation tool developed by the Aalborg University to study multi-reservoirs OWECs.
The optimization of the OWEC device was done first by using an algorithm that was developed for this study to determine the optimum reservoirs’ crest heights in order to maximize the hydraulic efficiency. This was achieved using an empirical formula giving the average overtopping discharge in each reservoir obtained from the experimental tests performed by Kofoed [
34].
Nine characteristic water levels and seven characteristic sea states of the HWEC installation site were determined and considered in the optimization process. Some restrictions were also imposed, namely (full-scale values):
Maximum reservoir crest level equal or below the breakwater’s crest, at 13.1 m above the mean sea level (MSL);
Minimum distance of 1.25 m between reservoirs’ crests to allow human access to the inside of the reservoirs for maintenance operations;
Minimum height of 0.75 m from the MSL for the bottommost reservoir’s crest level to allow a sufficient working head for the first reservoir’s turbine.
An OWEC device with three, four and five reservoirs was considered. The chosen solution was the one with four reservoirs, based on the hydraulic efficiency obtained, as well as the added cost of building an extra reservoir and buying an extra turbine. The chosen crest heights of the reservoirs were, from the bottommost to the fourth reservoir, 0.75 m, 2.00 m, 3.25 m and 5.00 m referred to the MSL, at full-scale. An angle of 30° (relative to the horizontal plan) was chosen for all the OWEC overtopping reservoirs’ ramps, with the intent of ensuring the occurrence of slightly breaking surging waves, which produce low energy dissipation [
35], as well as approximately safeguarding the 26.7° slope of the breakwater extension. The resulting geometry was then validated using WOPSim v3.11 software.
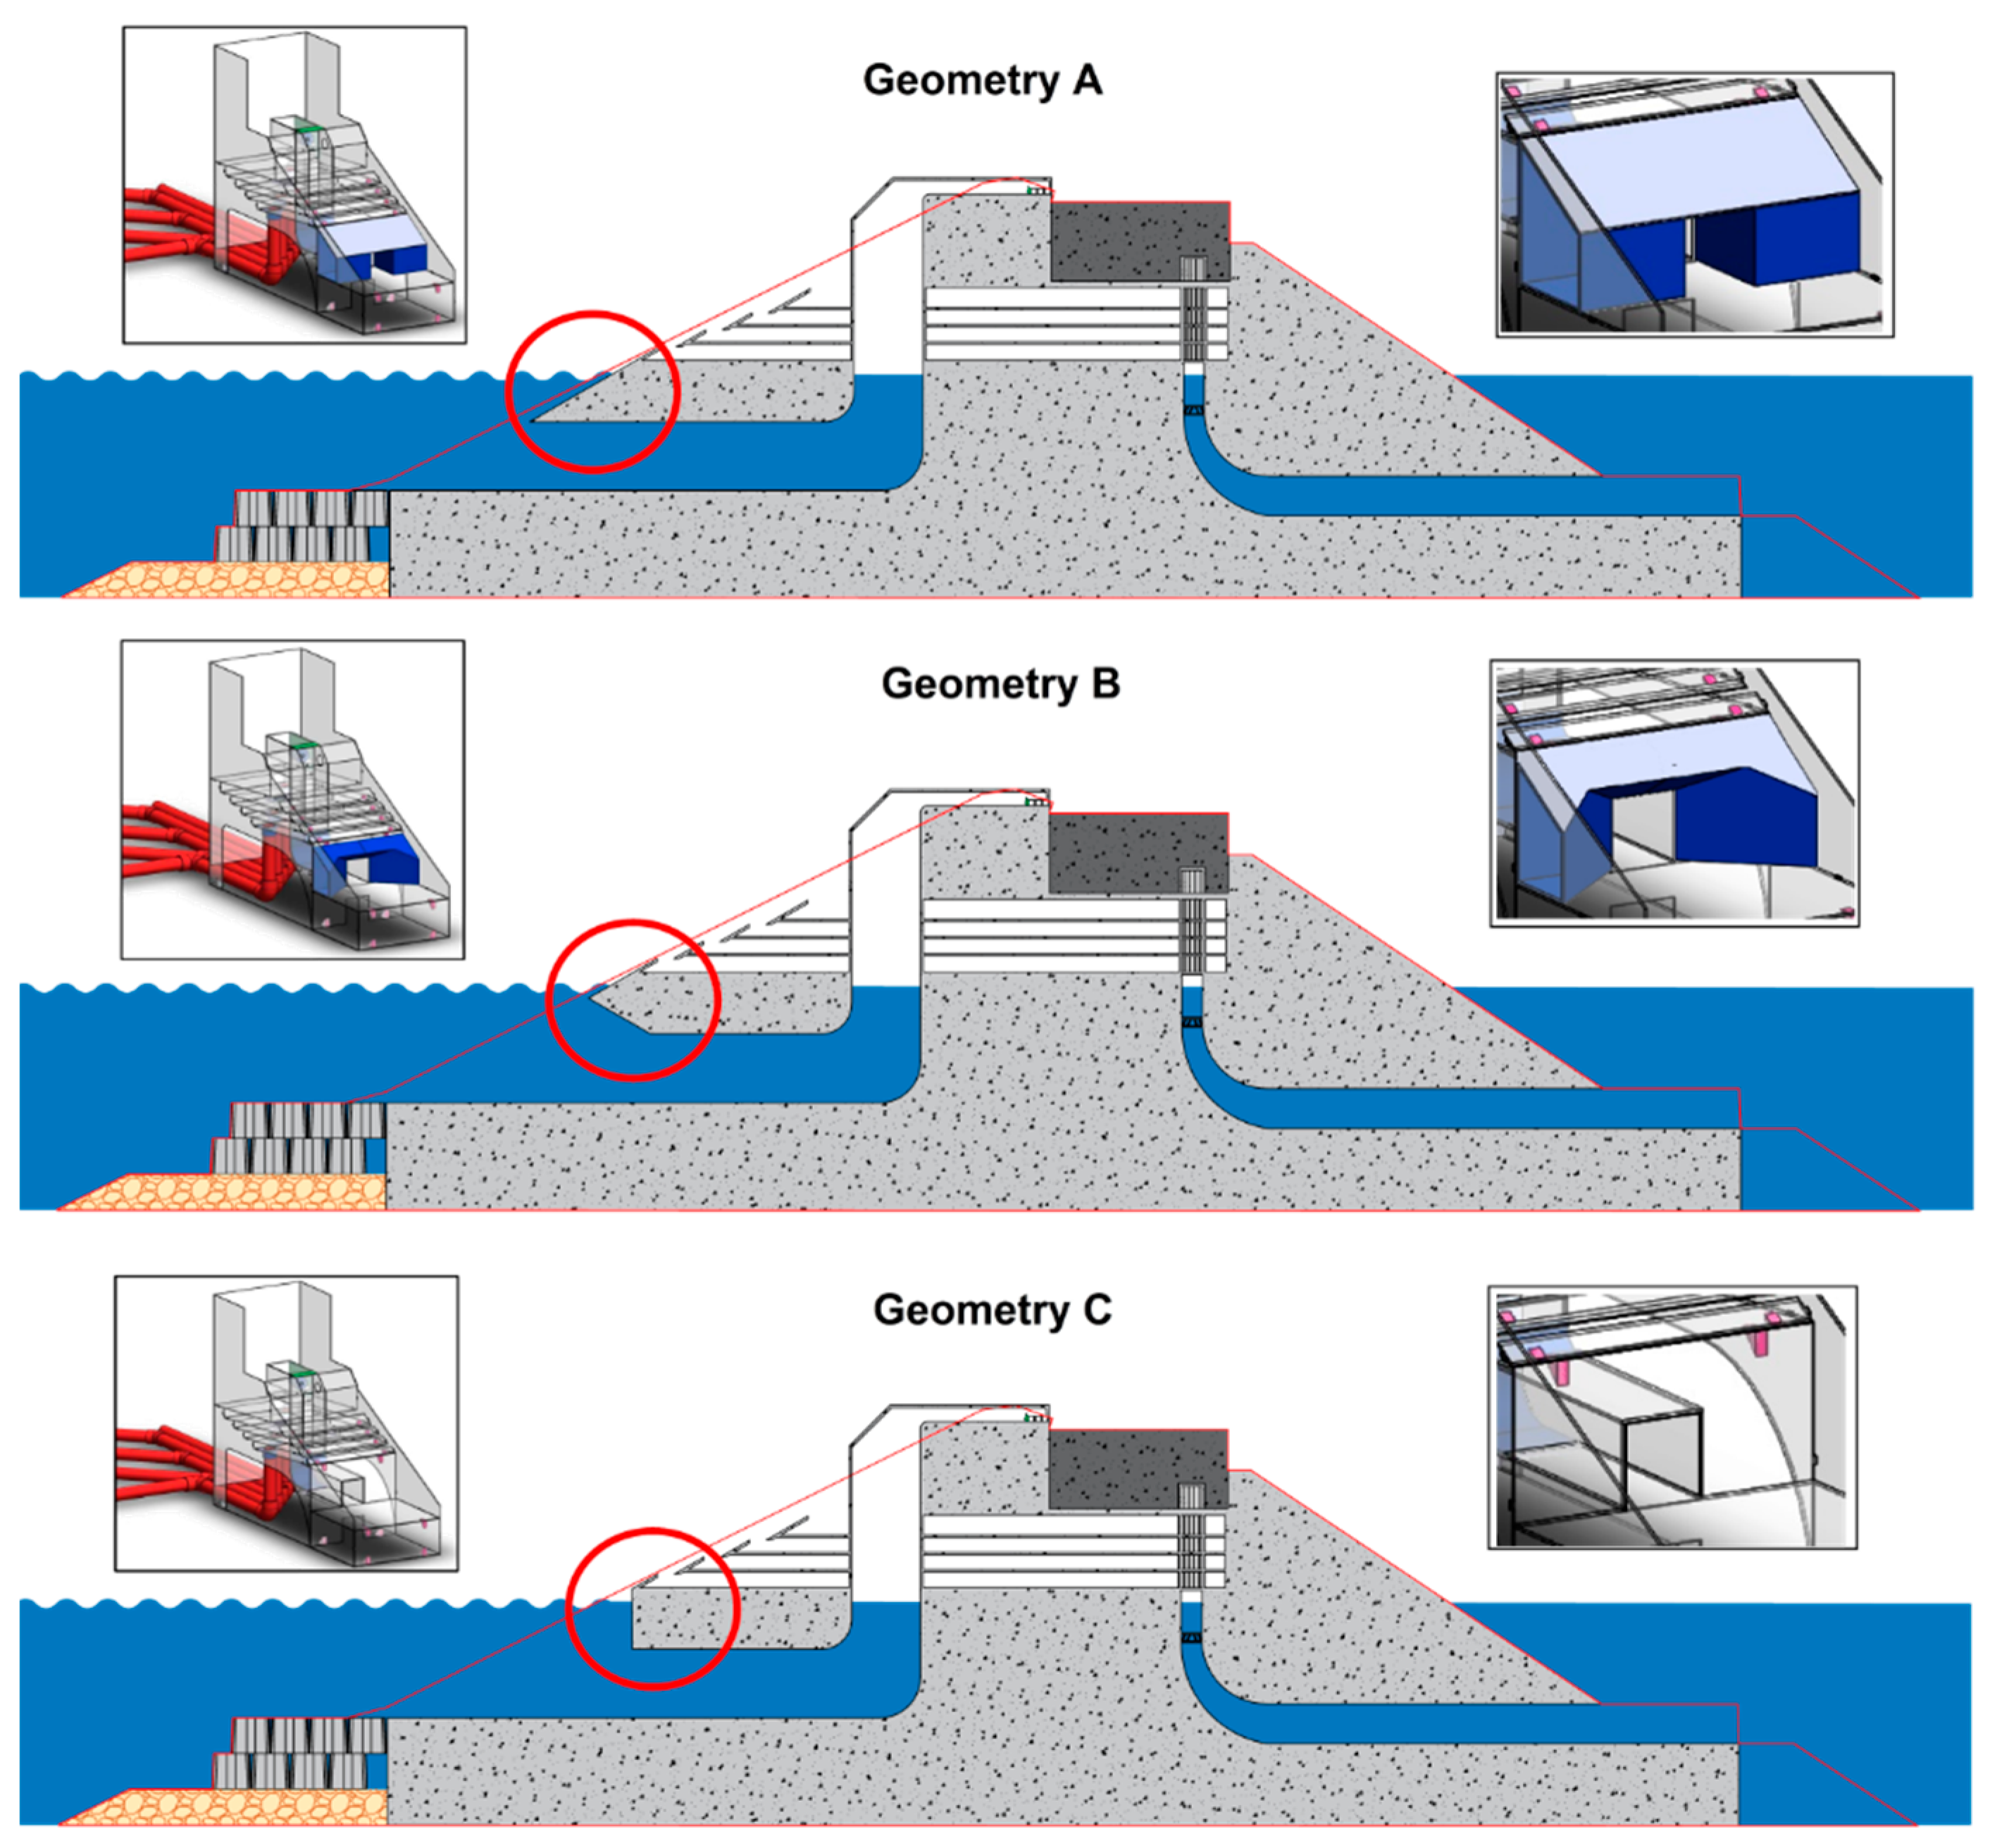
One of the key parameters influencing the performance of an OWC is its natural frequency. The OWC’s performance on the numerical tests, which were carried out using ANSYS Fluent before the experimental tests, was improved by changing its geometry, thus bringing the system’s resonant period values closer to the most energetic wave periods at the WEC’s installation site. However, the optimized chamber entrance geometry was expected to have a negative influence on the OWEC’s performance, because of the reduced draught of the overtopping ramps, which can diminish the overtopping discharges up to 40% [
34]. Due to this, the final HWEC design considered three different geometries for the OWC’s entrance chamber, what ensued in different resonant periods of the OWC near the target one,
Figure 3.
Geometry A, the initial design, was expected to lead to the best performance of the OWEC, whilst geometry C should lead the best performance of the OWC, although probably impacting the OWEC’s performance. Geometry B was designed as a compromise option between geometries A and C, and is intended to reduce the negative influence of each technology on the other. Notwithstanding, as the power production of the two technologies can be added, the overall efficiency of the HWEC module could be higher than that of the single devices as well as having high efficiencies for a broader range of wave conditions, thus making the power production less stochastic.
2.2. Experimental Facility and Equipment
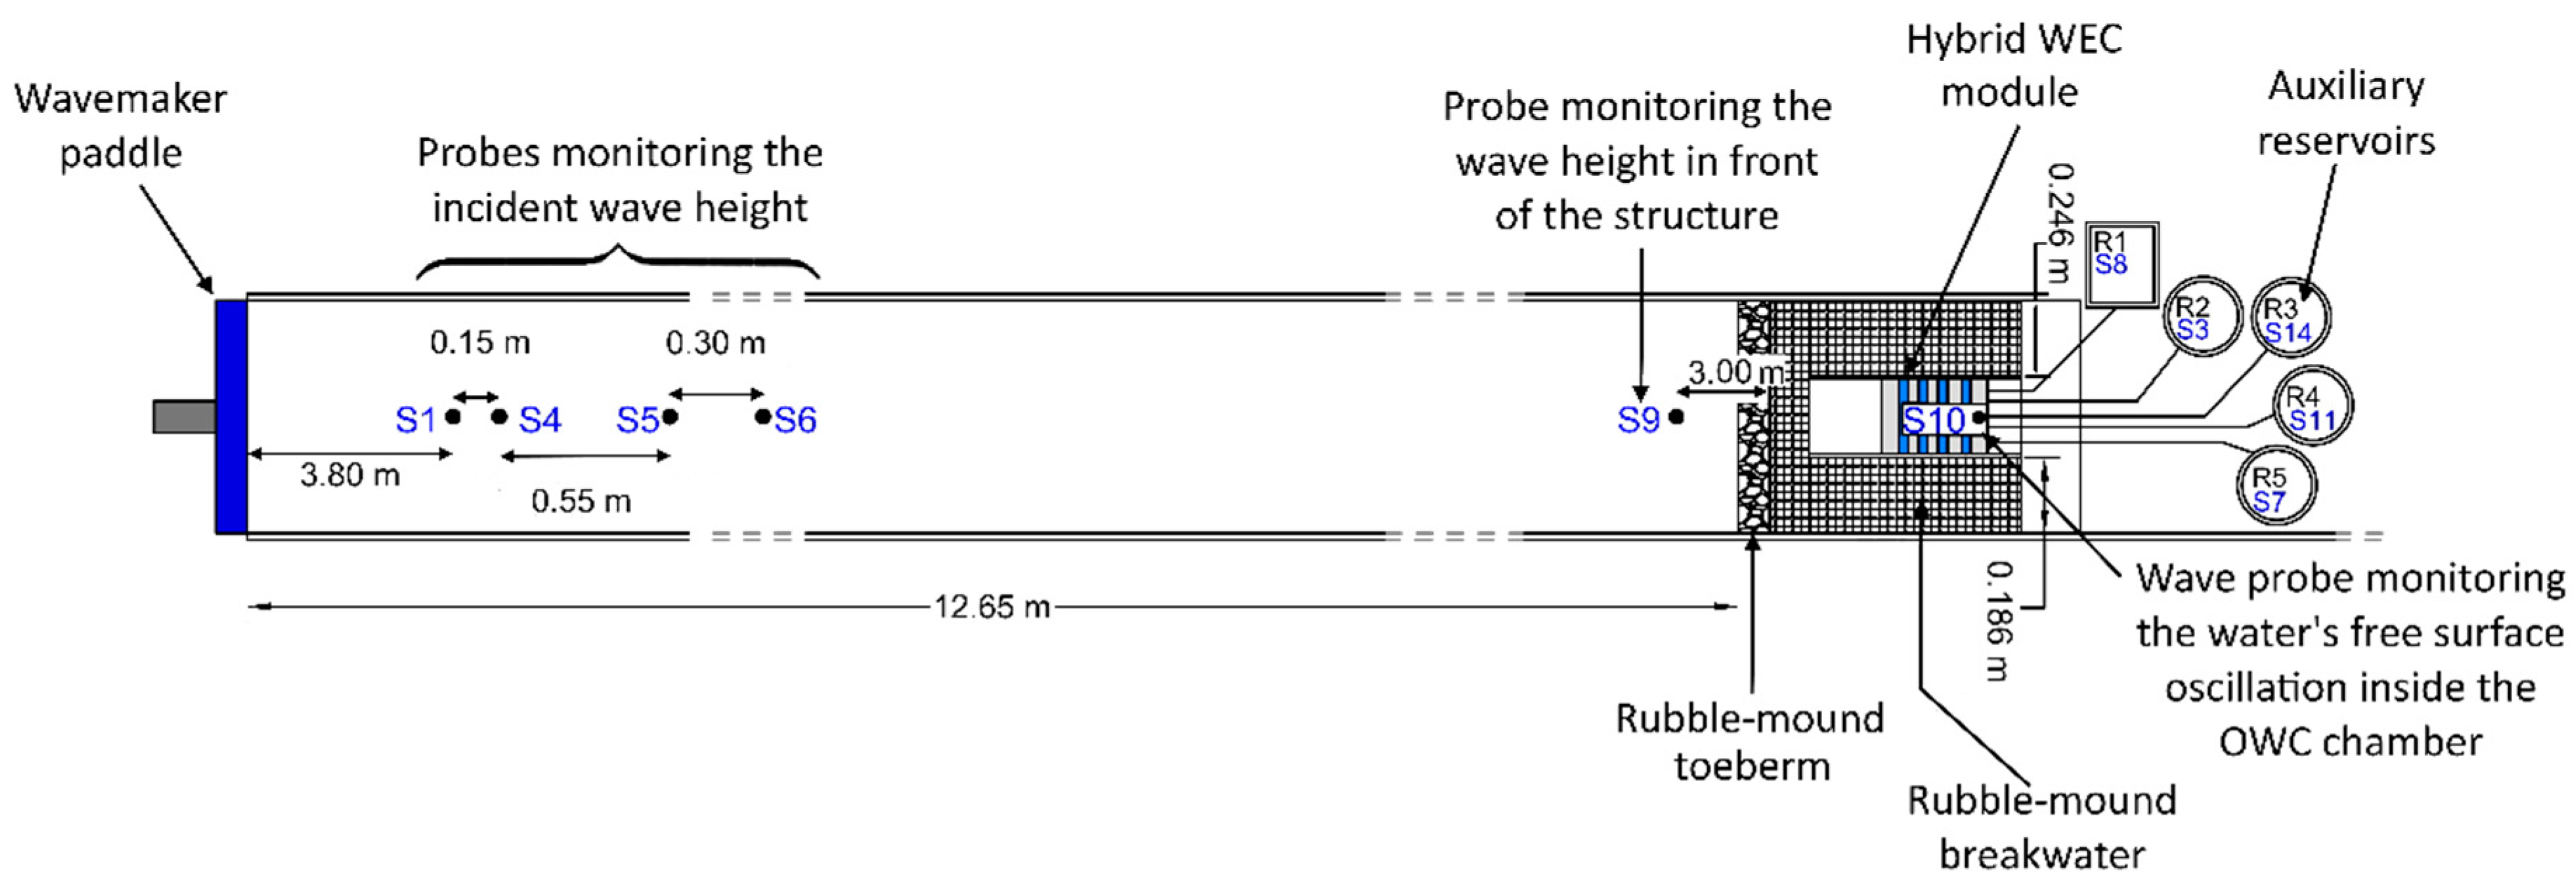
The experimental tests were performed in the wave basin at the Hydraulics Laboratory of the Hydraulics, Water Resources and Environment Division (SHRHA), of the Faculty of Engineering of the University of Porto (FEUP), Portugal. The wave basin is 28 m long, 12 m wide and 1.2 m deep. Inside, vertical barriers were used to create a channel 0.84 m wide and 14.30 m long, wherein the tests were performed,
Figure 4. The geometrical scale chosen for the tests was 1:50 (Froude similarity), based on similar studies of the OWC [
36] and the OWEC [
24] technologies, as well as the physical limitations of the wave basin. Furthermore, the scale effects associated with an incomplete hydraulic similitude were mitigated by testing the different models under the same test conditions. Therefore, scale effects have the same influence on the results, because the conditions were the same throughout all the tests. The wave generation system used was a single piston-type paddle (HR Wallingford, Oxfordshire, UK). Wave reflections were minimized by a dynamic reflection absorption system integrated in the wavemaker.
Figure 4 shows the disposition of the different elements inside the channel where the tests were performed. The equipment used comprised:
Eleven resistive wave probes (HR Wallingford, Oxfordshire, UK), with an accuracy of 0.4 mm, to measure the water free surface elevation during the tests in different positions of the experimental facility and of the physical model;
Two different water pumps (Resun, Shenzhen, China and Trotec, Heinsberg, Germany) that emptied the auxiliary reservoirs used during the tests to quantify the overtopping volumes;
A Canon camera lens diaphragm used to simulate different damping values of the OWC turbine (biradial impulse turbine) by changing its aperture;
Two pressure sensors (TruStability, Honeywell, Golden Valley, MN, USA), in order to measure the pressure variation inside the OWC chamber.
The eleven resistive probes were organized as follows:
Four aligned probes (S1, S4, S5 and S6) to monitor the water free surface elevation near the wave generation system, which enabled to perform a reflection analysis using a script based on a development of the least square method proposed by [
37] and therefore allowing to determine the incident wave conditions;
One probe (S9) directly in front of the HWEC to monitor the water free surface elevation close to the physical model;
One probe (S10) inside the OWC chamber to measure the water free surface oscillation and to monitor the dynamics of the oscillating water column;
Four probes (S8, S3, S14 and S11) inside the auxiliary reservoirs connected to the four reservoirs of the OWEC, to monitor the water levels inside them, therefore enabling the measurement of the overtopping volumes;
One probe (S7) inside the auxiliary reservoir connected to the top reservoir of the physical model to measure the overtopping volume over the crest of the structure.
The system that was devised to measure the overtopping discharges of the OWEC’s reservoirs and the structure, using the auxiliary reservoirs, was described later.
2.3. Physical Model
For this study, a 0.84 m wide (42 m at full-scale) section of the planned Leixões North breakwater extension was considered,
Figure 4. The chosen HWEC module’s width was 0.40 m (20 m at full-scale), while the remaining 0.44 m were completed with a full representation of the breakwater’s cross-section (
Figure 1), including the armor layer, rubble-mound internal layers and tout-venant core, fulfilling the 0.84 m wide channel at the geometrical scale of 1:50. For the operational tests, the HWEC model was placed approximately in the centre of the section, allowing an adequate fit of the Antifer cubes on both sides,
Figure 5c.
The HWEC was built in polymethyl methacrylate (PMMA) and the parts with a more complex geometry (geometries A and B, OWC chamber’s curves and hoses connection flanges) were 3D printed (in blue in
Figure 3 and
Figure 5a,b). The OWEC’s reservoirs were connected to the auxiliary reservoirs with rigid PVC pipes.
The model has four main reservoirs 20 m wide (full-scale), representing the OWEC’s reservoirs (R1, R2, R3 and R4),
Figure 5a. The fifth reservoir on top of the breakwater receives the overtopping flow over the crest of the structure at the level of 13.1 m (MSL). Besides, air exhaust slots on the back of each reservoir allowed the air trapped inside the reservoirs to exit when water entered into them [
25], thus preventing the reduction of their hydraulic performance. As the volume of the OWEC’s reservoirs was not enough to store the water intake from the test’s full duration, they were connected to auxiliary reservoirs on the back of the model with rigid hoses (in red in
Figure 5a,b). Moreover, their dimensions could not accommodate measuring equipment such as the wave probes. Consequently, all the overtopping volume from each reservoir directly flowed into its corresponding auxiliary reservoir, where the water free surface elevation was monitored. The volume intake from each reservoir (R1, R2, R3 and R4) had to be separated because the total available head differs between reservoirs, and the produced power is proportional to the available head. The resistive probes inside each of the auxiliary reservoirs monitored the water level inside them and a relay system controlled the operation of the pumps. The method used to measure the overtopping discharges can be found in Ref. [
24].
The depth of the submerged OWC water intake in the front had to be chosen as to prevent any air intake for test conditions combining high significant wave heights with the low tide water level, therefore the top of the entrance was fixed at 4.7 m below MSL. The OWC’s cross section is a 5 × 5 m2 square (full-scale).
Since the physical model scaling was done using Froude similarity, air compressibility would not be adequately represented [
38]. Hence, the OWC’s chamber was connected to a rigid-wall reservoir filled with air and water (
Figure 5a,b), following the procedure depicted in [
38]. For the tested water level, the air volume inside the rigid-wall reservoir was adjusted by adding water (considered an incompressible fluid) to or removing water from the reservoir to achieve the desired air volume.
The OWC’s PTO system considered was a biradial turbine [
39] because of its high peak and time-averaged efficiency [
40], as well as its wide operational flow range [
27]. As the biradial turbine has a quadratic relationship between the flow rate and the pressure [
40], which is the same as for an orifice plate, it was modeled using the diaphragm from a Canon photographic camera lens,
Figure 6.
The diaphragm was placed at the top of the OWC chamber, where the turbine would normally be. The use of the diaphragm camera lens instead of a fixed, simpler, orifice plate, is justified by the possibility to change its aperture during the tests,
Table 1. This was done in real time using an Arduino system. Therefore, by changing the diaphragm’s aperture several PTO configurations were tested without needing to stop the tests, which is the equivalent to testing air turbines with different damping characteristics. Hence, the turbine could be chosen based on the damping introduced by the diaphragm’s aperture that results in the highest efficiency of the OWC.
2.4. Wave Conditions
The project of the North breakwater extension of the Port of Leixões included a characterization of the wave conditions near the site by the Portuguese National Laboratory of Civil Engineering (LNEC), at a water depth of 21.1 m C.D. [
41]. In that study, data from the Leixões wave buoy with a 3 h frequency was used. The buoy is anchored at a water depth of −84 m C.D., and the period considered spanned from 2004 to 2013 (10 years). Due to the exiguity of the data, the WAM (Wave Modelling) forecast model [
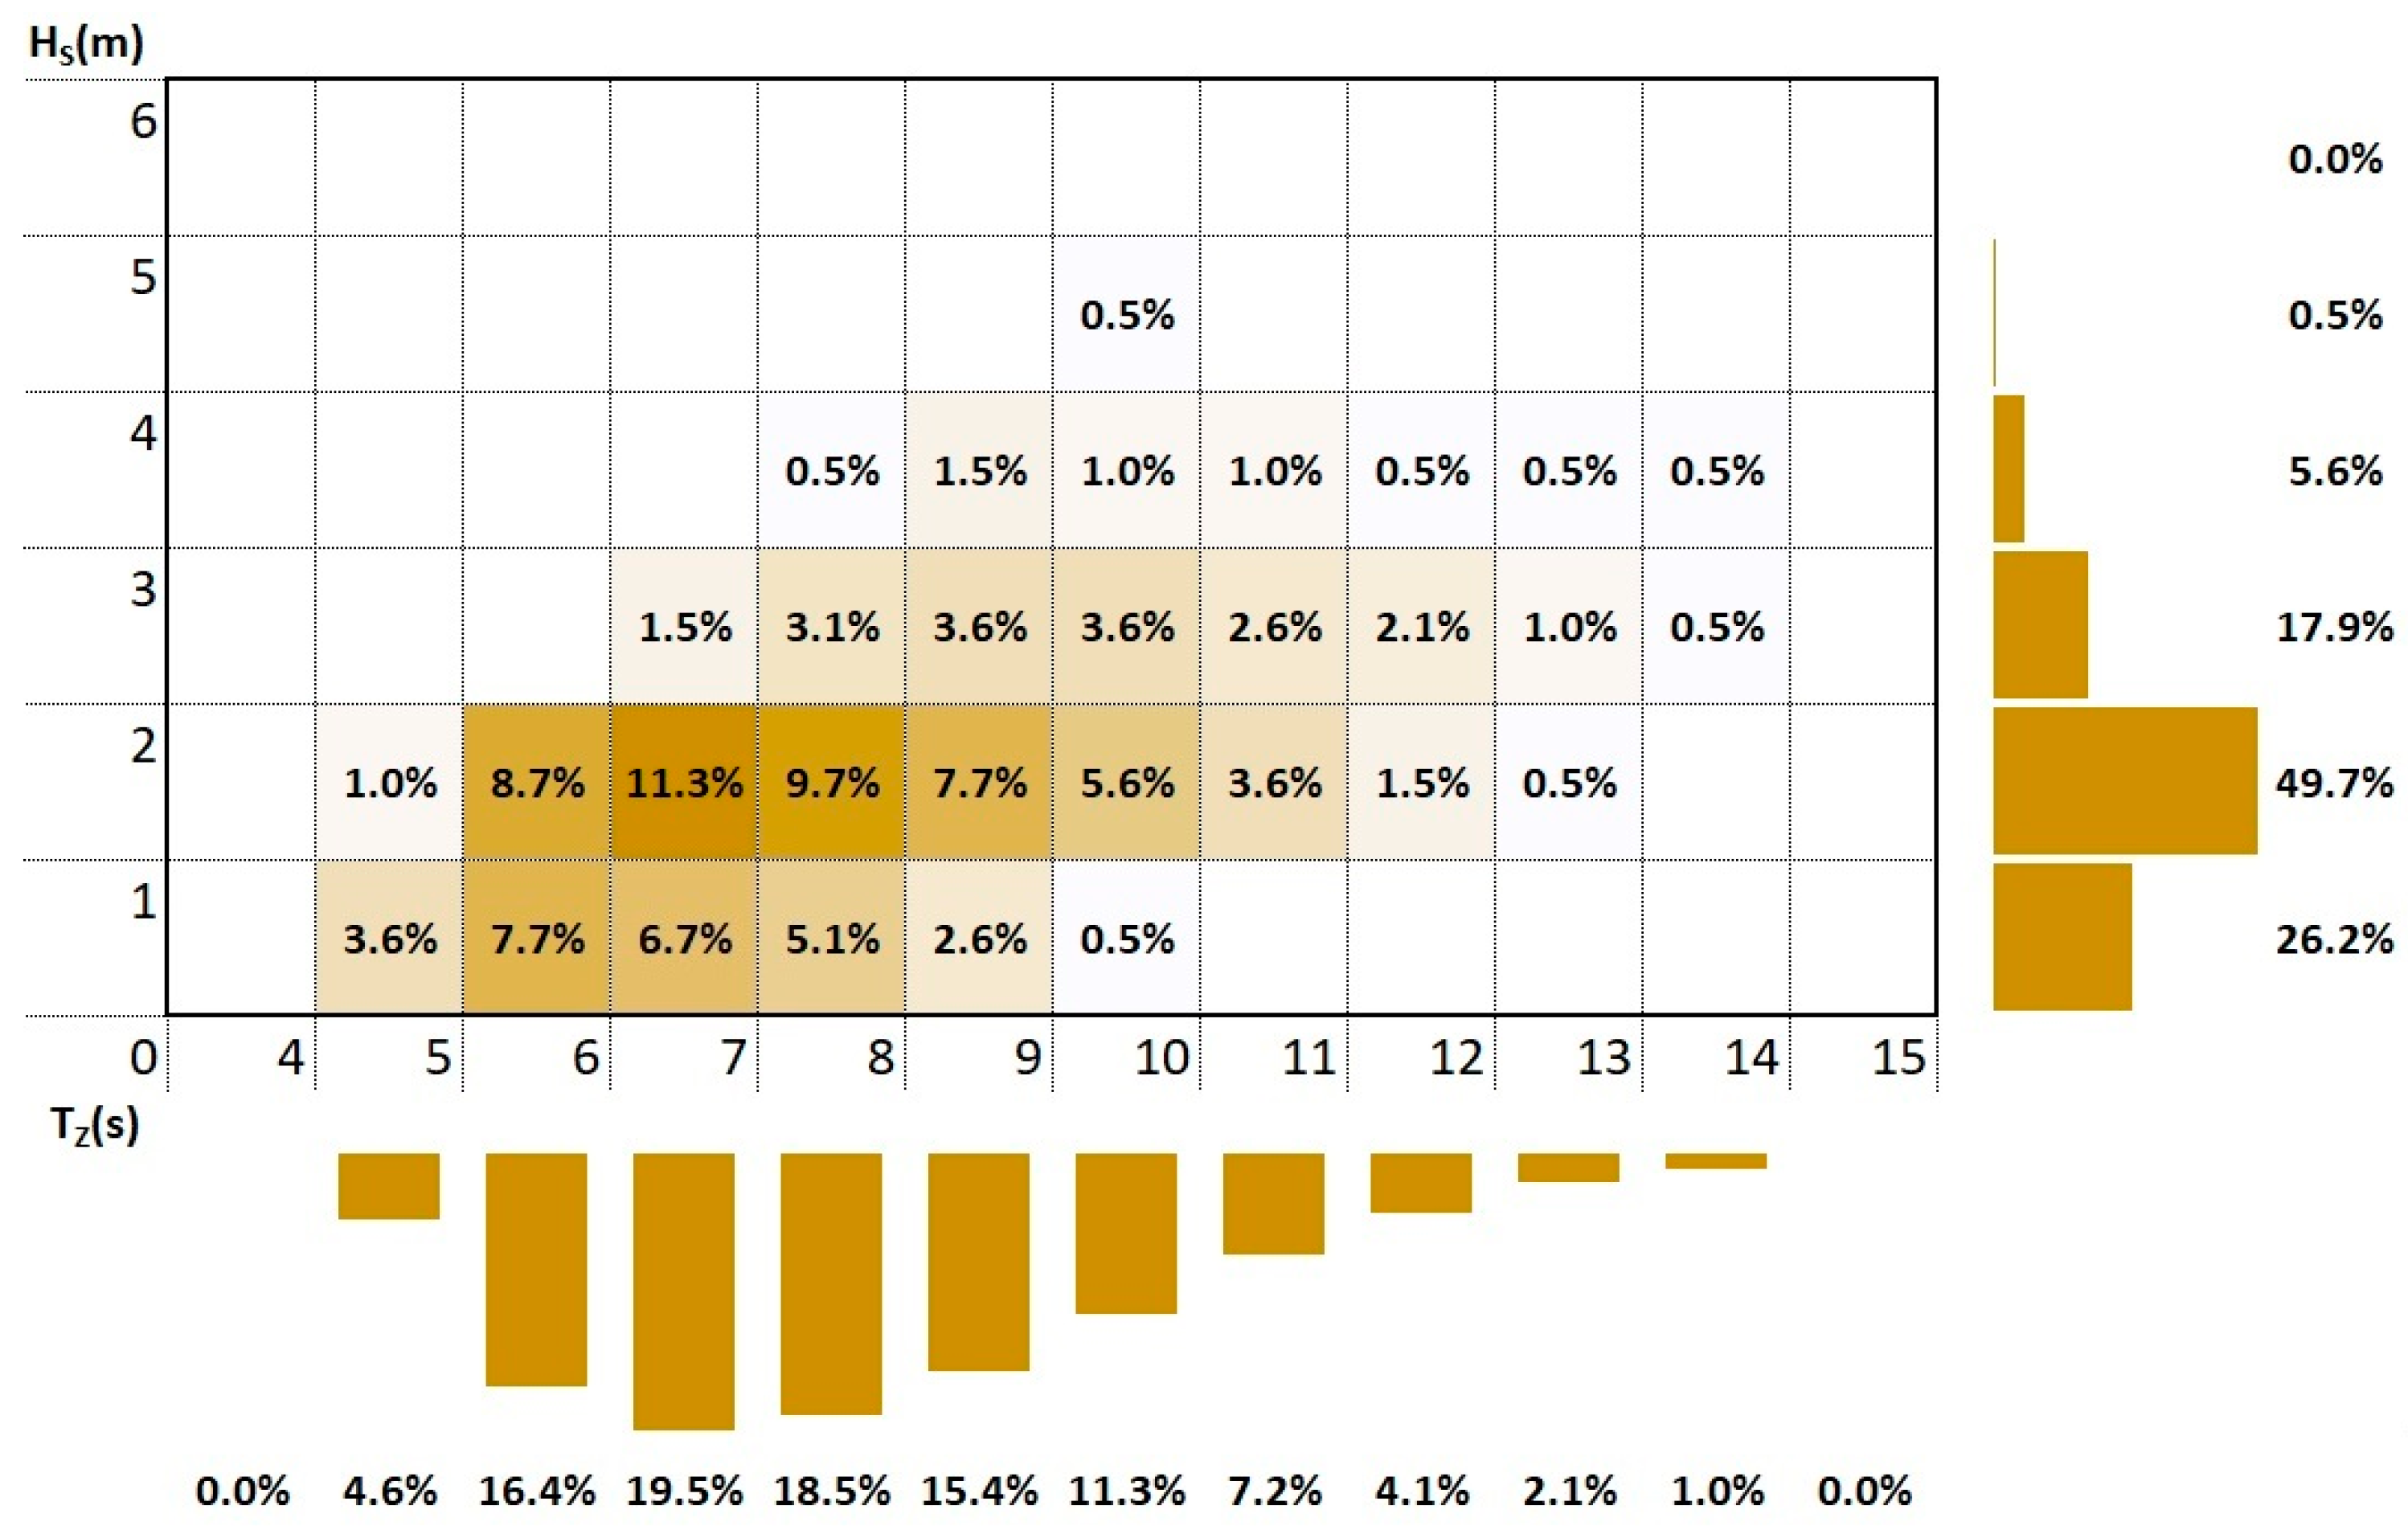
42] of the European Centre for Medium-Range Weather Forecasts (ECMWF) was also used (with 6 h frequency). The point chosen was different from the location of the wave buoy, but was also close to the Port of Leixões, at a water depth of −81 m C.D., and the period considered spanned from 1979 to 2016 (38 years). The data from both sources contained the significant wave height, the peak wave period and the wave direction. Offshore data were propagated to the vicinity of the breakwater using the SWAN (Simulating WAves Nearshore) spectral numerical model [
43]. Averaging the values from both sources, the scatter diagram in
Figure 7 was considered for the selection of the sea states to be tested.
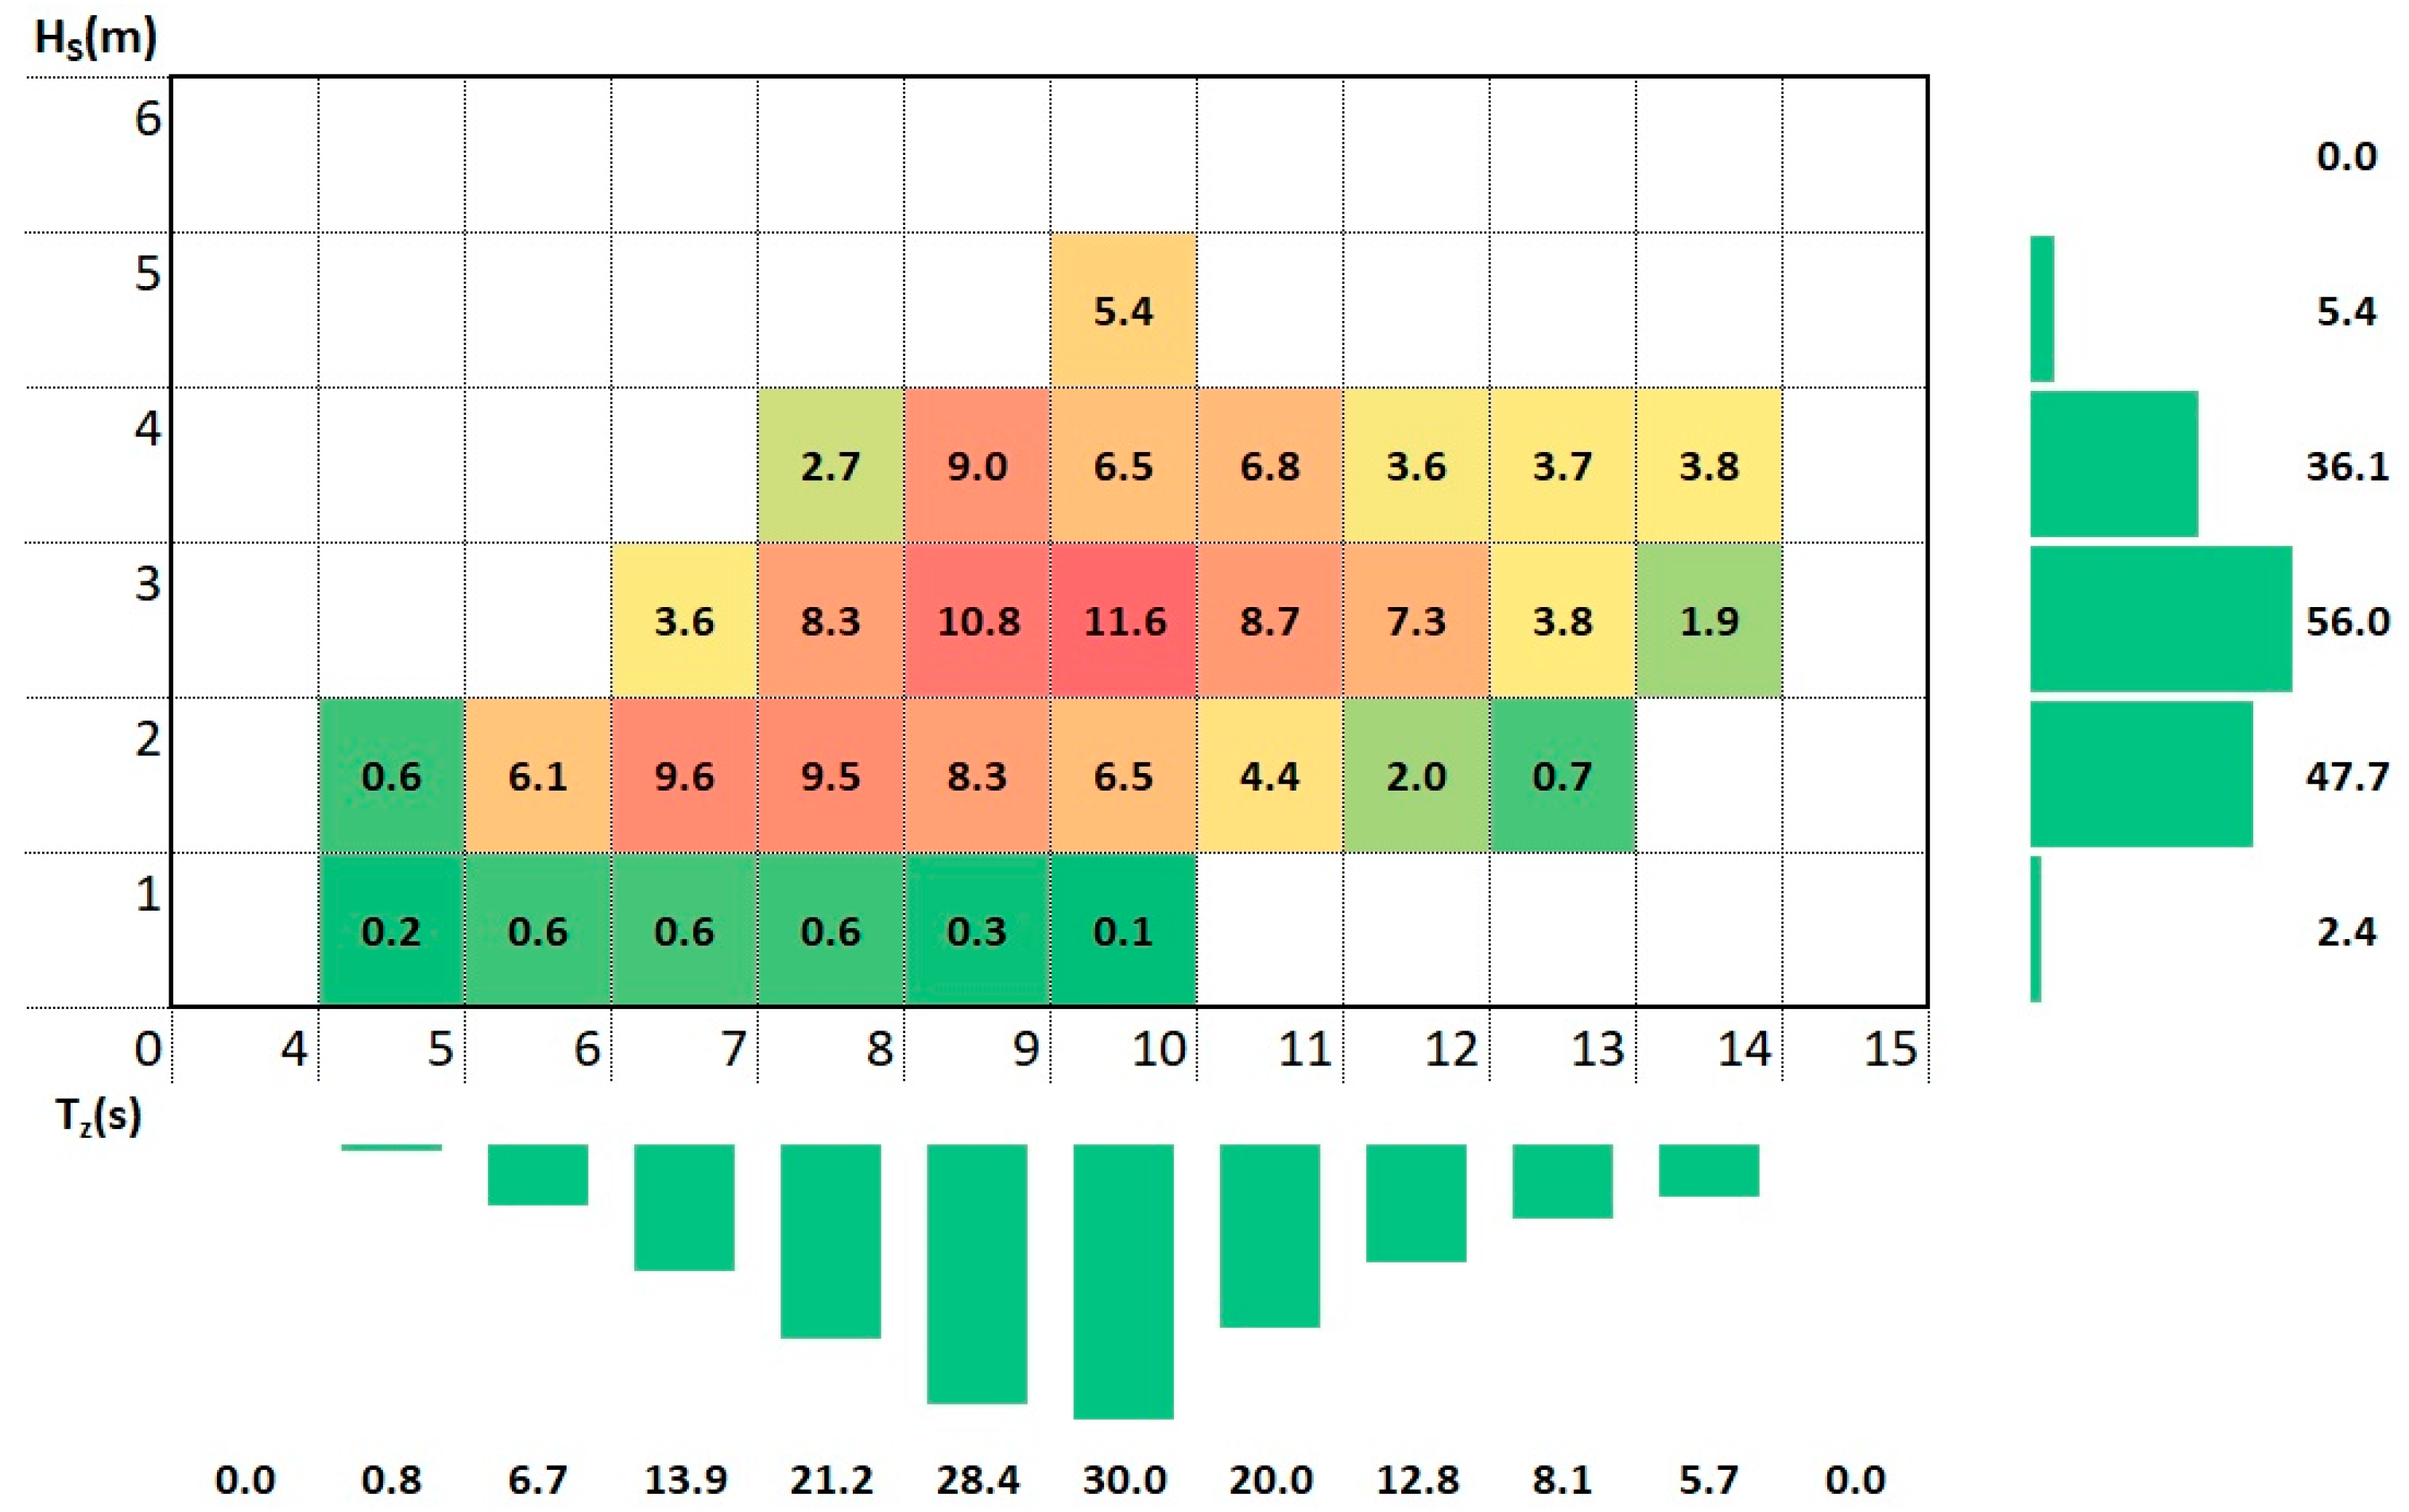
The resource matrix was obtained by multiplying the probability of occurrence of each combination of
(m) and
(s; in 1 m and 1 s intervals in this case), from
Figure 7 by the omnidirectional wave power flux available per meter of wave front (W/m). Considering a single wave component, the wave power is given by,
where
(kg/m
3) is the density of sea water,
(m/s
2) is the gravitational acceleration,
(rad/s) is the angular frequency of each wave component,
(m
2/Hz) is the spectral variance density and
(m/s) is the velocity of the energy propagation (group velocity), given by,
where
(m) represents the local water depth. The wave angular frequency is given by,
where
T (s) is the wave period and
(m
−1) is the wave number, given by,
where
L (m) is the wavelength.
Assuming linear super-positioning, the average wave power density (W/m) for a specific sea-state is obtained by integrating the wave components, as,
The obtained resource matrix is depicted in
Figure 8. It gives the annual average available power for each sea state per meter of wave front.
Taking into consideration the probability matrix in
Figure 7 and the power matrix in
Figure 8, the tests performed to assess the performance of the HWEC considered wave heights of 1, 2 and 4 m and wave periods from 6 to 15 s, and the mean sea level.
Table 2 shows the wave conditions tested for each geometry.
3. Results
For a comprehensive understanding of the performance of the HWEC developed in this study, both technologies (OWC and OWEC) are first analyzed individually, and then the performance of the HWEC module as a whole was discussed. The conditions for which each component works best were determined and the potential of their combination to complement each other and produce power for a broader range of wave conditions was assessed. The results are presented in full-scale values.
3.1. Oscillating Water Column
As the performance of OWCs is strongly dependent of the frequency at which they are excited [
44], the water free surface oscillation inside the chamber of the OWC was analyzed for periods ranging from 6 to 15 s (1 s interval) and a fixed wave height of 1 m, and for wave heights of 2 and 4 m for the resonant period,
Table 2. The response amplitude operator (RAO (–)) was calculated as,
where
(m) is the peak-to-peak amplitude of the oscillation inside the OWC and
(m) is the incident wave height determined after performing a reflection analysis.
Figure 9 shows the variation of the RAO with the wave period (left) and with the wave height (right) for the three tested geometries of the HWEC (
Figure 3) based on the water free surface oscillation measured inside the OWC. It can be concluded that the RAO increased with the wave period, peaking at 12.5, 11.5 and 10.5 s, respectively for geometries A, B and C (after obtaining the resonant period with a precision of 1 s, tests were performed for each geometry for the resonant period plus and minus 0.5 s to increase the precision). As predicted, the resonant period decreased from geometry A to geometry C. As can be seen in
Figure 8, the mean wave period for which the energy contribution was greater in the vicinity of the Port of Leixões was 9.5 s, close to geometry C’s resonant period (10.5 s). However, it can be seen that albeit the resonant period for geometry A being higher than for geometry C, the RAO associated with geometry A was the highest (5.4), followed by geometry B (4.9) and geometry C (4.8). Even so, it should be noted that increasing or decreasing the wave period by just 0.5 s led to significant changes in the RAO. This indicates that the water oscillation inside the OWC chamber varied significantly with only slight changes to the wave period when close to the natural frequency, a behavior that was also observed in other studies of OWC devices [
45,
46,
47]. The RAO was also compared for three different wave heights (1, 2 and 4 m) for the resonant period of each geometry (1 s precision, therefore 13, 12 and 10 s respectively for geometries A, B and C),
Figure 9 (right).
Figure 9 shows that the RAO tended to decrease with increasing tested wave heights, for the resonant period of each geometry, on average 17% from 1 to 2 m and 32% from 2 to 4 m. The same can be observed in [
46] and in [
47], as an increase in wave height resulted in smaller amplification factors over the entire frequency range. This might be a consequence of an increase in chamber free surface deformation and water sloshing as wave height increases [
46], as well as a higher dissipation of the wave energy in the motion.
Since the detailed characteristics of the turbine to be used and the different control strategies to be employed are still not completely defined, the comparative analysis of the three tested geometries was based on the hydrodynamic power captured and on the hydrodynamic efficiency,
Figure 10, because it does not depend on the efficiency of all the different conversion steps from the energy in the waves to the electrical energy fed into the grid, and therefore allows for a realistic assessment of the advantages of using a hybrid device over traditional solutions. Moreover, regular waves were used to unambiguously analyze and compare the hydrodynamic performance of the HWEC module for the different wave periods and geometric configurations tested.
The instantaneous hydrodynamic power captured by the OWC per meter width (W/m) was calculated as,
where
(Pa) is the instantaneous air pressure inside the OWC chamber,
(m
2) is the cross section area of the free surface inside the OWC chamber (5 × 5 m
2),
(m) the water free surface oscillation inside the OWC chamber,
(s) the time and
W (m) the width of the OWC chamber (5 m). The wave front considered was 5 m (the width of the OWC chamber) instead of 20 m (the width of the HWEC module), to allow a better comparison with other values in the literature.
(W/m) is the absorbed power,
, averaged over the test duration. Some wave periods were only tested for some of the geometries (9.5, 10.5, 11.5, 12.5 and 13.5 s), because they are related to each geometry’s resonant wave period (
TR ± 0.5 s).
The hydrodynamic efficiency (–) of an OWC device is given by,
where
is the absorbed power averaged over the test duration and
is the time-average energy flux of the incident waves per meter of wave front (W/m), according to linear wave theory, given by,
where
is the group velocity calculated as in Equation (2).
Figure 10 shows the results of the hydrodynamic power captured and of the hydrodynamic efficiency for the three geometries of the HWEC as a function of the wave period. The hydrodynamic power captured by the OWC peaks at 12 s (11.3 kW/m), 10 s (11.1 kW/m) and 10.5 s (14.9 kW/m), respectively, for geometries A, B and C.
The hydrodynamic efficiency of the OWC is highest close to the natural period of oscillation of each geometry,
Figure 10. The maximum obtained hydrodynamic efficiencies are 84% for geometry A, 98% for geometry B and 129% for geometry C. Efficiencies above 100% can be expected for OWC devices when the wave frequency is close to its natural frequency [
44], and there is a tapering effect induced by the converging walls. For example, efficiencies of up to 250% were obtained for tests with random waves [
44] while using “harbor walls”, i.e., a pair of sidewalls in front of the device that concentrate wave energy and significantly increase the OWC’s performance. On the other hand, [
36] obtained a maximum hydrodynamic efficiency of 68% and [
48] of 74%, both for experimental tests with regular waves. Geometry C has a higher efficiency for the lower wave periods, followed by geometry B and then geometry A. The increase in efficiency for the lower wave periods from geometry A to B and from B to C is a result of the numerical optimization process underwent before the beginning of the test campaign, where the geometry of the OWC’s chamber entrance was optimized to lower the resonant period of the OWC. Notwithstanding, the effect on the OWEC’s performance should be assessed and the overall optimum solution chosen. As the introduction of the OWEC’s reservoirs can have a negative impact on the OWC’s performance, and vice-versa, it was expected that the efficiency could be somehow lower than that of a conventional OWC.
The OWC device attained high hydrodynamic efficiencies for the tested wave conditions, reaching a maximum hydrodynamic efficiency of 129% (efficiency calculated considering a 5 m wave front, which corresponds to the width of the OWC intake). The OWC performed better for wave periods above 9.5 s, with maximum hydrodynamic efficiencies obtained for wave periods between 10 and 12 s, depending on the tested geometry. The obtained hydrodynamic efficiencies are considered to be high when compared to similar experimental tests, such as [
36,
44,
48], although of the same order.
3.2. Overtopping Wave Energy Converter
Since the SSG is a multi-reservoirs device, the total hydraulic power captured per meter width of the OWEC (W/m), which is the sum of the power at each reservoir’s crest level, was calculated as,
where
(m) is the crest height of the
ith reservoir relative to the SWL and
(m
3/s/m) is the mean overtopping flow rate per meter of reservoir width that enters the
ith reservoir, calculated as the total overtopping volume that entered the
ith reservoir during the test divided by the test’s full duration and by the reservoir’s width. Like the hydrodynamic power captured by the OWC, the hydraulic power captured by the OWEC is independent of all the different conversion steps from the potential energy of the water stored inside the reservoirs to the electrical energy fed into the grid, which allows to perform an unbiased analysis of its performance, independent of turbine and turbine control strategy choice.
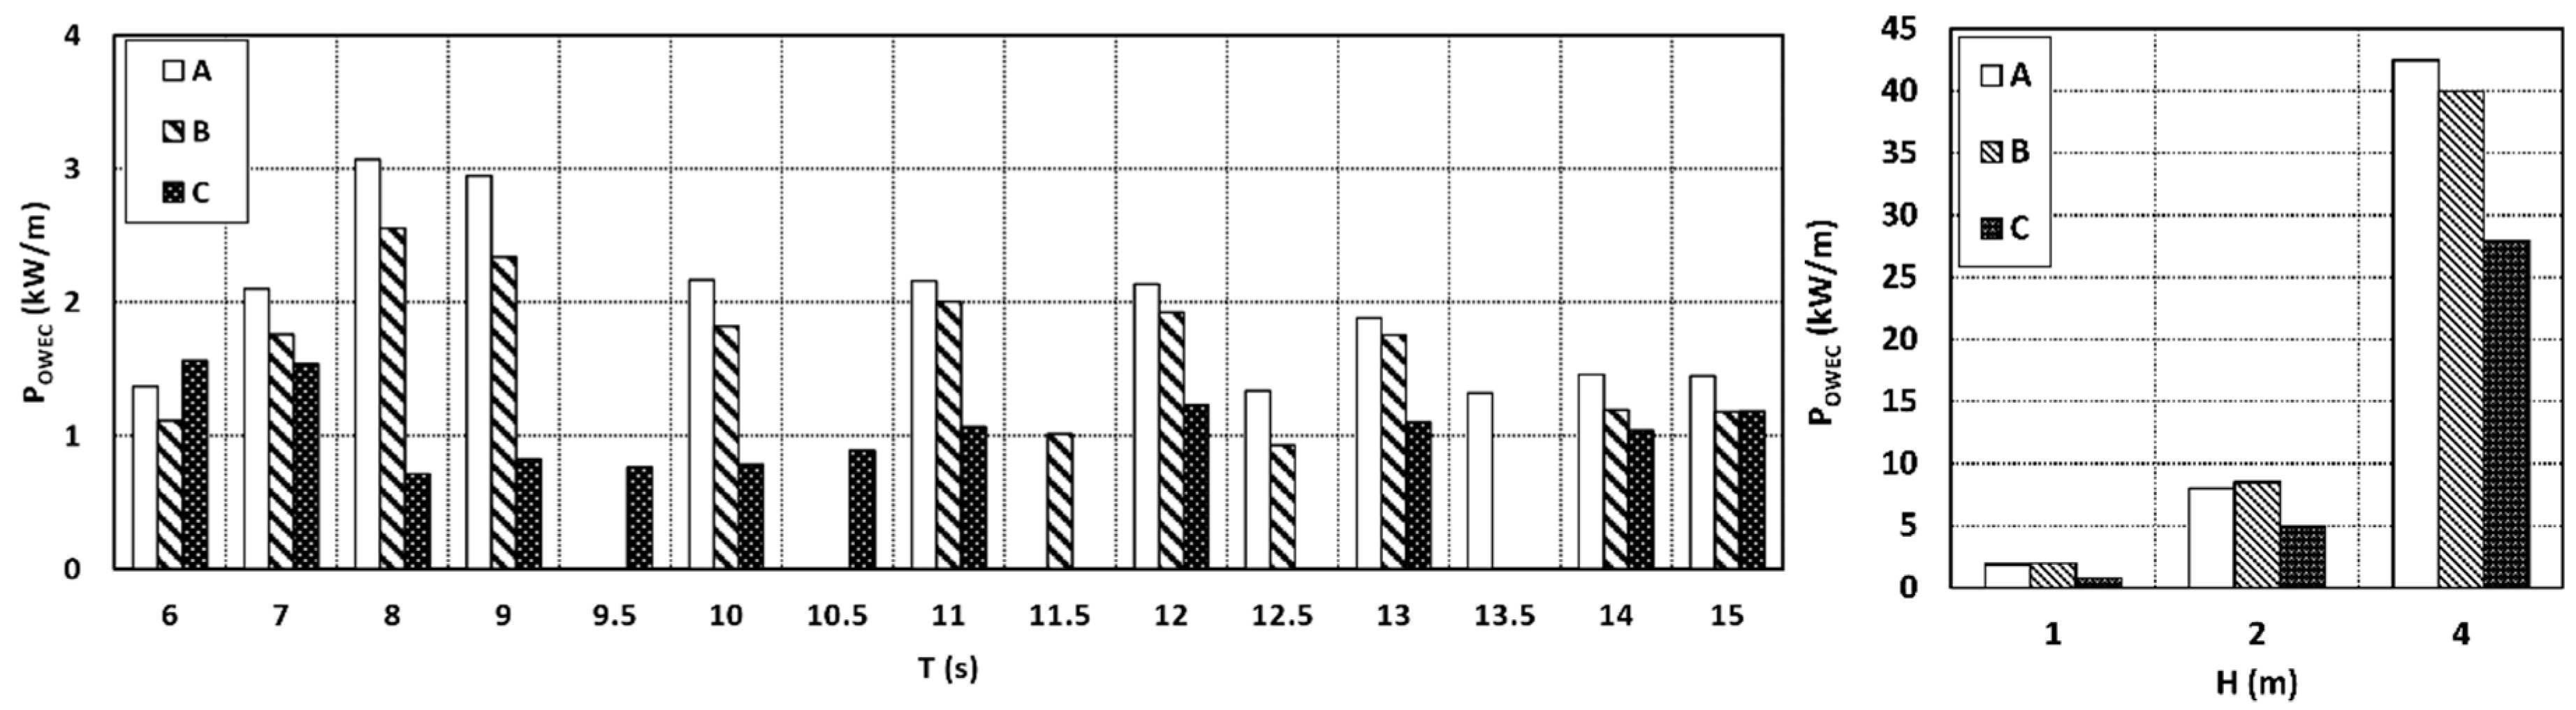
Figure 11 (left) shows the hydraulic power captured by the OWEC for different wave periods and a fixed regular wave height of 1 m (full-scale). Some wave periods were only tested for some of the geometries (9.5, 10.5, 11.5, 12.5 and 13.5 s). As the OWEC is a technology whose performance depends more on the wave height than on the wave period,
Figure 11 (right) shows the hydraulic power captured by the OWEC for the three tested wave heights for the OWC resonant period of each geometry (the tests with
H = 2 m and
H = 4 m were performed only for the OWC resonant period). The wave front considered was 20 m.
The results presented in
Figure 11 show that the maximum power captured by the OWEC is 3.1 kW/m for geometry A (
T = 8 s), 2.6 kW/m for geometry B (
T = 8 s) and 1.6 kW/m (
T = 6 s) for geometry C. It is also clear that both geometries A and B had a significantly better performance than geometry C, namely for wave periods above 7 s. Besides, the hydraulic power captured by the OWEC significantly increased with the wave height. However, it was not proportional to the wave height, but rather proportional to its square. Consequently, sea states with large wave heights should result in considerably higher power productions than sea states with small wave heights.
The increase in the captured power with the wave height can be explained, in part, by the available wave power per meter of wave front being proportional to the wave height’s square (cf. Equation (9)). The hydraulic efficiency of an OWEC device (–) is given by the ratio between the average available power per meter width at the crest level and the time-average energy flux of the incident waves per meter of wave front, according to linear wave theory, given as,
where
is given by Equation (9).
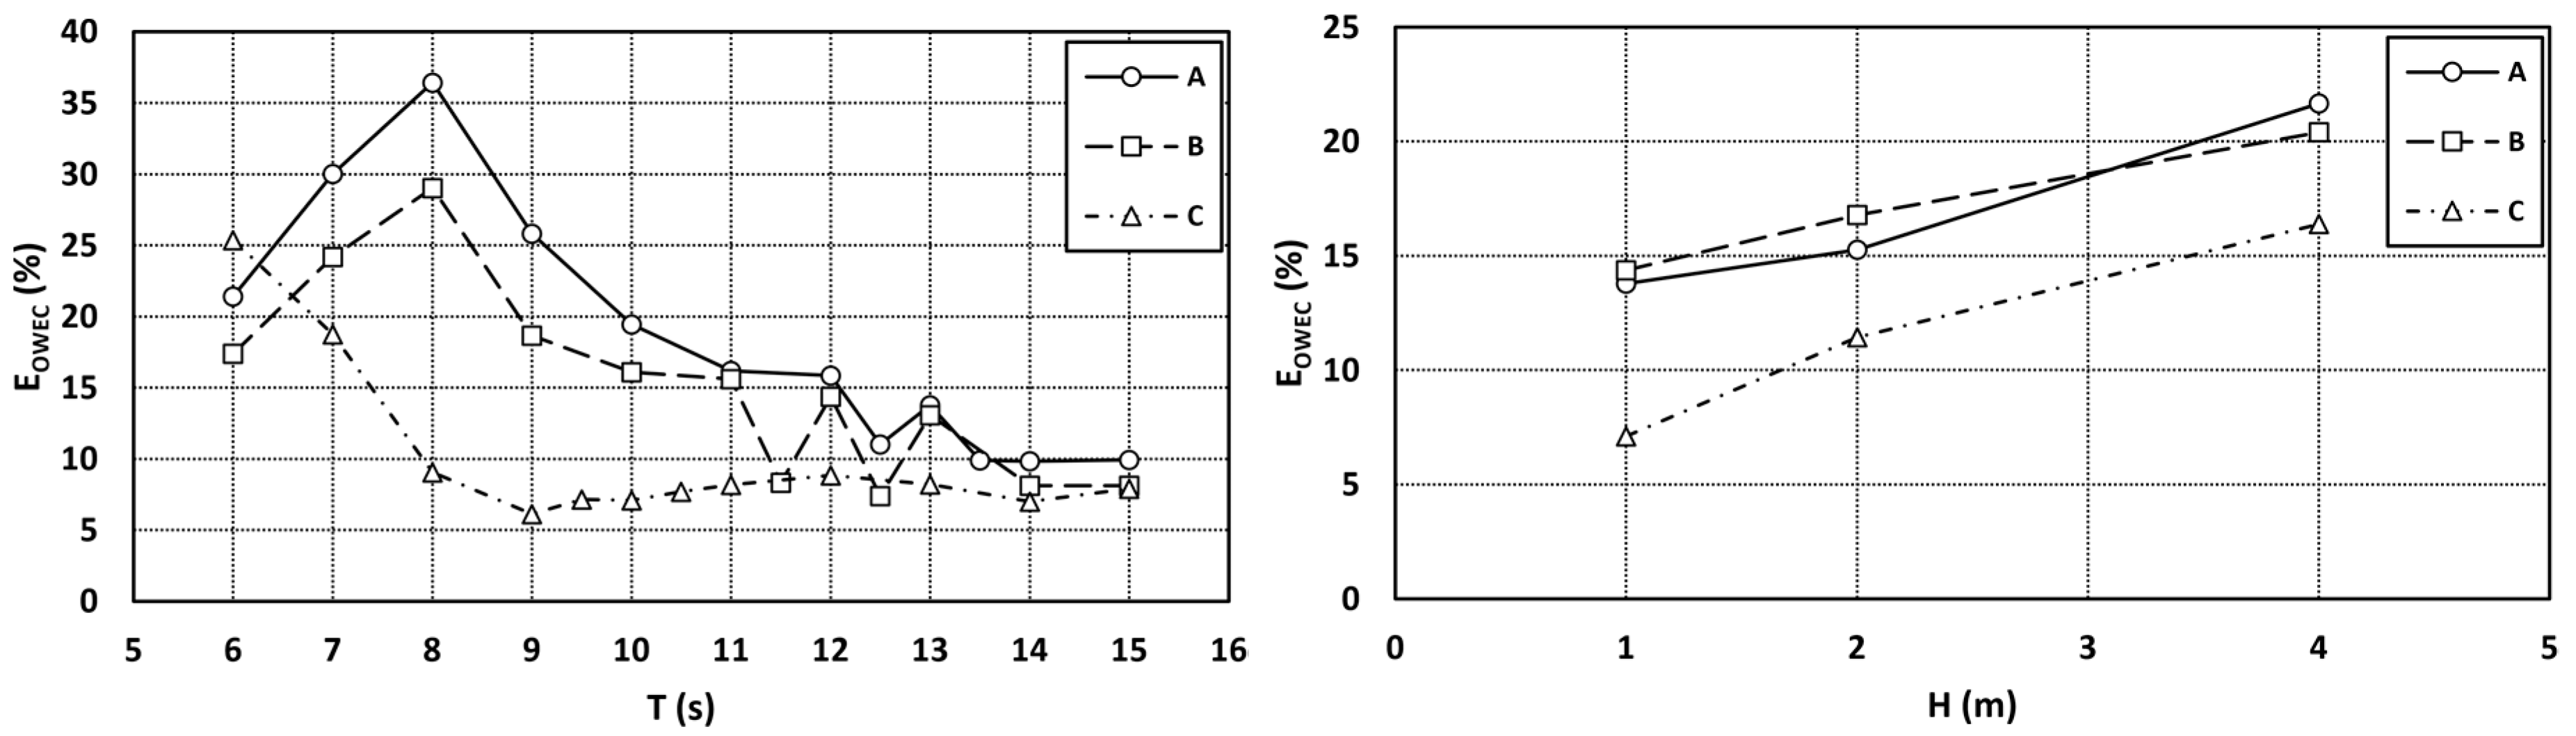
Figure 12 (left) shows the hydraulic efficiency of the OWEC device for the tested wave periods and a fixed wave height of 1 m, and
Figure 12 (right) shows the hydraulic efficiency for the tested wave heights and their resonant period.
A maximum hydraulic efficiency of 36% was obtained for geometry A (T = 8 s), of 29% for geometry B (T = 8 s) and of 25% for geometry C (T = 6 s). All the geometries show a higher hydraulic efficiency for the lower wave periods (6–10 s). Moreover, geometries A and B have considerably higher efficiencies than geometry C for wave periods up to 12 s, whilst above that the efficiency of the three geometries seems to stabilize around 7.5–10%. Furthermore, the hydraulic efficiency for geometries A and B is above 15% for all the tested wave periods between 6 and 11 s, inclusive, and above 10% for geometry A for all the tested wave periods.
The hydraulic efficiency increases with the wave height, although not proportionally. Likewise, in [
49,
50] an increase in efficiency can be observed for tested wave heights of 1, 2 and 3 m, although the efficiency tends to decrease for higher wave heights. Nevertheless, the change in efficiency with varying wave height should be dependent on the number and crest height of the reservoirs. Therefore, a reason for the decrease in efficiency for wave heights higher than 3 m for the tests by [
49,
50] could be that there are not reservoirs with a high enough crest level to efficiently capture the power available on the waves with a higher wave height. In [
24] the same tendency for an increase in the hydraulic efficiency with increasing wave height can be noticed, although not as clearly as in [
49,
50].
Margheritini [
51] estimated the hydraulic efficiency of an SSG device to be between 30% and 40%, and obtained hydraulic efficiencies of up to 43% in a numerical study of an SSG device to be implemented in the Port of Hanstholm [
52]. However, physical model tests of an SSG device by [
24] lead to a maximum hydraulic efficiency, for a particular sea state, of circa 17%, and Kofoed obtained hydraulic efficiencies between 9% and 38% [
49] and between 27% and 57% [
50]. Notwithstanding, all of these tests were performed with irregular waves, and not with regular waves. Besides, the presence of the OWC system in the HWEC module can explain, in part, the lower hydraulic efficiencies for the OWEC, as it is supposed to have a negative impact on the OWEC due to the decreased draught of its front ramp and for absorbing part of the available wave power in front of the structure. Furthermore, the chosen wave heights and wave periods combinations tested were not selected in order to take full advantage of the OWEC performance, and consequently its efficiency might not be maximized.
Notwithstanding, the OWEC device attained high hydraulic efficiencies for the tested wave conditions, reaching a maximum hydraulic efficiency of 36% for a test with
H = 1 m and
T = 8 s, with geometry A. The OWEC performed better for the lower wave periods, with the maximum hydraulic efficiencies being obtained for wave periods between 6 and 8 s, depending on the geometry tested. The obtained hydraulic efficiencies are similar to those obtained in similar studies of the SSG device [
24,
49,
50], although there are few experimental tests of the SSG, and efficiency values vary considerably amongst authors.
3.3. Joint OWC–OWEC Efficiency
The study of the innovative HWEC module designed to be integrated into a seaport breakwater, with the Port of Leixões as a reference case study, aimed at analyzing the potential advantages of combining two already proven concepts (OWC and SSG) into one. Therefore, an analysis focusing on the combined performance of both technologies was conducted in this section.
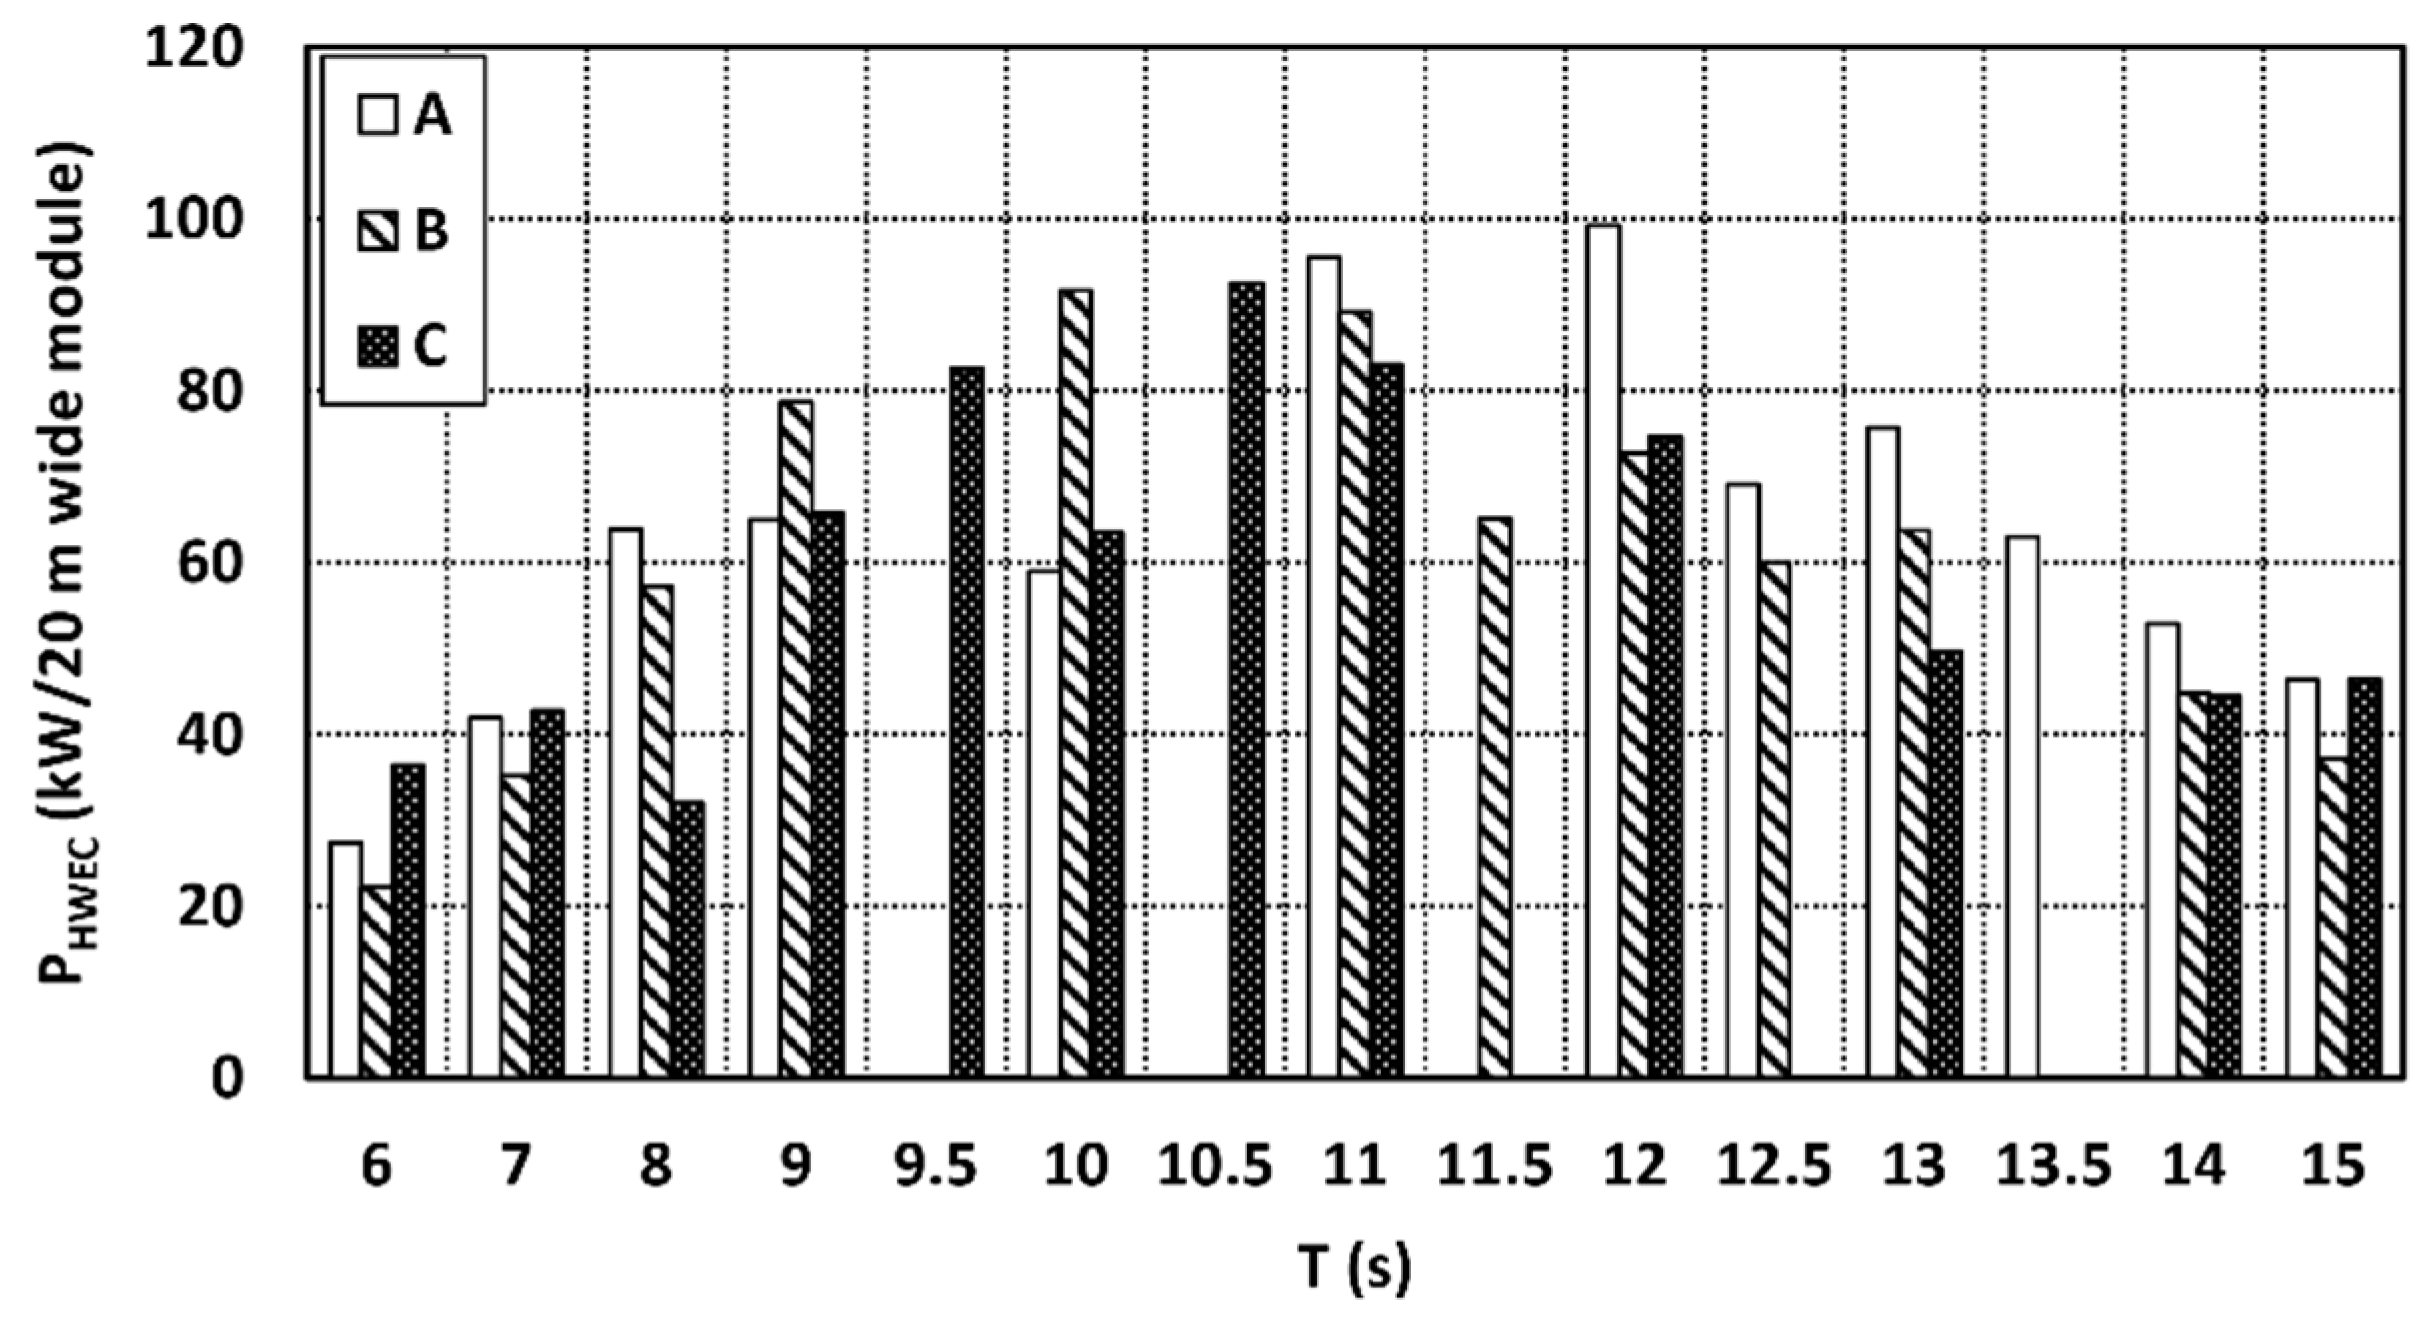
Figure 13 shows the combined hydrodynamic/hydraulic power captured by the hybrid device,
, for the tested wave periods with a (regular) wave height of 1 m. The maximum (mean) captured power was 99.3 kW for geometry A. It can also be seen that the overall power captured for all the wave periods was more constant when compared with the independent technologies (
Figure 11), which shows a significant advantage of combining two wave energy harnessing technologies, the OWC and the OWEC, into a hybrid device.
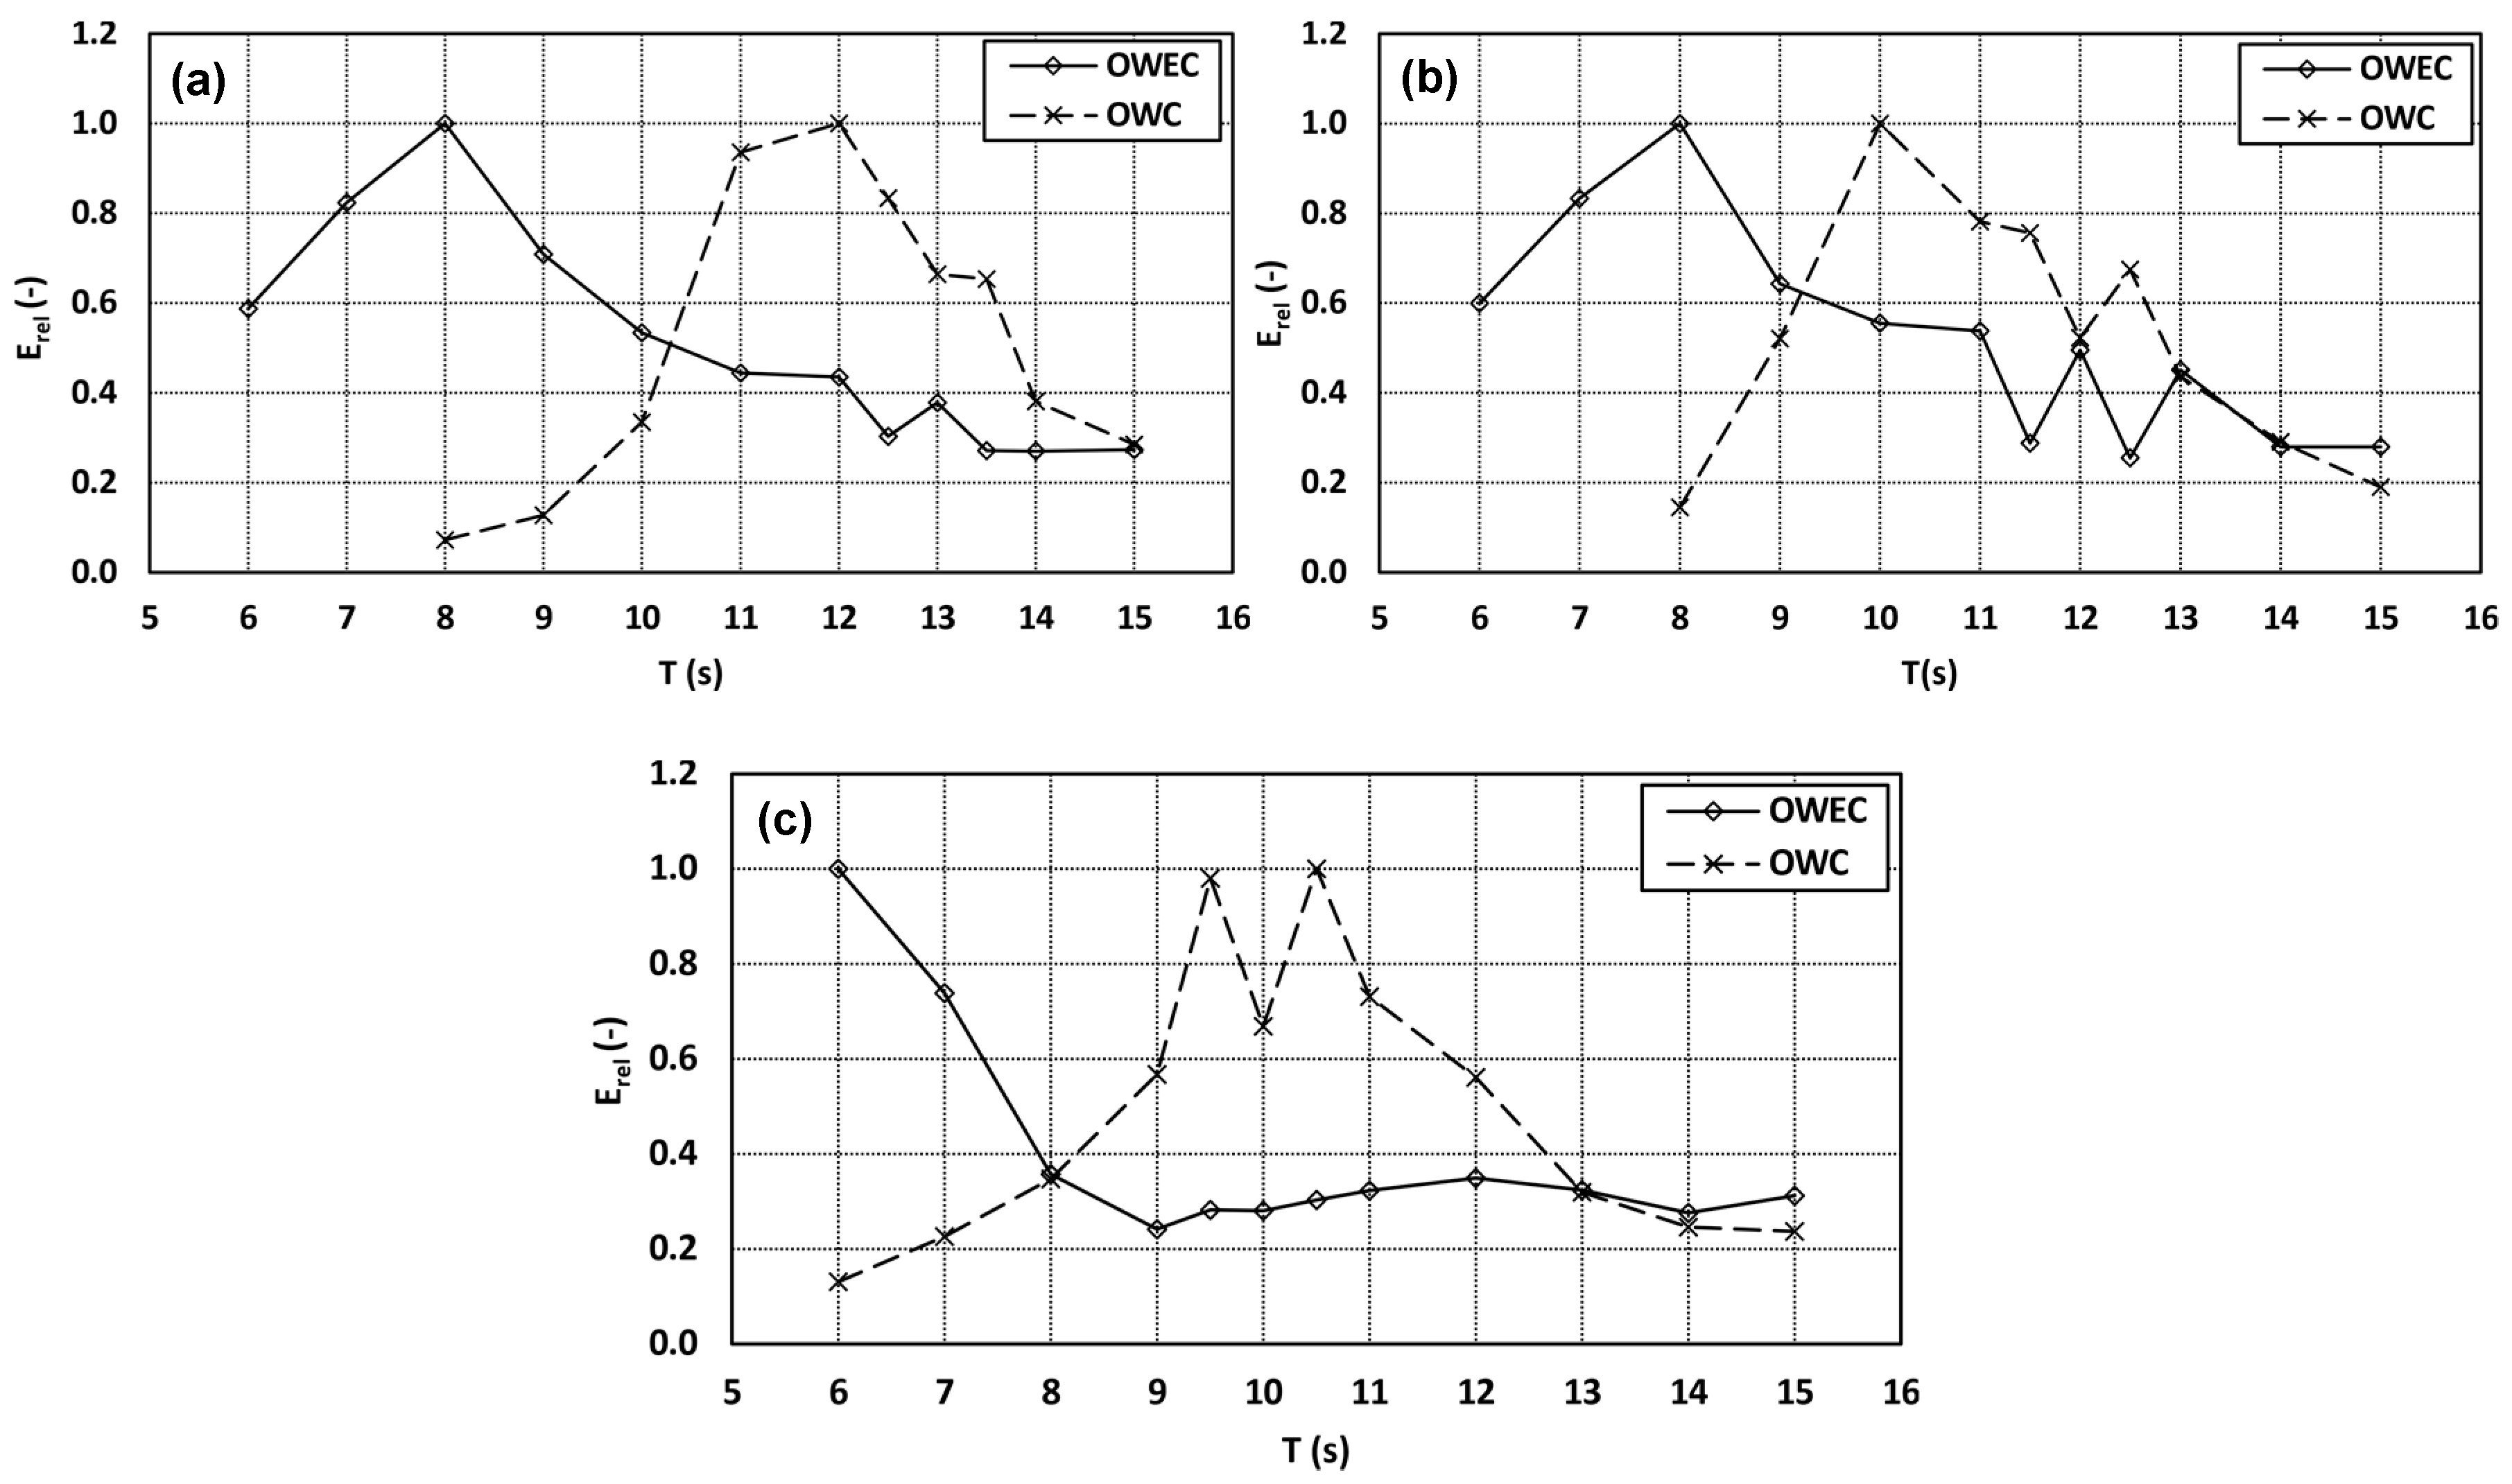
As the efficiencies of the OWC and the OWEC are significantly different for the tested wave periods, the relative efficiency,
(–), is calculated as the efficiency
(–) estimated for each wave period tested divided by the maximum efficiency
(–) of each technology, as,
Figure 14 shows the relative efficiency of the device separated by the OWC and the OWEC components. The results could be used to assess which periods each technology is better suited to efficiently extract energy.
Figure 14 shows that the two technologies complement each other well, as the OWEC works better for the lower wave periods and the OWC for the higher wave periods. This is a very important advantage of the dual-WEC system based on the OWC and OWEC technologies because it allows a more constant power production, which is usually difficult to obtain in the renewable energy sector. It is also evident that the OWC’s efficiency increased from geometry A to B to C, and that of the OWEC increased from geometry C to B to A. However, the most interesting solution should be the one with the best overall performance. Given that, the combined captured power from both the OWC and the OWEC is presented in
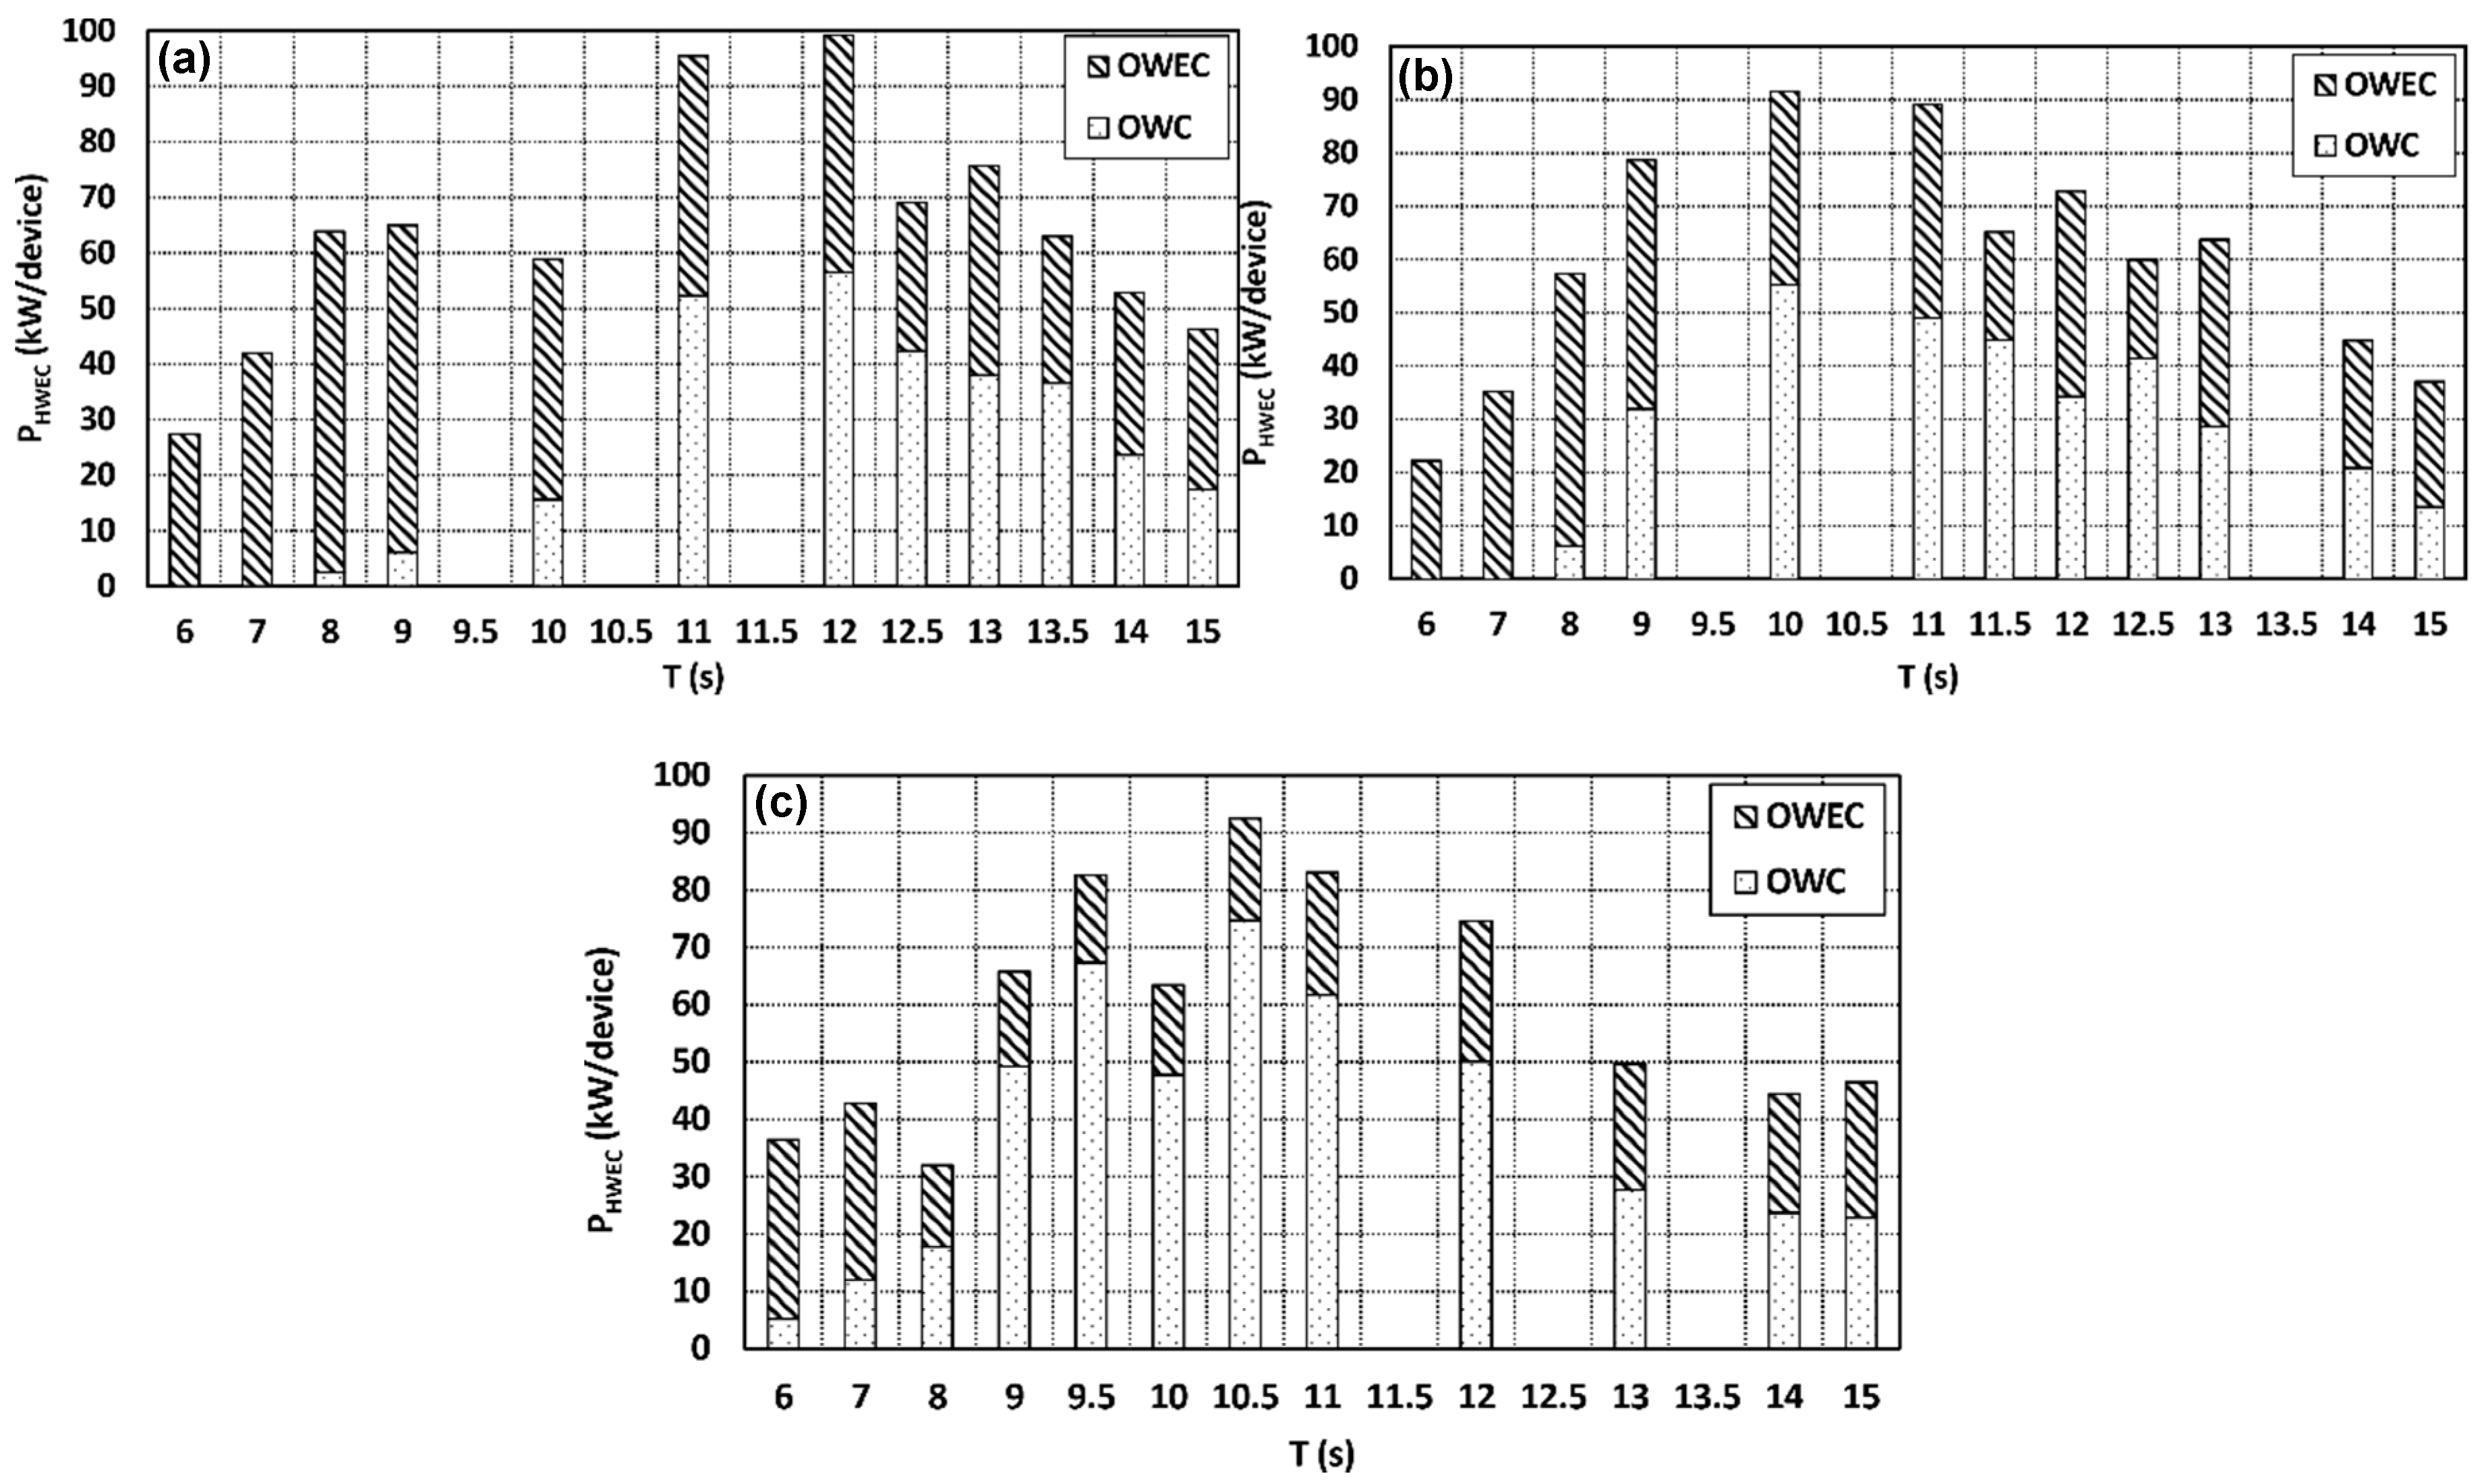
Figure 15.
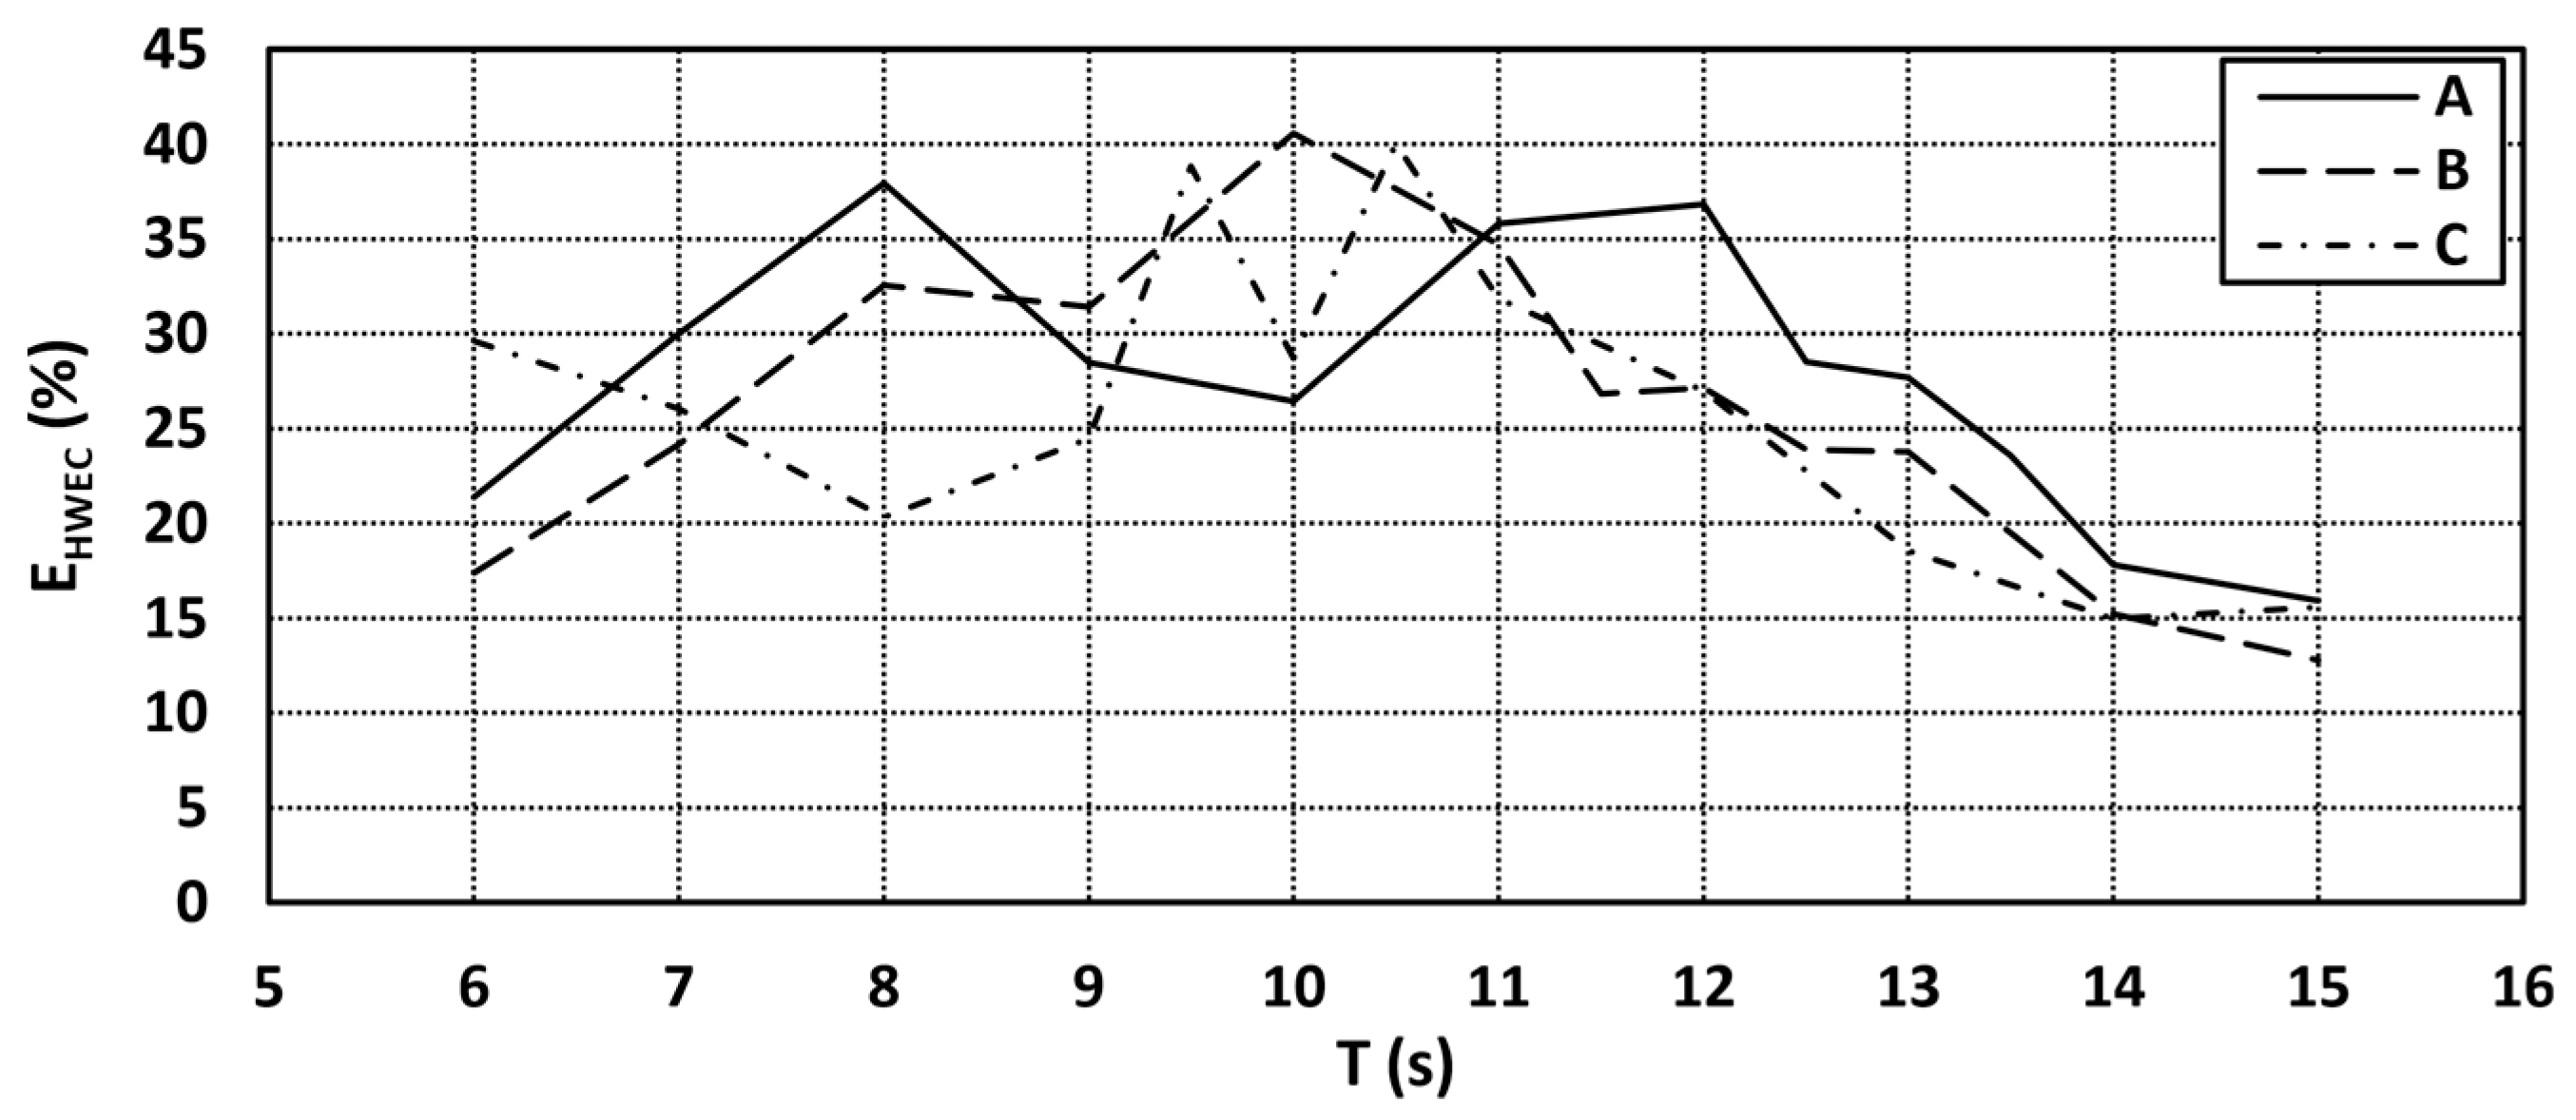
The total mean hydraulic efficiency was calculated as the total power captured by the 20 m wide HWEC module for all the tests for each geometry, divided by the total available wave power for those tests, calculated as in Equation (9), for a 20 m wide wave front,
Figure 16. The mean total hydraulic efficiency was 27.2%, 25.7% and 25.7% respectively for geometries A, B and C. The mean total hydraulic efficiencies of the three geometries were extremely close (B’s and C’s being equal), which also indicates that the chosen technologies (OWC and SSG based OWEC) complemented each other well, thus showing that adding the power production of both components led to high efficiencies for a broad range of wave conditions. On the other hand, as expected, by increasing the OWC component’s performance by changing its geometry, the OWEC component’s performance decreased, and vice-versa. The maximum hydraulic efficiencies obtained were 37.9% for geometry A (
T = 8 s), 40.6% for geometry B (
T = 10 s) and 40.0% for geometry C (
T = 10.5 s). For tests with irregular waves, the total hydraulic efficiency can be calculated by pondering the power captured with the probability of occurrence of the tested sea states and dividing by the available resource. This allows an accurate estimation of the HWEC module performance in a real environment, which will be discussed in future works.
However, it should be pointed out that the tests performed with H = 1 m did not favor the OWEC component of the HWEC module, because its power capture increased with the wave height. Notwithstanding, further optimization of the HWEC module developed in this project was planned and should significantly increase its efficiency.
4. Conclusions
In the SE@PORTS project a hybrid wave energy converter combining an OWC and an OWEC device integrated into a rubble-mound breakwater was developed, optimized and experimentally tested. For that, the wave climate near the case study port, the Port of Leixões located in the North of Portugal, was characterized and the device developed to be integrated into the provisional layout of the structure designed for the extension of the North breakwater of the Port of Leixões. Forty-two tests with regular wave conditions were carried out in the wave basin of the Hydraulics Laboratory of the Hydraulics, Water Resources and Environment Division of the Faculty of Engineering of the University of Porto. The present paper analyzed the results of the tests to assess the hydraulic behavior and performance of the innovative HWEC module, and to determine the advantages and disadvantages of the hybrid solution.
The OWC device attained high hydrodynamic efficiencies for the tested wave conditions, reaching a maximum hydrodynamic efficiency of 129% (efficiency calculated considering a 5 m wave front, which corresponded to the width of the OWC intake). The OWC performed better for wave periods above 9.5 s, with maximum hydrodynamic efficiencies obtained for wave periods between 10 and 12 s, depending on the tested geometry. The obtained hydrodynamic efficiencies are considered high when compared to similar experimental tests, such as those mentioned in [
36,
44,
48], although of the same order.
The OWEC device attained high hydraulic efficiencies for the tested wave conditions, reaching a maximum hydraulic efficiency of 36% for a test with
H = 1 m and
T = 8 s, with geometry A. The OWEC performed better for the lower wave periods, with the maximum hydraulic efficiencies being obtained for wave periods between 6 and 8 s, depending on the geometry tested. The obtained hydraulic efficiencies are similar to those obtained in similar studies of the SSG device [
24,
49,
50].
The performance of the HWEC module combining the OWC and the OWEC technologies was assessed, and it was concluded that the hybridization lead to a device with higher efficiencies than its independent components, for a broader range of wave conditions. This leads to a more constant power production and less prominent power production peaks, therefore being able to better supply the energy demand. Moreover, the chosen technologies, OWC and OWEC, complemented each other well as they work better for different conditions. The OWEC was more efficient for the lower wave periods tested and the OWC for the higher. Consequently, the range of wave conditions for which the device’s power production is low was reduced. This is a very positive aspect as the key disadvantage of renewable resources relative to conventional generation is its stochastic nature [
53].
It was shown that the hybridization of an OWC and an OWEC could bring considerable benefits, such as reducing dependency on the characteristics of wave conditions to produce power. However, the developed hybrid device needs further research and optimization works. Namely, other options combining both technologies should be studied, and tests with irregular wave conditions and annual produced energy estimations should be carried out. Furthermore, the wave loading on the device should be assessed to better predict the structural viability of integrating the device into seaport’s breakwaters, as these structures’ main function is to protect the inner parts of seaports. Finally, an economic study should be performed to assess the commercial viability of the concept.

 ,
, 


