Article

Comparative Analysis of On-Board Methane and Methanol Reforming Systems Combined with HT-PEM Fuel Cell and CO2 Capture/Liquefaction System for Hydrogen Fueled Ship Application

1
R&D Division, Korean Register, 36, Myeongji Ocean City 9-ro, Gangseo-gu, Busan 46762, Korea
2
Division of Marine System Engineering, Korea Maritime and Ocean University, 727 Taejong-ro, Yeongdo-Gu, Busan 49112, Korea
3
Department of Mechanical and Information Engineering, University of Seoul, Seoulsiripdaero 163, Dongdaemun-gu, Seoul 02504, Korea
*
Author to whom correspondence should be addressed.
Energies 2020, 13(1), 224; https://doi.org/10.3390/en13010224
Submission received: 4 December 2019 / Revised: 20 December 2019 / Accepted: 25 December 2019 / Published: 2 January 2020
(This article belongs to the Special Issue Fuel Cell Renewable Hybrid Power Systems)

Abstract

:
This study performs energetic and exergetic comparisons between the steam methane reforming and steam methanol reforming technologies combined with HT-PEMFC and a carbon capture/liquefaction system for use in hydrogen-fueled ships. The required space for the primary fuel and captured/liquefied CO2 and the fuel cost have also been investigated to find the more advantageous system for ship application. For the comparison, the steam methane reforming-based system fed by LNG and the steam methanol reforming-based system fed by methanol have been modeled in an Aspen HYSYS environment. All the simulations have been conducted at a fixed Wnet, electrical (475 kW) to meet the average shaft power of the reference ship. Results show that at the base condition, the energy and exergy efficiencies of the methanol-based system are 7.99% and 1.89% higher than those of the methane-based system, respectively. The cogeneration efficiency of the methane-based system is 7.13% higher than that of the methanol-based system. The comparison of space for fuel and CO2 storage reveals that the methanol-based system requires a space 1.1 times larger than that of the methane-based system for the total voyage time, although the methanol-based system has higher electrical efficiency. In addition, the methanol-based system has a fuel cost 2.2 times higher than that of the methane-based system to generate 475 kW net of electricity for the total voyage time.

Graphical Abstract

1. Introduction

The International Maritime Organization assessed that international shipping accounted for about 2.2% of total carbon dioxide emissions in 2012, which is approximately 796 million tonnes of CO2, and forecasted that this amount will increase between 50% and 250% in the period to 2050 under a business-as-usual scenario [1]. However, when the Paris Agreement on climate change mitigation was adopted in 2015 to deal with the global-warming concerns, shipping was not included [2]. Instead, in April 2018, the IMO established a strategy to reduce the total amount of annual greenhouse gas (GHG) emissions from shipping by at least 50% by 2050 compared to 2008 [3]. To achieve this, several technical and operational measures that improve energy efficiency and reduce CO2 emissions in the shipping industry should be introduced, such as increasing energy efficiency of engines, adopting waste heat recovery systems, improving the hull form, implementing speed reduction and alternative sea routes [4]. In addition to the above measures, using different propulsion systems, such as fuel cells, are also considered possible alternatives [5]. Hydrogen fuel cells emit no direct GHGs, but the emissions generated during hydrogen production should be considered. The emissions from hydrogen production are highly dependent on feedstock and primary energy sources [6]. In the shipping industry, fuel cell power generation can eliminate NOx, Sox, and particulate material (PM) emissions, and reduce CO2 emission compared to emissions from conventional diesel engines [2]. The advantage of fuel cells for maritime applications is the reduction of noise, vibrations, and infra-red signatures, along with their modular and flexible design, water generation, etc., although they may be application specific [5]. Seven fuel cell types were evaluated from the perspectives of relative cost, module power level, lifetime, tolerance for cycling, flexibility towards type of fuel, technological maturity, size, sensitivity to fuel impurities, emissions, safety, and efficiency. As a result of the evaluation, the low temperature proton exchange membrane (PEM) fuel cell and the high temperature PEM fuel cell (HT-PEMFC) received, respectively, the first and second highest score in the ranking, and this implied that those technologies are the most promising for marine use [7]. An LT-PEMFC has relatively higher power density than an HT-PEMFC; however, the HT-PEMFC has several other advantages [8]. The operating temperature of LT-PEMFCs is between 50 and 90 °C and that for HT-PEMFCs is between 120 and 200 °C. The lower operational temperature of LT-PEMFCs results in limited tolerance to fuel impurities such as sulfur and carbon monoxide (CO), which reduce its performance drastically. To be specific, LT-PEMFCs require fuels containing less than 30 ppm of CO and less than 1 ppm of sulfur, whereas HT-PEMFCs can work with concentrations of up to 3% of CO and 20 ppm of sulfur in the fuel without permanent degradation [7]. This higher tolerance to impurities of HT-PEMFC makes it possible to develop a simpler fuel reforming system [8]. Additionally, the water management of HT-PEMFCs is easier because the water produced in the fuel cell is in vapor, and the waste heat from HT-PEMFCs can be recovered and used for steam or hot water generation [9].
Since the gravimetric energy density of hydrogen is approximately 120 MJ/kg, 2.47 times higher than natural gas and 2.8 times higher than diesel, hydrogen provides higher gravimetric energy than other fossil fuels. However, volumetric energy density of liquid hydrogen is approximately 8.51 GJ/m3, which corresponds to 40.8% of natural gas and 23.7% of diesel [10]. The lower volumetric energy density could be a drawback for some vessels in those applications that cannot support a large volume of storage or higher frequency of refueling [11]. To overcome this, several maritime fuel cell studies have considered on-board reforming of methane and methanol to hydrogen, although the applied fuel cell types are different [5,12,13,14,15,16,17,18,19,20]. This is because methane and methanol stored at liquid state have higher volumetric energy density than hydrogen [10], and the operation expenditure (OPEX) can be reduced owing to the lower price of both fuels compared to that of hydrogen. In addition, the bunkering infrastructure for methane and methanol is not an issue, unlike that for hydrogen. The bunkering infrastructure for methane (namely LNG) is rapidly expanding, and that for methanol requires minimal modification from the existing conventional infrastructure [5,12].
There are several technologies for reforming carbon-based fuels to hydrogen, which include steam reforming, partial oxidation, and auto-thermal steam reforming. Among these processes, steam reforming provides higher efficiency, higher production yield, and lower rate of side reactions [21].
Steam methane reforming is one of the most proven and commercially available technologies for hydrogen production [22], and at present, 80% to 85% of global hydrogen production is derived via this technology [23,24]. Steam methane reforming technology has been widely investigated from the energy and exergy efficiency and economic and environmental perspectives in the past decades.
Simpson et al. evaluated the performance of steam methane reforming system using an exergy analysis. The results revealed that irreversibility of chemical reactions results in the largest amount of exergy destruction, and exergy loss through the exhaust gas stream was significant. Results of a parametric study show that the highest exergy efficiencies of 62.73% was achieved at operating temperatures of 974 K. The highest exergy efficiencies of 62.85% was attained at an operating pressure of 6.8 atm. The effect of steam carbon ratio (S/C ratio) was also investigated, and the result revealed that the highest efficiencies were achieved at an S/C ratio of approximately 3.2 [23]. Welaya et al. evaluated the partial oxidation and steam reforming process to convert a carbon-based marine fuel, such as natural gas, gasoline, and diesel, into hydrogen-rich gases suitable for application to the PEMFCs on board ships. Among several options evaluated, the natural gas steam reforming system showed the highest fuel processing efficiency [14]. Authayanun et al. investigated the theoretical performance of an HT-PEMFC integrated with the steam reformer using various primary fuels, i.e., methane, methanol, ethanol, and glycerol. Results revealed that for the steam methane reforming, CO fraction lower than the acceptable limit for the HT-PEMFC can be attained with higher S/C ratios and lower temperature. For S/C ratios (3–6), operating temperature lower than 1000 K should be maintained in order to keep the CO fraction at an acceptable level for an HT-PEMFC or a water–gas shift (WGS) reactor should be included. Steam methanol reforming produces the lowest CO fraction among the studied fuels and can be directly fed to the HT-PEMFC for all of the studied cases (S/C ratio: 1–3, reformer temperature: 423–523 K). The steam methanol reforming system without a WGS reactor and steam methane reforming with a WGS reactor achieved the highest system efficiency, approximately 50%, among several options in the study [25]. Nerem et al. evaluated hydrogen, LNG, or methanol as PEMFC fuel on a cruise vessel, based on the space required on board, environmental impact, and life cycle cost (LCC) aspects. An external reformer other than hydrogen fuel was considered. Results show that the LNG system requires the smallest dimensions, whereas hydrogen and methanol require equal dimensions. From the perspective of environmental impact, LNG is a better solution than methanol for use in fuel cells. Further, LNG achieved the lowest LCC, 1.10 times higher than heavy fuel oil (HFO), while hydrogen and methanol are 1.14 and 1.15 times more expensive than HFO [12]. Arsalis et al. evaluated a micro combined heat and power system integrated with HT-PEMFC and steam methane reformer. They reported that the cogeneration and electrical efficiencies of the system are 55.46% and 27.62%, respectively [26].
Methanol is an advantageous fuel for mobile fuel cell applications since it has low boiling temperature (65 °C). Therefore, it can be stored in a liquid state at atmospheric pressure and normal environment temperature, unlike liquefied methane (−163 °C) [27,28]. In addition, as no carbon–carbon bond exists, methanol can be converted to hydrogen at lower temperature (150–350 °C) than other carbon-based fuels, and it can be activated at lower temperature than methane [28]. With these advantages, methanol steam reforming has been widely developed. Faungnawakij et al. has investigated the effect of varying S/C ratio (0–10), reforming temperatures (25–1000 °C), and pressures (0.5–3 atm) on the steam methanol reforming process. Results show that the optimized operating condition based on efficiency was the temperature range of 100–225 °C, S/C range of 1.5–3, and pressure at 1 atm. In addition, an operating temperature higher than approximately 150 °C and operating pressure varying from 0.5 to 3 atm did not affect the methanol conversion and hydrogen yield [21]. Herdem et al. modeled the methanol steam reforming system to produce power using a HT-PEMFC for portable power generation and examined performance variation of the HT-PEMFC with varying composition of reformate gas. The result reveals that lower S/C ratio and higher reforming temperature increase CO mole fraction in the reformed gas. However, higher fuel cell temperatures decrease the effect of CO mole fraction on the HT-PEMFC performance [27]. Mousavi Ehteshami and Chan analyzed the steam reforming of methanol, ethanol, and diesel in a technical and economical point of view. It was found that steam methanol reforming showed the easy conversion and the highest energy efficiency. Therefore, methanol is considered to be one of the promising fuels for hydrogen production by using steam reforming. However, the model used in the study did not take into account heat recovery and heat integration in the system. Therefore, it is possible that the efficiencies of fuels with higher reforming temperature than methanol can be increased when heat recovery and integration are applied [29]. Romero-Pascual and Soler investigated an HT-PEMFC-based CHP system integrated with a methanol steam reformer. The result reveals that 24% of system power efficiency and a CHP efficiency over 87% were achieved [9]. Table 1 summarizes the simulation parameters about steam methane and steam methanol reforming system from other works.
Although steam reforming of methane and methanol on board ships offers several advantages as aforementioned, CO2 emission will be unavoidable because these are carbon-based fuels [15]. One of the future options for carbon-based fuels could be to install carbon capture and storage (CCS) systems on board ships [2]. If hydrogen production by reforming a carbon-based fuel is applied on board ships, the resulting CO2 can be captured by using a CCS, and then the produced hydrogen can be considered as a zero-emission fuel at the ship level [2]. The use of CCSs on board ships was investigated in an Eurostar project. On-board chemical capture, CO2 liquefaction, and a temporary storage system for ships were developed. The result shows that the concept is technically feasible and capable and can reduce CO2 emissions by 65% [35].
There are several technologies for CO2 capture in hydrogen production, which include adsorption, absorption, use of membranes, and cryogenic/low temperature processes [36,37]. Among them, the absorption process using monoethanolamine (MEA) is the most mature and promising process for CO2 capture [38,39]. Many authors have presented hydrogen production processes associated with the MEA absorption process [30,40,41]. The MEA absorption process comprises two major stages: Absorption of CO2 in the absorber and desorption of CO2 in the stripper to regenerate the amine solvent. One of the drawbacks of this process is the large amount of heat required to regenerate the amine solvent [42,43]. Typically, regeneration occurs at an elevated temperature (100–140 °C) and pressure not much higher than the atmospheric [38,44,45]. The heat required for regeneration is supplied to the re-boiler by a separate steam cycle [43].
The challenge in the marine environment is the handling and storage of any captured CO2. Storage of CO2 in gaseous form requires a huge space, whereas the storage of CO2 in liquid form requires a large amount of power consumption for its liquefaction. Considering the limited space of the vessel, the captured CO2 should be stored in a liquid form even if the energy consumption for liquefaction is high. The pressure and temperature of the liquid CO2 for storage should be higher than the triple-point pressure (5.2 bar) and lower than the critical-point temperature (31 °C). In the published reports, the pressure of liquid CO2 for shipping is mainly in the range from 6 to 20 bar, and in this range of pressure the temperature varies form −52 to −20 °C [46]. Feenstra et al. conducted a technical and economic evaluation of ship-based carbon capture on diesel or LNG fueled ships. For the LNG fueled ships, the cooling energy from evaporation of the LNG was used for liquefying the captured CO2. For diesel fueled ships, the ammonia-based refrigeration cycle was used for liquefaction of CO2 [47]. Berstad et al. evaluated the energy consumption and CO2 liquefaction ratio for CO2 phase separation from the flue gas. The result reveals that the specific power consumption and CO2 liquefaction ratio are significantly affected by CO2 concentration in flue gas. To maximize the CO2 capture ratio by liquefaction, the concentration of gases other than CO2 in the flue gas should be minimum and pressure should be as high as practically possible [48].
The authors of this study consider that to achieve zero emission from shipping alternative fuels such as green hydrogen from renewable energy should be applied. However, the storage volume for hydrogen, lack of infrastructure for hydrogen bunkering, and high cost of hydrogen, among other factors, are challenging at the current level of technology. Therefore, on-board methane and methanol steam reforming with CO2 capture could be one of the transition solutions.
Therefore, in this study, we present on-board methane and methanol steam reforming systems integrated with an HT-PEMFC system for power generation, along with a CO2 capture/liquefaction system for storage of the captured CO2 on board. The performance of the integrated systems was evaluated through an exergy and energy analysis. In addition, the spaces required for the captured CO2 and primary fuel storage were also compared. Those evaluations were carried out for a reference ship. The following features distinguish this study from previous works:
(1)
Steam reforming, HT-PEMFC, and CO2 capture/liquefaction systems are simultaneously considered. Heat integration and recovery were implemented for practical comparison. Excess heat from the HT-PEMFC and steam reforming system were used in the CO2 capture system.
(2)
For the steam methane reforming-based system, liquefied natural gas (LNG) was used as primary fuel because it is the most cost effective for ship storage of natural gas and has been well proved in LNG fueled-ship applications.
(3)
For CO2 liquefaction, the steam methane reforming-based system used the cold energy of LNG, whereas the steam methanol reforming-based system has a separate refrigeration cycle.
The main objectives of this study are as follows:
(1)
To develop methane and methanol steam reforming systems combined with HT-PEMFC and CO2 capture/liquefaction systems suitable for the reference ship.
(2)
To carry out exergy and energy analyses for the developed integrated systems to assess the energy efficiency, exergy efficiency, and exergy destruction of components within each system.
(3)
To evaluate the overall fuel cost and overall space required for storage of the liquefied CO2 and primary fuels.
(4)
To carry out parametric studies with varying operating conditions, such as the S/C ratio, operating temperature of the reforming process, and CO2 capture ratio.

2. System Description

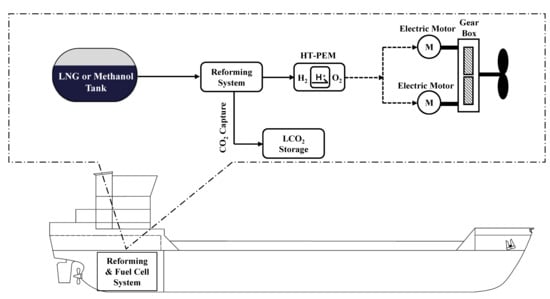
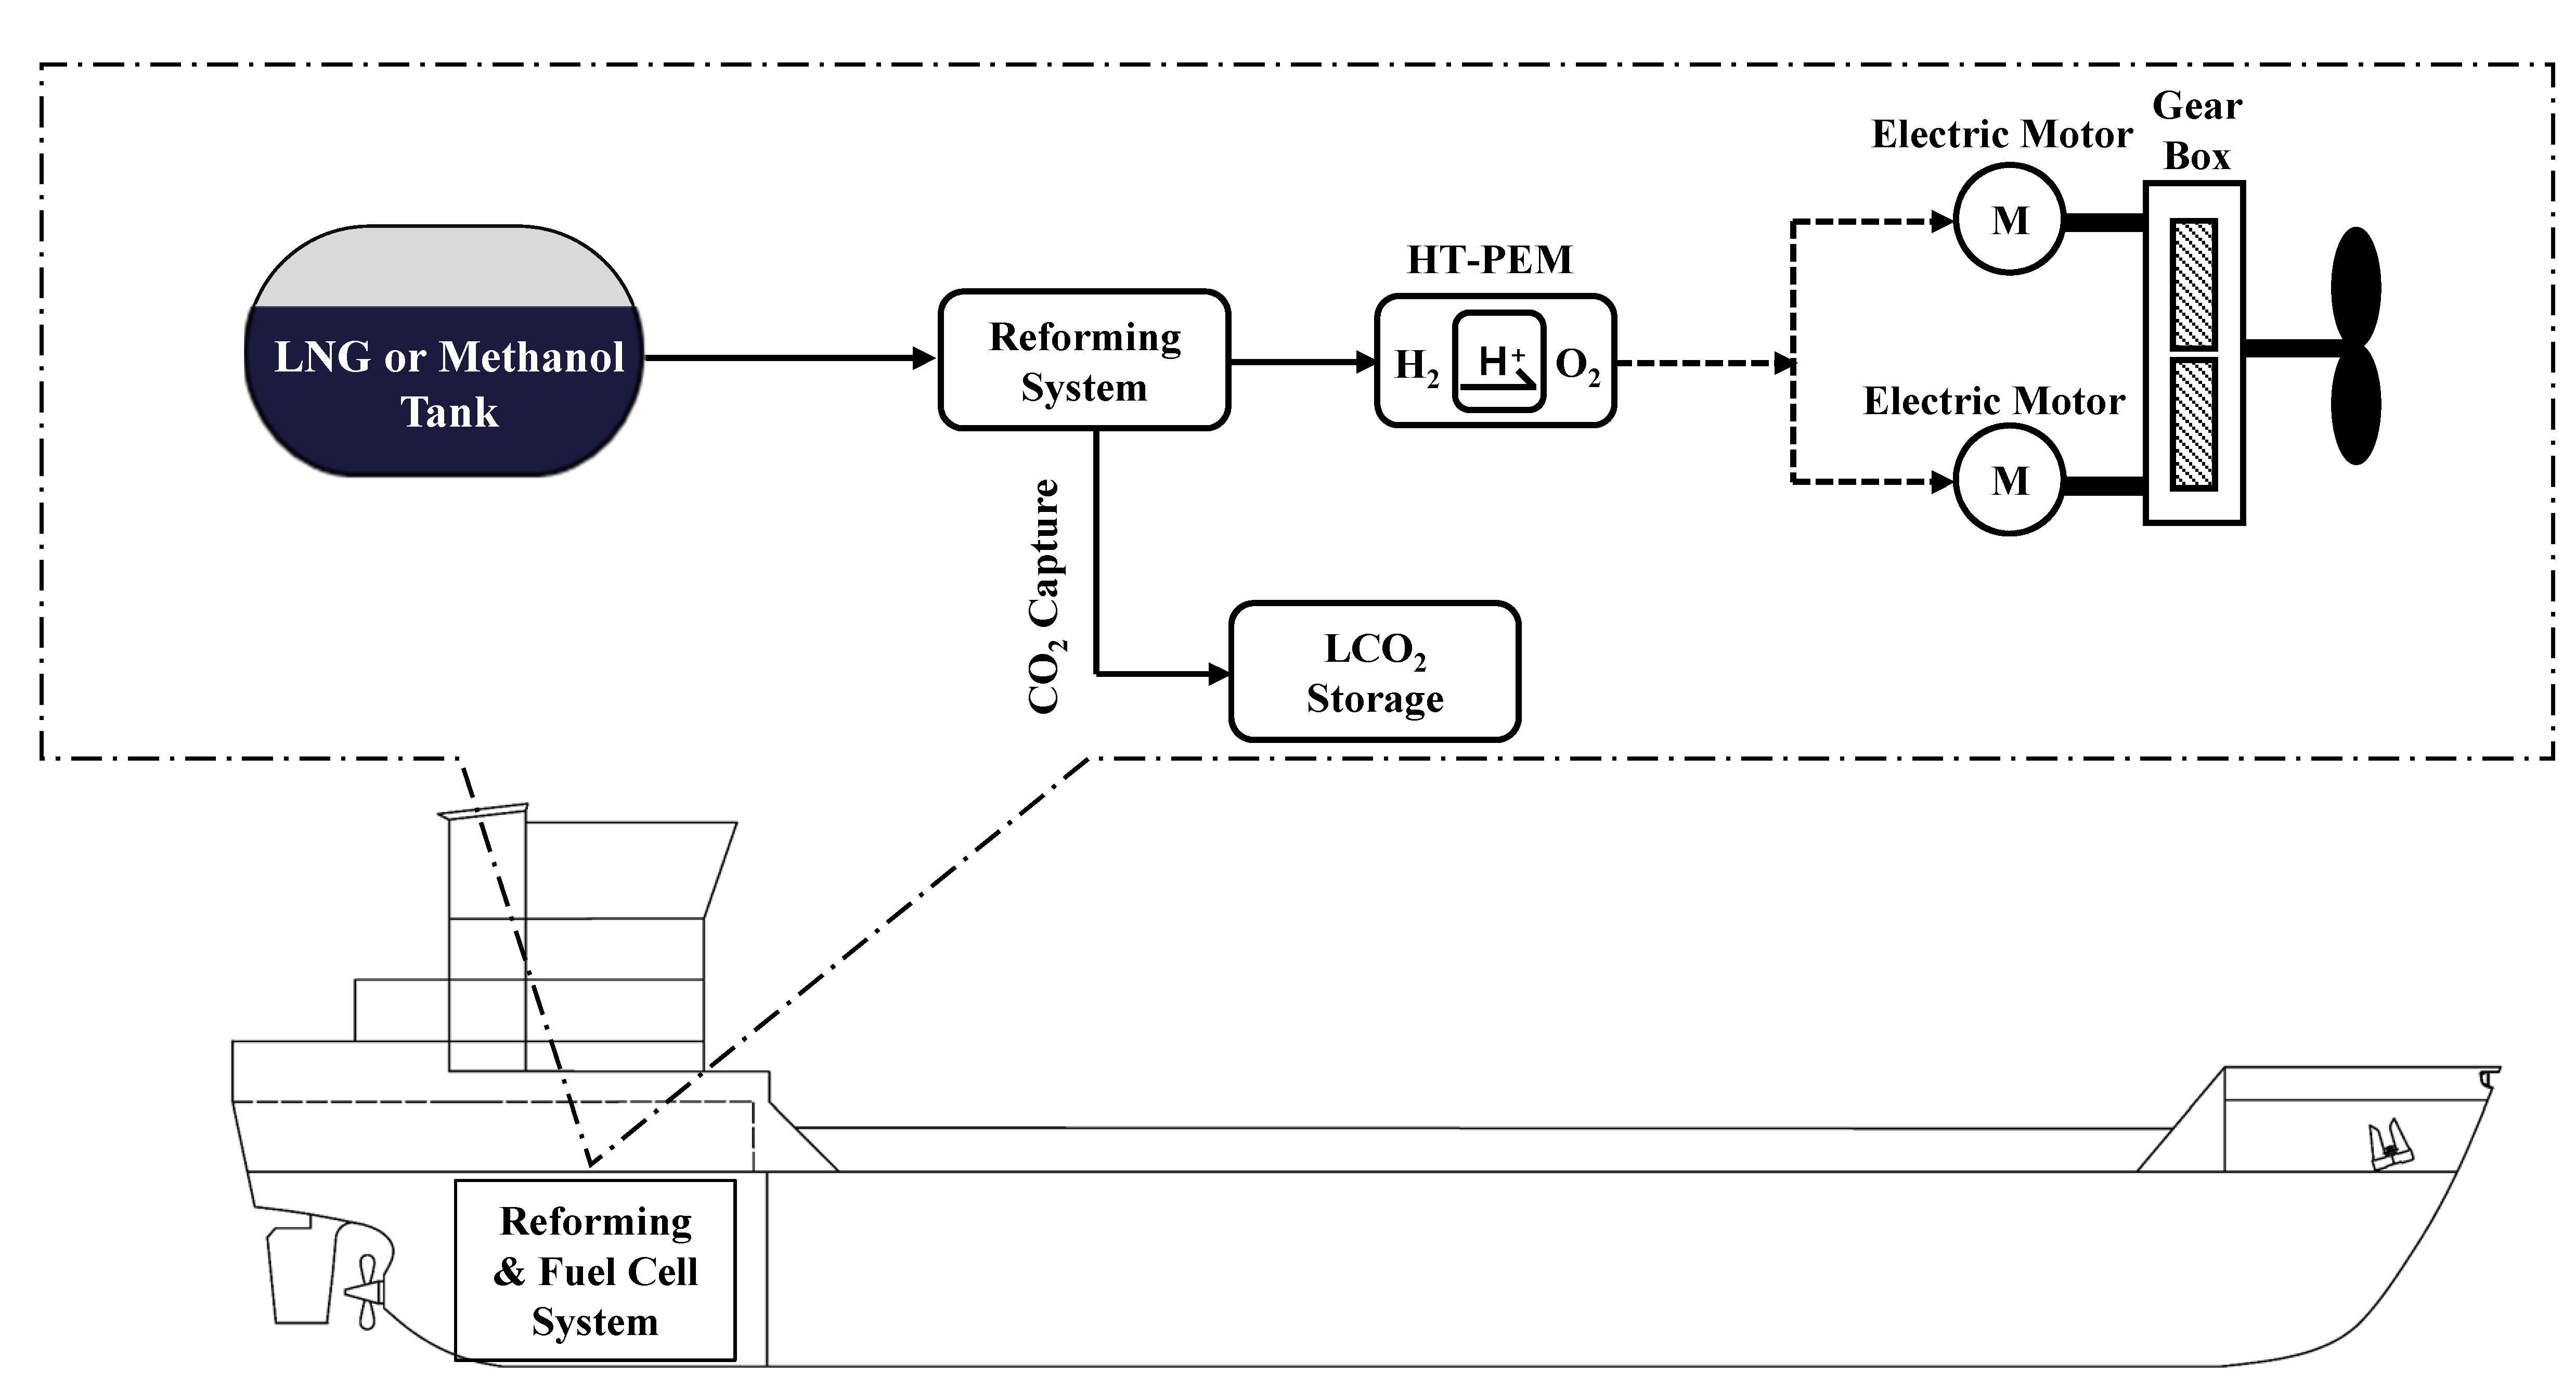
2.1. Reference Ship Description

A general cargo ship with main engine power of 3800 kW is chosen as the reference ship for integrating the steam reforming, HT-PEMFC and CO2 capture/liquefaction systems. Although the operational engine load depends on the ship design, in general, it can be much smaller than the engine total capacity [48]. Therefore, in this study, the systems are designed based on the average shaft power. This approach allows a more precise evaluation of the amount of CO2 emissions and energy consumption for CO2 capture/liquefaction on board. To calculate the average shaft power, a load factor that indicates the fraction of power needed by the engine to navigate at the average speed was calculated by using the average and maximum speeds. The product of load factor and total installed engine power (MCR) provides the average shaft power. The formulas for load factor and average shaft power are presented in the equations below. The detailed specifications of the reference ship, including the calculated load factor and average shaft power, are presented in Table 2 [49].
Load   factor = ( Average   Speed Max   Speed ) 3
Average   shaft   power   [ kW ] = Load   factor · MCR   [ kW ]
In the present study, for simplicity of system design, we only considered the power required for propulsion excluding other hotel powers.

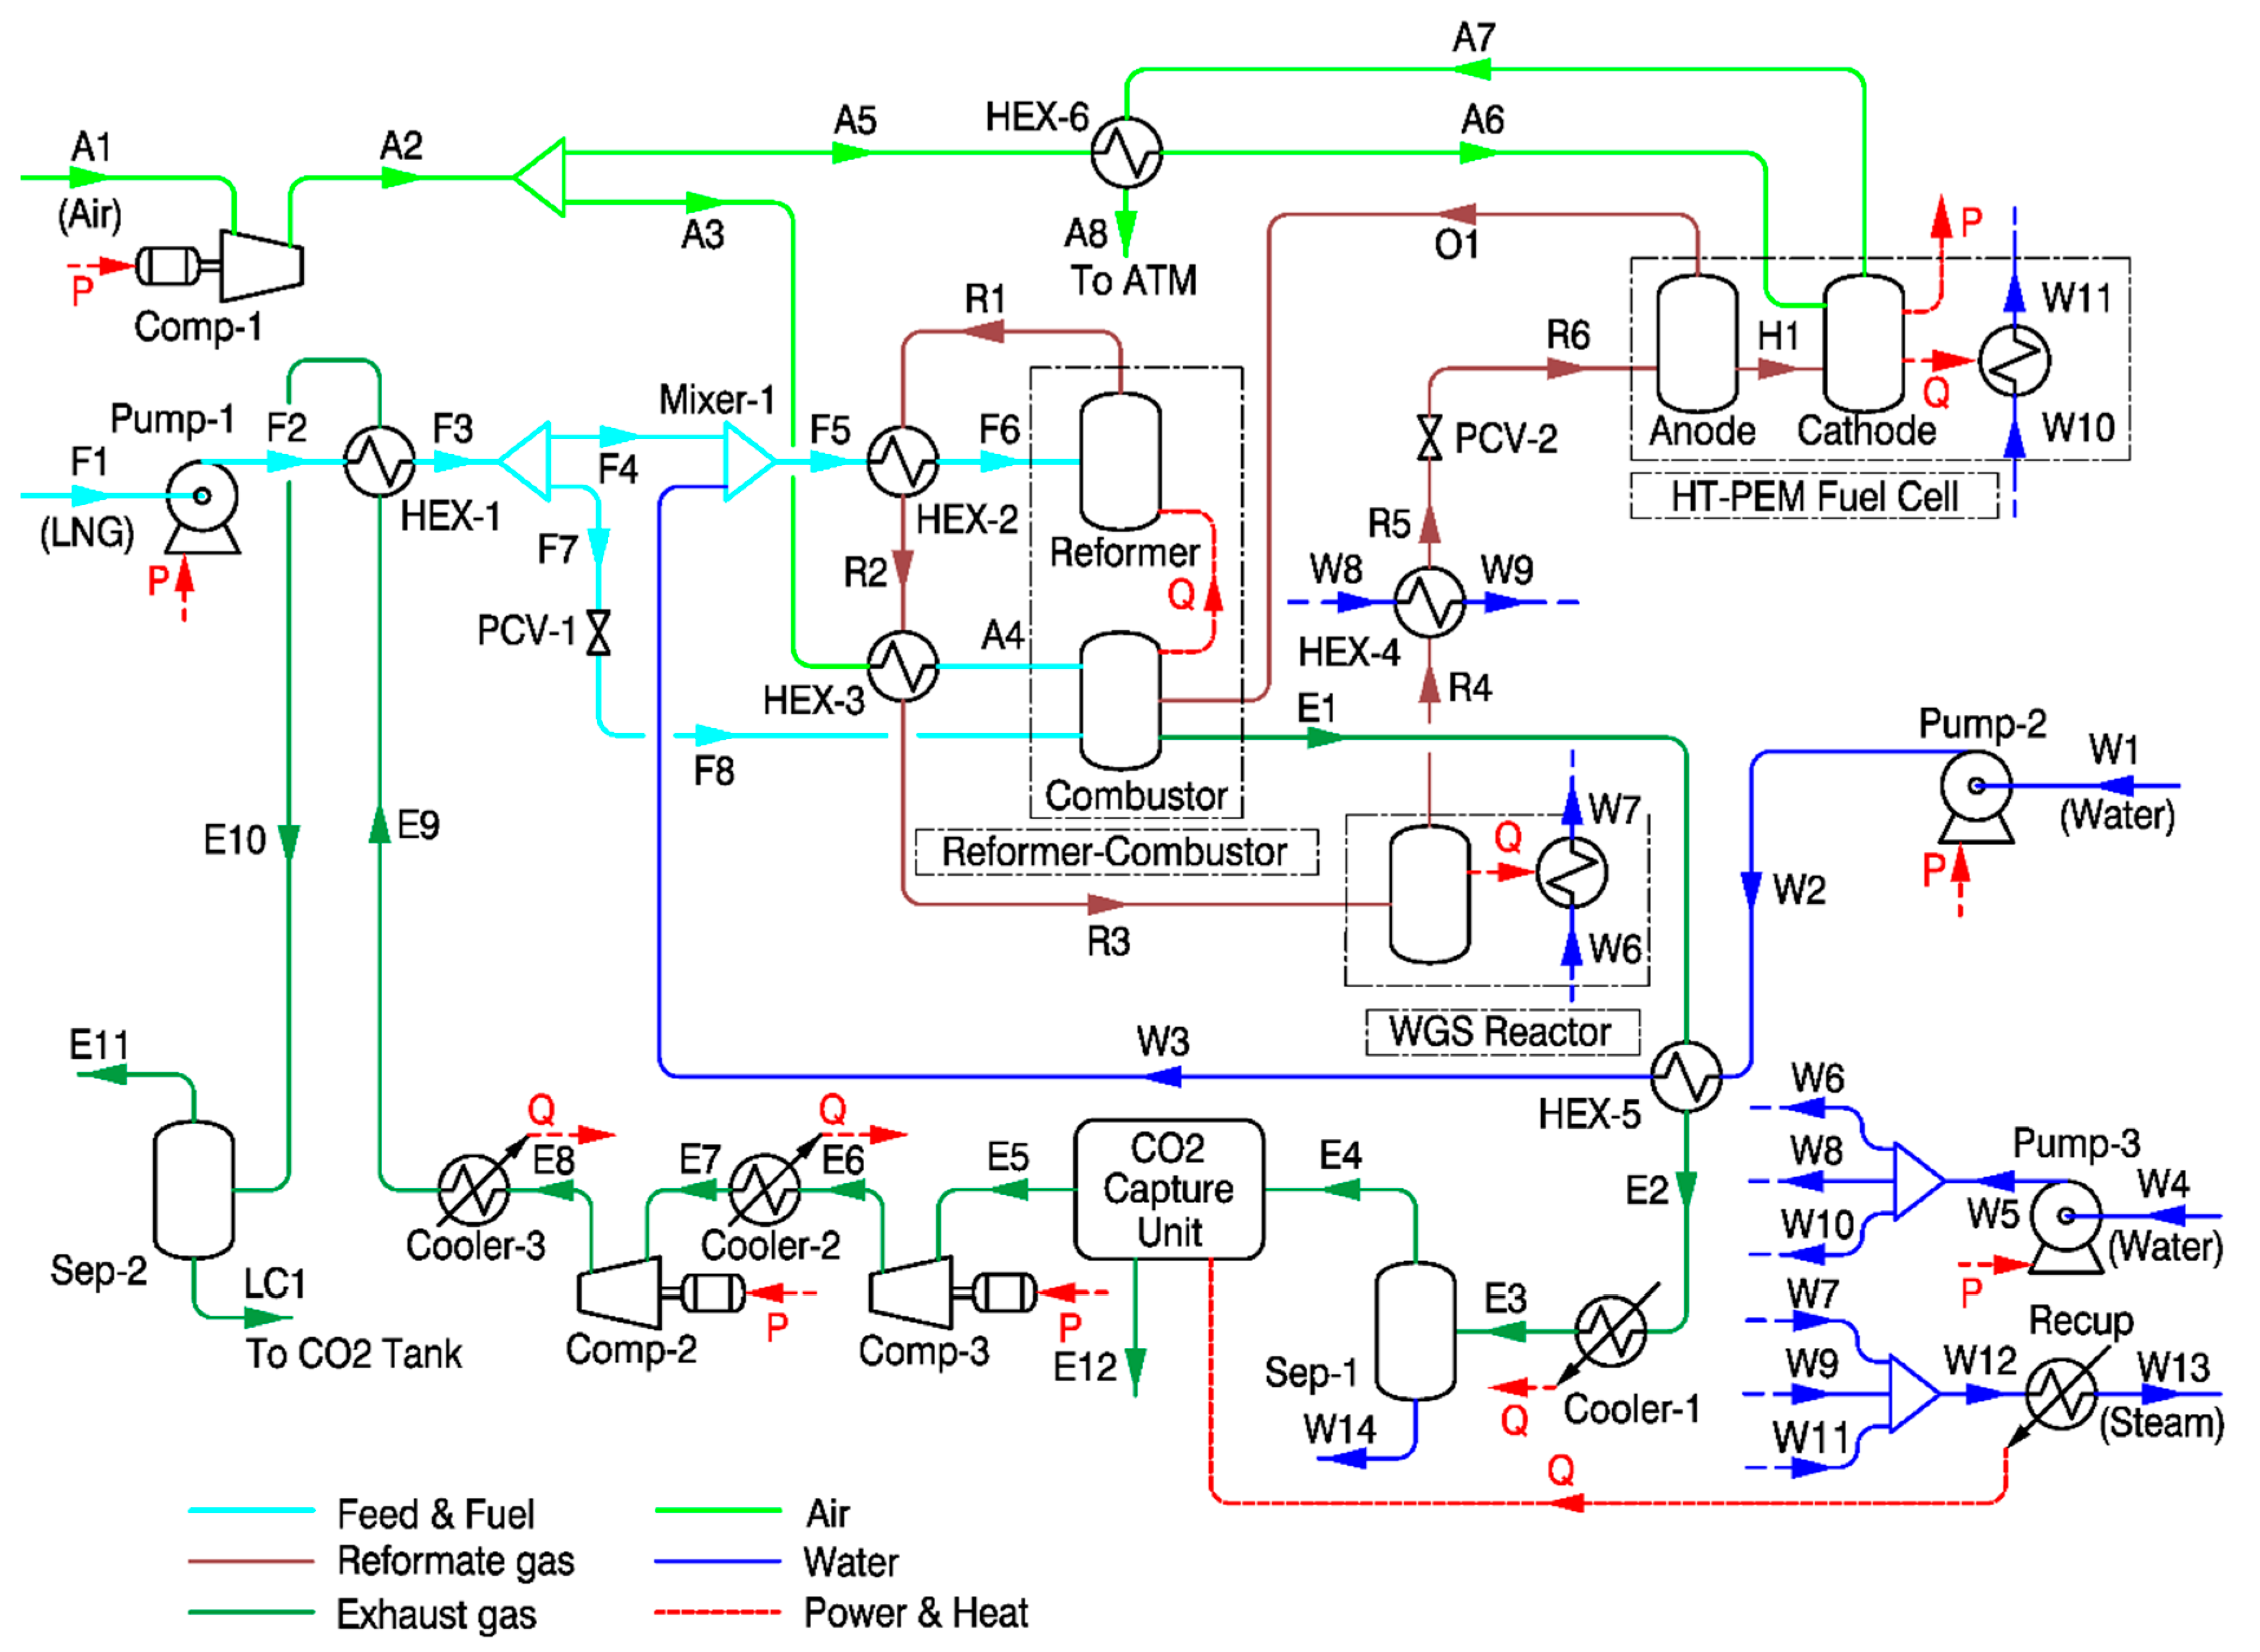
2.2. Description of Steam Methane Reforming-Based System

Figure 1 shows the block diagram of the steam methane reforming system combined with HT-PEMFC and CCS on board ships. The integrated system consists of six main unit/systems: Reformer for producing reformate gas, combustor for providing heat to reformer, WGS reactor for conversion of CO to CO2, HT-PEMFC for power generation, CO2 capture unit, and CO2 liquefaction system for storage.
Natural gas is normally used as feedstock for steam methane reforming and it normally contains small amounts of sulfur compounds, which must be removed to avoid contamination of the catalyst in the reformer and low temperature shift reactor [50]. However, in the proposed system, LNG was considered as feedstock for reforming. As an industry practice, prior to liquefaction, natural gas is further treated to remove sulfur compounds along with water and any residual CO2 to avoid freezing [51]. Therefore, a desulfurization unit was not included in this study. As shown in Figure 2, liquefied from an on-board storage tank is pumped and vaporized by heat exchange with the captured CO2 in HEX-1. Then, the vaporized CH4 is divided into two streams: One as feedstock for reforming (stream F4), the other as fuel for the combustor (stream F7). The CH4 used as feedstock is mixed with high temperature steam (stream W3) and further preheated by heat exchange with the reformate gas stream from the reformer at HEX-2. Then, the steam methane mixture (stream F6) is supplied to the reformer, where the reforming reaction occurs as expressed in Equations (4) and (5), and converted to H2, CO, and CO2. The steam methane reforming reaction is highly endothermic; therefore, a large amount of heat must be supplied by the combustor by burning supplemental methane as fuel and by burning off-gas (mostly unreacted CH4 and unused H2) from the fuel cell. The operating temperature and pressure for the steam methane reformer in this model were set as 700 °C and 3 bar, respectively. The steam to carbon molar ratio (S/C) of 3:1 was applied to avoid coke formation.
CH 4 + H 2 O = CO + 3 H 2 Δ H 298 = 206.3   kJ mol 1
CH 4 + 2 H 2 O = CO 2 + 4 H 2 Δ H 298 = 165   kJ mol 1
The reformate gas exiting HEX-2 (stream R2) is further used to preheat air entering to the combustor, and then enters the WGS reactor. The WGS reaction is moderately exothermic and it converts undesired CO in reformate gas to CO2 and H2, as shown in Equation (6). The WGS reactor is modeled as a single stage, and the reaction occurs at 250 °C. The heat produced during the WGS reaction is used for steam generation.
CO + H 2 O = CO 2 +   H 2 Δ H 298 = 41   kJ mol 1
The reformate gas leaving the WGS rector (stream R4), which has an acceptable level of CO content (<1%) for the HT-PEMFC, is firstly cooled down to 160 °C and then supplied to the anode side of the HT-PEMFC. Dry air is supplied to the cathode side and used for the fuel cell reaction, converting the chemical energy of hydrogen to electricity. Unreacted hydrogen is supplied to the combustor for heat generation. The exhaust gas from the combustor preheats the water supplied to the reformer and then is cooled down to 40 °C when exiting Cooler-1. After removing the condensed water at Sep-1, the exhaust gas stream (E4) enters the post combustion CO2 capture unit using aqueous MEA as solvent. As large quantities of heat are required to regenerate the solvent within the MEA CO2 capture process, the fractions of heat produced from the WGS reactor, HT-PEMFC, and HEX-4 are supplied to the CO2 capture unit. The MEA CO2 capture unit is modeled as a “black box” in the present study. The detailed explanation for the black box model of the MEA process is provided in the next section. Then, the captured CO2 is compressed to 7 bar by two stage compressors with cooling in between and then partially liquefied by heat exchange with the LNG feedstock at HEX-1. The liquefied CO2 is separated in Sep-2 and stored at 7 bar, −48.5 °C in a temporary tank on board the ship. Noteworthy, although CO2 capture by using low temperature and vapor–liquid phase separation could be advantageous from the perspective of CO2 liquefaction, the capture ratio is significantly affected by concentration of other gases. Therefore, in this study, the MEA CO2 capture unit and CO2 liquefaction system are modeled separately.

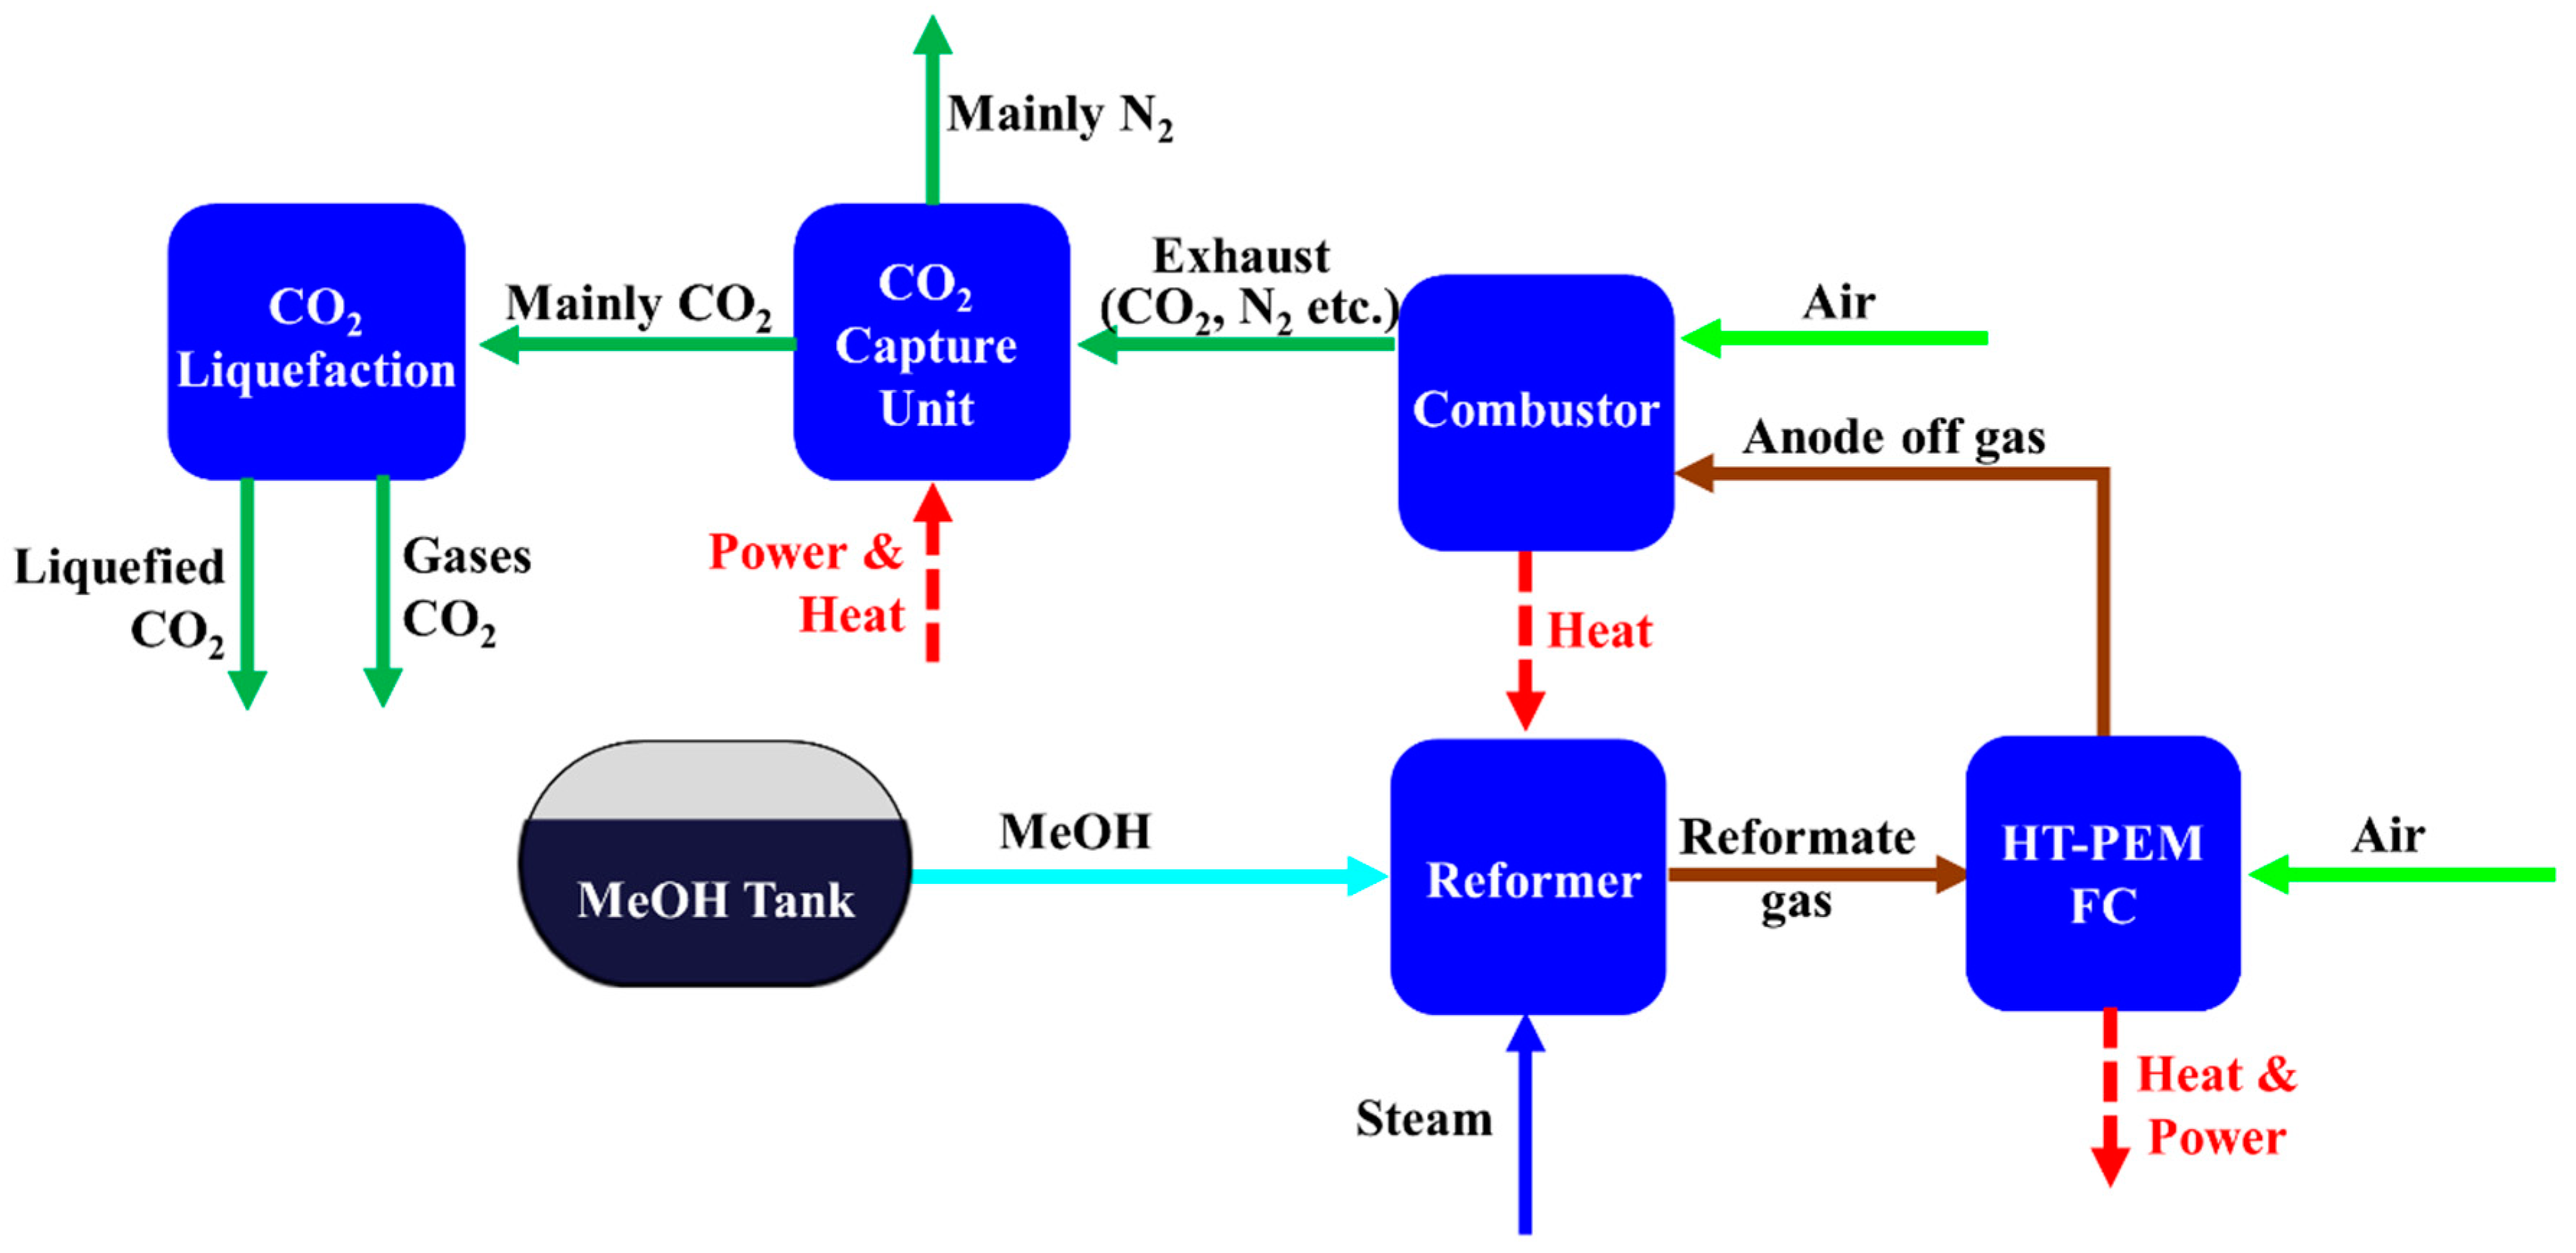
2.3. Description of Steam Methanol Reforming-Based System

Figure 3 shows the block diagram of the steam methanol reforming system combined with HT-PEMFC and CCS on board a ship. The integrated system consists of five main unit/sub-systems: Reformer for producing reformate gas, combustor for providing heat to the reformer, HT-PEMFC for power generation, CO2 capture unit, and CO2 liquefaction system for storage. Unlike the steam methane reforming system, the WGS reactor is not added because the hydrogen rich gas produced in steam methanol reforming includes CO contents tolerable to the HT-PEMFC in this study.
As shown in Figure 4, methanol and water are mixed at 25 °C. The water and methanol mixture is preheated by the steam generated at the HT-PEMFC at HEX-1 and further vaporized by the reformate gas stream (stream R1) from the reformer at HEX-2. Then, H2 rich reformate gas is produced in the reformer. The main reactions that take place in the reformer are as follows [52]:
CH 3 OH + H 2 O = CO 2 + 3 H 2 Δ H 298 = + 49.7   kJ mol 1
CO + H 2 O = CO 2 + H 2 Δ H 298 = 41   kJ mol 1
  CH 3 OH = CO + 2 H 2 Δ H 298 = + 90.7   kJ mol 1  
Equation (6) represents the steam methanol reforming reaction, Equation (7) represents the water gas shift reaction, and Equation (8) represents the methanol decomposition reaction. Only the WGS reaction is exothermic and the other two are endothermic. The operating temperature and pressure for the steam methanol reformer in this model are 200 °C and 3 bar, respectively. A S/C ratio of 1.5:1 was selected based on literature reviews [27,33]. Reformate gases containing H2, CO2, CO, and CH3OH exiting HEX-2 are further adjusted to 160 °C at HEX-3 and 1.1 bar by PCV-1. Then, the reformate gas is fed to the anode side of the HT-PEMFC for power generation. As off-gas (stream O1) from the fuel cell contains H2 unreacted in the fuel cell and CH3OH unconverted in the reformer, the fraction of these is supplied to the combustor to produce heat. The remaining is recycled to the anode inlet stream. The exhaust gas stream (E1) from the combustor preheat air is supplied to the combustor, and the remaining heat in the exhaust gas is recovered in HEX-5. The exhaust gas stream (E4), from which most water is removed in Sep-1, is fed to the CO2 capture unit, which is modeled as a “black box,” in the same way as the steam methane reforming system.
The captured CO2 stream (E5) is compressed to 14 bar by Comp-1, -2, and liquefied passing through HEX-7. Unlike the steam methane reforming system, a separate liquefaction cycle using ammonia as refrigerant was modeled. The liquefied CO2 is separated in Sep-2 and stored in a temporary tank on board the ship. The operating and design parameters of the steam methane and methanol reforming system combined with HT-PEMFC, CO2 capture, and liquefaction systems are presented in Table 3.

3. System Simulation and Assumptions

The process simulation and heat and mass balance calculations were carried out using the ASPEN HYSYS process simulator. The heat and mass balances obtained from the converged simulation are utilized for exergy and energy calculations in a separate spreadsheet. The Peng–Robinson equation of state is used for different units/sub-systems including steam reforming, HT-PEMFC, and CO2 liquefaction system [29,58]. A “Gibbs reactor” model, which considers the condition of the Gibbs free energy of the reacting system being at a minimum at equilibrium to calculate the product mixture composition [59], is used to simulate the reformer and WGS reactor, whereas the “conversion reactor” model is used to simulate the combustor [50]. There is no separate module to simulate a fuel cell in ASPEN HYSYS. Therefore, in the present study, the HT-PEMFC is modeled as a “conversion reactor” and a “splitter,” which attain a conversion ratio equal to the hydrogen utilization factor [8,9]. For simplicity, the carbon capture unit using MEA is modeled as a “splitter” in ASPEN HYSYS, which can be considered as a black box assumption. In a black box assumption, the complex process for capturing CO2 is modeled by one single box, which has two outlet streams of differing composition from a single inlet stream. Although the black box model enables estimating the minimum work or heat required for CO2 capture, the calculated value for capture is generally a little different from the actual work and heat reported in the literature [30,41]. The concept for the black box model of the CO2 capture has been used in several studies [30,41,60]. To obtain information about the energy and exergy consumption per kg of captured CO2, the values reported in reference [37] are used in the present work.
The concentration of H2, CO2, and CO in the anode inlet stream can affect performance of HT-PEMFC. Andreasen et al. investigated the variation of HT-PEMFC performance by the feeding mixture of H2, CO (0%, 0.15%, 0.25%, 0.5%, 1%), CO2 (0%, 25%) to emulate methanol or methane reformate gas. Results reveal that increasing both CO and CO2 concentration decreases output voltage. In total, eight cases of experiments, 1% CO and 25% CO2 case and 0.5% CO and 25% CO2 case show the first and second lowest output voltage, approximately 0.645 and 0.652 V, respectively, at 0.2 A cm−2 and operating temperature of 160 °C [61]. Other experimental studies show similar results. Devrim et al. evaluated the combined effect of CO and CO2 in anode inlet stream and results show that no significant performance degrade due to the addition of only CO2 into H2, however addition of CO in H2 and CO2 mixture increase degrade of performance. H2, CO2, CO (75%, 24%, 3% and 75%, 24%, 1%) mixtures show output voltage of approximately 0.629 and 0.634 V at 0.2 A cm−2 and operating temperature of 160 °C [62]. It was reported that the impact of the CO presence (up to 2.0%) at higher operating temperature (160 °C and above) and lower current densities (below 0.3 A cm−2) is very low [63,64]. Therefore, in this study, the performance degrade due to CO contents is neglected and output voltage of HT-PEMFC is fixed as 0.637 V [56].
Since the amount of electricity consumption vary with several operation modes of ship, it is assumed that the target ship operates with constant average shaft power, namely 475 kW for simplicity. Further, a current density of 0.2 A cm−2 is assumed for constant power generation. Noteworthy, lower current densities lead to higher electrical efficiency, and require a larger cell area. However, considering the feasibility check and comparison for ship application of the methane-, methanol-based system is main purpose of this study, the above assumptions are deemed reasonable.
The general assumptions used in the modeling of the integrated energy system are as follows:
  • The simulations are implemented in a steady state and are not suitable for start-up operations.
  • The composition of air is considered to be 79% N2 and 21% O2 on a mole basis.
  • For simplicity, LNG is represented by pure, liquefied CH4.
  • The reaction time is considered long enough to achieve phase and chemical equilibrium.
  • The reformate gases exiting the reformer are at the reformer temperature.
  • Heat and pressure losses are assumed to be negligible in all operational units.
  • Complete fuel oxidation is assumed in the combustor.
  • In the CO2 capture unit, only heat consumption is considered because the power consumption at cooling pumps, solvent pumps, and other devices is relatively small.
  • The heat ejected from coolers is not recovered.

4. Performance Evaluation

To conduct a comparative analysis between the steam methane reforming-based system and the steam methanol reforming-based system, energy, exergy efficiency, and exergy destruction are used along with the carbon capture storage ratio and the required volumes of both fuels and captured CO2 during navigation.

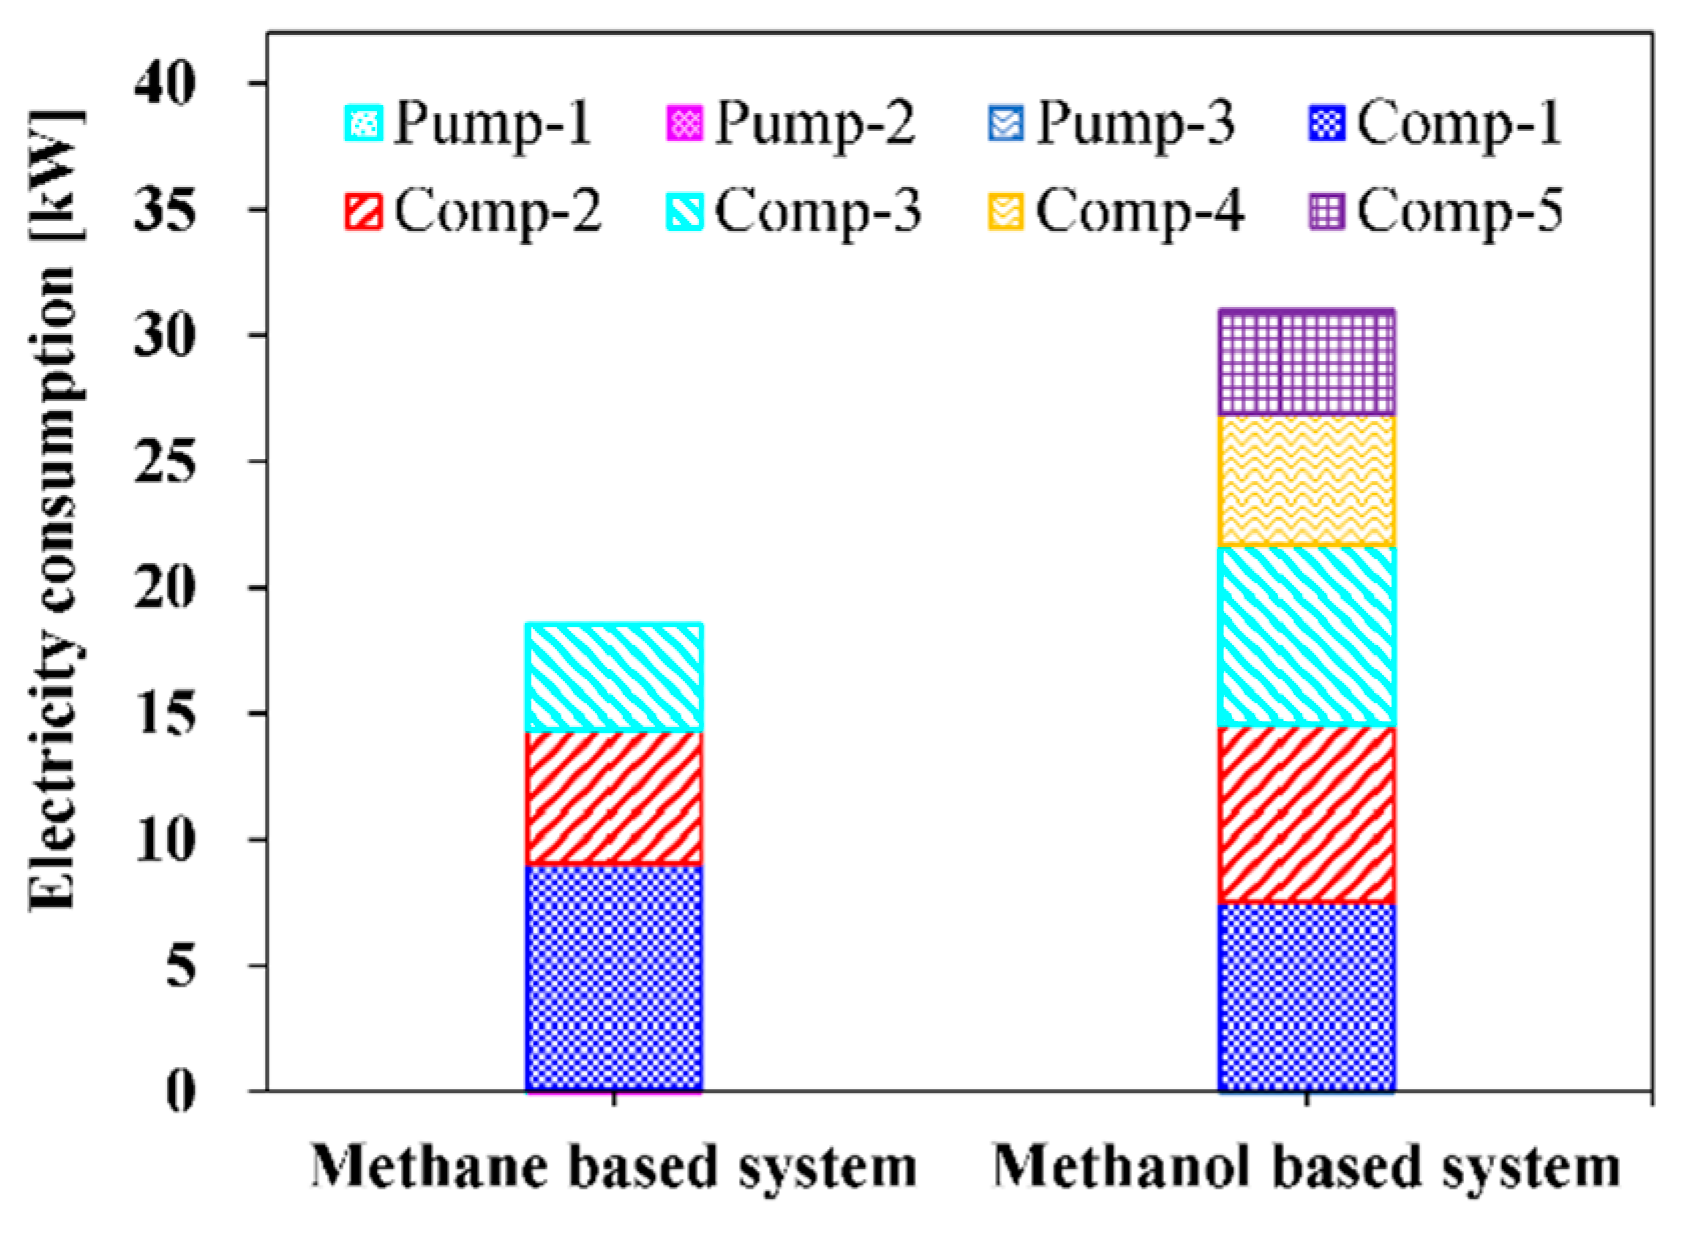
4.1. Energy Analysis of the Integrated Systems

The objective functions that are used in the energy analysis for system performance evaluation are electrical efficiency (ηen,sys,electrical) and cogeneration efficiency (ηcogen). The electrical efficiency of the systems is defined as the ratio of the net electrical power output of the system to the lower heating value of the feed and fuel entering the system, as expressed in Equation (9) for the steam methane reforming-based system and in Equation (10) for the steam methanol reforming-based system [27,54].
η en , CH 4 , electrical = P net ,   electrical ( n ˙ feed , CH 4 + n ˙ fuel , CH 4 ) · LHV CH 4
where LHVCH4 is the lower heating value of CH4. The net electrical power (Pnet,electrical) is calculated by subtracting the power consumed in the system (Ppump−1 + Ppump−2 + Ppump−3 + Pcomp−1 + Pcomp−2 + Pcomp−3) from the power generated in the HT-PEMFC (PHT-PEMFC,AC).
η en , CH 3 OH , electrical = P net ,   electrical n ˙ feed , CH 3 OH ,   · LHV CH 3 OH
where LHVCH3OH is the lower heating value of CH3OH. The net electrical power (Pnet,electrical) is calculated by subtracting the power consumed in the system (Ppump−1 + Ppump−2 + Ppump−3 + Pcomp−1 + Pcomp−2 + Pcomp−3 + Pcomp−4 + Pcomp−5) from the power generated in the HT-PEMFC (PHT-PEMFC, AC).
The electrical power generated by HT-PEMFC (PHT-PEMFC, AC) can be calculated as follows [65]:
P HT PEMFC , AC = η HT PEMFC · n ˙ H 2 · LHV H 2 · η Converter
where n ˙ H 2 is the molar flow rate of hydrogen that reacts in the HT-PEMFC, LHVH2 is the lower heating value of hydrogen, ηHT-PEMFC is the electrical efficiency of the HT-PEMFC, and ηConverter is the efficiency of the converter.
The efficiency of HT-PEMFC (ηHT-PEMFC) can be found from [65]
η HT PEMFC = μ f · V c EMF max · 100
where μf is the fuel utilization factor, Vc is the produced voltage of the cell, and EMFmax is the electromotive force when all the energy from the hydrogen fuel cell, the heating value or enthalpy of formation, was converted to electrical energy. Fuel utilization factor, μf and EMFmax can be determined as follows:
μ f = H 2 ,   consumed H 2 , supplied
EMF max = Δ h f 2 F
The heat produced in the fuel cell stack can be determined from [66]
Q ˙ heat ,   HT PEMFC = ( h in ,   c · n ˙ in ,   c ) ( h out ,   c · n ˙ out ,   c ) +   ( h in ,   a · n ˙ in ,   a ) ( h out ,   a · n ˙ out ,   a )   P HT PEMFC , DC
The cogeneration efficiency of the system (ηen,sys,cogen) is defined as the ratio between the summation of the rate of available heat output and the net electrical power to the lower heating value of the fuel and feed entering the system, as expressed in Equation (16) for the steam methane reforming-based system and in Equation (17) for the steam methanol reforming-based system [54].
η en , CH 4 , cogen = P net ,   electrical + Q net ( n ˙ CH 4 ,   feed + n ˙ CH 4 , fuel ) · LHV CH 4
η en ,   CH 3 OH , cogen = P net ,   electrical + Q net ( n ˙ CH 3 OH ,   feed ) · LHV CH 3 OH
where
Q net = Q hot   water ( W 13 ) Q water ( W 3 )

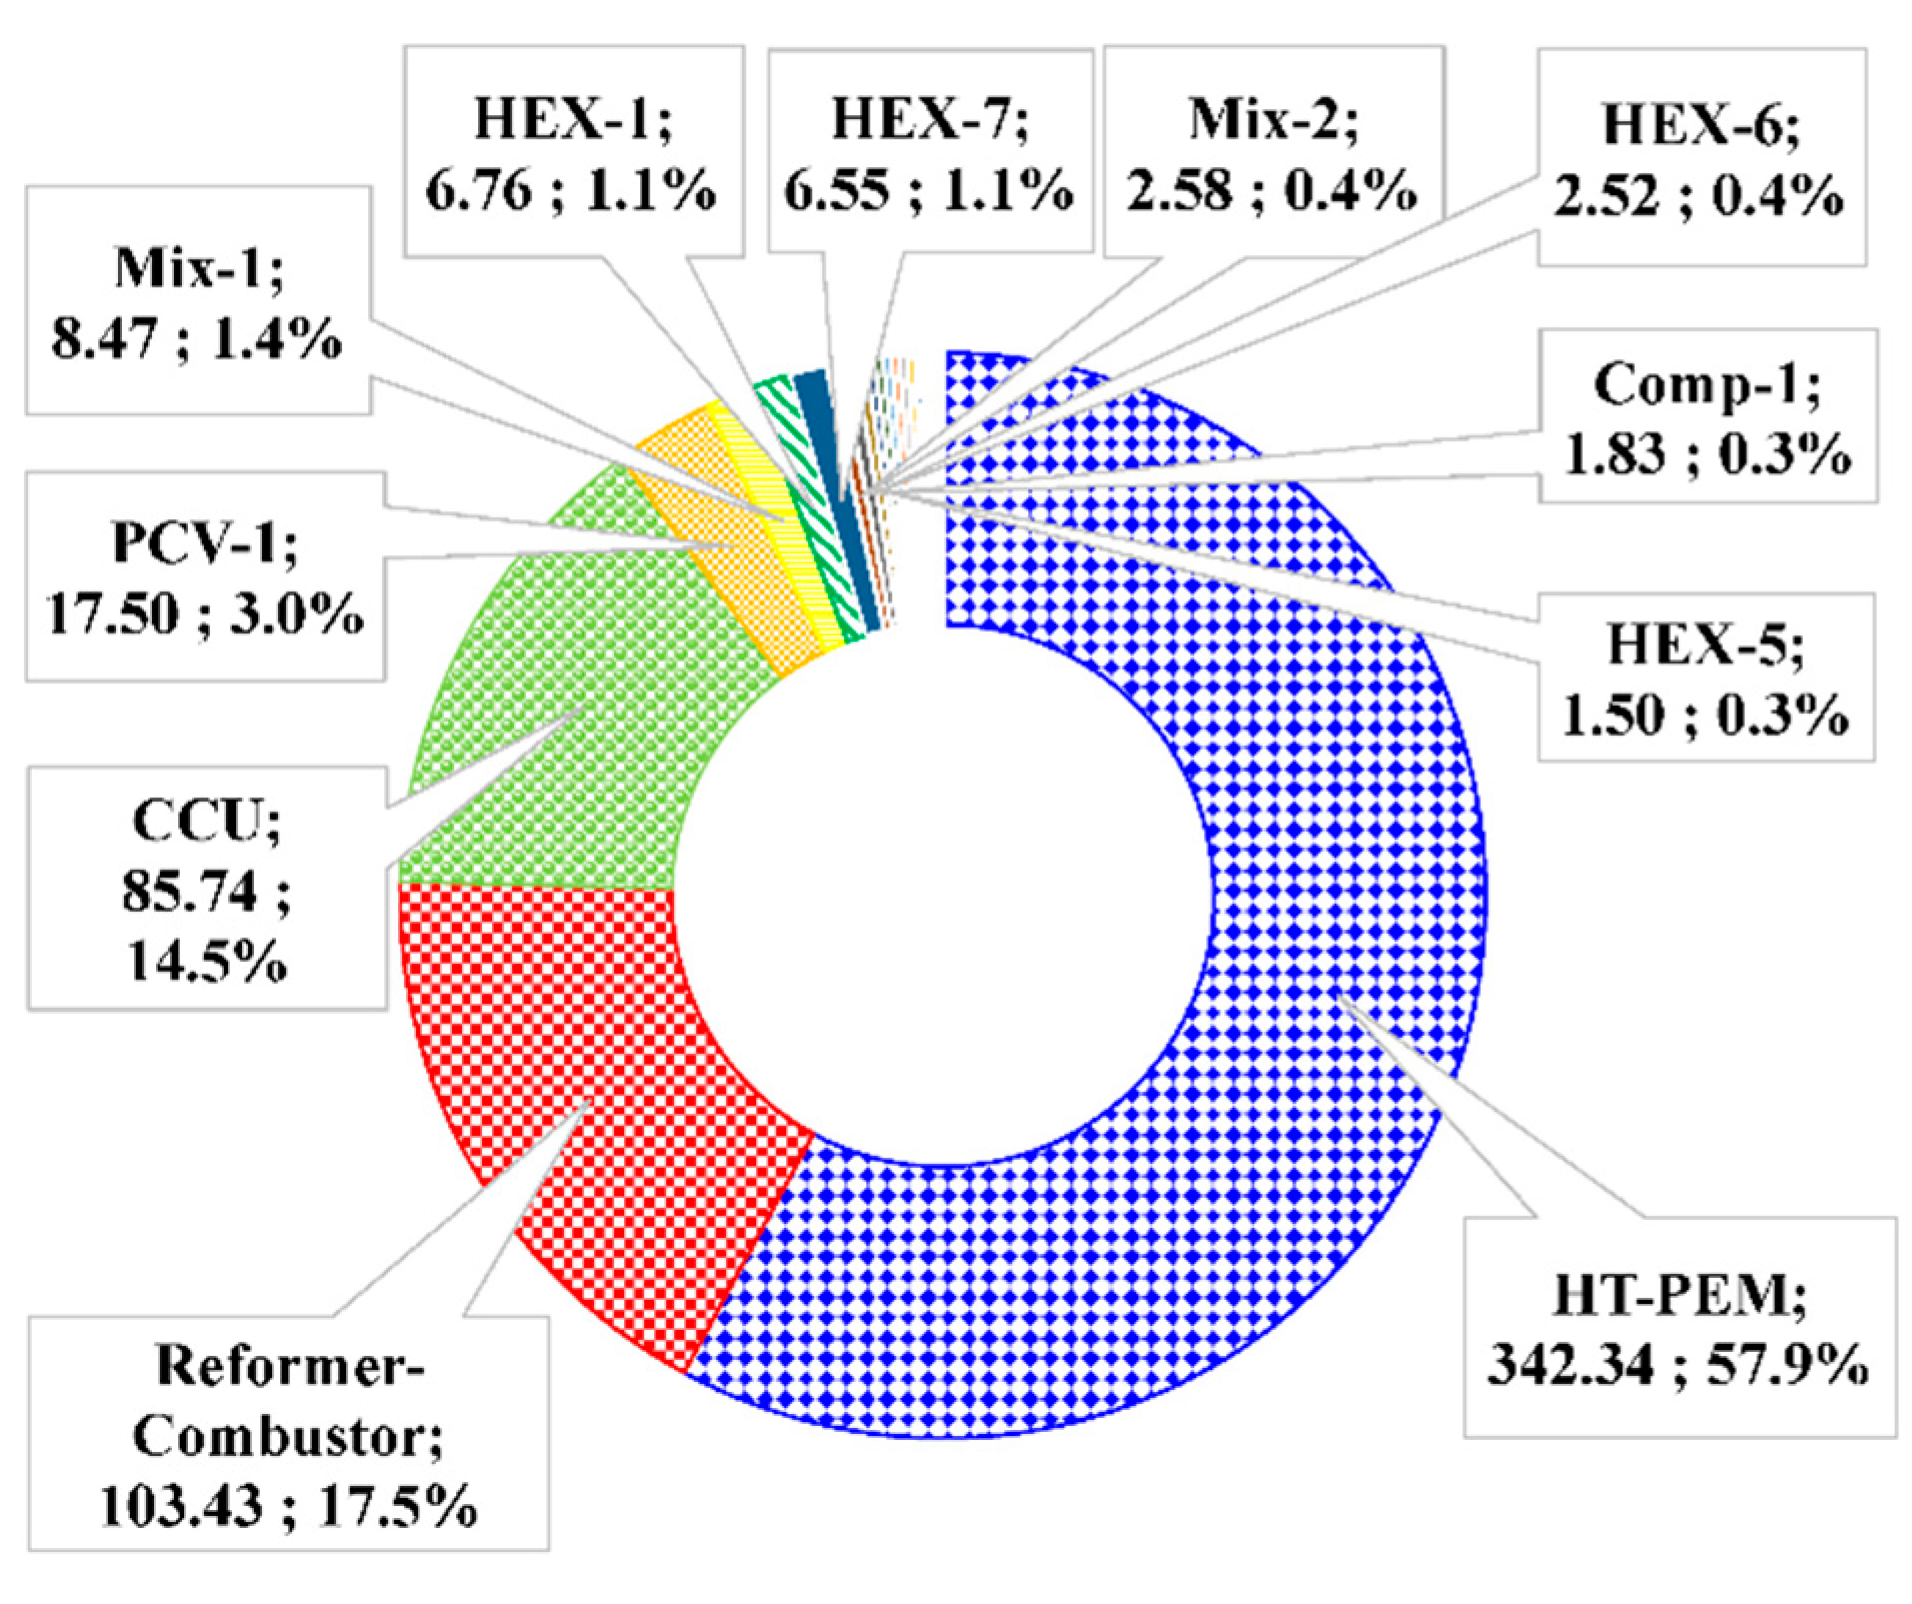
4.2. Exergy Analysis of the Integrated Systems

Exergy is defined as the maximum amount of useful energy that can be obtained from a stream when it reaches an equilibrium condition with the reference environment while interacting only with this environment [67]. The exergy analysis is applied to measure the exergy destruction and exergy efficiency for each component of the system proposed in this study. The equation of exergy destruction for each component can be derived from the equation of exergy balance. Considering a control volume at steady state, the general form of exergy balance can be written as follows:
E ˙ x Q E ˙ x w + E ˙ x flow ,   in E ˙ x flow ,   out E ˙ x dest =   0
where Ex Q represents the rate of exergy transfer due to heat exchange with the environment, Ex w is the rate of exergy transfer related to work, Ex dest represents exergy destruction, and Ex flow corresponds to the exergy transfer rate associated with the flow of the stream. E ˙ x represents the stream exergy, which can be expressed as follows [68]:
E ˙ x = F · ( Ex chem + Ex phys + Δ mix Ex )
F, Ex chem , Ex phys , and Δ mix Ex denote the molar flow rate and the physical, chemical, and mixing exergy of the stream.
The chemical exergy of the stream, accounting for phases and their composition at the reference condition, is given by Equation (21), as follows [68]:
Ex chem = L 0 · x 0 , i · Ex chem , i 0 l + V 0 · y 0 , i · Ex chem , i 0 v
L0 and V0 are the liquid and vapor mole fraction of the stream at the reference condition, respectively. xi and yi are the mole fraction of species i in the liquid and vapor phases, respectively. Ex chem , i 0 l and Ex chem , i 0 v denote the standard chemical exergy of component i in the liquid and vapor phases, respectively. The superscripts l and v denote liquid and vapor phases, respectively, and subscript 0 refers to the reference conditions. The reference conditions, T0 and P0, are set to 25 °C and 101.325 kPa in this work.
The physical exergy of the stream can be calculated from the enthalpies and entropies of the pure components, the amount of each phase, and their respective compositions, as follows [68]:
Ex phys = [ L · ( x i · H i l T 0 · x i · S i l ) + V · ( y i · H i v T 0 · y i · S i v ) ] actual   T , P   [ L 0 · ( x i · H i l T 0 · x i · S i l ) + V 0 · ( y i · H i v T 0 · y i · S i v ) ] T 0 , P 0
Hi and Si are the molar enthalpy and molar entropy of pure component i, respectively.
The mixing exergy, which has always a negative value, can be found from [68]:
Δ mix Ex = Δ mix H T 0 · Δ mix S
where
Δ mix M = L · ( M l x i · M l ) + V · ( M v y i · M v )
in which M is any thermodynamic property of the mixture and pure component i, respectively. The detailed methodology of exergy calculation of the stream can be referred from reference [68]. The equations for the exergy destruction of each component are summarized in Table 4.
To define exergy efficiency, the input and output of the system should be defined. In these integrated systems, output is the summation of the net electrical power generated and stream exergy change of the available hot water, whereas input is the summation of chemical exergy of the feed and fuel entering the system. The exergy efficiencies of the systems are expressed as follows [54]:
η ex , CH 4 , sys = P net ,   electrical + E ˙ x net ,   hotwater E ˙ x feed , CH 4 + E ˙ x fuel , CH 4
η ex , CH 4 , sys = P net ,   electrical + E ˙ x net ,   hotwater E ˙ x feed , CH 3 OH
E ˙ x net ,   steam = E ˙ x hot   water   generated E ˙ x water   supplied

5. Results and Discussion

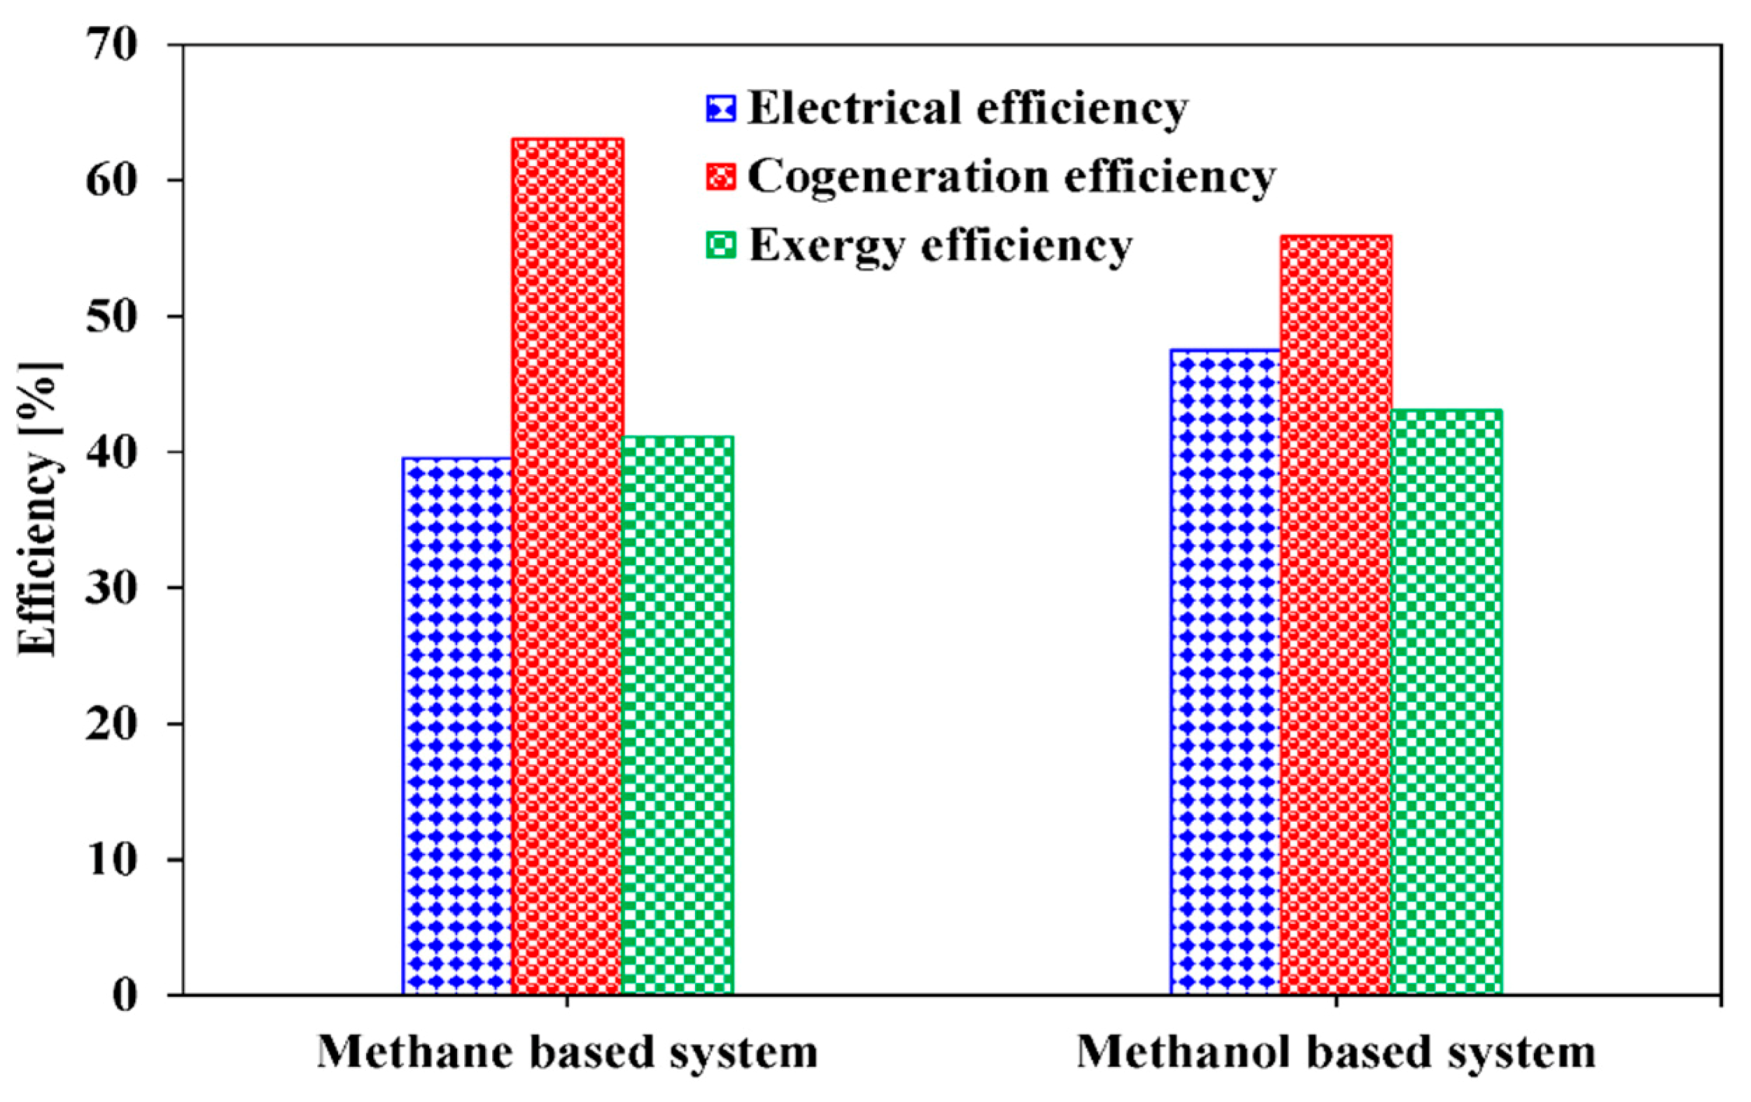
5.1. Energy and Exergy Analyses

The steam reforming systems presented in this study are evaluated in terms of energy, exergy efficiency of the overall systems, and exergy destruction rate of each component. For the energy efficiency, electrical and cogeneration efficiencies are utilized. Electrical efficiency, cogeneration efficiency, and exergy efficiency at the base condition presented in Table 3 for the methane-based and methanol-based systems are compared in Figure 5. Electrical efficiencies of 39.53% for the methane-based system and 47.53% for the methanol-based system are obtained. It can be interpreted that the methanol-based system uses the feed energy input (LHV basis) more efficiently than the methane-based system for 475 kW of net electricity generation. Noteworthy, the overall electricity consumption of the methane-based and methanol-based systems are 18.51 and 30.97 kW, respectively, as indicated in Figure 6. The higher electricity consumption in the methanol-based system is mainly attributed to electricity consumption of the compressors (Comp-4 and -5) in the ammonia refrigerant cycle, whereas the methane-based system, which uses the cold energy of LNG for CO2 liquefaction, does not consume additional electricity. Regarding the cogeneration efficiency, the methane-based system has higher value, 63%, than that of the methanol-based system, 55.86%, and this can be explained by Figure 7. As can be observed in Figure 7, the methane-based system consumes a higher amount of overall energy (LHV basis) than the methanol-based system and generates more available heat for 475 kW of net electricity generation. The higher value of heat generated can be explained by the fact that the steam methane reforming reaction is more endothermic than the steam methanol reforming reaction.
To evaluate the performance of the components, the exergy destructions of each component in the methane-based and methanol-based systems at the base condition provided in Table 3 are calculated. It is observed that there is a total exergy destruction of 690.68 kW for the methane-based system and 591.16 kW for the methanol-based system. The exergy destructions in each system are broken down to the component level and the results are presented in Figure 8 and Figure 9. The HT-PEMFC, reformer-combustor, and CCU have the largest percentages of total exergy destruction. For the methane-based system, the HT-PEMFC is the component having the highest exergy destruction with 365.5 kW (51.5%), followed by the reformer-combustor with 145.76 kW (20.6%) and CCU with 86.03 kW (14.0%). The exergy destructions in the methanol-based system follow a similar trend, having the highest exergy destruction in the HT-PEMFC with 342.34 kW (57.9%), reformer-combustor with 145.76 kW (20.6%), and CCU with 85.74 kW (14.5%). Exergy destruction of the HT-PEMFC and reformer-combustor mainly results from high irreversibility of the chemical reaction [54]. Exergy destructions of CCUs are calculated by assuming 1529 kW/kg CO2 [37], which are caused by the unavoidable heat exergy required for MEA regeneration, and therefore, are dependent on the amount of generated CO2 in the overall process. The larger total exergy destruction in the methane-based system is mainly attributed to the larger exergy destruction in the reformer-combustor. This relies on the fact that the steam methane reforming reaction is operated at a higher temperature condition of 700 °C (combustion temperature of 800 °C) instead of 200 °C (combustion temperature of 300 °C) in the steam methanol reforming reaction.
The other reasons explaining why the total exergy destruction is higher in methane-based systems than in methanol-based systems is that higher exergy destruction occurs in the heat exchangers (mainly HEX-1, HEX-3, and HEX-5), Mixer-1. For the heat exchangers, the larger exergy destruction derives from the larger temperature difference between cold and hot streams. This is because fuel in cryogenic temperature (LNG) is supplied in the methane-based system and streams from the reformer and combustor have inherent temperature. For Mix-1, more exergy destruction in the methane-based system than that in the methanol-based system is generated from mixing of streams with larger temperature difference. Therefore, reducing the temperature differences in these heat exchangers and Mix-1 by optimization can effectively reduce the system exergy destruction [71]. The exergy destruction generated in the WGS reactor, which is additionally equipped for the methane-based system to lower the CO fraction, is another reason.

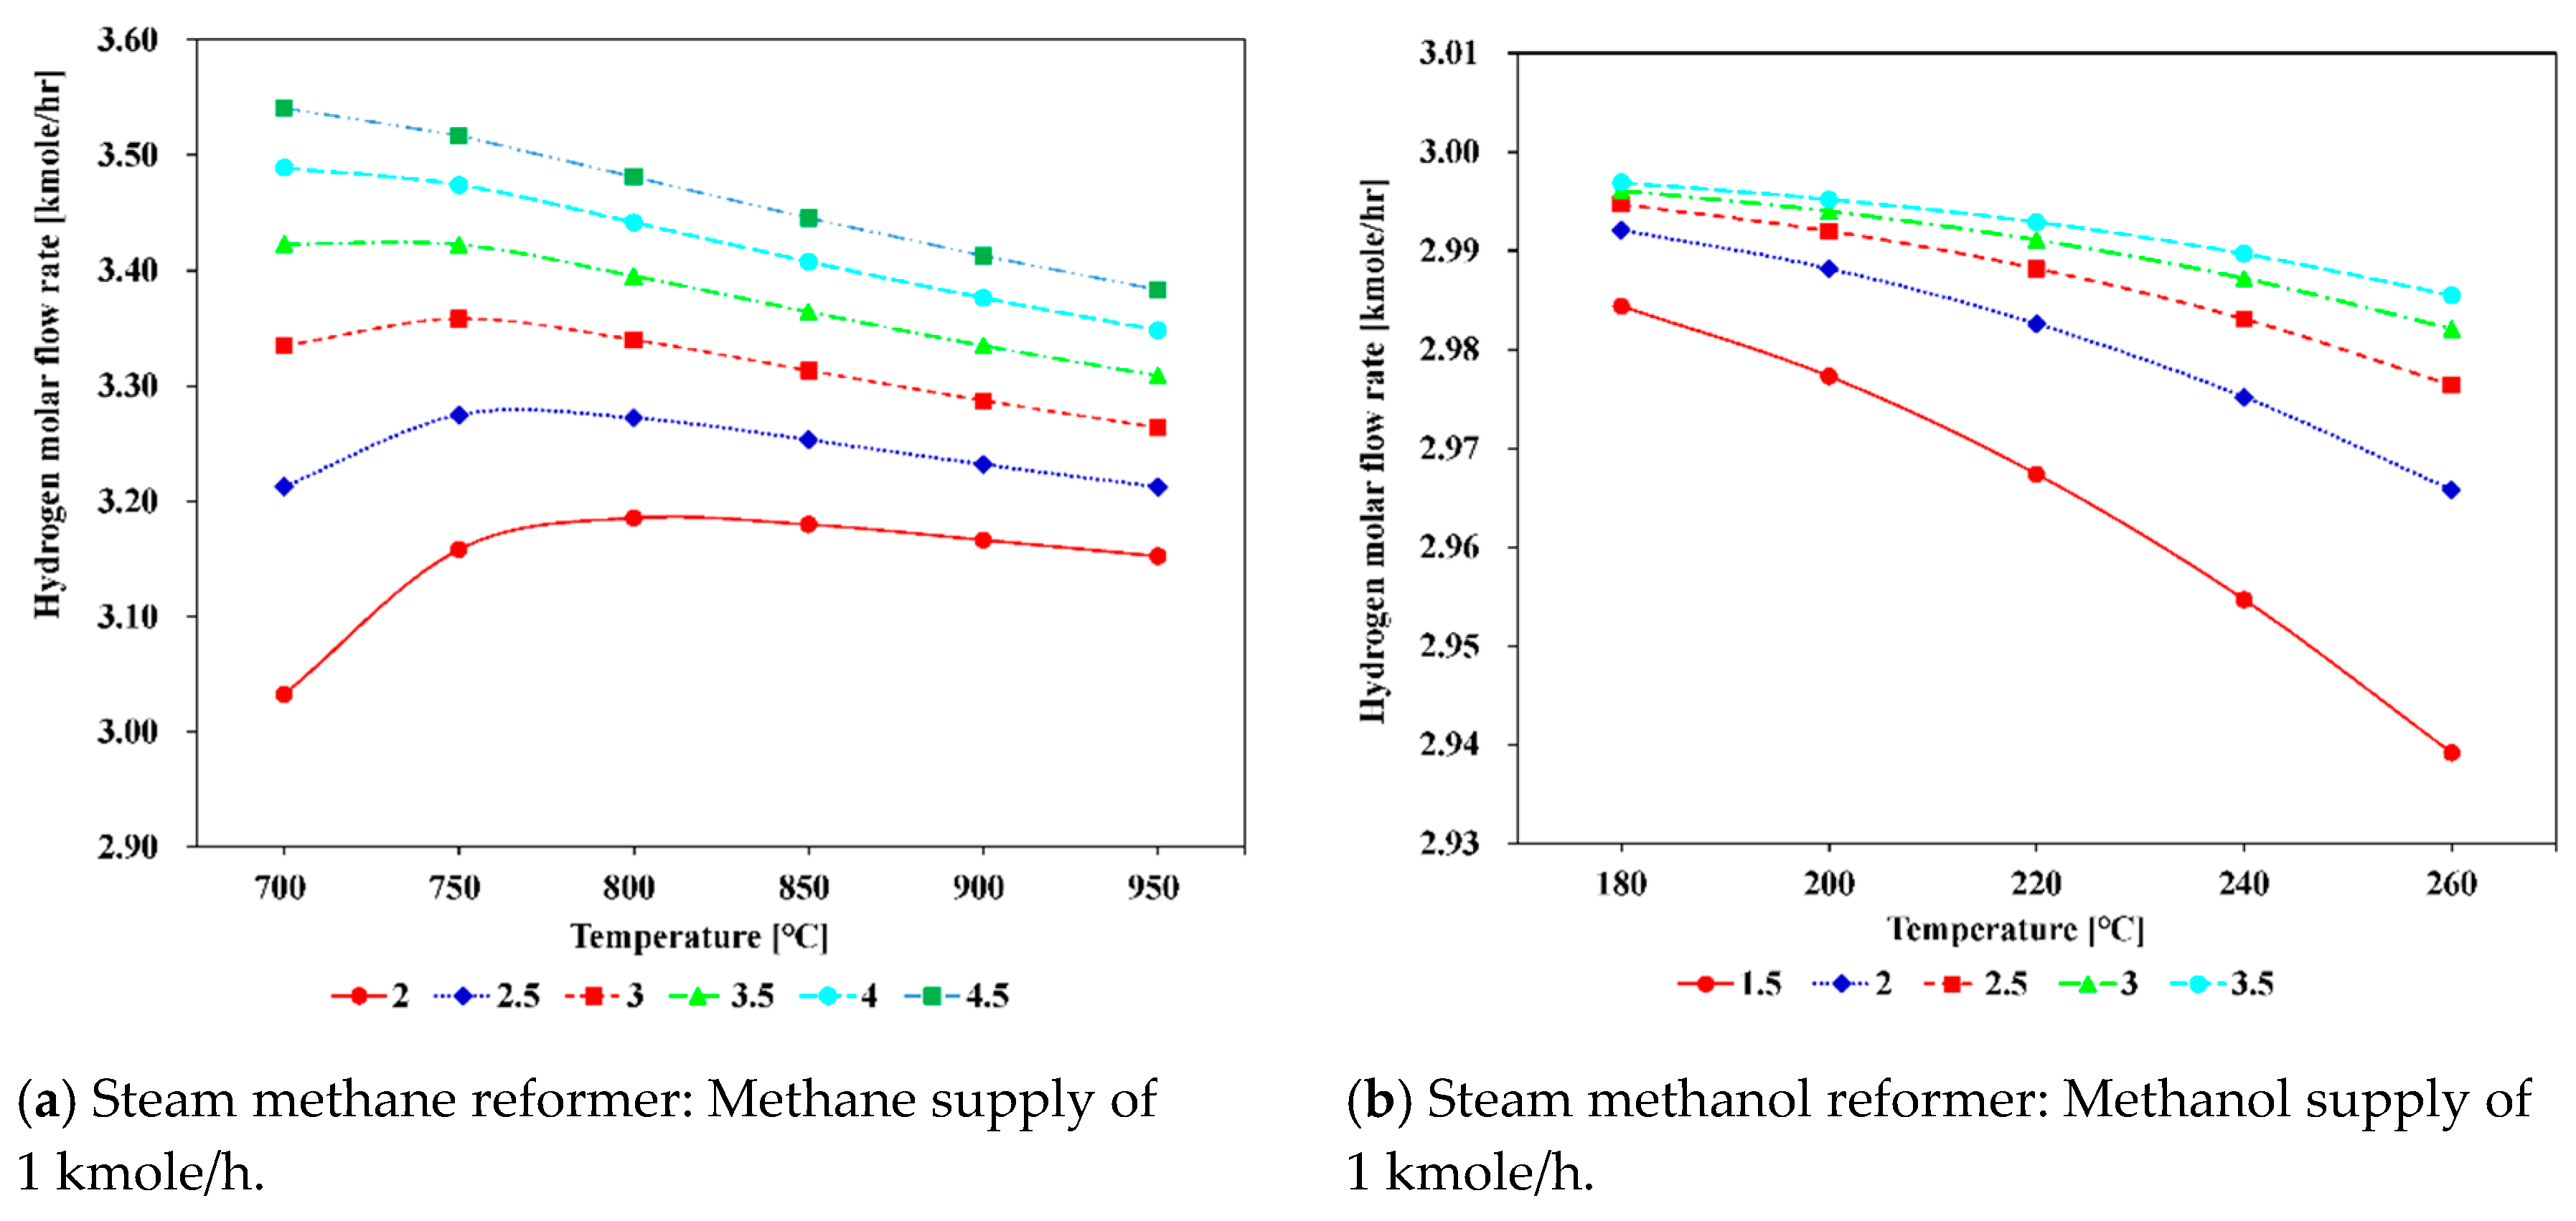
5.1.1. Effect of Varying Reforming Temperature

The variation of H2 molar flow rate at the outlet of the steam methane and steam methanol reformers in thermodynamic equilibrium with varying reforming temperature and S/C ratio was derived to understand the system behavior. As can be observed in Figure 10a, the methane steam reformer shows the tendency that at S/C ratios below 3.5, the hydrogen flow rate increases when the reforming temperature increases up to 750 °C. After then, the H2 molar flow rate decreases as the reforming temperature increases. At S/C ratios above 3.5, the H2 molar flow rate continuously decreases as the reforming temperature increases. The steam methanol reformer shows a trend that as the reforming temperature increases from 180 to 260 °C, the molar flow rate of H2 continuously decreases, although the decrease rates are different, as shown in Figure 10b. Figure 10a,b represent the behavior of each reformer and can be used for interpretation of each system in the next section. The effects of varying the reforming temperature on the efficiencies and molar flow rate of CO2 in the methane-based and methanol-based systems were studied and illustrated in Figure 11.
As can be observed in Figure 11a, for the methane-based system, as the reforming temperature increases from 700 to 950 °C, the electrical, cogeneration, and exergy efficiency continuously decrease, from 39.53%, 63%, and 41.14% to 37.92%, 58.03%, and 38.47%, respectively. This trend occurs because as the reforming temperature increases, the amount of additional fuel needed for the reformer and combustor increases by 5.8% and leads to a decrease in efficiencies of the system. It can be noticed that the slope of the efficiency curves between 700 and 750 °C is less steep than that at other temperature ranges. The reason for this is that the amount of hydrogen produced increases when the temperature is increased from 700 to 750 °C; after then, the amount of hydrogen produced starts to decrease, as shown in Figure 10a. In addition, the slope of the cogeneration efficiency curve is a little steeper than that of the electrical and exergy efficiencies as the amount of the produced CO2 increases; accordingly, the heat required to capture CO2 in the CCU increases. The methanol-based system shows a similar behavior to that of the methane-based system, as shown in Figure 11b. As the reforming temperature increases from 180 to 260 °C, the electrical and exergy efficiencies decrease from 47.85% and 43.25% to 46.27% and 42.23%, respectively, whereas the cogeneration efficiency stays almost constant. Noteworthy, unlike the methane-based system, as the reforming temperature increases above 200 °C, the amount of produced CO2 decreases. This happens because an increase in the reforming temperature above 200 °C will favor the CO formation and the increase in CO content will decrease the production of H2 and CO2. Therefore, the heat required for CO2 capture increases and this results in a slight increase in cogeneration efficiency as the reforming temperature increases.

5.1.2. Effect of Varying Steam to Carbon Ratio

Figure 12 shows the change in the electrical, cogeneration, and exergy efficiencies with varying S/C ratio. For the steam methane-based system, when the S/C ratio is increased from 2 to 4.5, the electrical efficiency, exergy efficiency, and cogeneration efficiency decrease from 46.64%, 63.77%, and 42.06% to 38.36%, 62.07%, and 40.14%, respectively. This tendency occurs because a higher S/C ratio requires a considerable amount of heat to produce steam, resulting in more fuel consumption in the combustor, as can be observed in Figure 13a. The increase in parasitic power consumption for the pump and CO2 compressor is another reason for the decrease in electrical and exergy efficiencies. Regarding the cogeneration efficiency, the increased heat consumption in the CCU due to increased CO2 generation is one of the reasons. Noteworthy, when the S/C ratio increases, H2 contents in the product gas is increased, although this increase rate becomes slower, as depicted in Figure 10a. This effect compensates slightly the required fuel consumption. Nevertheless, the efficiencies decrease with S/C ratio because the increase rate of additional fuel is greater than the increase rate of hydrogen production. For the methanol-based system, the efficiencies profiles are relatively flat with increasing S/C ratio from 1.5 to 3.5, as shown in Figure 12b. This trend is attributable to the lower reforming temperature and combustion temperature in the methanol-based system, which can be confirmed by the slight increase in fuel consumption. This trend can also be due to the trade-off between the increase in hydrogen production and the increase in parasitic power consumption with increasing S/C ratio.

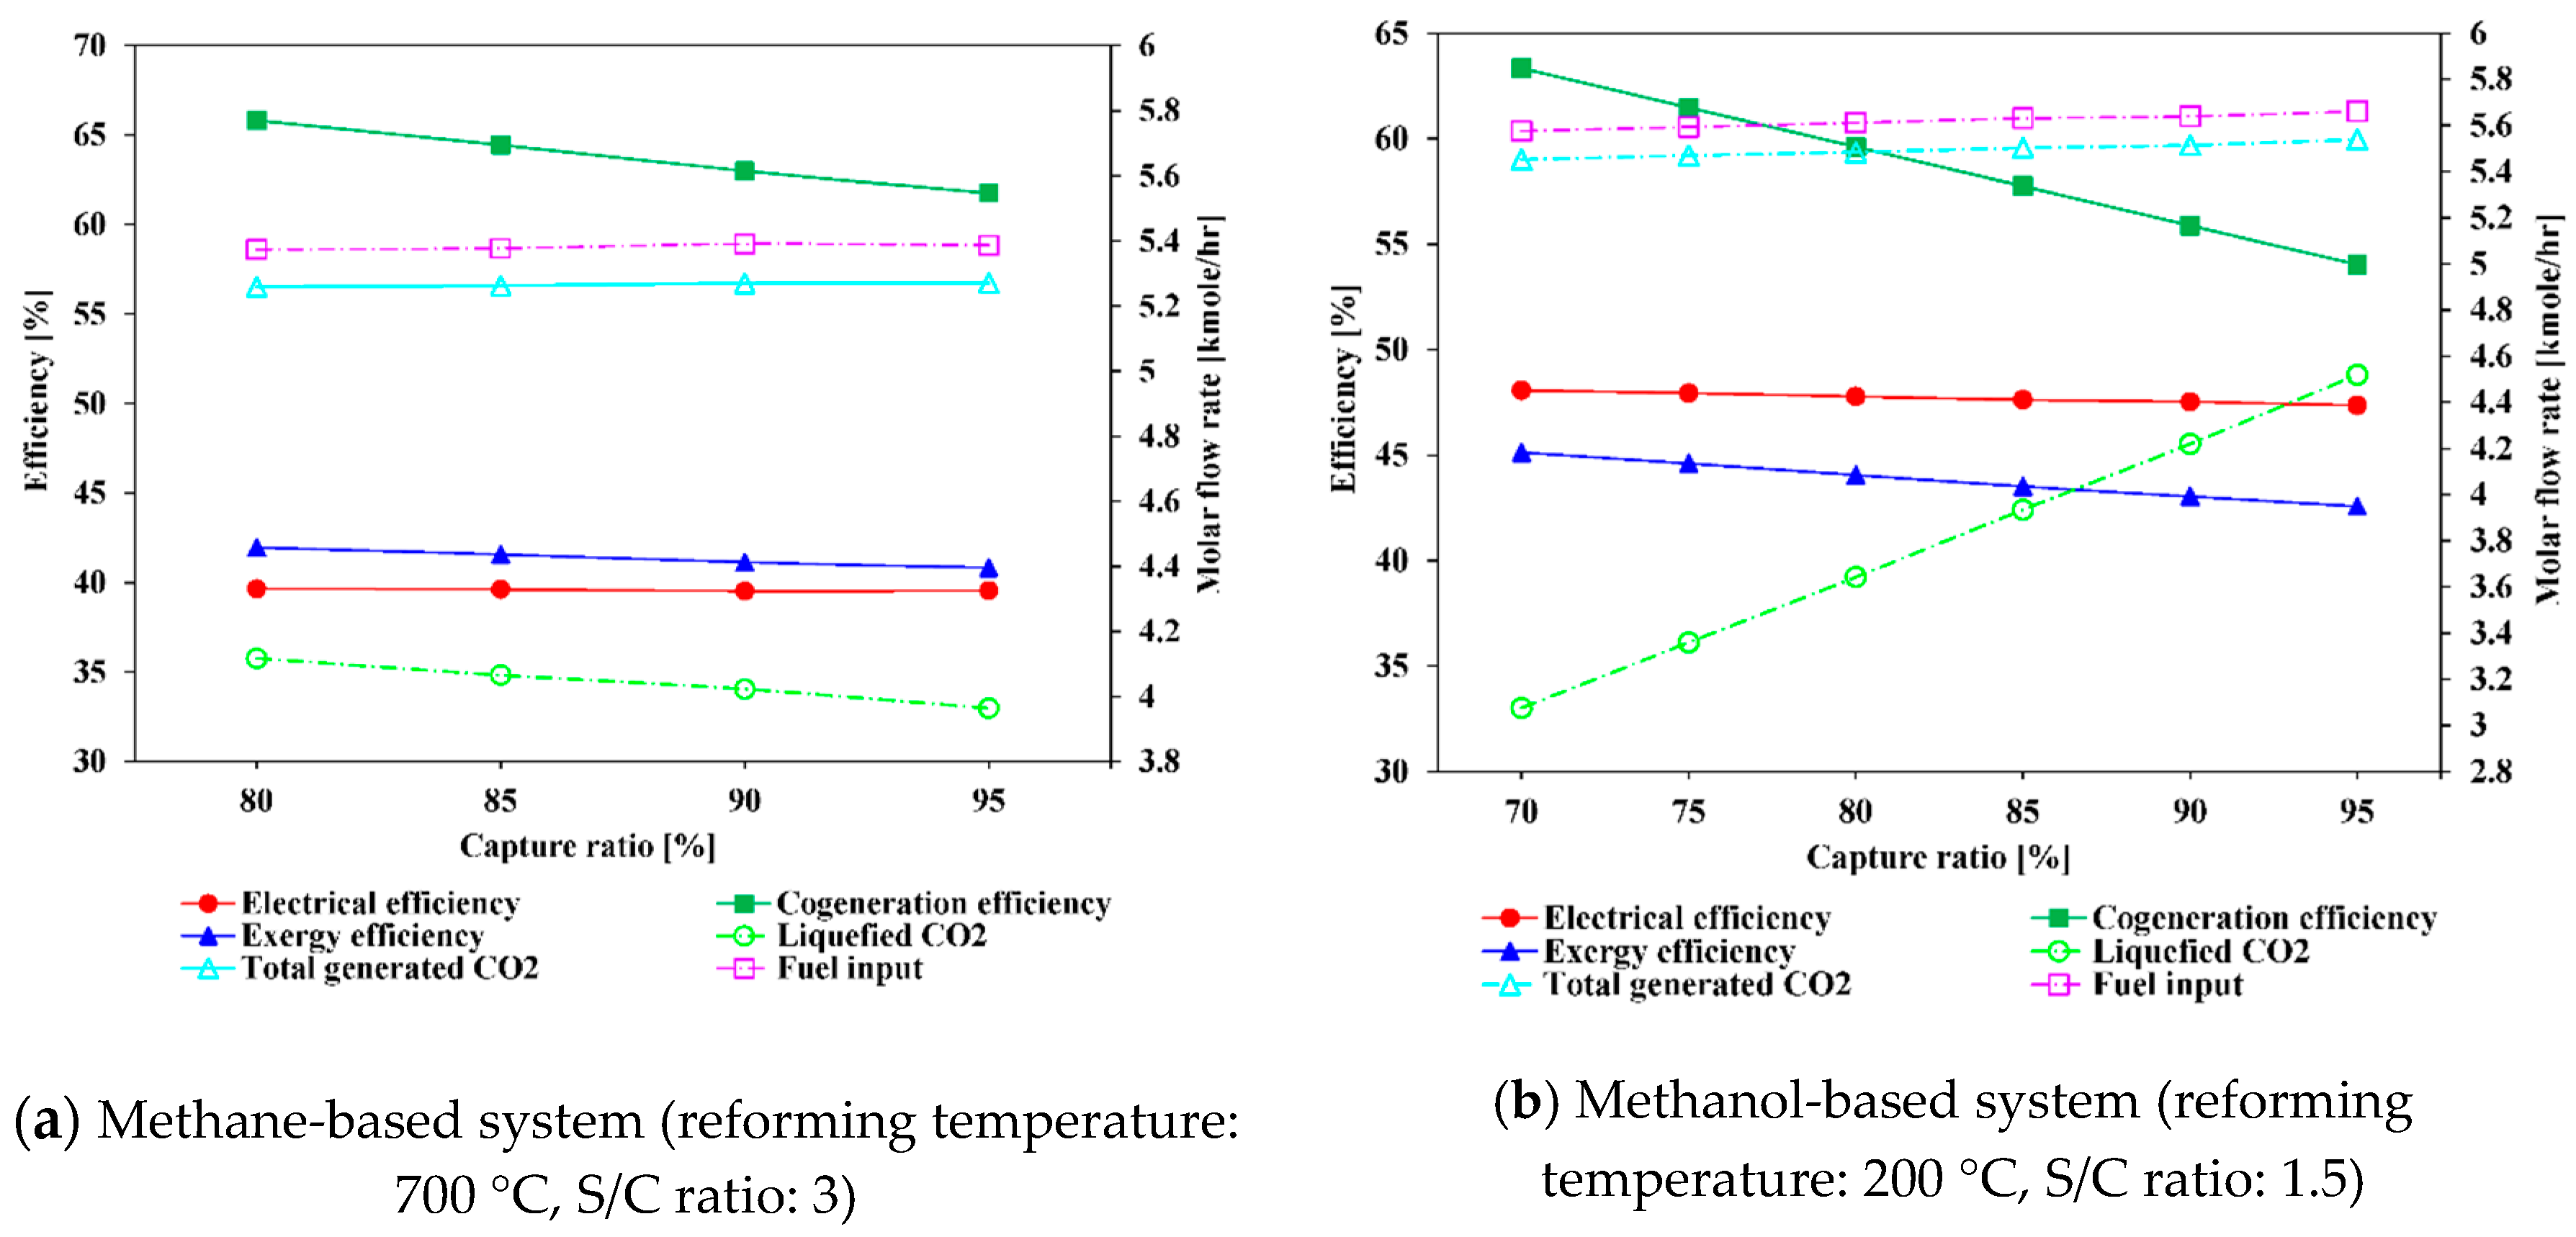
5.1.3. Effect of Varying CO2 Capture Ratio

Figure 13 shows the change of the electrical, cogeneration, and exergy efficiencies with carbon capture ratio. For the steam methane-based system, the profile of electrical efficiency is almost flat, whereas the exergy and cogeneration efficiency continuously decrease with increasing capture ratio from 80% to 95%. The exergy efficiency is reduced by 1.1% and the cogeneration efficiency by 4.06%. This trend is attributed to the fact that as the capture ratio decreased, heat consumption in the CCU decreased, leading to exergy and cogeneration efficiency. Note that a CO2 capture ratio below 80% in the methane-based system causes the formation of dry ice due to the lower temperature of LNG. Although the formation of dry ice can be managed by temperature control, it is not considered in this study. In the case of the methanol-based system, the electrical efficiency, cogeneration efficiency, and exergy efficiency decrease from 48.06%, 63.32%, and 45.12% to 47.35%, 54.03%, and 42.56%, respectively, with increasing carbon capture ratio from 70% to 95%. The higher decrease rate of electrical efficiency in the methanol-based system than that in the methane-based system is mainly attributed to the increase in power consumption of the CO2 compressor and NH3 compressors for CO2 liquefaction. In addition, as the capture ratio increases, the liquefied CO2 ratio proportionally increases because the total emitted CO2 is fixed, as presented in Table 3. In methanol-based systems, the amount of available heat is relatively small compared to that in the methane-based systems, and thus, fuel consumption increases faster than in the methane-based systems as capture rates increase.

5.2. Space and Operational Cost

Figure 14 illustrates the volume for storage of the fuel and liquefied CO2 along with the cost of fuels for the methane-based and methanol-based systems, which are required for 475 kW of net electricity generation during the total navigation time. A specific fuel cost of 9.76 USD/mmBtu for LNG [72] and 26.08 USD/mmBtu [73] for methanol are used, and both are the average cost in 2018 in the references. The result shows that that methane-based system requires 43.69 m3 for LNG storage and 32.30 m3 for the liquefied CO2 storage, whereas the methanol-based system requires 48.03 m3 for methanol and 36.17 m3 for the liquefied CO2. Accordingly, the methanol-based system needs approximately 1.1 times the volume (equivalent to 8 m3 more) for fuel and liquefied CO2 storage. In other words, the methanol-based system consumes a higher amount of methanol as fuel and generate a higher amount of CO2. Regarding the fuel cost, the methanol-based system has a 2.2 times higher fuel cost than the methane-based system for 475 kW of net electricity generation during the total navigation time. Therefore, the methane-based system is more competitive than the methanol-based system from the economic point of view, when only the fuel cost and volume are taken into account. However, note that the overall investment cost for both systems, which is beyond the scope of the current study, may also be an important factor in the selection of system.

6. Conclusions

In this work, the authors have performed a comparison between the steam methane reforming and steam methanol reforming technologies combined with HT-PEMFC and carbon capture systems for hydrogen-fueled ship applications. To find the most suitable technologies, an energy/exergy analysis, along with a space and fuel cost investigation, have been conducted. All the simulations have been conducted at a fixed Wnet, electrical (475 kW).
It is shown that, at the base condition, the energy and exergy efficiencies of the methanol-based system are 7.99% and 1.89% higher than those of the methane-based system, respectively. The different efficiencies between systems mainly arises from the reforming temperature difference. For fuel and CO2 storage, the methanol-based system requires a space 1.1 times larger than that of the methane-based system for the total navigation time, although the methanol-based system has higher electrical efficiency. Accordingly, the methanol-based system has 2.2 times higher fuel cost than the methane-based system for 475 kW of net electricity generation during the total navigation time. In the parametric study, both systems show a similar trend, in which with increasing reforming temperature and S/C ratio, the electrical, exergy, and cogeneration efficiencies gradually decreased.
The comparative analysis reveals that the methanol-based system has many technological advantages directly related to its low reforming temperature, which leads to better integration to the HT-PEMFC. However, the methane-based system showed economic advantages from the perspective of fuel cost and better availability in the maritime sector.
Furthermore, this work shows the feasibility of combining reforming, HT-PEMFC, CO2 capture, and liquefaction systems for both methanol and methane fuels in heat and power integration point of view. Excessive heat from HT-PEMFC and reformer in both methane-, methanol-based system are enough for CO2 capture unit, which require a large amount of heat to regenerate the amine solvent. In addition, for the methane based-system, cold energy of LNG, which should be vaporized, can be utilized for CO2 liquefaction, therefore power consumption for compressors can be reduced. Although separate ammonia refrigerant cycle is required for CO2 liquefaction for methanol based-system and power consumptions for compressors are slightly high, methanol based-system has still higher efficiency.
Several limitations were identified for consideration in the future study. In the present study, constant current density of 0.2 A cm−2 was assumed and resulted in a little higher electrical efficiency. More simulations in several current density within the operating window of HT-PEMFC are required in the future study. In addition, future study should use output voltage with real reformate gas for the detailed assessment. Present study compared two systems in the process simulation level, however, future study should include sizing and on-board arrangement of systems for reforming, CO2 capture, and liquefaction systems since those systems may take large spaces and lead to different results. Furthermore, other fuels such as ethanol and liquefied petroleum gas (LPG) which is getting attention together with methanol and LNG in maritime industry should be assessed in the future study. Although the present study has some limitations, the concepts suggested in this study can give other perspectives on applying hydrogen fuel cell on board and can be a good reference for the further development of hydrogen fuel cell ship.

Author Contributions

Formal analysis, H.L.; Investigation, Y.N.; Methodology, I.J. and G.R.; Supervision, H.K.; Writing—original draft, H.L.; Writing—review and editing, H.K. All authors have read and agreed to the published version of the manuscript.

Funding

This material is based upon work supported by the Technology Innovation Program (20004659, the development of LNG Fuel Gas Supply System for Coastal Ships) which was funded by the Ministry of Trade, Industry & Energy (MOTIE, Korea) and Core Technology Development and System Construction for LNG Bunkering program (20180048, Test evaluation for LNG bunkering equipment and development of test technology) which was funded by the Ministry of Oceans and Fisheries (Korea).

Conflicts of Interest

The authors declare no conflict of interest.

Nomenclature

Symbols
eSpecific exergy, kJ/kg
  E ˙ x   Exergy flow rate, kW
sSpecific entropy, kJ/kg·°C
hSpecific enthalpy, kJ/kg
PPressure, bar
TTemperature, °C
h Time, h
  m ˙   Mass flow rate, kg/h
  n ˙   Molar flow rate, kmole/h
VcOutput voltage
  μ f   Fuel utilization factor
QHeat rate, kW
  ρ   Density, kg/m3
Abbreviations
LHVLower heating value
LNGLiquefied natural gas
CCUCarbon capture unit
MEAMonoethanolamine
HT-PEMFCHigh temperature proton-exchange membrane fuel cell
LT-PEMFCLow temperature proton-exchange membrane fuel cell
OPEXOperation expenditure
WGSWater gas shift
HFOHeavy fuel oil
CCSCarbon capture and storage

References

  1. International Maritime Organization. Third IMO Greenhouse Gas Study. Available online: http://www.imo.org/en/OurWork/Environment/PollutionPrevention/AirPollution/Pages/Greenhouse-Gas-Studies-2014.aspx (accessed on 30 December 2019).
  2. DNV GL. Maritime Forecast to 2050, Energy Transition Outlook 2018. Available online: https://eto.dnvgl.com/2018/#Energy-Transition-Outlook-2018 (accessed on 30 December 2019).
  3. Initial IMO Strategy on the Reduction of GHG Emissions From Ships. Resolution MEPC. Available online: http://www.imo.org/en/MediaCentre/HotTopics/GHG/Pages/default.aspx (accessed on 30 December 2019).
  4. Zhu, M.; Fai, K.; Wei, J.; Li, K.X. Impact of maritime emissions trading system on fleet deployment and mitigation of CO2 emission. Transp. Res. Part D 2018, 62, 474–488. [Google Scholar] [CrossRef]
  5. Van Biert, L.; Godjevac, M.; Visser, K.; Aravind, P.V. A review of fuel cell systems for maritime applications. J. Power Sources 2016, 327, 345–364. [Google Scholar] [CrossRef] [Green Version]
  6. Balcombe, P.; Brierley, J.; Lewis, C.; Skatvedt, L.; Speirs, J.; Hawkes, A.; Staffell, I. How to decarbonise international shipping: Options for fuels, technologies and policies. Energy Convers. Manag. 2019, 182, 72–88. [Google Scholar] [CrossRef]
  7. Tronstad, T.; Astrand, H.H.; Haugom, G.P.; Langfeldt, L. Study on the Use of Fuel Cells in Shipping. Available online: http://www.emsa.europa.eu/component/flexicontent/download/4545/2921/23.html (accessed on 30 December 2019).
  8. Jaggi, V.; Jayanti, S. A conceptual model of a high-efficiency, stand-alone power unit based on a fuel cell stack with an integrated auto-thermal ethanol reformer. Appl. Energy 2013, 110, 295–303. [Google Scholar] [CrossRef]
  9. Romero-Pascual, E.; Soler, J. Modelling of an HTPEM-based micro-combined heat and power fuel cell system with methanol. Int. J. Hydrogen Energy 2014, 39, 4053–4059. [Google Scholar] [CrossRef]
  10. Hydrogen Analysis Resource Center. Lower and Higher Heating Values of Fuels. Available online: https://h2tools.org/hyarc/hydrogen-data/lower-and-higher-heating-values-hydrogen-and-other-fuels (accessed on 30 December 2019).
  11. Vessels, M. Fuel Cell Applications for Marine Vessels Why Fuel Cells Make Sense. Available online: https://info.ballard.com/fuel-cell-applications-for-marine-vessels?hsCtaTracking=8b99d2e2-4e14-44a2-b88d-9cda7551cd89%7Cdef386da-b1b5-49ff-983b-9cdcf065b567 (accessed on 30 December 2019).
  12. Nerem, T. Assessment of Marine Fuels in a Fuel Cell on a Cruise Vessel. Available online: https://ntnuopen.ntnu.no/ntnu-xmlui/bitstream/handle/11250/2564492/19196_FULLTEXT.pdf?sequence=1&isAllowed=y (accessed on 30 December 2019).
  13. Sattler, G. Fuel cells going on-board. J. Power Sources 2000, 86, 61–67. [Google Scholar] [CrossRef]
  14. Welaya, Y.M.A.; El Gohary, M.M.; Ammar, N.R. Steam and partial oxidation reforming options for hydrogen production from fossil fuels for PEM fuel cells. Alex. Eng. J. 2012, 51, 69–75. [Google Scholar] [CrossRef] [Green Version]
  15. e4ships FUEL CELLS IN MARINE APPLICATIONS. Available online: https://www.e4ships.de/app/download/13416971890/e4ships_Brochure_engl_2016.pdf?t=1568291372 (accessed on 30 December 2019).
  16. Rajasekhar, D.; Narendrakumar, D. Fuel Cell Technology for Propulsion and Power Generation of Ships: Feasibility Study on Ocean Research Vessel Sagarnidhi. J. Ship. Ocean Eng. 2020, 5, 219–228. [Google Scholar]
  17. Saito, N. The Maritime Commons: Digital Repository of the World. The Economic Analysis of Commercial Ships with Hydrogen Fuel Cell through Case Studies. Available online: https://commons.wmu.se/cgi/viewcontent.cgi?article=1617&context=all_dissertations (accessed on 30 December 2019).
  18. Han, J.; Charpentier, J.F.; Tang, T. State of the Art of Fuel Cells for Ship Applications. In Proceedings of the 2012 IEEE International Symposium on Industrial Electronics, Hangzhou, China, 28–31 May 2012. [Google Scholar]
  19. Alvarez, C.; Fern, C.; Carral, L. Analysing the possibilities of using fuel cells in ships. Int. J. Hydrogen Energy 2015, 41, 2853–2866. [Google Scholar] [CrossRef]
  20. Leo, T.J.; Durango, J.A.; Navarro, E. Exergy analysis of PEM fuel cells for marine applications. Energy 2010, 35, 1164–1171. [Google Scholar] [CrossRef]
  21. Faungnawakij, K.; Kikuchi, R.; Eguchi, K. Thermodynamic evaluation of methanol steam reforming for hydrogen production. J. Power Sources 2006, 161, 87–94. [Google Scholar] [CrossRef]
  22. Chen, B.; Liao, Z.; Wang, J.; Yu, H.; Yang, Y. Exergy analysis and CO2 emission evaluation for steam methane reforming. Int. J. Hydrogen Energy 2012, 37, 3191–3200. [Google Scholar] [CrossRef]
  23. Simpson, A.P.; Lutz, A.E. Exergy analysis of hydrogen production via steam methane reforming. Int. J. Hydrogen Energy 2007, 32, 4811–4820. [Google Scholar] [CrossRef]
  24. Alhamdani, Y.A.; Hassim, M.H.; Ng, R.T.L.; Hurme, M. The estimation of fugitive gas emissions from hydrogen production by natural gas steam reforming. Int. J. Hydrogen Energy 2017, 42, 9342–9351. [Google Scholar] [CrossRef]
  25. Authayanun, S.; Saebea, D.; Patcharavorachot, Y.; Arpornwichanop, A. Effect of different fuel options on performance of high-temperature PEMFC (proton exchange membrane fuel cell) systems. Energy 2014, 68, 989–997. [Google Scholar] [CrossRef]
  26. Arsalis, A.; Nielsen, M.P.; Kær, S.K. Modeling and parametric study of a 1 kWe HT-PEMFC-based residential micro-CHP system. Int. J. Hydrogen Energy 2011, 36, 5010–5020. [Google Scholar] [CrossRef]
  27. Herdem, M.S.; Farhad, S.; Hamdullahpur, F. Modeling and parametric study of a methanol reformate gas-fueled HT-PEMFC system for portable power generation applications. Energy Convers. Manag. 2015, 101, 19–29. [Google Scholar] [CrossRef]
  28. Palo, D.R.; Dagle, R.A.; Holladay, J.D. Methanol steam reforming for hydrogen production. Chem. Rev. 2007, 107, 3992–4021. [Google Scholar] [CrossRef]
  29. Mousavi Ehteshami, S.M.; Chan, S.H. Techno-Economic Study of Hydrogen Production via Steam Reforming of Methanol, Ethanol, and Diesel. Energy Technol. Policy 2014, 1, 15–22. [Google Scholar] [CrossRef] [Green Version]
  30. Zhu, L.; Li, L.; Fan, J. A modified process for overcoming the drawbacks of conventional steam methane reforming for hydrogen production: Thermodynamic investigation. Chem. Eng. Res. Des. 2015, 104, 792–806. [Google Scholar] [CrossRef]
  31. Ye, L.; Jiao, K.; Du, Q.; Yin, Y. Exergy analysis of high-temperature proton exchange membrane fuel cell systems. Int. J. Green Energy 2015, 12, 917–929. [Google Scholar] [CrossRef]
  32. Ishihara, A.; Mitsushima, S.; Kamiya, N.; Ota, K.I. Exergy analysis of polymer electrolyte fuel cell systems using methanol. J. Power Sources 2004, 126, 34–40. [Google Scholar] [CrossRef] [Green Version]
  33. Wiese, W.; Emonts, B.; Peters, R. Methanol steam reforming in a fuel cell drive system. J. Power Sources 1999, 84, 187–193. [Google Scholar] [CrossRef]
  34. Lotrič, A.; Sekavčnik, M.; Pohar, A.; Likozar, B.; Hočevar, S. Conceptual design of an integrated thermally self-sustained methanol steam reformer—High-temperature PEM fuel cell stack manportable power generator. Int. J. Hydrogen Energy 2017, 42, 16700–16713. [Google Scholar] [CrossRef]
  35. TNO; Maritime Knowledge Centre. TU Delft Framework CO2 Reduction in Shipping. Available online: https://www.mkc-net.nl/library/documents/893/download/ (accessed on 30 December 2019).
  36. Voldsund, M.; Jordal, K.; Anantharaman, R. Hydrogen production with CO2 capture. Int. J. Hydrogen Energy 2016, 41, 4969–4992. [Google Scholar] [CrossRef]
  37. Ferrara, G.; Lanzini, A.; Leone, P.; Ho, M.T.; Wiley, D.E. Exergetic and exergoeconomic analysis of post-combustion CO2 capture using MEA-solvent chemical absorption. Energy 2017, 130, 113–128. [Google Scholar] [CrossRef]
  38. Bhown, A.S.; Freeman, B.C. Analysis and status of post-combustion carbon dioxide capture technologies. Environ. Sci. Technol. 2011, 45, 8624–8632. [Google Scholar] [CrossRef]
  39. Aaron, D.; Tsouris, C. Separation of CO2 from flue gas: A review. Sep. Sci. Technol. 2005, 40, 321–348. [Google Scholar] [CrossRef]
  40. Fan, J.; Zhu, L. Performance analysis of a feasible technology for power and high-purity hydrogen production driven by methane fuel. Appl. Therm. Eng. 2015, 75, 103–114. [Google Scholar] [CrossRef]
  41. Fan, J.; Zhu, L.; Jiang, P.; Li, L.; Liu, H. Comparative exergy analysis of chemical looping combustion thermally coupled and conventional steam methane reforming for hydrogen production. J. Clean. Prod. 2016, 131, 247–258. [Google Scholar] [CrossRef]
  42. Oh, S.Y.; Binns, M.; Cho, H.; Kim, J.K. Energy minimization of MEA-based CO2 capture process. Appl. Energy 2016, 169, 353–362. [Google Scholar] [CrossRef]
  43. Mangalapally, H.P.; Notz, R.; Hoch, S.; Asprion, N.; Sieder, G.; Garcia, H.; Hasse, H. Pilot plant experimental studies of post combustion CO2 capture by reactive absorption with MEA and new solvents. Energy Procedia 2009, 1, 963–970. [Google Scholar] [CrossRef] [Green Version]
  44. Abu-Zahra, M.R.M.; Schneiders, L.H.J.; Niederer, J.P.M.; Feron, P.H.M.; Versteeg, G.F. CO2 capture from power plants. Part I. A parametric study of the technical performance based on monoethanolamine. Int. J. Greenh. Gas Control 2007, 1, 37–46. [Google Scholar] [CrossRef]
  45. Romeo, L.M.; Bolea, I.; Escosa, J.M. Integration of power plant and amine scrubbing to reduce CO2 capture costs. Appl. Therm. Eng. 2008, 28, 1039–1046. [Google Scholar] [CrossRef]
  46. Goo, S.; Bong, G.; Jun, C.; Min, J. Chemical Engineering Research and Design Optimal design and operating condition of boil-off CO2 re-liquefaction process, considering seawater temperature variation and compressor discharge. Chem. Eng. Res. Des. 2017, 124, 29–45. [Google Scholar]
  47. Feenstra, M.; Monteiro, J.; van den Akker, J.T.; Abu-Zahra, M.R.M.; Gilling, E.; Goetheer, E. Ship-based carbon capture onboard of diesel or LNG-fuelled ships. Int. J. Greenh. Gas Control 2019, 85, 1–10. [Google Scholar] [CrossRef]
  48. Berstad, D.; Anantharaman, R.; Nekså, P. Low-temperature CO2 capture technologies—Applications and potential. Int. J. Refrig. 2013, 36, 1403–1416. [Google Scholar] [CrossRef]
  49. Minnehan, J.J.; Pratt, J.W. Practical Application Limits of Fuel Cells and Batteries for Zero Emission Vessels. Available online: https://energy.sandia.gov/wp-content/uploads/2017/12/SAND2017-12665.pdf (accessed on 30 December 2019).
  50. Hajjaji, N.; Pons, M.N.; Houas, A.; Renaudin, V. Exergy analysis: An efficient tool for understanding and improving hydrogen production via the steam methane reforming process. Energy Policy 2012, 42, 392–399. [Google Scholar] [CrossRef]
  51. Liquefied Natural Gas (LNG). Operations Consistent Methodology for Estimating Greenhouse Gas Emissions. Available online: https://www.api.org/~/media/Files/EHS/climate-change/api-lng-ghg-emissions-guidelines-05-2015.pdf (accessed on 30 December 2019).
  52. Iulianelli, A.; Ribeirinha, P.; Mendes, A.; Basile, A. Methanol steam reforming for hydrogen generation via conventional and membrane reactors: A review. Renew. Sustain. Energy Rev. 2014, 29, 355–368. [Google Scholar] [CrossRef] [Green Version]
  53. Tzanetis, K.F.; Martavaltzi, C.S.; Lemonidou, A.A. Comparative exergy analysis of sorption enhanced and conventional methane steam reforming. Int. J. Hydrogen Energy 2012, 37, 16308–16320. [Google Scholar] [CrossRef]
  54. Nalbant, Y.; Colpan, C.O.; Devrim, Y. Energy and exergy performance assessments of a high temperature-proton exchange membrane fuel cell based integrated cogeneration system. Int. J. Hydrogen Energy 2019, 1–11. [Google Scholar] [CrossRef]
  55. Ribeirinha, P.; Abdollahzadeh, M.; Sousa, J.M.; Boaventura, M.; Mendes, A. Modelling of a high-temperature polymer electrolyte membrane fuel cell integrated with a methanol steam reformer cell. Appl. Energy 2017, 202, 6–19. [Google Scholar] [CrossRef]
  56. Boaventura, M.; Sander, H.; Friedrich, K.A.; Mendes, A. The influence of CO on the current density distribution of high temperature polymer electrolyte membrane fuel cells. Electrochim. Acta 2011, 56, 9467–9475. [Google Scholar] [CrossRef]
  57. Ersoz, A.; Olgun, H.; Ozdogan, S. Simulation study of a proton exchange membrane (PEM) fuel cell system with autothermal reforming. Energy 2006, 31, 1490–1500. [Google Scholar] [CrossRef]
  58. Zohrabian, A.; Mansouri, M.; Soltanieh, M. Techno-economic evaluation of an integrated hydrogen and power co-generation system with CO2 capture. Int. J. Greenh. Gas Control 2016, 44, 94–103. [Google Scholar] [CrossRef]
  59. Haydary, J. Chemical Process Design and Simulation: Aspen Plus and Aspen Hysys Applications; John Wiley & Sons: Hoboken, NJ, USA, 2019; ISBN 1119089115. [Google Scholar]
  60. Simpson, A.P.; Simon, A.J. Second law comparison of oxy-fuel combustion and post-combustion carbon dioxide separation. Energy Convers. Manag. 2007, 48, 3034–3045. [Google Scholar] [CrossRef]
  61. Andreasen, S.J.; Vang, J.R.; Kær, S.K. High temperature PEM fuel cell performance characterisation with CO and CO2 using electrochemical impedance spectroscopy. Int. J. Hydrogen Energy 2011, 36, 9815–9830. [Google Scholar] [CrossRef]
  62. Devrim, Y.; Albostan, A.; Devrim, H. Experimental investigation of CO tolerance in high temperature PEM fuel cells. Int. J. Hydrogen Energy 2018, 43, 18672–18681. [Google Scholar] [CrossRef]
  63. Oh, K.; Ju, H. Temperature dependence of CO poisoning in high-temperature proton exchange membrane fuel cells with phosphoric acid-doped polybenzimidazole membranes. Int. J. Hydrogen Energy 2015, 40, 7743–7753. [Google Scholar] [CrossRef]
  64. Jo, A.; Oh, K.; Lee, J.; Han, D.; Kim, D.; Kim, J.; Kim, B.; Kim, J.; Park, D.; Kim, M.; et al. Modeling and analysis of a 5 kWe HT-PEMFC system for residential heat and power generation. Int. J. Hydrogen Energy 2017, 42, 1698–1714. [Google Scholar] [CrossRef]
  65. Larminie, J.; Dicks, A.; McDonald, M.S. Fuel Cell Systems Explained; J. Wiley: Chichester, UK, 2003; Volume 2. [Google Scholar]
  66. Authayanun, S.; Hacker, V. Energy and exergy analyses of a stand-alone HT-PEMFC based trigeneration system for residential applications. Energy Convers. Manag. 2018, 160, 230–242. [Google Scholar] [CrossRef]
  67. Tsatsaronis, G. Definitions and nomenclature in exergy analysis and exergoeconomics. Energy 2007, 32, 249–253. [Google Scholar] [CrossRef]
  68. Hinderink, A.P.; Kerkhof, F.P.J.M.; Lie, A.B.K.; De Swaan Arons, J.; Van Der Kooi, H.J. Exergy analysis with a flowsheeting simulator—I. Theory; calculating exergies of material streams. Chem. Eng. Sci. 1996, 51, 4693–4700. [Google Scholar] [CrossRef]
  69. Mert, S.O.; Ozcelik, Z.; Dincer, I. Comparative assessment and optimization of fuel cells. Int. J. Hydrogen Energy 2015, 40, 7835–7845. [Google Scholar] [CrossRef]
  70. Obara, S.; Tanno, I. Exergy analysis of a regional-distributed PEM fuel cell system. Int. J. Hydrogen Energy 2008, 33, 2300–2310. [Google Scholar] [CrossRef]
  71. Lee, H.; Shao, Y.; Lee, S.; Roh, G.; Chun, K.; Kang, H. Analysis and assessment of partial re-liquefaction system for liquefied hydrogen tankers using liquefied natural gas (LNG)and H2 hybrid propulsion. Int. J. Hydrogen Energy 2019, 44, 15056–15071. [Google Scholar] [CrossRef]
  72. BP Statistical Review of World Energy Statistical Review of World. Available online: https://www.bp.com/content/dam/bp/business-sites/en/global/corporate/pdfs/energy-economics/statistical-review/bp-stats-review-2019-natural-gas.pdf (accessed on 30 December 2019).
  73. Methanex Monthly Average Regional Posted Contract Price History. Available online: https://www.methanex.com (accessed on 30 December 2019).
Figure 1. Block diagram of steam methane reforming-based system.
Energies 13 00224 g001
Figure 2. Process flow diagram for steam methane reforming-based system.
Energies 13 00224 g002
Figure 3. Block diagram of steam methanol reforming-based system.
Energies 13 00224 g003
Figure 4. Process flow diagram for steam methanol reforming-based system.
Energies 13 00224 g004
Figure 5. Electrical, cogeneration, and exergy efficiencies of the methane-based and methanol-based systems for 475 kW of net electricity generation.
Energies 13 00224 g005
Figure 6. Break-down of electricity consumption of the methane-based and methanol-based systems for 475 kW of net electricity generation.
Energies 13 00224 g006
Figure 7. Overall energy consumption and generation of the methane-based and methanol-based systems for 475 kW of net electricity generation.
Energies 13 00224 g007
Figure 8. Break-down of exergy destruction for the methane based-system. Total exergy destruction 690.68 kW. (Unit names: Exergy destruction, kW; exergy destruction ratio, %).
Energies 13 00224 g008
Figure 9. Break-down of exergy destruction for the methanol based-system. Total exergy destruction 591.16 kW. (Unit names: Exergy destruction, kW; exergy destruction ratio, %).
Energies 13 00224 g009
Figure 10. Variation of H2 molar flow rates of the exit gases from the reformer as a function of the S/C ratio and reforming temperature.
Energies 13 00224 g010
Figure 11. Influence of reforming temperature on system efficiencies and variation of molar flow rates of CO2 and fuel.
Energies 13 00224 g011
Figure 12. Influence of S/C ratio on system efficiencies and variation of molar flow rates of CO2 and fuel.
Energies 13 00224 g012
Figure 13. Influence of CO2 capture ratio on system efficiencies and variation of molar flow rates of CO2 and fuel.
Energies 13 00224 g013
Figure 14. Fuel volumes and cost of methane-based and methanol-based systems for 475 kW of net electricity generation during the total navigation time.
Energies 13 00224 g014
Table 1. Simulation parameters about steam methane and steam methanol reforming from the open literature.
Ref.Primary FuelsS/C RatioPref
>(Bar)
Tref
>(°C)
Notes
[23]Methane3.210700Purpose of paper was to evaluate performance of hydrogen production via steam methane reforming.
[30]425900Steam methane reforming system was modeled and reformer in simulation was developed using a Gibbs equilibrium model in Aspen Plus. For CO2 capture, MEA scrubbing process was applied as black box model.
[31]31700Steam methane reforming system integrated with HT-PEMFC was simulated and performance was evaluated by exergy analysis.
[32]Methanol1.2-350Steam methanol reforming system integrated with PEMFC was simulated and performance was evaluated by exergy analysis.
[33]1.53.8260Steam methanol reforming system was experimented and the obtained results were used for simulation of power train integrated system.
[34]1–2-240–300Steam methanol reforming system integrated with HT-PEMFC was simulated. Parametric study with varying S/C ratio, Tref, reformate composition, etc. were implemented.
Table 2. Specification of the reference ship.
SpecificationsValues
Type General Cargo
Overall length 120 m
Beam13 m
Deadweight3000 tonnage
Main engine power3800 kW
Maximum speed14 knots
Average speed7 knots
Total voyage time209 h
Load factor0.125
Average shaft power475 kW
Table 3. Base condition of simulations.
Unit NameParameterValues
Steam Methane Reforming-Based SystemSteam Methanol Reforming-Based System
Steam reformerOperating temperature 700 °C [23,31]200 °C [34]
Operating pressure 3 bar3 bar
S/C ratio3 [31,53]1.5 [27]
WGS reactorOperating temperature250 °C [54]
Operating pressure1.1 bar
CombustorOperating temperature 800 °C300 °C
Operating pressure1.1 bar1.1 bar
Air-fuel ratio1.05 [30,41]1.05 [27]
HT-PEMFCFuel utilization factor0.83 [31,55]
Cathode stoichiometric ratio2 [31,55]
Operating temperature160 °C [31]
Operating pressure 1.1 bar
Output voltage per cell0.637 V [56]
Current density0.2 A cm−2 [56]
CO2 capture unit [38]SolventMEA
Feed gas temperature40 °C
Steam temperature130 °C
Specific reboiler duty5112 kJ/kg CO2
CO2 Capture ratio90%
CO2 Liquefaction systemRefrigerantLNGNH3
Liquefaction condition−8.5 °C at 7 bar−29.75 °C at 14 bar
Total emitted CO2 to ATM (Stream E11 and E12)55.83 kg/h
CompressorsPolytropic efficiency75%
PumpAdiabatic efficiency85%
ConverterEfficiency98% [57]
Heat exchangersMin. temperature approachHeat exchangers for CO2 liquefaction: 3 °C [46] Other heat exchangers: 10 °C [41]
Net electrical power (AC)475 (±0.2) kW
Note: For comparison purpose, the mass flow rate of total emitted CO2 of the steam methanol reforming-based system is adjusted to have the same value as that of the steam methane reforming-based system.
Table 4. Equation of exergy destruction and efficiency of the components.
ComponentsExergy Destruction
Compressors [53] E ˙ x dest   = E ˙ x in + P in ,   comp E ˙ x out
Pumps [53]   E ˙ x dest   = E ˙ x in + P in ,   pump E ˙ x out  
Heat exchangers [53]   E ˙ x dest = E ˙ x in E ˙ x out = ( Ex ˙ in Ex ˙ out ) hot + ( Ex ˙ in E ˙ x out ) cold
Reformer-Combustor [53]   E ˙ x dest = E ˙ x in E ˙ x out = E ˙ x in ,   feed + E ˙ x in ,   fuel + E ˙ x in ,   off   gas   from   HT PEMFC E ˙ x out ,   reformate   gas   from   reformer E ˙ x out ,   exhaust   gas
WGS [53] E ˙ x dest = E ˙ x in E ˙ x out = E ˙ x in ,   reformate   gas   from   reformer + E ˙ x in ,   cooling   water E ˙ x out ,   reformate   gas   to   HT PEMFC E ˙ x out ,   cooling   water
Separators   E ˙ x dest = E ˙ x in E ˙ x out  
HT-PEM fuel cell [69,70] E ˙ x dest = E ˙ x in E ˙ x out = E ˙ x in ,   reformate   gas   from   WGS + E ˙ x in ,   air + E ˙ x in ,   cooling   water E ˙ x out ,   air E ˙ x out ,   cooling   water E ˙ x out ,   off   gas P out ,   electrical
Coolers [53]   E ˙ x dest = E ˙ x in E ˙ x out  
Valves   E ˙ x dest = E ˙ x in E ˙ x out  

