Abstract
In the present work, two approaches for the phase current measurement of a permanent magnet synchronous motor (PMSM) were compared. The measured phase current was distorted by glitches, and a software method to eliminate these glitches was necessary. An averaging of samples was carried out, and the experimental results indicated that averaging was essential for further calculations. Moreover, the PMSM operated smoothly, and the difference between the set point and the actual speed was reduced for the full range of loads from the free run up to a full load. The increasing popularity of field-programmable gate array (FPGA) devices has encouraged developments in PMSM controllers using a direct hardware approach and the classic software approach utilizing a digital signal processor unit. In this study, the selected performance of TMS320F2812 and Spartan-3E were compared. This paper proposes an original adaptive correction method for a current transducer.
1. Introduction
Recent advances in car designs have partially originated from the dynamic development of electric power drive systems. The most promising is the permanent magnet synchronous motor (PMSM) due to its low weight, small size, high efficiency, and torque. Electric motors built using NdFeB permanent magnets have a simple structure [1]. The motor stator is usually similar to the stator of induction motors, and the rotor consists of permanent magnets. The magnets and the armature winding are positioned so that the electromotive force (EMF) generated as a result of rotation is sinusoidal. PMSM motors operate in a wide range of rotation speeds [1,2,3]. Due to construction with an electronic commutator, these motors require a power electronic drive system, typically using field-oriented control (FOC). The essential features of motors with permanent magnets are low weight, high efficiency, and torque. All of these features are very important for electric vehicle design.
In electrical engineering, current sensing is one of several techniques used to measure electric current. The selection of a current sensing method depends on requirements such as magnitude, accuracy, bandwidth, robustness, cost, isolation, and size.
Low-side current sensing is when the voltage is measured across a sense resistor that is placed between the load and the ground. Figure 1a shows the configuration for low-side current sensing. High-side current sensing is when the voltage is measured across a sense resistor that is placed between the load and the power supply. Figure 1b shows the configuration for high-side current sensing. Current sense amplifiers (Figure 1c), also called current shunt monitors, are specialized differential amplifiers with a precisely matched resistive gain network with the following characteristics:
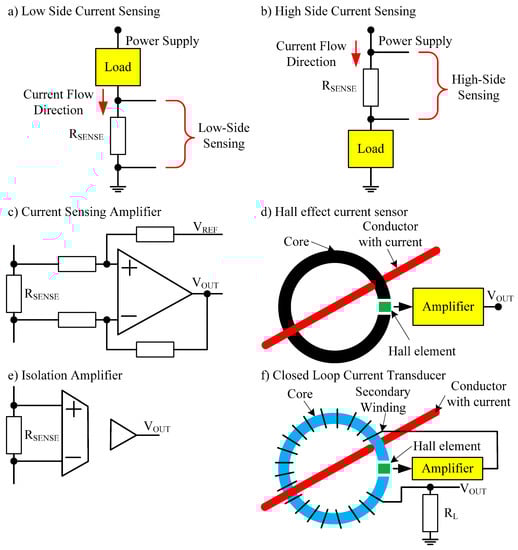
Figure 1.
Methods for current measurement.
- designed to monitor the current flow by measuring the voltage drop across a sense element, typically a shunt resistor;
- tend to be easier to use, more precise, and less prone to noise.
In a typical application, the Hall sensor is used in combination with a ring-shaped soft ferromagnetic core. The Hall sensor is placed in a small air gap, and the current conductor is passed through the inner part of the ferromagnetic ring. The ferromagnetic ring concentrates and amplifies the magnetic flux on the Hall sensor, which generates an output voltage proportional to the current. Figure 1d shows a typical application for current measurement.
An isolation amplifier is a form of differential amplifier that allows the measurement of small signals in the presence of a high common-mode voltage by providing electrical isolation and an electrical safety barrier (Figure 1e).
In the closed-loop architecture (Figure 1f), the magnetic field induced by the measured (primary) current is exactly cancelled by a secondary current, which has a smaller primary and secondary turns ratio and is easily measured at the precise resistance RL. The exact sensitivity of the Hall cell is therefore no longer of importance. Furthermore, the bandwidth of the signal from the Hall cell and its noise may be kept low because the current in RL comes directly from the primary and secondary transformer effect at frequencies above a few kilohertz. These improvements, however, need a transducer construction, which is more costly and is limited to its small size. In addition, the maximum measurable primary current is restricted by practical limits to the secondary current and the number of turns of the secondary winding.
Table 1 presents a summary of the discussed current measurement methods.

Table 1.
Summary of current measurement methods.
Looking at Table 1, it can be seen that closed-loop current transducers have the greatest advantages. In addition, they are reliable and enable the measurement of high currents. Therefore, they are ideal for measuring the PMSM phase currents. The electric scheme of the current used for the voltage transducer CASR 25-NP is shown in Figure 2 [4].
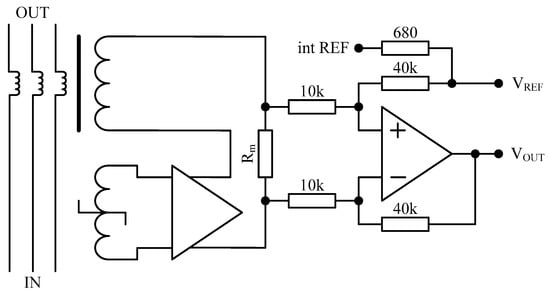
Figure 2.
Electric scheme of the CASR 25-NP (LEM, USA) current transducer [4].
The current transducer has three windings that can be connected in series, in parallel, or in series in parallel depending on the current measuring range.
Features:
- closed-loop (compensated) multirange current transducer;
- voltage output;
- single supply;
- isolated plastic case material recognized according to UL 94-V0;
- compact design for printed circuit board (PCB) mounting;
- very low temperature coefficient of offset;
- very good dv/dt immunity;
- LTSR-compatible footprint;
- reduced height;
- reference pin with two modes: Ref IN and Ref OUT; and
- extended measuring range for unipolar measurement.
The CASR series current transducer has insulated, highly accurate measurements from 1.5 to 50 Arms. It has been specially designed to respond to the technology advances in drives and inverters in an industrial environment requiring better performance. The closed-loop fluxgate technology of the current transducer measures current over a wide frequency range, including direct current (DC). It provides contact-free coupling to the current that needs to be measured as well as safe galvanic isolation and high reliability. Its output signal is an accurate, high-resolution image of the primary current with a very short delay. In higher frequency ranges, this transducer functions exactly the same way as current transformers, where a relatively small induced voltage in the secondary winding is capable of driving the secondary current through the secondary winding and, most importantly, through the burden resistor. A low induced voltage equals low magnetic flux in the magnetic core, which is the reason for the good accuracy [4].
The closed loop takes a secondary winding to the output. This secondary winding is wrapped around the magnetic circuit in a way that the secondary current creates a magnetic field in opposition to that created by the primary current. This creates a relatively flux-less core. The benefits of the closed loop are virtual lack of eddy currents and higher bandwidth. The output can be modelled as a current source with a current proportional to the primary current in a ratio determined by the secondary winding count. The fact that the gain is determined by the secondary windings count makes it virtually immune to gain change over temperature. A closed-loop transducer data sheet shows a very low temperature effect on gain characteristic. The current output is a benefit as it is less susceptible to noise sources within the application. The output current of a closed loop is typically driven through a burden resistor (Rm). The current passing thorough the resistor creates a voltage drop that be driven to the internal current sense amplifier and can be measured by an analogue-to-digital converter (ADC) [4].
2. Control Unit for the PMSM
To achieve high-quality control of the PMSM, the FOC technique is used. These algorithms make it possible to control both rotation speed and torque. A schematic block diagram of the control system is given in Figure 3. The vector control of the PMSM is based on feedback signal measurement (stator winding current and angular position of the rotor). The obtained values are subject to transformations to a two-phase circuit. Next, new values for phase voltages are calculated based on the measured and required settings. In the next step, the rotating reference system is transformed into a three-phase static reference system. Based on computed voltage values, the power module of the inverter is controlled. Embedded sensors provide currents for phases of the motor and the rotation angle of the motor shaft. The current sensor output is passed through an antialiasing filter and applied to ADC inputs. Next, continuous signals are sampled and quantized. The obtained phase currents are transformed using the Clarke transform, resulting from the computation of iα and iβ [5,6,7,8,9,10,11].
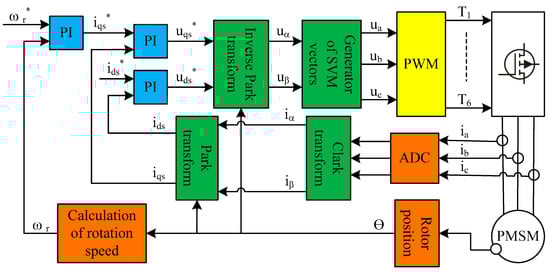
Figure 3.
Diagram of signal flows for a permanent magnet synchronous motor (PMSM).
Next, the rotor position (θ) is used to carry out the Park transform. This makes it possible to compute the (id, iq) values in the rotating coordinate system. As a result of the foregoing calculations, the values of the currents (ids, iqs) are obtained. In the next step, the differences in the already calculated values of the currents (ids, iqs) and the set point values (ids*, iqs*) are computed and applied to the proportional–integral (PI) controller. This allows the values for the voltages (uqs*, uds*) of the rotating coordinate system to be determined. To drive the power inverter, the inverse Park transform is first computed. This links the current shaft position with the rotating coordinate system to project it to a static coordinate system (uα, uβ). Computed values serve as the basis to calculate the instantaneous voltages (ua, ub, uc) delivered from the inverter. To control the power transistor switches, voltage values are transformed to T1–T6 digital waveforms with respective duty factors. These values are delivered by the pulse width modulation (PWM) module dedicated to controlling the power transistors of the inverter. Direct conversion from the two-phase system (uα, uβ) to the three-phase voltage system (ua, ub, uc) is obtained by space vector modulation (SVM). The motor rotation speed ωr is calculated based on the difference in shaft rotation angle in a given period of time. This calculation can be performed by summing the increase in the shaft position from a given number of shaft position samples. The difference between the current rpm ωr and given rpm ωr* is passed to the input of the PI regulator, which then calculates the new value of iqs* that corresponds to the control of the motor torque. The procedure for flux control by means of ids* is very similar. The equations for the Clarke and Park transformations are represented in Equations (1) and (2), respectively:
The inverse Clarke transformation is just a rotation of input values by the shaft position angle (3):
By transforming the stationary αβ-axis frame to the stationary three-axis frame, the three-phase reference frame of the stator is presented in Equation (4):
Measurement of motor phase currents ia, ib, and ic is fundamental in controlling a PMSM permanent magnet motor with a sinusoidal distribution of the EMF [12,13,14].
3. Materials and Methods
To perform the planned experiments, a laboratory setup was prepared (Figure 4).
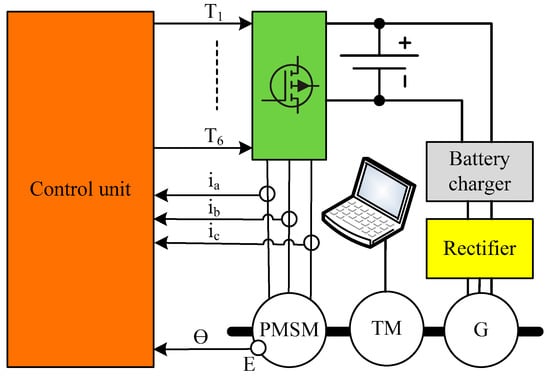
Figure 4.
The laboratory setup for encoder testing of the drive with a PMSM.
The PMSM was linked to a torque measuring (TM) device, a generator (G), and an encoder (E) by means of a common shaft. A three-phase 1 kW brushless DC (BLDC) motor worked as the generator. A DATAFLEX 22/20 device (KTR, Germany) placed on the torque-measuring shaft was used for torque sensing [15]. A detailed block diagram of the control unit is presented in Figure 5.
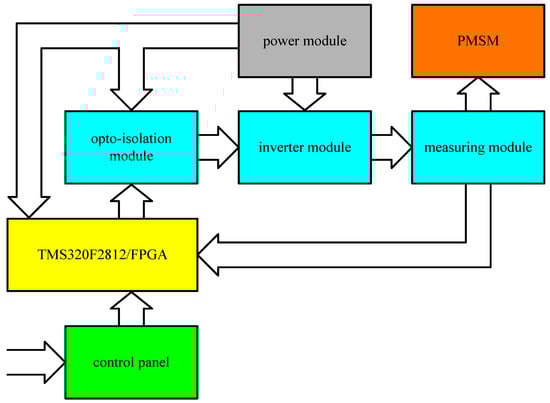
Figure 5.
A detailed block diagram of the control unit.
The control unit consisted of the following:
- control panel;
- development board with TMS320F2812 or field-programmable gate array (FPGA);
- opto-isolation module;
- inverter module;
- measuring module; and
- power module.
The parameters of the motor are summarized in Table 2.
Table 2.
PMSM nameplate.
The picture view of the experimental setup with TMS320F2812 (Texas Instruments, USA) is presented in Figure 6.
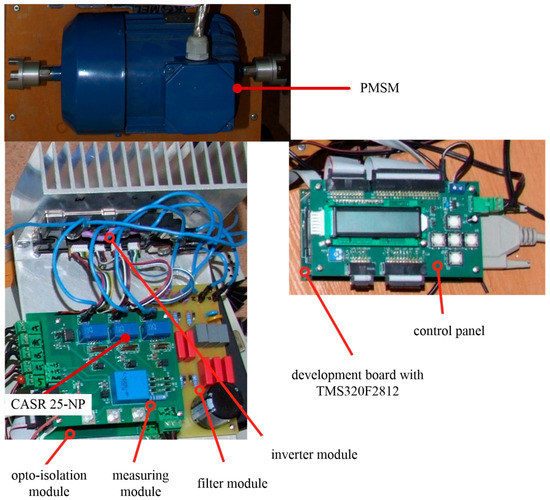
Figure 6.
The picture view of the experimental setup with TMS320F2812.
The picture view of the experimental setup with FPGA is presented in Figure 7.
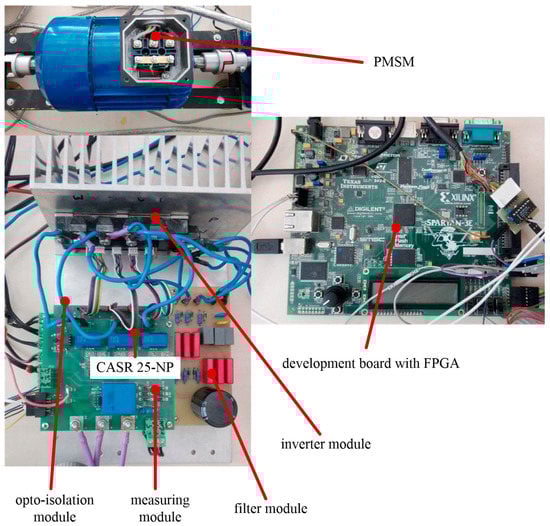
Figure 7.
The picture view of the experimental setup with or field-programmable gate array (FPGA).
4. Results
The laboratory setup presented in Figure 4 was used to perform a series of experiments. Figure 8 shows the phase voltages ua and ub of the unloaded PMSM at a speed of 700 rpm.
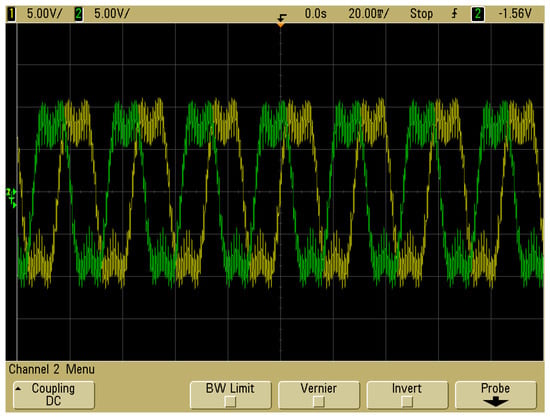
Figure 8.
Phase voltages ua and ub at a speed of 700 rpm.
Figure 9 shows the voltage signal from the CASR 25-NP proportional to the current. It depicts the motor idle run at a speed of 700 rpm.
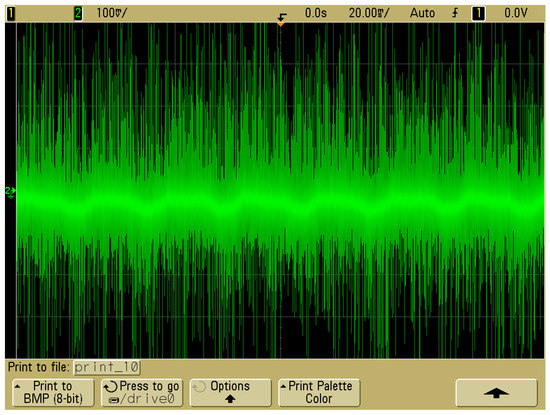
Figure 9.
Voltage signal from the CASR 25-NP at 700 rpm.
It can be observed that the voltage signal from the current transducer deviates significantly from the sinusoidal waveform. Noises are present due to inverter switching. Imperfect construction of the PMSM was one of the reasons for the signal distortion. To compare the properties of signal capturing, two controllers were implemented. The first was based on a programmatic approach utilizing a TMS320F2812 digital signal processor (DSP) unit with embedded ADC. In the second case, a direct hardware implementation utilizing the Xilinx FPGA device along with the separate ADC LTC1407A was used. The following is a short summary of the ADC module in the TMS320F2812 unit [16]:
- 16-bit ADC core with built-in dual sample-and-hold (S/H);
- simultaneous sampling or sequential sampling modes;
- analogue input: 0–3 V;
- minimal conversion time of 1.6 µs; and
- 16-channel, multiplexed inputs.
Figure 10 shows the voltage signal captured from the CASR 25-NP by the internal ADC of TMS320F2812. To compare it with the scope, a trace motor was run without a load at a speed of 700 rpm. The collected samples were not suitable for further calculations as they were significantly distorted by the noise and power converter operation. To increase the discrete signal quality, an averaging of samples was performed. This approach allowed the reduction of random noises. The ADC was able to operate with clock frequencies up to 25 MHz, which corresponded to the ability of sampling input signals at 12.5 mega samples per second (MSPS).
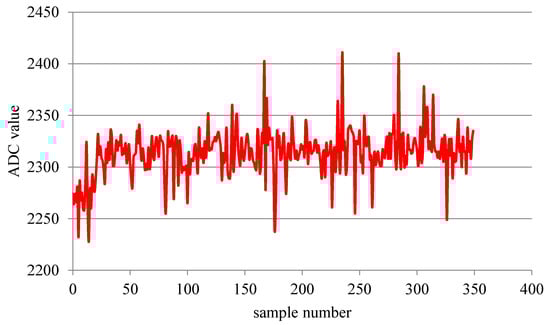
Figure 10.
Signal measured by the analogue-to-digital converter (ADC) of the TMS320F2812 system at 700 rpm.
Using the proposed sampling frequency, it was possible to collect 32 samples in the basic period of 125 µs used by the power inverter driver PWM (Figure 11).
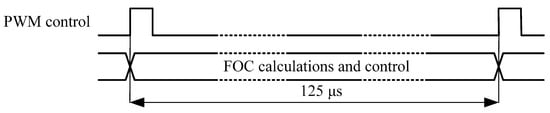
Figure 11.
Time dependencies for the pulse width modulation (PWM) module.
The ADC was able to convert approximately 1562 samples, enabling program averaging, which took place on a queue basis, i.e., the first sample was dropped, while the current sample was placed in its place. Then, the mean value of the samples in the queue was calculated. The running average value calculation scheme is depicted in Figure 12. It should be noted that the computation of the mean value considered only subtraction of the removed value and addition of the inserted value. When a ring buffer is used, the exchange operation of the samples does not require content shifting.
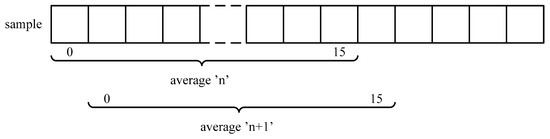
Figure 12.
Method for determining the average of 16 samples.
Figure 13 shows the signal waveform after averaging from the CASR 25-NP current transducer measured by the internal ADC of TMS320F2812. The averaging signals of 16 and 32 samples under the same conditions of motor operation (no load at 700 rpm) are given.
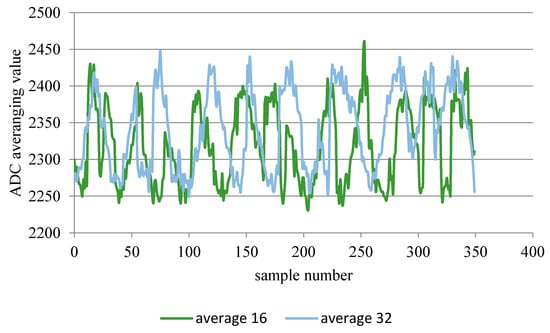
Figure 13.
Averaging signals of 16 and 32 samples measured by the internal ADC of the TMS320F2812 samples at 700 rpm.
As shown in Figure 13, the shape of the voltage waveform (proportional to the PMSM current) after averaging the measurement samples was better than that presented in Figure 10. Increasing the number of averaged samples above 32 was not possible.
A block diagram of the DSP program is shown in Figure 14. The DSP control unit uses two interrupts. The interrupt from timer 1 is called every 125 μs. The interrupt subroutine reads data from the encoder and performs FOC calculations. The interrupt subroutine triggered by the ADC reads the phase current values and calculates the average for individual current samples.
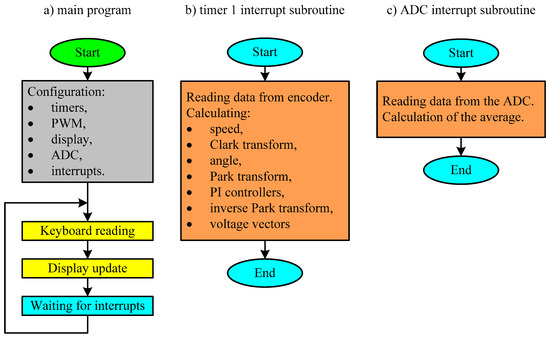
Figure 14.
A block diagram of the digital signal processor (DSP) program.
A direct hardware-implemented PMSM controller uses the Spartan-3E FPGA development board [17]. It is equipped with an XC3S500E FPGA (Xilinx, USA) device offering an equivalent logic capacity of approximately 500 k gates. This controller implements multiplier cores that significantly simplify signal processing implementation. An analogue signal input containing the LTC6912 programmable gain amplifier and the LTC1407A (Linear Technology, USA)analogue is implemented in the digital converter [18]. This system enables sampling of input signals at a resolution of 14 bits with a maximal rate of 1.5 M samples per second. During direct hardware controller development and diagnostics, the ethernet interface is used. This allows the transfer of a large amount of data collected from different registers in the system. The implanted interface enables a maximal data rate of 100 Mb/s, which allows the operation of the controller to be collected and analyzed by performing the acquisition of necessary signals. The parallel operation of hardware systems should also be emphasized. In contrast to programmatic implementation, which is able to process a single context (thread) at a time, the hardware implementation handles all processing threads independently and in parallel. The response time of the hardware controller can be as short as the single clock cycle. In this case, a 50 MHz clock signal was used, which offered a basic time resolution of 20 ns.
Figure 15 shows signals from the LTC1407A, the shaft position encoder, and the PWM module.
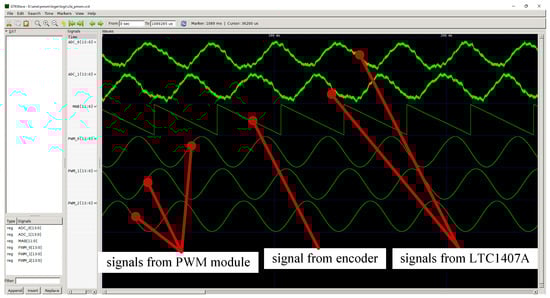
Figure 15.
Signals from the LTC1407A, signals from the encoder, and signals from the PWM module.
Figure 16 shows the voltage signal from the CASR 25-NP system after it was measured by an LTC1407A at a speed of 700 rpm.
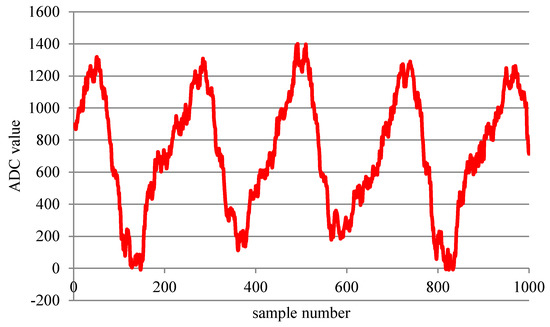
Figure 16.
Signal measured by LTC1407A at 700 rpm.
The direct hardware implementation of a controller using an FPGA device allows signal acquisition and calculations to be performed independently from other computations or data transfers. The sampling process is precisely triggered with the desired interval. In contrast to even DSP systems, hardware implementation offers extremely precise time data acquisition and real parallel processing. Therefore, signal acquisition and averaging are performed in a precisely defined number of clock cycles.
Figure 17 shows the sampled and quantized measurements by the LTC1407A signal obtained from the CASR 25-NP current transducer. There were waveforms after 16 and 32 samples averaged for the PMSM run without a load at 700 rpm. Even for as few as 16 samples, averaging allowed us to obtain a waveform with a shape similar to the sine wave. It should be taken into consideration that the shape was distorted due to imperfection of PMSM manufacturing.
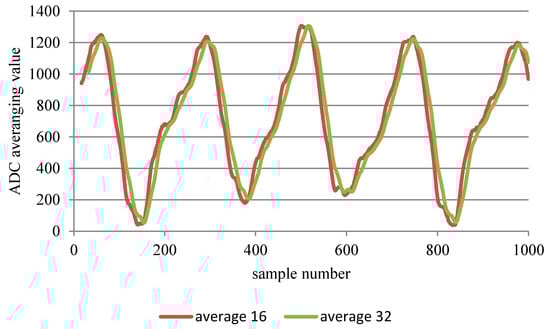
Figure 17.
Averaging signal from 16 and 32 measures by LTC1407A.
5. Discussion
This paper presents two approaches to an instantaneous current measurement system for a PMSM control unit. The first implementation utilized a programmatic approach using a DSP system, and its performance was compared with direct hardware implementation using an FPGA device. An essential problem of this current measurement is the significant noise component caused by the inverter module. To reduce the noise component from a useful signal, averaging was applied. This required an increasing number of samples taken by the ADC during the period of inverter operation. According to the experiments, the number of samples was found to be between 16 and 32. The basic period of the inverter was set to 125 μs. In the case of programmatic implementation, an increase in the number of samples collected in a short time interval increased the time dependencies that must be met in a given time. During this time, the DSP system is supposed to manage not only ADC acquisition but also acquire shaft position. Those items were ignored to calculate the parameters for inverter control. The direct hardware implementation brings completely new quality to signal processing. In contrast to programmatic implementation, direct hardware implementation offers massive parallel processing. The exact computation time is known at the time of design of a hardware controller. The sampling process can be flexibly set up to obtain the maximum performance of an ADC converter. Designing a direct hardware implementation is significantly more complex than designing a program running on a DSP controller. Thanks to hardware description languages (HDL) and transaction-based simulation techniques, it is possible to reduce hardware development times. It is even possible to use advance math modelling environments, such as MATLAB and Simulink, with Hardware Description Language (HDL) described systems. The developed direct hardware implementation of the controller offers significantly better parameters and perfectly meets given time requirements. Comparing the waveforms shown in Figure 12 and Figure 16, the LTC1407A driven by the direct hardware implemented controller in FPGA offered better phase current measuring results. After averaging, the shape of this waveform was closer to the expected shape for the PMSM. It should be taken into consideration that a real motor was used, which introduced imperfections.
Selected features of the TMS320F2812 and the Spartan-3E are shown in Table 3.
Table 3.
Selected features of the TMS320F2812 and the Spartan-3E [16,17,19,20].
The selected performance of the TMS320F2812 and the Spartan-3E are presented in Table 4.
Table 4.
The selected performance of the TMS320F2812 and the Spartan-3E.
The measurement time of a single current sample by the DSP is affected by the time the interrupt is received from the ADC. In the case of FPGA, due to parallel processing, the current measurement process can be done continuously, limited only by the performance of the ADC used or the required sampling period. For the DSP system, the next series of phase current measurements can be made only after measuring shaft position and FOC calculations. This is the reason the frequency of current measurement was only about 16 kHz. In the case of the FPGA, due to completely autonomous measurement channel, frequency of current measurement can be the maximum and is limited by the time of the ADC processing. As can be seen in Table 4, the FPGA achieved the best computation time due to the high level of parallelism.
6. Conclusions
The correct measurement of instantaneous PMSM phase currents is very important for the FOC technique. A vital part of this method is also the measurement of the instantaneous shaft position. Both the phase current and shaft position are essential for calculations in the FOC-based control system. The correct measurement of phase currents, together with the correct measurements of the shaft angle, assures correct computation of phase voltages delivered by inverter switches to motor windings. The method requires the measurement of the instantaneous value at given moments in time to precisely calculate current driving parameters. All errors introduced in the measurement of those two quantities lead to improper control and assessment of load and rotation speed. Work on direct hardware implementation is ongoing and is expected to deliver a simplified methodology for designing inverter controllers of motor drives that are directly implemented in hardware with minimal requirements of hardware resources.
The original scientific contribution of this work is in comparing existing current measurement methods and selecting the best one. The purpose of the article was to show that the measurement of PMSM phase currents in the presence of interference could cause problems. The proposed method is to average the measured current samples. The averaging time is important when it comes to control by means of FOC because the control unit, apart from the correct current measurement, still has to make many calculations. Therefore, it has been shown that the use of FPGA is more desirable than the use of DSP. The application of the proposed method is of practical importance because it can be used in the industry.
Funding
This work was supported by the Ministry of Science and Higher Education funding for statutory activities.
Conflicts of Interest
The author declares no conflicts of interest.
References
- Pillay, P.; Krishnan, R. Modeling, simulation, and analysis of permanent-magnet motor-drives. 1. The permanent-magnet synchronous motor drive. IEEE Trans. Ind. Appl. 1989, 25, 265–273. [Google Scholar] [CrossRef]
- Czerwinski, R.; Rudnicki, T. Examination of electromagnetic noises and practical operations of a PMSM motor driven by a DSP and controlled by means of field oriented control. Elektron. Ir Elektrotechnika 2014, 20, 46–50. [Google Scholar] [CrossRef][Green Version]
- Tang, M.; Zhuang, S. On Speed Control of a Permanent Magnet Synchronous Motor with Current Predictive Compensation. Energies 2019, 12, 65. [Google Scholar] [CrossRef]
- Available online: https://www.lem.com/sites/default/files/products_datasheets/casr_series.pdf (accessed on 20 June 2019).
- Myoungho, K.; Seung-Ki, S.; Junggi, L. Compensation of Current Measurement Error for Current-Controlled PMSM Drives. IEEE Trans. Ind. Appl. 2014, 50, 3365–3373. [Google Scholar] [CrossRef]
- Jacob, J.; Calligaro, S.; Petrella, R. Systematic Current Measurement Error Due to Back-EMF in PMSM Drives Adopting Synchronous Sampling. In Proceedings of the IEEE Energy Conversion Congress and Exposition (ECCE), Portland, OR, USA, 23–27 September 2018. [Google Scholar]
- Zhao, J.; Han, O.; Dai, Y.; Hua, M. Study on the Electromagnetic Design and Analysis of Axial Flux Permanent Magnet Synchronous Motors for Electric Vehicles. Energies 2019, 12, 3451. [Google Scholar] [CrossRef]
- Grouz, F.; Sbita, L.; Boussak, M. Current Sensors Faults Detection, Isolation and Control Reconfiguration for PMSM Drives. In Proceedings of the International Conference on Electrical Engineering and Software Applications, Hammamet, Tunisia, 21–23 March 2013. [Google Scholar] [CrossRef]
- Jarzebowicz, L.; Mirchevski, S. Modeling the Impact of Rotor Movement on Non-Linearity of Motor Currents Waveforms in High-Speed PMSM Drives. In Proceedings of the 19th European Conference on Power Electronics and Applications, Warsaw, Poland, 11–14 September 2017. [Google Scholar] [CrossRef]
- Zhang, G.; Wang, G.; Wang, G.; Huo, J.; Zhu, L.; Xu, D. Fault Diagnosis Method of Current Sensor for Permanent Magnet Synchronous Motor Drives. In Proceedings of the International Power Electronics Conference, Niigata, Japan, 20–24 May 2018. [Google Scholar] [CrossRef]
- Jarzebowicz, L. Errors of a Linear Current Approximation in High-Speed PMSM Drives. IEEE Trans. Power Electron. 2017, 32, 8254–8257. [Google Scholar] [CrossRef]
- Rudnicki, T.; Sikora, A.; Czerwinski, R.; Glinka, T. Impact of PWM control frequency on efficiency of drive with 1 kW permanent magnet synchronous motor. COMPEL Int. J. Comput. Math. Electr. Electron. Eng. 2018, 37, 307–318. [Google Scholar] [CrossRef]
- Jarzebowicz, L.; Gutten, M. Impact of Digital Signal Processing on FOC Current Feedback in High-Speed PMSM Drive. In Proceedings of the IEEE International Electric Machines & Drives Conference, San Diego, CA, USA, 12–15 May 2019. [Google Scholar] [CrossRef]
- Rudnicki, T.; Sikora, A.; Czerwinski, R.; Polok, D. Impact of PWM Control Frequency onto Efficiency of a 1 kW Permanent Magnet Synchronous Motor. Elektron. Ir Elektrotechnika 2016, 22, 10–16. [Google Scholar] [CrossRef]
- Dataflex. Torque Measuring Shaft Type 22. 2017. Available online: https://www.ktr.com/fileadmin/ktr/media/Manuals/49011en000000.pdf (accessed on 4 December 2018).
- Texas Instruments. TMS320F281x Digital Signal Processors. 2019. Available online: http://www.ti.com/lit/ds/symlink/tms320f2812.pdf (accessed on 20 July 2019).
- Xilinx. Spartan-3E FPGA Starter Kit Board User Guide. 2011. Available online: https://www.xilinx.com/support/documentation/boards_and_kits/ug230.pdf (accessed on 25 May 2018).
- Linear Technology. LTC1407-1/LTC1407A-1. 2009. Available online: https://www.analog.com/media/en/technical-documentation/data-sheets/14071fb.pdf (accessed on 25 February 2019).
- Spectrum Digital. eZdsp™ F2812 for TMS320F2812 DSP in Socket + Power supply + Code Composer Studio for C28xx. 2019. Available online: http://www.spectrumdigital.com/ezdsp-f2812-for-tms320f2812-dsp-in-socket-power-supply-code-composer-studio-for-c28xx/ (accessed on 5 November 2019).
- Digilent. Spartan-3E Starter Board (LIMITED TIME). 2019. Available online: https://store.digilentinc.com/spartan-3e-starter-board-limited-time/ (accessed on 5 November 2019).
© 2020 by the author. Licensee MDPI, Basel, Switzerland. This article is an open access article distributed under the terms and conditions of the Creative Commons Attribution (CC BY) license (http://creativecommons.org/licenses/by/4.0/).