Article

Optimization of A Swirl with Impingement Compound Cooling Unit for A Gas Turbine Blade Leading Edge

College of Power and Energy Engineering, Harbin Engineering University, Harbin 150001, China
*
Author to whom correspondence should be addressed.
Energies 2020, 13(1), 210; https://doi.org/10.3390/en13010210
Submission received: 3 December 2019 / Revised: 20 December 2019 / Accepted: 23 December 2019 / Published: 2 January 2020
(This article belongs to the Section I: Energy Fundamentals and Conversion)

Abstract

:
In this article, a compound unit of swirl and impingement cooling techniques is designed to study the performance of flow and heat transfer using multi-conical nozzles in a leading-edge of a gas turbine blade. Reynolds Averaged Navier-Stokes equations and the Shear Stress Transport model are numerically solved under different nozzle Reynolds numbers and temperature ratios. Results indicated that the compound cooling unit could achieve a 99.7% increase in heat transfer enhancement by increasing the nozzle Reynolds number from 10,000 to 25,000 at a constant temperature ratio. Also, there is an 11% increase in the overall Nusselt number when the temperature ratio increases from 0.65 to 0.95 at identical nozzle Reynolds number. At 10,000 and 15,000 of nozzle Reynolds numbers, the compound cooling unit achieves 47.9% and 39.8% increases and 63.5% and 66.3% increases in the overall Nusselt number comparing with the available experimental swirl and impingement models, respectively. A correlation for the overall Nusselt number is derived as a function of nozzle Reynolds number and temperature ratio to optimize the results. The current study concluded that the extremely high zones and uniform distribution of heat transfer are perfectly achieved with regard to the characteristics of heat transfer of the compound cooling unit.

Graphical Abstract

1. Introduction

Recently, heavy-duty gas turbines are always being subjected to new challenges to be efficient with the increasing energy demands [1]. Also, achieving the highest power and efficiency requires a high turbine entry gas temperature [2], which is excessively higher than the thermal resistance of the blade material. In order to provide a reasonable uniform temperature of the blade material, various complex cooling techniques are required to protect it. The blade leading-edge is the most critical part, which is directly forced by a very high gas temperature. As a result, over the past years, many cooling techniques have been developed by various researchers to overcome this problem. Nowadays, the impingement cooling and swirl cooling are the only common methods to cool down the leading edge of a blade. Also, due to the great impact of those two cooling methods on cooling performance, deep investigations are required to optimize the cooling method.
Numerous studies have been performed on the impingement cooling technique in a half-cylindrical duct inside a blade leading edge. Chupp et al. [3] presented an experimental work on an internal impingement cooling of a blade leading-edge. Results reported that the cooling performance was affected by correlations of Nusselt number as a function of some affecting parameters like nozzle Reynolds number. Tabakoff et al. [4] performed an experimental study of the effect of different jet configurations on the performance of impingement cooling in a leading-edge of a blade. Results revealed that the circular-shaped nozzle row had the best enhancement of heat transfer compared with both round and slot nozzles together. Yang et al. [5] studied the influences of Reynolds number and jet forms on the impinging cooling on a half-circular wall. Outputs indicated that there was a notable heat transfer enhancement compared to some other experimental results. Also, the impingement cooling performance for a half-circular wall was experimentally studied by Choi et al. [6]. Meanwhile, the average velocity and its fluctuation were monitored by utilizing Laser Doppler Anemometer. Kayansayan et al. [7] experimentally studied the impinging cooling inside a curved passage. Outputs revealed that the previous numerical results had a good agreement with the experimental data at a low range of Reynolds numbers. Florschuetz et al. [8,9,10] performed experimental work and theoretical analysis to study the effect of heat transfer performance for nozzle array impingement with the cross-flow on a flat test plate. The results confirmed that the crossflow decreased the performance of heat transfer. Taslim et al. [11,12,13,14] presented experimental and numerical studies of impingement cooling on a half-circular surface at various affecting parameters. The influences of a soft and rough surface, a spacing of jet to target wall, with and without film holes and crossflow were analyzed. The most related results confirmed that the cooling performance was increased by the rough wall surface and decreased by the crossflow. Moreover, numerous numerical studies were conducted of impingement cooling on a blade leading-edge of a gas turbine. Three different profiles were used inside a blade leading-edge interior cavity, which were numerically investigated by Rajamani et al. [15]. Results showed that there was an important effect on cooling performance due to cross-flow and vortices production. Liu et al. [16,17] studied the characteristics of the flow and heat transfer of the impingement cooling in a blade leading-edge using the (Shear Stress Transport) SST k-ω model. Results showed that there was an enhancement of heat transfer when the Mach number and jet nozzle diameter increased. In addition, an experimental investigation was performed by Liu et al. [18] to describe the flow pattern of a restricted passage with a row of a staggered jet. Outputs indicated that the distribution of static pressure, mass flow and coefficient of discharge were all controlled by the channel height to impinging hole diameter ratio. Yang et al. [19] described the impact of film-holes on the impinging cooling performance. The numerical simulations were validated using the SST k-ω model. Results showed that the location and angle of the film hole had an important influence on the heat transfer distribution in the stagnation area.
Concerning the different techniques of swirl cooling, many studies have been conducted. The first work on swirl inside a cylinder was performed by Kreith et al. [20] to investigate the characteristics of flow and heat transfer. They explored whether the swirling motion by the airflow could improve the heat transfer due to the lower thickness of the thermal boundary layer. Hay and West [21] investigated the heat transfer performance of free swirl flow using tangential injectors in a tube. Outputs indicated that the intensity of the swirling motion had a quite effect on the heat transfer performance. Fan et al. [22] experimentally investigated the flow field and heat transfer performance of the vortex cooling with a semicircular vortex channel with five jets and a cooling fluid inlet channel. Outputs indicated that the model obtained heat transfer enhancement at higher Reynolds number and lower temperature ratio. Many works were conducted to study different structures of swirl cooling techniques. Kusterer et al. [23,24,25] presented a modified swirl cooling model using double swirl chambers to investigate the effectiveness of cooling. Results revealed that the double swirl chambers model had a better enhancement of heat transfer compared to the swirl and impingement cooling models. A numerical study was performed by Luan et al. [26] to compare three different swirl cooling models according to the characteristics of flow and heat transfer. Results indicated that the inlet channel configuration had a great effect on the variations of the flow field and heat transfer. Rao et al. [27] introduced an investigation of heat transfer in a swirling channel with one and five jet slots. Results indicated that the single jet model obtained a 100% increase in the heat transfer compared with the model with five jets for the same mass flow rate. However, the model with five jets had a 12 times higher loss of total pressure compared to the model with a single jet. Fan et al. [28] numerically studied the swirl cooling performance in a vortex channel under the effect of multiple holes bleeding using the standard k-w model. The results revealed that there was a 5.2% increase in the heat transfer due to using film holes bleeding compared to the case without it. Biegger et al. [29] presented an experimental and numerical investigation to study the flow and heat transfer in a swirl pipe with multiple tangential jet nozzles. They confirmed that the swirling pipe with one jet nozzle obtains higher heat transfer while the model with multiple jets achieves more uniform heat transfer with higher pressure loss. Moreover, Liu et al. [30] numerically analyzed the effect of using dimples on the swirl channel surface with multiple inlet nozzles to examine the performance of heat transfer and pressure loss using the SST k-ω model. Results showed that the heat transfer increased by 7.2% and the loss of pressure decreased by 17.6% for the dimpled surface compared to the smooth surface of the swirling channel.
There were various parameters affecting swirl cooling behaviors have been considered by investigators. Ling et al. [31] introduced an experimental and numerical study on swirl and impingement cooling inside a cylindrical passage using two tangential/ normal inlet nozzles. Results revealed that the swirl cooling provided a more uniform heat transfer distribution with higher cooling performance than the impingement cooling. Du et al. [32,33,34] systematically investigated some geometric factors numerically such as axial number, aspect ratio and angle of injection in a swirl cooling channel. Also, they studied different aerodynamic parameters of the Reynolds number and temperature ratio. Furthermore, Du et al. [35] conducted a numerical simulation to investigate the influence of the internal swirl cooling on the conjugate heat transfer in a film cooled vane leading edge. Results revealed that there was a 57% and 75% increase in the overall cooling effectiveness in the passage and segment swirl cases, respectively.
With regard to advanced swirl and impingement cooling techniques, there are many studies interested in those issues. Experimental and numerical works were conducted by Wang et al. [36] to investigate the effect of jet Reynolds number on the heat transfer performance. Results showed that the heat transfer increased with the increase of Reynolds number of the impinging jet. Zhou et al. [37] introduced a study of the influences of the film hole diameter on heat transfer and flow characteristics for impingement and swirl cooling. Results indicated that by using a double swirl tube, there was about a 20% to 33% increase in overall Nusselt number. Wu et al. [38] studied the effect of circumferential jet number and ratio of temperature on internal vortex cooling. Results declared that using two circumferential jets with increasing ratio of temperature provided the best heat transfer enhancement. Furthermore, impingement cooling was studied by Zhang et al. [39] in a film cooled blade leading-edge with and without mainstream effect. They analyzed the effect of tangential and normal jets on the internal heat transfer performance at fixed arrays of film holes. Results showed that the overall Nusselt number for the tangential jets was higher than at the normal jets by 15%–20%. Moreover, the mainstream flow had a slight effect on the overall Nusselt number for all cases.
From the current cited literature, all previously applied techniques of the internal cooling of a blade leading-edge were either swirl cooling or impingement cooling separately. Besides, swirl cooling is mainly characterized by a uniform distribution of heat transfer on the target surface where the cross-flow effect is neglected. Moreover, impingement cooling has a good feature of high and concentrated heat transfer on the target surface but it is affected by the cross-flow. Based on these observations, it could innovate a compound cooling unit including the two techniques for internal cooling for a blade leading edge. The compound cooling unit utilizes the new design of coolant nozzles with a conical flow-path which are directed tangentially for one row of them and normally for the other.
In the present study, the compound cooling unit is numerically investigated under different aerodynamic parameters of the Reynolds number and temperature ratio. To achieve the best internal cooling performance of the proposed unit, the results were compared with some previous relevant work under the same conditions. Also, a correlation was derived as a function of aerodynamic parameters to optimize the compound cooling unit.

2. Description of the Physical Model and Solution Methods

2.1. Physical Geometry

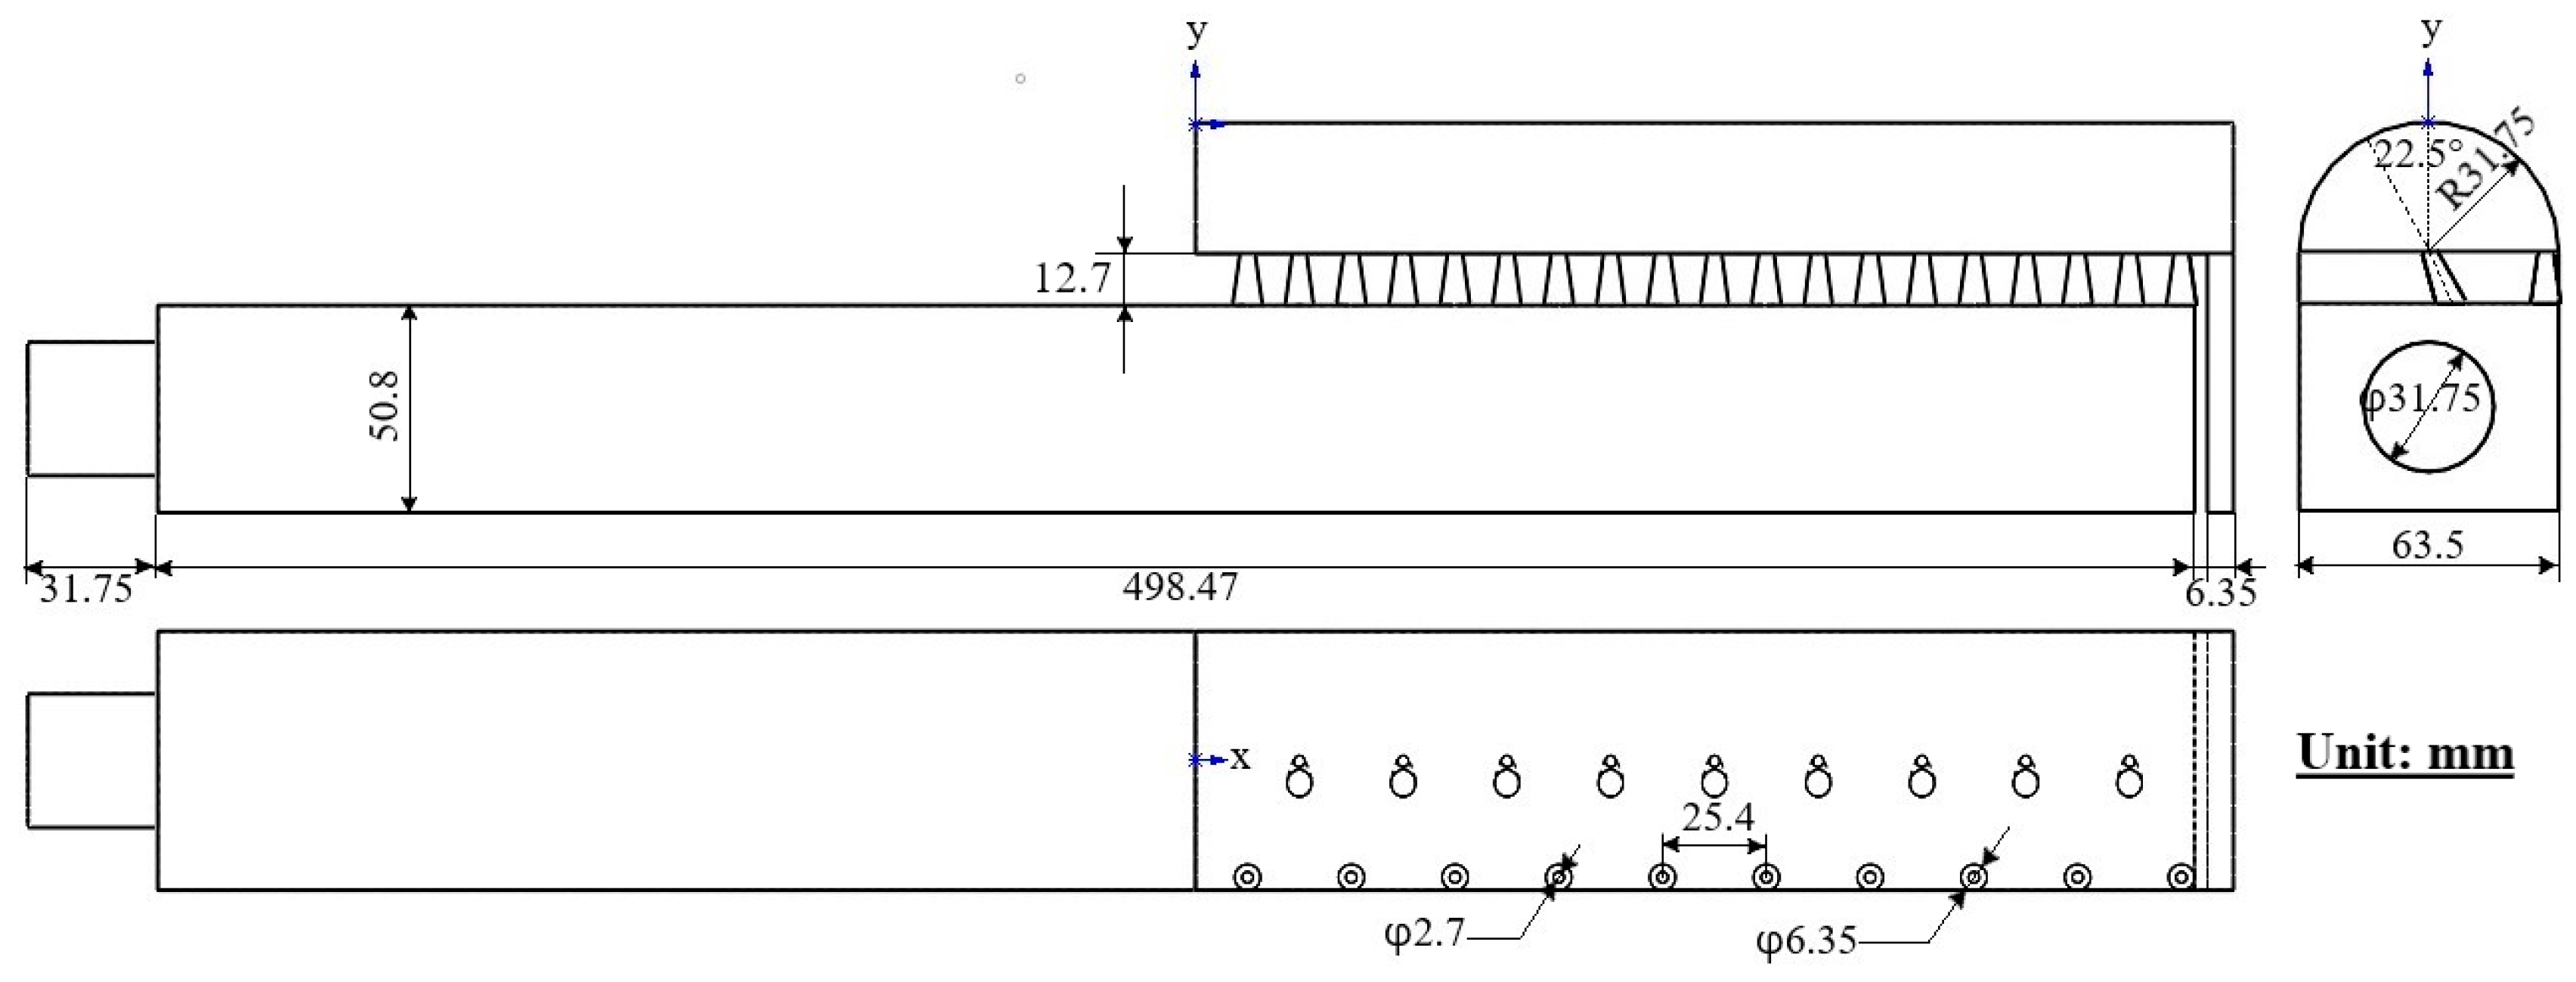
In the current work, the compound cooling unit is evolved based on the geometry of Zhang et al. [39]. To study the flow field and heat transfer characteristics of the proposed cooling unit in a wide manner, a swirl with an impingement compound cooling model was established. Both swirling and impinging flow are created using conical nozzles which are arranged in a staggered arrangement. Figure 1 shows a three-dimensional structure of the compound cooling unit. The dimensions detail of this cooling unit is depicted in Figure 2, where the unit is mm. As indicated in Figure 1, the compound cooling unit consists of a circular inlet short duct connected with a long rectangular duct (coolant channel) to feed the half-cylindrical passage with the coolant. The inner curved surface of the half-cylindrical passage is the target surface to study the internal cooling performance. The coolant flow is injected inside the half-cylindrical passage through multi-conical nozzles, in which the coolant impinges tangentially and normally on the target surface. In the end, the coolant flows out through a normal rectangular duct (outlet). The compound cooling technique is conducted using 10 conical nozzles distributed tangentially for swirl cooling and 9 conical nozzles directed normally with deviation by 22.5° to y-axis for impingement cooling according to the target surface. All conical nozzles are identical and have the same pitch.

2.2. Definition of Parameter

In order to describe the characteristics of the flow field and heat transfer of the compound cooling unit, the following parameters are defined. To investigate the flow potential to create swirling and impinging motion inside the half-cylindrical passage, the Reynolds number is calculated based on the inlet diameter of the conical nozzle (dnoz,in = 0.00635 m) and defined in Equation (1) as.
R e n o z = ρ V d n o z , i n / μ   ,
where ρ is the cooling fluid density, V is the mean area-average velocity at nozzle inlet and μ is the dynamic viscosity. To study the effect of the rate of heat transfer between the cooling fluid and target surface of the cooling unit, a coolant to wall temperature ratio is acquainted in Equation (2) as
T R = T c / T w .
To evaluate the intensity of heat transfer inside the compound cooling unit, the Nusselt number is defined in Equation (3) as
N u = q w d n o z , i n / ( T w T c ) λ ,
where qw is the wall heat flux of the target surface [40] and λ is the thermal conductivity. To study the aerodynamic losses, the local pressure coefficient is acquainted in Equation (4) as
C p = ( P t o t , l o c P t o t , o u t ) / P t o t , i n ,
where Ptot,loc is the local total pressure, Ptot,in is the total pressure at inlet and Ptot,out is the total pressure at outlet. The percentage of total pressure drop is defined in Equation (5) as
Δ P t = { ( P t o t , i n P t o t , o u t ) / P t o t , i n } × 100 .

2.3. Computational Method

The numerical model equations are solved using a commercial (Computational Fluid Dynamics) CFD software tool (ANSYS CFX 17.0). The results are obtained by solving turbulent steady viscous compressible Reynolds-averaged Navier–Stokes equations and turbulence model equations. Convection terms are discretized using a high-resolution scheme of second-order overall accuracy. Some significant assumptions of neglecting the radiation heat transfer, buoyancy and sources of external momentum are all applied. The CFD solution becomes converged and stable when the root mean square residuals of all terms is lower than 10−5 and remain steady. Considering these hypothesizes, the details of the governing equations are presented as follows [41].
The continuity equation is acquainted in Equation (6) as
× ( ρ U ) = 0 .
The momentum equation is specified in Equation (7) as
× ( ρ U U ) = p + × τ + S M ,
where τ is the viscous shear stress tensor and given in Equation (8) as
τ = μ [ U + ( U ) T 2 3 δ × U ] .
The total energy equation is defined in Equation (9) as
× ( ρ U h t o t ) = × ( λ T ) + × ( U × τ ) + S E ,
where U, μ, SM, htot, λ and SE are the velocity component, molecular viscosity, external momentum sources, total enthalpy, effective thermal conductivity and energy source term, respectively.

2.4. Boundary Conditions

The coolant is specified as air ideal gas for all simulations. Mass flow inlet is selected for coolant inlet, where the simulations are performed at different mass flow rates based on different conical nozzle Reynolds numbers of 5000, 10,000, 15,000, 20,000 and 25,000. The inlet coolant total temperature is kept at 298 K with 5% turbulence intensity for all cases. The outlet condition is set at an average static pressure of 1 atm for all cases. The wall temperature of the target surface is varied according to the different coolant to wall temperature ratios of 0.65, 0.75, 0.85 and 0.95. Also, all remaining walls are adiabatic surfaces with the no-slip condition.

2.5. Turbulence Model Validation

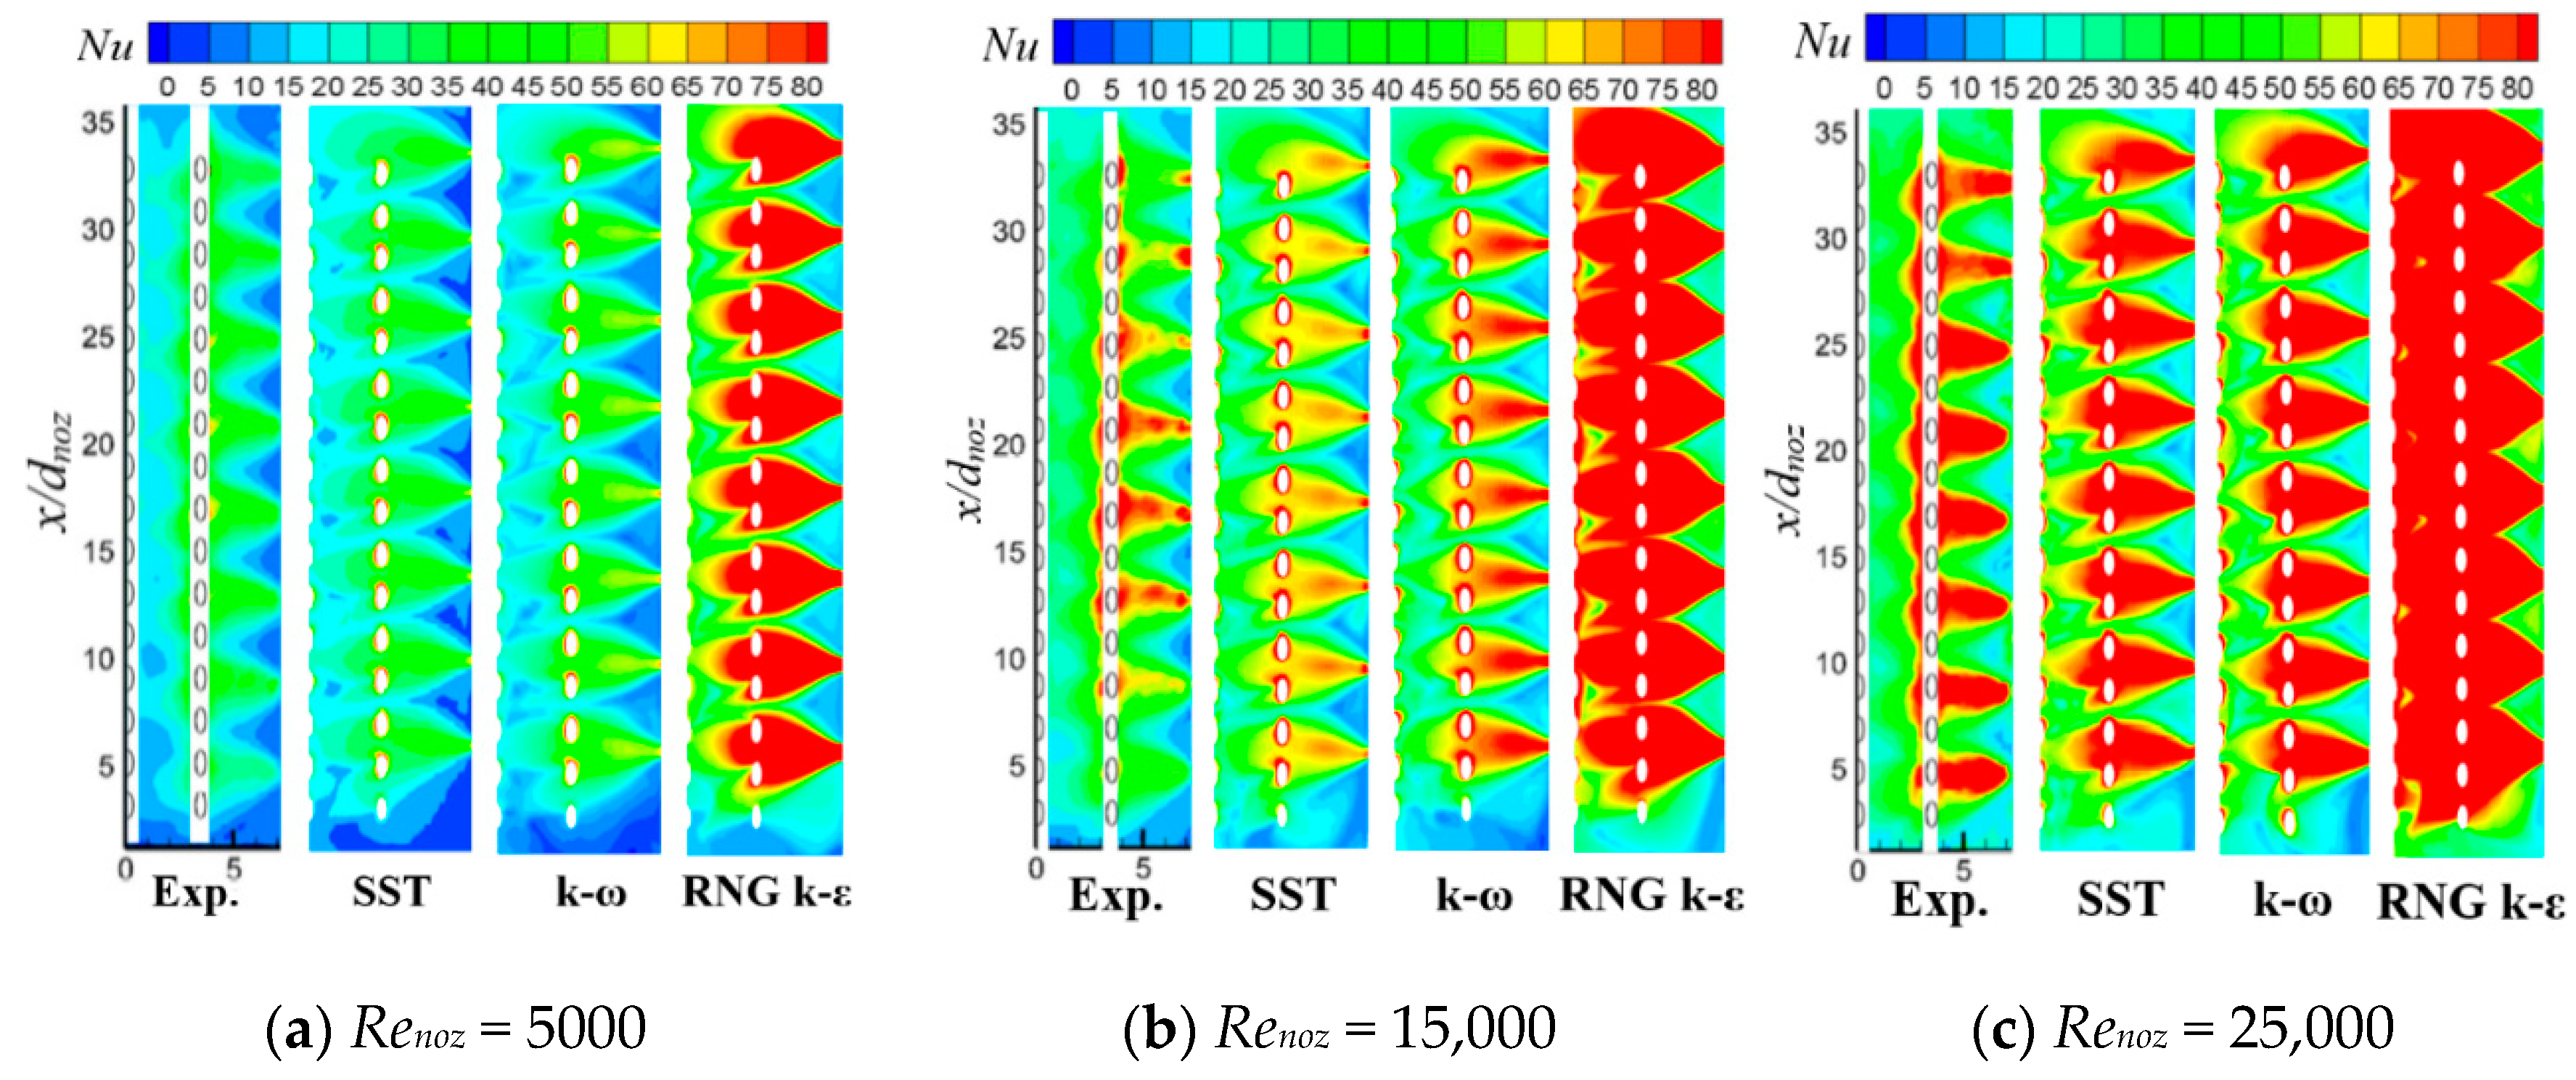
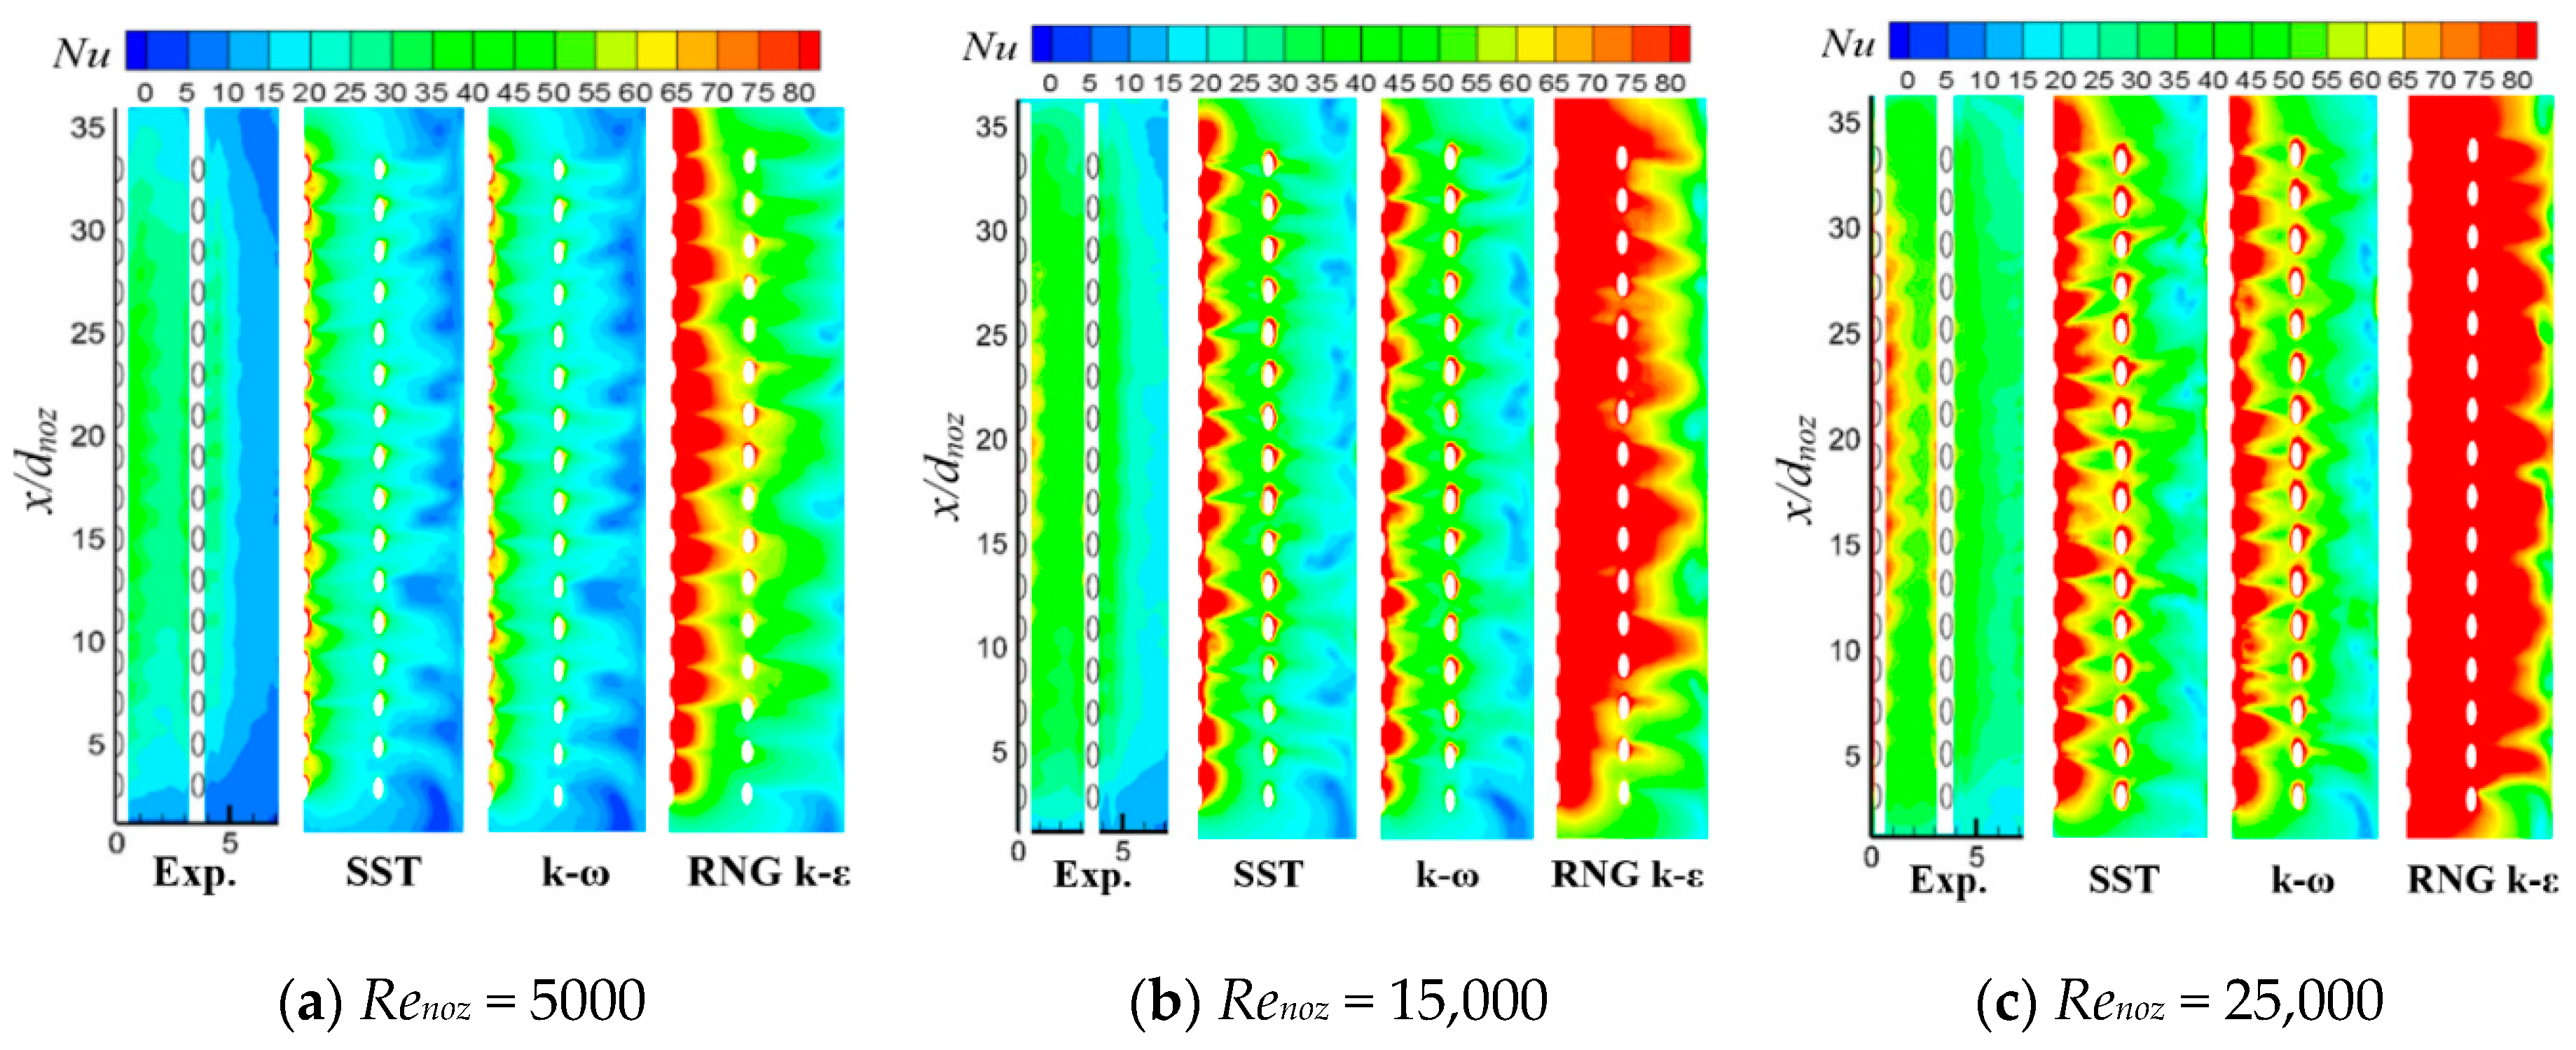
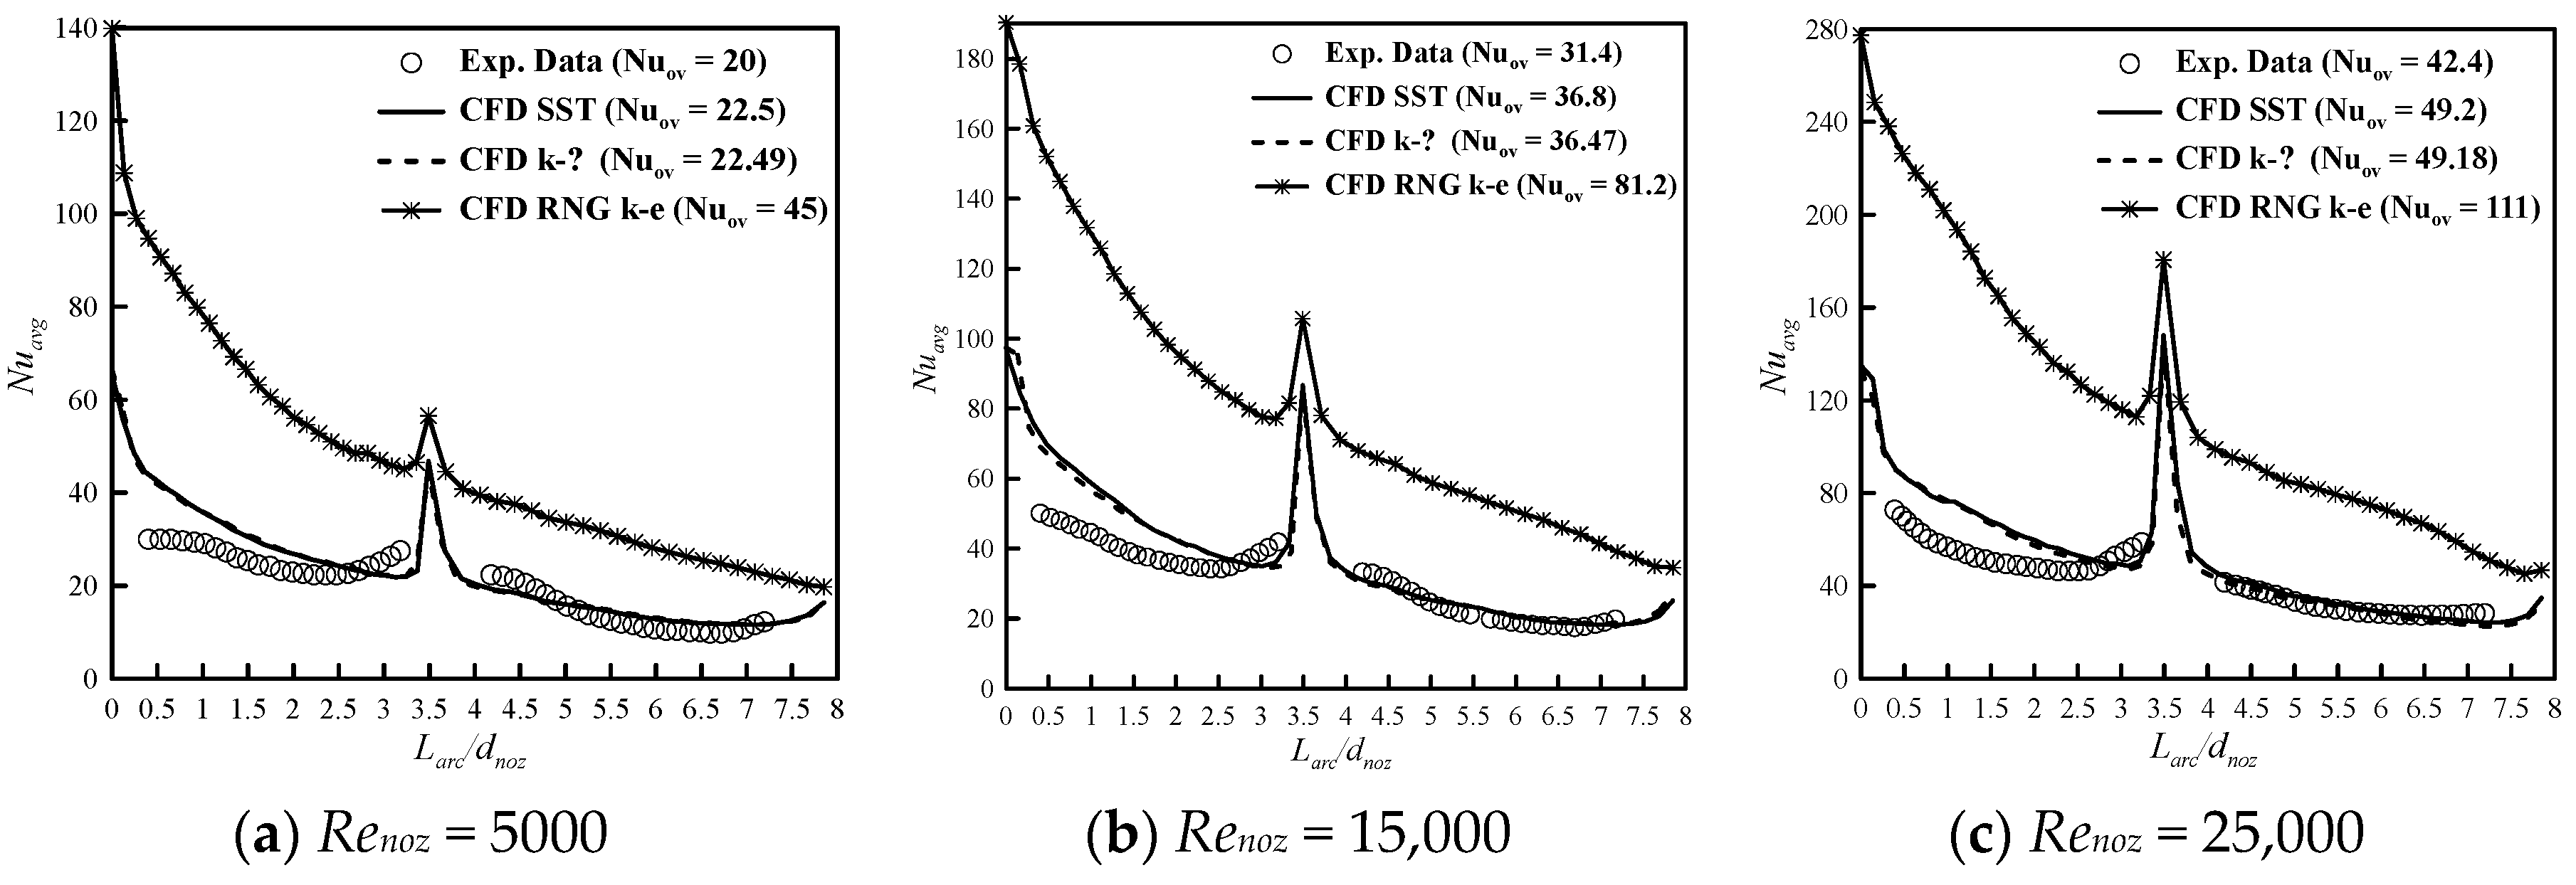
The CFD results accuracy is evaluated using the best turbulence model, which achieves a reasonable agreement with the most relevant experimental data. Nevertheless, almost no experimental work on a compound cooling unit of swirl and impingement has been conducted yet. The applied turbulence model must detect the results’ reliability of the flow behavior of the compound cooling unit for both swirl and impingement flow. As a result, the model is verified with an experimental work by Zhang et al. [39] on both swirl cooling and impingement cooling. The SST k-ω, standard k-ω and (Renormalization Group) RNG k-ε models are used to predict the heat transfer in terms of Nusselt number at different nozzle Reynolds numbers.
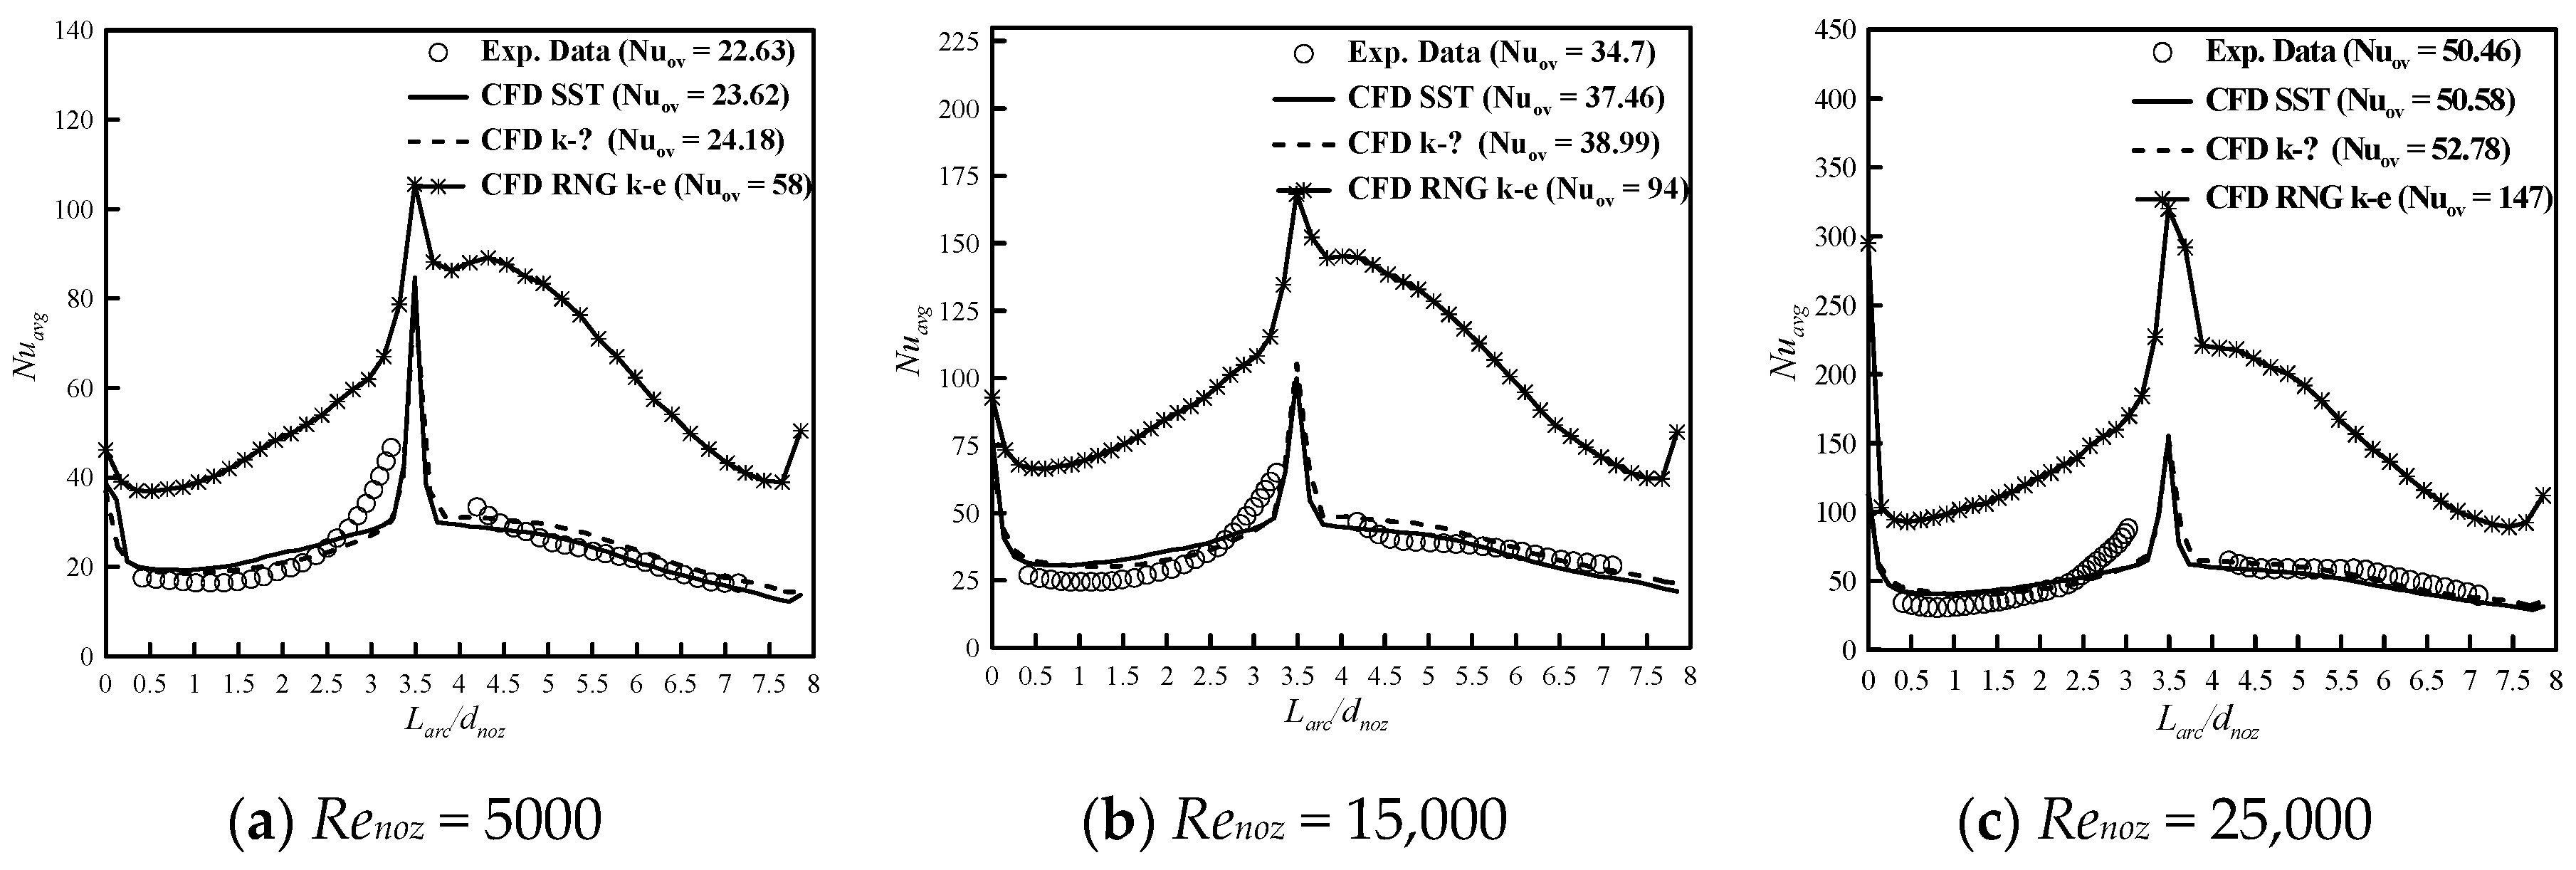
The numerical results are compared to the experimental data in terms of contours for both swirl cooling and impingement cooling as shown in Figure 3 and Figure 4. Also, an additional comparison between the experimental and numerical results according to spanwise area-averaged Nusselt number as illustrated in Figure 5 and Figure 6. As depicted in Figure 3 and Figure 4, the SST k-ω and standard k-ω models are both show a good agreement with the experimental data contours, while the RNG k-ε model is not completely converged for all cases. Figure 5 and Figure 6 illustrate the deviation among the experimental data and all numerical results for different turbulence model for all cases. It is clear that all turbulence models over predict the experimental data with different average percentage deviations.
The SST k-ω model obtains an average deviation of 4.2%, standard k-ω model yields 8% of average deviation, while the RNG k-ε model gives the highest average deviation of 172.8% as depicted in Figure 5. In the case of impingement cooling (Figure 6), the average deviations are 15.2%, 14.86% and 148.46% for the SST k-ω, standard k-ω and RNG k-ε models, respectively. As a result, the SST k-ω model could well predict the experimental data than the standard k-ω model for swirl cooling cases. However, the standard k-ω model obtains more slight convergence with the experimental data than the SST k-ω model in the cases of impingement cooling.
The SST k-ω model combines the virtues between the standard k-ω in the boundary layer and the k-ε model in the core-flow region [17,42]. Thereby, the SST k-ω model is valid for complex flow with turbulent shear transportation, which obtains highly accurate predictions of the flow separation under adverse pressure gradients [43,44]. Thus, all numerical simulations apply the SST k-ω model to study the compound cooling flow and heat transfer characteristics. The details of the applied turbulence model were presented by Safaei et al. [45]. The spanwise distance equals the arc length which starts from the stagnation point (0°) and finishes at the end of internal leading-edge curvature (90°) according to the experimental geometry. The arc length is specified in Equation (10) as.
L a r c = 2 π r ( θ / 360 )

2.6. Mesh Generation and Grid Independence Test

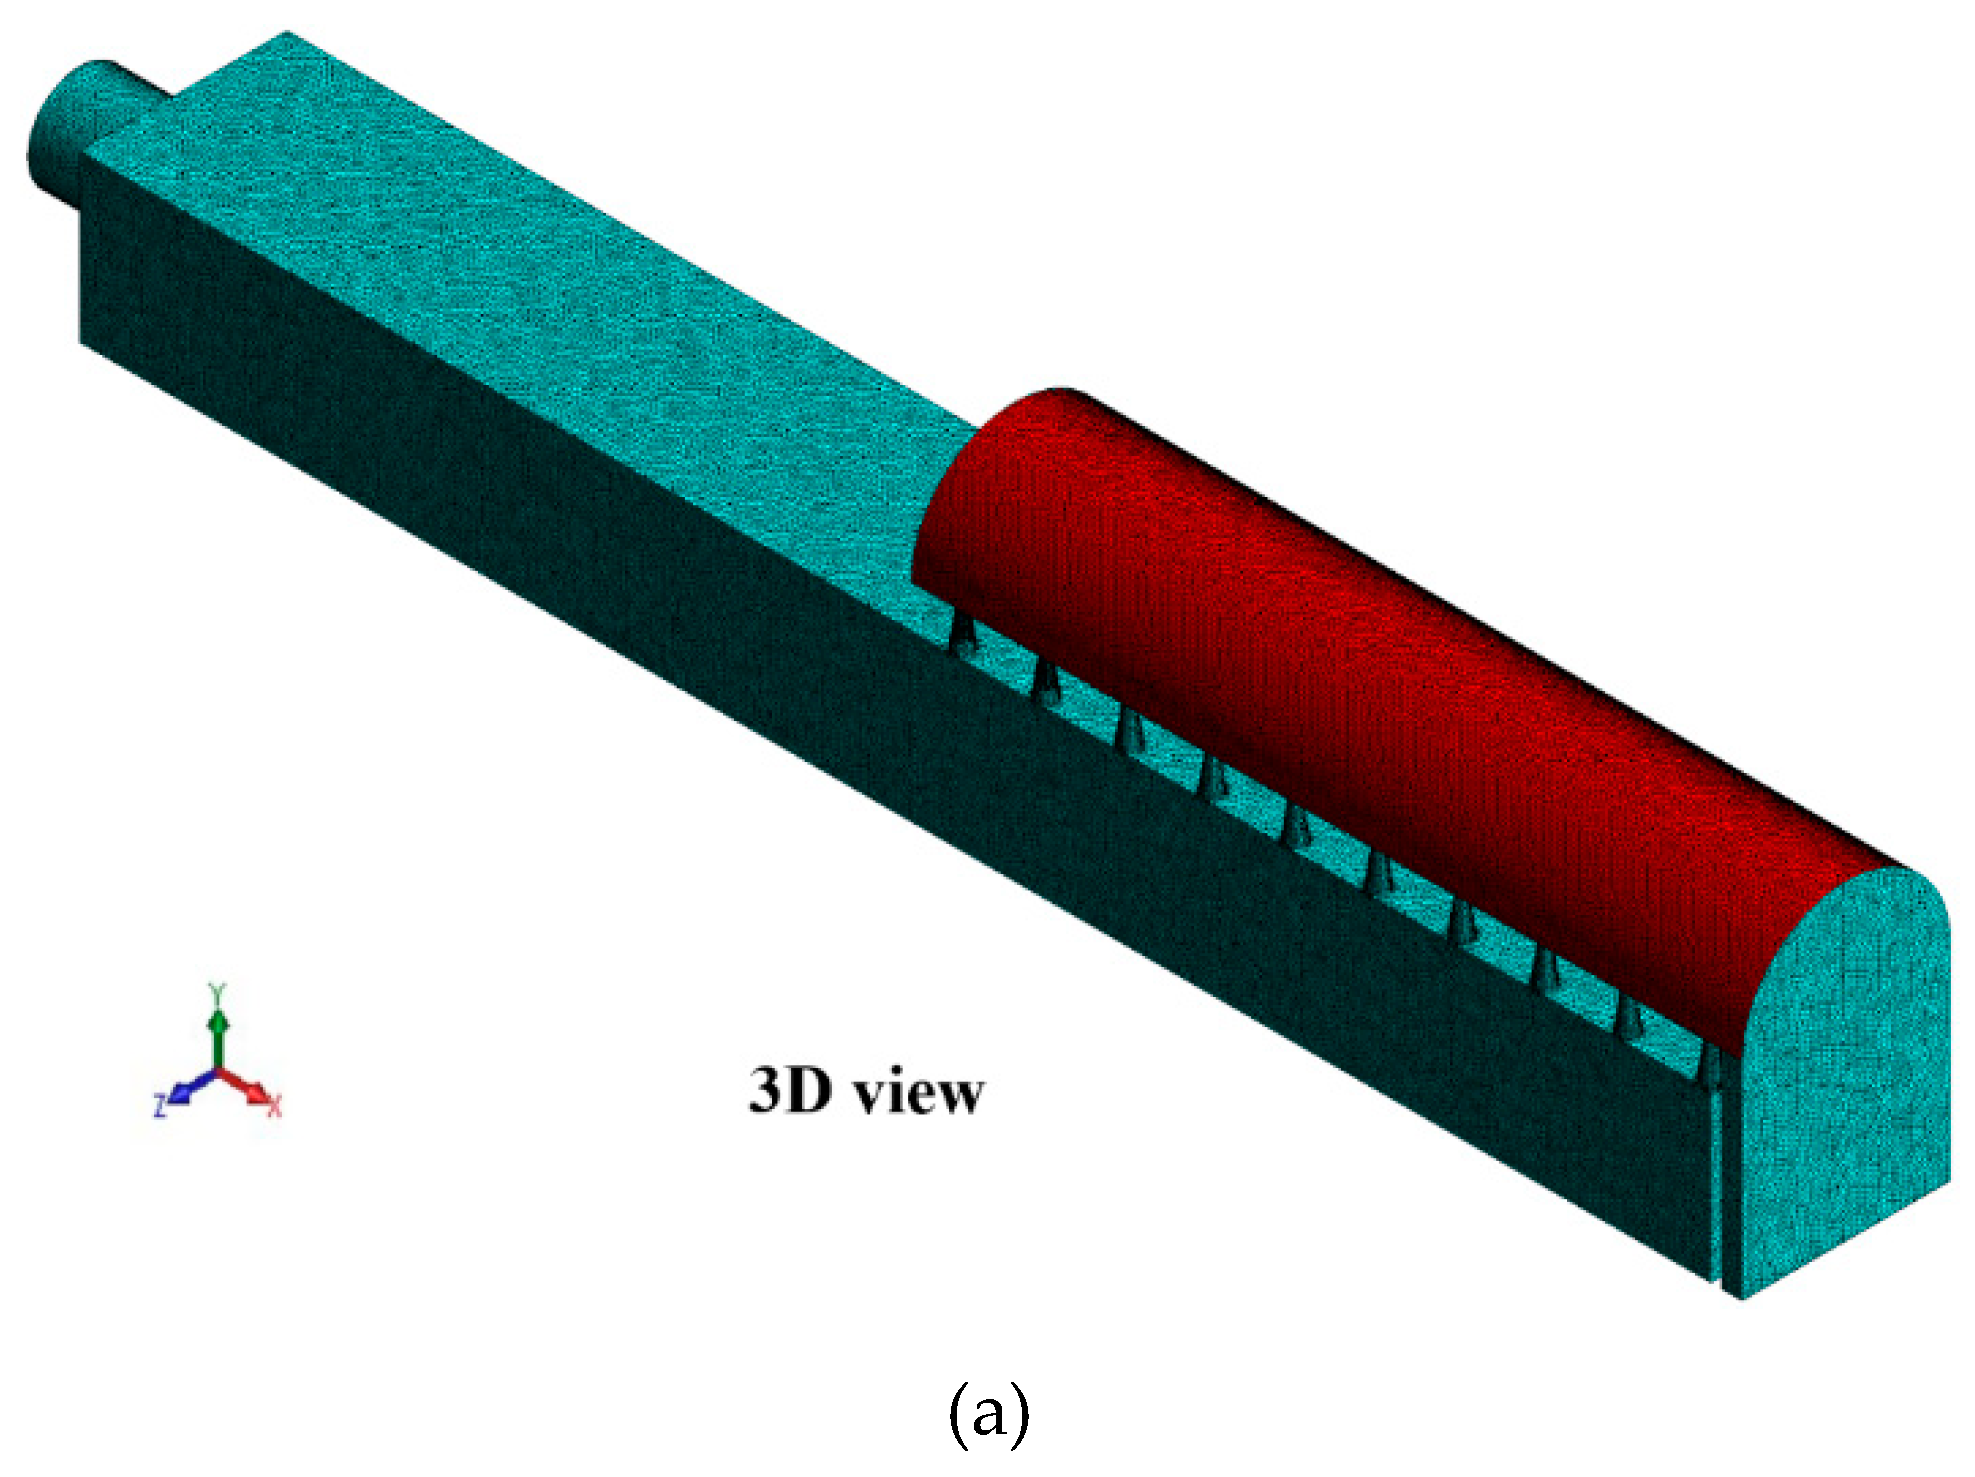
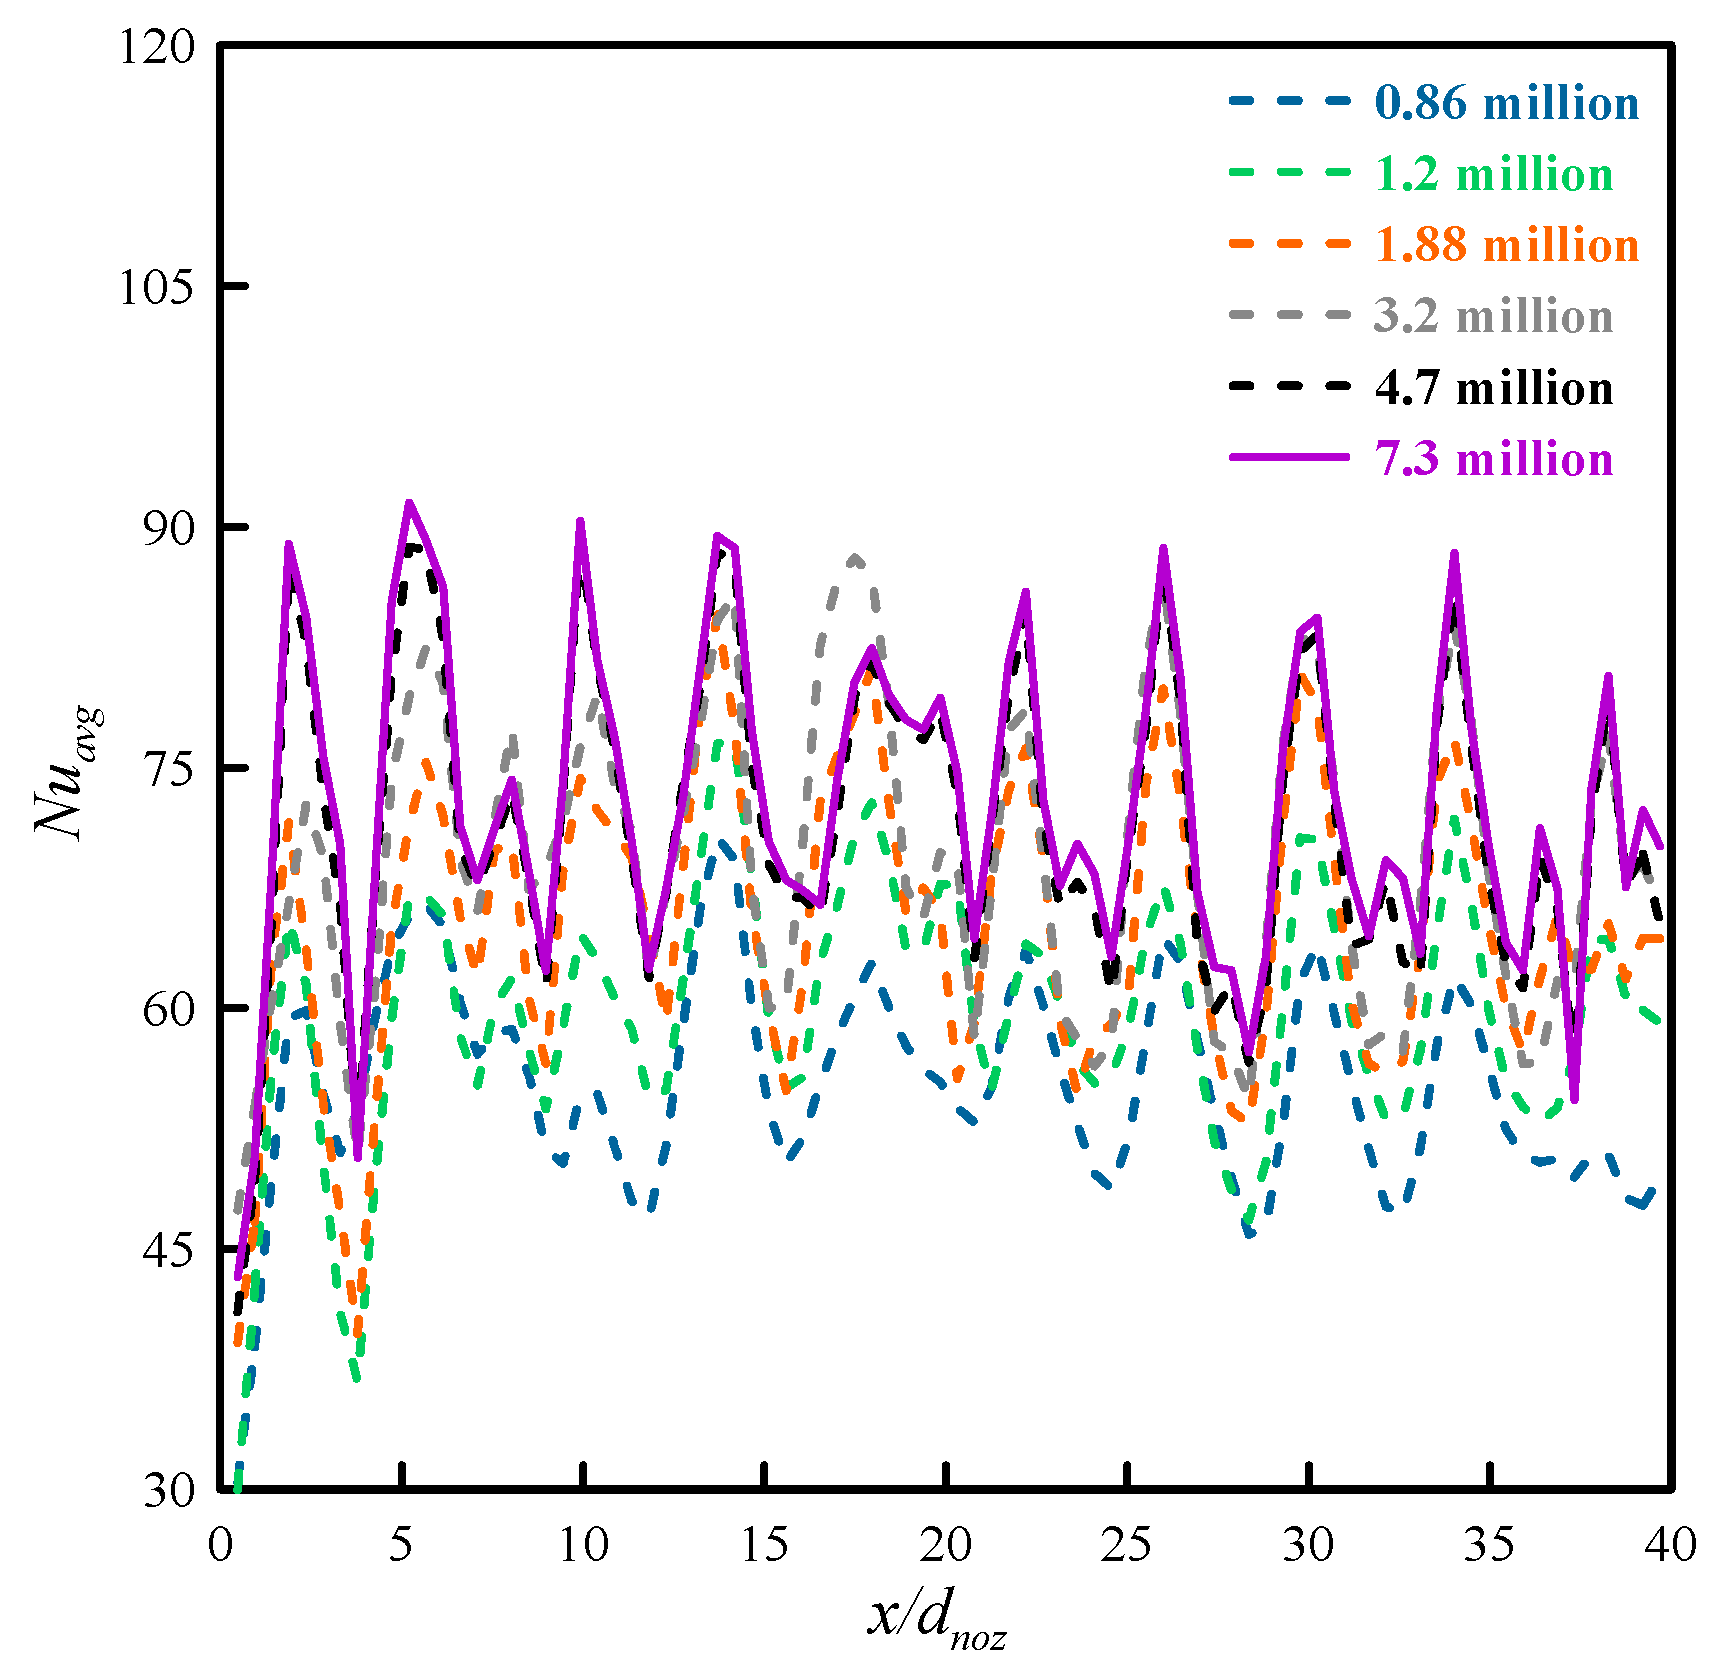
Unstructured grids are generated using the ICEM CFD software for the numerical calculation. Figure 7 shows the fine mesh details of the compound cooling unit. As depicted in Figure 7, the coolant channel, all conical nozzles, half-cylindrical channel and the outlet duct are discretized by tetra/mixed grids. The mesh is refined near all walls except the inlet and outlet surfaces using 20 prism layers at 0.001 mm of first layer height with 1.2 of height ratio. To fulfill the requirements of the turbulence model, the dimensionless wall distance value (y+) of the first layer is less than 1.0 for all simulations. In order to reduce the running cost of the simulation process, a grid dependence number test is necessary to trust the accuracy of the numerical results. Six different meshes with the node number of 0.86 million, 1.2 million, 1.88 million, 3.2 million, 4.7 million and 7.3 million are chosen. Per each mesh, a three-dimension refinement is performed and the SST k-ω model is applied at Renoz = 15,000 and TR= 0.85. Figure 8 indicates the streamwise-averaged Nusselt number distribution on the target surface for the six different meshes. Also, Table 1 provides the overall Nusselt number corresponding to the different meshes. It is obvious that Nuavg distribution and its overall value are almost the same when the node number is more than 4.7 million with a relative error of 0.266% based on the previous calculation. Consequently, the mesh with 4.7 million nodes is applied for all simulations.

3. Results

3.1. Coolant Flow Analyses

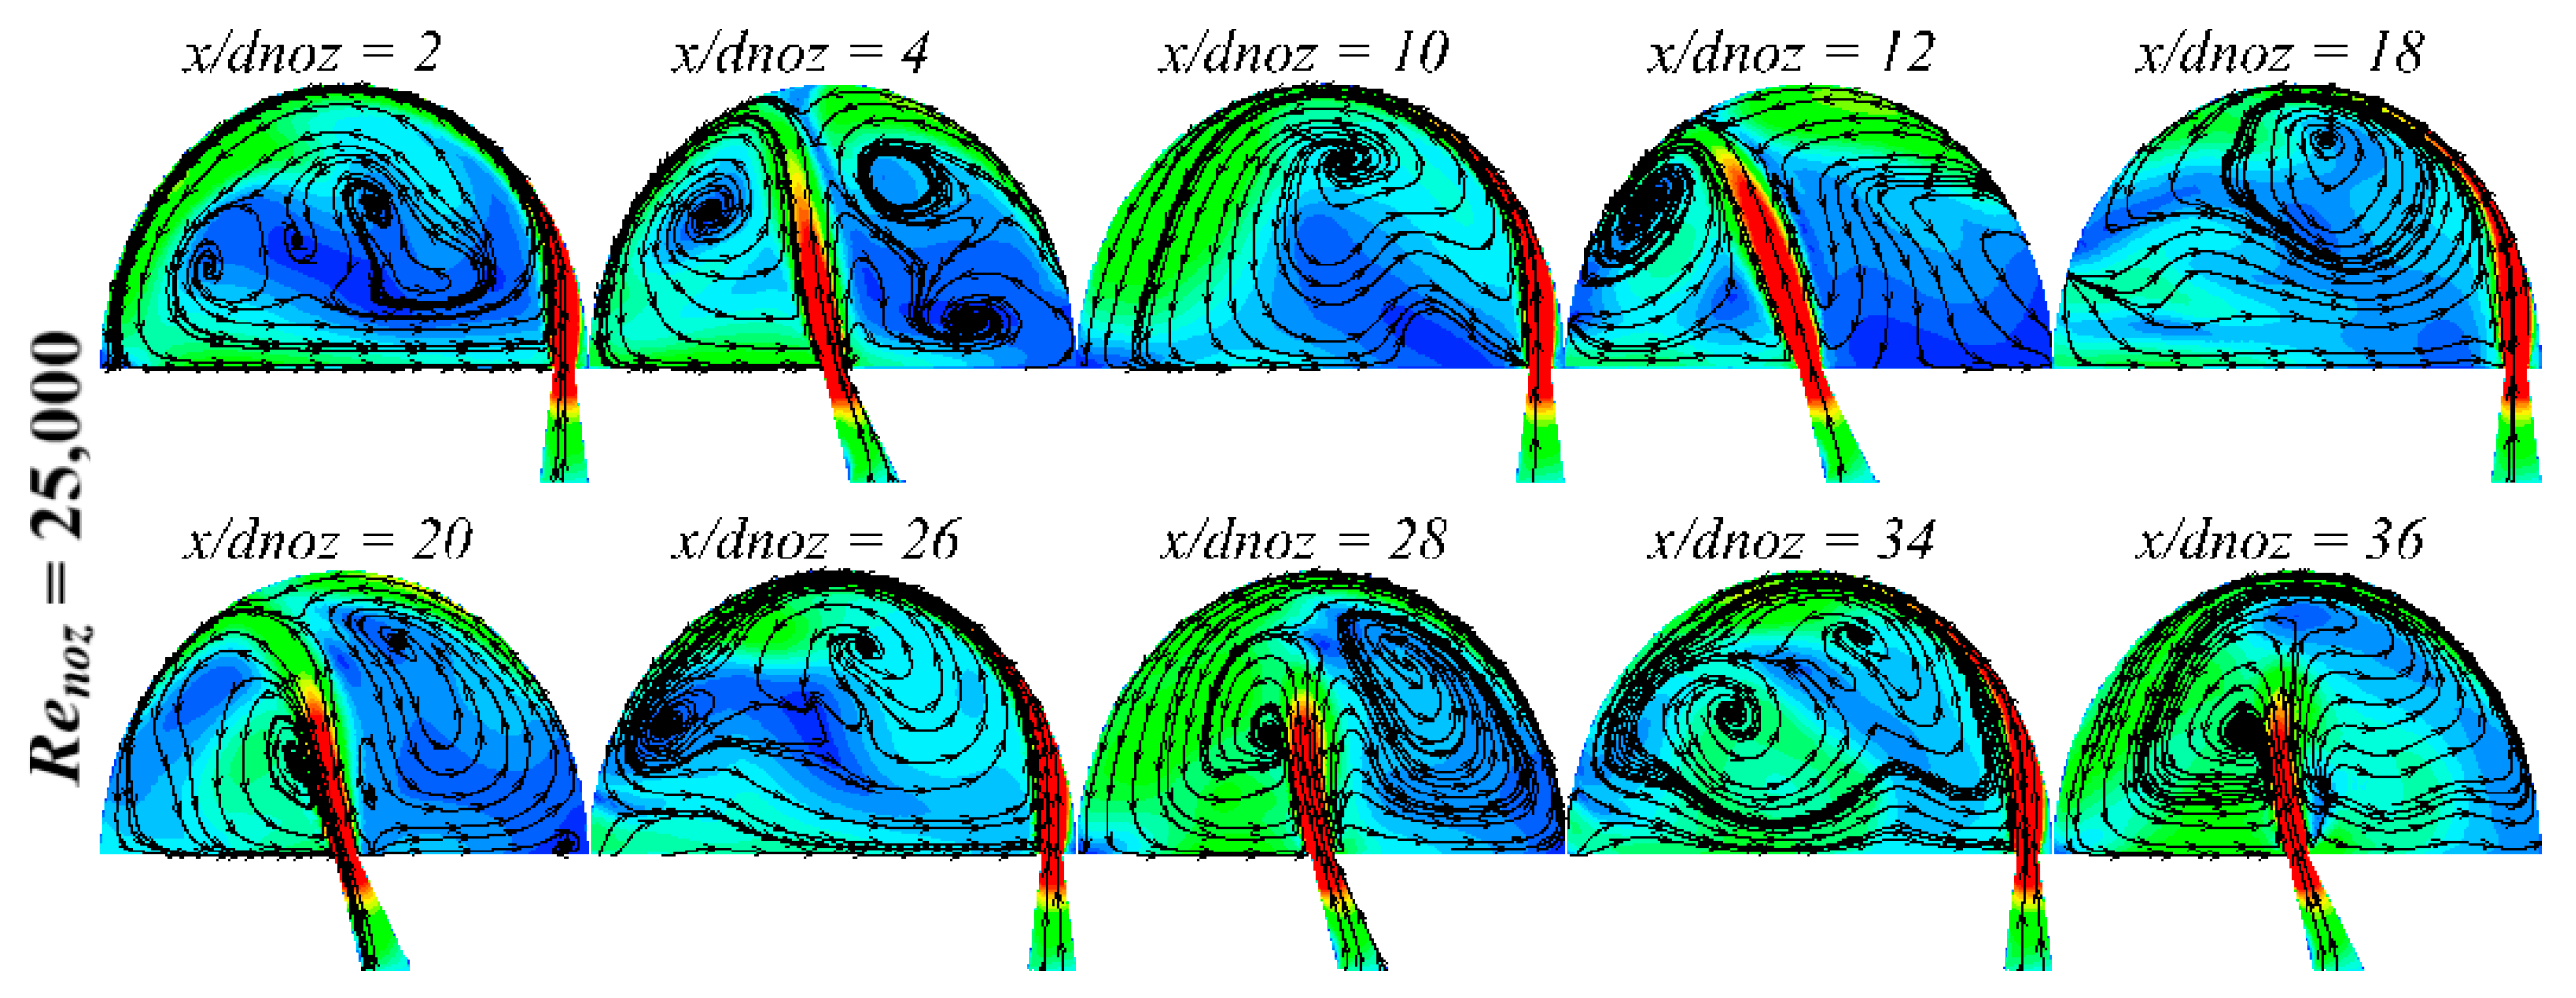
The flow structure inside the compound cooling unit can be deeply described using the area-average velocity contours with streamlines at different x/dnoz sections along the streamwise direction as depicted in Figure 9. Also, the fluid flow is studied at different nozzle Reynolds numbers to predict the variation of the flow characteristics. Ten successive x/dnoz sections passing through swirl and impingement nozzles are chosen to show different flow patterns. The coolant area-average velocity increases drastically by five and a half times through each conical nozzle for all different Reynolds numbers. This is attributed to the flow-path contraction effect, due to the new design of the coolant nozzles. As shown in Figure 9, the coolant rotates with a semi-uniform swirling motion downstream the first swirl nozzle (x/dnoz = 2) forming a large-scale vortex. By increasing x/dnoz, the near-wall flow rotation decays forming two or more small-scale vortices at low Reynolds number (Renoz = 10,000). This is due to the interference with the upstream flow from the flowing impingement nozzles and the core flow. Regarding sections of swirl nozzles, the coolant area-average velocity increases near the wall of the leading-edge downstream each nozzle and decreases further along the peripheral direction due to shear stress. By increasing the nozzle Reynolds number, the coolant area-average velocity increases and the flow streamlines have similar distributions per each section of both swirl and impingement nozzles. According to the impingement nozzles sections, the coolant jet is divided toward both right and left sides, forming two or more different-scale vortices. Besides, the impinging intensity on the target surface increases with the increase in the nozzle Reynolds number. Also, the generated impinging vortices are heterogeneous, which is mainly caused by the collision with the upstream flow coming from the following swirl nozzle. As clearly depicted in Figure 9, both swirl and impingement nozzles achieve the best coolant contact with the target surface with lower momentum loss. Besides, the uniform staggered distribution of all nozzles contributes to uniform concentrated coolant jets especially with the increase of nozzle Reynolds number.
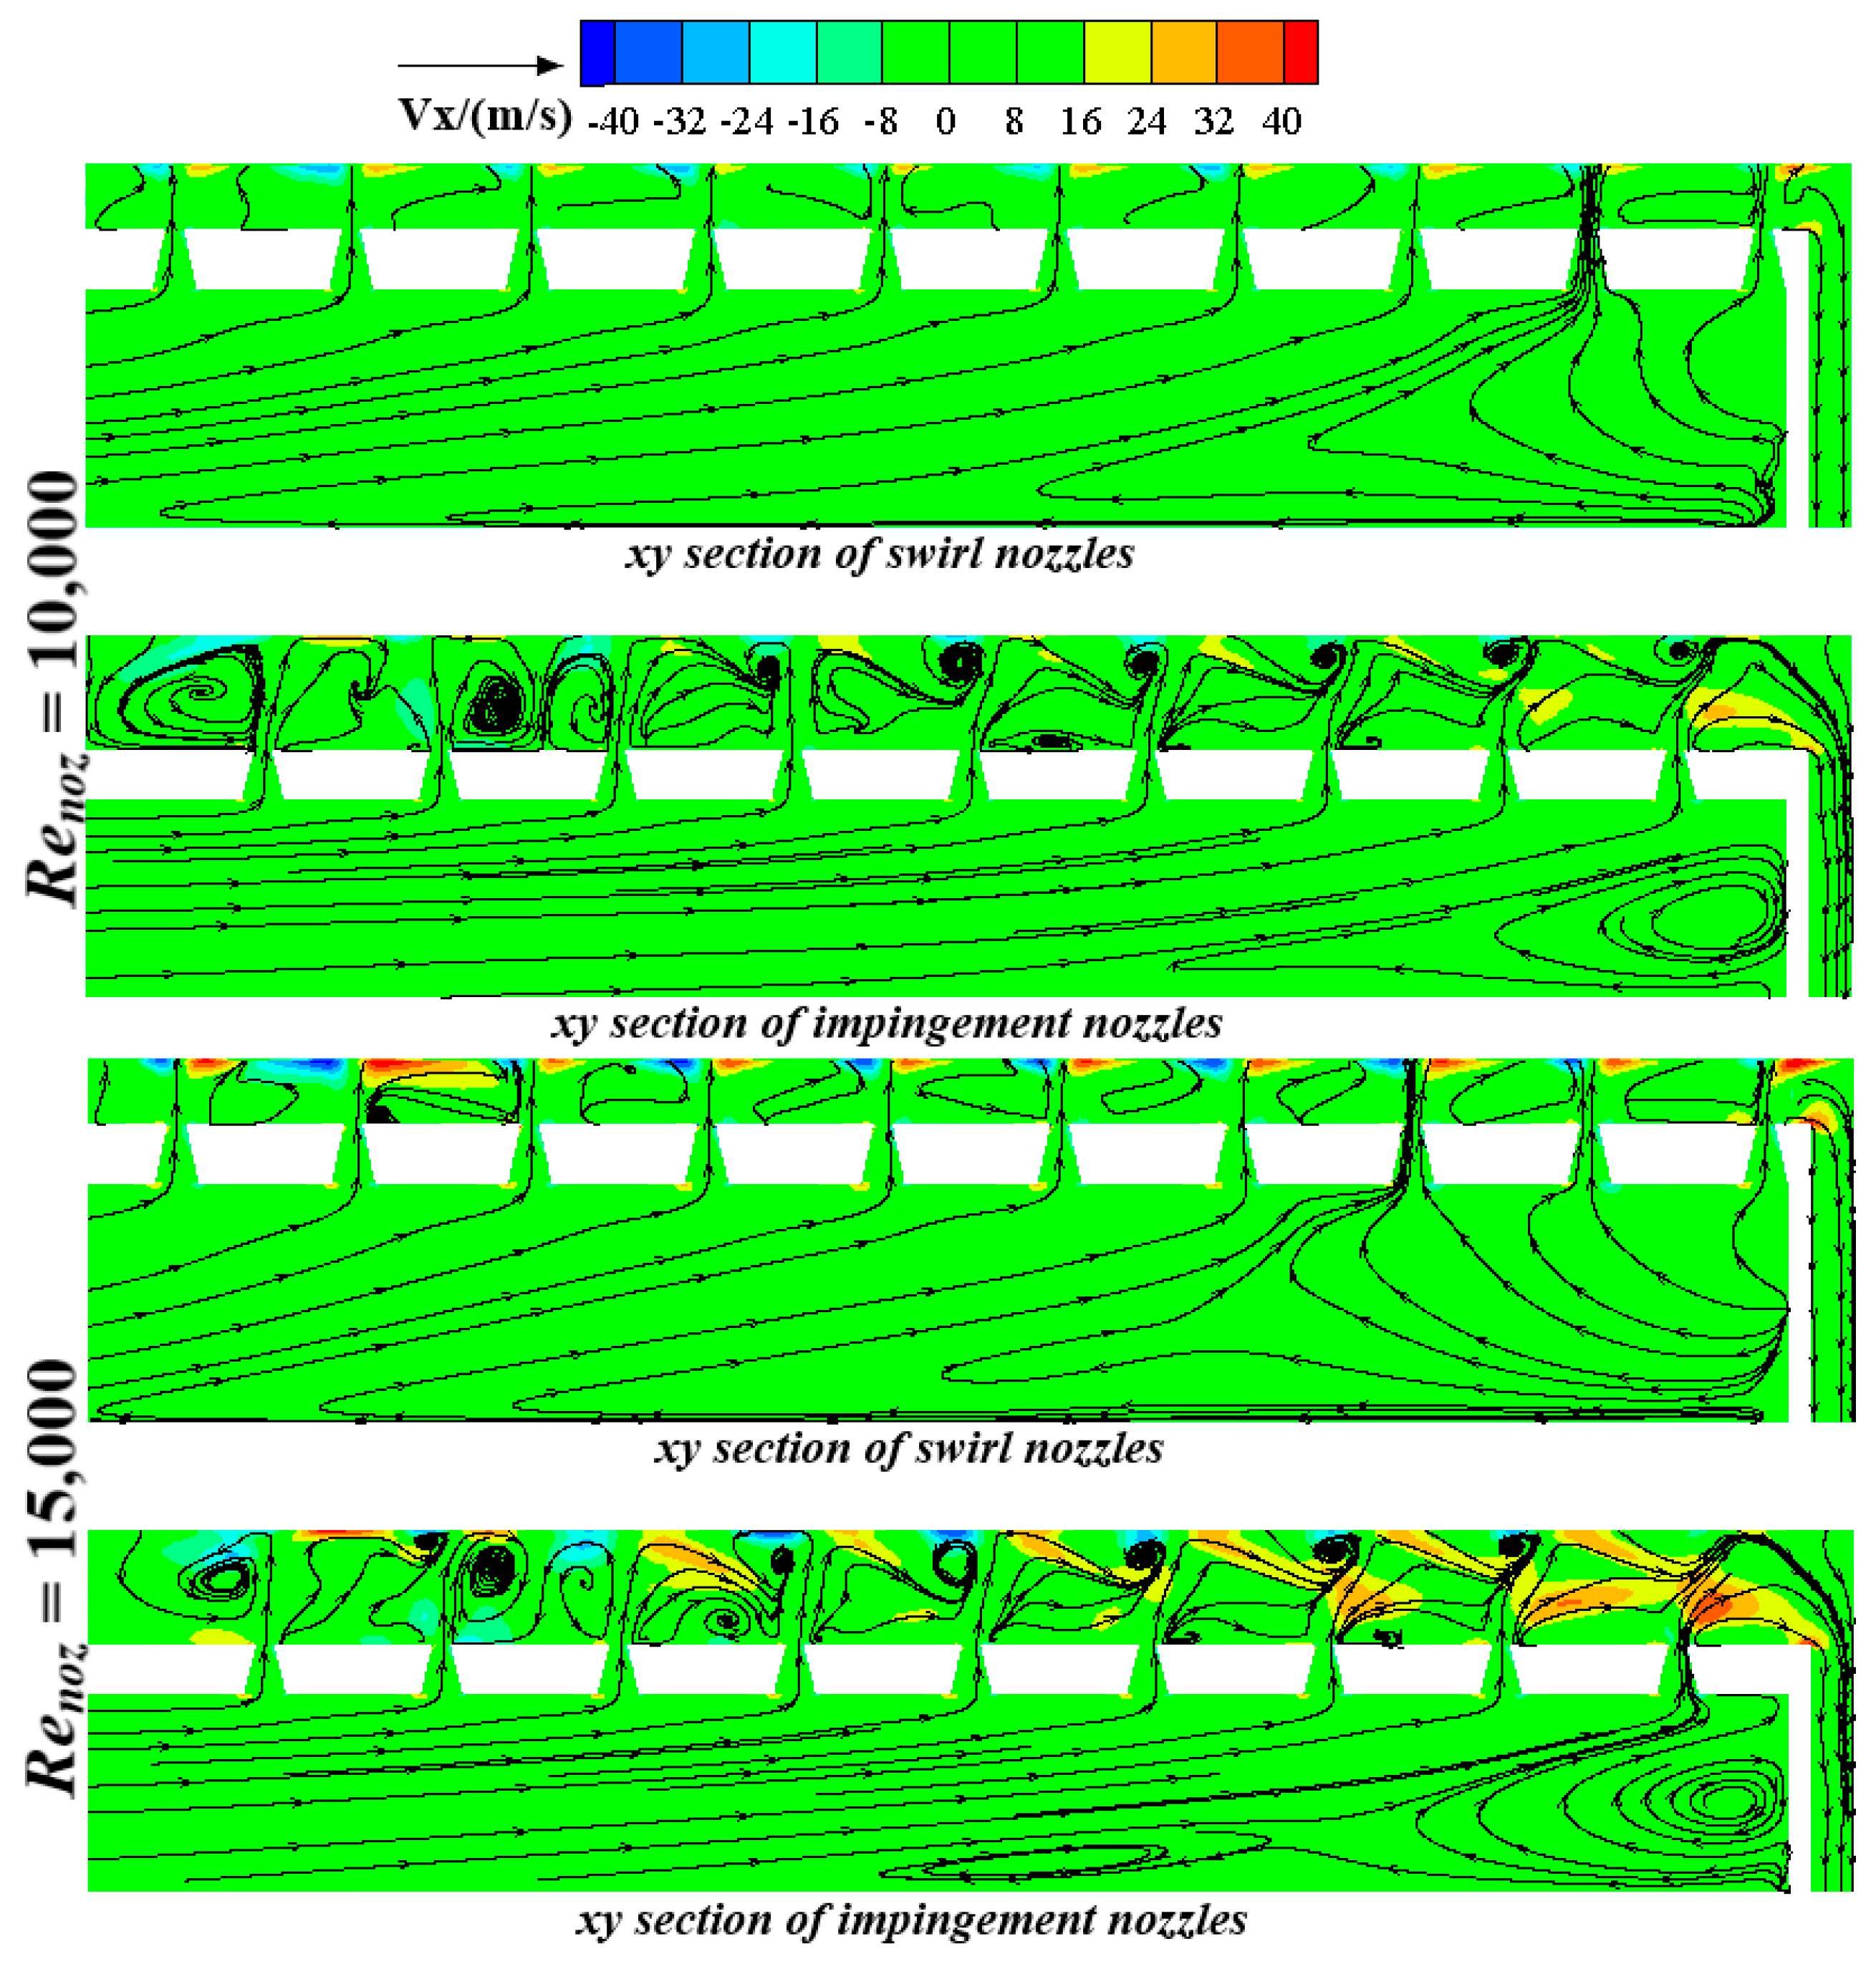
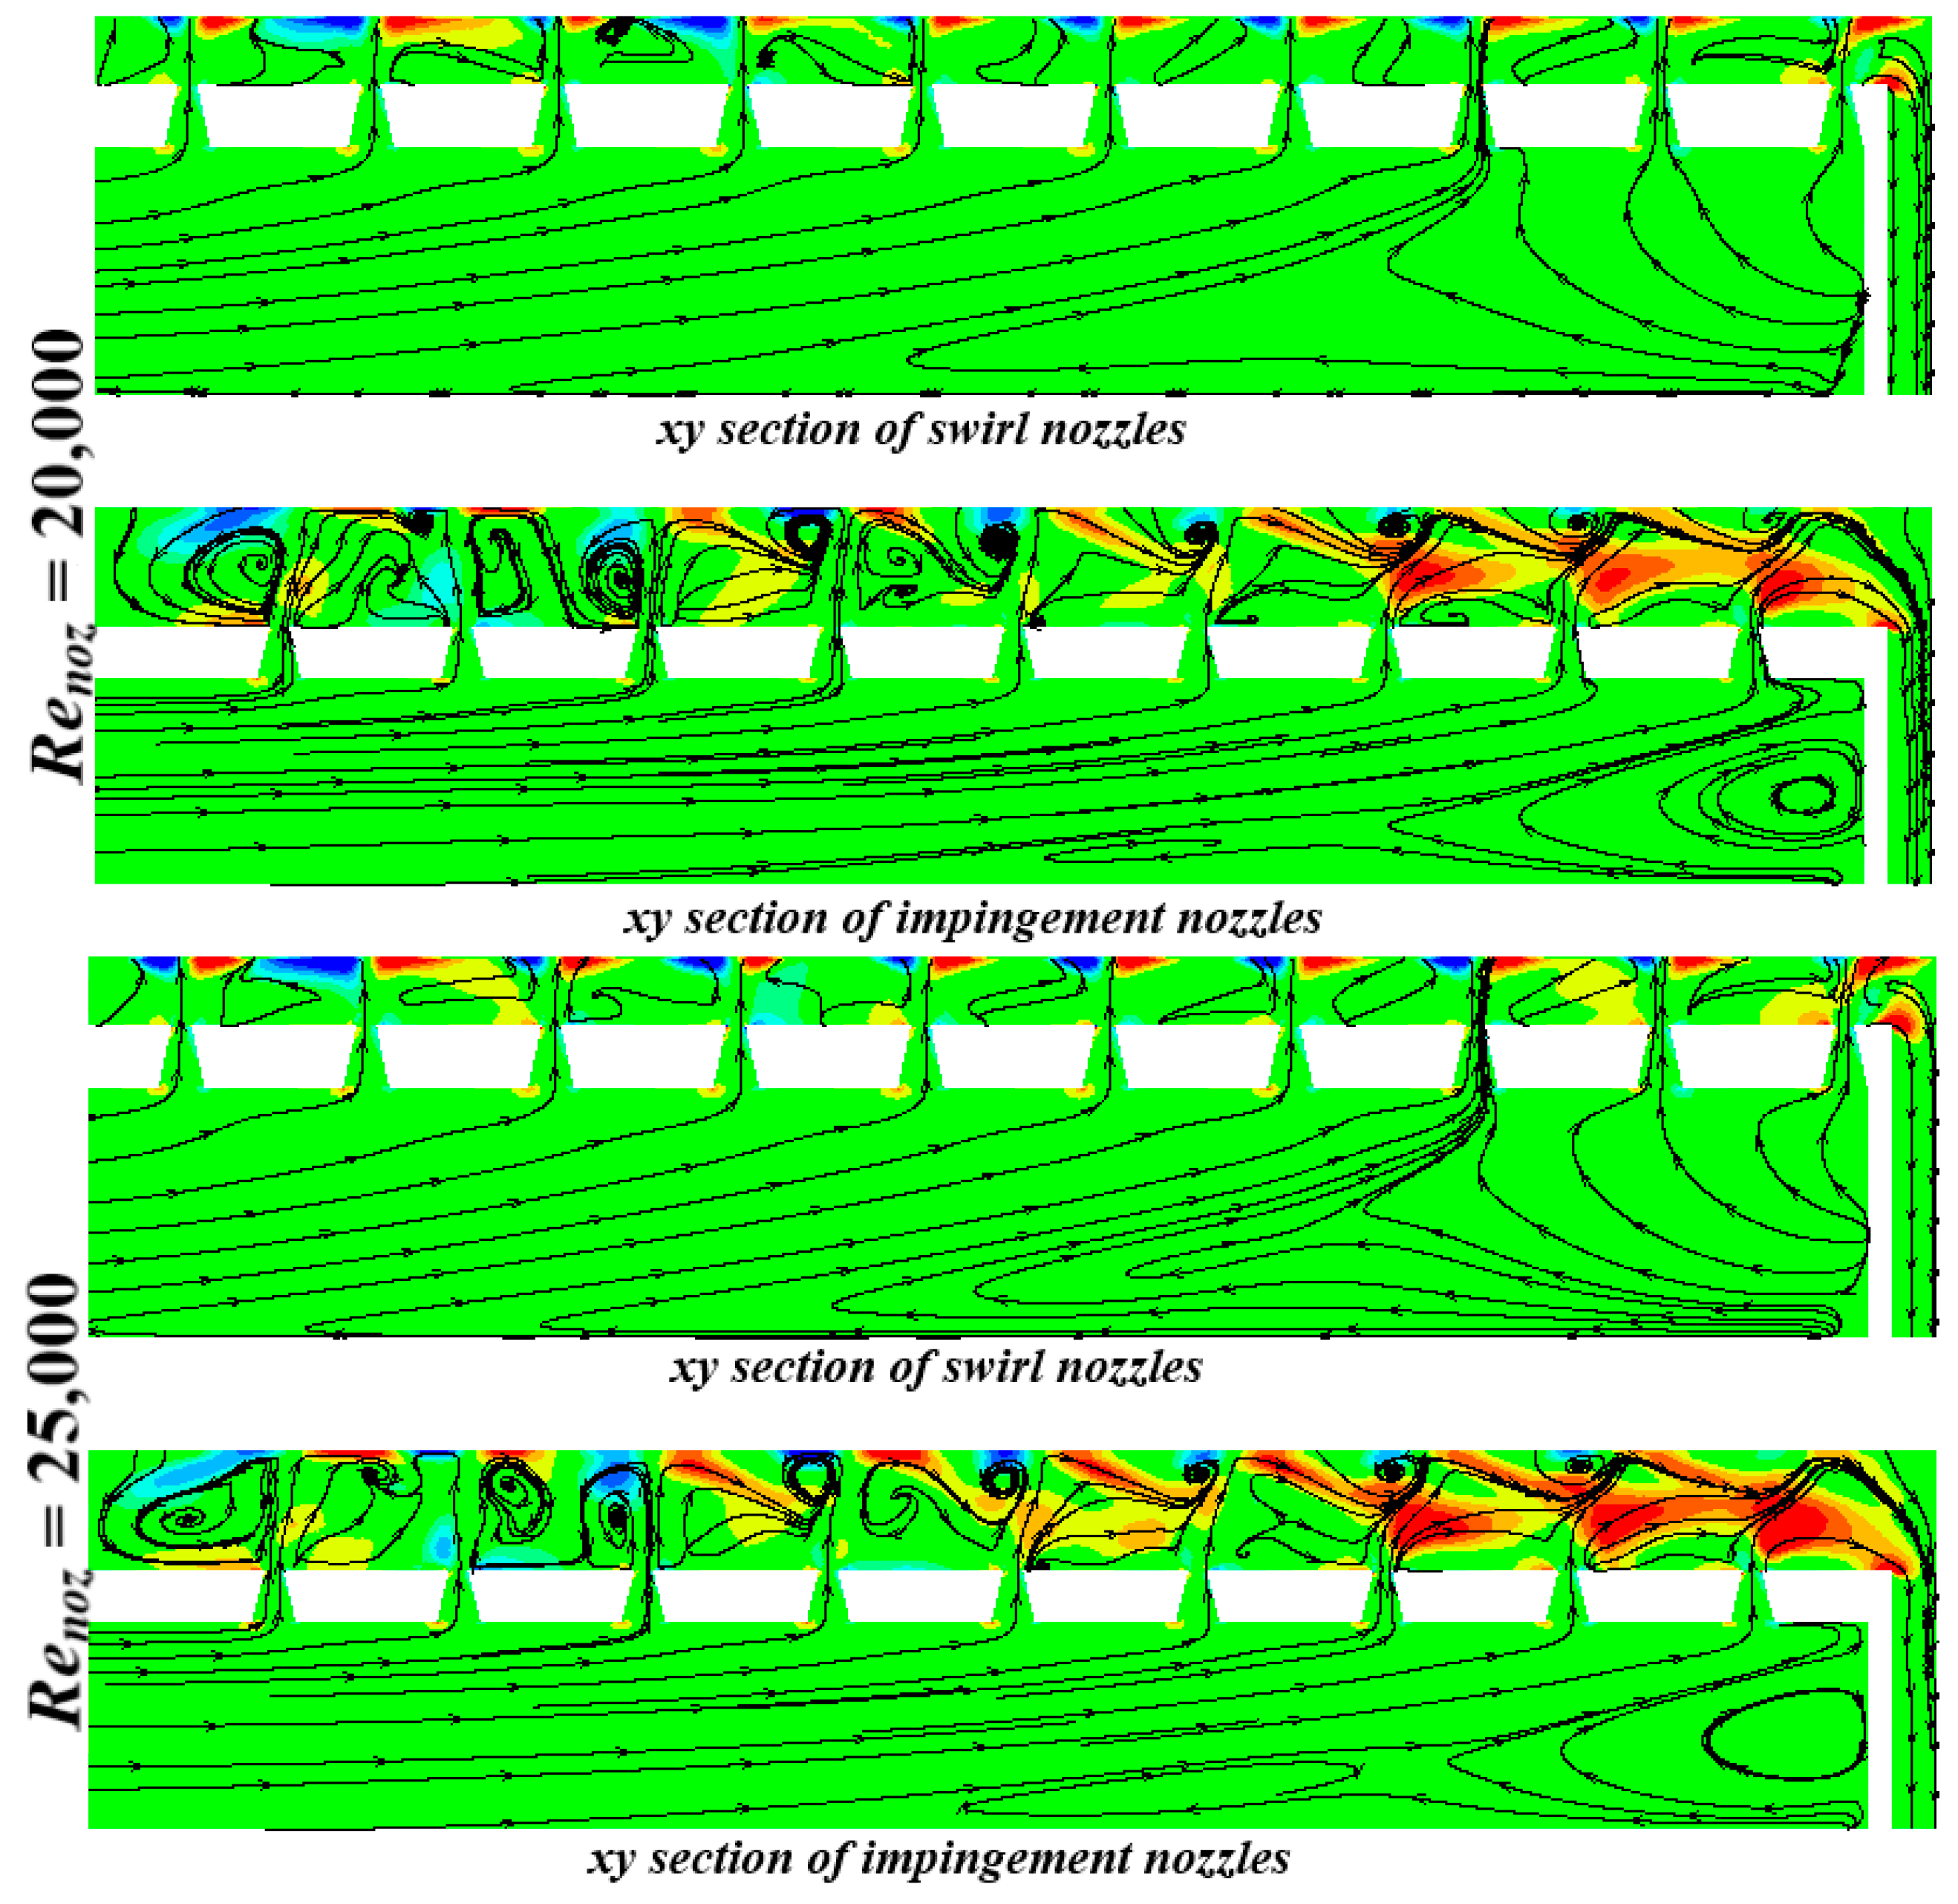
Figure 10 indicates the axial velocity contours with streamlines in different xy sections of both swirl and impingement nozzles at different nozzle Reynolds numbers. With regard to the flow structure of both swirl and impingement nozzles sections, the axial velocity increases along the axial direction further downstream near the core flow inside the leading-edge cavity. This is attributed to the developing successive coolant nozzles along the axial direction. As depicted in Figure 10, there are little reverse-flow regions in the leading-edge cavity, in which the reverse-velocity decreases with the increase of nozzle Reynolds number. Besides, the high axial velocity zones start from the seventh impingement nozzle in the leading-edge cavity, which increases with the increase of nozzle Reynolds number. This flow phenomenon of the accelerating of axial velocity toward the outlet may be attributed to the generation of the simultaneously accumulated different-scale vortices due to both swirl and impingement nozzles.
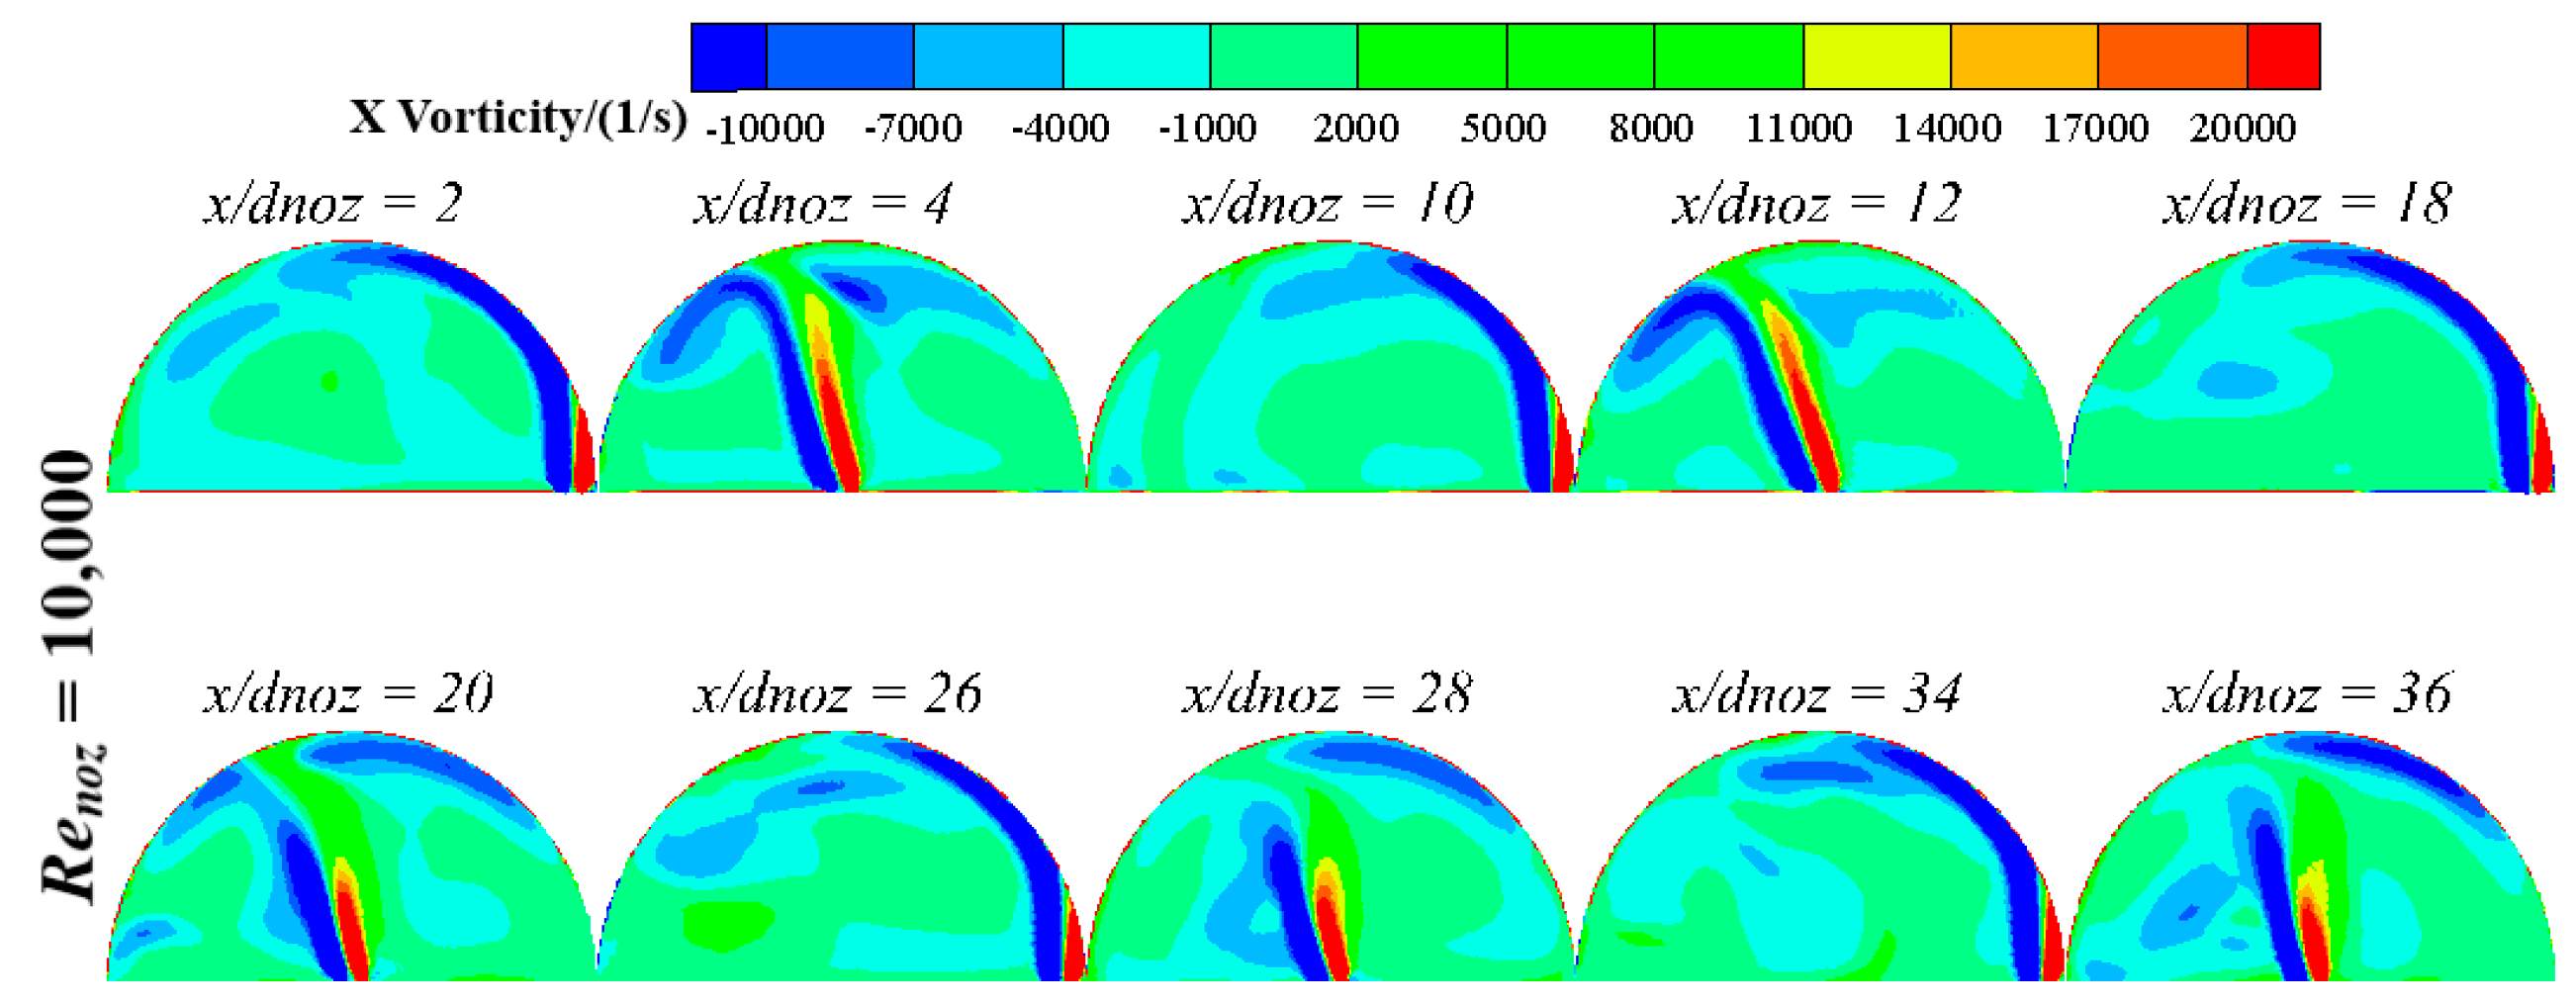
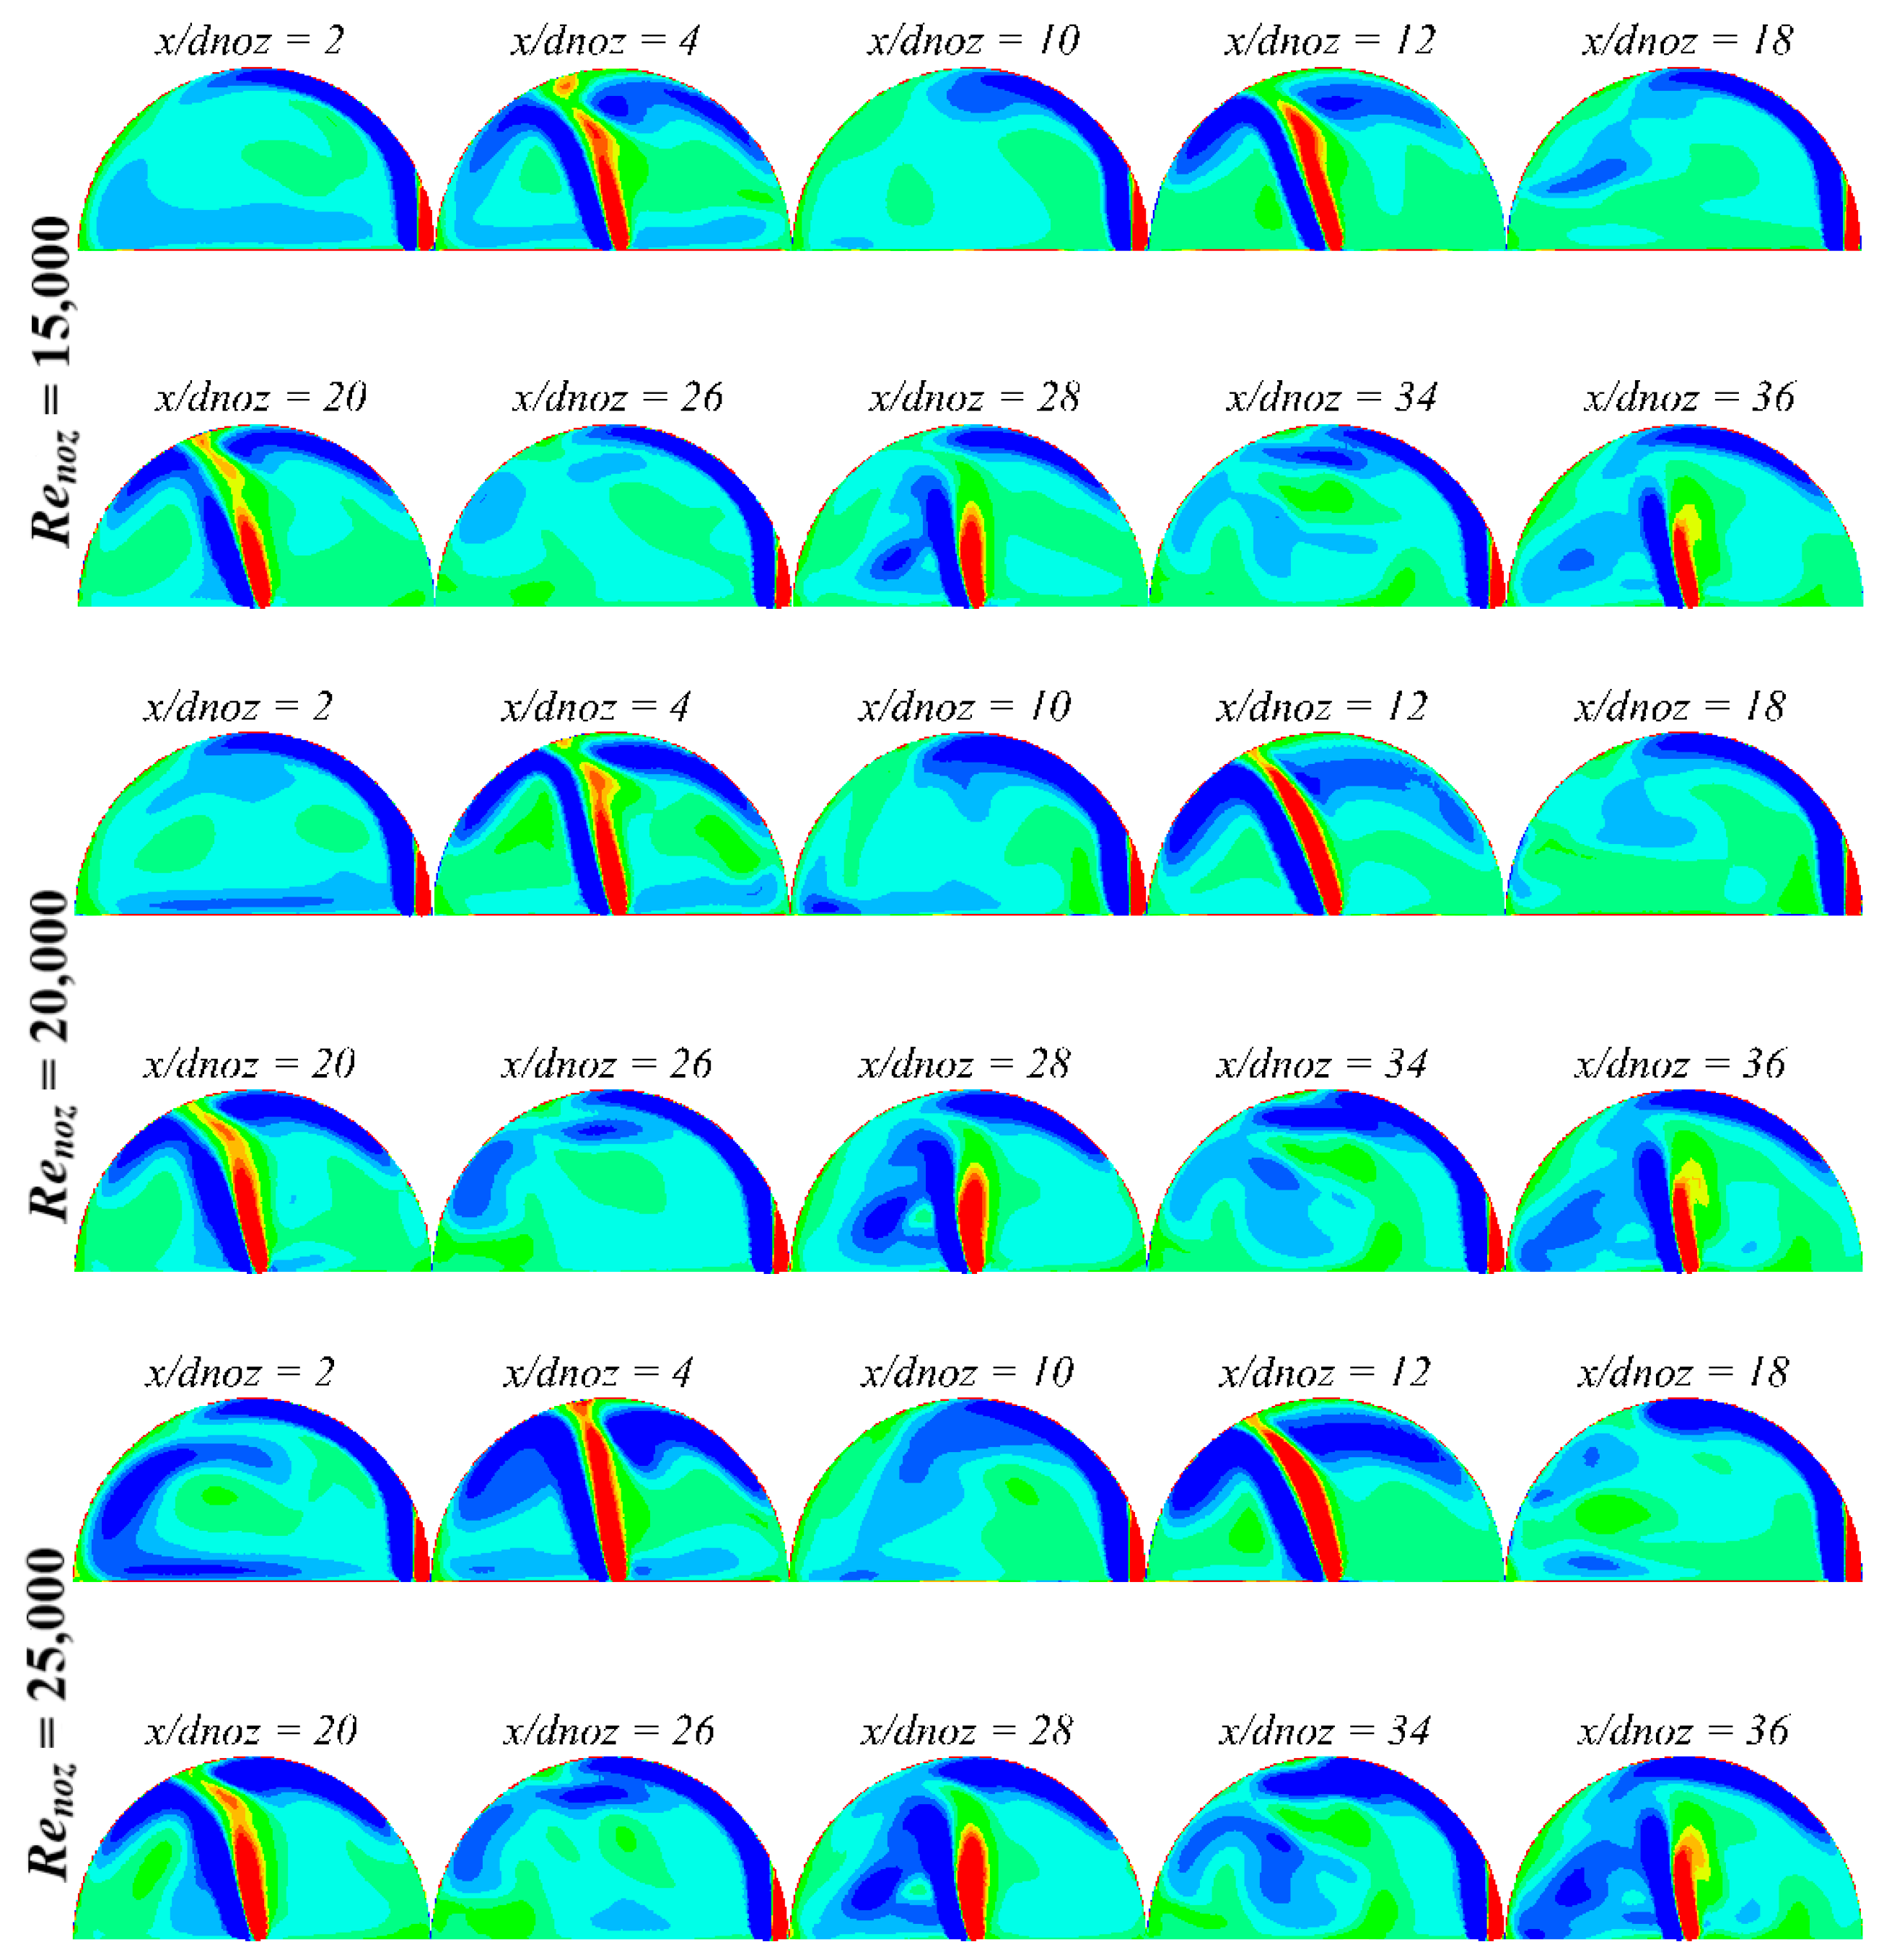
In order to describe the fluid rotation, the axial vorticity is employed to indicate the intensity of the swirling motion inside the leading-edge cavity. Figure 11 illustrates the axial vorticity contours at different x/dnoz sections along the x-axis direction of both swirl and impingement nozzles at different nozzle Reynolds numbers. As shown in Figure 11, for the swirl sections (x/dnoz = 2, 10, 18, 26 and 34), the positive vorticity regions occur directly downstream of each nozzle and very close to the curved wall. However, by increasing the nozzle Reynolds number, the negative vorticity zones increase further downstream along the circumferential direction and near to the core flow at the fixed x/dnoz section. The different distributions of the axial vorticity are attributed to the existence of different scale vortices generated due to the interaction between the tangential flow and the core flow as depicted in Figure 9. With regard to the impingement sections (x/dnoz = 4, 12, 20, 28 and 36), the normal jet creates two opposite accompanied high vorticity regions which propagate with adverse direction per each one. Moreover, additional negative vorticity appears in different positions and increases with the increase of nozzle Reynolds number per each x/dnoz section. The negative vorticity zones are generated due to the existence of different scale and corner vortices as depicted in Figure 9. Generally, the gathering between both swirl and impingement nozzles in the compound cooling model causes a complex vorticity distribution which hinders the continuous swirling intensity inside the leading-edge cavity.
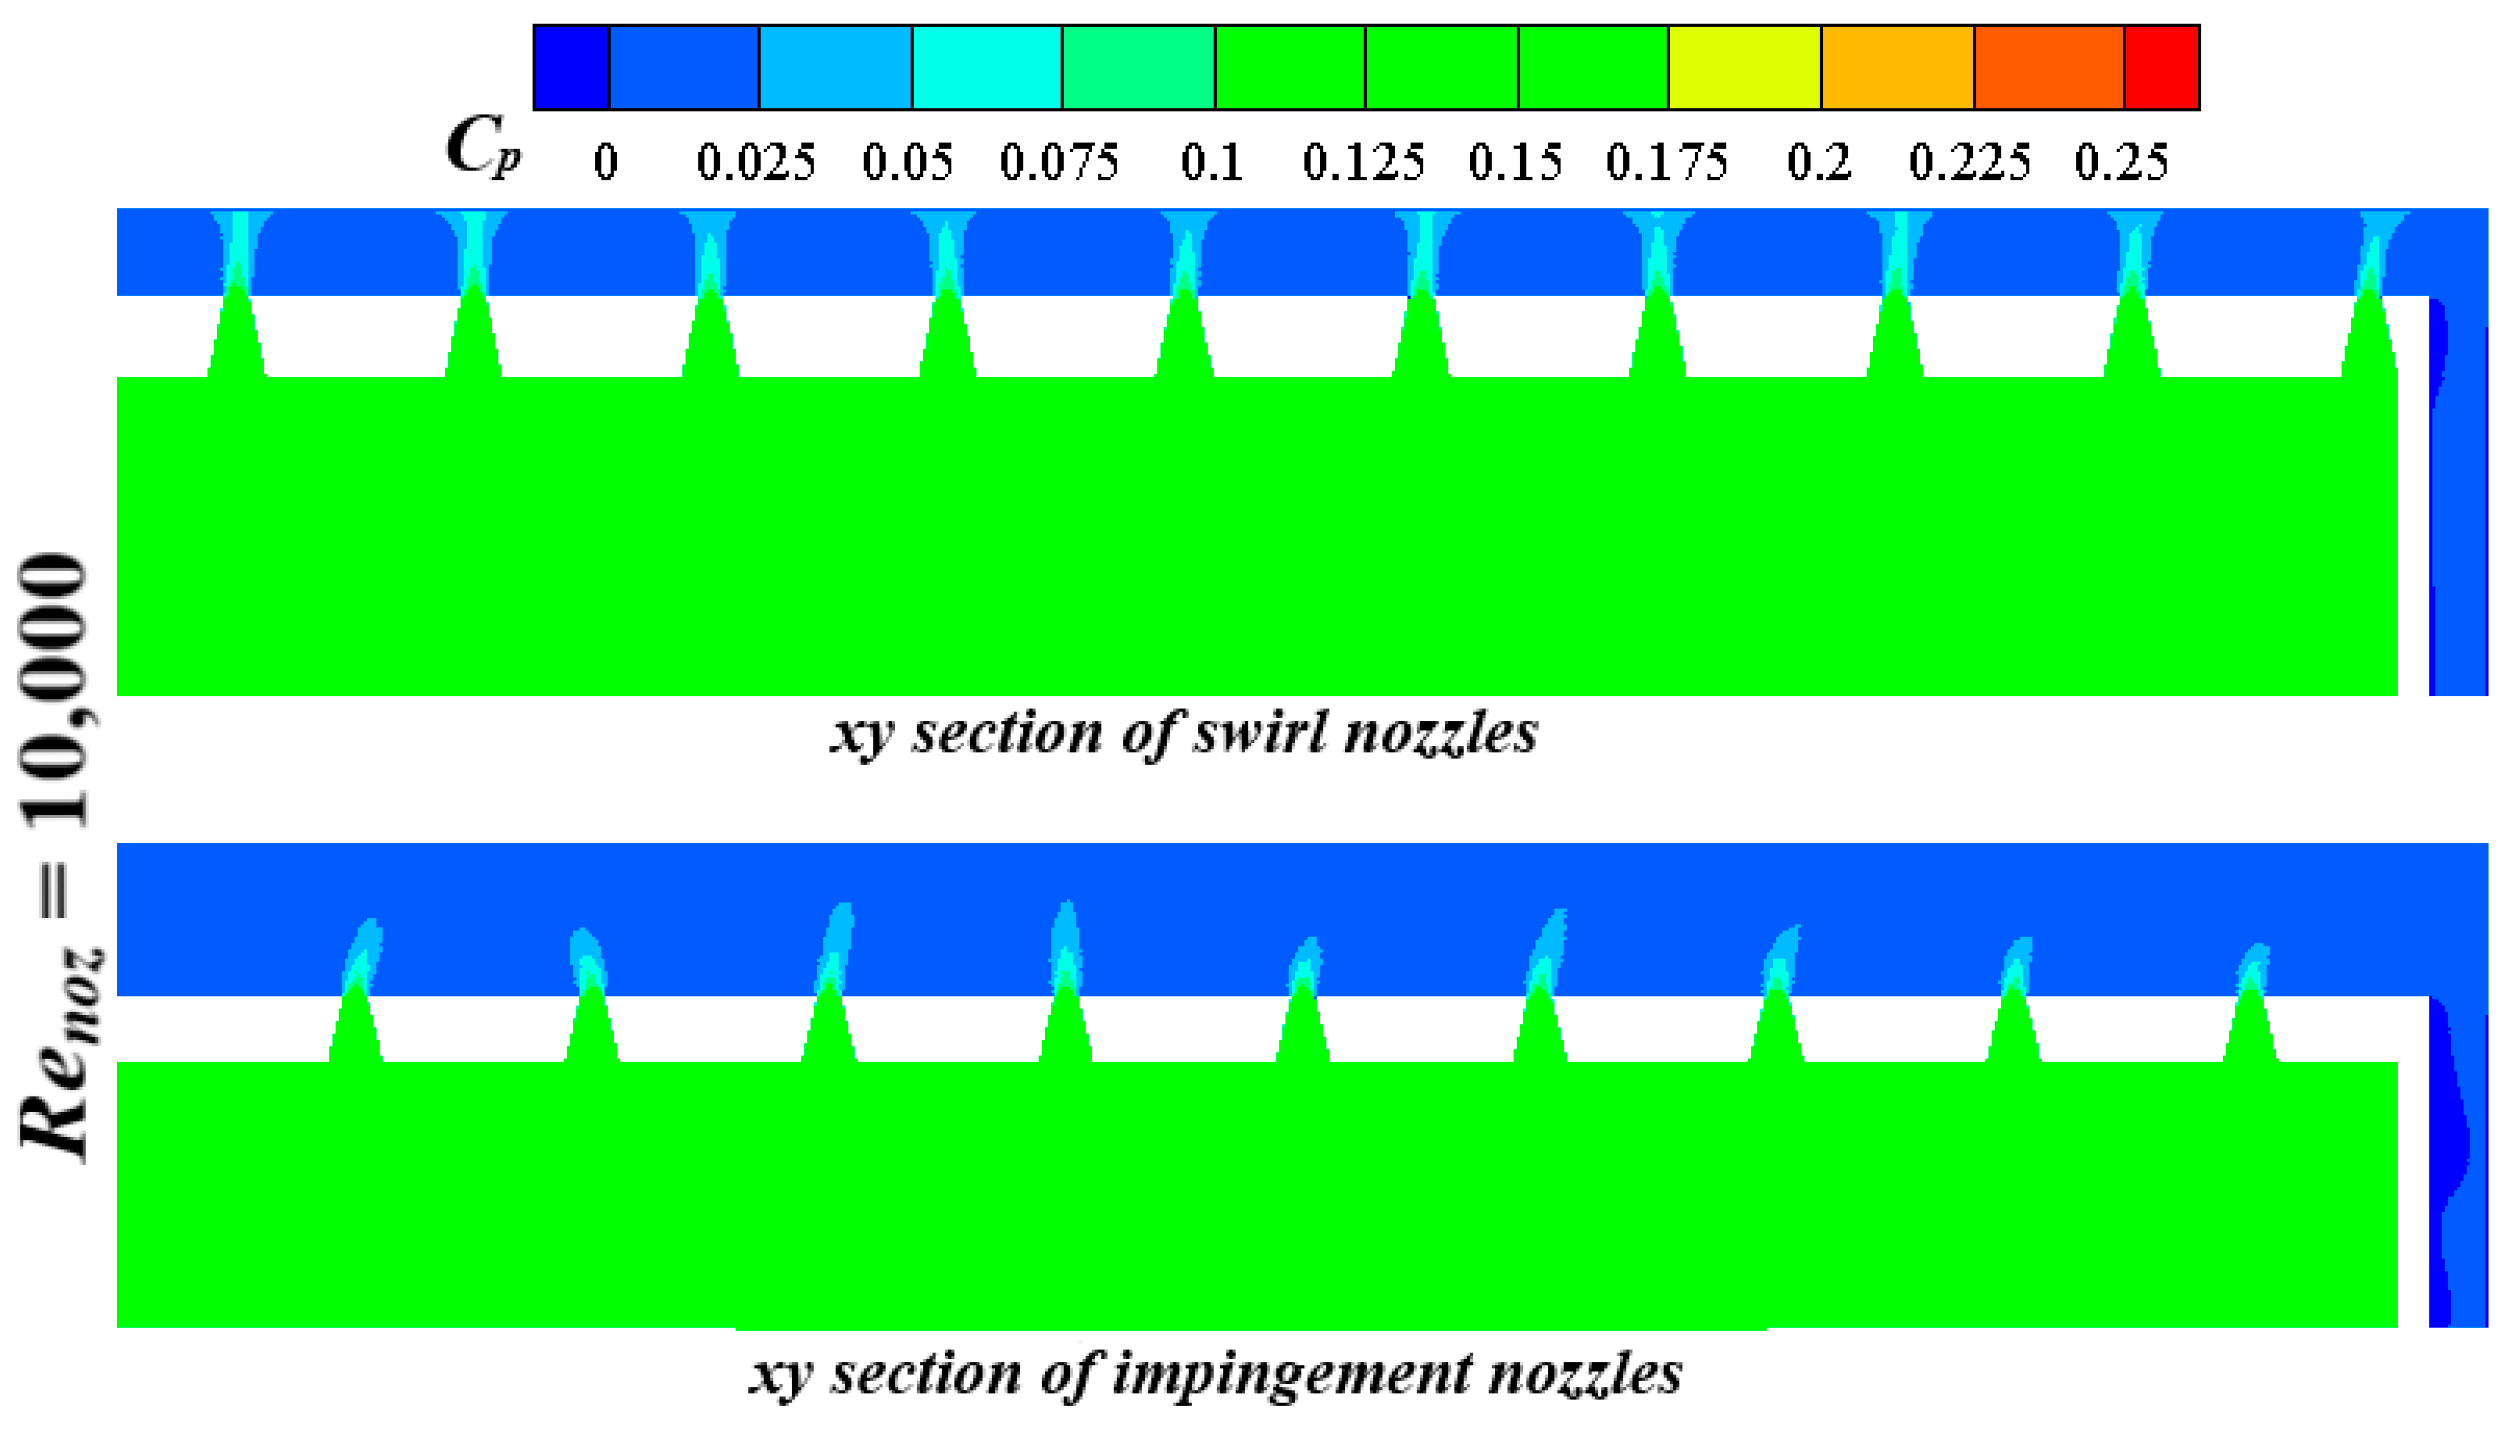
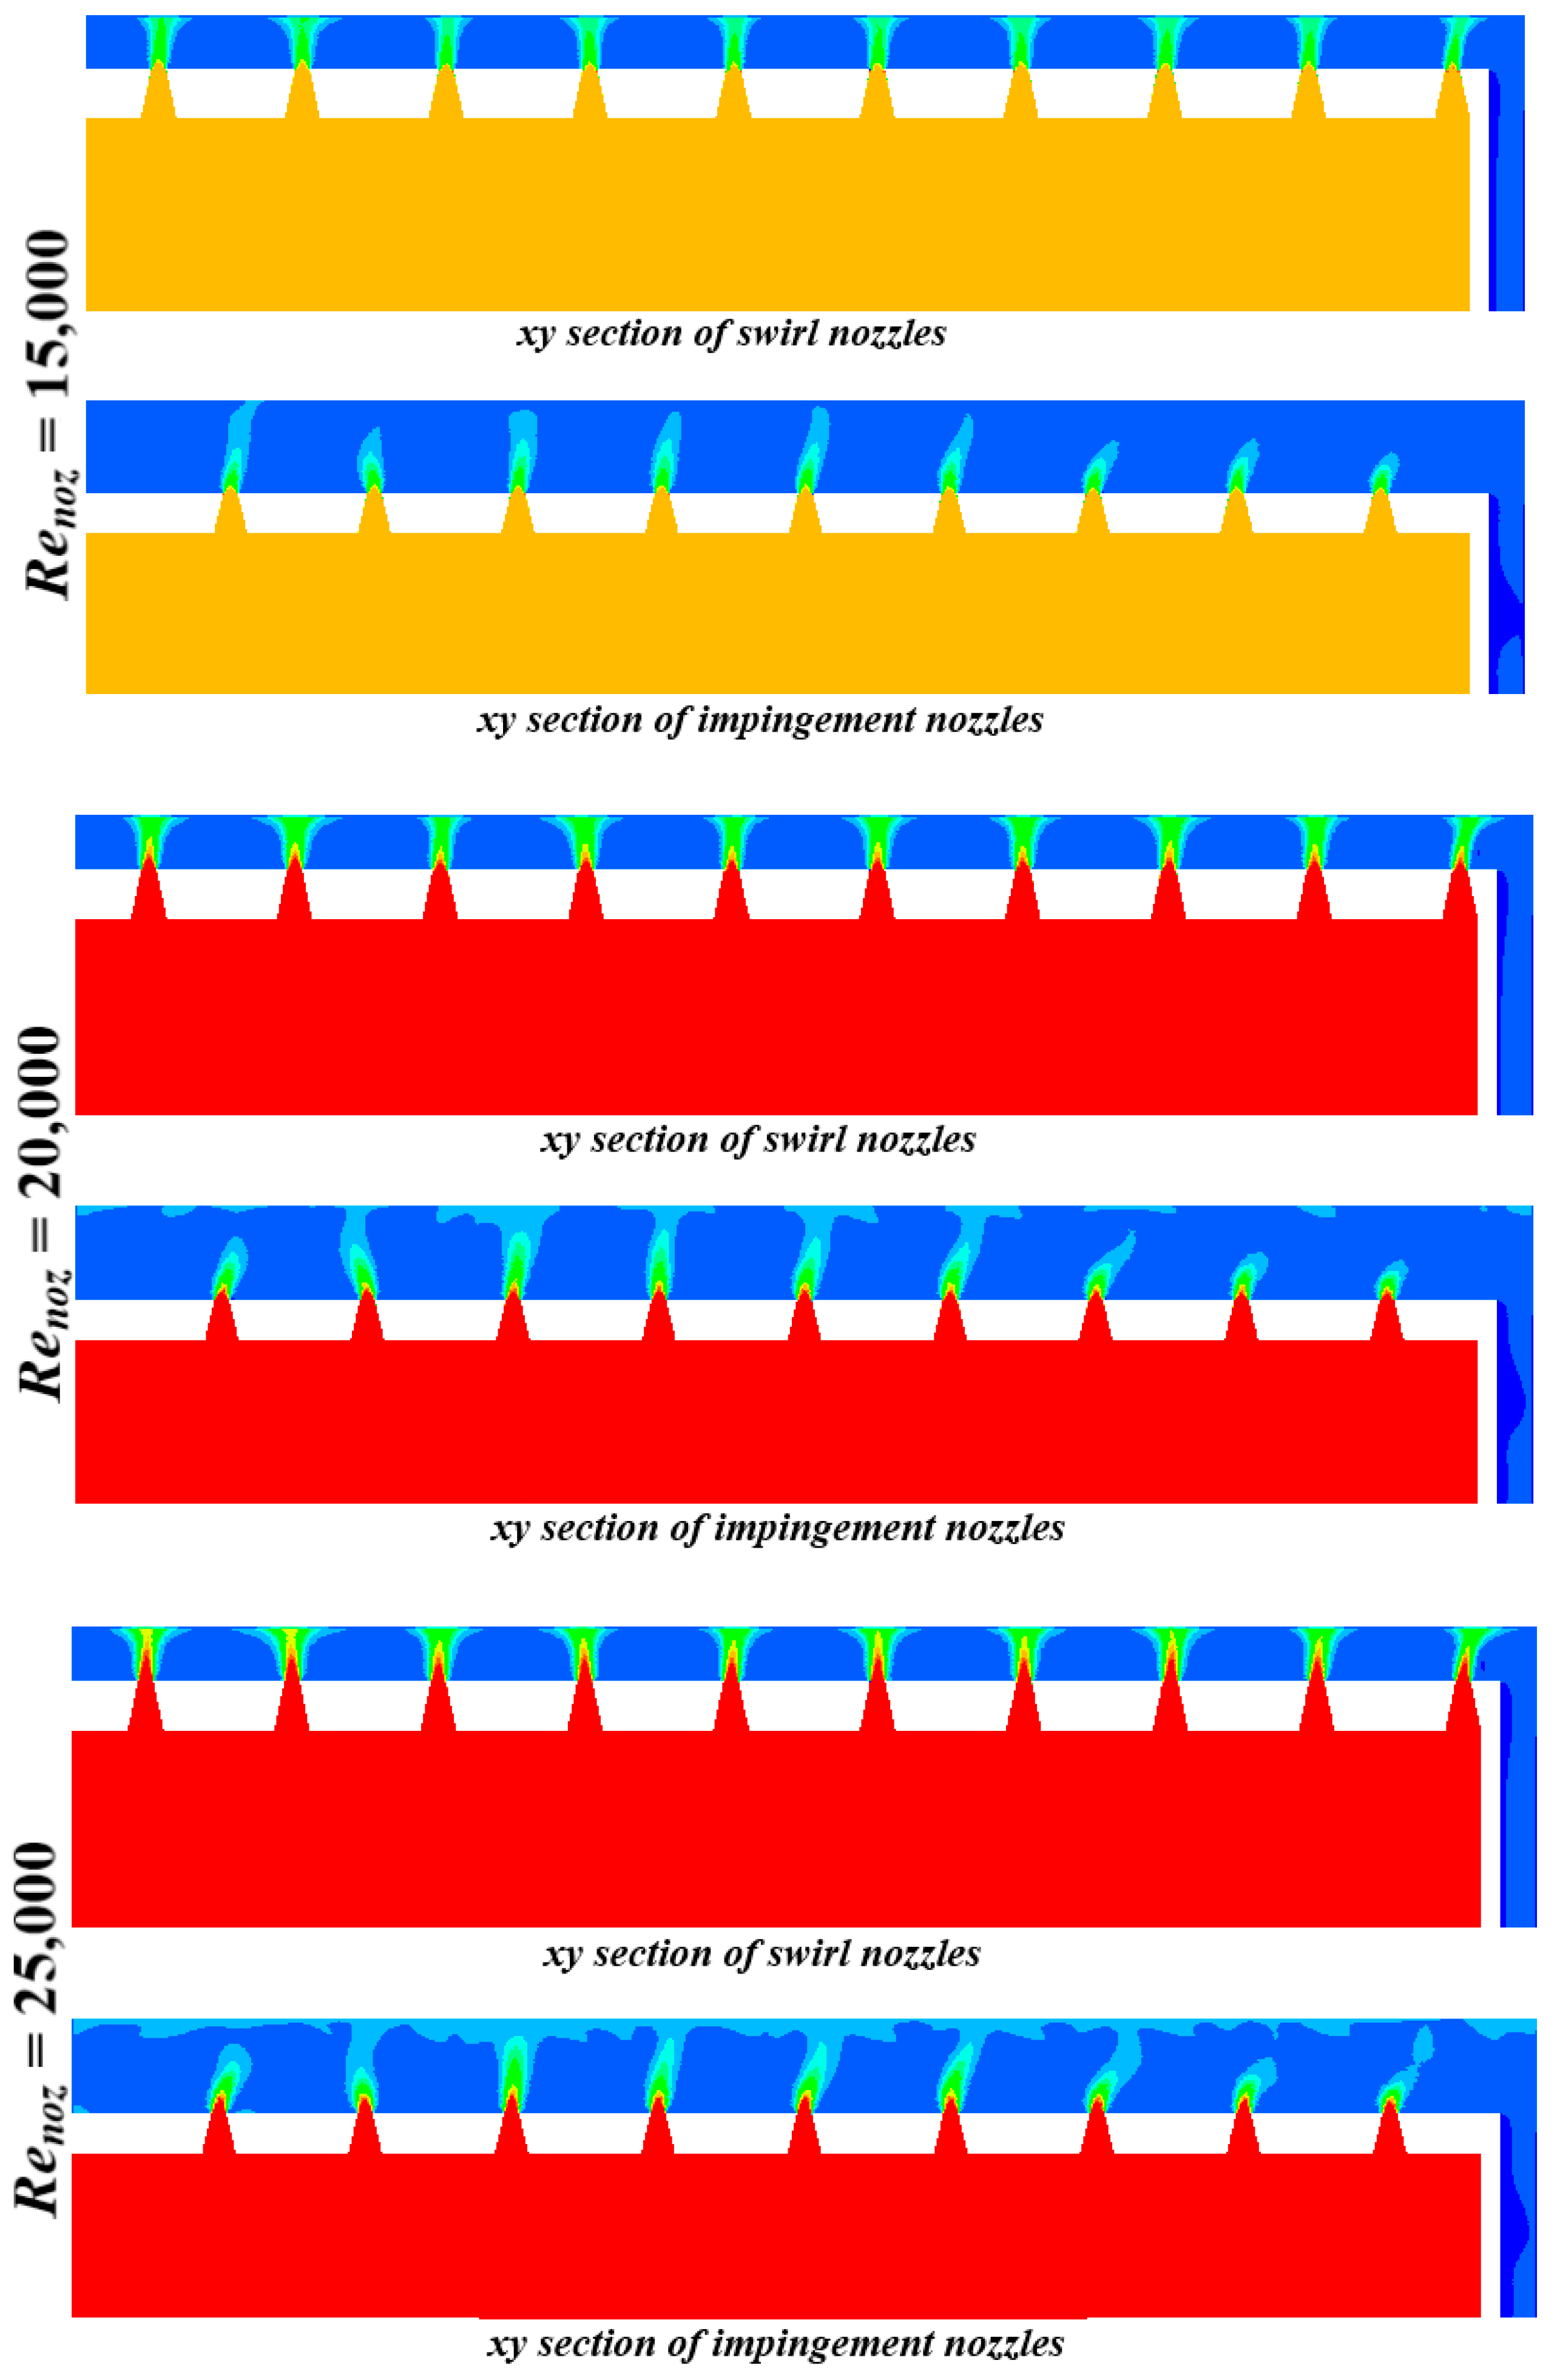
Figure 12 shows the local pressure coefficient contours of the compound cooling unit at different xy sections. As depicted in Figure 12, the coolant pressure reduces when the flow is injected through each conical nozzle due to the increase in the coolant velocity. Meanwhile, the high-pressure zone is located in the coolant chamber while the low pressure exists in the leading-edge cavity. As indicated in Figure 12, the local pressure distributions are similar through each of the swirl and impingement xy sections with small relatively different gradients. Moreover, the coolant pressure coefficient increases for each xy section with the increase of nozzle Reynolds number. Furthermore, Figure 13 indicates the total pressure drop through the compound cooling unit at different nozzle Reynolds numbers. As shown in Figure 13, the total pressure drop increases with the increase of the nozzle Reynolds number. Thereby, the pressure penalty is higher when the nozzle Reynolds number is greater due to the higher area-average velocity of coolant.

3.2. Thermal Analyses

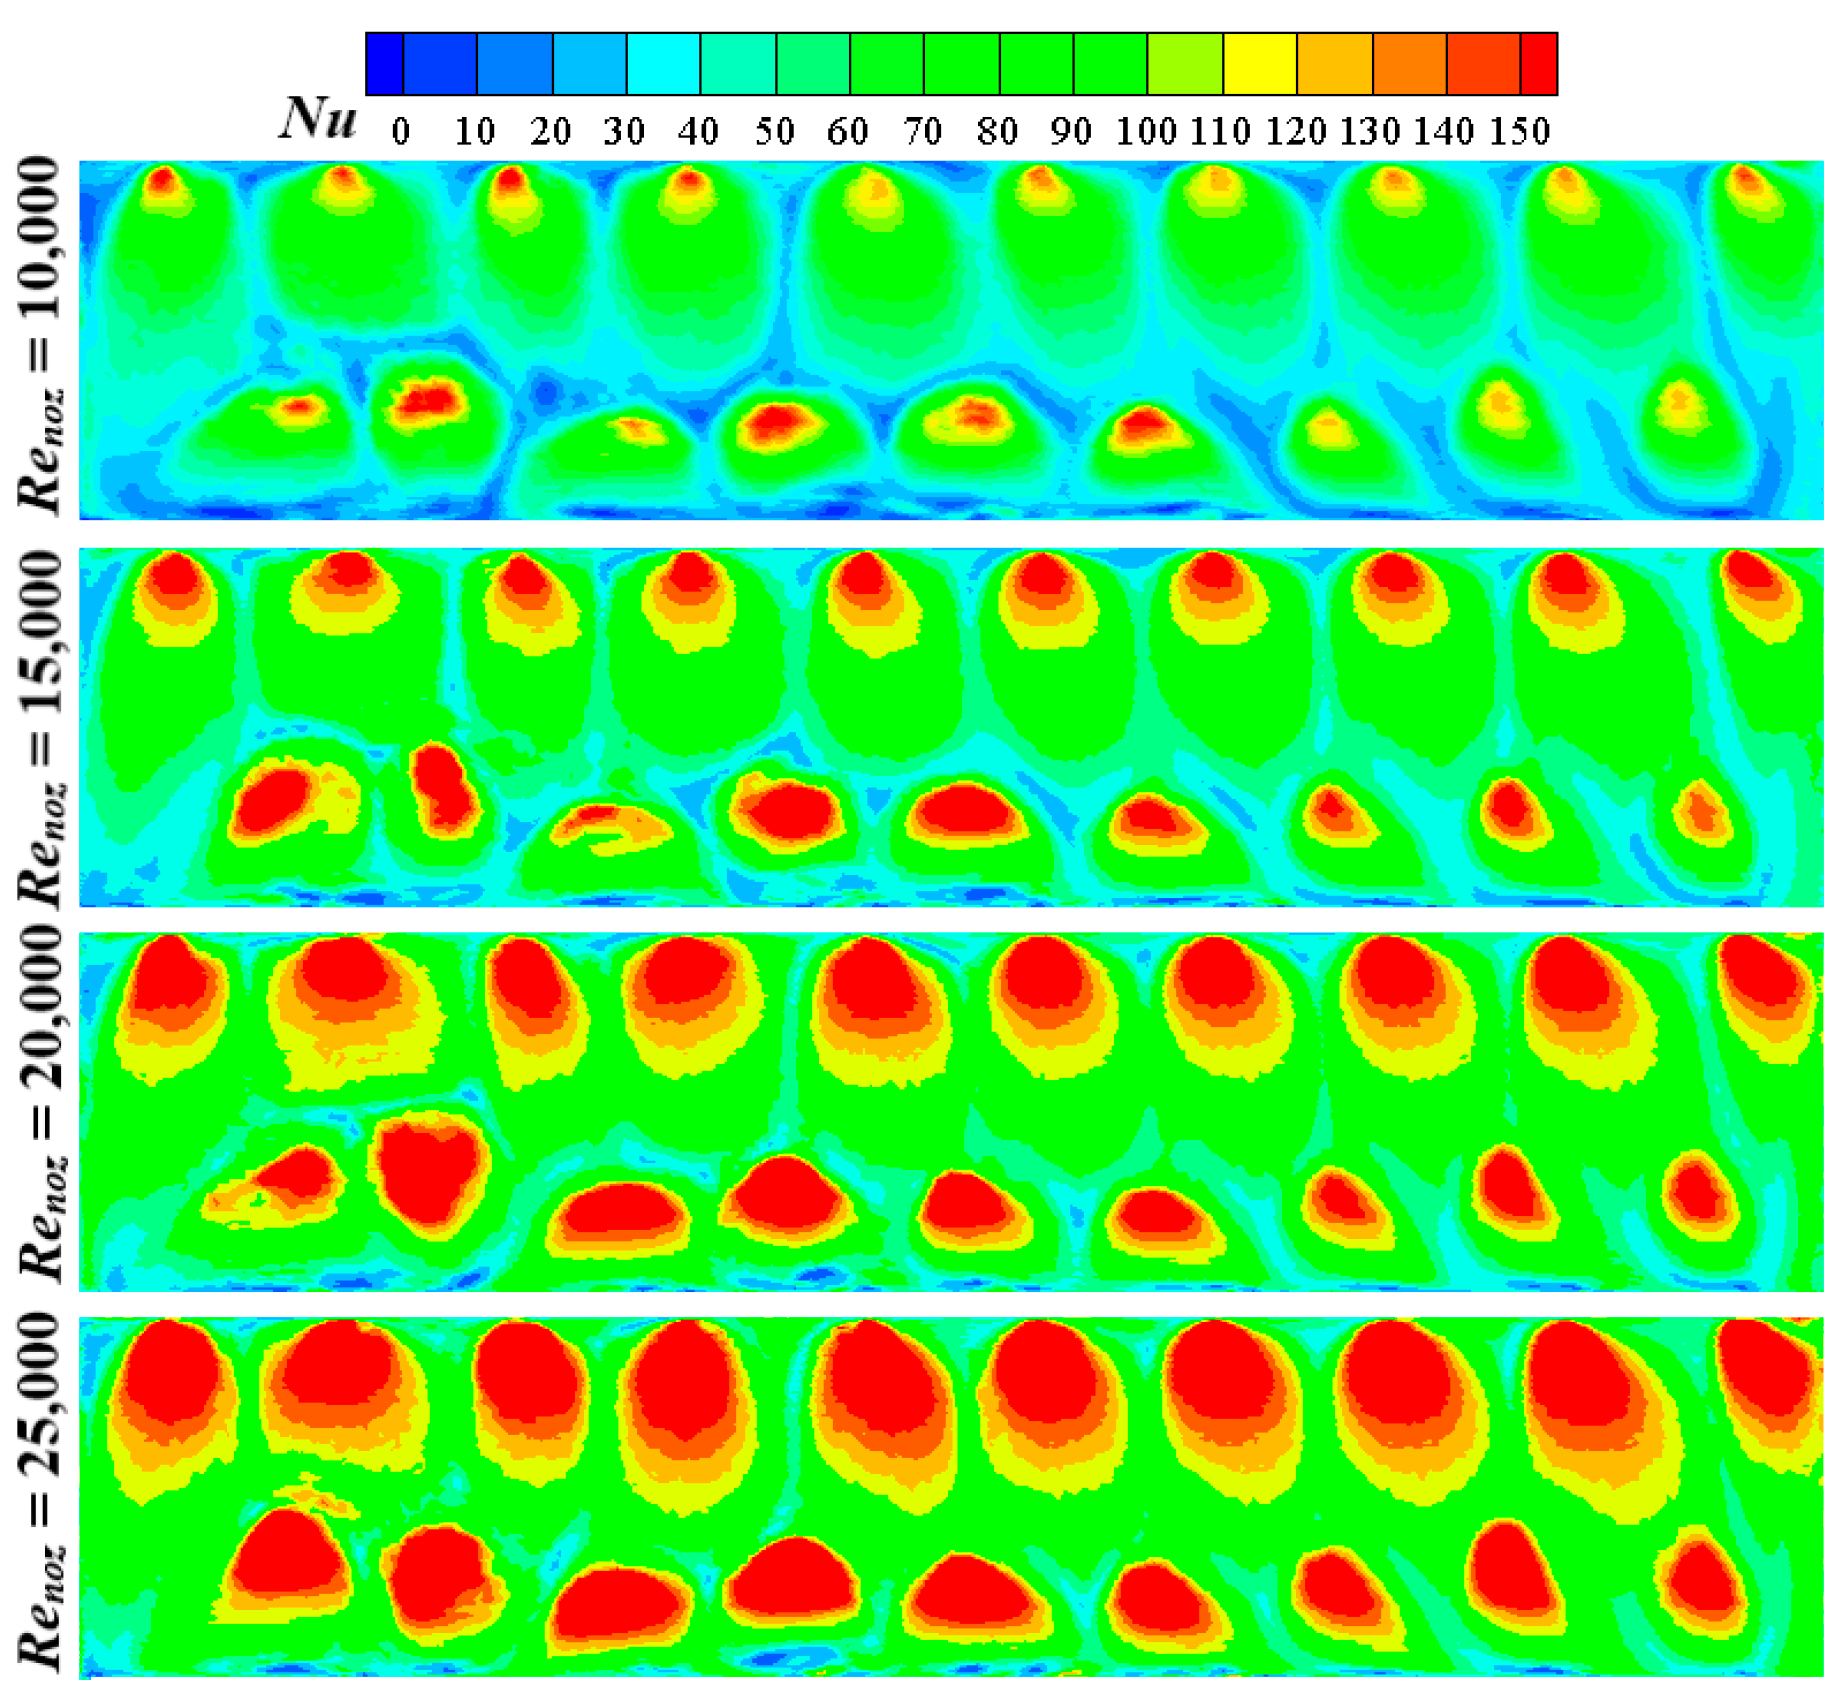
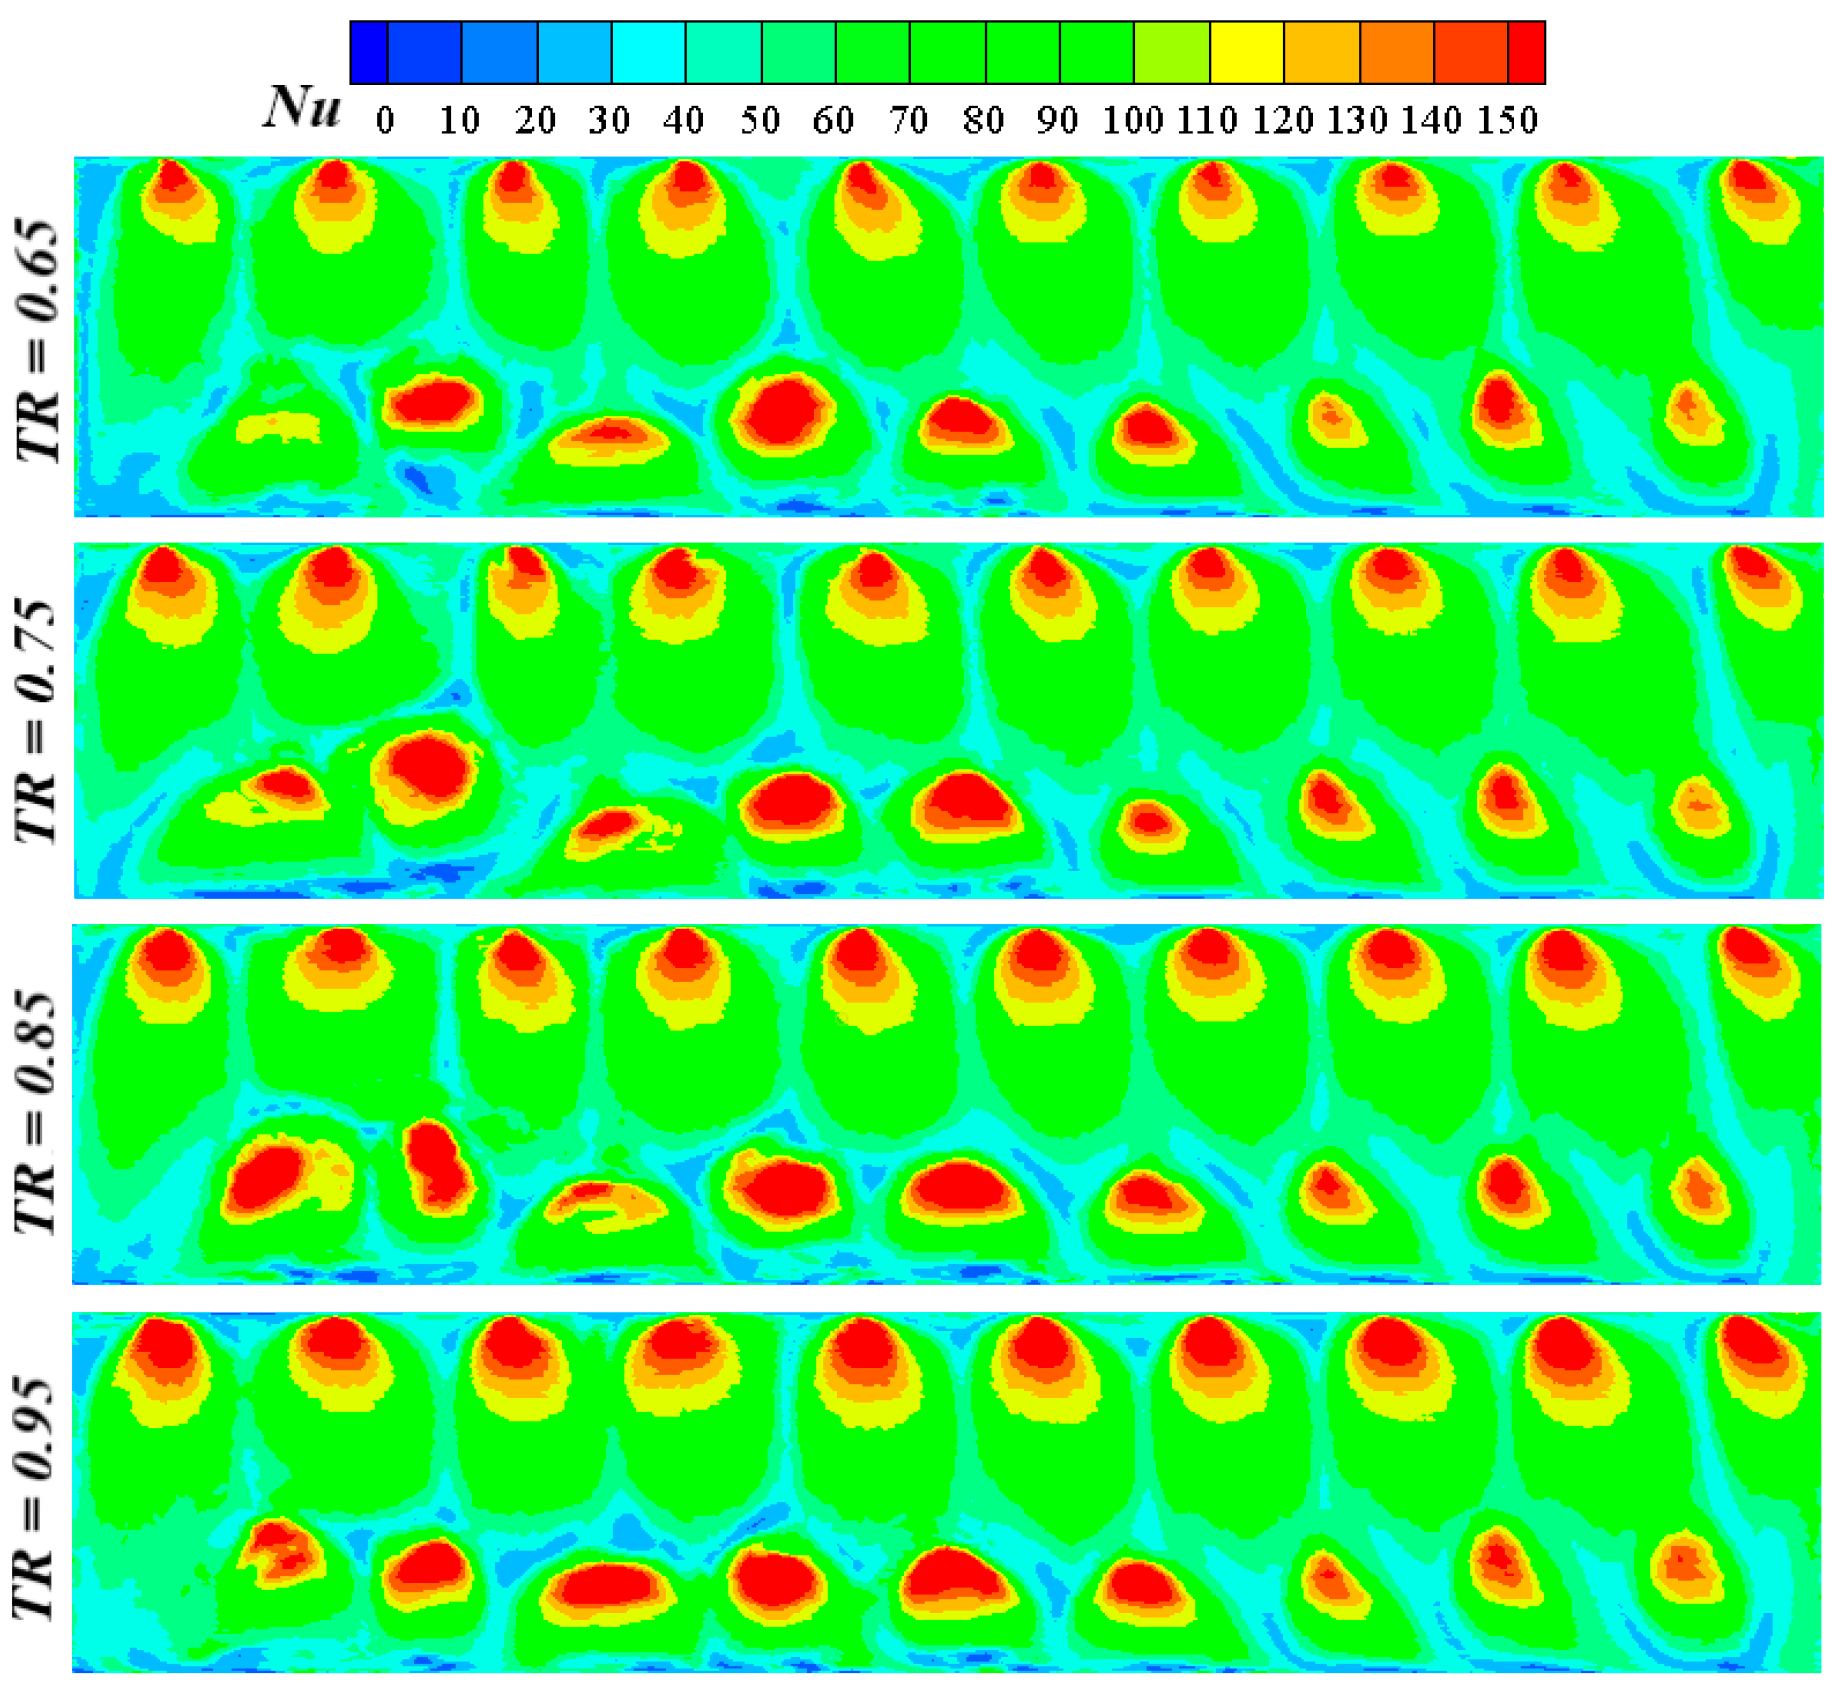
Undoubtedly, the compound cooling unit would achieve the ideal features of the swirl and impingement techniques of cooling according to the analysis of heat transfer. Figure 14 shows the local Nusselt number on the target surface of the compound cooling unit at different Renoz. As depicted in Figure 14, the regions of the high Nusselt number happen directly downstream of each swirl nozzle and concentrate in front of the impingement nozzles. Besides, the local heat transfer is enhanced by increasing the nozzle Reynolds number. The staggered distribution of the impingement nozzles has a great role in reducing the cross-flow effect due to the upstream swirl nozzles. Besides, this distribution contributes to reducing the area of the low Nusselt number zone, which in turn enhances the cooling performance. Moreover, the swirl nozzles cover more areas of the high Nusselt number zone and compensate the other areas that are located far from the impingement nozzles due to the loss of coolant momentum. Figure 15 shows the effect of TR on the local Nusselt number on the target surface at an identical nozzle Reynolds number. As depicted in Figure 15, the high Nusselt number zones are increased a little with the increase in TR. Furthermore, the quite high zone of heat transfer and the semi-uniform distribution of heat transfer are jointly noticed in the compound cooling unit, which is very effective for transacting with numerous ranges of the operating temperatures of the blade leading-edge of a gas turbine.
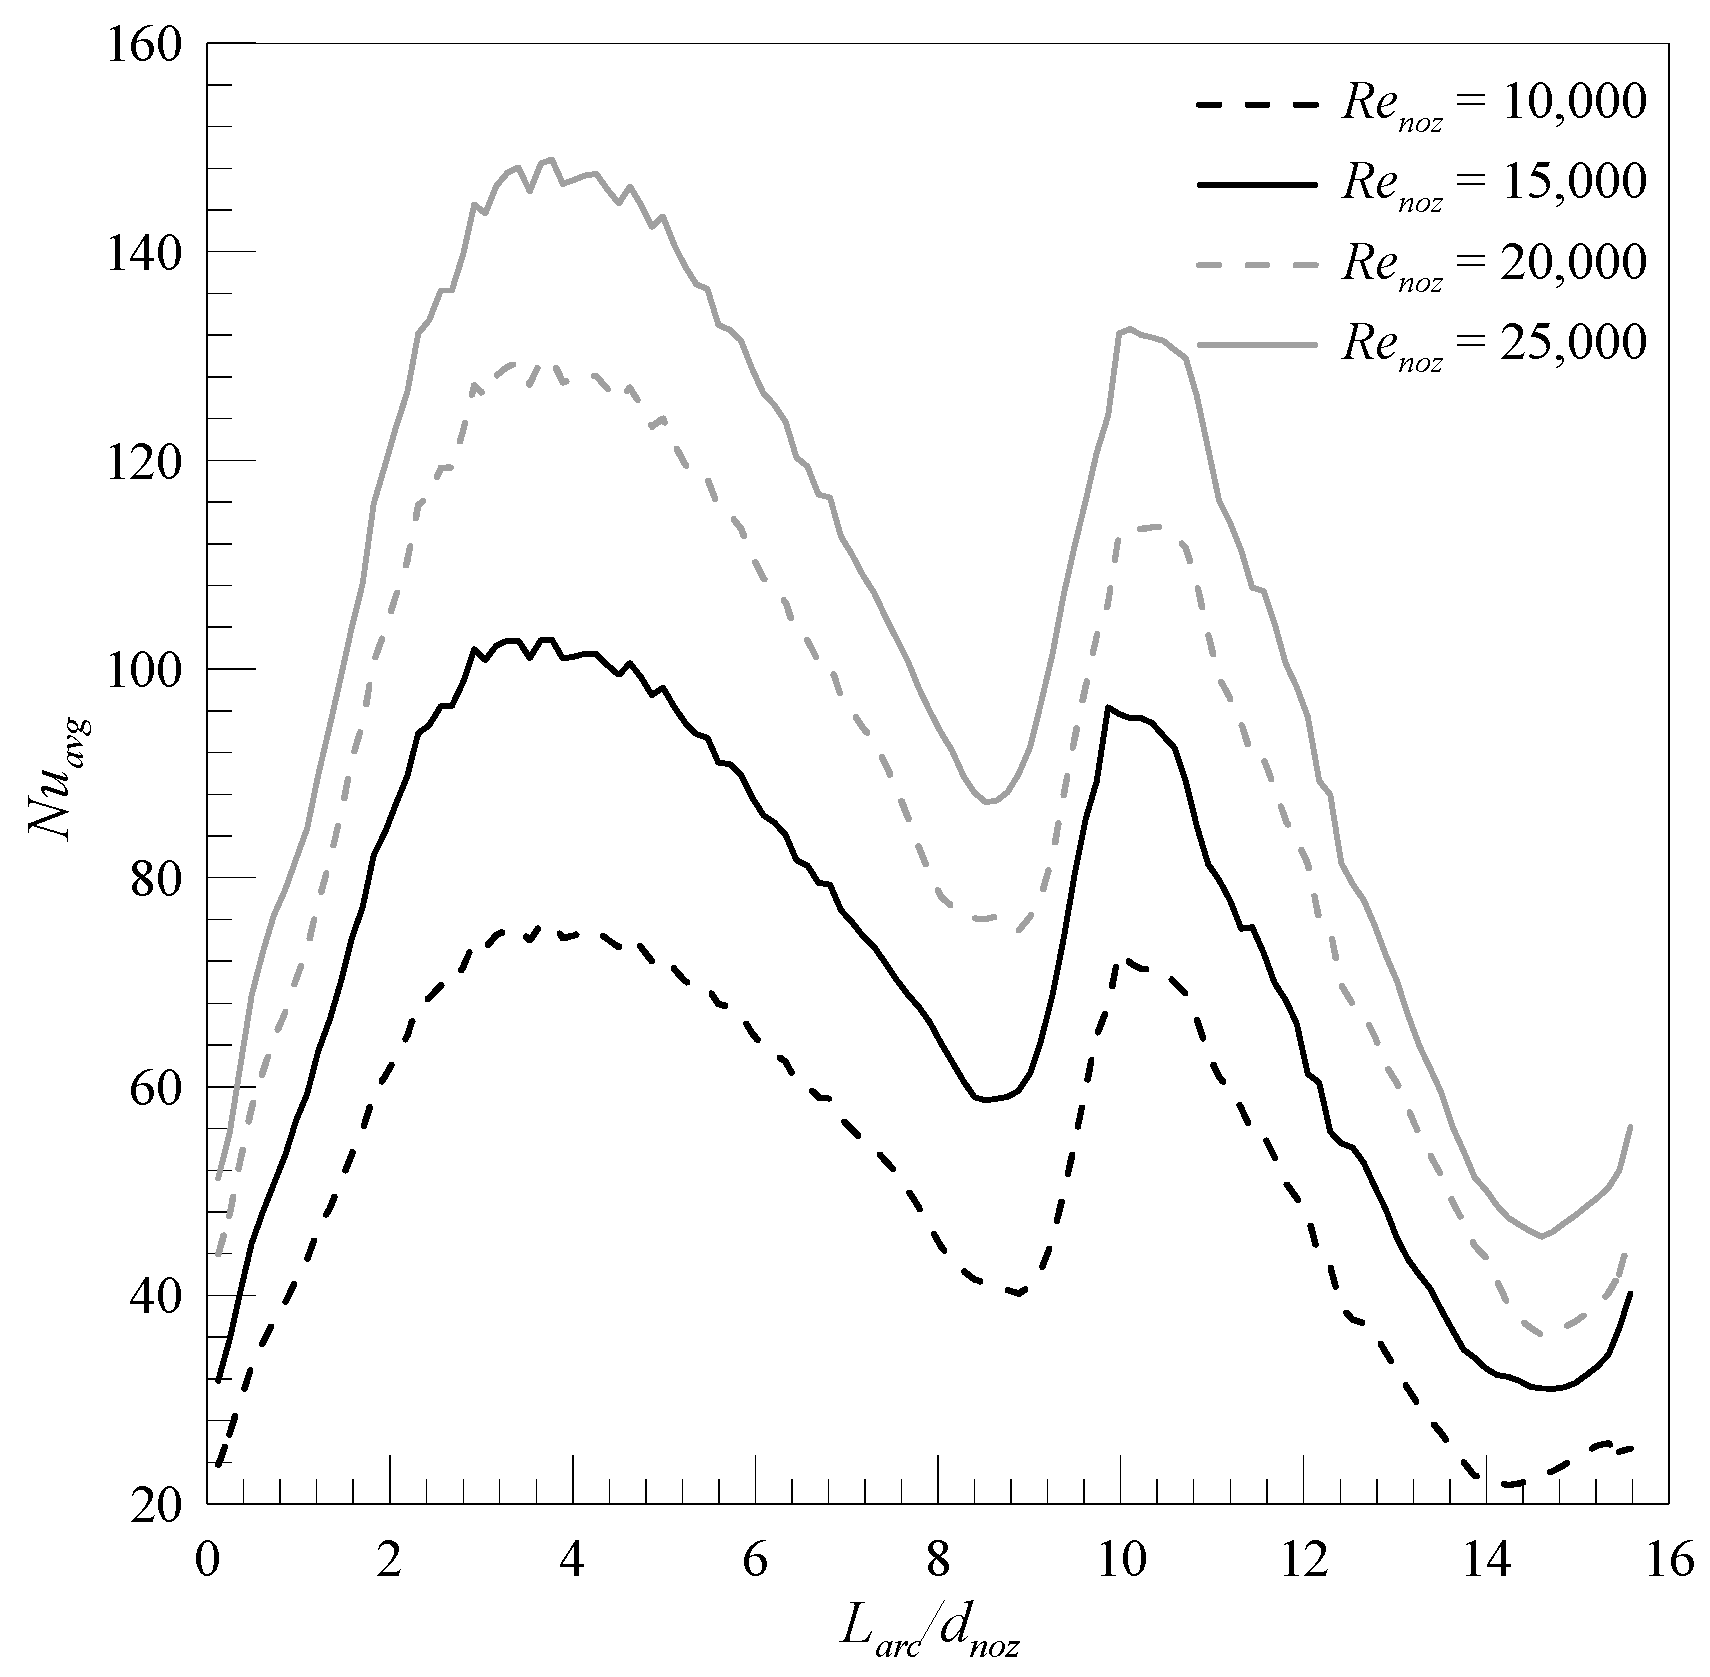
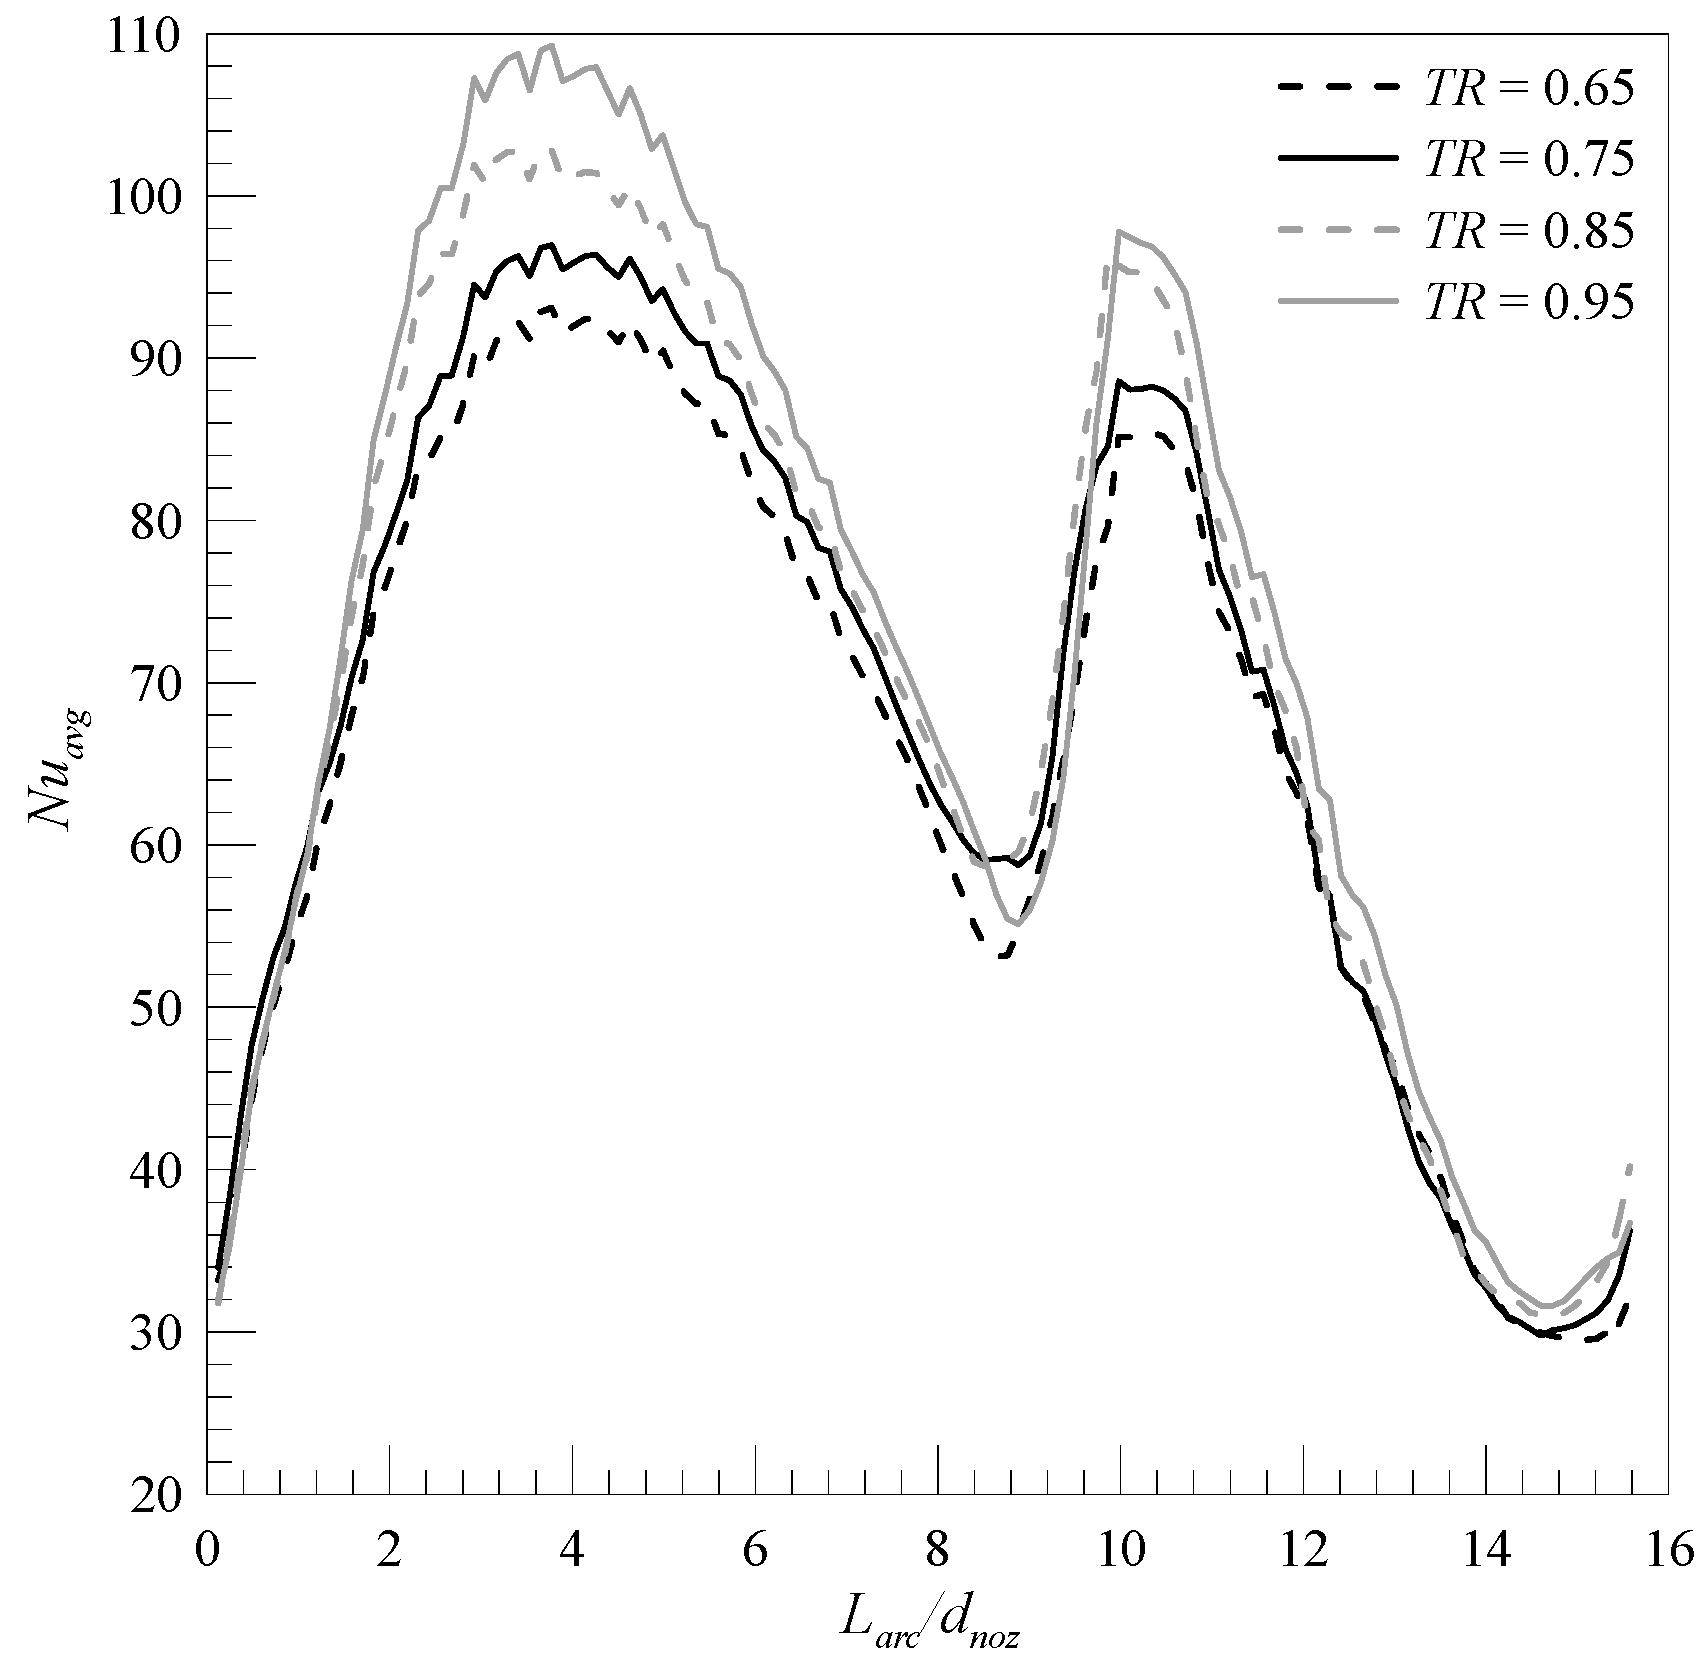
For further clarification, spanwise average Nusselt Number variations on the target surface are introduced in Figure 16 and Figure 17 under different Renoz and different TR, respectively. As depicted in Figure 16, the Nuavg value increases drastically along the circumferential direction until a peak value around Larc/dnoz = 4 due to the swirl coolant injectors. Then, the Nuavg value decreases until reaching a bottom value around Larc/dnoz = 9 and it again increases dramatically to another peak value around Larc/dnoz = 10.5 due to the impingement coolant injectors. Moreover, the Nuavg variations increase with the increase of nozzle Reynolds number as shown in Figure 16. On the other hand, by increasing the TR at fixed Renoz, there is a clear enhancement in the heat transfer on the target surface of the compound cooling unit. Furthermore, the high Nuavg value is mainly dependent on the position of the conical nozzles, which clearly occurs at high coolant velocity as described in Figure 9.
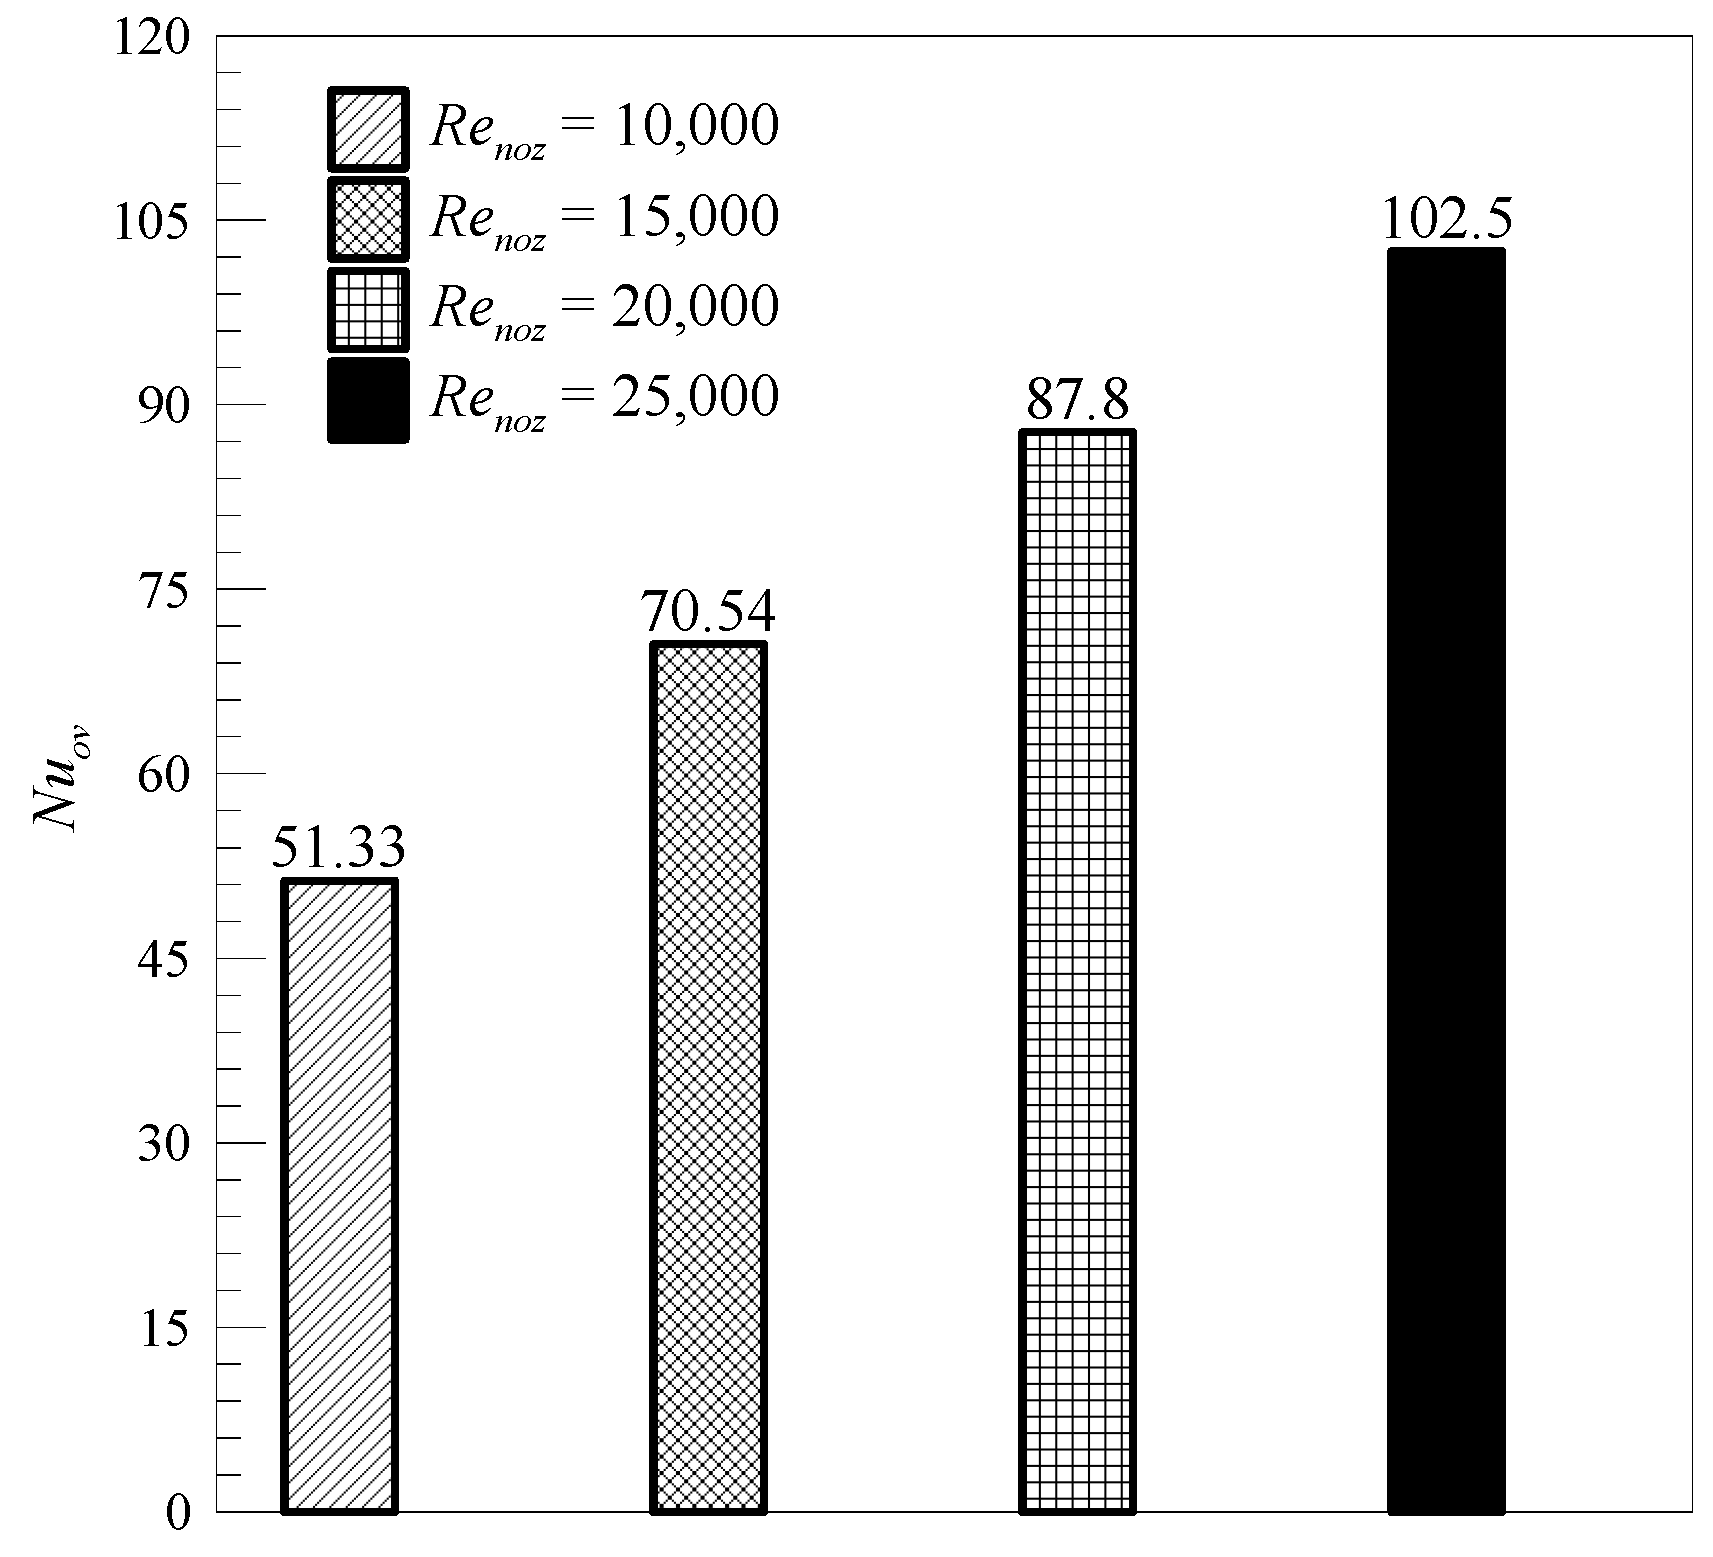
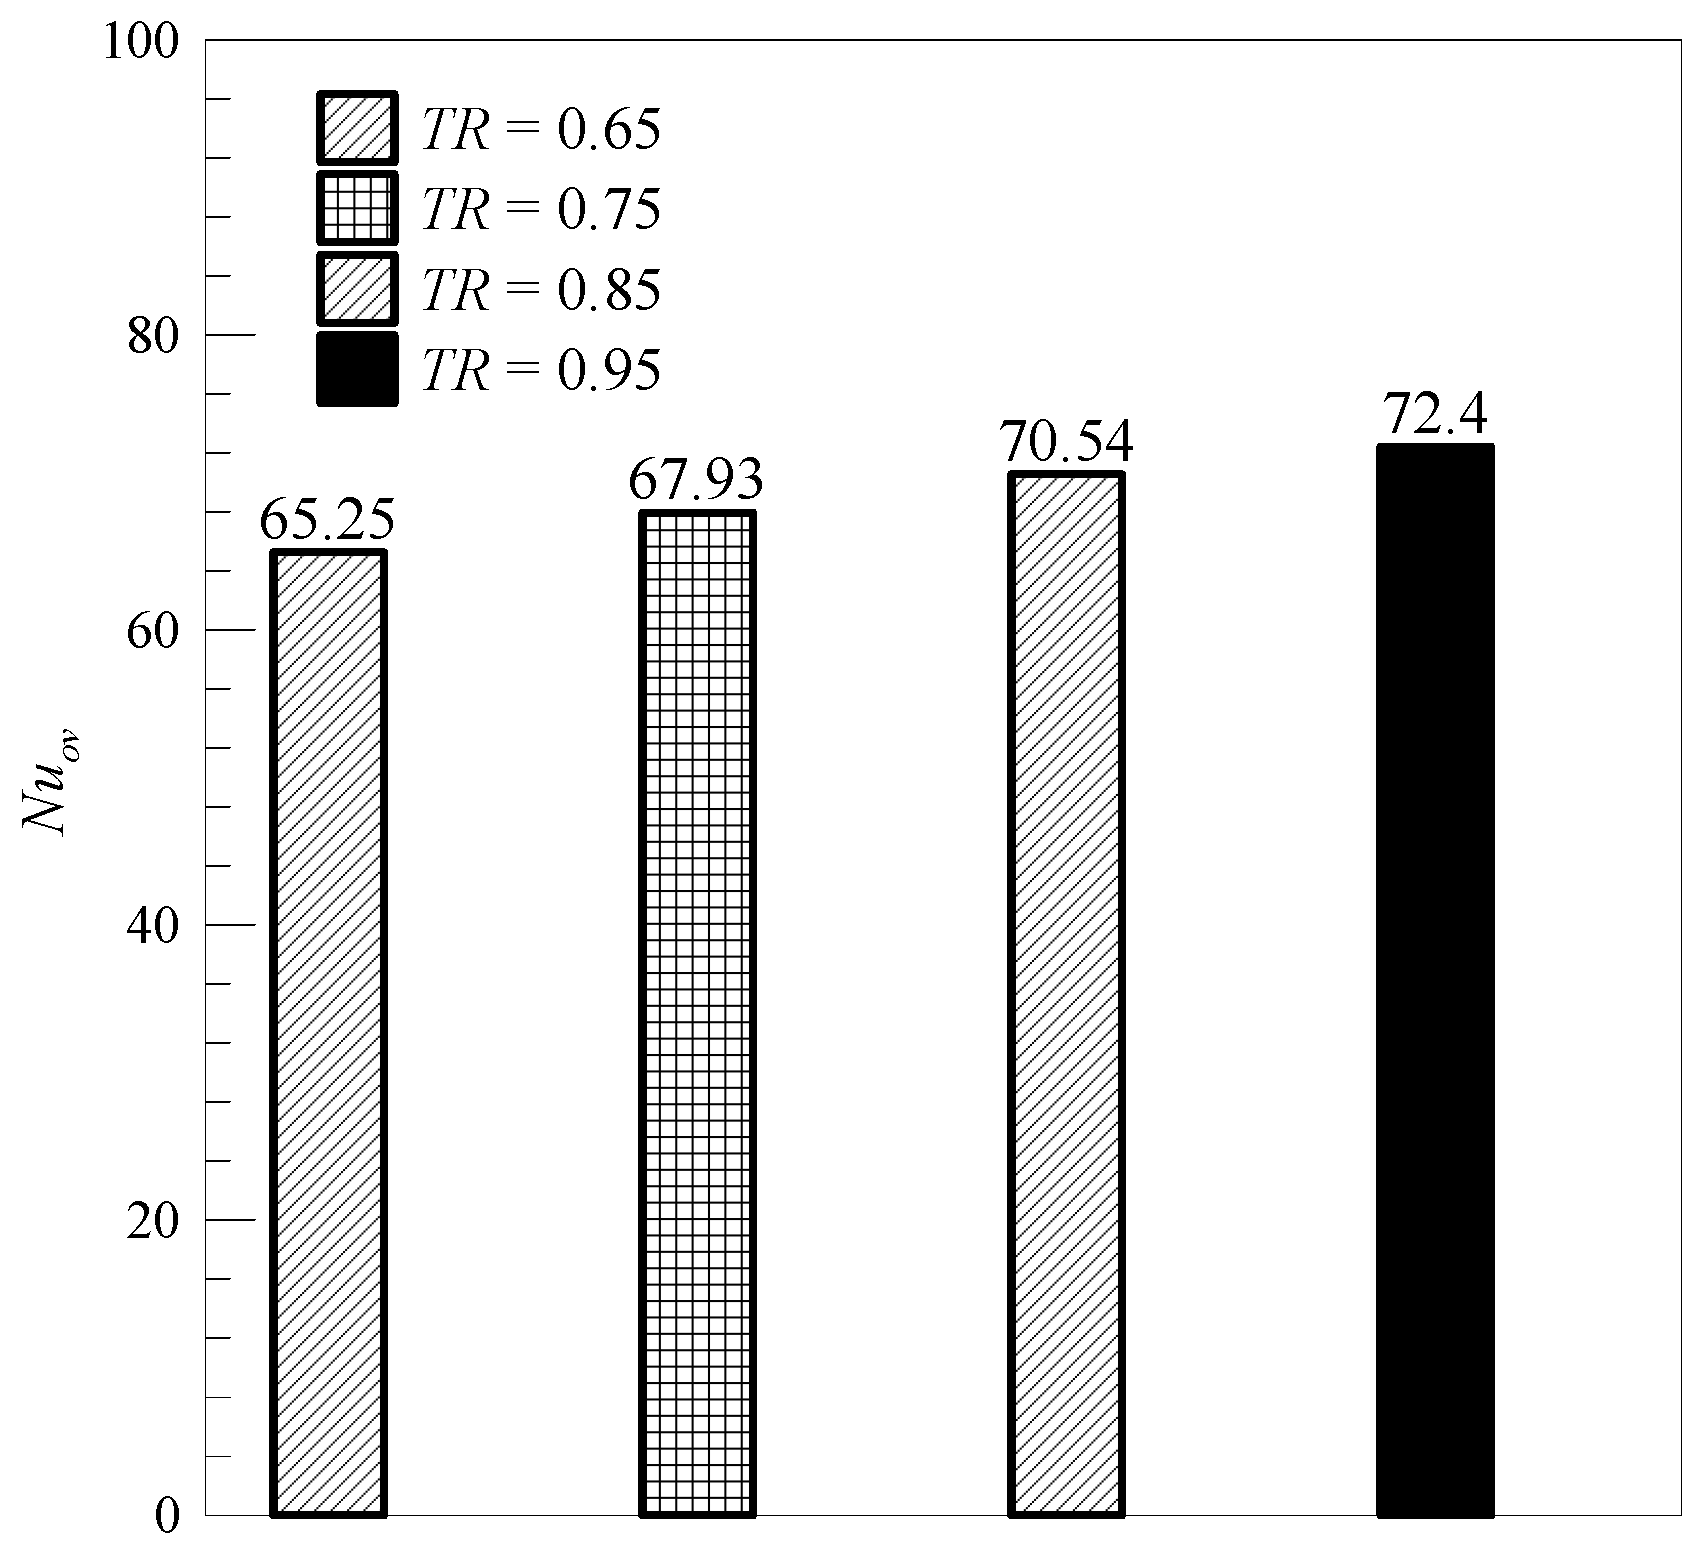
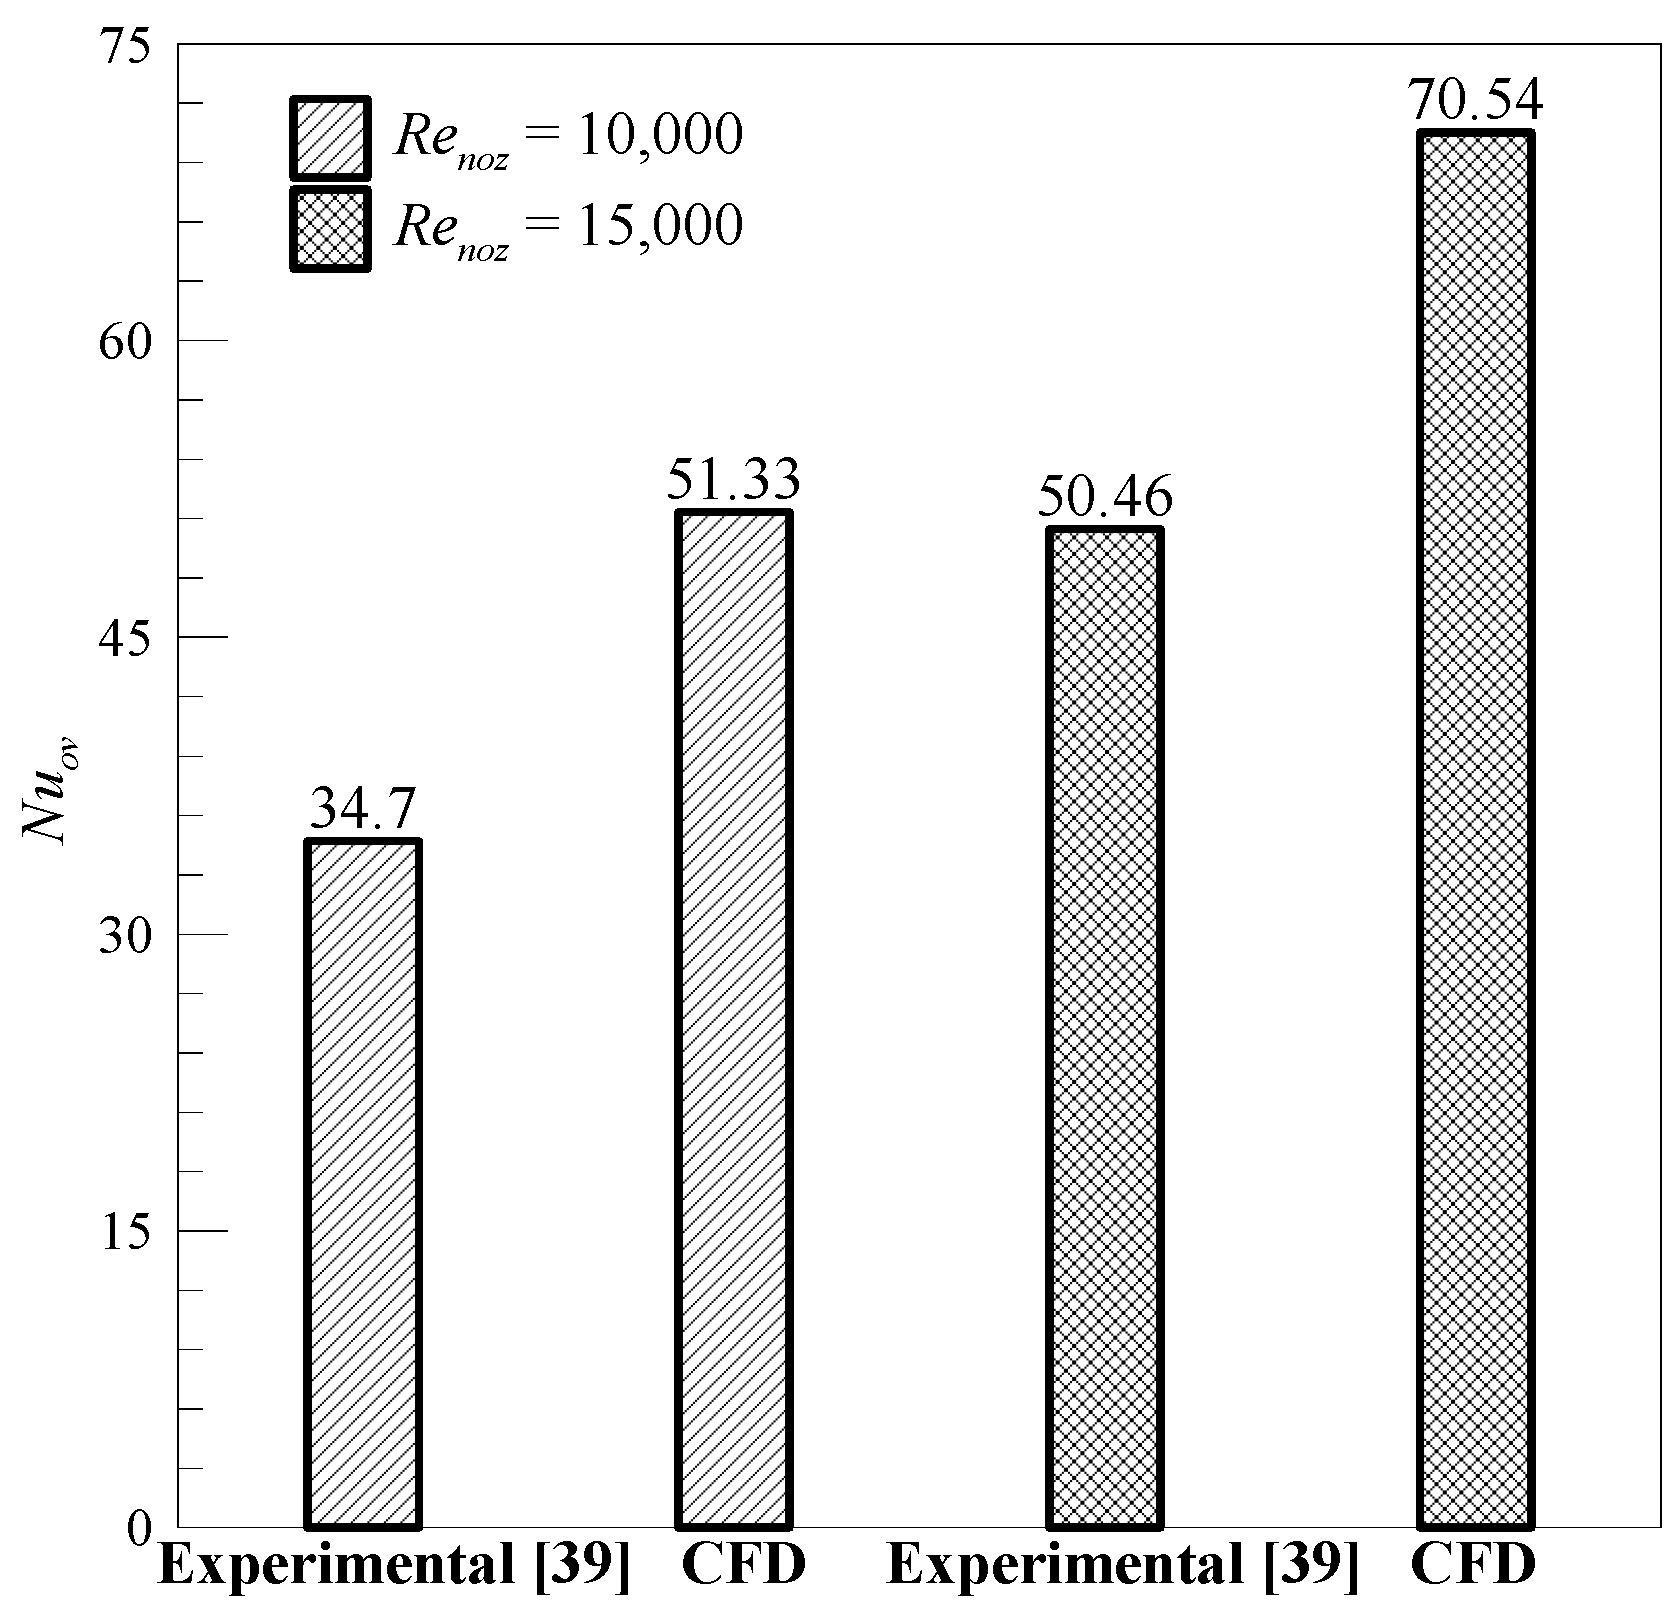
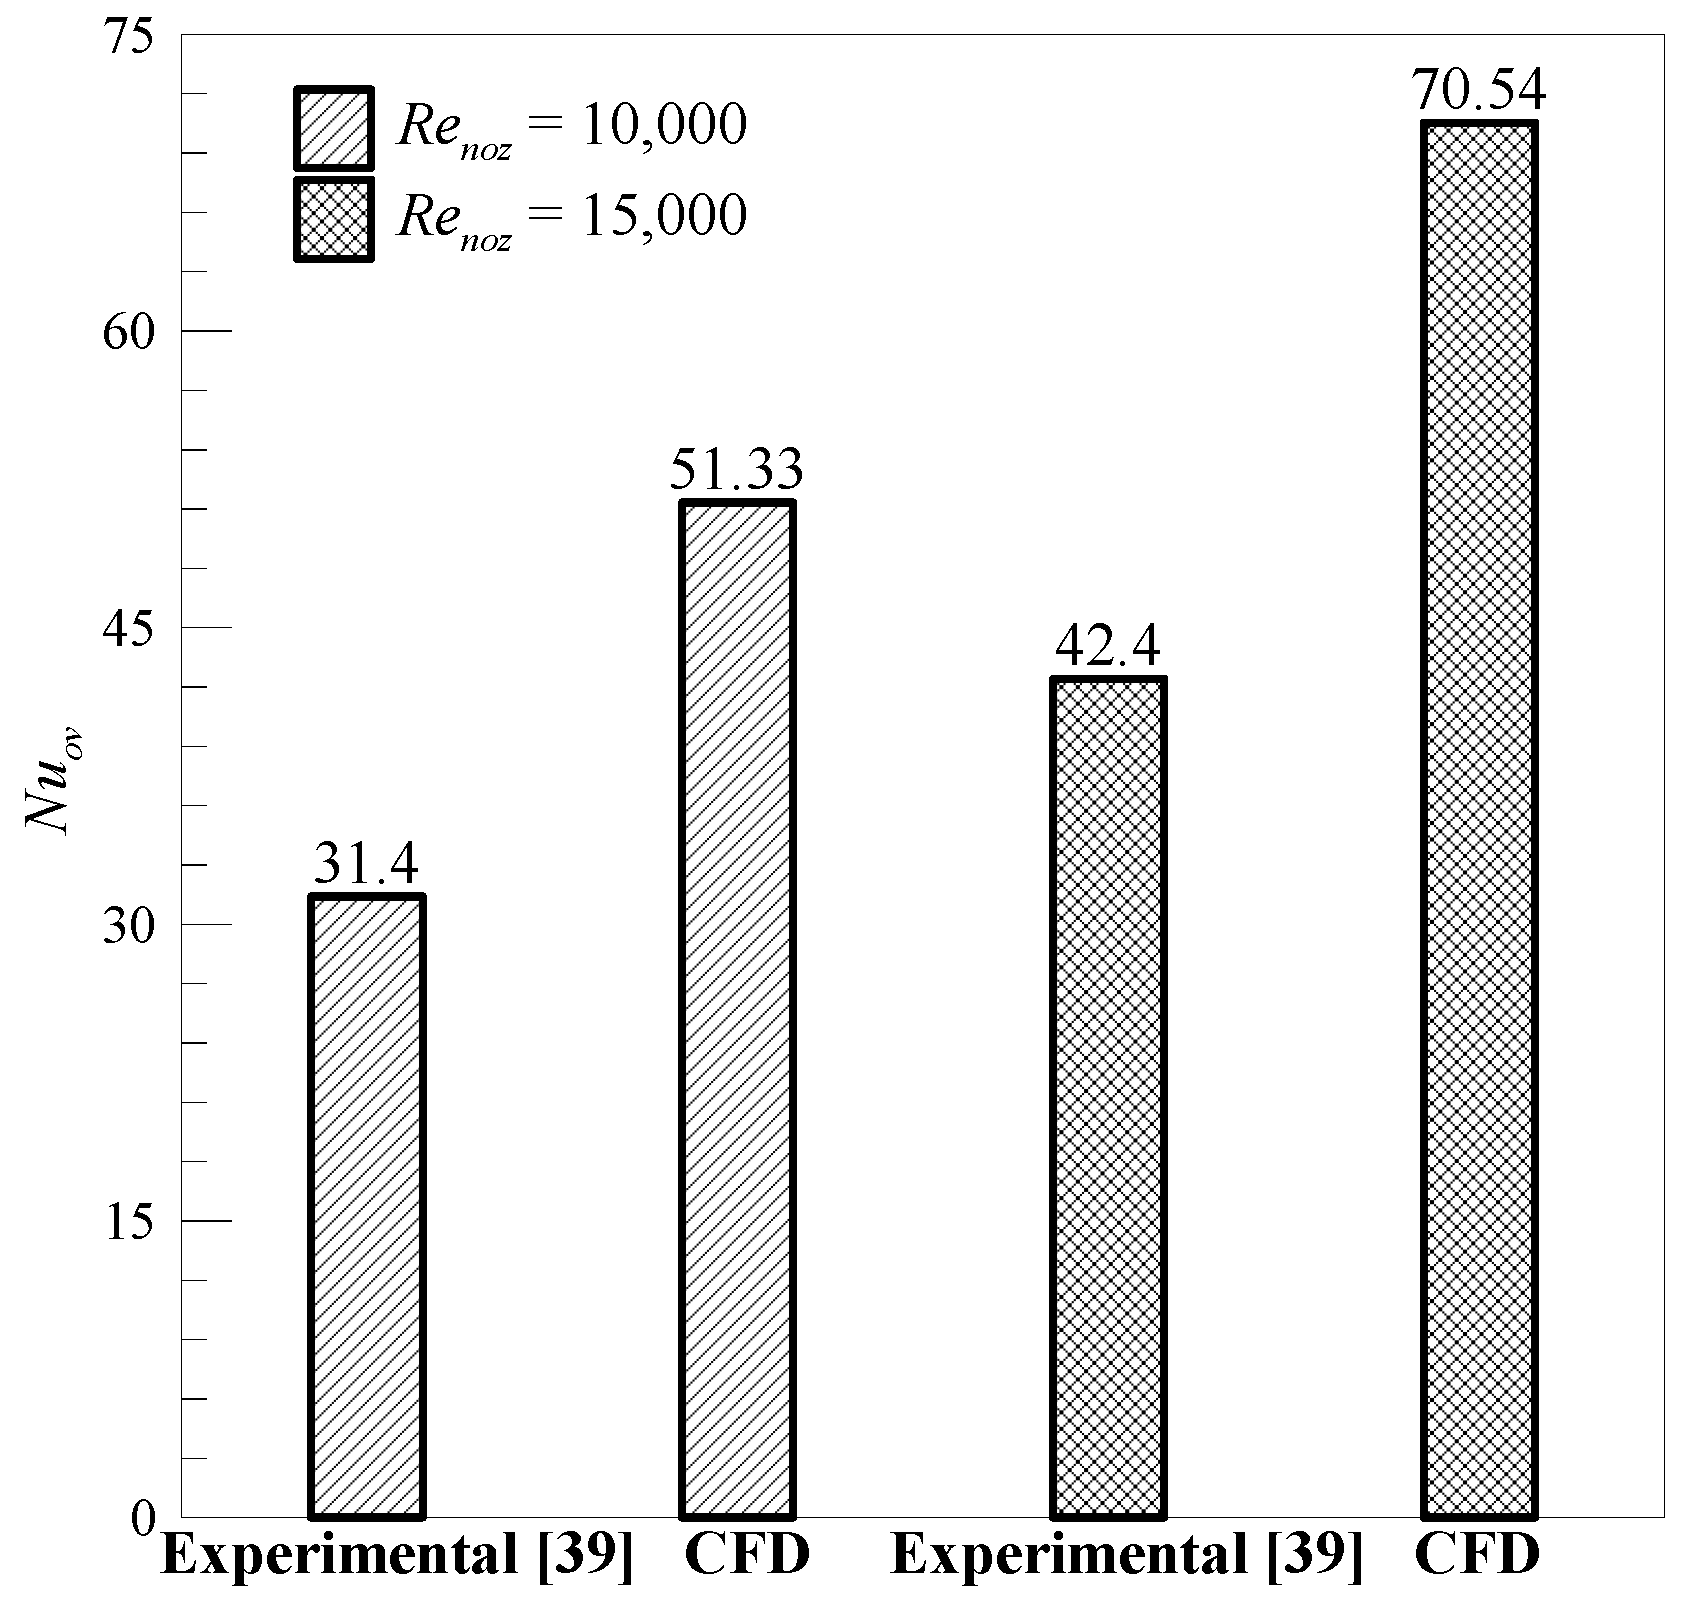
In order to describe an overall evaluation, it is indispensable to present the Nuov under different Renoz and TR as shown in Figure 18 and Figure 19, respectively. As depicted in Figure 18, it is obvious that the Nuov increases with the increase in the Renoz. Hence, the Nuov increases by 99.7% when the Renoz increases from 10,000 to 25,000 at constant TR. Besides, at a fixed Renoz, the compound cooling unit obtains an 11% increase in the Nuov when the TR increases from 0.65 to 0.95 as shown in Figure 19. Figure 20 indicates a comparison between the numerical results of the compound cooling unit and experimental data of Zhang et al. [39] of the tangential (swirl) model at the same Renoz. As shown in Figure 20, the compound cooling unit obtains a Nuov increase by 47.9% compared to the experimental model at Renoz = 10,000. Besides, the current numerical model could also achieve a 39.8% increase in the Nuov comparing with the experimental model at Renoz = 15,000 and, by comparing with the normal (impingement) experimental model of Zhang et al. [39] at identical Renoz as indicated in Figure 21. There are Nuov increases of 63.5% and 66.3% at Renoz = 10,000 and Renoz = 15,000, respectively compared to the experimental model.

3.3. Correlations

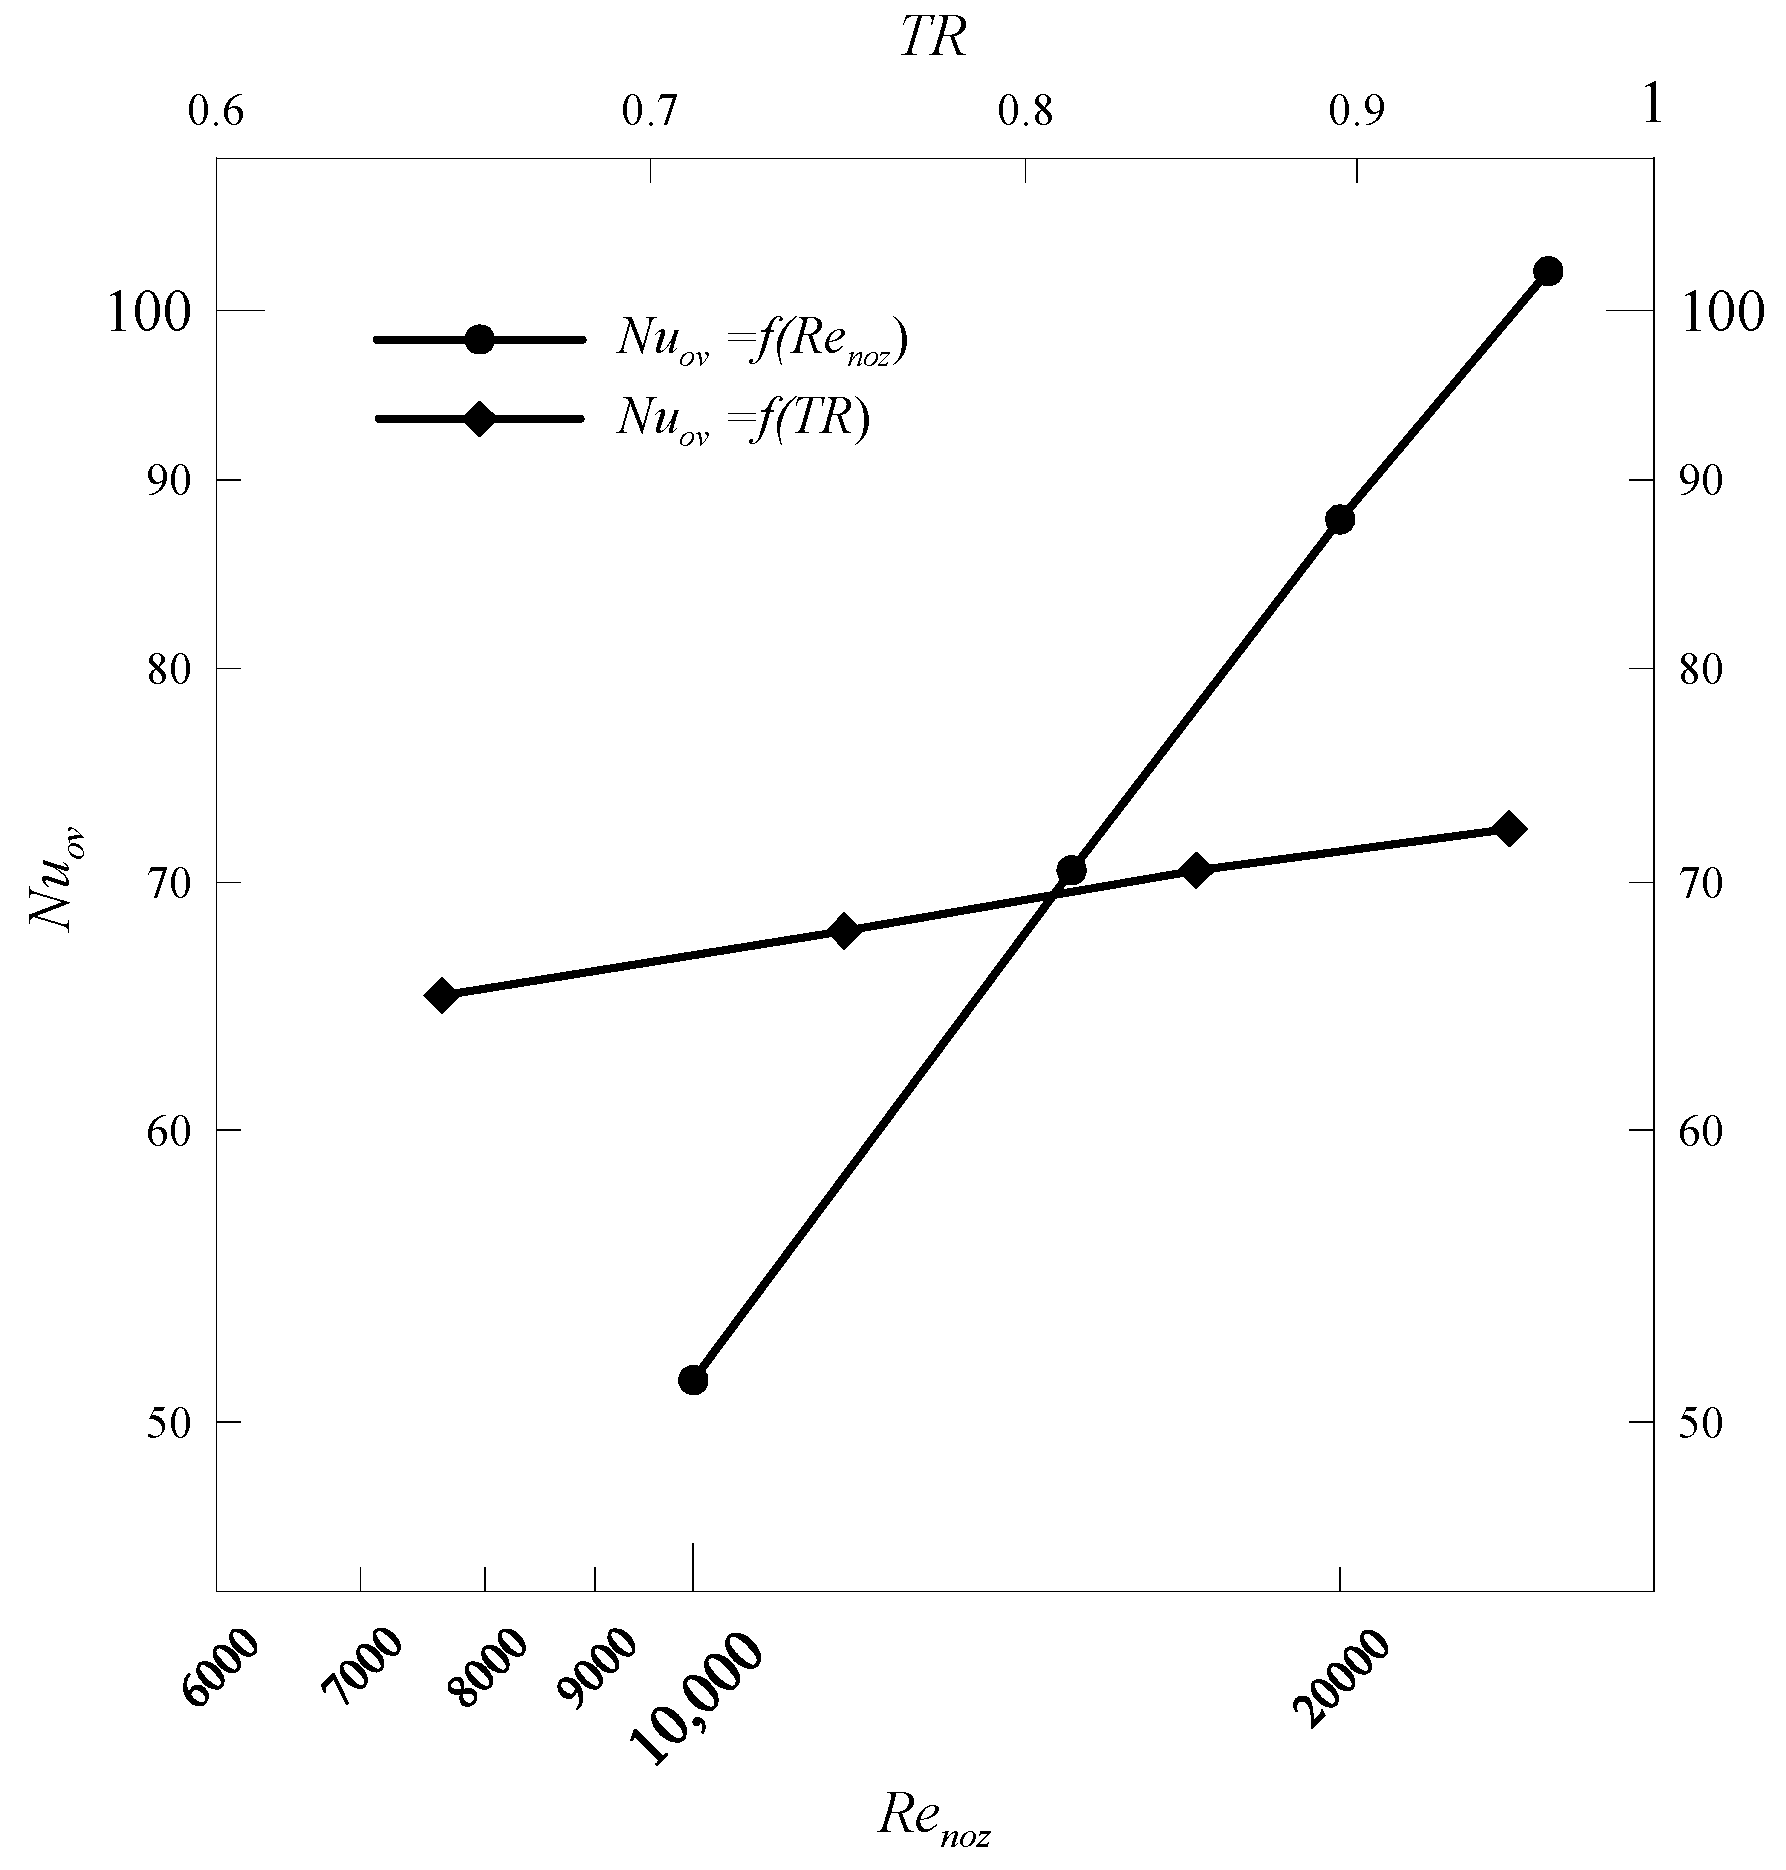
Figure 22 indicates the Nuov versus Renoz and coolant to mainstream temperature ratios. This relation is plotted in logarithmic coordinates for all x-axis and y-axis coordinates. As depicted in Figure 22, there is a linear relationship between Nuov and Renoz, which is also found between the Nuov and TR. When the Renoz increases, the Nuov increases dramatically. Meanwhile, the increase of TR slightly increases the Nuov. To optimize the design of the compound cooling unit, the present paper summarizes a correlation of the heat transfer based on CFD results. According to Figure 22, the Nuov is a monotonic function of Renoz and TR. This function can be expressed via a correlation that could be of interest and very eligible for optimization. To derive this correlation a relationship of Nuov is assumed as a function of Renoz and TR which is acquainted in Equation (11) as
N u o v = k × R e n o z a × T R b .
The constant k and the exponents a and b are calculated via regression analysis of different CFD data under different conditions using engineering software MATLAB R2016b. The desired correlation is calculated in Equation (12) as
N u o v = 0.0391 R e n o z 0.784 T R 0.2906 ,
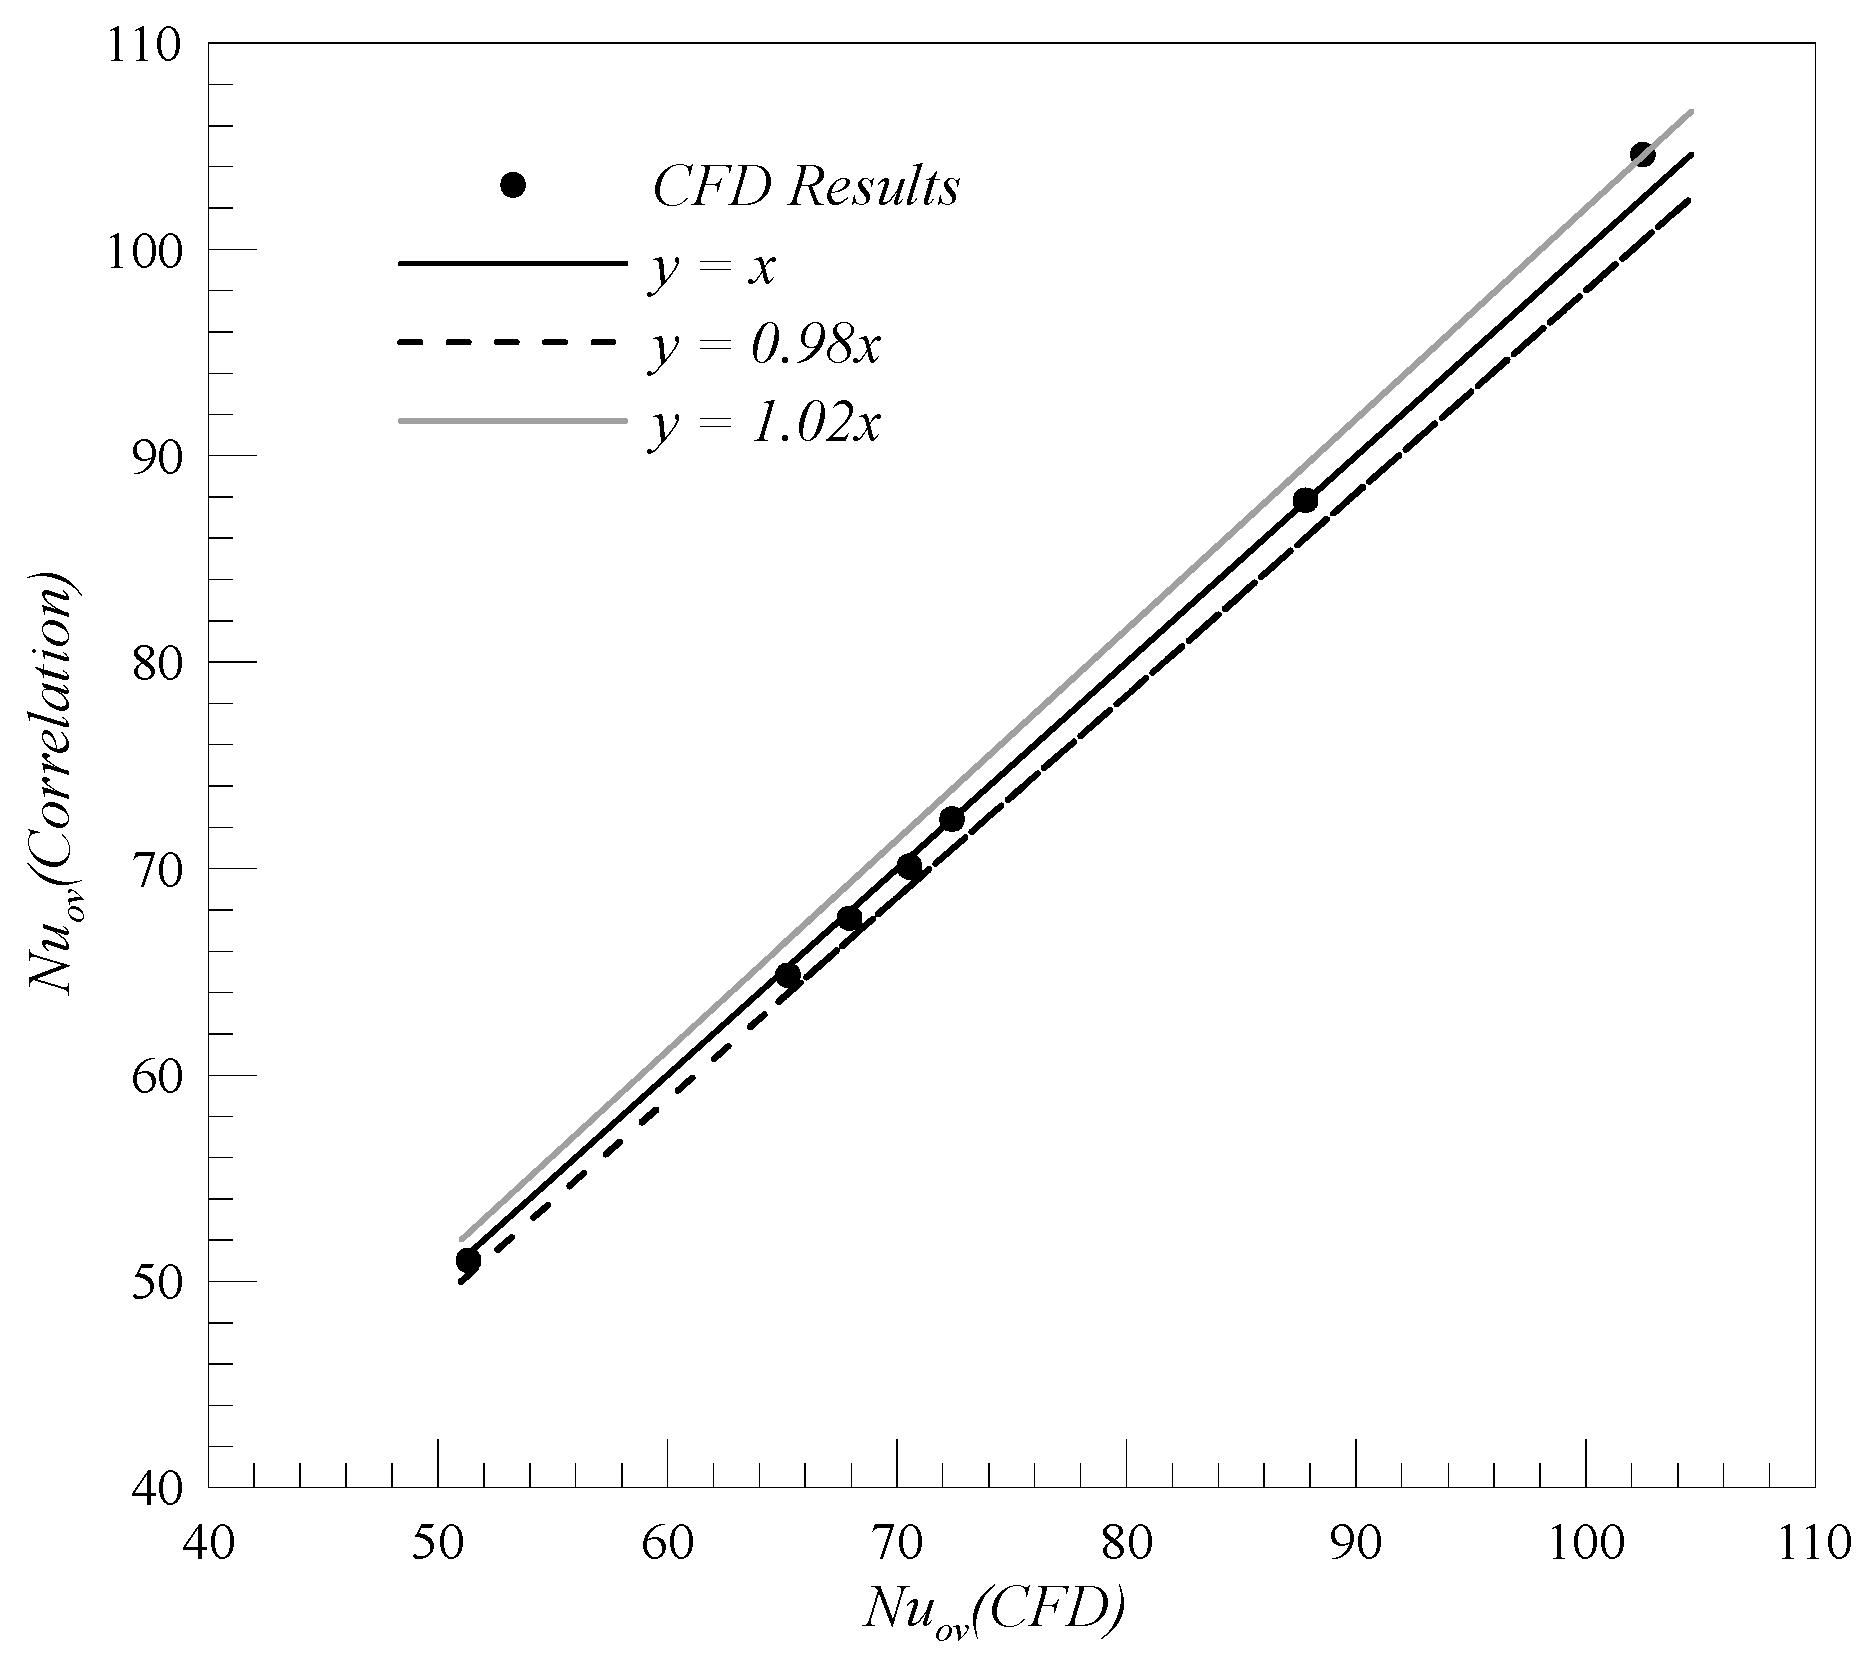
where, 10,000 ≤ Renoz ≤ 25,000 and 0.65 ≤ TR ≤ 0.95. According to these data, the derived correlation of the Nuov is examined. Figure 23 indicates the Nuov calculated by CFD simulations against that computed by the derived correlation. As shown in Figure 23, the CFD simulation results under different conditions are in a perfectly straight line and all points locate between the line y = 0.98x and the line y = 1.02x. Consequently, the derived correlation gives the overall Nusselt number value within ±2% of the corresponding computed values. In words, the derived correlation of the overall Nusselt number matches well with the computations with a 98% accuracy.

4. Conclusions

CFD simulations have been performed to investigate the characteristics of the flow field and heat transfer for a compound cooling unit in a blade leading-edge of a gas turbine blade. The effect of different operating conditions of nozzle Reynolds number and temperature ratio have been analyzed. The applied turbulence model is validated, which achieved a reasonable agreement with the experimental data.
  • At identical nozzle Reynolds number, the area-average velocity of coolant increases dramatically by five and a half times through each conical nozzle. Also, the coolant area-average velocity increases near the leading-edge wall downstream of each nozzle and decreases further along the circumferential direction. The impingement nozzles generate heterogeneous vortices around the jet, where the impinging intensity increases with the increase of the nozzle Reynolds number.
  • The staggered arrangement of both swirl and impingement nozzles obtain coolant contact and uniform on the target surface well, with low momentum losses. The axial velocity increases along the axial direction further downstream near the core-flow. There are complex vorticity distributions which hinder the continuous swirling intensity in the compound cooling unit. The pressure penalty is higher when the nozzle Reynolds number is greater due to the higher coolant velocity.
  • In the compound cooling unit, the local heat transfer is enhanced with the increase in the nozzle Reynolds number. Also, the staggered distribution of the impingement nozzles with respect to the swirl nozzles, have a major role in decreasing the cross-flow effect. In addition, it contributes to a decrease in the area of the low Nusselt number zone which in turn enhances the cooling performance. There is a little effect of the temperature ratio on the Nusslet number under a constant nozzle Reynolds number.
  • The overall Nusselt number increases by 99.7% when the nozzle Reynolds number increases from 10,000 to 25,000 at a fixed temperature ratio. Also, at constant nozzle Reynolds number, the compound cooling unit achieves an 11% increase in the overall Nusselt number when the temperature ratio increases from 0.65 to 0.95. Moreover, the compound cooling unit could achieve a 47.9% increase and a 39.8% increase in the overall Nusselt number comparing with the swirl experimental model at nozzle Reynolds numbers of 10,000 and 15,000, respectively. Furthermore, there are increases in the overall Nusselt number of 63.5% and 66.3% at nozzle Reynolds numbers of 10,000 and 15,000, respectively compared to the impingement experimental model. A correlation for the overall Nusselt number is derived as a function of nozzle Reynolds number and coolant to mainstream temperature ratio at a specified range of these parameters.
According to the numerical simulation results and the aforementioned analysis, the compound cooling unit could achieve the best cooling performance compared to the available experimental model. The extremely high zone of heat transfer and its semi-uniform distribution are simultaneously noticed in the compound cooling unit, which is very effective at transacting with numerous ranges of operating temperatures of a blade leading-edge of a gas turbine.

Author Contributions

All the authors have contributed their efforts to complete the paper. Conceptualization, H.F. and Q.Z.; methodology, H.F.; software, H.F.; validation, H.F., Y.J. and N.A.; formal analysis, H.F.; investigation, H.F.; resources, N.A.; data curation, Y.J.; writing—original draft preparation, H.F.; writing—review and editing, H.F.; visualization, H.F.; supervision, Q.Z.; project administration, Q.Z.; funding acquisition, Q.Z. All authors have read and agreed to the published version of the manuscript.

Funding

This work was jointly supported by National Natural Science Foundation of China (No. 51809065 and 51741901) and the Ph.D. Student Research and Innovation Fund of the Fundamental Research Funds for the Central Universities (Grant No. 3072019GIP0304).

Conflicts of Interest

The authors declare no conflict of interest.

Abbreviations

Latin Characters
dnoz,inInlet diameter of the conical nozzle m
rRadius of curvature of the target surfacem
ReReynolds number
RenozReynolds number based on conical nozzle inlet diameter
qwTarget wall heat flux W/m2
NuNusselt number
NuovOverall Nusselt number
NuavgArea average Nusselt number
PtotTotal pressurePa
ΔPtPercentage of total pressure dropPa
CpLocal pressure coefficient
TRTemperature ratio
TcCoolant temperature K
TwTarget wall temperature K
V, UMagnitude of velocitym/s
y+Non-dimensional wall distance
X, Y, ZCartesian coordinates
Greek Letters
ρFluid density kg/m3
λThermal conductivityW/m. K
μDynamic viscosity N.s/m2
τViscous shear stressPa
θAngle of curvature of the target surface

References

  1. Rosini, A.; Palmieri, A.; Lanzarotto, D.; Procopio, R.; Bonfiglio, A. A Model Predictive Control Design for Power Generation Heavy-Duty Gas Turbines. Energies 2019, 12, 2182. [Google Scholar] [CrossRef] [Green Version]
  2. Liu, Z.; Ren, X.; Yan, Z.; Zhu, H.; Zhang, T.; Zhu, W.; Li, X. Effect of Inlet Air Heating on Gas Turbine Efficiency under Partial Load. Energies 2019, 12, 3327. [Google Scholar] [CrossRef] [Green Version]
  3. Chupp, R.E.; Helms, H.E.; McFadden, P.W. Evaluation of internal heat-transfer coefficients for impingement-cooled turbine airfoils. J. Aircr. 1969, 6, 203–208. [Google Scholar] [CrossRef]
  4. Tabakoff, W.; Clevenger, W. Gas Turbine Blade Heat Transfer Augmentation by Impingement of Air Jets Having Various Configurations. J. Eng. Gas Turbines Power 1972, 94, 51–58. [Google Scholar] [CrossRef]
  5. Yang, G.; Choi, M.; Lee, J.S. An experimental study of slot jet impingement cooling on concave surface: Effects of nozzle configuration and curvature. Int. J. Heat Mass Transf. 1999, 42, 2199–2209. [Google Scholar] [CrossRef]
  6. Choi, M.; Yoo, H.S.; Yang, G.; Lee, J.S.; Sohn, D.K. Measurements of impinging jet flow and heat transfer on a semi-circular concave surface. Int. J. Heat Mass Transf. 2000, 43, 1811–1822. [Google Scholar] [CrossRef]
  7. Kayansayan, N.; Küçüka, S. Impingement cooling of a semi-cylindrical concave channel by confined slot-air-jet. Exp. Therm. Fluid Sci. 2001, 25, 383–396. [Google Scholar] [CrossRef]
  8. Florschuetz, L.W.; Berry, R.A.; Metzger, D.E. Periodic Streamwise Variations of Heat Transfer Coefficients for Inline and Staggered Arrays of Circular Jets with Crossflow of Spent Air. J. Heat Transf. 1980, 102, 132–137. [Google Scholar] [CrossRef]
  9. Florschuetz, L.W.; Truman, C.R.; Metzger, D.E. Streamwise Flow and Heat Transfer Distributions for Jet Array Impingement with Crossflow. J. Heat Transf. 1981, 103, 337–342. [Google Scholar] [CrossRef]
  10. Florschuetz, L.W.; Isoda, Y. Flow Distributions and Discharge Coefficient Effects for Jet Array Impingement with Initial Crossflow. In Proceedings of the 27th International Gas Turbine Conference and Exhibit, London, UK, 18–22 April 1982. [Google Scholar]
  11. Taslim, M.E.; Setayeshgar, L.; Spring, S.D. An Experimental Evaluation of Advanced Leading Edge Impingement Cooling Concepts. J. Turbomach. 2001, 123, 147–153. [Google Scholar] [CrossRef]
  12. Taslim, M.E.; Bakhtari, K.; Liu, H. Experimental and Numerical Investigation of Impingement on a Rib-Roughened Leading-Edge Wall. J. Turbomach. 2003, 125, 682–691. [Google Scholar] [CrossRef]
  13. Taslim, M.E.; Khanicheh, A. Experimental and Numerical Study of Impingement on an Airfoil Leading Edge with and Without Showerhead and Gill Film Holes. J. Turbomach. 2005, 128, 310–320. [Google Scholar] [CrossRef]
  14. Taslim, M.E.; Bethka, D. Experimental and Numerical Impingement Heat Transfer in an Airfoil Leading-Edge Cooling Channel with Cross-Flow. J. Turbomach. 2008, 131, 011021. [Google Scholar] [CrossRef]
  15. Rajamani, K.; Ganesh, M.; Paramanandam, K.; Jayamurugan, C.; Narayanan, S.R.; Srinivasan, B.; Chandra, A. Cooling Efficiency Enhancement Using Impingement Cooling Technique for Turbine Blades. In Proceedings of the ASME 2013 Gas Turbine India Conference, Bangalore, India, 5–6 December 2013. [Google Scholar]
  16. Liu, Z.; Feng, Z.; Song, L. Numerical Study of Flow and Heat Transfer of Impingement Cooling on Model of Turbine Blade Leading Edge. In Proceedings of the ASME Turbo Expo 2010: Power for Land, Sea, and Air, Glasgow, UK, 14–18 June 2010; pp. 657–674. [Google Scholar]
  17. Liu, Z.; Feng, Z. Numerical simulation on the effect of jet nozzle position on impingement cooling of gas turbine blade leading edge. Int. J. Heat Mass Transf. 2011, 54, 4949–4959. [Google Scholar] [CrossRef]
  18. Liu, H.-Y.; Liu, S.-L.; Qiang, H.-F.; Liu, C.-L. Aerodynamic investigation of impingement cooling in a confined channel with staggered jet array arrangement. Exp. Therm. Fluid Sci. 2013, 48, 184–197. [Google Scholar] [CrossRef]
  19. Yang, L.; Kan, R.; Ren, J.; Jiang, H. Effect of Film Cooling Arrangement on Impingement Heat Transfer on Turbine Blade Leading Edge. In Proceedings of the ASME Turbo Expo 2013: Turbine Technical Conference and Exposition, San Antonio, TX, USA, 3–7 June 2013. [Google Scholar]
  20. Kreith, F.; Margolis, D. Heat transfer and friction in turbulent vortex flow. Appl. Sci. Res. Sect. A 1959, 8, 457–473. [Google Scholar] [CrossRef]
  21. Hay, N.; West, P.D. Heat Transfer in Free Swirling Flow in a Pipe. J. Heat Transf. 1975, 97, 411–416. [Google Scholar] [CrossRef]
  22. Fan, X.; Li, L.; Zou, J.; Wang, J.; Wu, F. Local heat transfer of vortex cooling with multiple tangential nozzles in a gas turbine blade leading edge cooling passage. Int. J. Heat Mass Transf. 2018, 126, 377–389. [Google Scholar] [CrossRef]
  23. Kusterer, K.; Lin, G.; Bohn, D.; Sugimoto, T.; Tanaka, R.; Kazari, M. Heat Transfer Enhancement for Gas Turbine Internal Cooling by Application of Double Swirl Cooling Chambers. In Proceedings of the ASME Turbo Expo 2013: Turbine Technical Conference and Exposition, San Antonio, TX, USA, 3–7 June 2013. [Google Scholar]
  24. Kusterer, K.; Lin, G.; Bohn, D.; Sugimoto, T.; Tanaka, R.; Kazari, M. Leading Edge Cooling of a Gas Turbine Blade with Double Swirl Chambers. In Proceedings of the ASME Turbo Expo 2014: Turbine Technical Conference and Exposition, Düsseldorf, Germany, 16–20 June 2014. [Google Scholar]
  25. Kusterer, K.; Lin, G.; Sugimoto, T.; Bohn, D.; Tanaka, R.; Kazari, M. Novel Gas Turbine Blade Leading Edge Cooling Configuration Using Advanced Double Swirl Chambers. In Proceedings of the ASME Turbo Expo 2015: Turbine Technical Conference and Exposition, Montreal, QC, Canada, 15–19 June 2015. [Google Scholar]
  26. Luan, Y.; Du, C.; Fan, X.; Wang, J.; Li, L. Investigations of flow structures and heat transfer in a swirl chamber with different inlet chambers and various aerodynamic parameters. Int. J. Heat Mass Transf. 2018, 118, 551–561. [Google Scholar] [CrossRef]
  27. Rao, Y.; Biegger, C.; Weigand, B. Heat transfer and pressure loss in swirl tubes with one and multiple tangential jets pertinent to gas turbine internal cooling. Int. J. Heat Mass Transf. 2017, 106, 1356–1367. [Google Scholar] [CrossRef]
  28. Fan, X.; Du, C.; Li, L.; Li, S. Numerical simulation on effects of film hole geometry and mass flow on vortex cooling behavior for gas turbine blade leading edge. Appl. Therm. Eng. 2017, 112, 472–483. [Google Scholar] [CrossRef]
  29. Biegger, C.; Rao, Y.; Weigand, B. Flow and heat transfer measurements in swirl tubes with one and multiple tangential inlet jets for internal gas turbine blade cooling. Int. J. Heat Fluid Flow 2018, 73, 174–187. [Google Scholar] [CrossRef]
  30. Liu, Y.; Rao, Y.; Weigand, B. Heat transfer and pressure loss characteristics in a swirl cooling tube with dimples on the tube inner surface. Int. J. Heat Mass Transf. 2019, 128, 54–65. [Google Scholar] [CrossRef]
  31. Ling, J.P.C.W.; Ireland, P.T.; Harvey, N.W. Measurement of Heat Transfer Coefficient Distributions and Flow Field in a Model of a Turbine Blade Cooling Passage with Tangential Injection. In Proceedings of the ASME Turbo Expo 2006: Power for Land, Sea, and Air, Barcelona, Spain, 8–11 May 2006; pp. 325–340. [Google Scholar]
  32. Du, C.; Li, L.; Wu, X.; Feng, Z. Effect of jet nozzle geometry on flow and heat transfer performance of vortex cooling for gas turbine blade leading edge. Appl. Therm. Eng. 2016, 93, 1020–1032. [Google Scholar] [CrossRef]
  33. Du, C.; Li, L.; Chen, X.; Fan, X.; Feng, Z. Numerical Study on Effects of Jet Nozzle Angle and Number on Vortex Cooling Behavior for Gas Turbine Blade Leading Edge. In Proceedings of the ASME Turbo Expo 2016: Turbomachinery Technical Conference and Exposition, Seoul, Korea, 13–17 June 2016. [Google Scholar]
  34. Du, C.; Li, L.; Li, S.; Feng, Z. Effects of aerodynamic parameters on steam vortex cooling behavior for gas turbine blade leading edge. Proc. Inst. Mech. Eng. Part A J. Power Energy 2016, 230, 354–365. [Google Scholar] [CrossRef]
  35. Du, H.; Mei, Z.; Zou, J.; Jiang, W.; Xie, D. Conjugate Heat Transfer Investigation on Swirl-Film Cooling at the Leading Edge of a Gas Turbine Vane. Entropy 2019, 21, 1007. [Google Scholar] [CrossRef] [Green Version]
  36. Wang, N.; Chen, A.F.; Zhang, M.; Han, J.-C. Turbine Blade Leading Edge Cooling with One Row of Normal or Tangential Impinging Jets. J. Heat Transf. 2018, 140, 062201. [Google Scholar] [CrossRef]
  37. Zhou, J.; Wang, X.; Li, J.; Hou, W. Comparison between impingement/effusion and double swirl/effusion cooling performance under different effusion hole diameters. Int. J. Heat Mass Transf. 2019, 141, 1097–1113. [Google Scholar] [CrossRef]
  38. Wu, F.; Li, L.; Du, C.; Wang, J.; Fan, X. Effects of circumferential nozzle number and temperature ratio on swirl cooling characteristics. Appl. Therm. Eng. 2019, 154, 332–342. [Google Scholar] [CrossRef]
  39. Zhang, M.; Wang, N.; Han, J.-C. Internal heat transfer of film-cooled leading edge model with normal and tangential impinging jets. Int. J. Heat Mass Transf. 2019, 139, 193–204. [Google Scholar] [CrossRef]
  40. Seifi, A.R.; Akbari, O.A.; Alrashed, A.A.A.A.; Afshary, F.; Shabani, G.A.S.; Seifi, R.; Goodarzi, M.; Pourfattah, F. Effects of external wind breakers of Heller dry cooling system in power plants. Appl. Therm. Eng. 2018, 129, 1124–1134. [Google Scholar] [CrossRef]
  41. Jiang, Y.; Zheng, Q.; Dong, P.; Yue, G.; Gao, J. Numerical Simulation on Turbine Blade Leading-Edge High-Efficiency Film Cooling by the Application of Water Mist. Numer. Heat Transf. Part A Appl. 2014, 66, 1341–1364. [Google Scholar] [CrossRef]
  42. Rehman, A.; Liu, B.; Asghar, M.A. Secondary Flow and Endwall Optimization of a Transonic Turbine. Energies 2019, 12, 4103. [Google Scholar] [CrossRef] [Green Version]
  43. Gong, J.; Gao, T.; Zeng, J.; Hou, J.; Li, Z. Effect of Actual Gas Turbine Operating Conditions on Mist/Steam Cooling Performance in a Ribbed Passage. Energies 2019, 12, 2015. [Google Scholar] [CrossRef] [Green Version]
  44. Dzido, A.; Krawczyk, P.; Kurkus-Gruszecka, M. Numerical Analysis of Dry Ice Blasting Convergent-Divergent Supersonic Nozzle. Energies 2019, 12, 4787. [Google Scholar] [CrossRef] [Green Version]
  45. Safaei, M.R.; Togun, H.; Vafai, K.; Kazi, S.N.; Badarudin, A. Investigation of Heat Transfer Enhancement in a Forward-Facing Contracting Channel Using FMWCNT Nanofluids. Numer. Heat Transf. Part A Appl. 2014, 66, 1321–1340. [Google Scholar] [CrossRef]
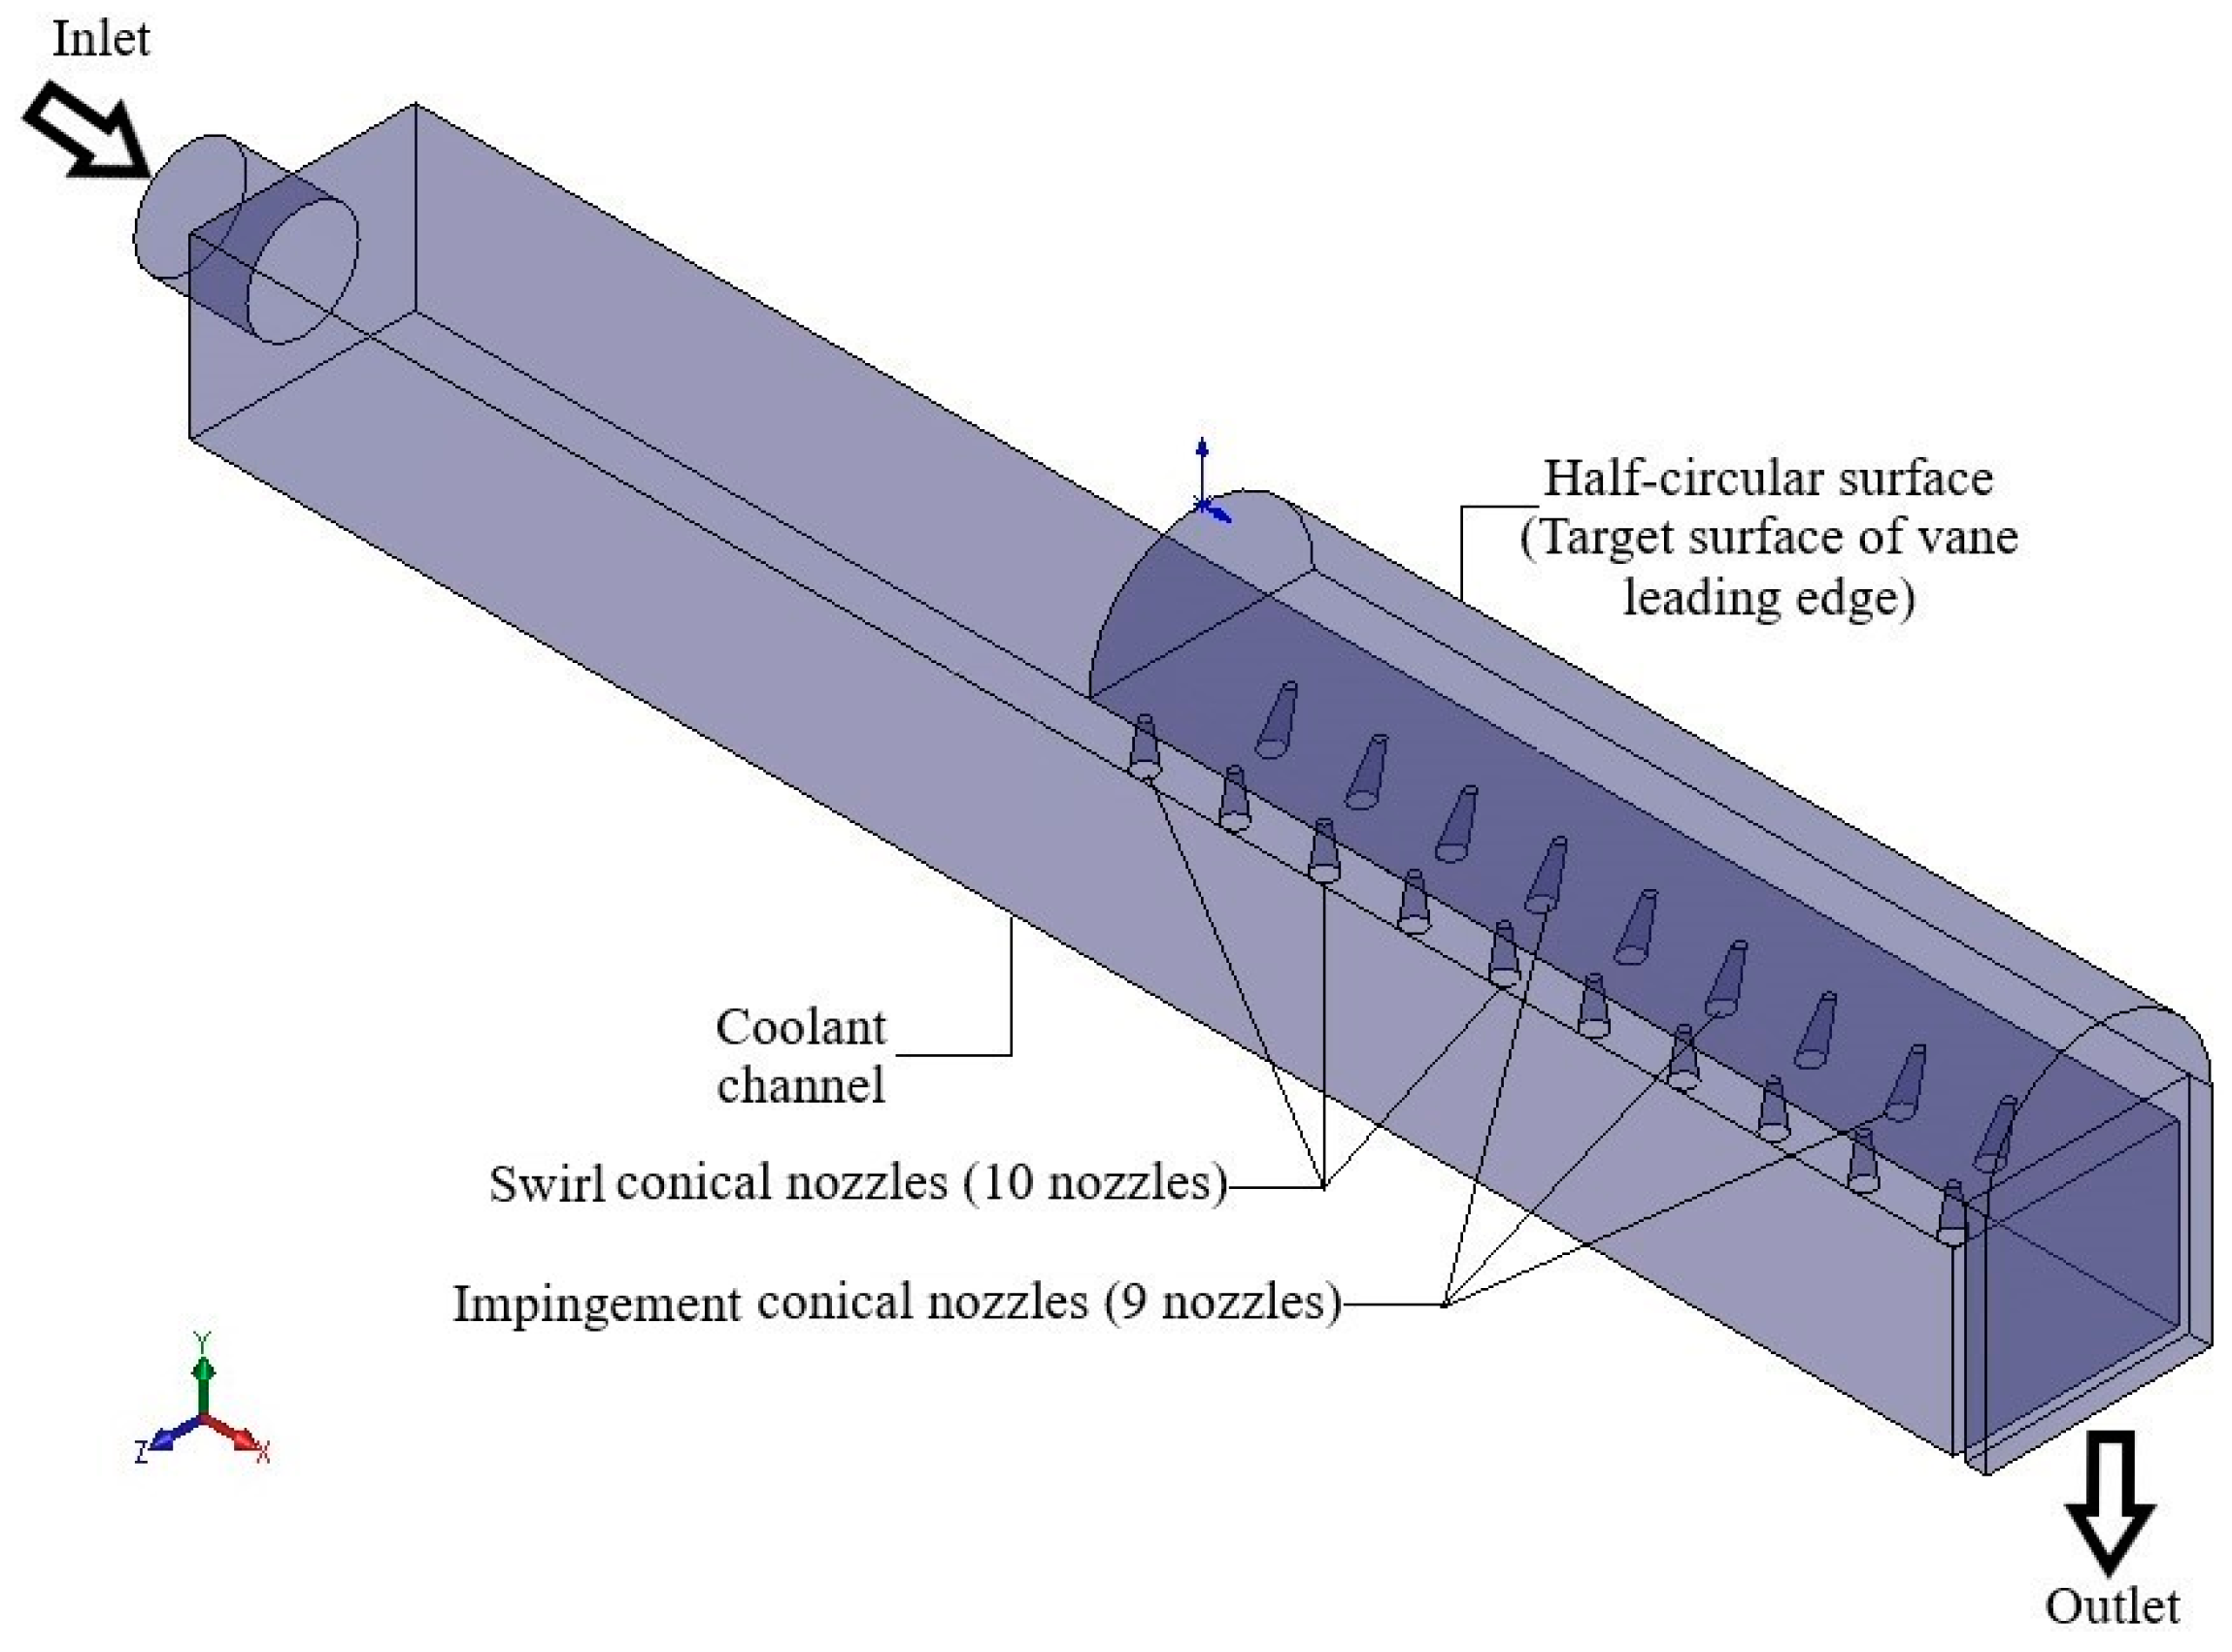
Figure 1. 3D structure of the compound cooling unit.
Energies 13 00210 g001
Figure 2. Dimensions detail of the compound cooling unit.
Energies 13 00210 g002
Figure 3. Nusselt number contours for both experimental (without mainstream [39]) and numerical results of swirl cooling at (a) Renoz = 5000, (b) Renoz = 15,000 and (c) Renoz = 25,000.
Energies 13 00210 g003
Figure 4. Nusselt number contours for both experimental (without mainstream [39]) and numerical results of impingement cooling at (a) Renoz = 5000, (b) Renoz = 15,000 and (c) Renoz = 25,000.
Energies 13 00210 g004
Figure 5. Spanwise averaged Nusselt number for both experimental and numerical results of swirl cooling at (a) Renoz = 5000, (b) Renoz = 15,000 and (c) Renoz = 25,000.
Energies 13 00210 g005
Figure 6. Spanwise averaged Nusselt number for both experimental and numerical results of impingement cooling at (a) Renoz = 5000, (b) Renoz = 15,000 and (c) Renoz = 25,000.
Energies 13 00210 g006
Figure 7. Unstructured fine mesh details of the compound cooling unit. (a) 3D view; (b) yz sections of swirl and impingement nozzles.
Energies 13 00210 g007aEnergies 13 00210 g007b
Figure 8. Streamwise-averaged Nusselt number distribution on the target surface for six different meshes.
Energies 13 00210 g008
Figure 9. Area-average velocity contours with streamlines of the compound cooling unit at different x/dnoz sections.
Energies 13 00210 g009aEnergies 13 00210 g009b
Figure 10. Axial velocity contours with streamlines of the compound cooling unit at different xy sections.
Energies 13 00210 g010aEnergies 13 00210 g010b
Figure 11. Axial vorticity contours of the compound cooling unit at different x/dnoz sections.
Energies 13 00210 g011aEnergies 13 00210 g011b
Figure 12. Coefficient of local pressure contours of the compound cooling unit at different xy sections.
Energies 13 00210 g012aEnergies 13 00210 g012b
Figure 13. Total pressure drops of the compound cooling unit at different Renoz.
Energies 13 00210 g013
Figure 14. Local Nusselt number on the target surface of the compound cooling unit at different Renoz.
Energies 13 00210 g014
Figure 15. Local Nusselt number on the target surface of the compound cooling unit at different TR.
Energies 13 00210 g015
Figure 16. Spanwise average Nusselt number on the target surface of the compound cooling unit at different Renoz.
Energies 13 00210 g016
Figure 17. Spanwise average Nusselt number on the target surface of the compound cooling unit at different TR.
Energies 13 00210 g017
Figure 18. Overall Nusselt Number of the compound cooling unit at different Renoz.
Energies 13 00210 g018
Figure 19. Overall Nusselt Number of the compound cooling unit at different TR.
Energies 13 00210 g019
Figure 20. Experimental swirl cooling versus compound cooling at identical values of Renoz.
Energies 13 00210 g020
Figure 21. Experimental impingement cooling versus compound cooling at identical values of Renoz.
Energies 13 00210 g021
Figure 22. Variations of overall area average Nusselt number as a function of Renoz and TR.
Energies 13 00210 g022
Figure 23. Overall Nusselt number correlation fit with CFD and computation results.
Energies 13 00210 g023
Table 1. Overall Nusselt number at Renoz = 15,000 for different meshes.
Mesh (million) Overall Nu
0.8655
1.259.46
1.8865
3.269.3
4.771.3
7.371.49