Abstract
Motivated by the benefits of multi-energy integration, this paper establishes a bi-level two-stage framework based on transactive control, to achieve the optimal energy provision among interconnected multi-energy systems (MESs). At the lower level, each MES autonomously determines the optimal setpoints of its controllable assets by solving a cost minimization problem, in which rolling horizon optimization is adopted to deal with the load and renewable energies’ stochastic features. A technique is further implemented for optimization model convexification by relaxing storages’ complementarity constraints, and its mathematical proof verifies the exactness of the relaxation. At the upper level, a coordinator is responsible for minimizing total costs of interconnected MESs while preventing transformer overloading. This collaborative problem is solved iteratively in a proposed two-stage transactive control framework that is compatible with operational time requirement while retaining scalability, information privacy and operation authority of each MES. The effectiveness of the proposed framework is verified by simulation cases that conduct a detailed analysis of the collaborative autonomous optimization mechanism.
1. Introduction
Continuous environment deterioration and energy depletion have necessitated the comprehensive utilization of various forms of energy. Accordingly, multi-energy systems (MESs) have gained significant attention for their ability to improve comprehensive energy efficiency, as well as to benefit system economy and environment [1,2]. For one thing, an MES can shift supply and demand across energy vectors and networks, as well as handle the uncertain and volatile generation outputs of renewable energy sources (RES) [3,4]. Besides, owing to the energy complementarity, MES has the untapped potentials of jointly minimizing the operational cost [5], enhancing the overall operational efficiency and to increasing system flexibility [6].
Based on significant research works on networked microgrids [7], recent years have witnessed a research re-orientation from energy optimization of a standalone MES to the collaborative optimization among multiple interconnected MESs (IMESs) [6]. Collaboration methods of interconnected subsystems generally fall into centralized and distributed mechanisms. The centralized models are established in [5,6,8,9] and subsequently solved with traditional mathematical algorithms [6,8] or modern intelligent optimization techniques [5,9]. While such optimizations guarantee a global optimal utilization of resources, they fail to meet privacy protection, scalability and openness requirements. Besides, MESs may have different owners and schedule resources based on their own economic rules and policies [6,10]. This indicates that a direct decision authority or compulsory dispatch orders can be unpractical.
Concerning this, the distributed mechanism is more favorable. While ensuring satisfactory solutions, it is capable of protecting crucial information of individual entities [3]. Two commonly used distributed methods are game theory [11,12] and the alternating direction method of multipliers (ADMM) algorithm [13,14]. For example, an incentive mechanism using the Nash bargaining solution is proposed to encourage interaction and sharing among interconnected microgrids in [15]. A hierarchical distributed strategy is proposed in [13] to operate interconnected microgrids to increase the overall infeed of RES. While these methods address the issue of scalability, the coordination signals used in these methods, e.g., the Lagrange multipliers, do not provide explicit market information in collaboration [3]. Compared with these methods, transactive control (TC) developed in recent years uses local price as a key operational parameter in collaboration [16] and reaches equilibriums over dynamic and real-time forecasting periods [17]. It has been used in several applications, such as the Grid-SMART demonstration project [18] and the PowerMatching City project [19], as well as in some studies on operating systems with high penetration of distributed energy resources [17,20].
While the TC framework has been successfully applied to the optimal operation of IMESs [3,21,22], two prominent issues still need to be addressed.
First, the existing TC methods usually require a comparable number of iterations to converge [3], which makes it unpractical in respect to communication latency, throughput, and distortion. Considering the uncertainties and fluctuations of RES output and load demand profile, a collaboration framework for intra-day or even real-time operation is highly demanded, to better integrate high penetration of RES and to improve overall energy efficiency. Therefore, much research is needed to increase the convergence speed [17]. While an adaptive scheme has been proposed in [23] for power dispatching among networked microgrids in this aspect, it is not applicable to optimizations with intertemporal constraints.
Electric or thermal storages are becoming increasingly important in the MES. The second issue is concerned with constraints that prevent simultaneous charging and discharging of energy storages. To be specific, existence of these complementarity constraints leads to non-convex optimizations that are computationally intractable to solve [24,25]. While researchers in [22,26,27,28] have illustrated that these complementarity constraints are redundant under the normal operation mode, an exact definition of such normal cases is lacking in these studies. Three groups of sufficient conditions are proved in [25]. However, those conditions are not generally suitable for this paper. The simulation case in [29] demonstrates how including a penalty on storage usage in the cost function ensures an equivalent solution. However, the optimization problem has to be solved twice in this case. Some preliminary work regarding this issue has been made in our previous paper [30] and this paper follows its footstep to provide proof mathematically and through simulation.
Concerning the above-mentioned issues, a two-stage transactive control framework is proposed for the collaborative autonomous optimization of multiple interconnected MESs. To be detailed, “autonomous” implies that each self-governed MES is authorized to conduct optimization to supply local demand independently; “collaborative” confirms that the IMESs’ benefit as a whole is considered and obtained jointly; finally, the proposed “two-stage TC framework” guarantees that the collaboration proceeds in a distributed and scalable manner with a fast convergence speed.
Main contributions of the work are:
- For the autonomous optimization of each MES, a convexification technique is proposed along with two sufficient conditions to relax the storage’s complementarity constraint, so that the problem is formulated as a convex model.
- For the collaborative optimization of interconnected MESs, a bi-level framework that preserves the privacy of each MES is proposed wherein the upper-level system coordinator and the lower-level MES operator exchange incentive/responsive signals with each other.
- A novel two-stage transactive control framework is further established to reduce the required iterations so that it applies to intra-day rolling optimizations or even real-time optimizations.
The paper is structured as follows. The general framework is firstly described in Section 2. Section 3 then develops the detailed rolling optimization model for each autonomous MES. The collaborative optimization of the IMESs is formulated in Section 4, together with the proposed two-stage bi-level TC framework. The proposed method is tested in Section 5. A discussion of this paper is presented in Section 6 and Section 7 finally concludes the paper.
2. Bi-Level Optimization Framework
This section describes both energy management entities and the general system architecture of the optimization framework. The assumptions made are also included in this section.
2.1. Energy Management Entities and System Architecture
This paper considers two energy management entities:
2.1.1. MES Operator
Energy systems have been tightly coupled nowadays, leading to the blooming of integrated energy service companies that manage several types of energy concurrently. Therefore, this paper assumes that an operator is responsible for optimal operation within the multi-energy system. However, as the interconnected network among IMESs cannot be monitored by individual MESs, each MESs’ optimized solutions might not meet the requirement of secure IMESs operation.
2.1.2. System Coordinator
To address these above-mentioned issues, this paper assumes that an upper-level entity, referred to as system coordinator, is responsible for coordinating the IMESs and managing the operation of the interconnected network. Meanwhile, the system coordinator also serves as an interface between IMESs and the utility grid, by strategically responding to dispatching signals.
Under these assumptions, a collaborative autonomous optimization framework is proposed based on the TC mechanism for energy management of IMESs, as shown in Figure 1. In the proposed framework, each MES optimizes to minimize its operational cost autonomously, and incentive/responsive signals are exchanged between the MESs and the system coordinator to achieve a collaborative optimization. In this way, issues can be addressed effectively that are associated with individual MESs’ information privacy and operation authority among different management entities.
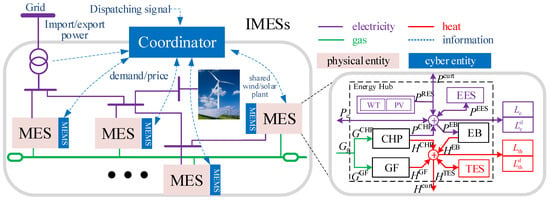
Figure 1.
Energy management architecture for interconnected multi-energy systems (MESs).
2.2. General Assumptions
The following assumptions are made in this paper:
- Considering that the gas market is much less competitive and less flexible than the electricity market [6], the gas price usually varies much slower than the electricity price. Now that this paper focuses on intra-day energy optimization, we assume that the gas price is known one day ahead and kept unchanged throughout a day.
- Since the implementation of a real-time pricing (RTP) scheme requires continuous real-time communication between the energy provider and the customers, an alternative named day-ahead RTP is used wherein the next day’s predicted real-time prices are announced beforehand [31]. Therefore, we assume that the real-time electricity prices are announced one day ahead [31] or can be forecasted as in [32].
- Given that ongoing forecasting methodologies are beyond the scope of this study, it is assumed that the forecast errors of RES power output and load demand would follow normal distributions [33,34] with parameters known beforehand.
3. Autonomous Convex Optimization of MES
This section first formulates the autonomous optimization problem of an MES. A convexification technique is then proposed to relax its nonlinear constraint and convexify the optimization problem.
3.1. MES Model
The lower part of Figure 1 exemplifies the structure of an MES consisting of a gas turbine combined heat and power (CHP) unit, a natural gas furnace (GF), an electric boiler (EB), an electric energy storage (EES) and a thermal energy storage (TES). Its model can be formulated as:
where denotes the electricity power MES imports from the main grid at time t, and implies that the MES sells surplus electricity to the grid; represents the onsite RES power generated under the maximum power point tracking mode; and denote natural gas consumed by CHP and furnace, respectively; and are the gas-electric and gas-thermal efficiencies of CHP, and denote electricity consumed by boiler; are efficiencies of the furnace and boiler, respectively; and represent the charging and discharging power of EES, respectively, while and are the charging and discharging amount of TES, respectively; and represent the curtailed RES and heat; and denote the shiftable electric load and thermal load, while and denote the fixed electric load and thermal load, respectively.
3.2. Rolling Optimization Problem
Considering various fluctuations and uncertainties, the rolling optimization is adopted in this paper. Namely, at time t, each MES seeks to autonomously minimize its expected cost across the remaining periods based on forecasts of local RES output and load demand. However, only decision of current time slot will be made according to the optimized schedule [35]. The schedule will be remade in the next time slot since refreshed forecast data will be provided.
The operational cost during period t can be split into two parts: The electricity purchasing cost and the gas purchasing cost,
where and denote electricity price under the RTP scheme and natural gas price at period t, respectively.
In addition to power balance Constraint (1), other constraints include:
- The capacity constraint of electricity:where denote the maximum exchange powers through the connecting line.
- The electric capacity limits of CHP, furnace, and boiler:where , and denote the installed capacity of the CHP, furnace and boiler, respectively; , and denote lower limits of corresponding electric power.
- The ramping constraints of CHP and boiler:where and denote the hourly ramping rate of CHP and boiler.
- The maximum charging/discharging power constraints:where , denote the maximum charging and discharging power of the EES, and , denote the maximum charging and discharging quantity of the TES, respectively.
- The mutual exclusiveness of charging and discharging mode of EES and TES:
- Constraints associated with shiftable loads [36]:where and denote the total shiftable electric and heat load within the scheduling day, respectively; and are upper limits of the shiftable load; and are feasible time intervals of shiftable electric load and thermal load, respectively.
- Upper limits of RES curtailment (which happens when the feed-in power hits the limit of the connecting line caused by too much local RES) and heat curtailment (which happens when the local heat output exceeds the local demand):
- The upper and lower energy bounds of EES and TES:where denote the minimum and maximum energy of EES and TES, respectively; , denote the energy of the EES and TES at current period ; , are the self-discharge rate of EES and TES; and are the net energy change of the EES and TES during the period t, which can be calculated, respectively, as:where denotes the scheduling period; , , and denote charging and discharging efficiencies of EES and TES, respectively.
- The target energy constraints of storages to avoid end-of-horizon effects:where denotes the end period of optimization horizon; and are the target energy of EES and TES at the end of the optimization horizon.
The autonomous optimization problem at for each MES can thus be formulated as:
3.3. Equivalent Energy Change Transform
For each MES, problem P1 can be solved by commercial solvers or heuristic approaches. However, since the Slater’s Condition [28] is not satisfied, distributed mechanisms cannot be applied to the joint optimization of multiple interconnected MESs that are, respectively, described in this non-convex form. Therefore, this section endeavors to propose a method to relax these nonlinear constraints, such that P1 can be convexified as:
The relationship between optimal solutions of problem P1 and P2 is discussed below. Without loss of generality, we only discuss the Constraint (11), i.e., the mutual exclusiveness of charging/discharging mode of the EES, and the same method is also applicable to the Constraint (12) for the TES.
Let the feasible regions of P1 and P2 be , , optimal solution vectors be , , and optimal values be , , respectively. Besides, variables with a superscript * denote corresponding optimal values in . For instance, and denote the optimal charging and discharging power of the EES in at time t.
The following theorem provides a sufficient condition for the equivalency of these two optimal solutions:
Theorem 1.
In problem P2, if no RES need to be curtailed, i.e., , then holds.
Proof.
To prove it by contradiction, suppose that , such that . Denote the corresponding energy change of the EES as . Define the equivalent-energy-change (EEC) transform for the EES as:
It is easy to verify that the new pair of charging/discharging power leads to a same energy change of the EES as during period t.
The difference of EES’s net discharge power can thus be calculated as:
which means that compared with , an EES controlled according to always consumes less power (or discharge more power). Since there is no RES curtailment, according to Equation (1) the system coordinator could purchase less electricity from the main grid by implementing the new charging/discharging power without breaking power balance. This contradicts with the fact that is an optimal solution of P2. □
According to Theorem 1, without energy curtailment, the model has no incentive to charge and discharge simultaneously [26] and therefore . While references [22,26] have conducted similar relaxation steps, the precondition and the proof are not provided.
However, in case local renewable energies are abundant, surplus power should be curtailed and this precondition is no longer established. In such case, apply the EEC transform and use the following substitutions in :
and denote the new solution vector as .
Remark 1.
The EEC transform has no impact on the energy trajectory of an EES. Since the difference in the net discharge power caused by the transform is balanced by , the exchanged electricity power of an MES is also kept unchanged.
The sufficient condition for optimality of is given in the following theorem:
Theorem 2.
If the optimal solution of P2 satisfies:
then is an optimal solution ofP1.
Proof.
See Appendix A. □
Remark 2.
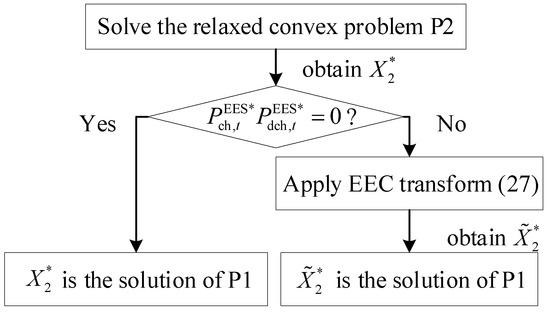
The extreme circumstance when (28) is unsatisfied is assumed to never occur due to the optimal planning procedure of energy systems in practice. As a consequence, the problem P1 can be solved by solving a relaxed problem P2. While the EEC transform may be applied to the solution of P2 as summarized in Figure 2, it will not be explicitly stated in the subsequent models according to Remark 1.

Figure 2.
Applying the equivalent-energy-change (EEC) transform.
4. Transactive Collaborative Optimization
Based on the autonomous optimization established in Section 3, this section further formulates the collaborative optimization of interconnected MESs. The problem is then dual-decomposed to be iteratively solved with the bi-level framework. Finally, a two-stage TC framework is designed that reduces the iterations so that it applies to intra-day rolling optimizations.
4.1. Bi-Level Decomposition of Optimization Problem
During each period, the system coordinator aims at minimizing the overall costs of IMESs across the remaining periods while keeping supply-demand balanced and operation constraints satisfied. The optimization problem at can be modeled as follows:
where n is the index for MES; N is total number of MESs; is the total shared RES power (wind or solar) as shown in Figure 1; is the imported power of the main transformer, and are the maximum exchange powers, determined either by the physical limit of the transformer or dispatch signal such as a peak-shaving request.
The problem P3 should have been solved in a centralized manner after gathering detailed information from all MESs. However, to preserve information privacy, this paper advocates to solve it in a distributed TC framework.
The Lagrangian relaxed dual problem of P3 is [37]:
where L is the Lagrangian function after introducing the Lagrange multipliers associated with the power balance constraint:
Since the primal problem P3 is convex, strong duality holds and the optimal value of P4 is equivalent to that of P3.
Under the given , the dual problem P4 can be decomposed into subproblems (SP), corresponding to N MESs:
and the transformer [38]:
If the Lagrangian multiplier in Equations (32) and (33) is interpreted as price, a local price signal can then be defined as:
Thus, the multiplier indicates the offset of the local electricity price to the RTP price , caused by the transformer congestion.
SP is exactly the individual optimization problem P2 of MES established in Section 3, except for that is replaced by .
Similarly, substitute Equations (34) into (33) and then decompose Equation (33) into each control period, the subproblem SP is stated as:
Obviously, the optimal solution of SP is:
which indicates that when the local price is higher (lower) than the RTP price, the transformer purchases (sells) electricity from (to) the main grid as much as possible [38] and vice versa.
By far, problem P3 of Equation (29) can be solved in a bi-level framework. That is to say, at the upper level, the system coordinator adjusts the local price vector to strike a general balance between supply and demand. At the lower level, each MES autonomously minimizes its cost under the price vector. This process usually requires a large number of iterations. Denote the price vector in the k-th iteration by:
In each iteration, each MES solves SP (35) with the given price vector and bids the optimal power vector . Meanwhile, the transformer bids the optimal power vector by solving SP (36). After receiving all biddings, the system coordinator computes the balance vector , and updates the price vector , where denotes a feasible step length. These steps are repeated until the balance is achieved. In this paper, the above method is referred to as subgradient-based rolling TC (SG-RTC), since it adopts the dual subgradient method in a rolling optimization horizon [12,21,22].
4.2. Two-Stage Optimization
While the bi-level decomposition method significantly improves scalability, a large number of iterations required might be impractical for hourly-scheduling. To address this problem, a two-stage TC (abbreviated as 2S-TC) is proposed that splits the SG-RTC into two stages as illustrated in Figure 3. A day-ahead stage is first implemented to forecast local electricity prices of the next day. Then an intra-day hourly-scheduling stage is implemented to further deal with RES and loads’ uncertainties. These two stages are compared in Table 1, and the SG-RTC method is also compared in the table.
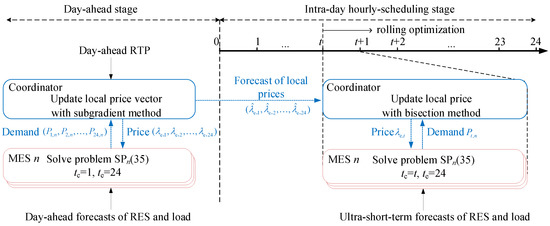
Figure 3.
Operation framework diagram for a two-stage TC (2S-TC).

Table 1.
Comparisons between subgradient-based rolling TC (SG-RTC) and 2S-TC.
4.2.1. Day-Ahead Stage
Just like the SG-RTC, the day-ahead stage adopts the subgradient method to solve the intertemporal optimization problem iteratively. However, since the purpose is to forecast local electricity prices of the next day, there is no need to adopt a rolling optimization strategy in this stage. Denote the forecast local price vector of the next day by
4.2.2. Hourly-Scheduling Stage
This stage aims to perform an hour-ahead power adjustment based on ultra-short-term forecasts of RES and load.
The rolling optimization is employed in this stage. At period , it is assumed that day-ahead forecasts of local electricity prices for future periods, i.e., , are perfect, and only the electricity price for the current period needs to be updated. Since now there is only one decision variable, a one-dimension search method such as the bisection algorithm [39] can be used. Denote the bisection search space as where are minimum and maximum prices, respectively. Then the search process is as follows:
S0: The system coordinator broadcasts the forecast price vector obtained in the day-ahead stage to all MESs.
S1: At the p-th iteration of period , the coordinator broadcasts the price .
S2: Each MES then generates the p-th price vector locally:
then solves its own subproblem SP (35) and bids the optimal power, denoted as , to the coordinator.
Meanwhile, the transformer bids its optimal power, denoted as , according to Equation (37).
S3: The coordinator calculates the power balance of the current period after receiving all bidding data:
S4: If is smaller than a predefined threshold , then the system converges and steps into S5. Otherwise, the coordinator updates according to the bisection method and steps back to S1.
S5: Each MES implements local control according to its last bid. The above procedures are then repeated for the next control period.
5. Case Study
5.1. Case Study Setup
Three case studies will be simulated in this section. Case study I aims to compare the proposed 2S-TC with SG-RTC in terms of accuracy and number of iterations. Case study II and case study III will evaluate the collaborative optimization and the autonomous optimization, respectively.
The simulation system consists of three MESs, including two residential MESs (MES and MES) and one commercial MES (MES). Parameters are listed in Table 2. The shared RES includes a 0.4 MW wind farm and a 0.3 MW solar farm. Profiles of fixed loads, shiftable loads and RES in a typical winter day are shown in Figure 4. The shiftable electric load typically includes EVs, washing machines and dishwashers in residential MESs, as well as water heaters and disinfectors in the commercial MES. The power limit of the main transformer is 2.25MW. The connecting line limits of MES, MES and MES are 1.1 MW, 2.25 MW, and 1.2 MW, respectively.

Table 2.
Parameters of components.
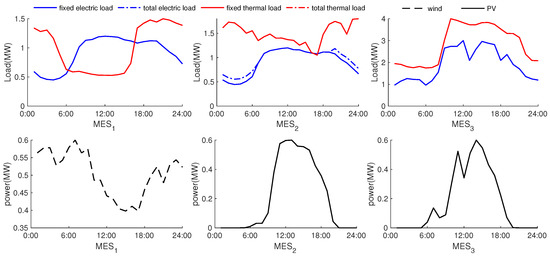
Figure 4.
Curves of local loads and renewable energy sources (RES) in each MES.
The control period is 1h. The maximum and minimum electricity prices in the market are 1.0 and 0.2 yuan/kWh, respectively. The real-time prices are obtained from the PJM website [40]. The price of natural gas is 3.3 yuan/m [30]. The day-ahead, intra-day and real-time forecast errors of RES are , and , respectively; the day-ahead, intra-day and real-time forecast errors of load are , and , respectively [41].
5.2. Case Study I: Comparisons of SG-RTC and 2S-TC
In this case study, the IMESs operate in the collaborative autonomous mode, i.e., the autonomous MESs are coordinated under the 2S-TC framework. The whole IMESs system can both buy and sell electricity to maximize its profit. The feed-in electricity price is assumed to be the same as the RTP price.
Since the SG-RTC’s accuracy is guaranteed, it is viewed as a benchmark in this case study. Therefore, the rolling horizon problem P3 is solved with both the SG-RTC and the proposed 2S-TC.
The overall cost is 83.94k yuan under 2S-TC and 84.26k yuan under the benchmark. The energy cost of each MES is listed in Table 3. The results of the two methods are fairly close, suggesting that the proposed method is efficient in obtaining a rather optimal solution of the collaborative optimization.

Table 3.
Comparisons of subgradient-based rolling TC (SG-RTC) and 2S-TC.
Using MATLAB on a 3.60GHz Intel(R) Core i7-7700 CPU and 16GB RAM, the execution time of one iteration is less than 100ms for both methods. The maximum and average number of iterations required by SG-RTC and 2S-TC during congestion periods are also compared in Table 3. Results show that the 2S-TC method requires substantially fewer iterations to converge than SG-RTC in each period. Since the number of iterations corresponds to the communication costs between the system coordinator and MESs, and each MES is required to execute a local optimization for each iteration, 2S-TC can significantly improve control performances in terms of communication and computation requirements, especially considering the communication latency and distortion in practice.
5.3. Case Study II: Effects of Collaborative Optimization
In addition to the collaborative autonomous mode, two operation modes will be considered in this case study:
- Non-collaborative mode: The IMESs are not coordinated by the system coordinator and each MES acts autonomously, i.e., each MES simply responds to RTP and self-optimizes according to P1 (23);
- collaborative autonomous mode with feed-in limitation (FIL): In contrast to the collaborative autonomous mode, this mode aims to encourage local consumption of RES [26] and thus reduce the impact on the main power grid [42]. This incentive purpose is usually achieved with the introduction of a feed-in price that is lower than the electricity price [21,26]. To maximize the local consumption, the feed-in price is assumed to be zero in this mode.
Simulation results of transformer power under these three modes are plotted in Figure 5, which clearly shows that:
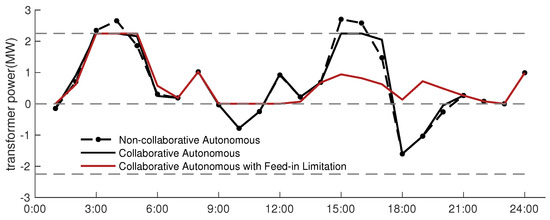
Figure 5.
Transformer power under three operation modes.
- In the non-collaborative mode, the main transformer would suffer from overloading during 3:00–4:00 and 15:00–16:00.
- After coordinating the IMESs in the collaborative autonomous mode, the main transformer is successfully protected from overloading. Meanwhile, power exportation through the main transformer can be observed in some periods to maximize the profit.
- In contrast, the collaborative autonomous-FIL mode can maximize local accommodation of RES while avoiding congestion.
Total costs of the IMESs under the three modes are 83.90 k, 84.26 k and 83.93 k yuan, respectively, while their RES accommodation rates are 87.69%, 88.34%, and 100%, respectively.
Figure 6 plots the imported electricity of each MES under the above-mentioned three modes, respectively. Besides, since in the 2S-TC framework the IMESs are coordinated using local price signals, the clearing prices and RTP prices are plotted in Figure 6 as well. As illustrated in Figure 6b, the collaborative autonomous mode will raise the clearing price above the RTP price when import congestion occurs during 2:00–4:00. As a result, MES and MES are discouraged from consuming electricity and would lower the EES charging power if possible during these hours, while MES would increase the CHP output to make extra profit from selling electricity to other MESs. The congestion is finally relieved under the collaboration of all MESs successfully.
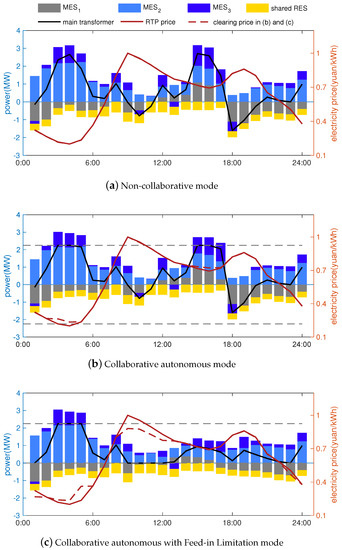
Figure 6.
Imported electricity of each MES and local prices.
In contrast, while relieving the import congestion by raising the clearing price, the collaborative autonomous-FIL mode will also cut down the clearing price when export congestion happens at 1:00, 9:00–12:00 and 23:00, as illustrated in Figure 6c. Therefore, MES and MES are discouraged from generating much electricity through CHP during these hours and would lower the TES charging power correspondingly, while MES is incentivized to consume more electricity to increase the overall RES accommodation within the IMESs.
5.4. Case Study III: Effects of Autonomous Optimization
This section will focus on the MES-level self-optimization under the collaborative autonomous-FIL mode. The results of all MESs are shown in Figure 7 where the state of charge (SOC) of energy storage is defined as the ratio of stored energy to that of the total capacity. Note that for the bars in the figure, the generated power to supply the demand is positive, while the exported or consumed power is negative. For the convenience of analysis, the day is divided into two periods according to levels of price, i.e., valley-price hours (24:00–6:00) and peak-price hours (7:00–23:00).
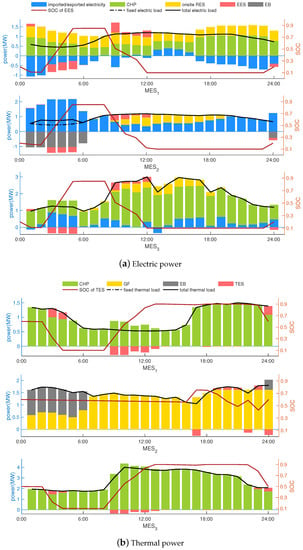
Figure 7.
Result of each MES’s (a) electric and (b) thermal power.
It can be seen from Figure 7 that the output level of CHP is determined by heat amount throughout the day in both MES and MES. As a result, despite redundant wind resources at midnight in MES and solar resources at noon in MES, excessive electricity is generated as a by-product, so that these two MESs have to sell electricity to other MESs at that time. On the contrary, since no CHP is installed in MES, it has no alternative but to import electricity from the main grid to supply electric demand. Therefore, the electricity demand of MES is comparatively higher all day long, especially during valley hours when the heat is mainly supplied with the electric boiler. The following characteristics can thus be concluded from the simulation results:
- During valley hours, an MES tends to purchase cheap electricity from the main grid and supply heat with the boiler. During peak hours, it is more profitable to generate energy through CHPs and supply heat with the furnace.
- An MES tends to charge EES during valley hours to store electricity for peak hours, while a TES in MES installed with CHP (TES and TES in this case) tends to store thermal energy during peak hours and release heat during valley hours.
- The EES, TES and shiftable loads are coordinated such that the MES’ net electric demand against thermal load matches the heat-to-electric ratio of CHP unit. On the one hand, it can minimize the use of furnace and reduce the cost of thermal energy during peak hours. On the other hand, under such conditions, curtailments of both electric and thermal power are minimized, thus the comprehensive efficiency of an MES is improved.
To sum up, the complementary among multi-energy effectively help IMESs to better accommodate congestions caused by price fluctuation. It also gives full scope to each MES’ optimization that aims to reduce its overall energy cost autonomously, while protecting the main transformer from overloading and increasing the RES accommodation, collaboratively.
It should be mentioned that neither RES curtailment nor simultaneously charge/discharge is witnessed in the above-mentioned cases, thus verifying the exactness of Theorem 1. To further verify the effectiveness of Theorem 2, the installed capacity of wind turbines in MES is intentionally increased, causing wind curtailment at certain periods. Figure 8 plots optimal charging/discharging power of the EES obtained in P1, P2 and (P2+EEC), which (P2+EEC) indicates the applying of EEC transformation on the optimal result of P2 as illustrated in Figure 2. The optimal operational costs of MES obtained in both P1 and (P2+EEC) are 15.51k yuan. The simulation results demonstrate that: (i) During time slots when no wind curtailment occurs, the optimal solution of P2 always satisfies the mutual exclusiveness constraint, which also verifies Theorem 1. In contrast, at 6:00 and 24:00, abundant winds are curtailed and the result of P2 violates the relaxed constraints meanwhile. (ii) As expected, conditions where Equation (28) is unsatisfied have not been witnessed in the simulation case. Since the optimal operational costs of P1 and (P2+EEC) are the same, the correctness of Theorem 2 is also verified.
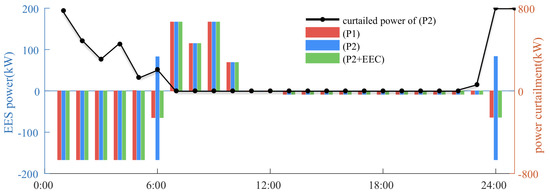
Figure 8.
Power of RES curtailment and EES in a wind-rich MES.
6. Discussion
Two issues will be discussed in this section. First, the impact of power losses on the simulation outcomes. Second, the possibility of real-time coordination of the IMESs with the proposed 2S-TC framework.
In this paper, power losses that include the loss in the connecting line and the transformer are not considered for simplicity, which may have impacts on the local accommodation of RES. As for the collaborative autonomous mode with feed-in limitation, the loss actually has no impact on the RES accommodation, since a 100% accommodation is already guaranteed. Nevertheless, in the collaborative autonomous mode, when the transformer’s export power is within the feed-in limit, the incorporation of power loss would incentivize the local electricity usage and increase the RES accommodation. However, compared with TC that lowers local price to incentivize electricity usage when the exportation congestion occurs, the impact of power loss on accommodation rate is limited and not the focus of this benchmark.
Given that the real-time communication between the system coordinator and each MES operator is a great challenge for existing ICT infrastructures [17], communication latency should be considered to estimate the total execution time of every control period. Recall that the execution time of every iteration is less than 100 ms in our simulation result, while the maximum iterations of SG-RTC and 2S-TC are 183 and 9, respectively. Since the maximum unidirectional communication latency may be about 3 seconds in an interconnected MV and LV distribution network [43], the total execution time of the SG-RTC can be as long as 183 × (3 s + 100 ms) ≈ 9 min, while that of the proposed 2S-TC is about 9 × (3 s + 100 ms) ≈ 0.5 min. While 9 min seems tolerable for the hourly scheduling, considering the ever-increasing penetration of RES in the IMESs, real-time optimization is required to balance the very short-term wind power fluctuation [44] thus ensuring the security and efficiency of the system. Besides, the flexibility and comfort of price-responsive loads call for real-time information to quantify end-customers’ willingness in demand response [45]. In both cases, the control interval can be as low as 5–15 min as in [44,45]. As a result, the SG-RTC would fail to meet the higher convergence requirement for these real-time optimizations, while the proposed two-stage TC framework applies to both real-time operation of the IMESs and the fast-acting demand response of flexible loads in the future.
7. Conclusions
This paper proposes a two-stage TC framework for coordinating multiple interconnected MESs. Due to the nonlinearity of the storage’s complementarity constraint, a convexification technique is proposed along with two sufficient conditions to relax the constraint so that the convex problem applies to the distributed TC framework. In the proposed framework, each MES conducts rolling optimization autonomously at the lower level to minimize the operation cost under the given electricity price. At the same time, the upper-level system coordinator is responsible for updating the broadcasted price to solve the collaborative optimization iteratively. Considering the communication overhead and latency, a two-stage TC is established so that it even applies to real-time optimization with a short control interval, e.g., 5 min.
Compared with SG-RTC, the simulation shows that the proposed 2S-TC obtains results with an error of less than 1% within ten times fewer iterations. It is also verified that the collaborative optimization helps to achieve a 100% local accommodation of RES, compared to the autonomous case. Furthermore, the benefits of different components in the MES and the effectiveness of the proposed convexification technique are also discussed in the simulation results.
Future work will include the analysis of establishing a competitive gas market. Another possible research direction is to consider price-responsive loads in our model to exploit the flexibility of end-customers.
Author Contributions
The paper was a collaborative effort between the authors. Y.C. performed the simulation and wrote the original draft. P.Z. conceptulized the methodology and supervised the research. X.L. reviewed and edited the paper. All authors have read and agreed to the published version of the manuscript.
Funding
This research was funded by the National Key R&D Program of China (2018YFB0905000).
Conflicts of Interest
The authors declare no conflict of interest.
Appendix A. Proof of Theorem 2
Proof.
Condition 1: When . First, since Equation (11) is satisfied and the right-hand-side of Condition (28) equals zero, Condition (28) is always met. Second, because and denote the feasible and optimal solution of P1, respectively, it can be derived that . Meanwhile, since , then . Therefore, and is also an optimal solution of P1. At last, it is obvious that . To sum up, is an optimal solution of P1.
Condition 2: When , which means that , such that . To prove that is an optimal solution of P1, let’s first prove that it is a feasible solution.
Without loss of generality, assume , and similar proof can be derived when .
First, apparently satisfies Constraints (3)–(8), (10), (12)–(14), (16), (18), (22) since the modified variables are not included in these constraints. Besides, the transformation method introduced in (27) guarantees that always meets the power balance Constraint (1) and the mutual exclusiveness Constraint (11). As for Constraints (9), (15), (17), (21):
Therefore, all constraints of P1 are met for , and is a feasible solution of P1. Since , hereafter conclusion of condition 1 can be applied to derived that . Thus, is an optimal solution of P1. □
References
- Dall’Anese, E.; Mancarella, P.; Monti, A. Unlocking Flexibility: Integrated Optimization and Control of Multienergy Systems. IEEE Power Energy Mag. 2017, 15, 43–52. [Google Scholar] [CrossRef]
- Huang, W.; Zhang, N.; Kang, C.; Li, M.; Huo, M. From demand response to integrated demand response: Review and prospect of research and application. Prot. Control. Mod. Power Syst. 2019, 4, 12. [Google Scholar] [CrossRef]
- Liu, W.; Zhan, J.; Chung, C.Y. A Novel Transactive Energy Control Mechanism for Collaborative Networked Microgrids. IEEE Trans. Power Syst. 2019, 34, 2048–2060. [Google Scholar] [CrossRef]
- Wang, Z.; Chen, B.; Wang, J.; Begovic, M.M.; Chen, C. Coordinated Energy Management of Networked Microgrids in Distribution Systems. IEEE Trans. Smart Grid 2015, 6, 45–53. [Google Scholar] [CrossRef]
- Liu, J.; Wang, A.; Qu, Y.; Wang, W. Coordinated Operation of Multi-Integrated Energy System Based on Linear Weighted Sum and Grasshopper Optimization Algorithm. IEEE Access 2018, 6, 42186–42195. [Google Scholar] [CrossRef]
- Chen, Y.; Wei, W.; Liu, F.; Wu, Q.; Mei, S. Analyzing and validating the economic efficiency of managing a cluster of energy hubs in multi-carrier energy systems. Appl. Energy 2018, 230, 403–416. [Google Scholar] [CrossRef]
- Alam, M.N.; Chakrabarti, S.; Ghosh, A. Networked Microgrids: State-of-the-Art and Future Perspectives. IEEE Trans. Ind. Inform. 2019, 15, 1238–1250. [Google Scholar] [CrossRef]
- Zhang, Y.; He, Y.; Yan, M.; Guo, C.; Ding, Y. Linearized Stochastic Scheduling of Interconnected Energy Hubs Considering Integrated Demand Response and Wind Uncertainty. Energies 2018, 11, 2448. [Google Scholar] [CrossRef]
- Beigvand, S.D.; Abdi, H.; Scala, M.L. A general model for energy hub economic dispatch. Appl. Energy 2017, 190, 1090–1111. [Google Scholar] [CrossRef]
- Malekpour, A.R.; Pahwa, A. Stochastic Networked Microgrid Energy Management With Correlated Wind Generators. IEEE Trans. Power Syst. 2017, 32, 3681–3693. [Google Scholar] [CrossRef]
- Parisio, A.; Wiezorek, C.; Kyntäjä, T.; Elo, J.; Strunz, K.; Johansson, K.H. Cooperative MPC-Based Energy Management for Networked Microgrids. IEEE Trans. Smart Grid 2017, 8, 3066–3074. [Google Scholar] [CrossRef]
- Dehghanpour, K.; Nehrir, H. An Agent-Based Hierarchical Bargaining Framework for Power Management of Multiple Cooperative Microgrids. IEEE Trans. Smart Grid 2019, 10, 514–522. [Google Scholar] [CrossRef]
- Hans, C.A.; Braun, P.; Raisch, J.; Grüne, L.; Reincke-Collon, C. Hierarchical Distributed Model Predictive Control of Interconnected Microgrids. IEEE Trans. Sustain. Energy 2019, 10, 407–416. [Google Scholar] [CrossRef]
- Feng, C.; Wen, F.; Zhang, L.; Xu, C.; Salam, M.A.; You, S. Decentralized Energy Management of Networked Microgrid Based on Alternating-Direction Multiplier Method. Energies 2018, 11, 2555. [Google Scholar] [CrossRef]
- Wang, H.; Huang, J. Incentivizing Energy Trading for Interconnected Microgrids. IEEE Trans. Smart Grid 2018, 9, 2647–2657. [Google Scholar] [CrossRef]
- GridWise Transactive Energy Framework, Version 1.0. PNNL-22946 Ver1; Technical Report; The GridWise Architecture Council: Richland, WA, USA, 2015.
- Hu, J.; Yang, G.; Kok, K.; Xue, Y.; Bindner, H.W. Transactive control: A framework for operating power systems characterized by high penetration of distributed energy resources. J. Mod. Power Syst. Clean Energy 2017, 5, 451–464. [Google Scholar] [CrossRef]
- Widergren, S.E.; Subbarao, K.; Fuller, J.C.; Chassin, D.P.; Somani, A.; Marinovici, C.; Hammerstrom, J.L. AEP Ohio gridSMART Demonstration Project Real-Time Pricing Demonstration Analysis; Technical Report; Pacific Northwest National Laboratory Richland: Washington, DC, USA, 2014.
- Kok, J.K.; Warmer, C.J.; Kamphuis, I.G. PowerMatcher: Multiagent Control in the Electricity Infrastructure; ACM: New York, NY, USA, 2005; pp. 75–82. [Google Scholar]
- Yao, Y.; Zhang, P.; Chen, S. Aggregating Large-Scale Generalized Energy Storages to Participate in the Energy and Regulation Market. Energies 2019, 12, 1024. [Google Scholar] [CrossRef]
- Xu, D.; Zhou, B.; Chan, K.W.; Li, C.; Wu, Q.; Chen, B.; Xia, S. Distributed Multi-Energy Coordination of Multi-Microgrids with Biogas-Solar-Wind Renewables. IEEE Trans. Ind. Inf. 2019, 15, 3254–3266. [Google Scholar] [CrossRef]
- Hu, J.; Yang, G.; Ziras, C.; Kok, K. Aggregator Operation in the Balancing Market Through Network-Constrained Transactive Energy. IEEE Trans. Power Syst. 2019, 34, 4071–4080. [Google Scholar] [CrossRef]
- Fathi, M.; Bevrani, H. Statistical Cooperative Power Dispatching in Interconnected Microgrids. IEEE Trans. Sustain. Energy 2013, 4, 586–593. [Google Scholar] [CrossRef]
- Li, Z.; Guo, Q.; Sun, H.; Wang, J. Sufficient Conditions for Exact Relaxation of Complementarity Constraints for Storage-Concerned Economic Dispatch. IEEE Trans. Power Syst. 2016, 31, 1653–1654. [Google Scholar] [CrossRef]
- Li, Z.; Guo, Q.; Sun, H.; Wang, J. Extended sufficient conditions for exact relaxation of the complementarity constraints in storage-concerned economic dispatch. CSEE J. Power Energy Syst. 2018, 4, 504–512. [Google Scholar] [CrossRef]
- Beck, T.; Kondziella, H.; Huard, G.; Bruckner, T. Assessing the influence of the temporal resolution of electrical load and PV generation profiles on self-consumption and sizing of PV-battery systems. Appl. Energy 2016, 173, 331–342. [Google Scholar] [CrossRef]
- Shao, C.; Wang, X.; Wang, X.; Du, C.; Dang, C.; Liu, S. Cooperative Dispatch of Wind Generation and Electric Vehicles With Battery Storage Capacity Constraints in SCUC. IEEE Trans. Smart Grid 2014, 5, 2219–2226. [Google Scholar] [CrossRef]
- Cortés, A.; Martínez, S. A Hierarchical Algorithm for Vehicle-to-Grid Integration under Line Capacity Constraints. Eur. J. Control. 2019, 47, 53–63. [Google Scholar] [CrossRef]
- Garifi, K.; Baker, K.; Christensen, D.; Touri, B. Control of Energy Storage in Home Energy Management Systems: Non-Simultaneous Charging and Discharging Guarantees. arXiv 2018, arXiv:1805.00100. [Google Scholar]
- Ji, M.; Zhang, P. Transactive control and coordination of multiple integrated energy systems. In Proceedings of the 2017 IEEE Conference on Energy Internet and Energy System Integration (EI2), Beijing, China, 28 November 2017; pp. 1–6. [Google Scholar] [CrossRef]
- Vardakas, J.S.; Zorba, N.; Verikoukis, C.V. A Survey on Demand Response Programs in Smart Grids: Pricing Methods and Optimization Algorithms. IEEE Commun. Surv. Tutor. 2015, 17, 152–178. [Google Scholar] [CrossRef]
- Wang, Z.; Paranjape, R. Optimal Residential Demand Response for Multiple Heterogeneous Homes With Real-Time Price Prediction in a Multiagent Framework. IEEE Trans. Smart Grid 2017, 8, 1173–1184. [Google Scholar] [CrossRef]
- Tewari, S.; Geyer, C.J.; Mohan, N. A Statistical Model for Wind Power Forecast Error and its Application to the Estimation of Penalties in Liberalized Markets. IEEE Trans. Power Syst. 2011, 26, 2031–2039. [Google Scholar] [CrossRef]
- Hippert, H.S.; Pedreira, C.E.; Souza, R.C. Neural networks for short-term load forecasting: A review and evaluation. IEEE Trans. Power Syst. 2001, 16, 44–55. [Google Scholar] [CrossRef]
- Kong, F.; Jiang, J.; Ding, Z.; Hu, J.; Guo, W.; Wang, L. A Personalized Rolling Optimal Charging Schedule for Plug-In Hybrid Electric Vehicle Based on Statistical Energy Demand Analysis and Heuristic Algorithm. Energies 2017, 10, 1333. [Google Scholar] [CrossRef]
- Liu, N.; He, L.; Yu, X.; Ma, L. Multiparty Energy Management for Grid-Connected Microgrids With Heat- and Electricity-Coupled Demand Response. IEEE Trans. Ind. Inform. 2018, 14, 1887–1897. [Google Scholar] [CrossRef]
- Chiang, M.; Low, S.H.; Calderbank, A.R.; Doyle, J.C. Layering as Optimization Decomposition: A Mathematical Theory of Network Architectures. Proc. IEEE 2007, 95, 255–312. [Google Scholar] [CrossRef]
- Ji, M.; Zhang, P.; Cheng, Y. Distributed microgrid energy optimization using transactive control and heuristic strategy. In Proceedings of the 2017 IEEE Power Energy Society General Meeting, Chicago, IL, USA, 16–20 July 2017; pp. 1–5. [Google Scholar] [CrossRef]
- Burden, R.L.; Faires, J.D. Numerical Analysis; Prindle, Weber & Schmidt Publisher: New York, NY, USA, 1985. [Google Scholar]
- PJM. Hourly Real-Time and Day-Ahead LMP. Available online: https://dataminer2.pjm.com/feed/rt_da_monthly_lmps/definition (accessed on 20 December 2018).
- Wang, H.; Ai, Q.; Gan, L.; Zhou, X.; HU, F. Collaborative Optimization of Combined Cooling Heating and PowerSystem Based on Multi-scenario Stochastic Programming and Model Predictive Control. Autom. Electr. Power Syst. 2018, 42, 51–58. (In Chinese) [Google Scholar] [CrossRef]
- Ruf, H. Limitations for the feed-in power of residential photovoltaic systems in Germany—An overview of the regulatory framework. Sol. Energy 2018, 159, 588–600. [Google Scholar] [CrossRef]
- Garau, M.; Celli, G.; Ghiani, E.; Pilo, F.; Corti, S. Evaluation of Smart Grid Communication Technologies with a Co-Simulation Platform. IEEE Wirel. Commun. 2017, 24, 42–49. [Google Scholar] [CrossRef]
- Shao, C.; Ding, Y.; Siano, P.; Lin, Z. A Framework for Incorporating Demand Response of Smart Buildings Into the Integrated Heat and Electricity Energy System. IEEE Trans. Ind. Electron. 2019, 66, 1465–1475. [Google Scholar] [CrossRef]
- Behboodi, S.; Chassin, D.P.; Djilali, N.; Crawford, C. Transactive control of fast-acting demand response based on thermostatic loads in real-time retail electricity markets. Appl. Energy 2018, 210, 1310–1320. [Google Scholar] [CrossRef]
© 2019 by the authors. Licensee MDPI, Basel, Switzerland. This article is an open access article distributed under the terms and conditions of the Creative Commons Attribution (CC BY) license (http://creativecommons.org/licenses/by/4.0/).