Article

Piping-Main Scheme for Condensers against the Adverse Impact of Environmental Conditions on Air-Cooled Thermal Power Units

1
Key Laboratory of Condition Monitoring and Control for Power Plant Equipment (North China Electric Power University), Ministry of Education, Beijing 102206; China
2
School of Energy and Power Engineering, Lanzhou University of Technology, Lanzhou 730050, China
*
Authors to whom correspondence should be addressed.
Energies 2020, 13(1), 170; https://doi.org/10.3390/en13010170
Submission received: 24 October 2019 / Revised: 9 December 2019 / Accepted: 11 December 2019 / Published: 30 December 2019
(This article belongs to the Section I: Energy Fundamentals and Conversion)

Abstract

:
To improve the adaptability of direct air-cooled power generating units to the variations of both meteorological condition and power load, a piping-main arrangement of air-cooled condensers was proposed. The heat and mass transfer models of the air-side were established for the air cooling system of 2 × 600 MW thermal power generating units. The coupled model for both flow resistance loss and condensate flow rate distributions of exhaust steam inside air-cooled condensers were developed based on the temperature fields through numerical simulation. Calculation results, including the condensate flow rate, back pressure, and coal consumption rate, were acquired under different ambient temperatures and wind velocities. The results show that the proposed piping-main arrangement can weaken the ambient wind impacts and reduce the backpressure significantly in summer by adjusting the number of air-cooled condenser cells in operation. The steam flow rate can be uniformed effectively by adjusting the number of operating air-cooled condenser cells during winter. It can also avoid the freezing accident in winter while cooling the exhaust steam of two turbines by part air-cooled condenser cells.

1. Introduction

Air-cooled technology is becoming the main choice of the thermal power generation in the regions rich in coal but short of water such as in north China due to its unique water-saving benefits. The air-cooled condenser (ACC) employs ambient air to condense the in-tube exhaust steam compared with wet cooling. A severe weakness with this cooling way, however, is that the ambient wind and temperature have vast negative influences on the performance of air-cooled units. Besides, the capacity of the thermal power generating units is severely excessive in China [1]. How to avoid the negative influence of ambient conditions and use the existing units efficiently is an urgent problem.
Numerous studies have been conducted for air-cooled systems, both by wind tunnel experiments and numerical simulations, to reveal the air-side flow field. Duvenhage found that crosswinds significantly reduced the air flow rate caused by axial fans [2]. Gu et al. reported that two factors, including wind speed and platform height, affected the performance of ACC, and wind tunnel simulation was a suitable approach to minimize exhaust recirculation [3]. In order to overcome these shortcomings, several approaches, including that of windbreak mesh [4,5], and novel arrangements [6,7], were proposed to improve the efficiency of air-cooled condensers (ACCs) through decreasing the influence of adverse wind. Some studies involved the flow condensation inside the tube bundles of ACC, including steam condensation in narrow channel vertical tube condensers, and steam flow distributions. Chernysheva et al. [8] investigated the heat transfer properties of steam in channels through experiments. Dehbi et al. [9] established a model which can predict the flow characteristics of mixtures in a vertical tube. Datta et al. [10] proposed a finite-difference model which could predict the flow distributions in both parallel and reverse manifold systems. As for condensation in ACCs, Zhao et al. [11] analyzed the process of condensation and summarized the factors which affect the condensation capacity of the ACC. Deng et al. [12] and Kekaula et al. [13] focused on the flow of reflux and inclined tube condensation in ACC, respectively. Deng et al. [14] also developed a numerical model combining the vapor inside tube and cooling air outside the tube to predict the thermal-hydraulic characteristic of ACCs. Berrichon et al. conducted experimental studies on adiabatic and condensate flow [15]. Besides, studies considering their coupling effect of air side and steam side can be seen more and more in recent years. William et al. proposed a numerical model to calculate steam condensation in ACC which showed good agreement in capacity and void fraction [16]. Cheng et al. proposed the condense theory model which combined the condensate pool model and air-cooled boundary condition [17]. Owen et al. [18] presented a numerical simulation method to investigate the steam flow distribution in ACCs, which was a good combination of air side and steam side of ACC.
Unfortunately, from the literature review, the majority of studies concerning ACCs focused on air-side performance. It means a substantial lack of the coupling effect of the air side and steam side involving in pipeline pressure loss. Besides, very few of the mentioned studies are concerning the effect of extreme meteorological condition as well as the frequent peak shaving operation. It is the critical issue to overcome the ACCs’ drawback caused by the meteorological condition as well as the frequent peak shaving operation and improve the adaptability of large scale air-cooled thermal power units, as well as the efficiency of the existing power generating units under off-design conditions.
In this paper, a novel arrangement of ACCs is established with the analytical model coupled with both air-side and steam-side thermo-fluid performances concerning pipeline loss and validated through the design conditions. The corresponding operation strategies are made to assure the steam turbines operating efficiently under the different meteorological condition as well as different output load, that is, operating under low back pressure in summer and operating above choked back pressure in winter.

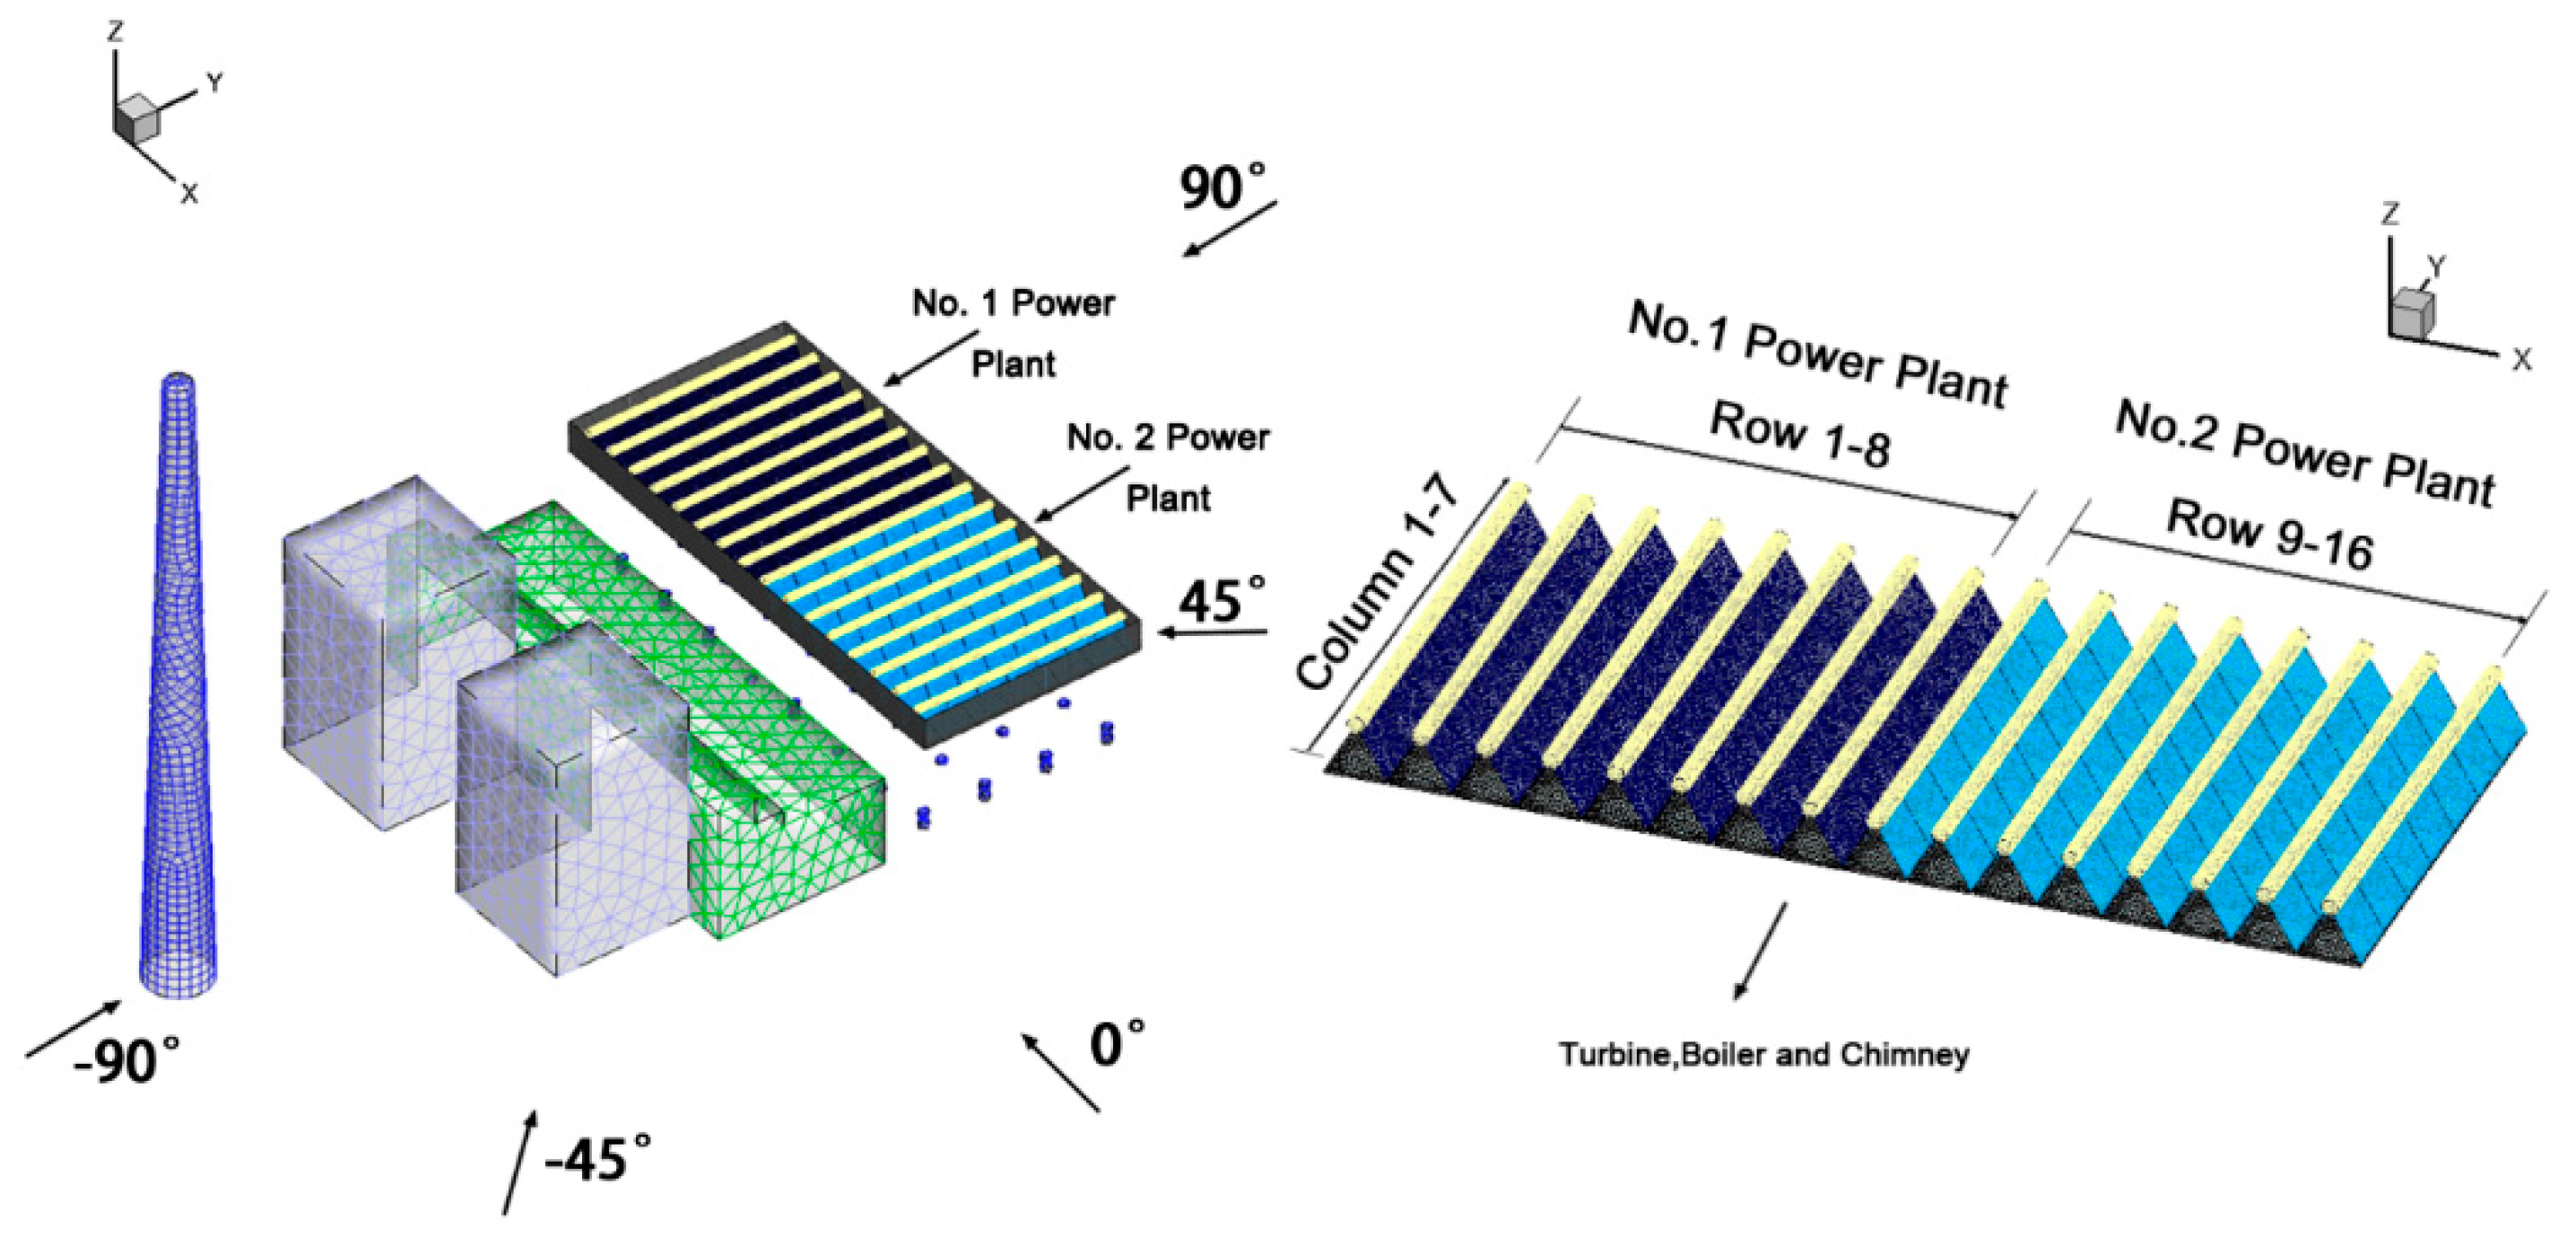
2. Physical and Mathematical Model of the Piping-Main Arrangement of Air-Cooled System

As shown in Figure 1, there are 56 ACC cells for each power generating unit, divided into eight rows with seven cells in each row.
Columns 2 and 6 correspond to countercurrent cells. The remaining columns are downstream cells. The total fin heat transfer area is 1,750,684 m2. The downstream and countercurrent heat transfer area ratio is 9. In the original design, the ACCs of rows 1–8 belong to the number one power generating unit, and those of rows 9–16 belong to the number two power generating unit.
The details of the piping-main arrangement air-cooled system are shown in Figure 2. The steam is elicited by two main exhaust pipes with a diameter of 6 m, and goes into the exhaust steam header firstly. Then, the exhaust steam goes into the vertical upward steam distribution pipelines, which use a “Y” type branch arrangement with diameters of 3, 2.1 and 1.5 m, successively. Each steam distribution tube is connected with three segments of the horizontal shrinking distribution tubes, respectively.
During the practical operation, the number of rows put into operation is controlled by the valves based on the unit output and the ambient conditions. The face velocity in different areas varies significantly due to the large number of fans operating together, which leads to a varying heat transfer capacity. The face velocity of each ACC cell can be obtained through simulation.
The mathematical model involves the resistance loss along the steam flow path, the condensate steam flow rate and the coupling algorithm of airside fields and steam side fields. The resistance loss contains that in the exhaust pipes and ACC cells. The effectiveness-number of transfer unit(ε-NTU) method is used to calculate the heat transfer in ACC cells. The coupling algorithm is programmed in the Matlab software platform (MathWorks, Natick, MA, USA).

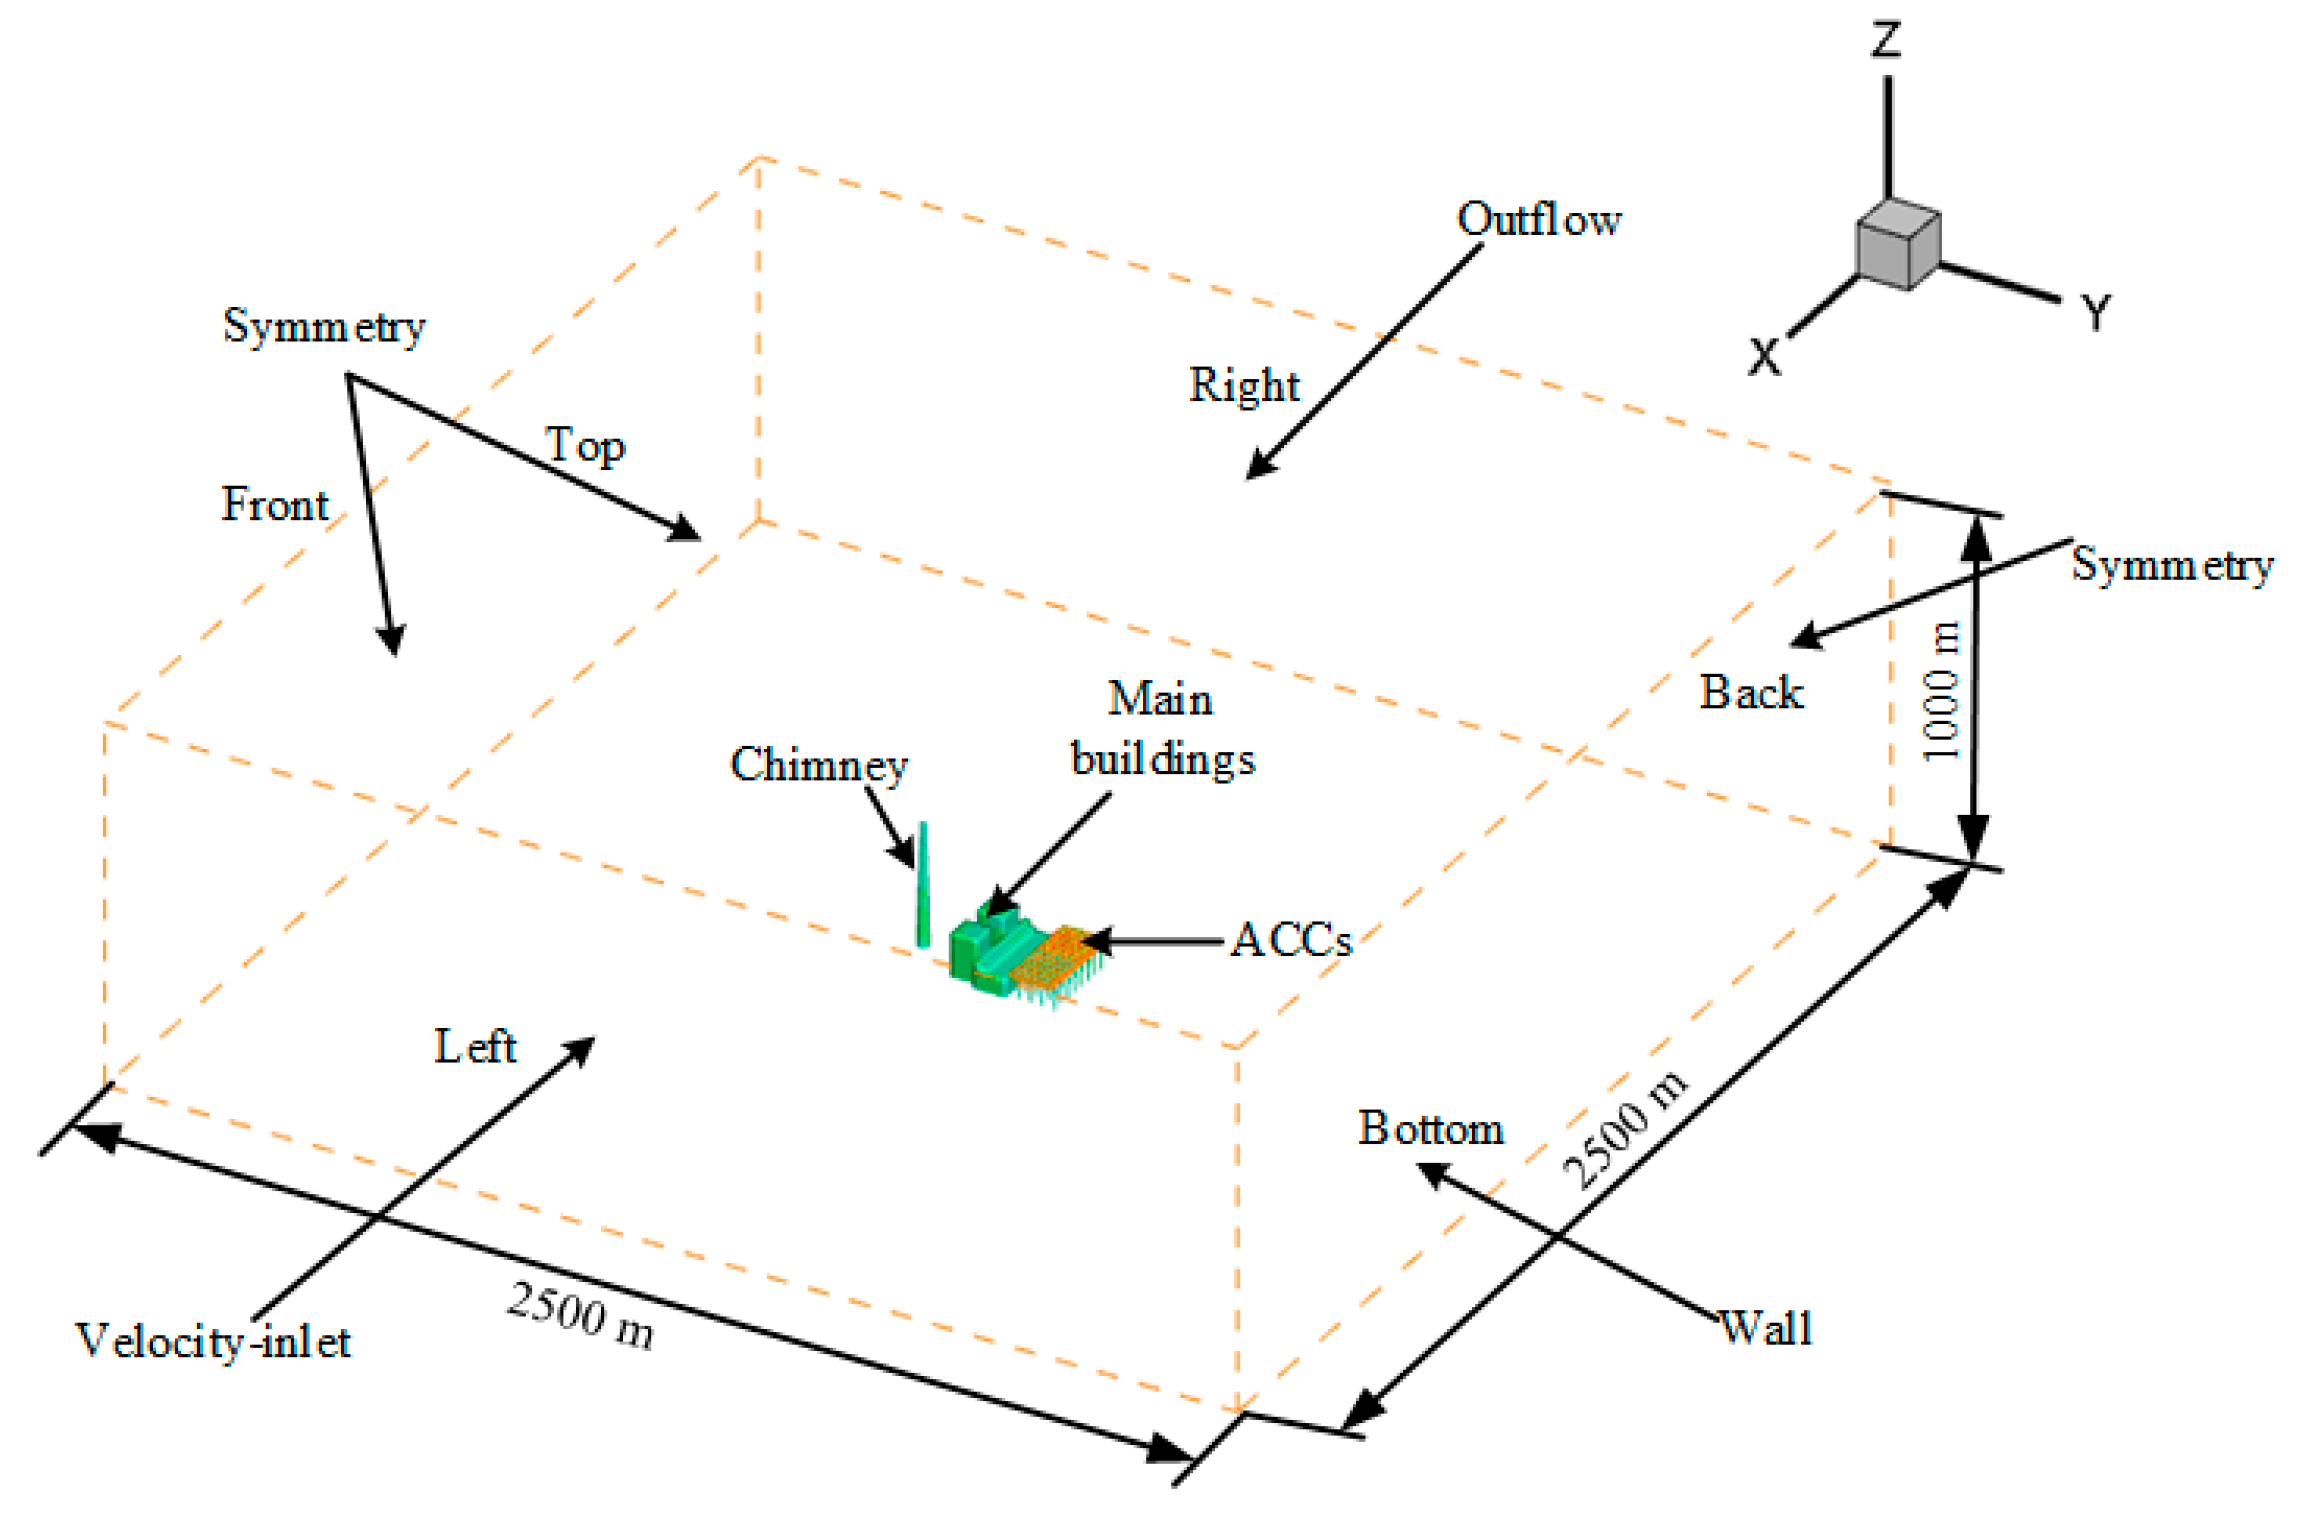
2.1. Exterior Air Flow Field

The mathematical model of its air-side thermo-fluid performance is established, referring to a previous study [19]. We use ANSYS FLUENT 18.0 (ANSYS, Pittsburgh, PA, USA) to model the exterior air flow field.
The radiator is infinitely thin. It is assumed that the pressure drop across the radiator is a function of face velocity. The loss coefficient is determined based on empirical data. In the current work, the radiator model with the lumped parameters is chosen to predict the flow and heat transfer characteristic of ACCs. The details are described as follows.
The pressure drop across the radiator and heat transfer coefficient are determined by the face velocity. The pressure drop, Δpa is [4,20]:
Δ p a = K a 1 2 ρ a u f 2
where ρa refers to the air density, uf refers to the face velocity. Ka is the loss coefficient of air, obtained by a polynomial function:
K a = n = 1 N r n u f n 1
where N is set to be 3, and the corresponding values of rn are r1 = 71.689, r2 = −31.707, r3 = 4.798.
Besides, the fan pressure rise is a function of the air velocity through the fan. Ignoring the flow characteristics inside fans, the pressure rise, Δpa, of a fan is given by:
Δ p a = n = 1 N f n u f n 1
where fn is obtained from the performance curve of the typical fan.
The conservation equations are based on [6]. The realizable k-ε model is chosen to describe the turbulent air flow in the exterior field. The second-order upwind scheme is chosen to discrete the equations. We use the SIMPLE algorithm to solve the equations. The residuals of all the variables are set to 10−5.
Figure 3 shows the computational domains of the present objective 2 × 600 MW air-cooled power generating unit under ambient winds with dimensions of 2500 m × 2500 m × 1000 m (x × y × z). We set the windward surface as the velocity-inlet, with 3, 6 and 9 m/s wind velocity respectively, and set the leeward surface as the outflow region. The other three planes are appointed as symmetry boundaries. The solid walls are appointed as adiabatic wall boundaries.
Meshes are created in the simulation domain consisting of a middle block and surrounding blocks. Tetrahedral unstructured grids are used in the middle block made up of the main building and ACCs. Structed grids are meshed in the surrounding blocks, the air-cooled condensers with adjacent zones are meshed tiny enough to accurately predict their air flow field. The grids of the remaining part are gradually increased to save computational resources. In the exterior air flow field, the grid size is set to 0.5 m for the fans and heat exchanger surface, while the grid size is set to 5 m for the main buildings and support structure surfaces. This division method can ensure the simulation accuracy, as well as the minimum computing resources after several tests.
Grids consisting of about 1,200,000, 2,125,000 and 3,100,000 cells, respectively, are calculated at 6 m/s wind velocity. Both the volume flow rate and the inlet air temperature vary by only about 0.9%, so the final grid number is set to 2,125,000.

2.2. Interior Exhaust Steam Flow Field

The physical model of the interior exhaust steam flow, including steam pipeline and ACC cells is shown in Figure 2. The effectiveness-NTU method (ε-NTU) is used for calculation in the different ACC cells. The resistance loss in pipelines and in finned tubes, as well as the conduction heat loss of pipelines are considered to make the results more accurate.

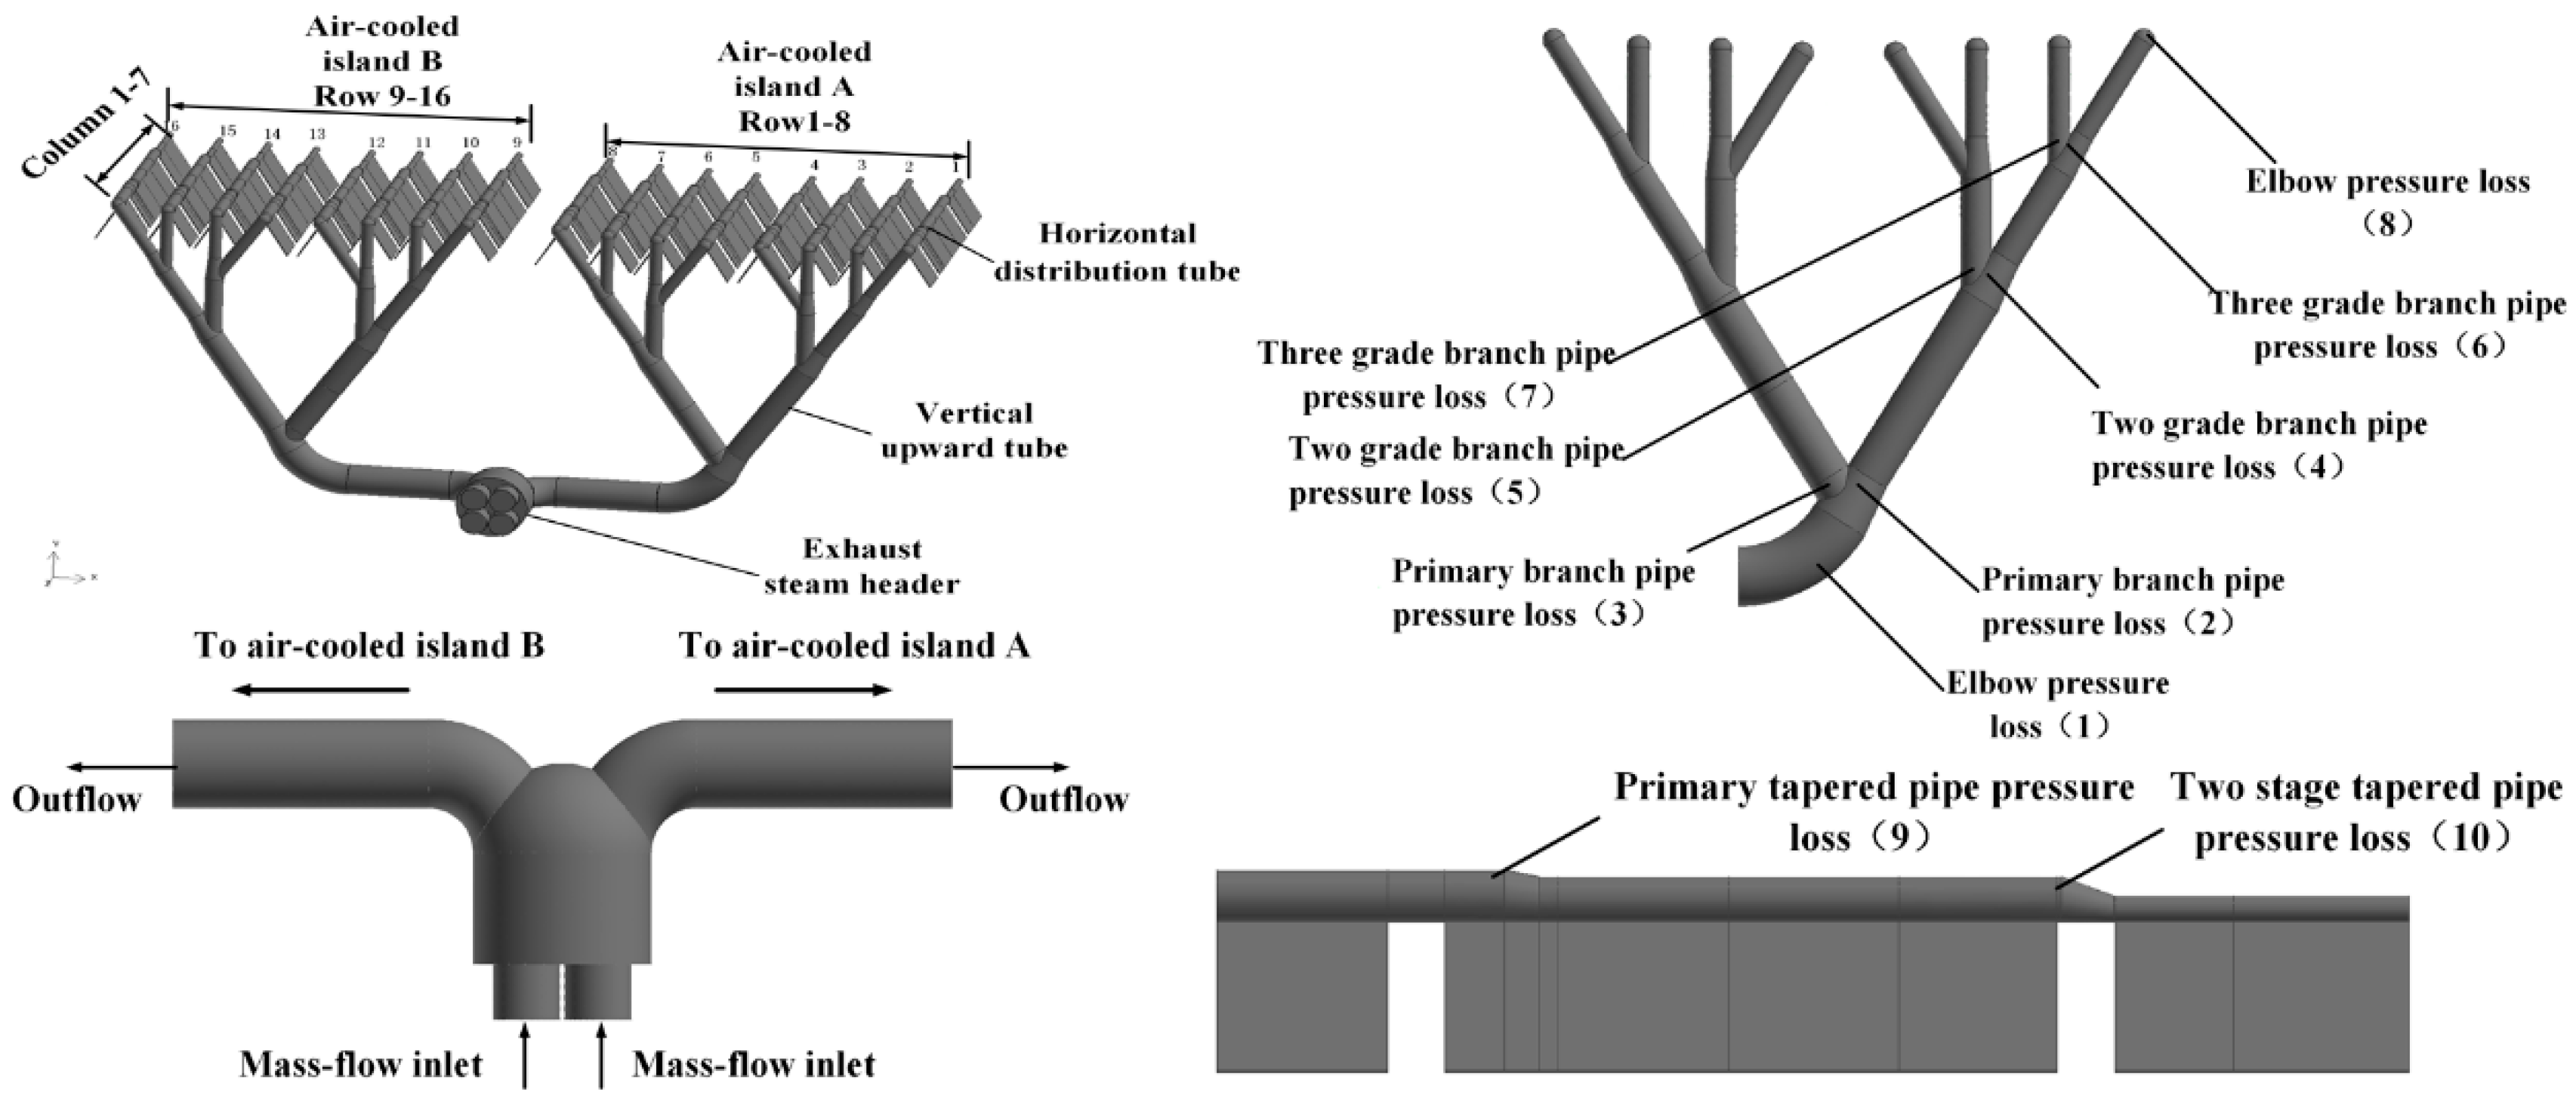
2.2.1. Resistance Loss in Exhaust Pipes

The on-way resistance of exhaust steam flow along the pipelines in the piping-main system can be divided into two parts: frictional loss and local resistance loss, including that of the exhaust steam header and the local resistance loss shown in Figure 2.
The frictional resistance loss ∆pfr is defined as:
Δ p f r = ρ s K s l d v 2 2
where l is pipe length, d is the hydraulic radius. Ks refers to loss coefficient of steam, which depends on fluid properties, pipeline roughness, flow velocity, and hydrodynamics.
Haaland et al. [21] proposed the definition of the two kinds of circular tubes loss coefficient. When e/d < 10−4, the formula of the friction resistance coefficient is:
K s = 2.77776 [ l o g { ( 7.7 Re ) 3 + ( e d 3.75 ) 3.333 } ] 2
When e/d > 10−4, the formula of the friction resistance coefficient is:
K s = 0.30864 [ l o g { ( 6.9 Re ) 3 + ( e d 3.7 ) 1.11 } ] 2
where e is the surface roughness, and Re refers to the Reynolds number.
The local resistance loss ∆plo is defined as:
Δ p l o = ρ s ξ v 2 2
where ξ is the local resistance coefficient.
The values of the local resistance coefficient [22] of the ten parts shown in Figure 2 are listed in Table 1.

2.2.2. Resistance Loss in the Finned Tube Bundles of ACC Cell

Zipel et al. [23] declared that a resistance, ∆ptotdc, exists in all the process, which includes the steam entering the finned tube bundles from the horizontal distribution pipes, ∆ptoti, condensed into saturated water, ∆ptotcon, and entering the condensate tank, ∆ptoto:
Δ p t o t d c = Δ p t o t i + Δ p t o t c o n + Δ p t o t o
Δ p t o t i = K i 1 2 ρ s v l i 2 = p h d p l i + 1 2 ρ s ( α e d v h d 2 v l i 2 )
Δ p t o t c o n = K c o n 1 2 ρ s v l i 2 = p l i p l o + 1 2 ρ s ( v l i 2 v l o 2 )
Δ p t o t o = K o 1 2 ρ s v l o 2 = p l o p h c + 1 2 ρ s ( v l o 2 α e c v h c 2 )
p h d p h c = [ ( K i α e d v h d 2 v l i 2 ) + K c o n ] 1 2 ρ s v l i 2 + ( K o + α e c v h c 2 v l o 2 ) 1 2 ρ s v l o 2
where ρs is the density of steam. Ki, Kcon, and Ko are called the reduced inlet, condensed, and outlet loss coefficients, respectively. vhd and vli are the mean header and lateral flow velocity in the indicated direction, respectively, vlo and vhc are the outlet lateral and header flow velocity in the indicated direction. αed and αec are the energy correction factor of diving and combining header, respectively. phd and pli are the mean header and lateral steam pressure, respectively. plo and phc are the outlet lateral and header steam pressure, respectively.
Above all, the resistance loss from the steam turbine outlet to the condenser cell in row i and column j, Δpij, is:
Δ p i j = Δ p f r + Δ p l o + Δ p t o t d c ( 1 i 16 , 1 j 7 )
The steam pressure in condenser cell in row i and column j is:
p i j = p s 0 Δ p i j ( 1 i 16 , 1 j 7 )
where ps0 is steam pressure of low-pressure (LP) cylinder outlet. The saturation temperature, tn, can be calculated by the corresponding saturation pressure, pij.

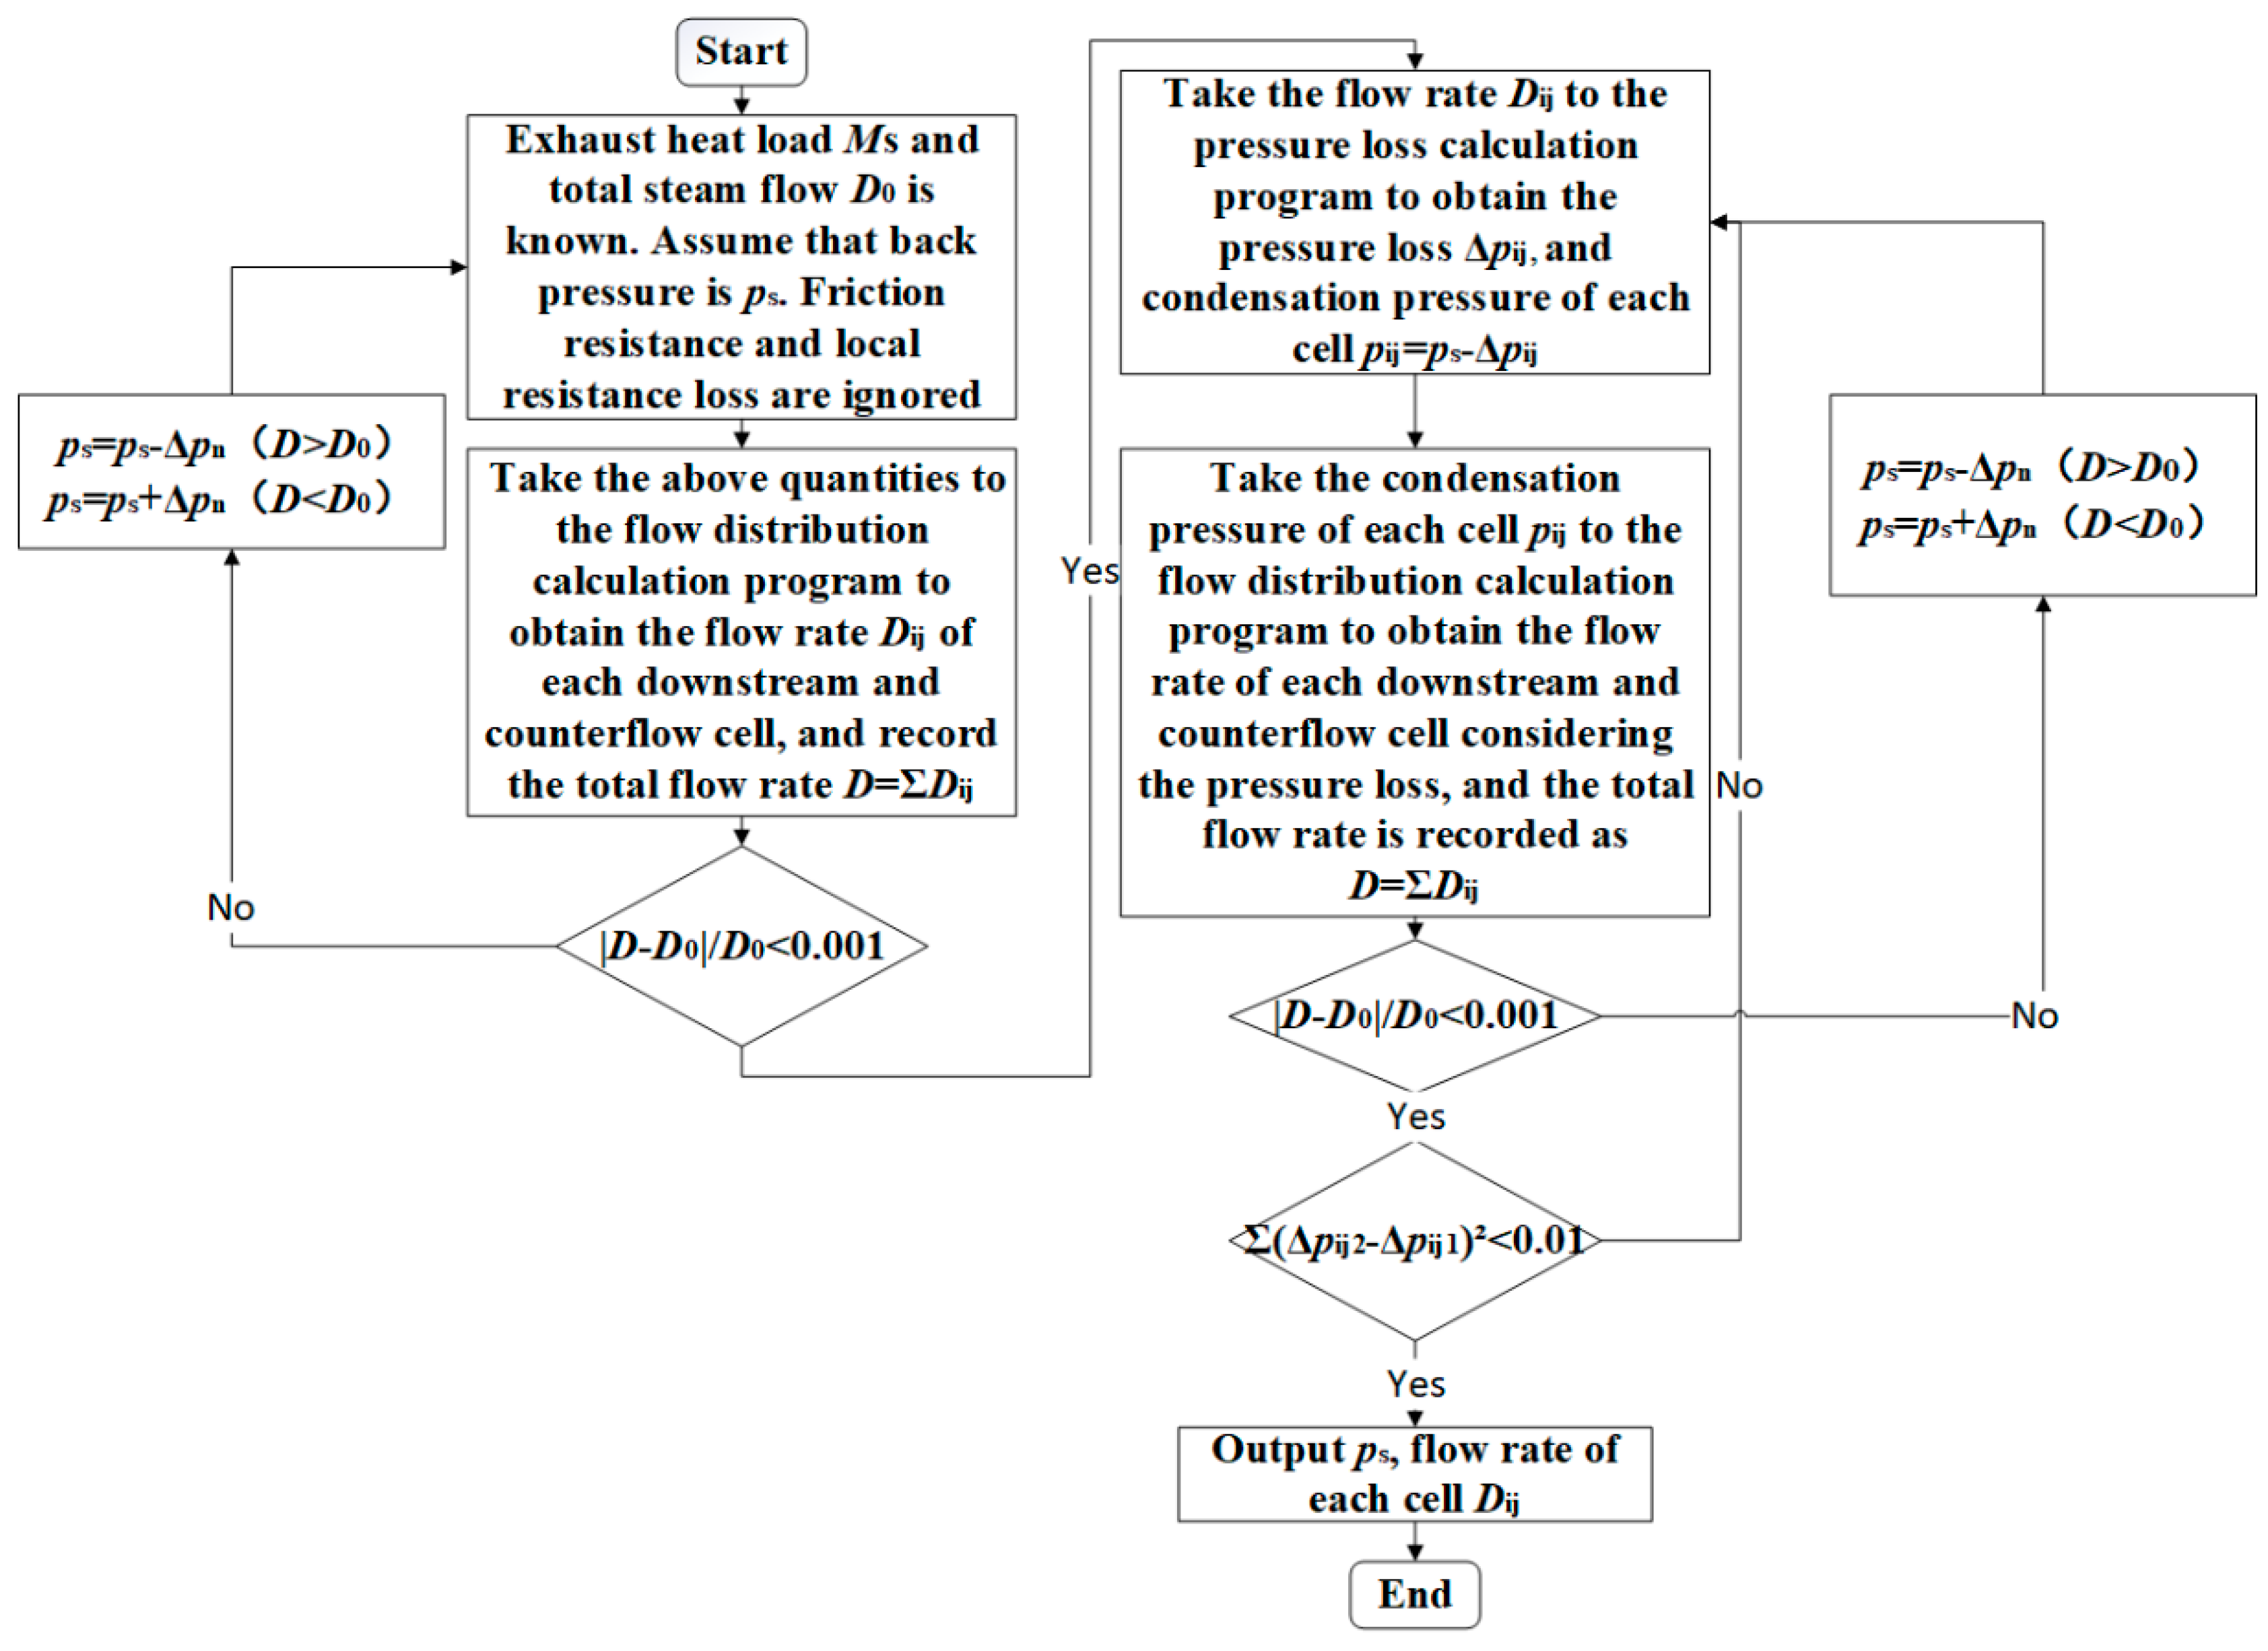
2.2.3. Steam Flow Distribution of ACC Cells Based on the ε-NTU Method

The effectiveness-NTU method (ε-NTU) is used to describe the steam condensation inside ACC cells [24]. For the condensation of saturated vapor, the effectiveness of a downstream ACCcell, εd, and a counter-current ACC cell, εc is defined as:
ε d , c = Δ t a I T D = t a 2 t a 1 t n t a 1
and can be obtained by:
ε d , c = 1 e N T U d , c
in which, the NTU of downstream and countercurrent ACC cells is defined as:
N T U d = H a A f d A y d u f C p ρ a
where ta1 refers to the inlet temperature of the downstream condenser, tn refers to the condensation temperature in an ACC. ta2 is the air side outlet temperature. Ha is the air-side heat transfer coefficient, Afd is the downstream finned tube bundle area, Ayd is the windward area of the downstream finned tube bundles, Cp is the specific heat of air at constant pressure, uf is the face velocity perpendicular to radiator, ρa is the density of air. Afa refers to the heat transfer area of the countercurrent finned tube bundles, Aya refers to the windward area of the countercurrent finned tube bundles.
The condensate flow rate in downstream ACC cell is:
D d = ( t n t a 1 ) A f d u f ρ a C p ε d h l v
where hlv refers to the latent heat of steam, tn refers to the saturation temperature of steam, ta1 refers to the inlet air temperature.
The correlation between the heat transfer coefficient and wind speeds is obtained [25]:
N u = 0.105 Re 0.71
Re = u f d 0 υ
N u = K d 0 λ a
where d0 is the characteristic dimensions of the air-side finned tube, υ refers to air dynamic viscosity, λa refers to the thermal conductivity of air.
For the ACC cells selected in this study, the windward area of each downstream ACC cell is 114.15 m2, the heat transfer area is 14,068 m2, the windward area of each countercurrent ACC is 44.39 m2, corresponding to a 5470.89 m2 heat transfer area. The effectiveness of the downstream ACC cells, εd, as well as the countercurrent ACC cells, εc, is obtained with the parameters of the downstream NTUd and NTUc by using Equation (16) and Equation (17) respectively, while the condensed steam flow rates both of the downstream and counter-current ACC cells can be obtained by Equation (18).

2.3. Combination of the Exterior and Interior Flow Fields

The air-side fluid flow of air-cooled system depends on the forced convection caused by the axial flow fans, the ambient wind as well as the steam heat transfer. To simply the model, the impact of steam heat transfer on exterior flow field is ignored. The calculation process is shown in Figure 4.
Step 1. Ignoring the impact of the interior flow field, for the specific operating condition, saturation pressure of ACC cell, ps, is assumed, the saturation temperature tn is obtained based on ps. The condensate flow rate and heat load of each ACC cell can be calculated. The total condensate flow rate D0 and total heat load Ms can be calculated by summing up all ACC cells together.
Step 2. Taking ps, Ms and D0 as the input of the flow distribution calculating program, the exhaust heat load of each ACC cell, Mij, and the mass flow rate of ACC cell, Dij, is acquired, which should satisfy the following relation:
| D 0 i = 1 8 j = 1 7 D i j | D 0 0.01
| M 0 i = 1 8 j = 1 7 M i j | M 0 0.01
Otherwise, a new ps is selected as the alternative input to the program until the above condition is achieved.
Step 3. Consider the impact of the interior flow field. Take Dij as the input of steam resistance program, and the resistance loss of each ACC cell, Δpij, can be obtained. Then the saturation pressure of each ACC cell is obtained by;
p i j = p s Δ p i j
Take the last acquired pij, D0, and M0 as the input of the steam flow calculating program. When Equations (22) and (23) are satisfied, and the resistance loss of each ACC cell remains constant, the backpressure of steam turbine, ps, as well as the condensed steam flow rate, Dij, in each cell can be finally obtained.

2.4. Coal Consumption Rate of the Power Generating Unit

The economics of power generating unit can be expressed by the coal consumption rate, which can be obtained by:
b c p = q 0 q 1 η b η p
in which, the term q0 is defined by:
q 0 = Q 0 P e η m g
Q 0 = ( D f w D b l ) ( h 0 h w l ) + D r h ( h r h ( b ) o h r h ) + D a p ( h ) ( h b h r h ) + D a p ( i ) ( h b h 4 ) + D b o ( h b h 0 ) + D r h ( c ) ( h b h r h ) + D b l ( h b h r h )
where ηb is the efficiency of the boiler and ηp is the efficiency of pipelines, q0 is the heat rate, q1 is the lower heating value of standard coal, Q0 is the heat consumption, Pe is the steam turbine power, ηmg is the efficiency of the generator.
The specific calculation is related to the principle thermal system of power plant and achieved through the software Matlab.

2.5. Model Validation

An indirect verification is conducted by comparing the model predictions of the practical values of the real units. Five operating conditions for a 600 MW air-cooled unit were used for the model verification, as listed in Table 2 These operating states are the common steam turbine conditions given by the instruction, which contain different ambient temperature, ranging from 5 °C to 33 °C, and different backpressure, ranging from 8 kPa to 29 kPa. The simulation results are in good agreement with the design data, implying that the model predicted results are acceptable.

3. Results

The present piping-main air-cooled system can adjust the number of ACC cells in operation according to the ambient conditions and the output load of the units to guarantee uniform distribution of the steam flow rate and optimal backpressure. The steam flow rate is assumed constant. The output load, plant efficiency and coal consumption are changed with backpressure. The backpressure, as well as the backpressure impact on the coal consumption rate are quantified in this paper. The actual air-cooled power plant operates in a wide range of temperature, which may reach 30 °C in summer and reach −15 °C in winter. Thus, the following discussions will mainly take the 30 °C and −15 °C as typical summer and winter conditions.

3.1. The Operation Strategy of the Piping-Main Air-Cooled System in Summer

The following discussion assumes that only one single power generating unit puts into operation in summer. The exhaust steam flow rate is 1217.5 ton/h, the average ambient temperature in summer is 30 °C.

3.1.1. Analysis with Ambient Winds

A total of 12 operation conditions are selected as representation, including different ambient winds with the speed of 0, 3, 6 and 9 m/s, and the operation strategies, with rows 1–8, 1–12 and 1–16 in operation, as shown in Figure 5.
Figure 5 shows the steam flow rate of different rows under different operating strategies and ambient winds. Without ambient wind, the flow rate of maximum and minimum row is 40.18 kg/s in the 5th row and 32.42 kg/s in the first row when row 1–8 ACC cells are into operation. The difference is 7.76 kg/s.
The maximum and minimum flow rate become 42.62 kg/s in the 6th row and 24.08 kg/s in the windward row, respectively, when the ambient wind is 3 m/s, and the difference is increased to 18.54 kg/s. When the ambient wind increases to 9 m/s, the flow rate of a maximum and minimum row are 62.47 kg/s in the 6th row and 14.88 kg/s in the windward row. The difference between the maximum and minimum is 47.59 kg/s. As the wind velocity increases, there is an upward trend in flow rate gap, and the inhomogeneity of the steam flow distribution becomes serious. To be more exact, the flow rate in windward ACC cells is shallow, while on the leeward side it is massive. The ambient wind affects the operation of axial fans and leads to a small air flow rate on the windward ACC cells [20], the amount of steam condensed in those cells decreases due to the small air flow rate. Overall, the increasing ambient wind deteriorates the uniform distribution of steam.
However, this non-uniform distribution can be enhanced by adding more ACC cells. When adding four rows of ACC cells in operation (namely rows 1–12), the flow rate gap decreases significantly. When we continue to add ACC cells to rows 1–16 in operation, the flow rate gap between the maximum and minimum row reaches 12.02 kg/s at 3 m/s, 16.96 kg/s at 6 m/s and 20.24 kg/s at 9 m/s. The piping-main arrangement of the air-cooled system can adjust the ACC cells flexibly, and therefore, it can greatly reduce the influence of the ambient wind.
In order to clarify the factors affecting backpressure and coal consumption, 27 operating conditions including ambient wind speeds of 3, 6 and 9 m/s, and rows 1–8 to 1–16 of cells in operation are calculated. The back pressure and the coal consumption rate of all the conditions are illustrated in Figure 6.
The operation strategies have relatively little influence on the backpressure under the ambient wind speed of 3 m/s as seen in Figure 6. The backpressure is 11.5 kPa, and the coal consumption rate is 338.46 g/kWh, corresponding to rows 1–16 in operation, while these values are 24.9 kPa and 352.58 g/kWh corresponding to rows 1–8 in operation.
As shown in Table 3, with the ambient windincreasing, the backpressure has an upward trend. When the ambient wind increases to 6 m/s, the back pressure and coal consumption rate are 12.85 kPa and 340.80 g/kWh (rows 1–16), 35.2 kPa and 361.96 g/kWh (rows 1–8), respectively. When the ambient wind speed increases to 9 m/s, the backpressure increases significantly. The maximum (rows 1–8) and the minimum backpressure (rows 1–16) are 53.7 kPa and 16.12 kPa, corresponding to 375.10 g/kWh and 345.92 g/kWh of coal consumption rate, respectively.
In conclusion, the ambient wind has a considerable impact on the backpressure, changing from 24.9 kPa to 53.7 kPa when rows 1–8 are in operation. However, when the rows 1–16 ACC cells are put into operation, this effect decreases significantly from 11.5 kPa to 16.2 kPa, which indicates that increasing the number of ACC cells can well offset the ambient wind influence, and has a positive effect on the operation of units.
By the way, it is hazardous if the backpressure reaches 53.7 kPa. At this time, the backpressure of the steam turbine can be reduced to 42.2 kPa by adding a set of ACC cells, and this value will reach 34.1 kPa by adding two sets of ACC cells. The decrease in backpressure is pronounced.

3.1.2. Optimal Operation Strategy of the Air-Cooled System Affected by Ambient Wind

The ambient wind can significantly affect the windward side ACCs, which seriously influences the system economy. The middle part can be given priority due to the lesser influence of the ambient wind. In order to give full play to the flexibility of the piping-main arrangement air-cooled system, the optimal operation strategy is established. Five operation strategies are proposed to explore the characteristics of the air-cooled system under different ambient wind, which includes rows 5–12, 4–13, 3–14, 2–15, 1–16 of ACC cells in operation. Besides, five different ambient temperatures are investigated. The influences of both operation strategies and ambient temperature on the backpressure and coal consumption rate are illustrated in Figure 7.
The proposed operation strategy further enhanced the ACC performance. For example, when the ambient temperature is 30 °C, the ambient wind speed is 9 m/s, and rows 1–8 ACC cells are put into operation, the backpressure is 53.7 kPa, corresponding to 375.10 g/kWh of coal consumption rate. When it is changed to rows 5-12 ACC cells, the backpressure of the steam turbine reduces to 46.25 kPa, corresponding to 370.22 g/kWh of coal consumption rate. The improvement is especially apparent.

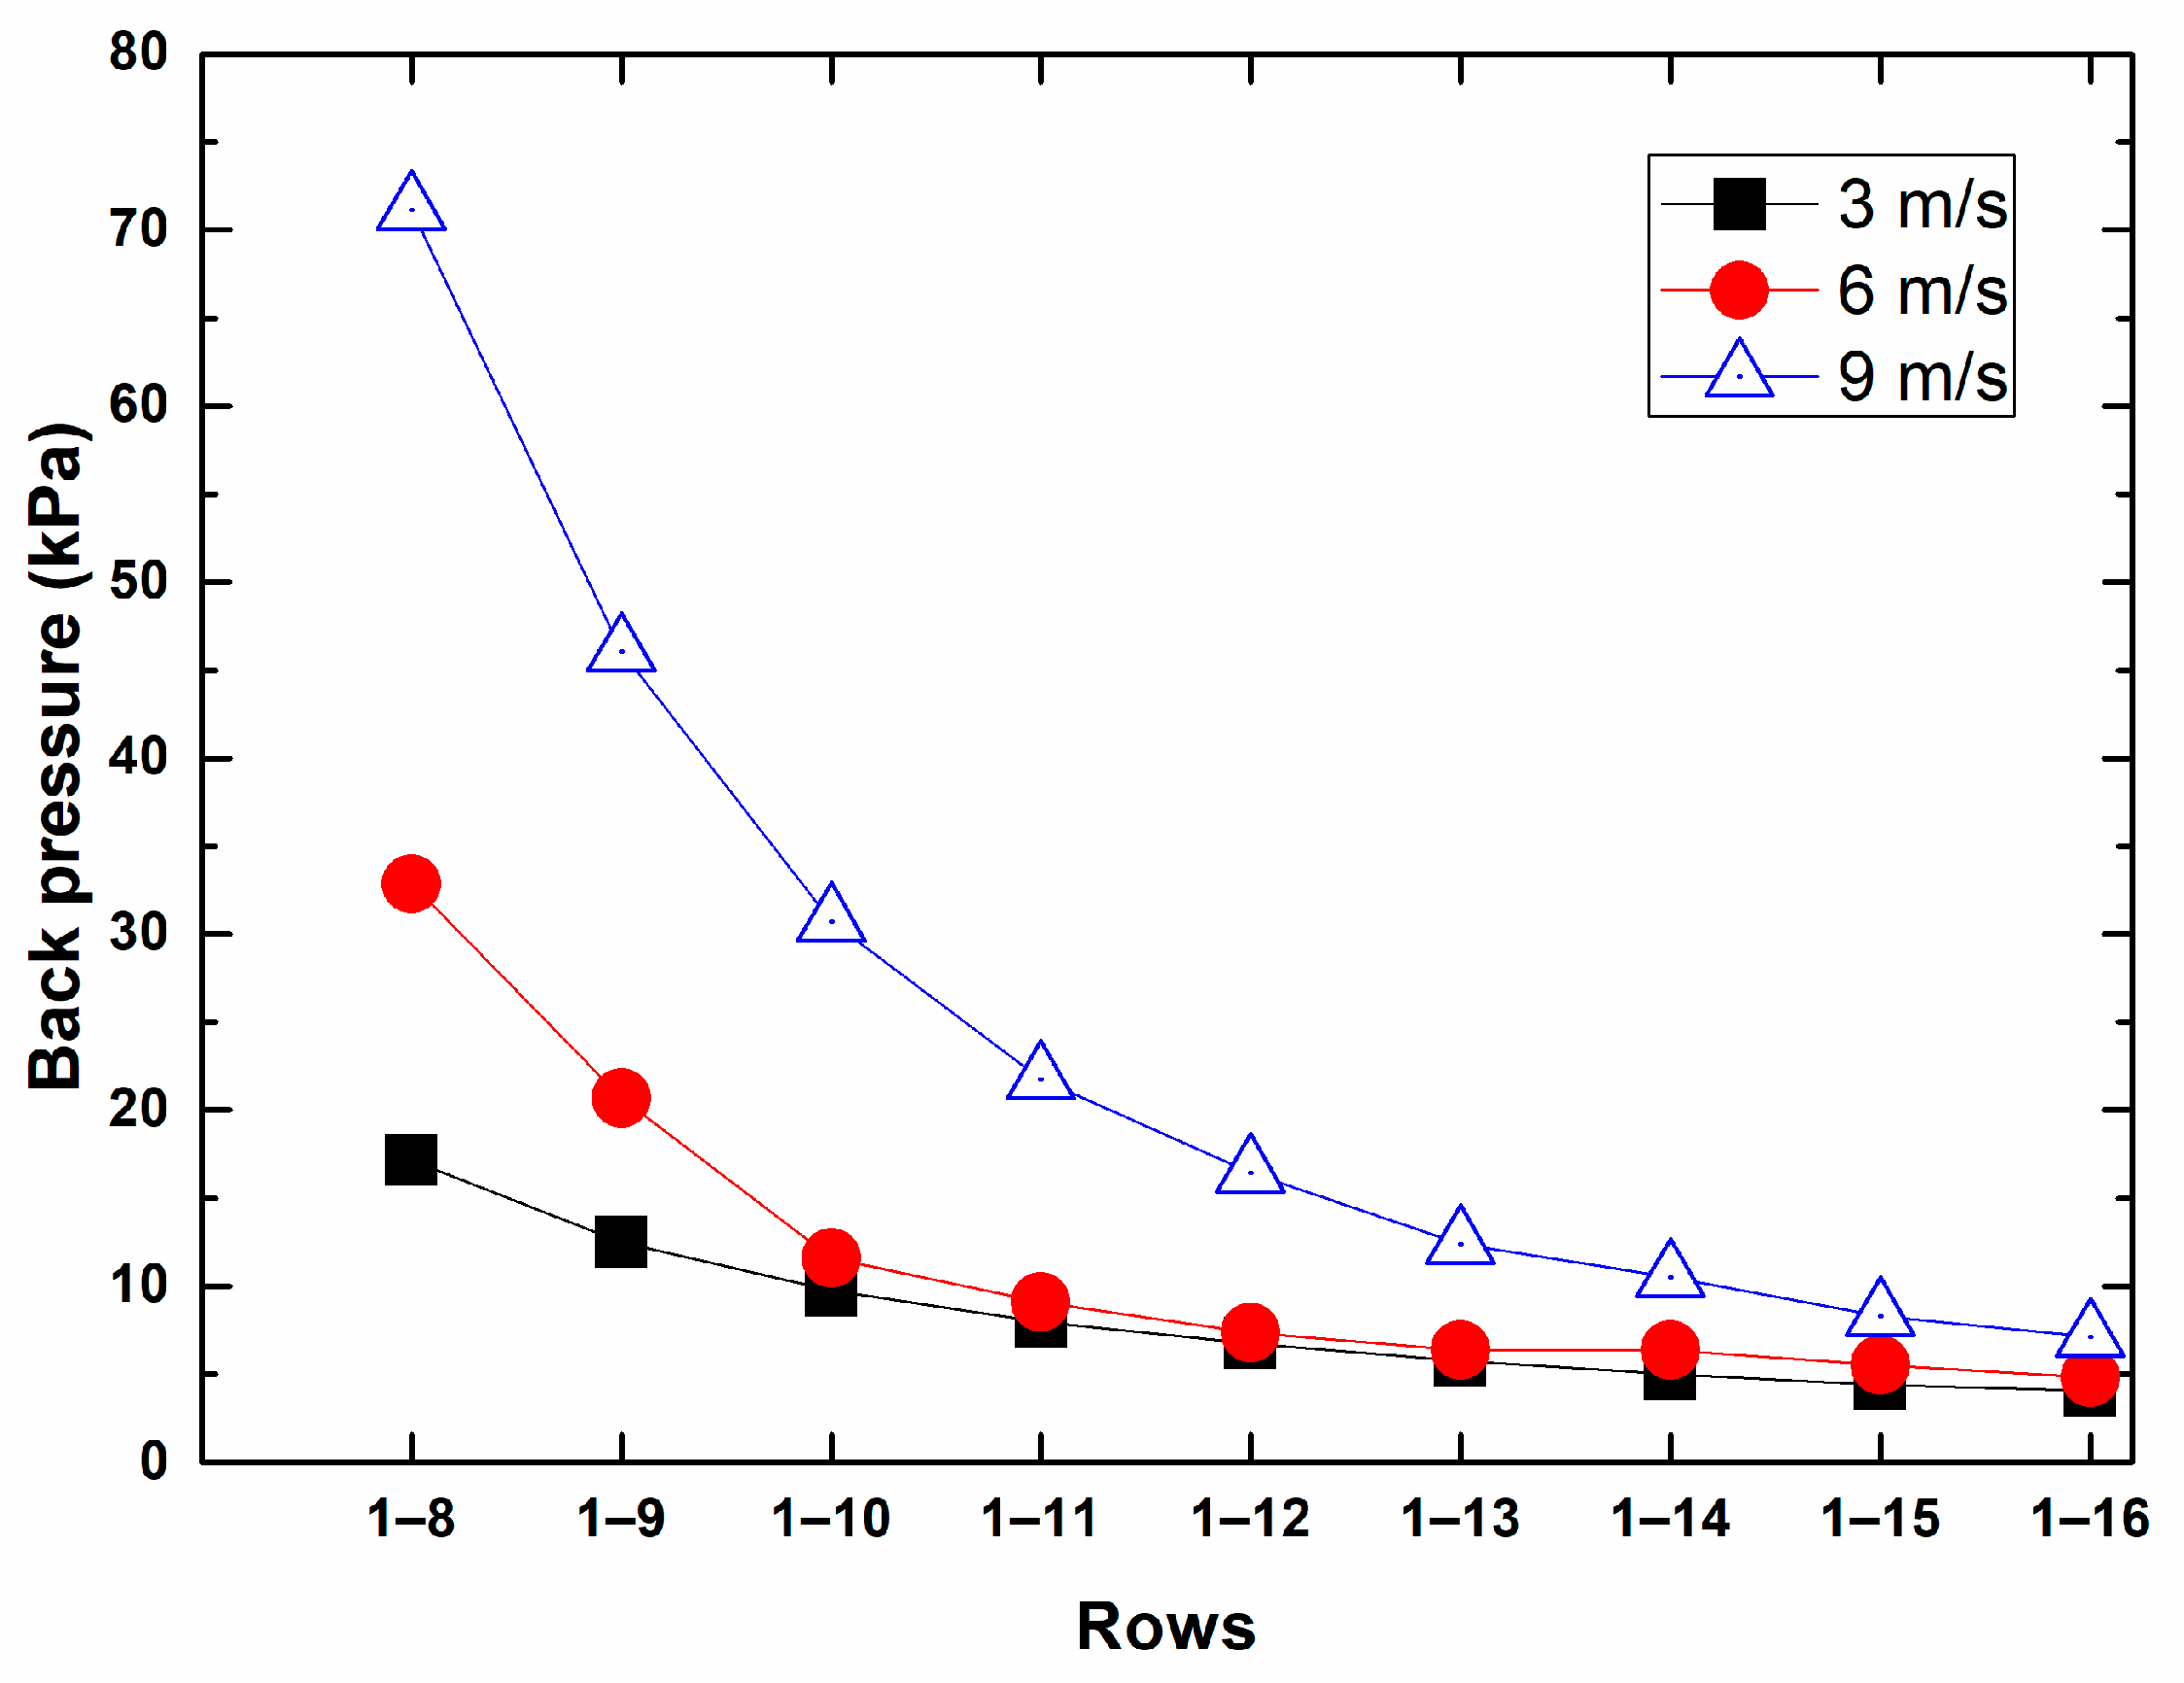
3.2. The Operation Conditions in Winter

For the winter operating conditions, it is assumed that the two power generating units are operating at full power load, which can prevent freezing. The steam flow rate is 2435.14 ton/h. The ambient temperature is set to −15 °C. The operating characteristics of 27 different working conditions are selected for analysis.
The nonuniformity distribution of flow rate becomes serious due to the increase of ambient wind in Figure 8. The maximum flow rate ranges from 84.90 kg/s (3 m/s) to 115.98 kg/s (9 m/s), while the minimum flow rate ranges from 48.60 kg/s (3 m/s) to 29.67 kg/s (9 m/s) when the rows 1–8 ACC cells are in operation. The uneven distribution seriously affects the economic operation of the air-cooled system, and this is occurring due to two reasons: firstly, the small air flow zone (the windward row) suffers from a lower heat exchange capacity which means a higher back pressure is needed to cool down the steam. Secondly, the normal air flow zone without ambient wind affects will burden the condensation of a large amount of steam corresponding higher pipeline pressure loss, and this will also improve the backpressure.
As the number of operating air-cooled rows is increased, the uneven distribution is reduced to a certain extent compared with the latter ones. This occurs because the steam is distributed to the newly added ACC cells, resulting in less condensed steam per unit area and reduced steam saturation pressure. The difference between the maximum and minimum flow rate ranges from 36.3 kg/s (rows 1–8) to 22.64 kg/s (rows 1–12), and finally to 20.31 kg/s (rows 1–16) under 3 m/s ambient wind. When the wind speed is 9 m/s, the difference between the maximum and minimum flow rate ranges from 86.91 kg/s (rows 1–8) to 59.09 kg/s (rows 1–12), and finally to 39.07 kg/s (rows 1–16). This indicates that the proposed system can effectively provide uniform flow rates under different wind velocity conditions in winter.
Twenty seven (27) sets of operating conditions including when the ambient wind speed is 3, 6 and 9 m/s and rows 1–8 to 1–16 of ACC cells are in operation at −15 °C are examined (Table 4). The back pressures of all the conditions are obtained and analyzed. The results are illustrated in Figure 9.
When the wind speed reaches to 3 m/s, the backpressure decreases more slowly with the increasing number of rows of ACC cells. When the ambient wind reaches 6 m/s, the backpressure corresponding to rows 1–8 ACC cells in operation is 32.85 kPa. This data reaches 71.15 kPa when the wind speed reaches 9 m/s. It is because the rows 1–8 ACC cells are used to cool the exhaust steam of two units in winter, and the steam flow in each ACC cell is enormous. The cooling capacity decreases rapidly, and the backpressure of the unit grows significantly. Adding one set of ACC cells will make the backpressure drop dramatically because of the increased heat transfer area and pumped cooling air flow.
It is worth noting that when rows 1–16 ACC cells are put into operation, there is a great risk of freezing due to the low back pressure, close to 5 kPa. The piping-main arrangement of the air-cooled system can easily avoid this freezing accident by controlling the number of ACC cells in operation. The results above indicate that the piping-main arrangement ACCs can adjust the number of ACC cells flexibly and maintain the backpressure in the most economical range. This kind of arrangement is suitable for retrofitting existing air-cooled units to make them operate efficiently and safely.

4. Conclusions

An air-cooled system with the piping-main arrangement of ACC cells was proposed for thermal power generating units. The steam flow rate, the backpressure of the turbine as well as the coal consumption rate under different ambient temperatures, and natural wind conditions both in summer and winter were obtained and analyzed. The following conclusions can be obtained:
(1)
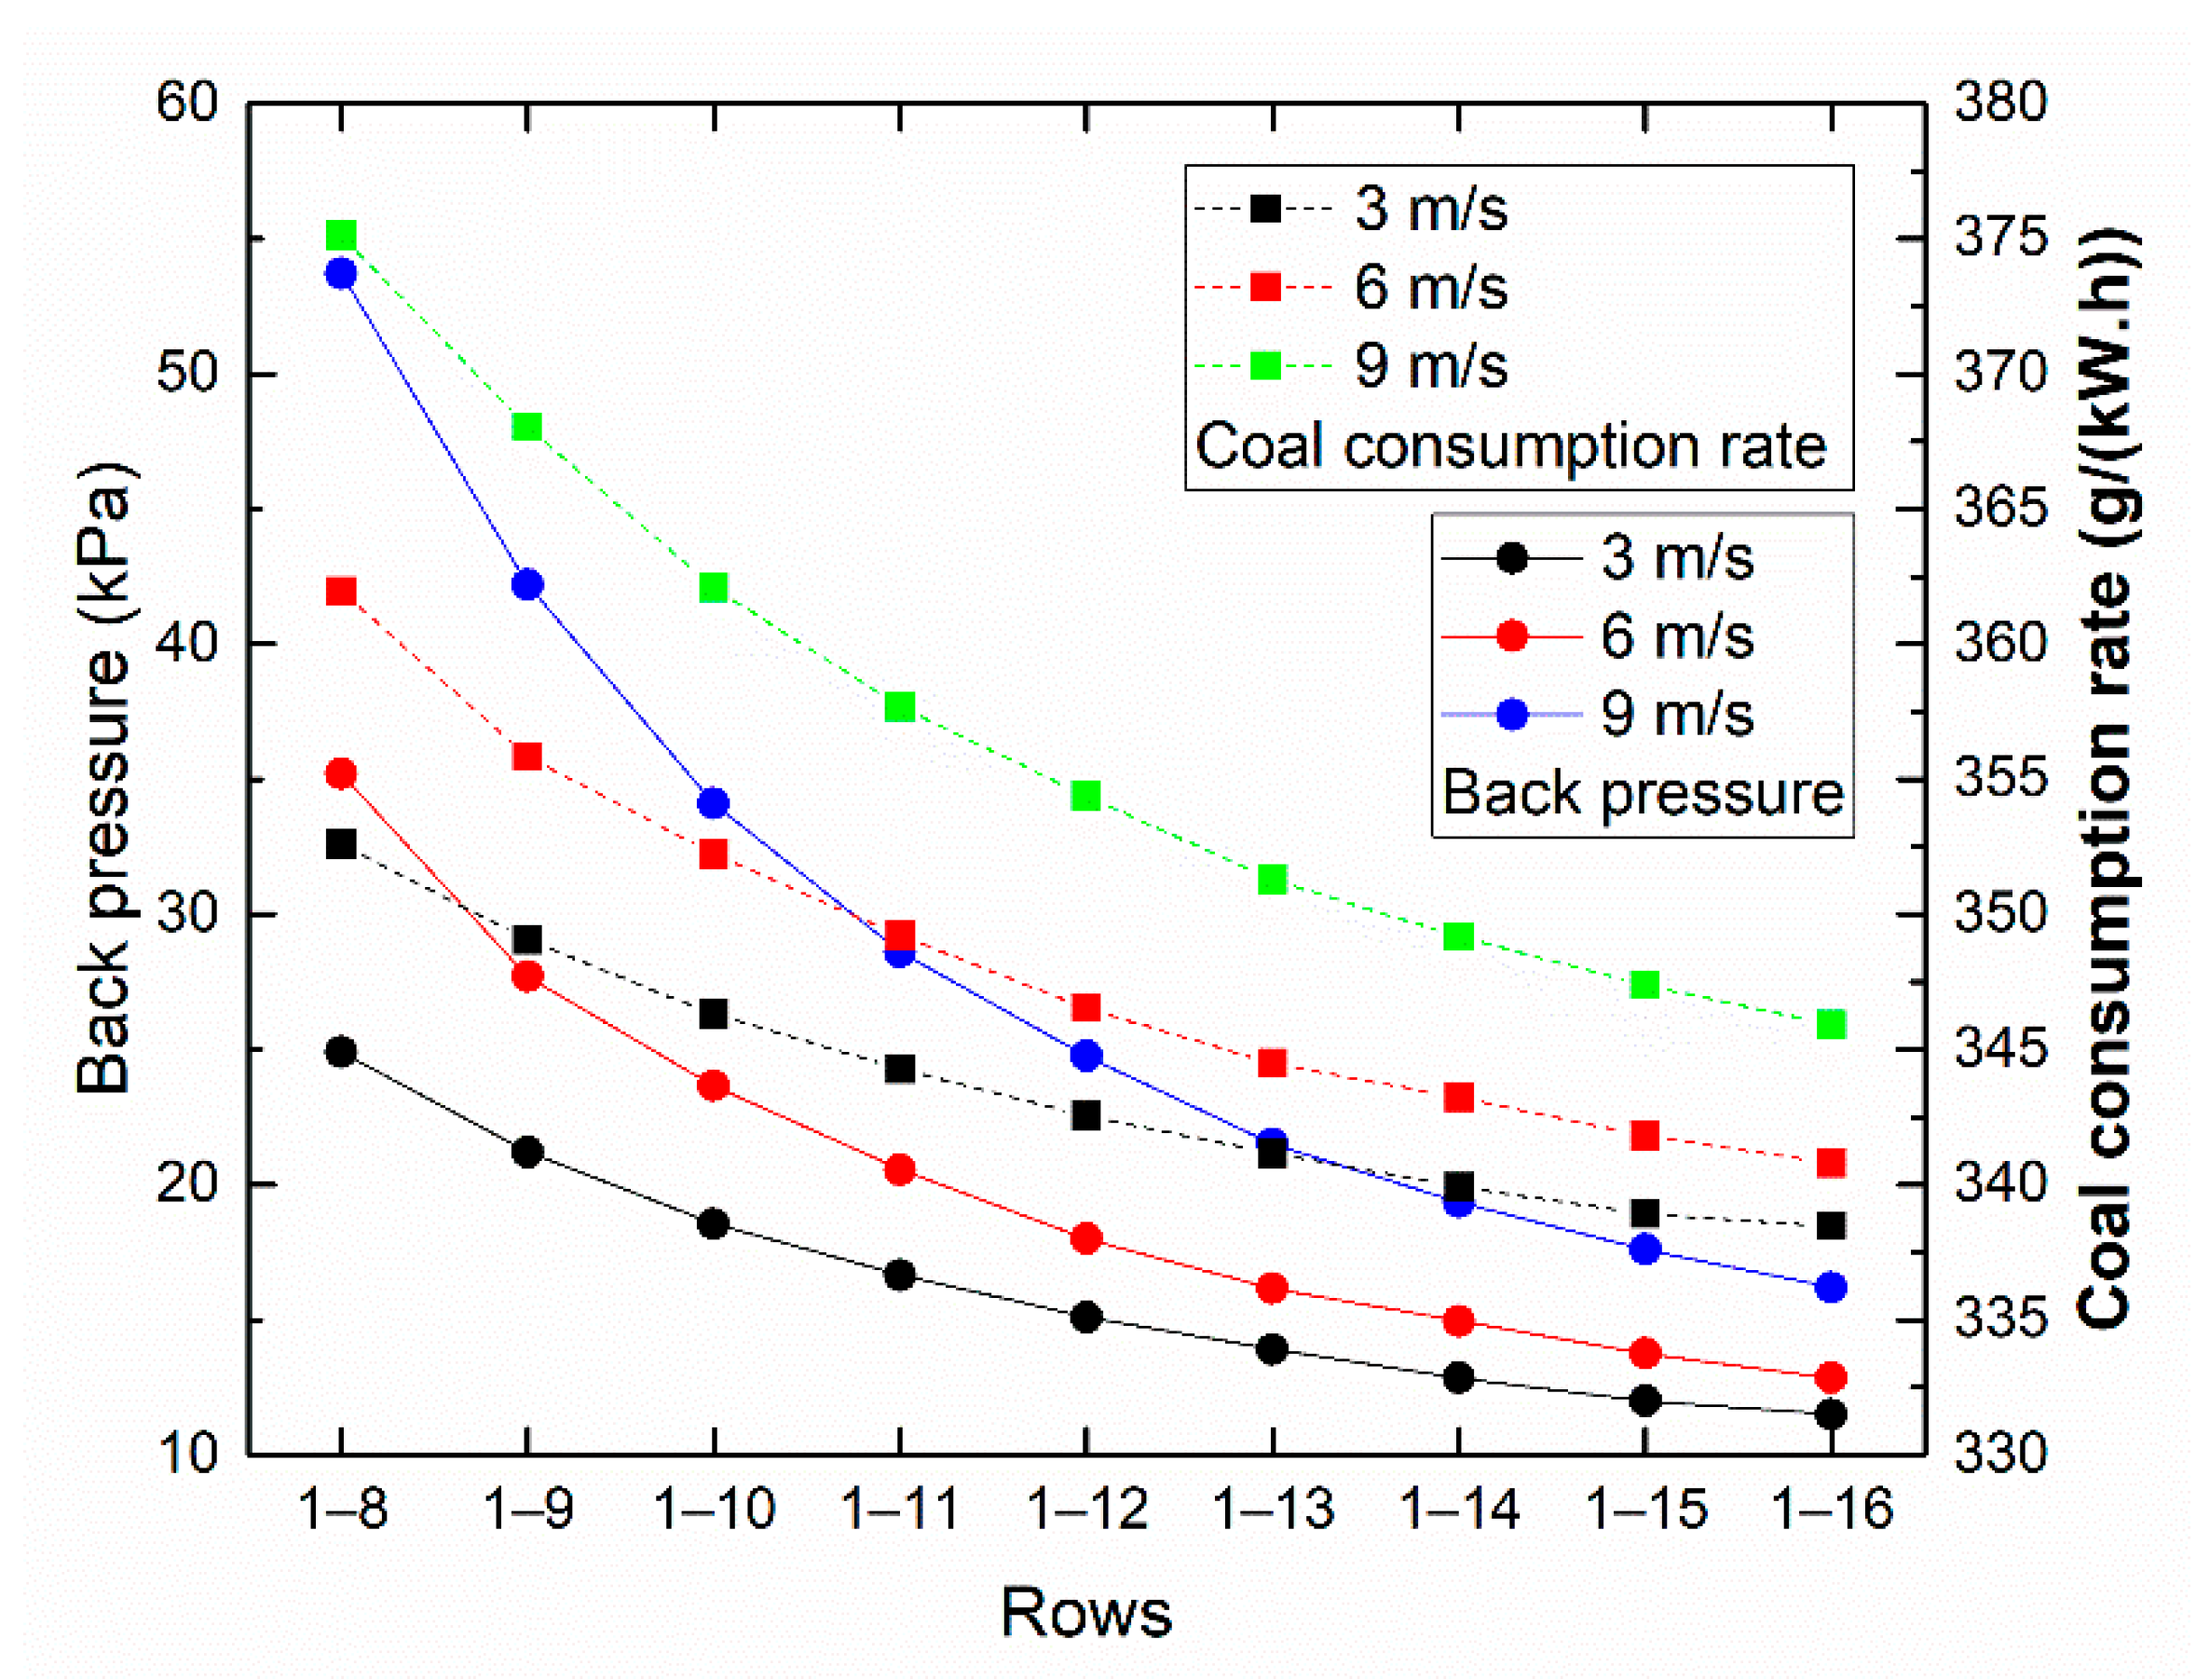
In summer, both backpressure and coal consumption rate decrease with the increasing number of rows of ACC cells in operation. The difference ranges from 24.9 kPa in backpressure and 352.58 g/kWh in coal consumption to 11.5 kPa and 338.46 g/kWh under 30°C and wind speed of 3 m/s. The inhomogeneity of the steam flow distribution can be improved by increasing the number of ACC cells. The power generating unit can maintain the design backpressure of 15 kPa under various conditions by adjusting the number of ACC cells in operation.
(2)
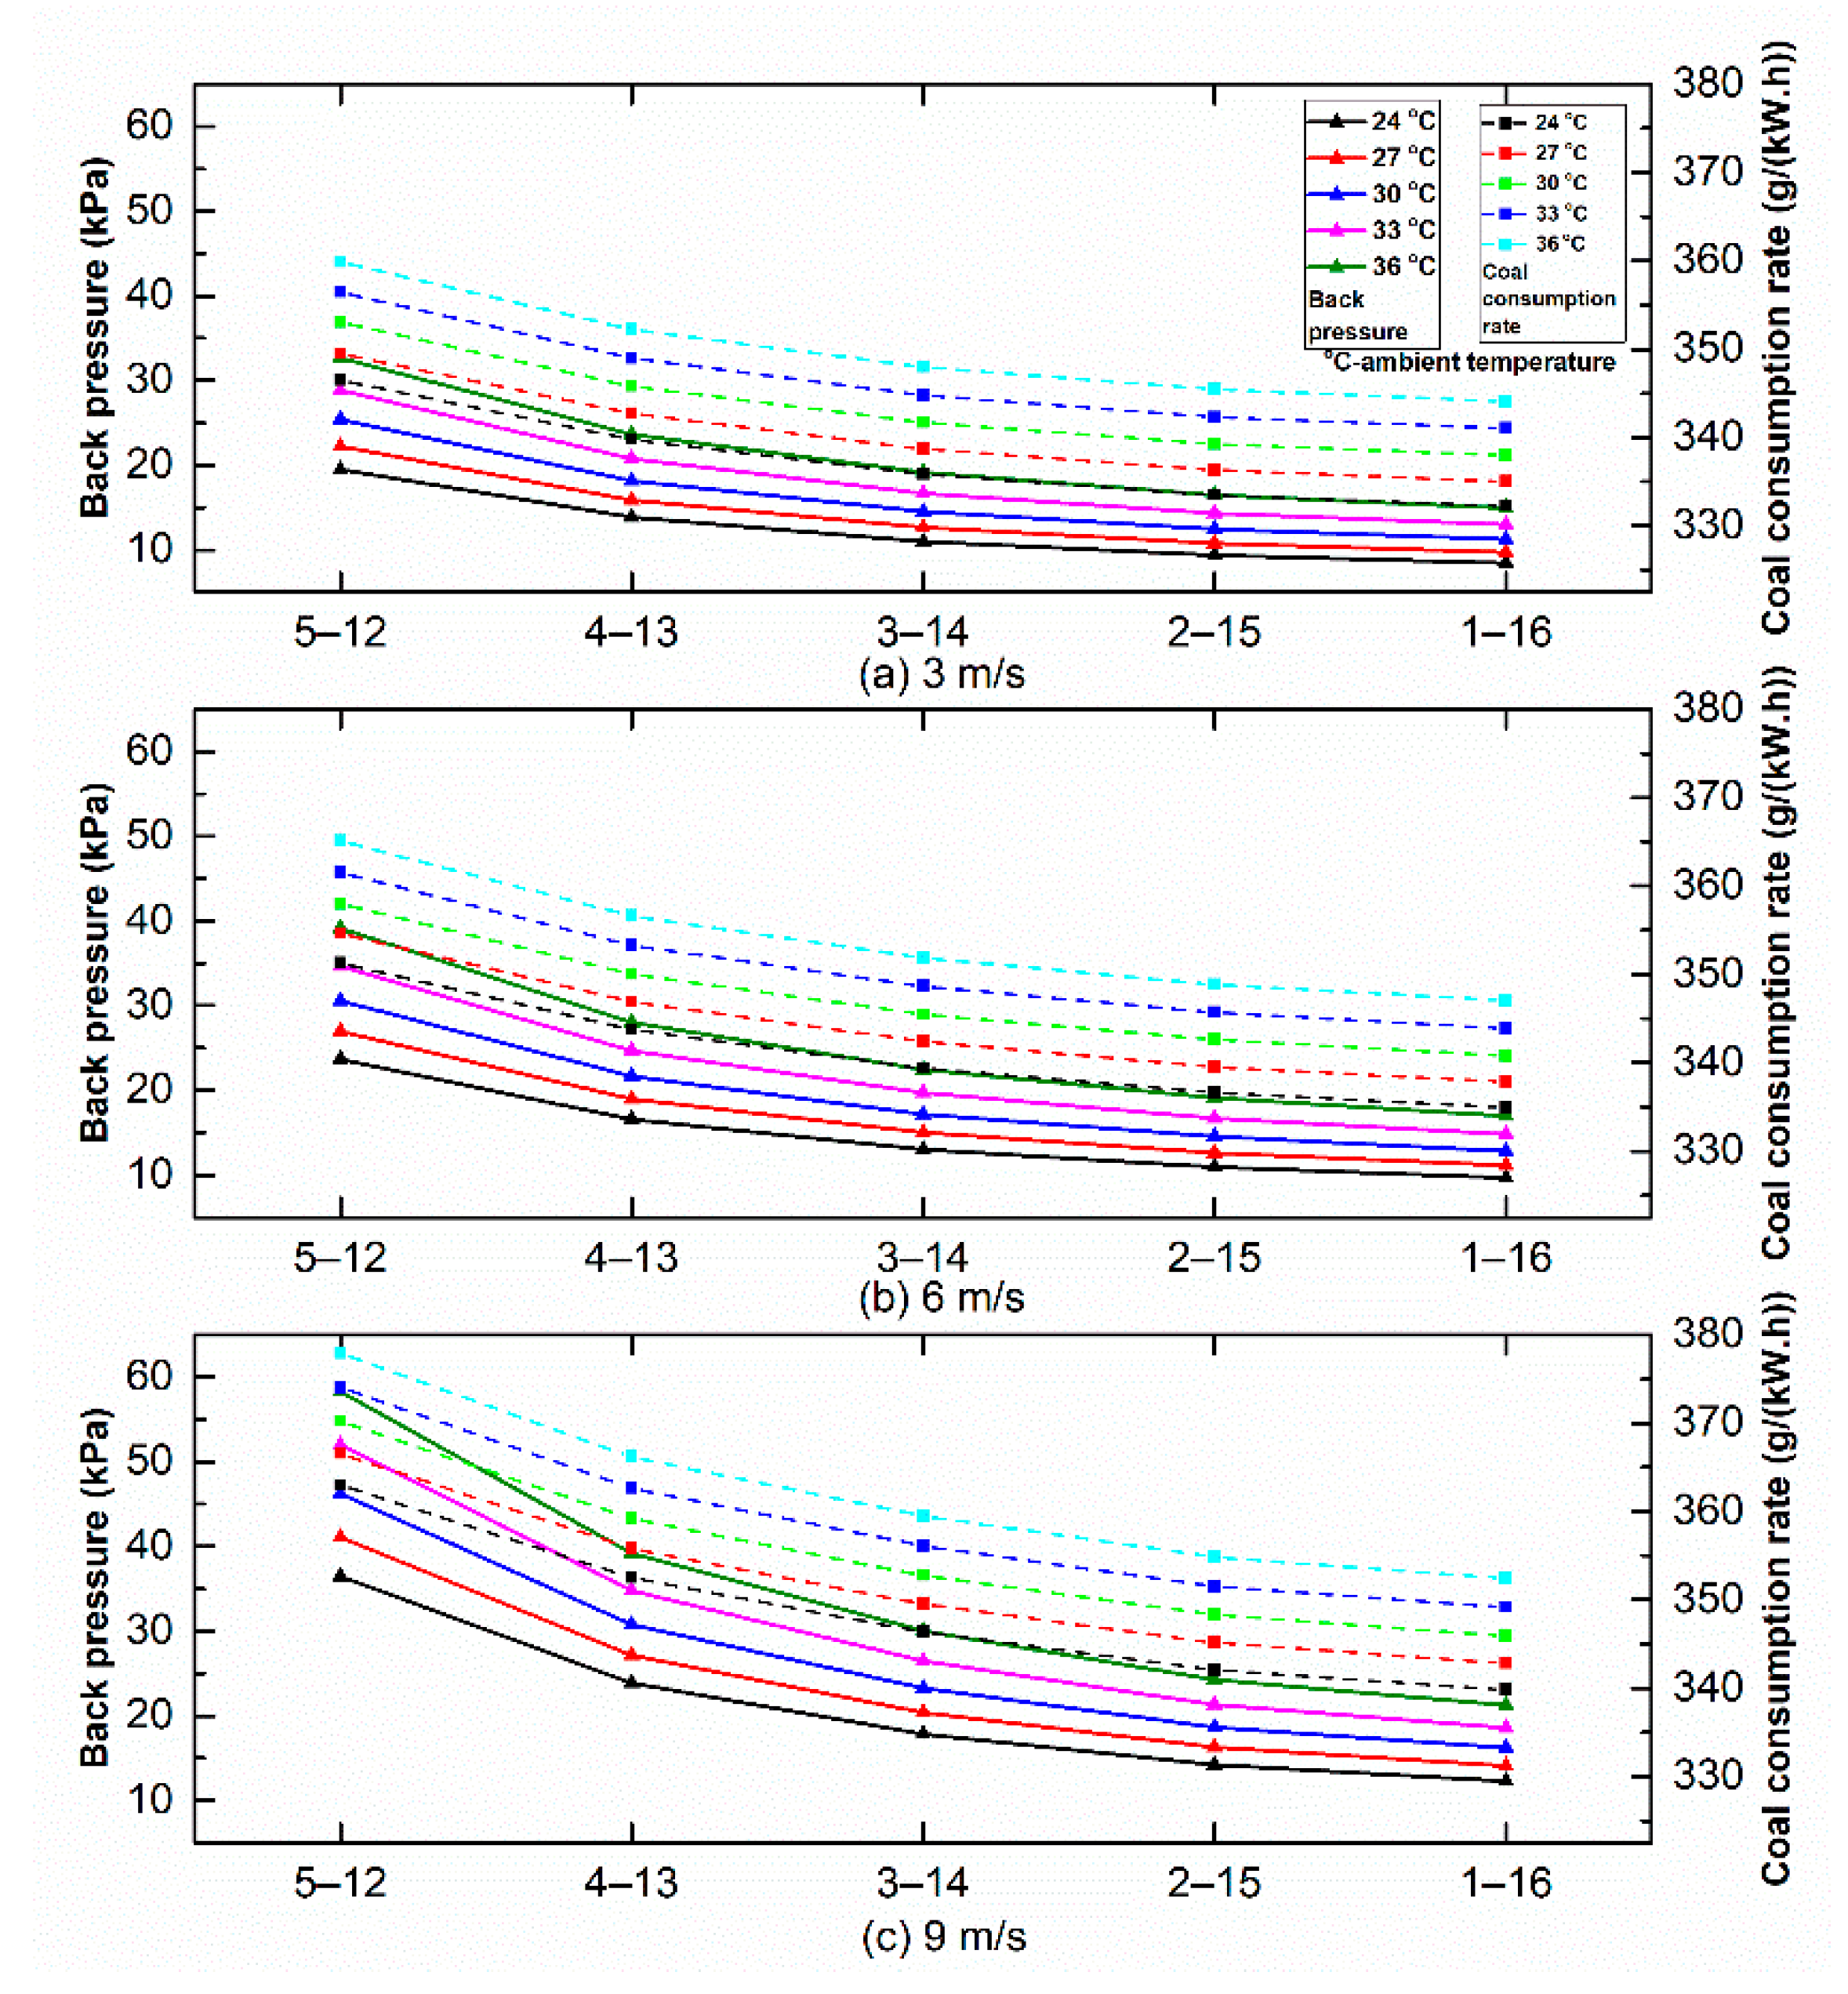
The ACC cells in the middle part can be given priority due to the fact they are less affected by the ambient air. A total of five operation strategies is proposed to confirm that the improvement effect is especially apparent.
(3)
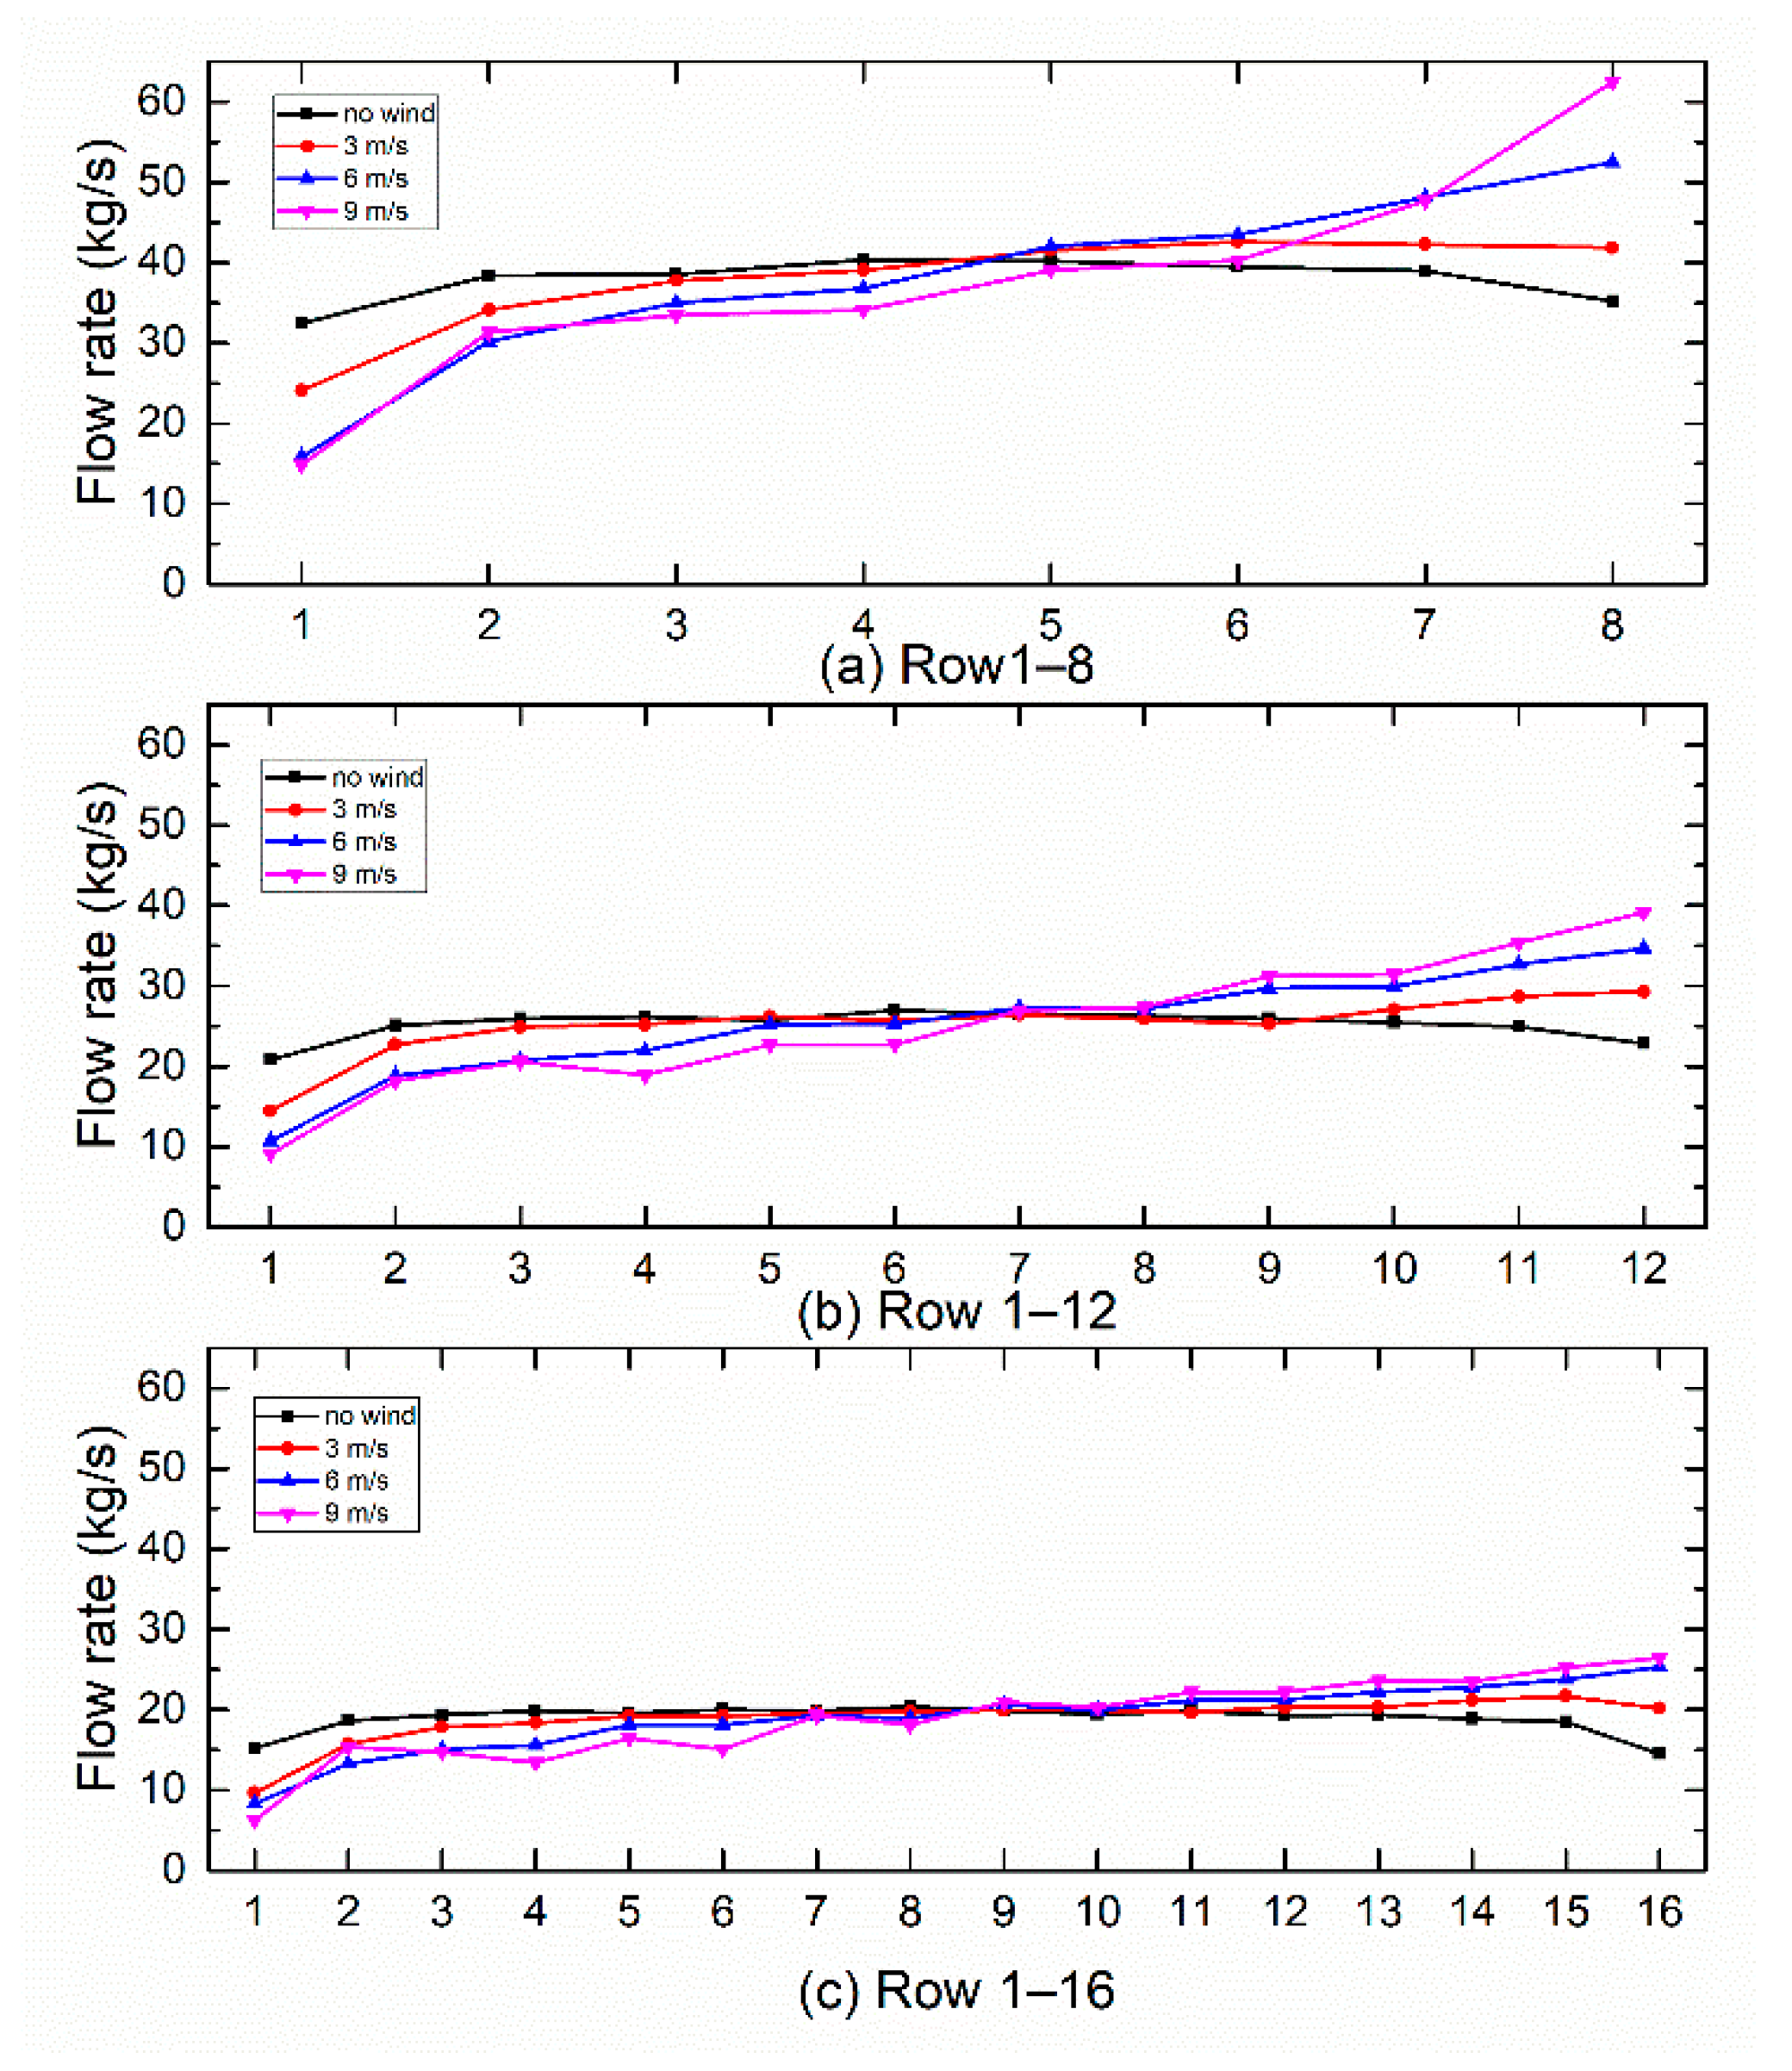
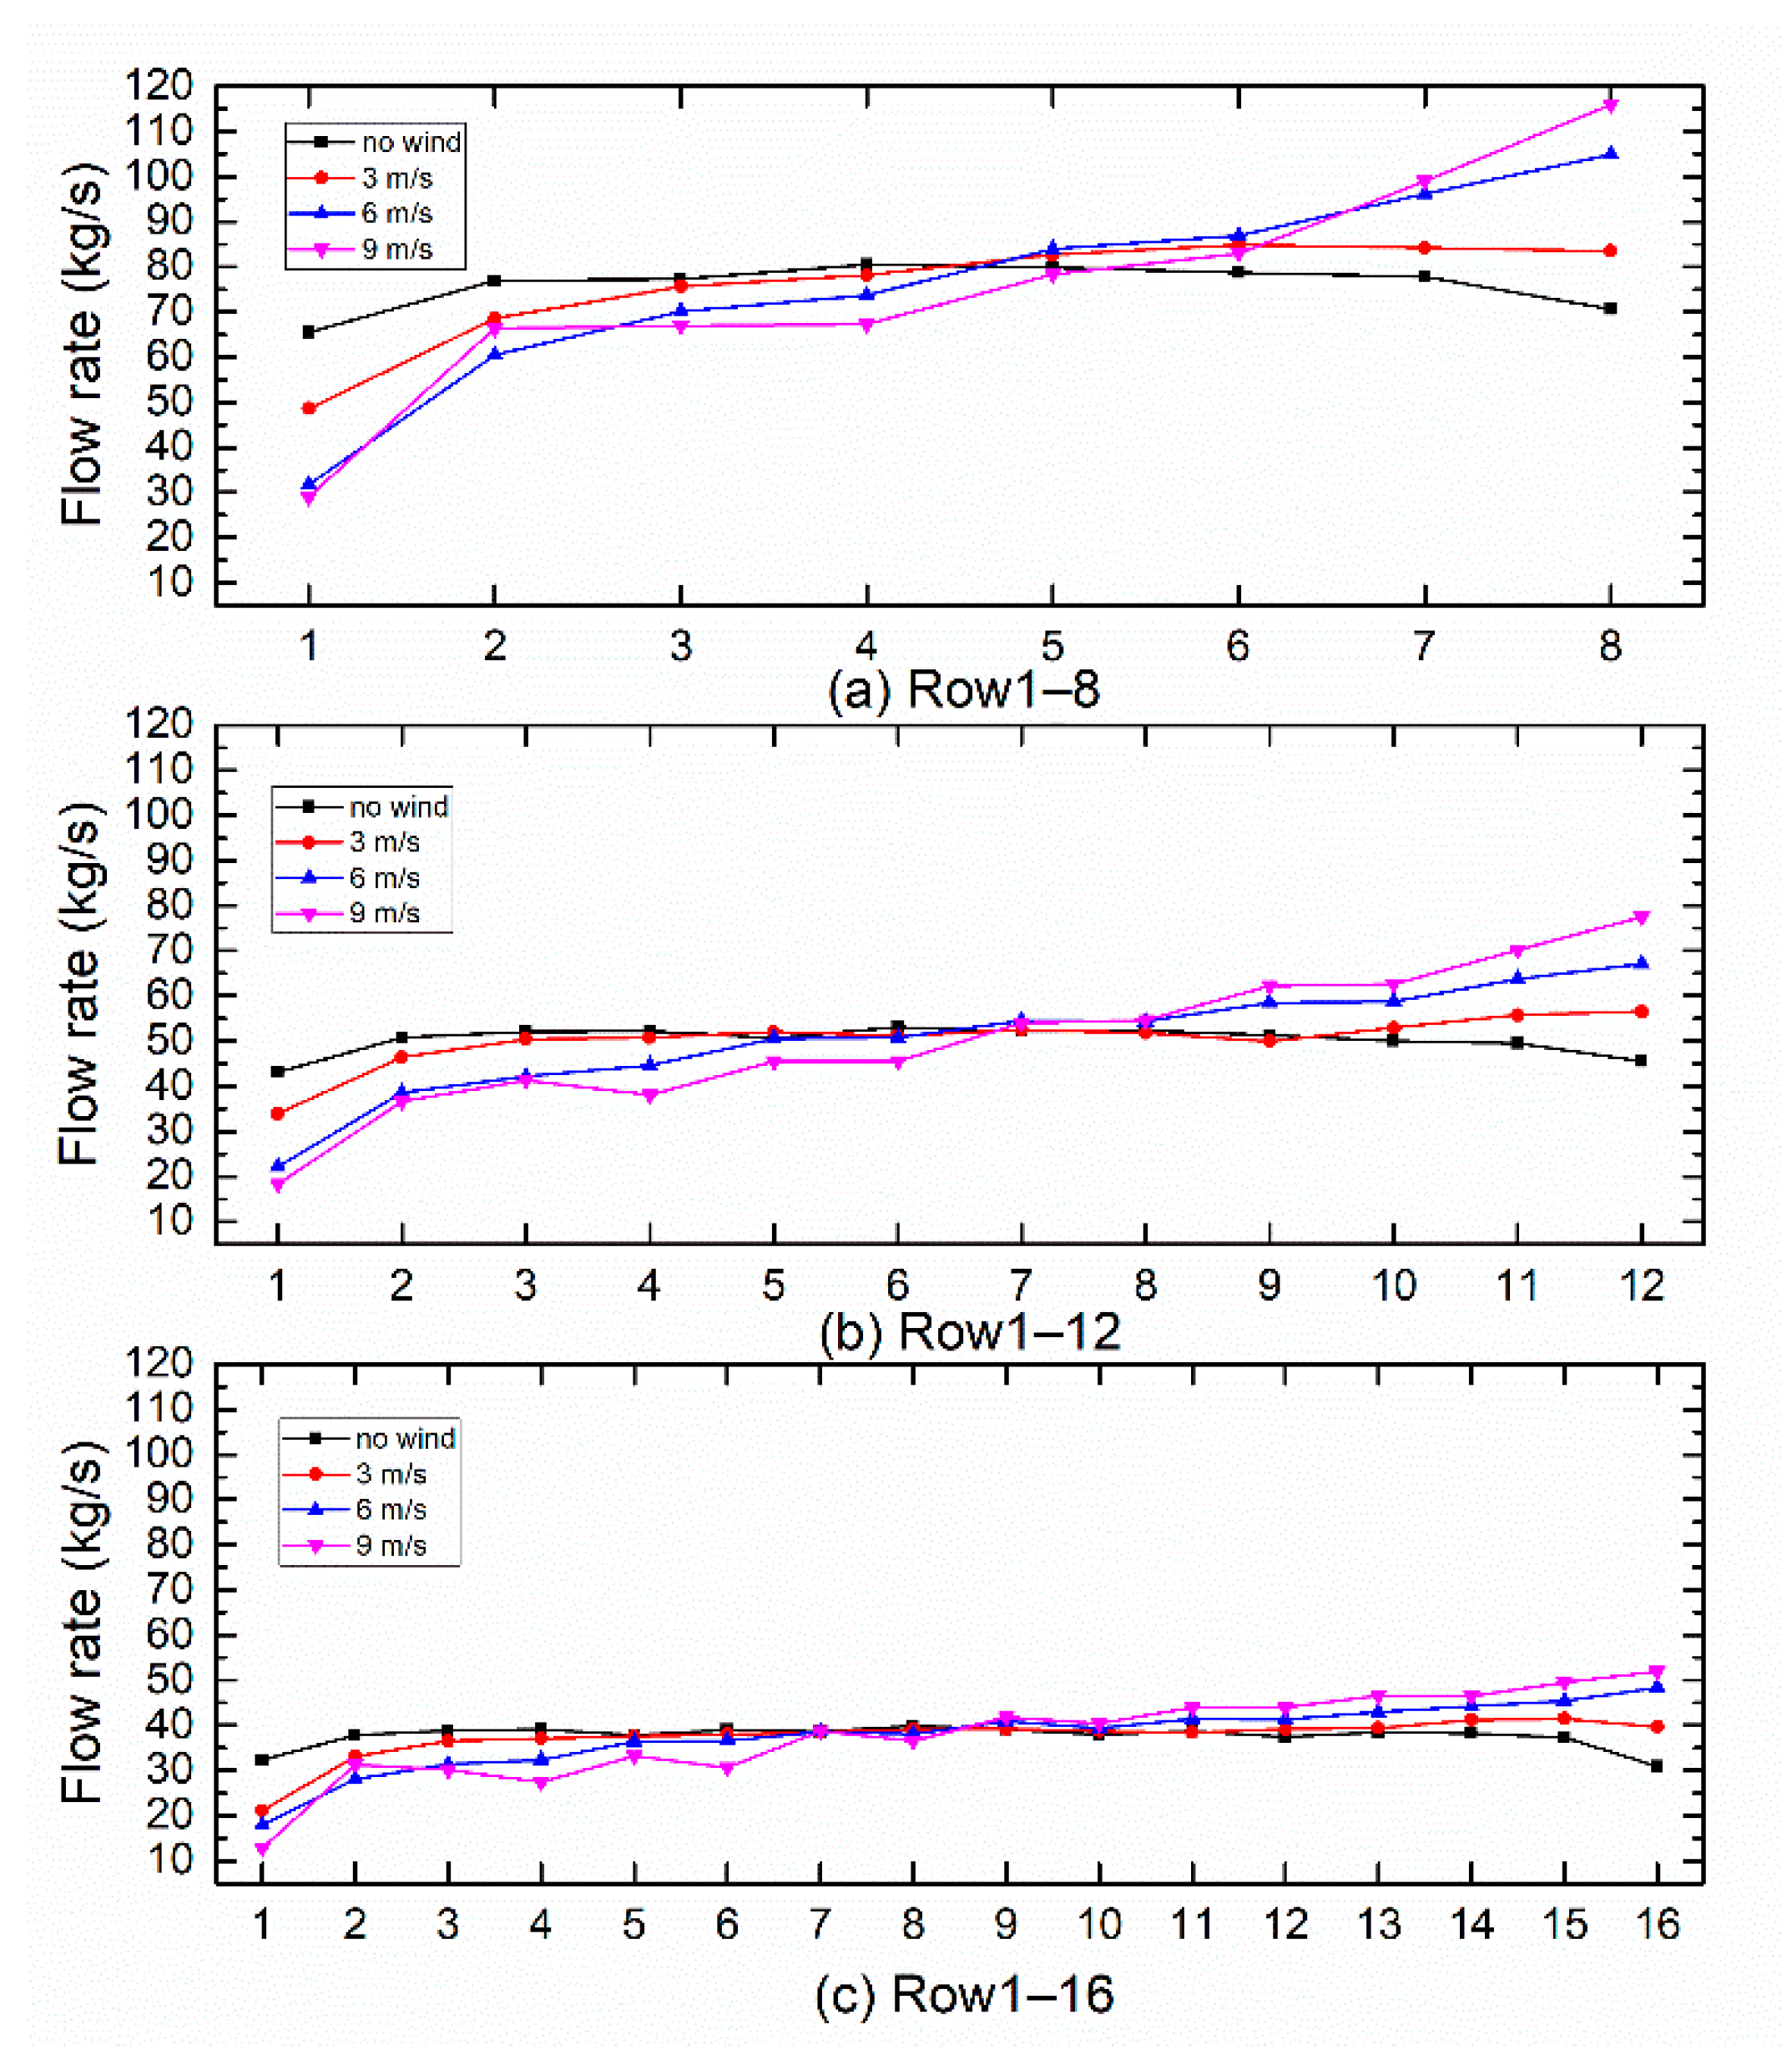
In winter, the external flow field has a greater impact on the steam flow distribution than in summer. The steam flow rate can be balanced effectively by adjusting the number of rows of ACCs used. The steam flow rate difference ranges from 13.4 kg/s with rows 1–8 to 8.79 kg/s with rows 1–12, and finally to 6.64 kg/s with rows 1–16 ACC cells in operation under 3 m/s wide conditions. It is extremely effective under the large wind speed conditions. Also, the piping-main arrangement can avoid the freezing accident in winter by adjusting the number of ACC cells put into operation.

Author Contributions

Conceptualization, X.D., Z.G., and W.N.; methodology, X.D., W.N.; software, W.N.; validation, Z.G., L.Y. and W.N.; formal analysis, W.N.; investigation, Z.G., X.D.; resources, W.N.; data curation, W.N.; writing—original draft preparation, W.N.; writing—review and editing, X.D.; visualization, L.Y.; supervision, X.D.; project administration, X.D.; funding acquisition, X.D. All authors have read and agreed to the published version of the manuscript.

Funding

This research was funded by National Natural Science Foundation of China, grant number 51821004 and the national “973 Program” of China, grant number 2015CB251503.

Conflicts of Interest

The authors declare no conflict of interest.

Nomenclature

AfdHeat transfer area of downstream finned tube bundles
AydWindward area of downstream finned tube bundles
bcpCoal consumption rate
CpSpecific heat of air at constant pressure
dHydraulic radius
DSteam flow rate
doThe characteristic dimensions of the air side finned tube
eSurface roughness
fnThe polynomial coefficient
hlvThe latent heat of steam
kTurbulent kinetic energy
KThe loss coefficient
KiReduced inlet loss coefficient
KconCondensed loss coefficient
KoOutlet loss coefficient
HHeat transfer coefficient
hbSuperheated steam enthalpy
hlvLatent heat
h4Fourth stage extraction enthalpy
lLength of the pipe
MHeat load
NNumber
NTUNumber of transfer units
pPressure
PeSteam turbine power
Q0Heat consumption
q0Heat rate
q1Lower heating value of standard coal
rnThe polynomial factor
SSource term
tTemperature
tnSaturation temperature of the steam
ufAir velocity normal to the radiator surface
uzAir axial velocity
vSteam velocity
Greek symbols
αecCombining header energy correction factor
αedDividing header energy correction factor
ΓDiffusion coefficient
λFriction resistance coefficient
λaAir thermal conductivity
μDynamic viscosity
μTTurbulent viscosity
ξLocal resistance coefficient
ρDensity
υThe aerodynamic viscosity
φScalar variable
εEffectiveness
ηbEfficiency of the boiler
ηpEfficiency of pipelines
ηmgEfficiency of generator
pfrFrictional resistance loss
plcLocal resistance loss
ptotdcResistance loss in the finned tube bundles
ptotiResistance loss entering the finned tube bundles
ptotconResistance loss condensed into saturated water
ptotoResistance loss entering the condensate tank
Subscripts
aAir
cCountercurrent air-cooled cell
dDownstream air-cooled cell
sSteam
soOutlet of steam turbine
i Row number
jColumn number
0Exhaust from the turbine
a1Air inlet
a2Air outlet
hdHeader inlet
liLateral inlet
loLateral outlet
hcHeader outlet

References

  1. Yuan, J.; Wang, Y.; Zhang, W.; Zhao, C.; Liu, Q.; Shen, X.; Zhang, K.; Dong, L. Will recent boom in coal power lead to a bust in China? A micro-economic analysis. Energy Policy 2017, 108, 645–656. [Google Scholar] [CrossRef]
  2. Duvenhage, K.; Kröger, D.G. The influence of wind on the performance of forced draught air-cooled heat exchangers. J. Wind Eng. Ind. Aerodyn. 1996, 62, 259–277. [Google Scholar] [CrossRef]
  3. Gu, Z.; Chen, X.; Lubitz, W.; Li, Y.; Luo, W. Wind tunnel simulation of exhaust recirculation in an air-cooling system at a large power plant. Int. J. Therm. Sci. 2007, 46, 308–317. [Google Scholar] [CrossRef]
  4. Yang, L.J.; Du, X.Z.; Yang, Y.P. Influences of wind-break wall configurations upon flow and heat transfer characteristics of air-cooled condensers in a power plant. Int. J. Therm. Sci. 2011, 50, 2050–2061. [Google Scholar] [CrossRef]
  5. Zhang, X.; Chen, H. Effects of windbreak mesh on thermo-flow characteristics of air-cooled steam condenser under windy conditions. Appl. Therm. Eng. 2015, 85, 21–32. [Google Scholar] [CrossRef]
  6. Chen, L.; Yang, L.; Du, X.; Yang, Y. A novel layout of air-cooled condensers to improve thermo-flow performances. Appl. Energy 2016, 165, 244–259. [Google Scholar] [CrossRef]
  7. Kong, Y.; Wang, W.; Huang, X.; Yang, L.; Du, X.; Yang, Y. Circularly arranged air-cooled condensers to restrain adverse wind effects. Appl. Therm. Eng. 2017, 124, 202–223. [Google Scholar] [CrossRef]
  8. Chernysheva, M.A.; Vershinin, S.V.; Maydanik, Y.F. Heat transfer during condensation of moving steam in a narrow channel. Int. J. Heat Mass Transf. 2009, 52, 2437–2443. [Google Scholar] [CrossRef]
  9. Dehbi, A.; Guentay, S. A model for the performance of a vertical tube condenser in the presence of noncondensable gases. Nucl. Eng. Des. 1997, 177, 41–52. [Google Scholar] [CrossRef]
  10. Datta, A.B.; Majumdar, A.K. Flow distribution in parallel and reverse flow manifolds. Int. J. Heat Fluid Flow 1980, 2, 253–262. [Google Scholar] [CrossRef]
  11. Zhao, J.; Feng, Z.; Dou, Z.; Yao, Y.; Zhu, A.; Li, Y.; Liu, Y.; Jiang, Y.; Jiang, Z. Numerical analysis of factors affecting condensation capacity of air-cooled condenser. IOP Conf. Ser. Earth Environ. Sci. 2019, 227, 032030. [Google Scholar] [CrossRef]
  12. Deng, H.; Liu, J.; Yang, T.; Wu, S. Numerical study and visualization on flow characteristics of reflux condensation in air-cooled condenser. Appl. Therm. Eng. 2019, 148, 1310–1323. [Google Scholar] [CrossRef]
  13. Kekaula, K.; Chen, Y.; Ma, T.; Wang, Q.-W. Numerical investigation of condensation in inclined tube air-cooled condensers. Appl. Therm. Eng. 2017, 118, 418–429. [Google Scholar] [CrossRef] [Green Version]
  14. Deng, H.; Liu, J. Performance prediction of finned air-cooled condenser using a conjugate heat-transfer model. Appl. Therm. Eng. 2019, 150, 386–397. [Google Scholar] [CrossRef]
  15. Berrichon, J.; Louahlia-Gualous, H.; Bandelier, P.; Clement, P.; Bariteau, N. Experimental study of flooding phenomenon in a power plant reflux air-cooled condenser. Appl. Therm. Eng. 2015, 79, 214–224. [Google Scholar] [CrossRef]
  16. Davies, W.A., III; Hrnjak, P. Thermo-hydraulic model for steam condensation in a large, inclined, flattened-tube air-cooled condenser. Appl. Therm. Eng. 2019, 149, 745–756. [Google Scholar] [CrossRef] [Green Version]
  17. Cheng, T.; Du, X.; Yang, L.; Yang, Y. Co-current Condensation in an Inclined Air-cooled Flat Tube with Fins. Energy Procedia 2015, 75, 3154–3161. [Google Scholar] [CrossRef] [Green Version]
  18. Owen, M.; Kröger, D.G. A numerical investigation of vapor flow in large air-cooled condensers. Appl. Therm. Eng. 2017, 127, 157–164. [Google Scholar] [CrossRef]
  19. Yang, L.J.; Du, X.Z.; Yang, Y.P. Space characteristics of the thermal performance for air-cooled condensers at ambient winds. Int. J. Heat Mass Transf. 2011, 54, 3109–3119. [Google Scholar] [CrossRef]
  20. Yang, L.J.; Du, X.Z.; Yang, Y.P. Wind effect on the thermo-flow performances and its decay characteristics for air-cooled condensers in a power plant. Int. J. Therm. Sci. 2012, 53, 175–187. [Google Scholar] [CrossRef]
  21. Haaland, S.E. Simple and explicit formulas for the friction factor in turbulent pipe flow. J. Fluids Eng. 1983, 105, 89–90. [Google Scholar] [CrossRef]
  22. Hua, S.; Yang, X. Practical Fluid Resistance Manual; National Defense Industry Press: Beijing, China, 1985. [Google Scholar]
  23. Zipfel, T. Steam Flow Distribution in Air-Cooled Condensers. Ph.D. Thesis, Stellenbosch University, Stellenbosch, South Africa, 1996. [Google Scholar]
  24. Yang, L.; Du, X.; Yang, Y. Measures against the adverse impact of natural wind on air-cooled condensers in power plant. Sci. China Technol. Sci. 2010, 53, 1320–1327. [Google Scholar] [CrossRef]
  25. Du, X.Z.; Jin, Y.S.; Jiang, J.B. Experimental study on heat transfer performance of direct air-cooled condenser in power plant. J. Eng. Thermophys. 2009, 30, 99–101. [Google Scholar]
Figure 1. Schematics of the objective air-cooled power generating units and the arrangement of ACC cells.
Energies 13 00170 g001
Figure 2. The piping-main arrangement air-cooled system of the co-established power generating units.
Energies 13 00170 g002
Figure 3. Computational domain and boundary conditions.
Energies 13 00170 g003
Figure 4. Flow chart of the coupled calculation program.
Energies 13 00170 g004
Figure 5. Flow distribution of each cell with different operation strategies and different ambient winds.
Energies 13 00170 g005
Figure 6. Variations of the back pressure and coal consumption rate with the number of ACC cells under different ambient winds.
Energies 13 00170 g006
Figure 7. Variations of the back pressure and coal consumption rate in different operation strategies under ambient winds.
Energies 13 00170 g007
Figure 8. Steam flow distribution under different operation strategies and different wind speeds with the ambient temperature of −15 °C.
Energies 13 00170 g008
Figure 9. Variation of the backpressure with the number of ACC cells under different ambient winds in winter.
Energies 13 00170 g009
Table 1. Coefficient of local resistance loss shown in Figure 2.
Resistance coefficient(1)(2)(3)(4)(5)
ξ0.14500.32900.51190.53700.5389
Resistance coefficient(6)(7)(8)(9)(10)
ξ0.50200.51990.14500.13200.1430
Table 2. Comparison between the model results and the design back pressures.
Operation ConditionAmbient Temperature/°CSteam Turbine Exhaust Volume/ton/hCalculated Back Pressure/kPaDesigned Back Pressure/kPaExhaust Steam Load/MWRelative Error
THA1221217.5715.115746.090.67%
THA2191352.37515.415828.362.67%
TMCR201304.08115.215798.991.33%
TRL331329.3327.4529803.698−5.34%
Choked back pressure51273.7977.58790.796−6.25%
Table 3. Backpressure and coal consumption rate with the number of ACC cells under different ambient winds in 30 °C.
Operation StrategyBack Pressure (kPa)Coal Consumption Rate (g/kW.h)
3 m/s6 m/s9 m/s3 m/s6 m/s9 m/s
1–824.935.253.7352.5783361.9601375.0984
1–921.227.742.2349.0379355.8416368.0369
1–-1018.5523.6534.1346.3137352.2273362.0824
1–1116.6520.5528.6344.2769349.2191357.6905
1–1215.11824.75342.5351346.5289354.3570
1–1313.916.1521.5341.1662344.4898351.2723
1–1412.8514.9519.35339.9213343.2078349.1707
1–151213.7517.6338.9160341.8151347.3849
1–1611.512.8516.2338.4642340.7975345.9233
Table 4. Backpressure with the number of ACC cells under different ambient winds in −15 °C.
Operation StrategyBack Pressure (kPa)
3 m/s6 m/s9 m/s
1–817.1532.8571.15
1–912.520.6546.05
1–109.7511.630.7
1–117.959.121.75
1–126.757.3516.45
1–135.756.3512.4
1–1456.3510.5
1–154.45.548.3
1–164.054.87.1

