Article

Measurements of Energy Consumption and Environment Quality of High-Speed Railway Stations in China

School of Mechanical Engineering, Southwest Jiaotong University, Chengdu 610031, China
*
Author to whom correspondence should be addressed.
Energies 2020, 13(1), 168; https://doi.org/10.3390/en13010168
Submission received: 17 November 2019 / Revised: 21 December 2019 / Accepted: 23 December 2019 / Published: 30 December 2019
(This article belongs to the Special Issue Energy Performance in Buildings and Quality of Life)

Abstract

:
In recent years, the energy performance of public buildings has attracted substantial attention due to the significant energy-saving potential. As a semi-open high-space building, the high-speed railway station is obviously different from other public buildings and even traditional stations in terms of energy consumption and internal environment. This paper investigates the current energy consumption situation and environmental quality of 15 high-speed railway passenger stations in China. Results show that the energy consumption of the high-speed railway station is between 117–470 kWh/(m2·a). The energy consumption of the station is related to the area and the passenger flow. The energy use of the station using district heating is higher than that of the station without district heating in the same region. The higher glazing ratio induces good natural lighting in the station, but the uniformity of the lighting in the station is not good. The acceptable temperature range of passengers in winter is larger than that in summer. The average air change rate of the high-speed railway station is 3.2 h−1 in winter and 1.8 h−1 in summer, which is the main reason of high energy consumption of the HVAC (Heating Ventilation Air Conditioning) system in this kind of building.

1. Introduction

Buildings are responsible for approximately 40% of the total world annual energy consumption, most of which is used for the lighting and the HVAC (Heating Ventilation Air Conditioning) systems [1]. In China, building energy consumption has doubled in the past 20 years, with an annual growth rate of 3.7% [2]. Among them, energy consumption of public buildings accounts for 30% of energy consumed by all kinds of buildings [3]. Energy consumption of urban office buildings in China is about 33.6–107 kWh/(m2·a), while the average energy consumption of commercial buildings is 55 kWh/(m2·a) [4]. Due to the remarkable energy-saving potential, many studies [5,6,7,8,9] have focused on the energy-saving evaluation of public buildings. As an important and special branch of public buildings, traffic transportation buildings like railway stations have characteristics of large space span, various functions, high density of people, and long operation time of air conditioning system. Energy consumption and energy-saving approaches of these kind of buildings are also quite different from those of common public buildings [10].
Energy consumption of traditional railway stations in China is about 101–423 kWh/(m2·a). Calculation results showed that the energy consumption of the HVAC system accounted for 30–60% of the total energy consumption of the station, while the lighting system and the elevator system had a percentage of 10–20% and 5–10% [10,11], respectively. Li et al. [12] studied the energy-saving potential of a single railway station by simulations. Results showed that the energy consumption of the waiting lounge of the railway station can be saved by 17–30% by changing the design temperature or the operation mode of HVAC systems. Because of the large amount of unorganized ventilation caused by the opening of the station building, the installation of the air curtain to organize the infiltration air can reduce 12% of the cooling load [13]. Relevant research on the elevator suggested that 30% of energy consumed by the elevator system can be saved in theory for typical stations through reasonable operations of the elevator system [14]. For the lighting system, as a kind of low power equipment, LED (Light Emitting Diode) light is widely used for lighting. Energy efficiency can be improved by controlling the lighting intensity reasonably according to the intensity of natural light as well as the arrival and the departure of vehicles [15,16,17,18].
Indoor thermal environment research has mainly focused on office buildings [19]. Tests showed that the acceptable comfort temperature in the building was a temperature range rather than a single temperature value [9]. A wider control temperature range can save energy, and it will not significantly decrease the indoor thermal comfort [20]. Expanding the temperature range of the thermostat can save the cooling system energy consumption by 31% and the heating energy consumption by 12% [21]. By using natural ventilation in different cities, the cooling energy consumption can be reduced by 8–78% [22]. By studying the thermal environment of railway stations, Japanese scholars have concluded that the temperature and the wind speed are main factors determining the thermal environment of the station where passengers stay for a short time. Furthermore, they put forward that ventilation is the most effective method to improve the thermal environment of the station. They even considered that a high wind speed can control the temperature between 18 °C and 32 °C in summer to ensure the same thermal comfort [23]. Thermal comfort ranges of buildings are very different from climates. Manual adjustments such as natural ventilation (opening windows in summer, ventilation, etc.) are more comfortable and energy-saving than mechanical methods [24,25,26]. In addition to objective analysis, people’s subjective perception of the environment will also affect the evaluation of indoor comfort. For example, for wooden buildings, the use of environmental materials will increase the good impression of the internal environment [27,28]. Railway station buildings have a wider acceptable temperature range due to a shorter stay time than office buildings, but the design parameters of public buildings are still used in domestic design codes, which will cause energy waste [29].
Most studies of the light environment relied on subjective surveys. Light environment is influenced by the parameters including human activity, light intensity, and lighting design of buildings [30,31]. Results showed that the visual clarity, the color authenticity, the light and the shade contrast were the main factors influencing the light environment comfort in offices, and the corresponding weights were 29.55%, 17.59%, 16.77%, and 14.44%, respectively [32]. For the lighting environment of railway stations, the balance between natural lighting and energy consumption was studied. Glazing ratio was parabolic in relation to the load [33]. However, the high-speed railway station is much higher than the traditional railway station, with a larger glass enclosure structure to meet a better visual effect. From the perspective of energy saving and emission reduction, it is necessary to understand the current situation of the light environment in such buildings and to analyze its energy-saving potential.
Concentration of CO2 in the building reflects the effect of ventilation. Many studies have shown that natural ventilation is able to meet the demand of indoor fresh air [34,35]. Natural ventilation was successfully used in some small office buildings [21,36,37]. While, for tall buildings, passive air infiltration will bring excessive energy consumption and damage the indoor thermal environment. Huang et al. [38,39,40] found that the thermal stratification in large single buildings such as gymnasiums was significantly higher than that in other public buildings due to a higher ceiling height (9–17 m) and multiple openings. This phenomenon is more serious in winter than in summer, and the load caused by the air infiltration accounts for 40–60% of the total load. Test results of CO2 concentration in the waiting lounge of the station is about 900 ppm, which is higher than the 700 ppm stipulated in ASHARE (American Society of Heating Refrigerating and Airconditioning Engineer), but passengers still can accept it [14]. Compared to the former, the high-speed railway station with more openings and a higher ceiling height will have more obvious chimney effect in winter, which may increase the heating load in winter.
Current research results show that there is a huge difference between railway stations and other public buildings, and it is not suitable to use the evaluation method of public buildings for the railway stations. With the rapid development of the high-speed railway in China, a large amount of high-speed railway station buildings will be built in the future. However, designers and operational staff do not pay enough attention to the energy consumption and the indoor environment of such buildings. The main purpose of this study is to investigate the characteristics of energy consumption and the indoor environment of high-speed railway stations in China. Energy consumption is related to the design parameters of the station and the scale of the station building. Problems and suggestions of the high-speed railway station are proposed by comparing the previous results with the measured results. Studies of energy consumption characteristics and light-thermal environment characteristics of high-speed railway stations are beneficial to understand the energy consumption and environmental status of high-speed railway stations in China, to formulate relevant design specifications and to further improve thermal comfort of the station environment and to save energy.

2. Description of Energy Use Characteristics

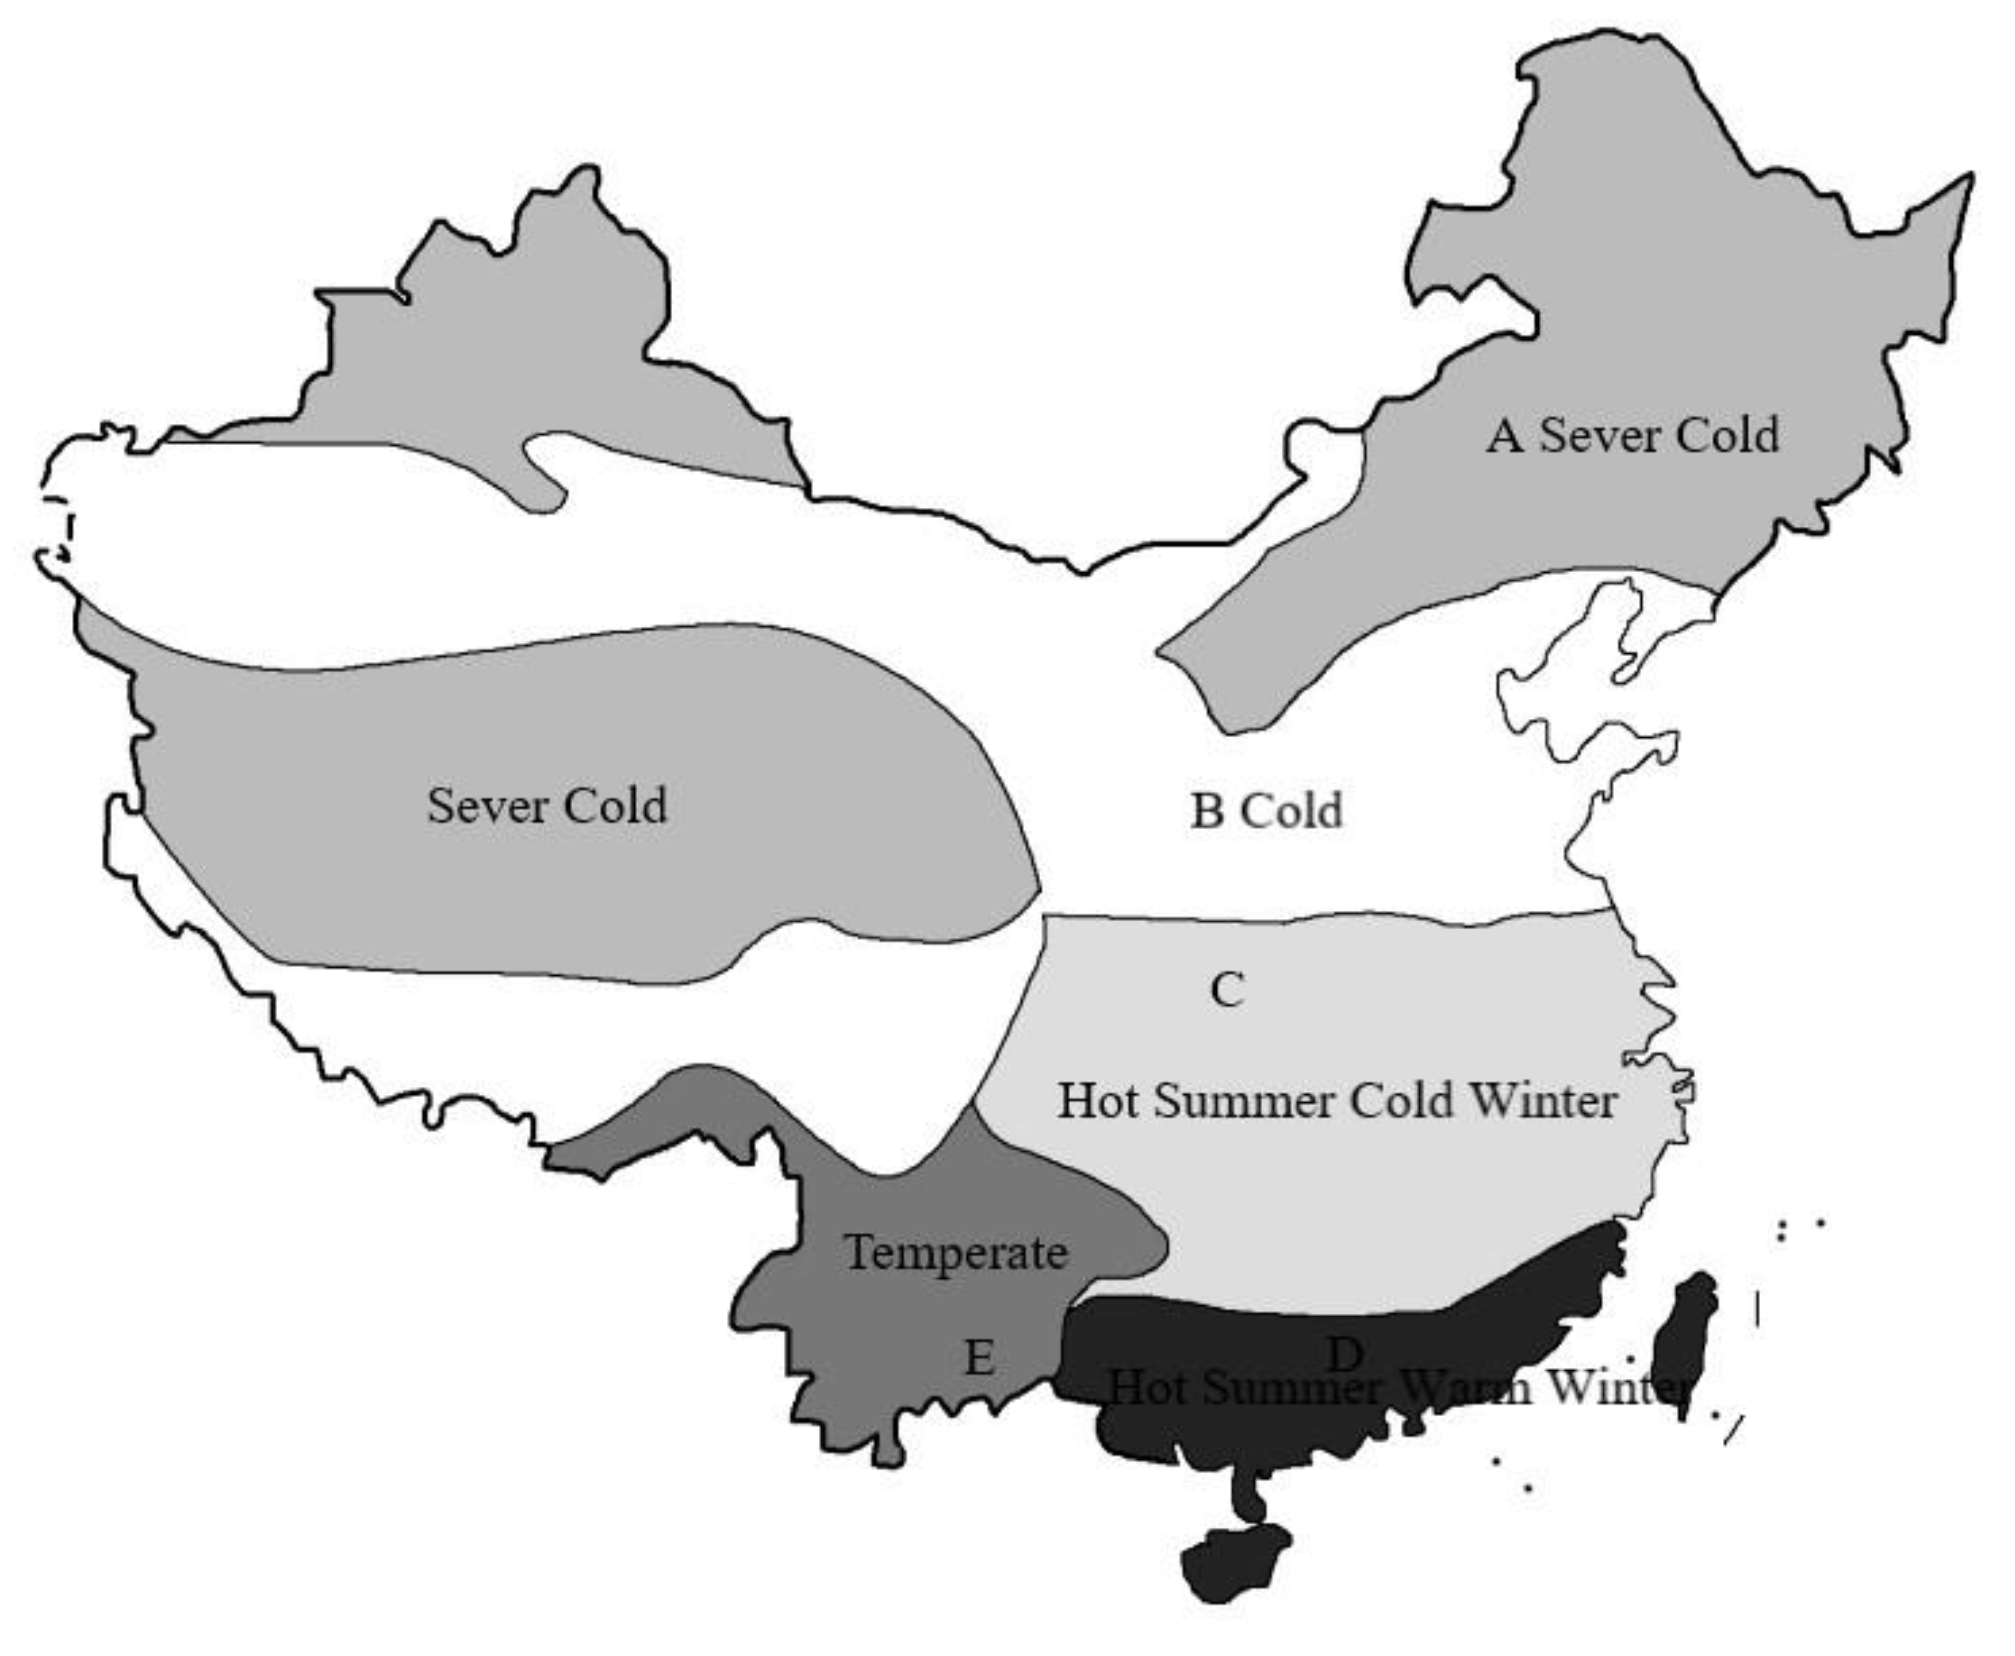
2.1. Description of Data Source

In order to discover the current situation and characteristics of the energy consumption of high-speed railway stations, it is necessary to investigate the energy consumption data of high-speed railway stations of different scales in different climate regions for analysis and collation. According to the Design Standard for Energy Efficiency of Public Buildings (GB50189-2015) [41], five climates are considered, including severe cold (A), cold (B), cold winter and hot summer (C), warm winter and hot summer (D,) and temperate (E) (Figure 1). According to the Code for Design of Railway Station (TB-10100-2018) [42], of stations with a number of passengers dispatched during the peak hour, more than 5000 are large ones and within that, between 1000 and 5000 are medium-sized ones. In this paper, a total of 15 large and medium-sized stations are selected for measurements. The basic information for the selected railway stations is shown in Table 1. In this paper, the annual energy consumption, the passenger flow and the equipment load list of 15 high-speed railway stations in 2018 are provided by the operation department of the station, and the building information of the station is provided by the corresponding design company.
Energy sources used in railway station buildings mainly include electricity and natural gas. In order to facilitate the comparison, all kinds of energy are converted into electricity consumption. Energy consumption of the high-speed railway station comes from the data statistics of the station operation department. Annual and monthly building energy consumption of 2018 is read out by the meters of the distribution station. Energy consumption of items (including lighting, elevator, HVAC system, etc.) is separated by the equipment number and the energy use recorded. During the heating period, energy consumption is calculated by reading the boiler gas meter (Figure 2) or by heating costs.
Most of the investigated high-speed railway stations are not equipped with the sub-item energy consumption measurement system. Annual energy consumptions of the building HVAC system and the heating system are obtained by the energy splitting method [43]. Monthly average power consumption in the transition period, annual energy consumption of the cooling system, and annual energy consumption of the heating system are calculated by Equations (1)–(3) [44,45], respectively:
E g d , j = i = 1 M E g d , i M ,
E c = E c z E g d , j × N c ,
E n = E n z E g d , j × N n ,
where E g d , j is monthly average consumption in the transition period, kWh/month. E g d , i is the monthly energy consumption in the transition period, kWh. M is total number of months during the transition period. E c is annual energy consumption of the air conditioning system, kWh. E c z is total energy consumption in the cooling period, kWh. N c is cooling month number. E n is annual energy consumption of the heating system, kWh. E n z is total energy consumption in the cooling period, kWh. N n is heating month number.
Energy consumption of lighting system is calculated by Equation (4) through statistics of lights in each station:
E L = i m N i × P i × T i × D i × k i × 10 3 ,
where E L is lighting energy consumption, kWh. N i is number of lights. P i is power of light, W. T i is average daily running time of lights, hour. D i is number of days of light operation throughout the year. k i is opening coefficient of lighting, the ratio of the actual number of lights to the total number. m is number of rooms.

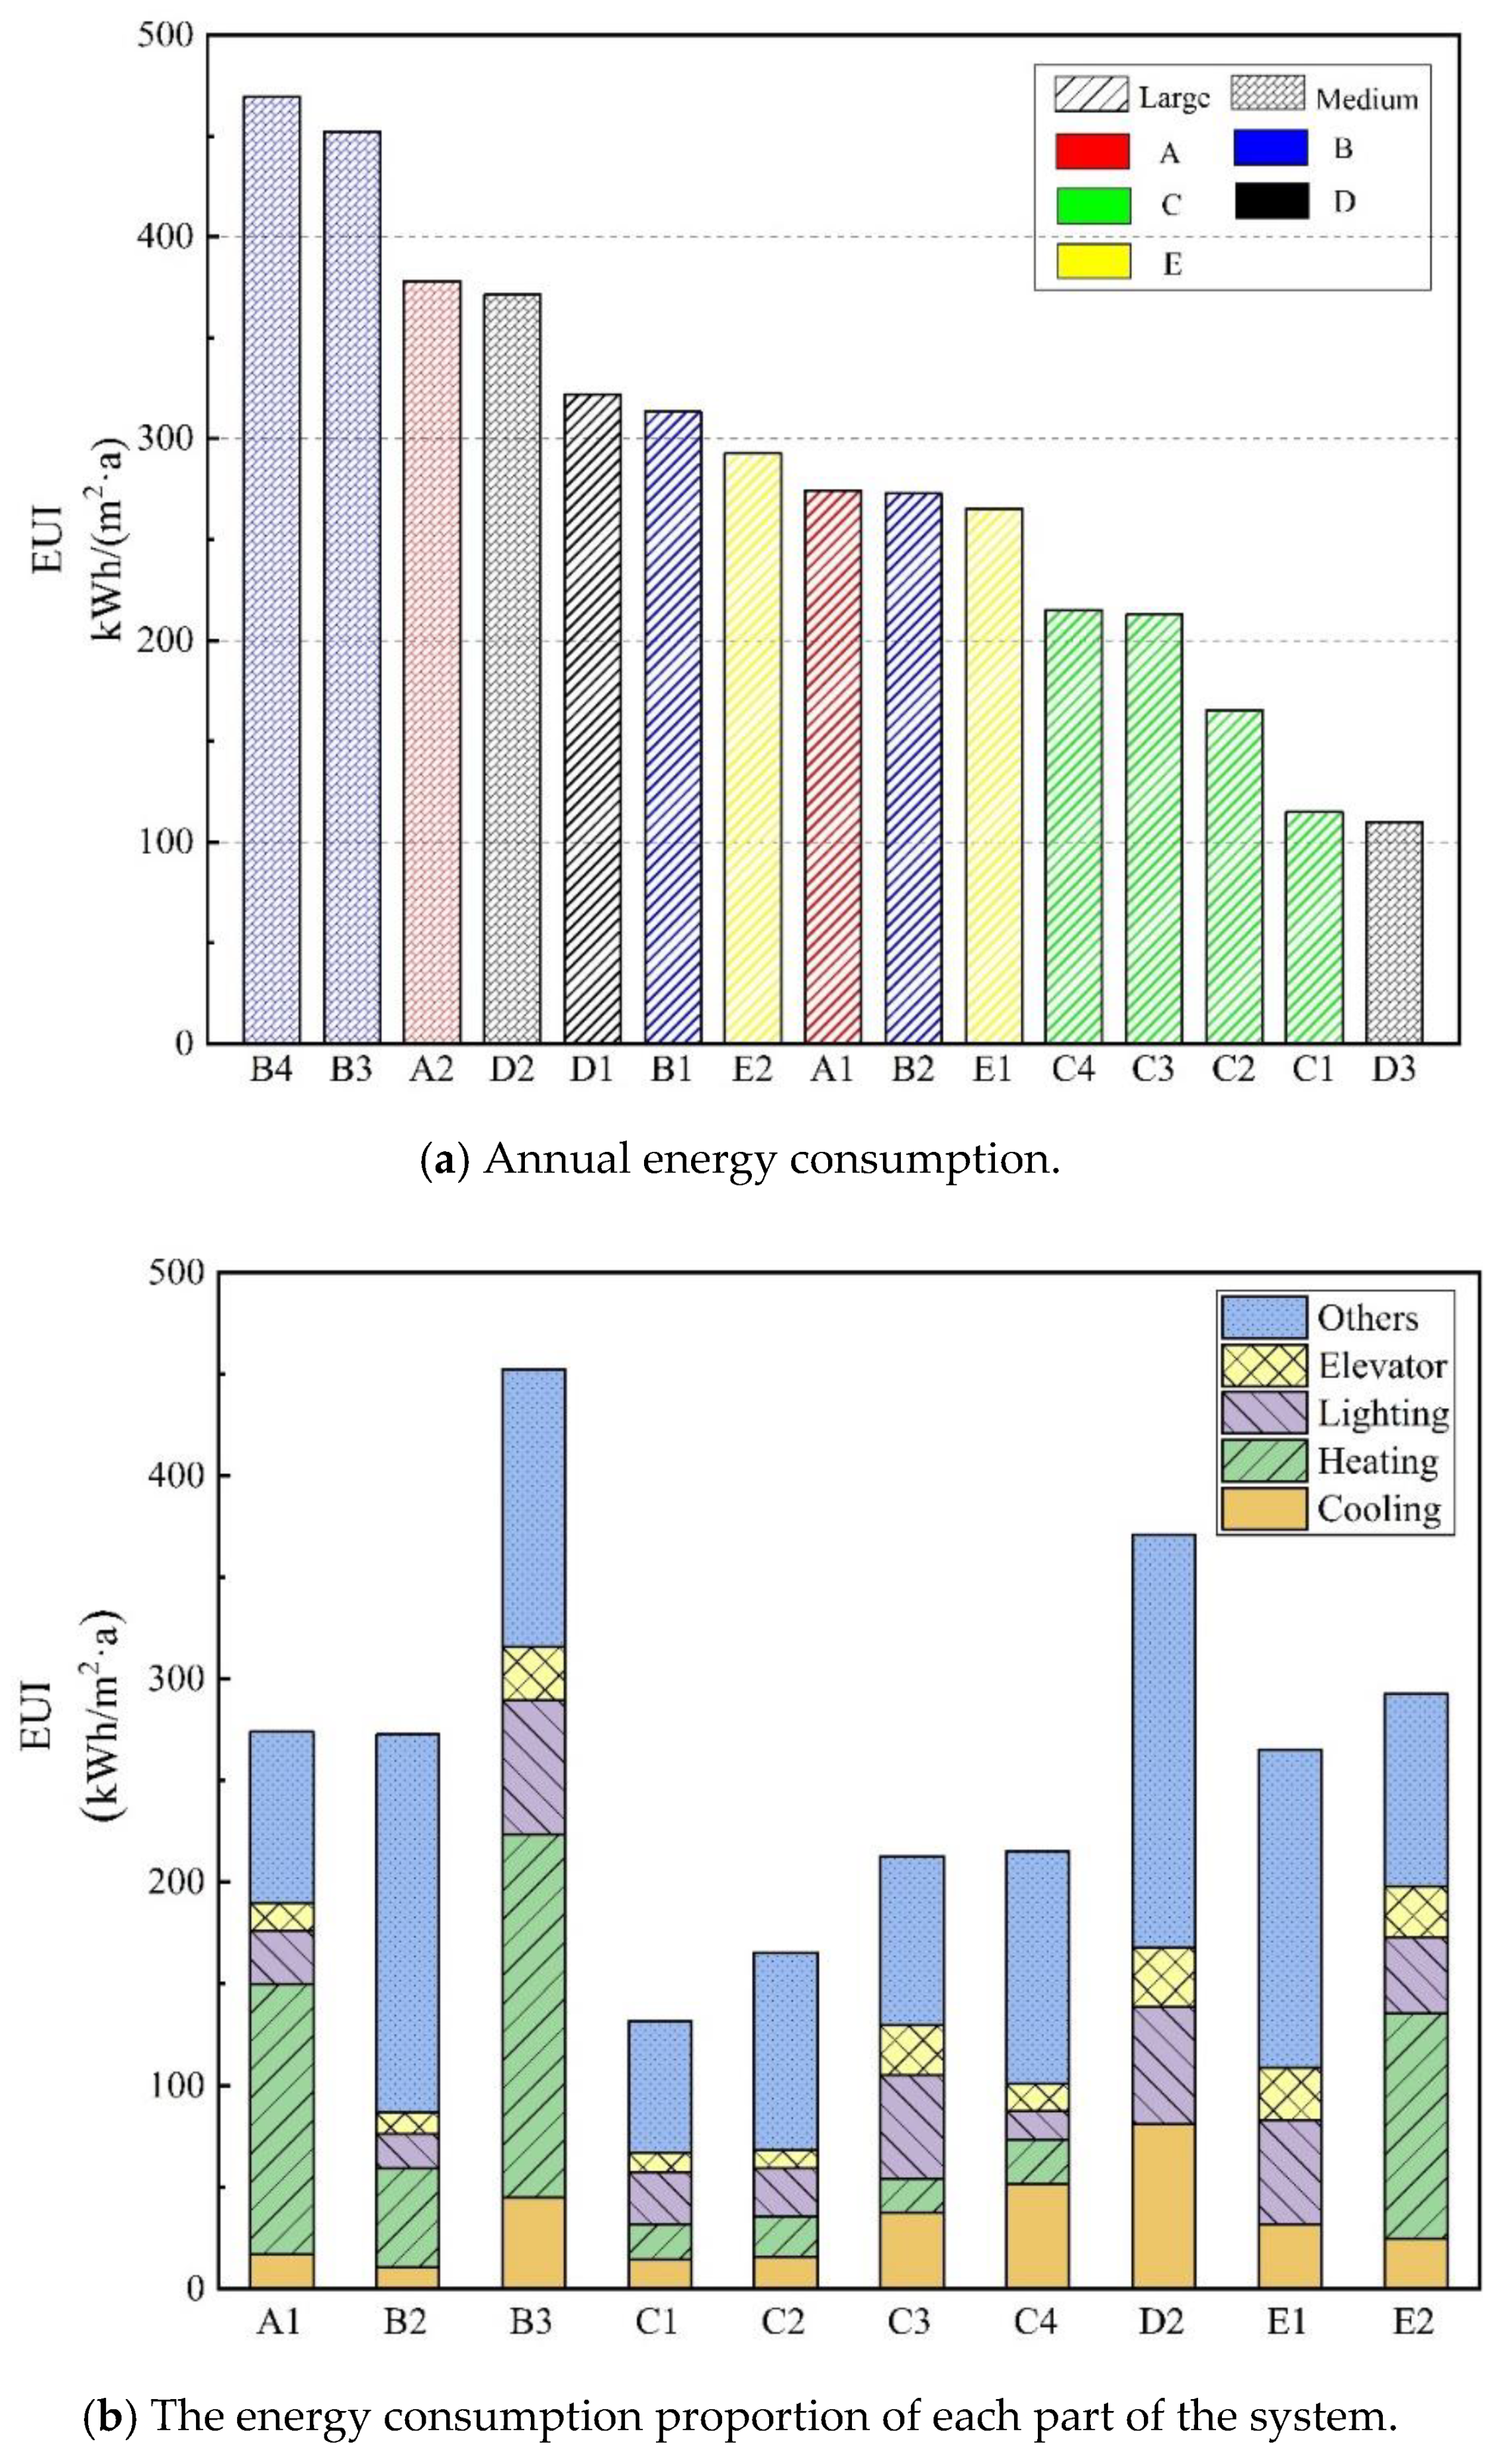
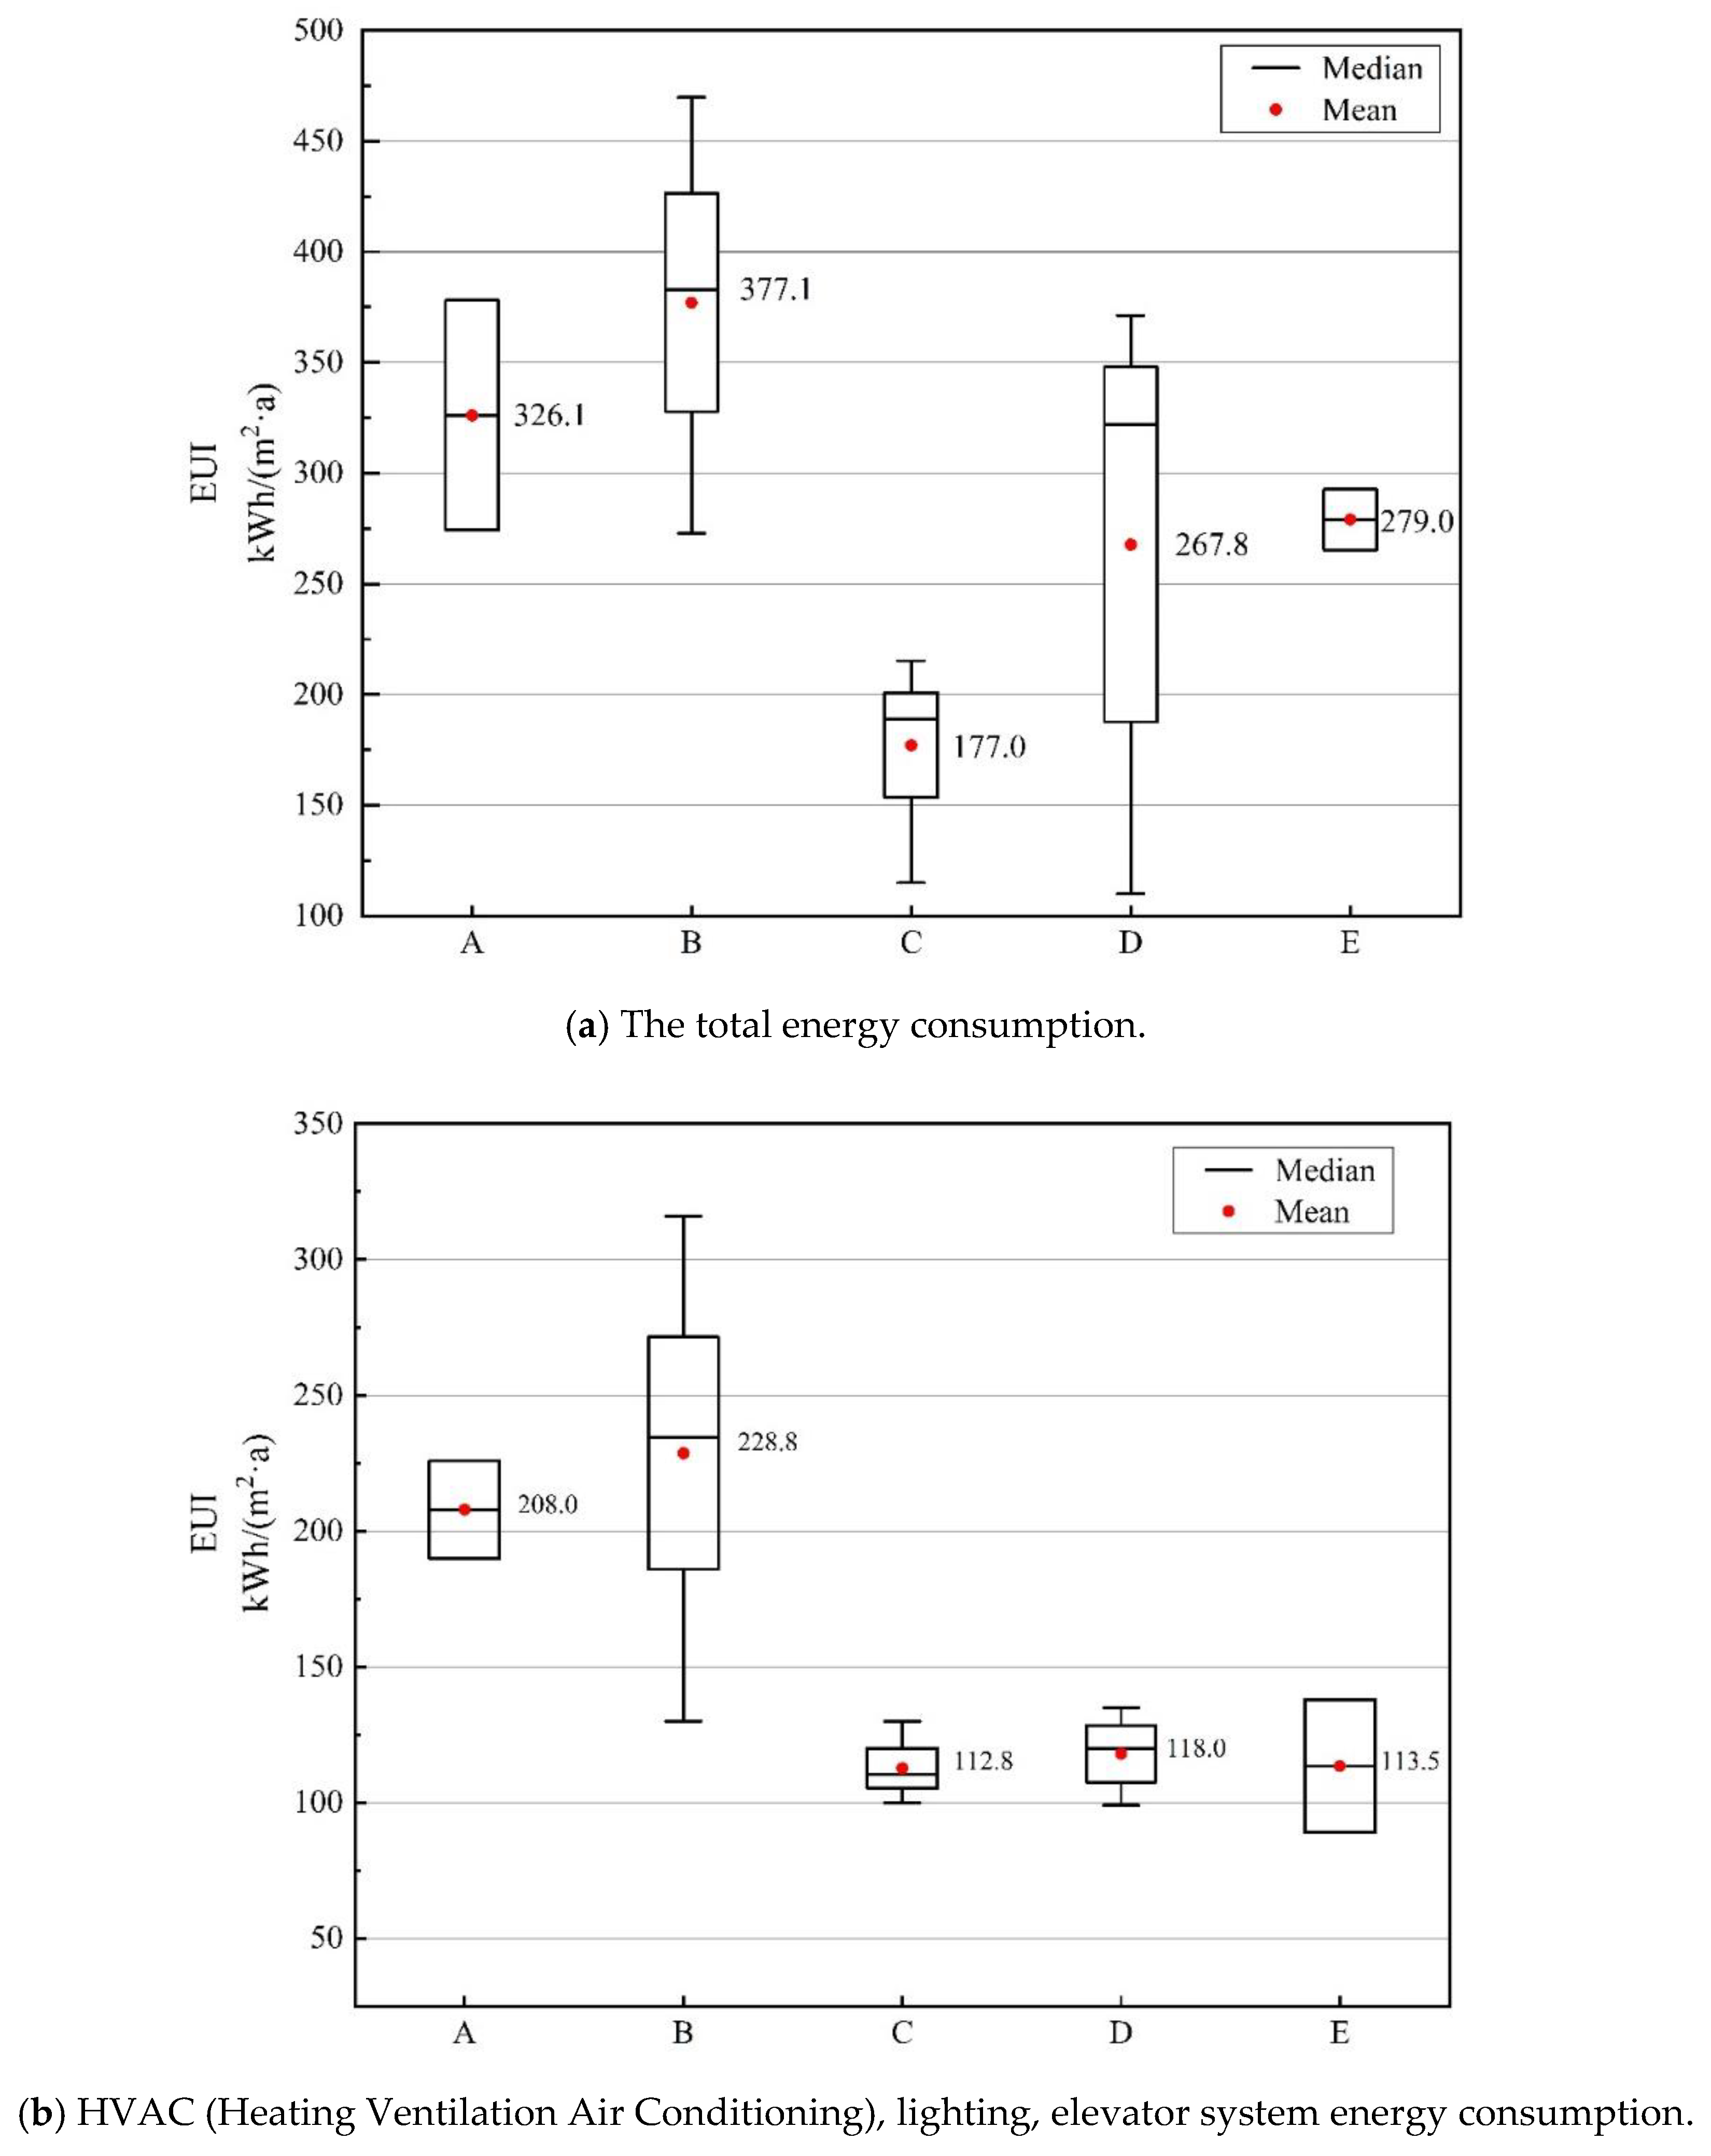
2.2. Energy Consumption Characteristics of High-Speed Railway Stations

All types of energy are converted into equivalent power consumption according to the Classification and Presentation of Civil Building Energy Use (GB/T 34913-2017) [46]. Energy consumption of the high-speed railway station is different from that of the previous stations [29,42]. The annual total energy consumption of the high-speed railway stations ranges from 20 × 106 to 60 × 106 kWh. Figure 3 shows the annual energy use intensity (EUI) of different high-speed railway stations is between 115 and 470 kWh/(m2·a). Results are 10–20% higher than the traditional railway stations [10,47], as the comparison in Table 2. EUI of different stations is related to the climate region and area of the station.
The total energy consumption of smaller stations (B3, D2) is lower, but the EUI is larger. The average EUI of the cooling system in each station is 35.12 kWh/(m2·a), and the heating system is 56.93 kWh/(m2·a). For the overall energy consumption of station buildings, the energy consumption in each station is quite different, but the change of energy consumption proportion in the same climate is very close. Most stations in regions D and E where the climate is warmer in winter do not have the heating system. Regions A and B mainly rely on gas boilers or municipal centralized heat for district heating. With a lower outside air temperature, the energy consumption of the heating system in cold the region accounts for 30–50%. In summer, the energy consumption of the cooling system in regions C and D accounts for 15–35% because of the large moisture load and the high outdoor temperature.
EUI in regions A and B is the largest, while EUI in regions C and E is the smallest. EUI in medium-sized stations is higher than that in large stations. As can be seen from the boxplot (Figure 4) made from the sample results in accordance with the climatic zone, EUI values can be roughly divided into high and low ranges. The main reason for the difference in climate interval is the heating method in winter. According to the classification of EUI of heating, the energy consumption in winter (111.5 kWh/(m2·a)) using the district heating is much higher than that of the station using non-district heating (Figure 5) (18.7 kWh/(m2·a)). Figure 6 shows the relation between EUI and station area by dividing the sample into two types, district heating and non-district heating. EUI of both stations is related to the number of the area, but the gap of EUI will increase with the area.

3. Environment Measurements

Energy consumption and passenger comfort are related to the quality of the environment. It mainly includes light comfort and lighting energy consumption, thermal comfort and HVAC system energy consumption, air quality and mechanical ventilation and infiltration air volume. Although people’s subjective perception of the environment, such as the material of the structure and the design style of the building, can also affect the comfort of the building, it is not taken into account in this paper because there is almost no difference in the construction of the high-speed railway station. In this work, the indoor illumination, the thermal comfort, and the air infiltration of selected high-speed railway stations are measured. All the analyzes of the environmental quality of high-speed railway stations are based on the test results.

3.1. Error Analysis

As errors are often accompanied in the process of testing, in order to determine the accuracy of measurement results, error analysis of test data is needed. In the measurements, the errors of direct and indirect measurements of physical quantities are calculated by Equations (5) and (6), respectively 40. Parameters of the instrument required are shown in Table 3.
γ i = ( w i 2 3 ) 0.5 ,
γ R = ( n = 1 n γ i 2 ) 0.5 = ( 1 3 n = 1 n w i 2 ) 0.5 ,
where γ i is the i th direct measurement error of physical quantity. w i is the i th direct measurement of physical quantity. γ R errors in indirect measurements of physical quantities. n is the number of the direct measurement of physical quantities which is related to indirect measurement of physical quantities.

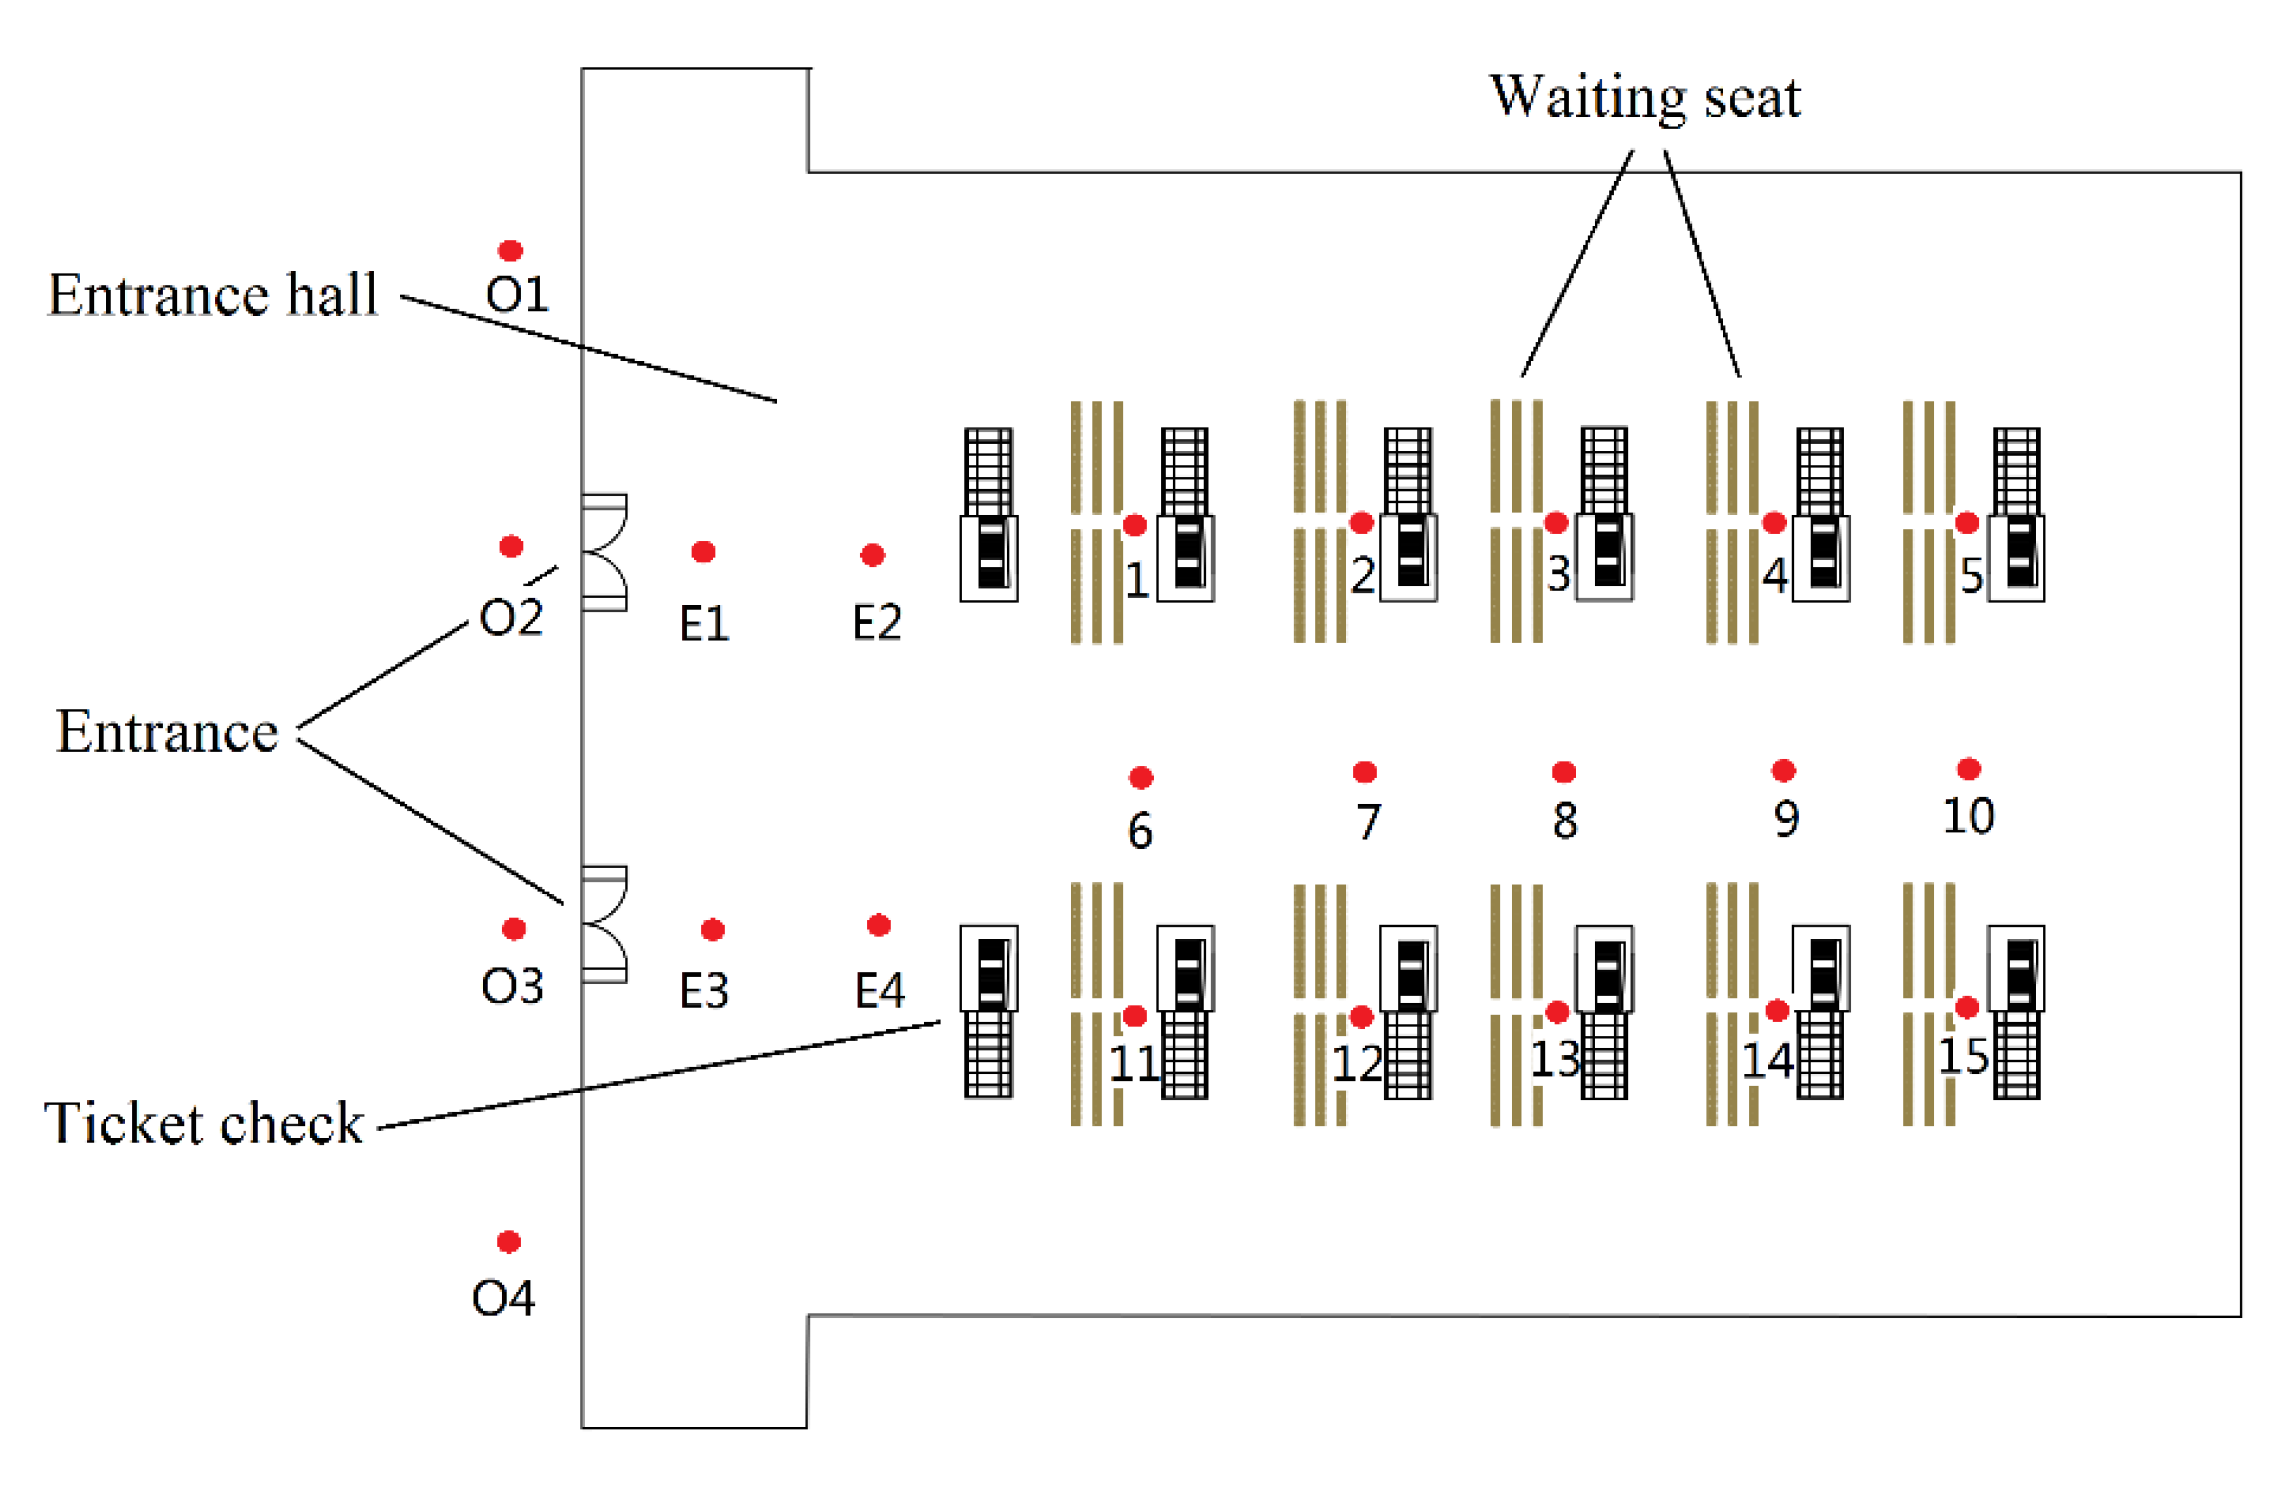
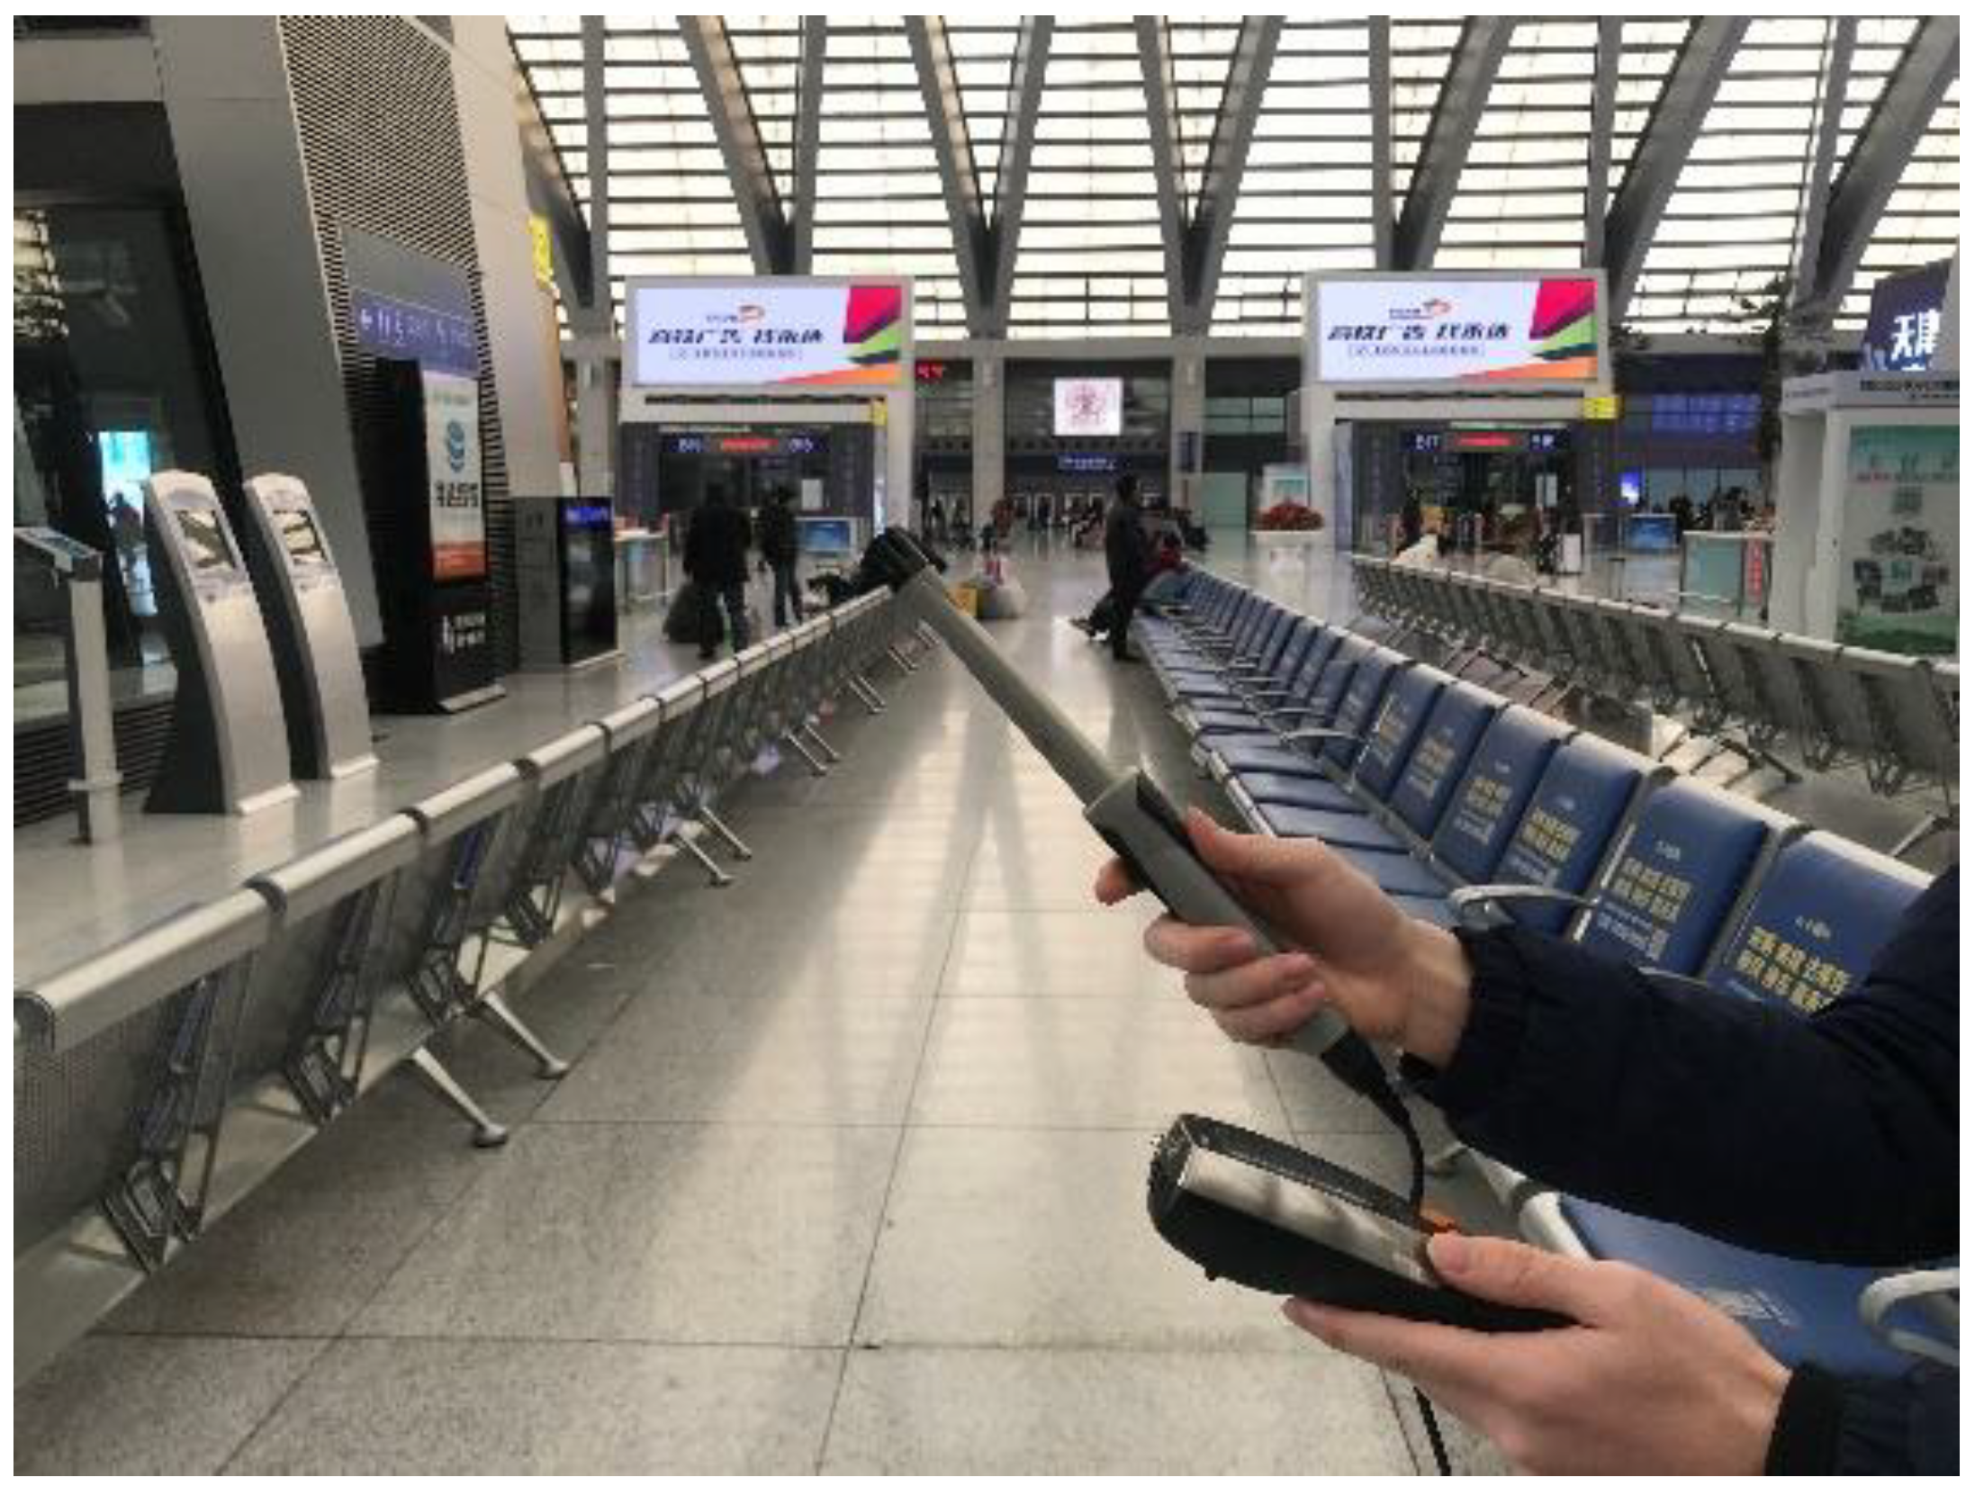
3.2. Measurement Method

The high-speed railway station is mainly composed of the arrival hall, waiting lounge, offices, toilets, and equipment rooms. Among them, the waiting lounge and the arrival hall are the public areas for passengers, and in the waiting lounge, passengers stay for the longest time. At present, the glass enclosure structure is widely used in newly-built high-speed railway station buildings, which fully shows the advantages of natural lighting, whereas the building load may be increased [45]. Light environment is tested in the waiting lounge. The testing time starts from 8:00 to 18:00 during each day, with 2–3 days for each station. According to the space characteristics of the waiting lounge, the measuring points are evenly distributed. Take the station B3 for example, 15 test points as depicted in Figure 7 are placed to record the data every two hours using the luminometer TES-1335. The illuminance value of each measuring point in the waiting lounge is tested every two hours to calculate the variation rule of the average illuminance value in the high-speed railway station.
Measurements of thermal environment mainly focus on the waiting lounge and the entrance hall. Parameters including air temperature, humidity, wind speed, and average radiation temperature (black globe temperature) are tested. Thermal sensation is also affected by the outdoor temperature, so the outdoor temperature is tested at the same time. The activity intensity and the personnel density of passengers in different functional areas vary, and the thermal environment is different from each other. To measure the air temperature difference between the inside and the outside, four measuring points are placed outside the station and four in the entrance hall. Measuring points in the waiting lounge are the same as those in the light environment test. Wind speed measurements are placed at 1.5 m above the floor, as shown in Figure 8. All data are recorded every two hours. In addition, a questionnaire survey is conducted among passengers, including age, waiting time, thermal comfort, light comfort, and so on. Each station receives 100 questionnaires per day.
The air infiltration is measured by CO2 concentration method, and the air change rate of the station is calculated by the difference of the CO2 concentration between indoor and outdoor. CO2 concentrations both in the waiting lounge and outside the station are measured by the Multifunctional Tester, and the location of the measuring point is the same as that in the thermal environment test. Each measuring point is tested every two hours. To ensure the accuracy of the data, each test lasts five minutes until the reading is stable.

3.3. Results

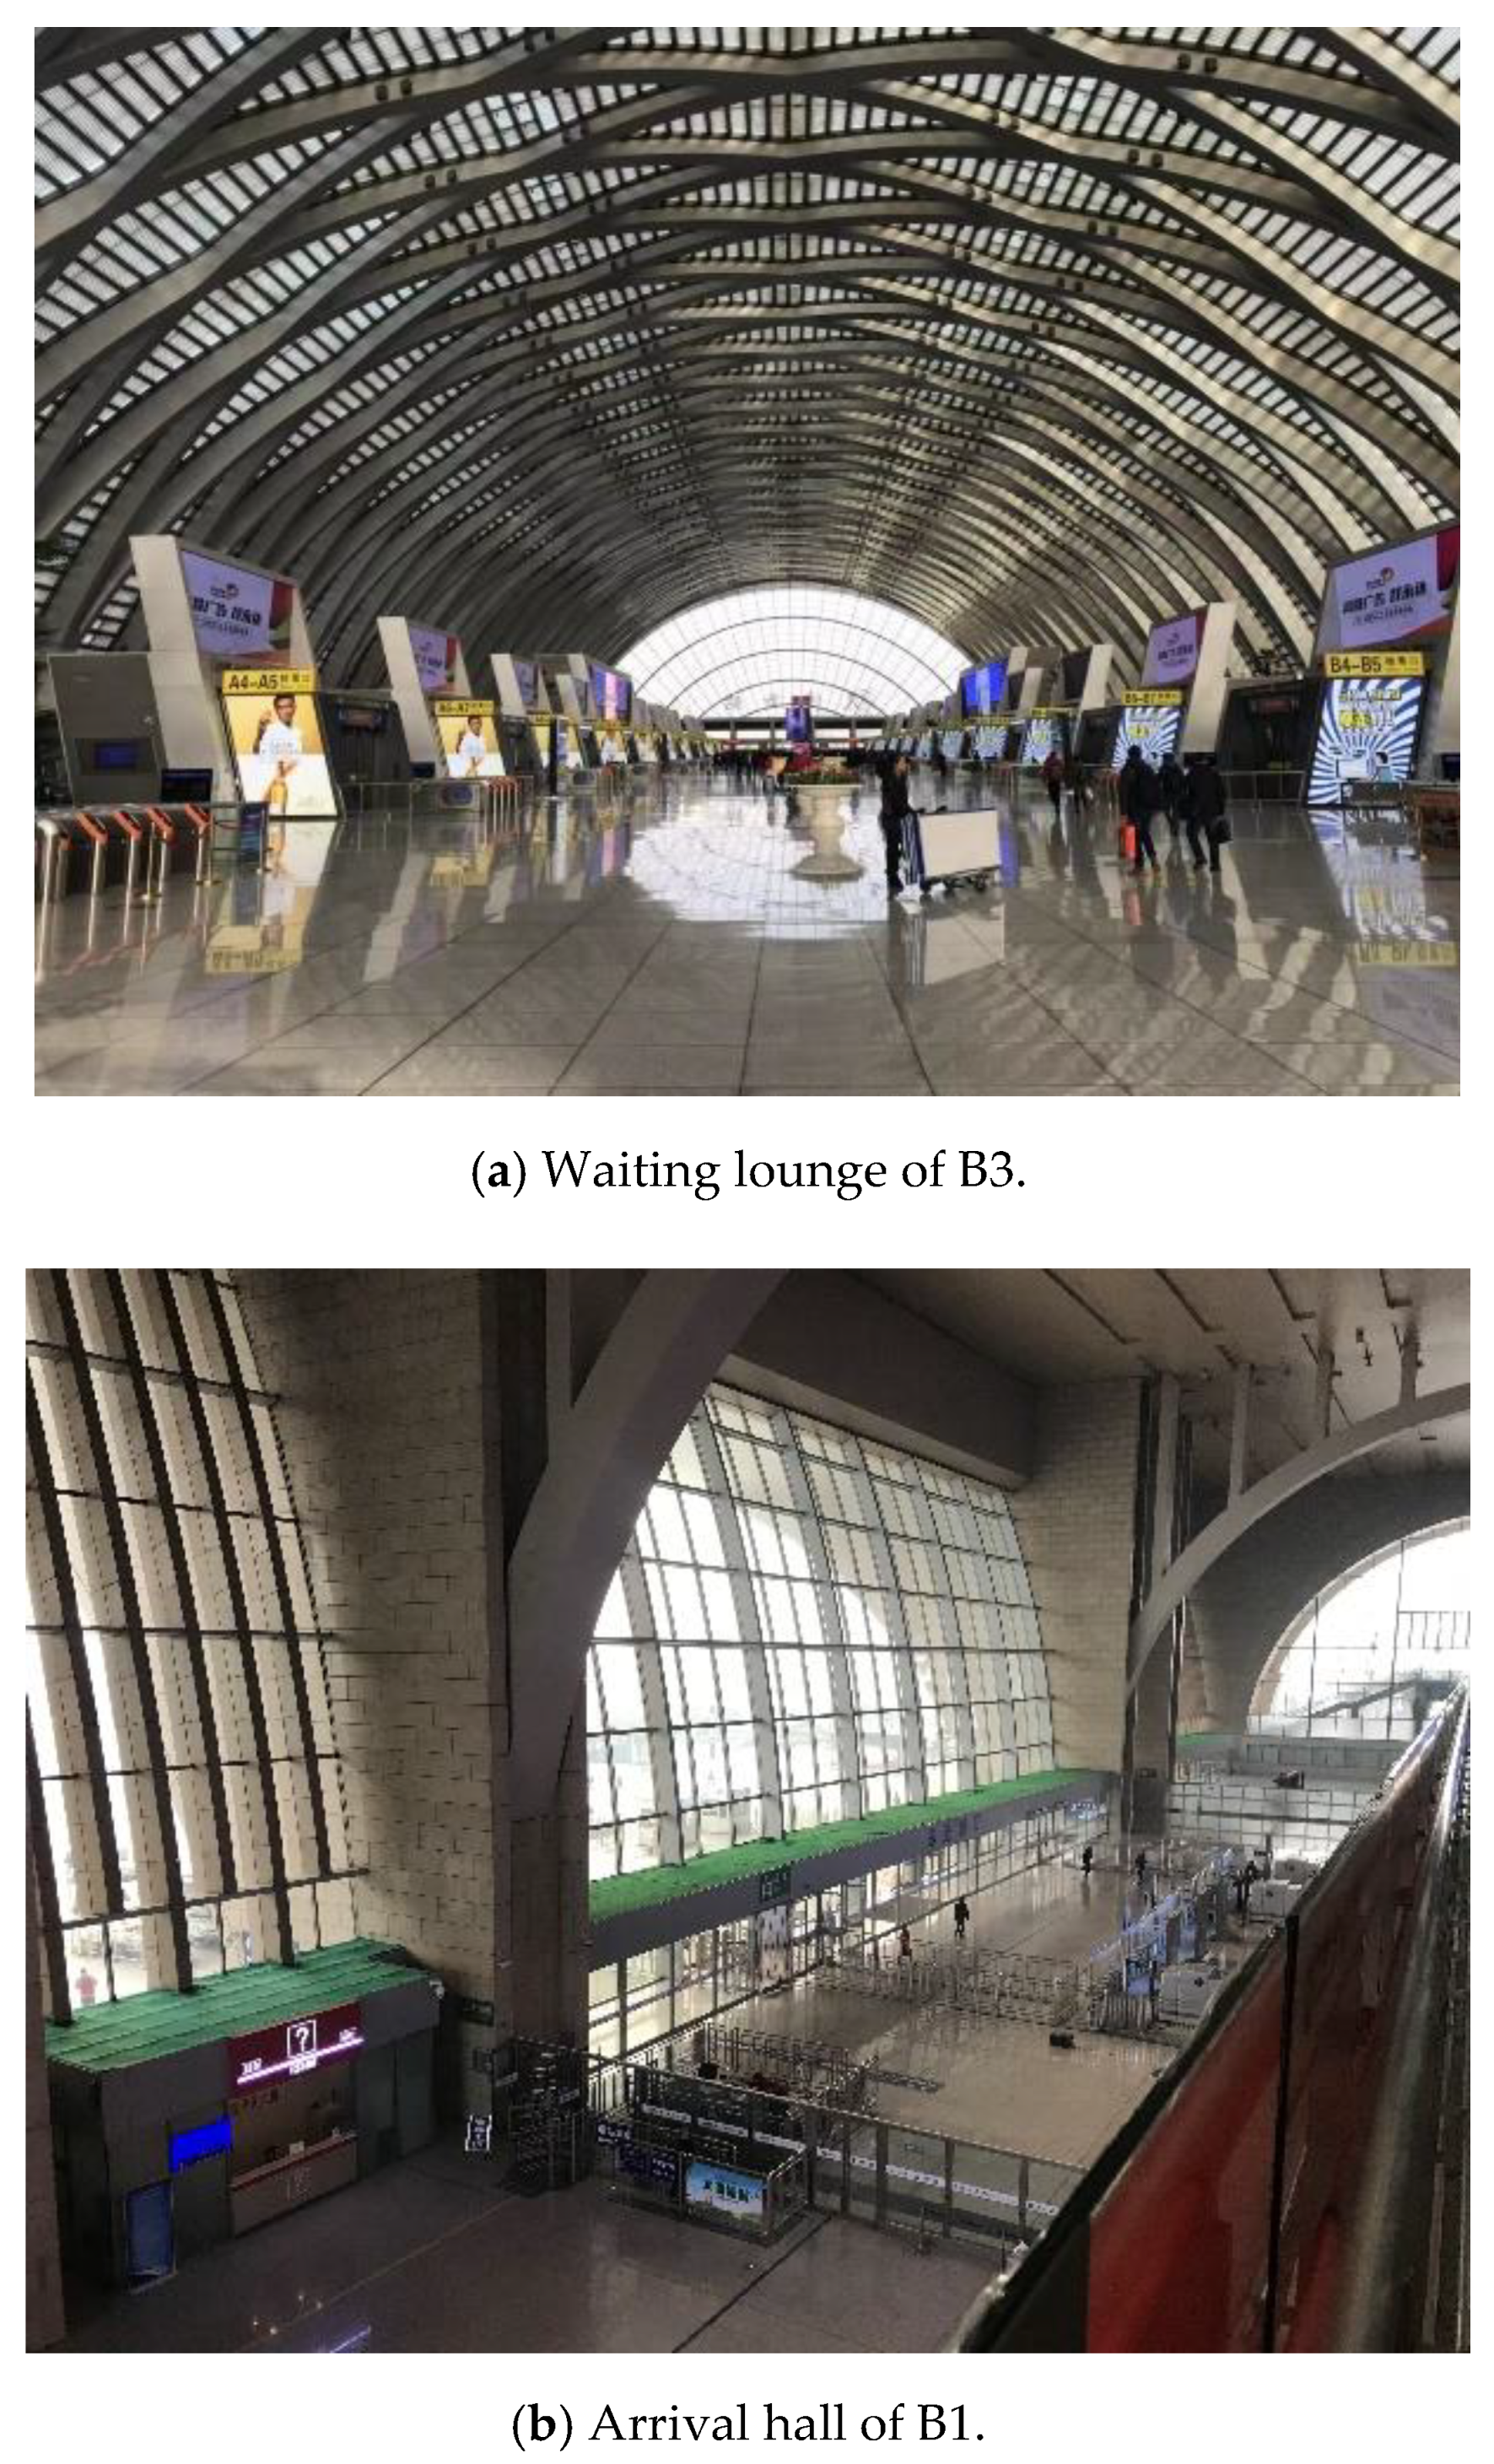
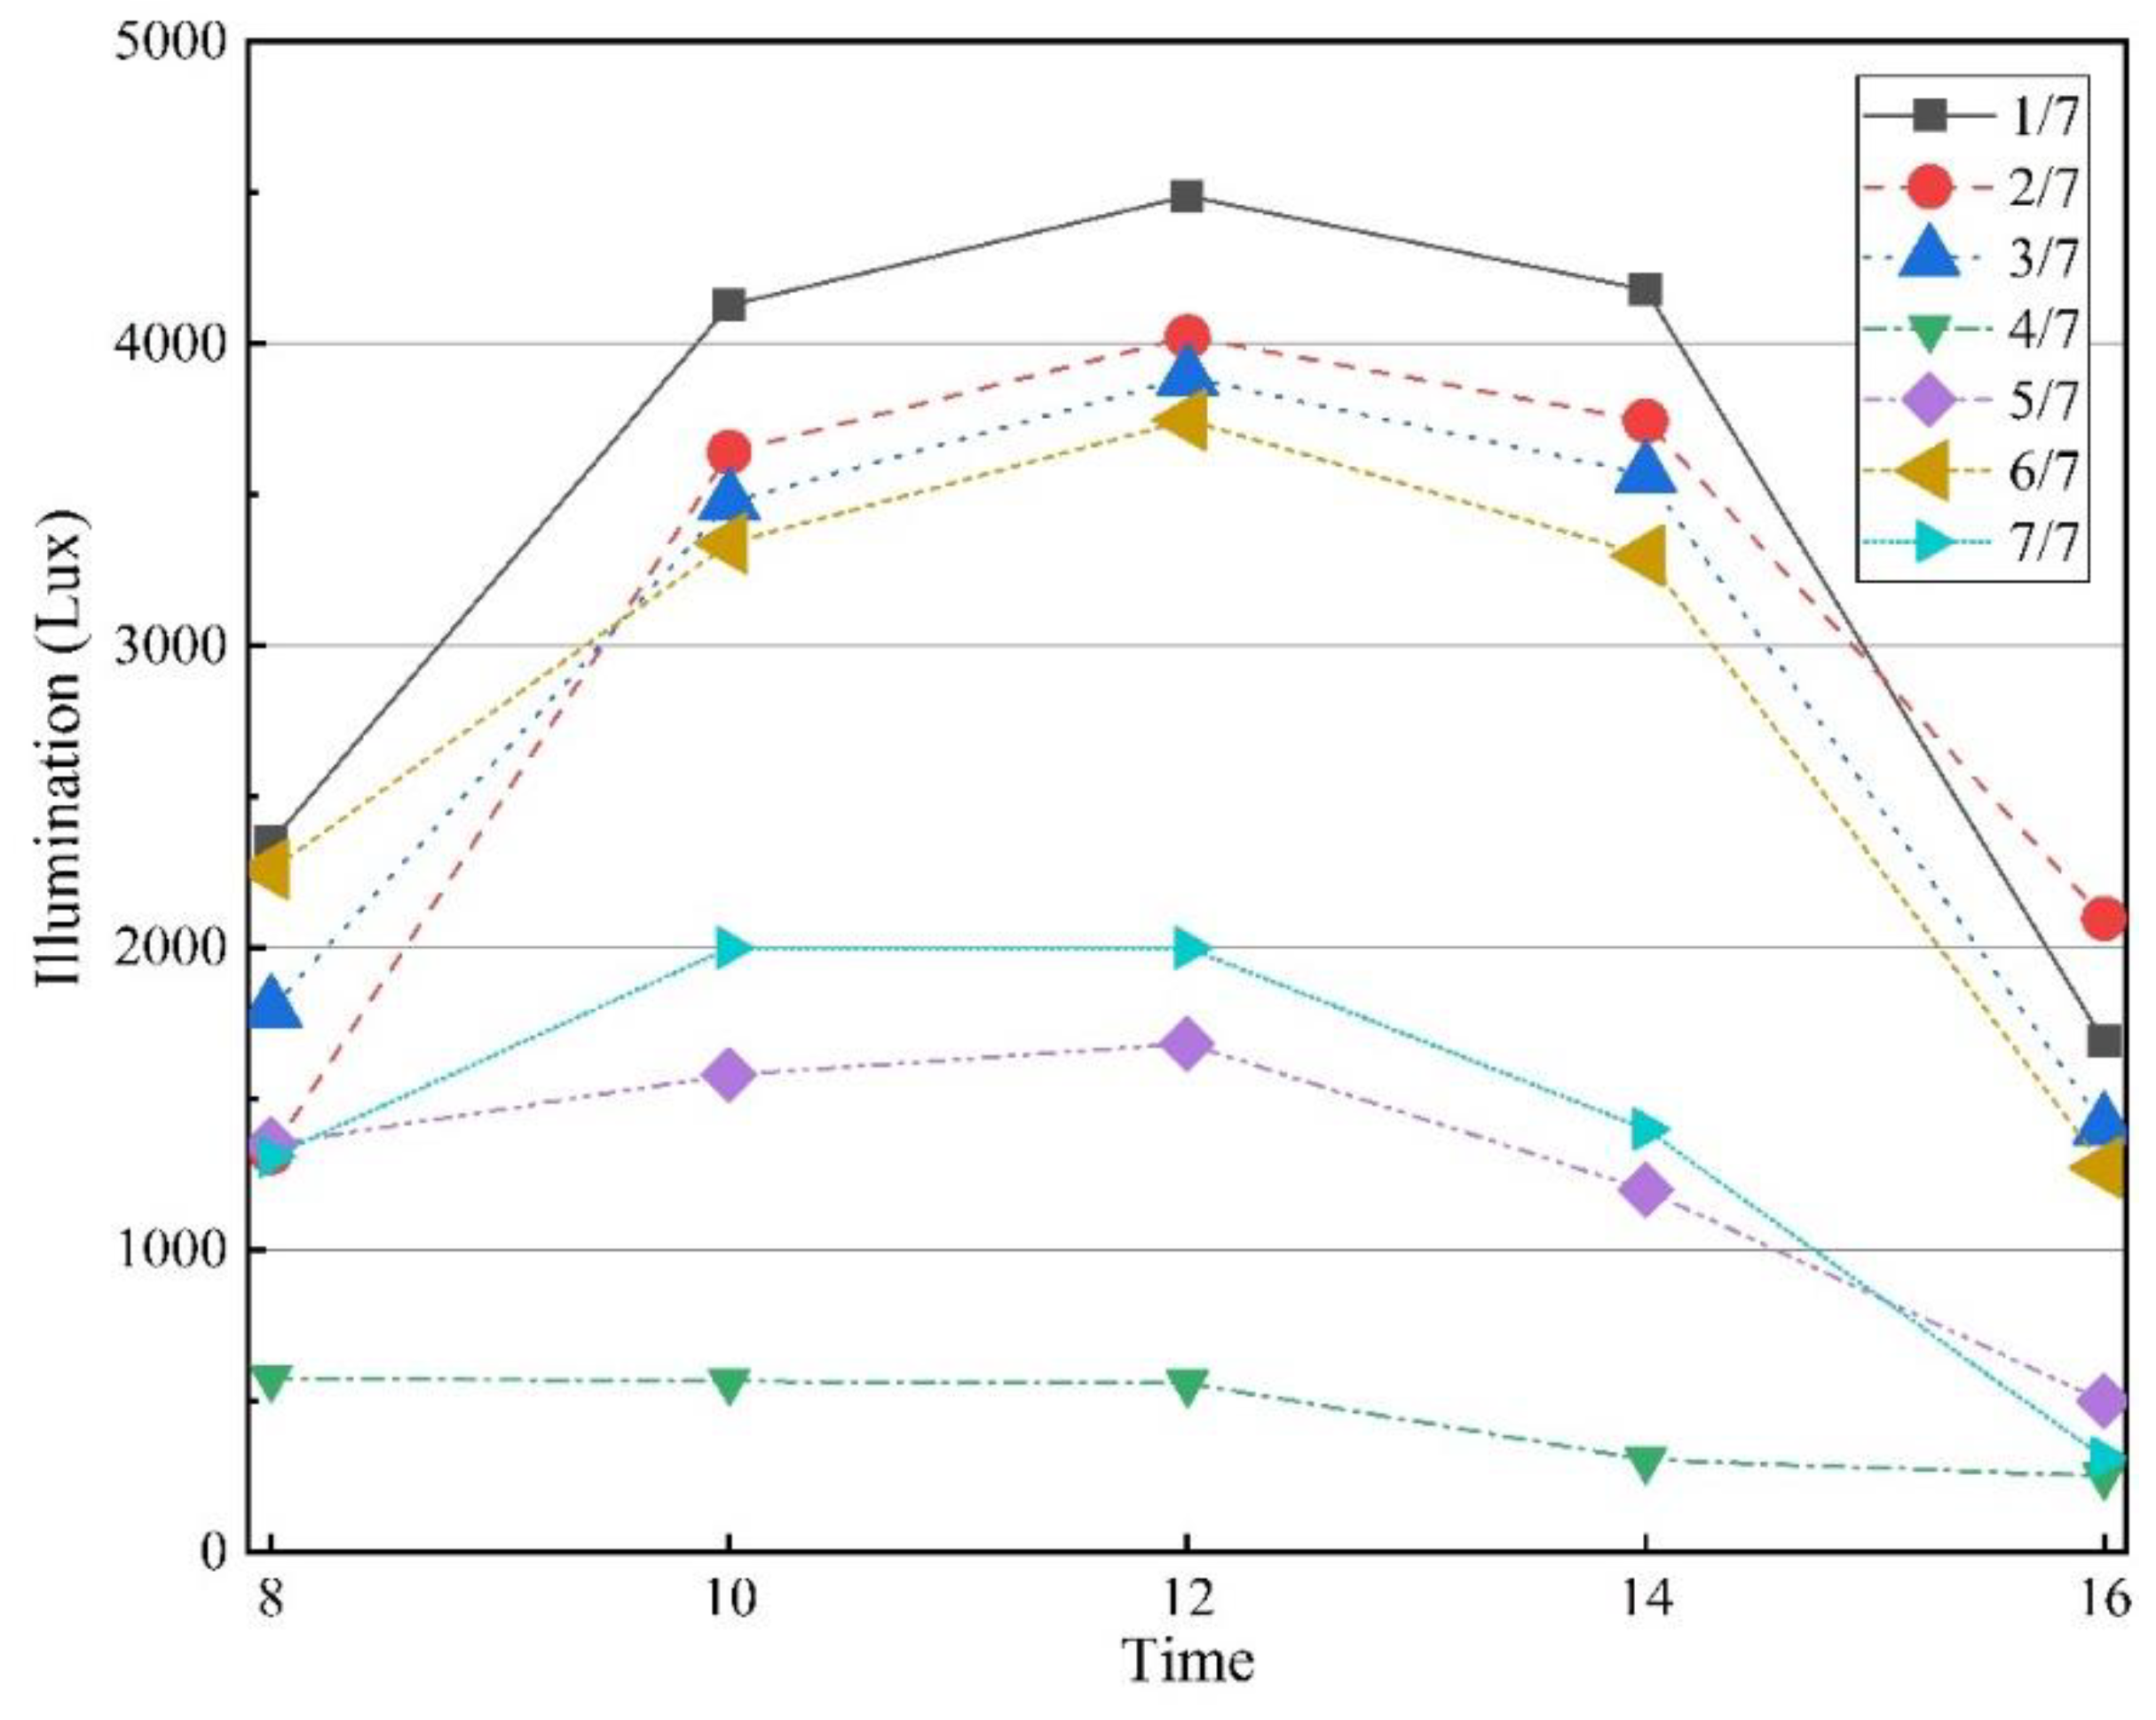
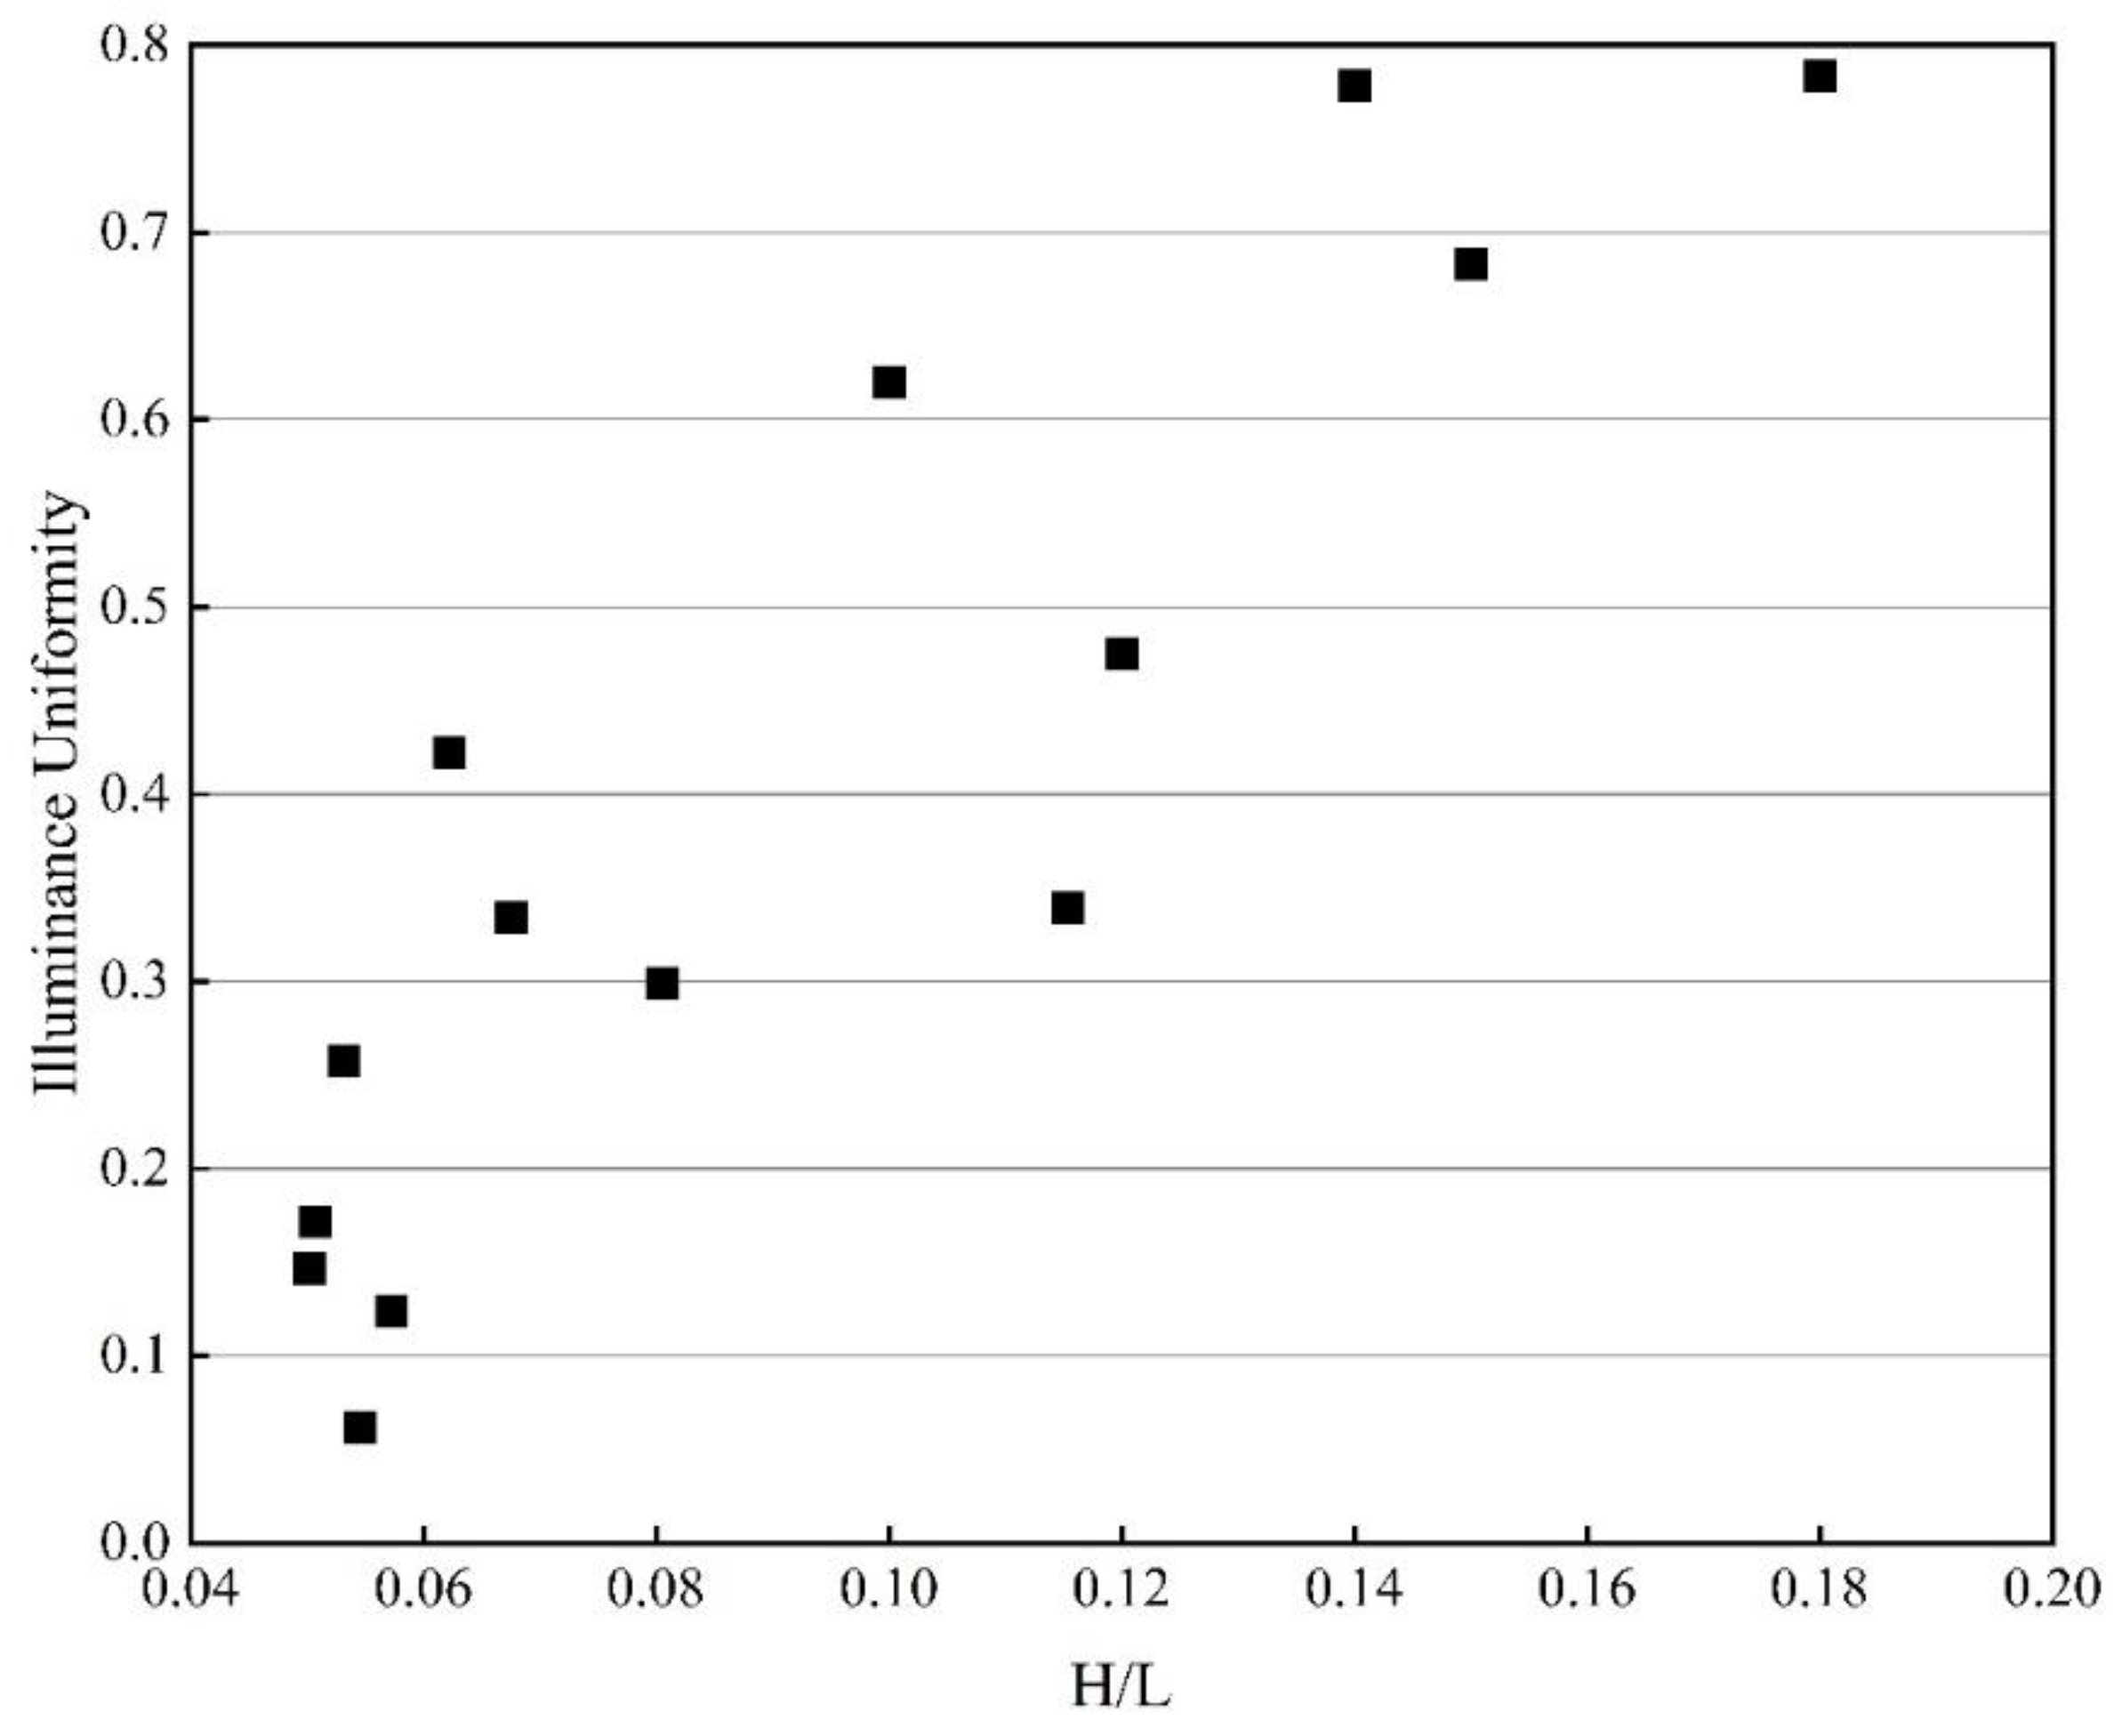
3.2.1. Light Environment

A large amount of glass enclosure is used as the enclosure structure of the high-speed railway station, as shown in Figure 9. The station glazing ratio is between 50–70%. Average illumination in most stations is much higher than the standard requirement of 100 Lux [48]. However, this does not mean that the good lighting effect is obtained, and the homogeneity needs to be considered. The use of natural lighting makes the illumination in the station vary greatly during the day. Figure 10 shows the change of illumination average value of different depth positions in B2 station during a summer day. It can be seen that the area affected by the natural lighting in B2 station accounts for 4/7 of the waiting room space of the station. The illumination in the middle of the station is relatively stable, which leads to the poor uniformity of illumination in the station. The main reason may be related to the regional radiation amount, the height of the station building, and the length of the lighting direction. Considering the maximum period of natural lighting (12:00), comparing the lighting homogeneity and the ratio of height to depth in different stations, it is found that there is a logarithmic relationship between them (Figure 11). Increasing the height can achieve better homogeneity but with the increasing energy consumption of HVAC. It is more feasible to use the shading or reduce the proportion of glass maintenance structure to alleviate the problem of uneven illumination.
Passengers reflect that the daytime is brighter and the appropriate shading should be considered to improve the light comfort. The lighting control mode in the station is relatively simple and the response is slow with a certain time lag, which is also proved by the station staff. Normally, the glass curtain wall has poor thermal insulation and low air tightness. It is necessary to balance the relationship between natural lighting and energy consumption of the HVAC system to optimize the design.

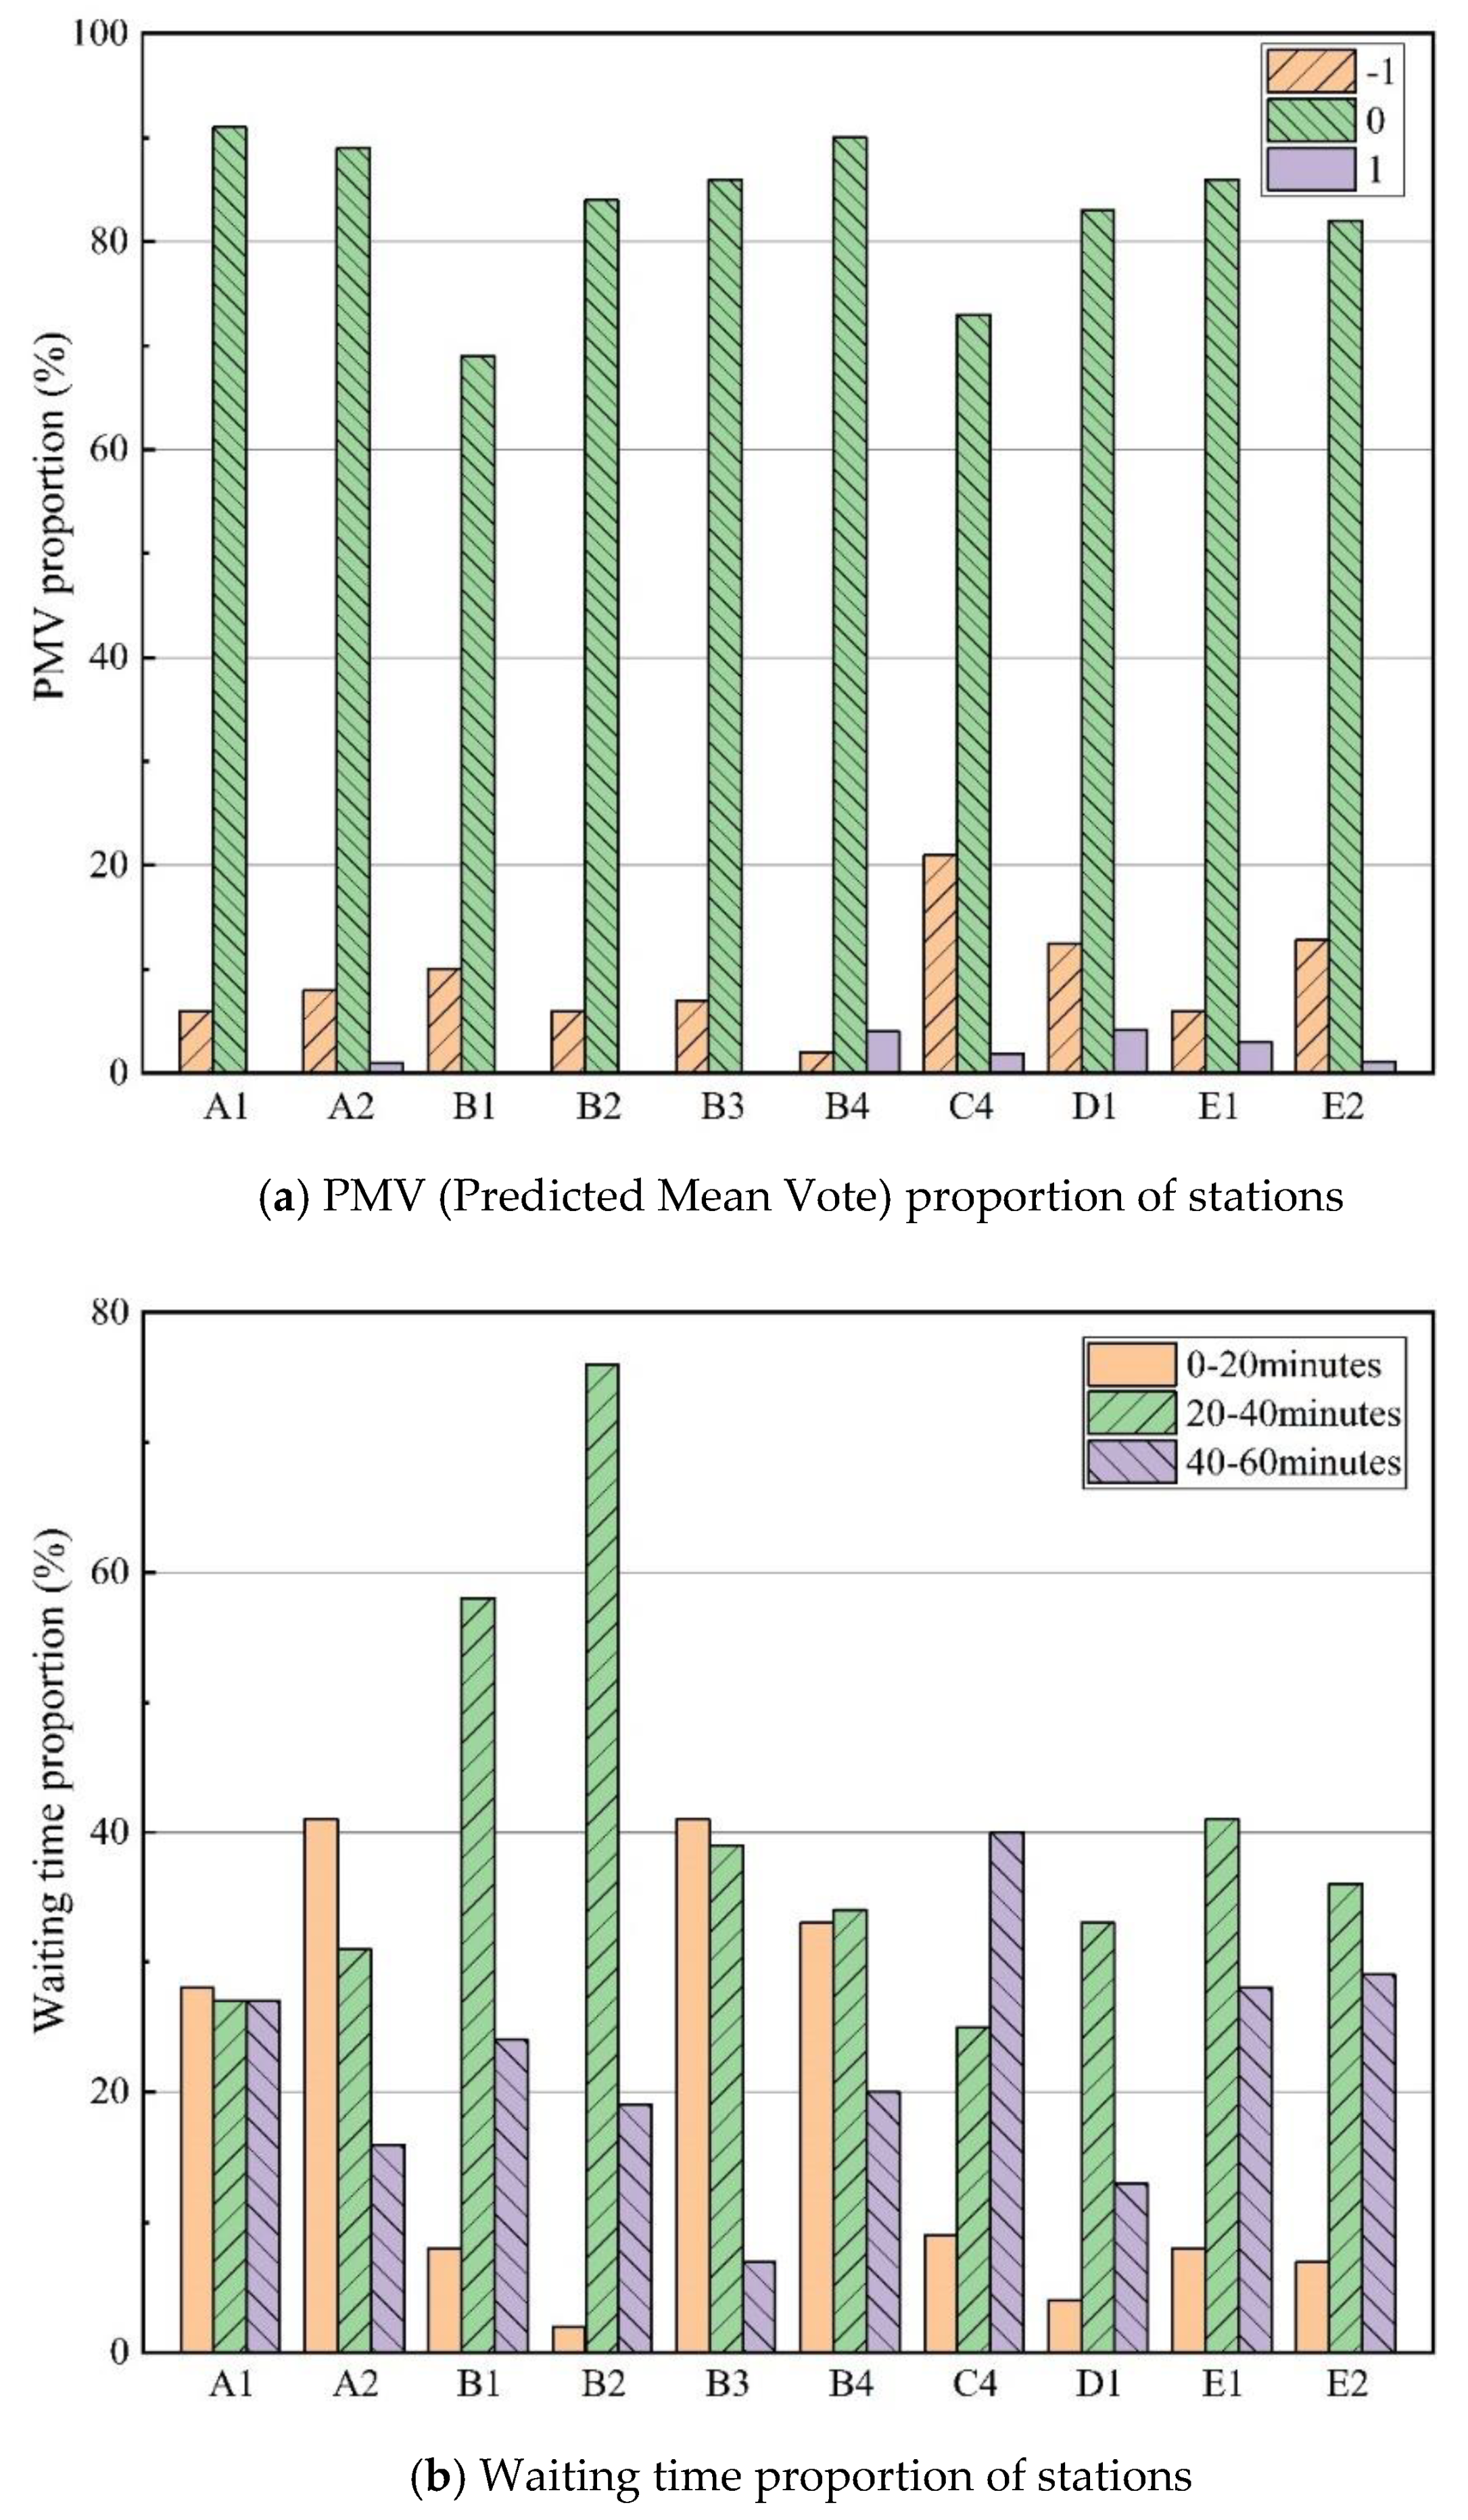
3.2.2. Thermal Comfort and Thermal Environment

The measured indoor temperature, humidity, radiation temperature, wind speed, and outdoor temperature are shown in Table 4 and Table 5. During the test, air conditioning systems are closed in the stations D1, D2, D3, and E1. Two hundred valid questionnaires are carried out in each station, including passenger age, gender, waiting habits, comfort, and other information.
PMV (Predicted Mean Vote) ranges from hot (+3) to cold (−3) according to the ASHARE 7 scale [49].Through the survey of passenger thermal comfort satisfaction in winter, it is found that the majority of PMV are within −1~+1 as depicted in Figure 12a, indicating that the temperature in the waiting lounge can be accepted by most passengers. Most uncomfortable passengers feel that the station environment is cold in winter. Moreover, the thermal sensation of passengers in regions C and D is much colder than that in regions A and B, and the average temperature measured is lower as well. Main reasons are the high humidity in these climatic regions, the large opening of buildings and the lack of cold wind protection measures in winter. Because there is no need to consider the dehumidification in regions A and B, the windshield curtain wall and the glass house are installed in the entrance and the exit, where the insulation effect is improved.
Thermal sensation in the waiting lounge changes with the stay time. When passengers enter into the station, there is a kind of warm comfort due to the temperature difference between the indoor and the outdoor. As they stay longer, the comfort decreases. The average waiting time for passengers at traditional passenger stations is 68 min [50]. Questionnaire survey shows that the waiting time of passengers in high speed railway stations is shorter within 60 min. Very few passengers wait more than an hour. Figure 12b shows the proportion of passenger waiting time at different stations. The average passenger waiting time at all stations is about 40% within 20–40 min. As A2, B3, and B4 are medium stations, they have more short-distance trains, so the waiting time of passengers is shorter, accounting for 38% of passengers in 20 min. However, A1, B1, B2, D1, E1, and E2 are large stations with a high passenger flow, so the waiting time of passengers in 40–60 min reaches 25.4%. Therefore, passengers feel colder. The difference in sensation increases with the temperature difference between the indoor and the outdoor, and the thermal sensation tends to stabilize after about 40 min. Smaller stations have a higher proportion of passengers feeling comfortable due to the shorter waiting time. Regions A and B have a higher acceptance of the environment because the temperature difference between indoor and outdoor in winter is much greater than that in other regions.
According to ASHARE Standard 55-2017, the operative temperature based on Equation (7) is used for the analysis of thermal comfort in the waiting lounge, which considers the influence of air temperature and average radiation temperature on the human thermal sensation [51,52]:
t 0 = α t a + ( 1 α ) t r ,
where t 0 is operative temperature, °C t a is indoor air temperature, °C. t r is average indoor radiation temperature, °C. α is factor related to the wind speed. When the indoor wind speed is 0–0.2 m/s, take 0.5, when the indoor wind speed is 0.2–0.6 m/s, take 0.6; when the indoor wind speed is 0.6–1.0 m/s, take 0.7.
According to the Reference [53], the mean number of thermal sensory votes (MTSV) is linearly regressed with the operative temperature (t0). Thermal neutral temperature (T0) is obtained when MTVS is 0. Table 6 gives the calculated thermal neutral temperature (T0). In winter, passengers at station B4 feel comfortable and warm in the waiting area, and T0 in the waiting lounges of other passenger stations is 0.3–3.2 °C higher than the average operative temperature, indicating that the thermal sensation in the waiting area is cold. This is consistent with the results of the thermal environment test.
The thermal neutral temperature of the waiting lounge varies greatly in different climate regions in winter. Although the temperature in the waiting lounge of most high-speed railway stations is lower than the design value (18 °C) in the code, most passengers can accept it. In winter, the thermal neutral temperature increases with the waiting time but decreases with the outdoor temperature. The highest thermal neutral temperature of 20.3 °C is found in region A, while the lowest value of 16.5 °C is found in region E. In addition, the waiting time of passengers at stations B3 and B4 is shorter than that at station B2, so the thermal neutral temperature is lower than that at station B2. The situation in summer is similar to that in winter. Therefore, when determining the design temperature, both the climate and the station scale should be considered. A single design parameter will cause the unnecessary energy waste.
According to ASHRAE [52] standard and ISO7730 [54], the regression equation is obtained by the polynomial regression with the operative temperature and the acceptable percentage. Taking the thermal environment with 80% of the passengers satisfied as the comfortable environment 36, the acceptable temperature range of passengers in waiting lounges of each station is concluded in Table 7.
Compared with other types of public buildings, the indoor acceptable operative temperature range of railway station is larger [55]. The acceptable temperature range in high-speed rail passenger stations is larger in winter than in summer. The average operative temperatures measured in stations B1, B2, C4, and E2 are lower than the acceptable range, so the passengers generally feel cold. The main reason is that the air conditioning system is not well maintained and a higher temperature in the station is needed. The average operative temperature measured by station B4 is close to the upper limit of the acceptable range, therefore, the station temperature appropriately can be reduced and energy use is saved.

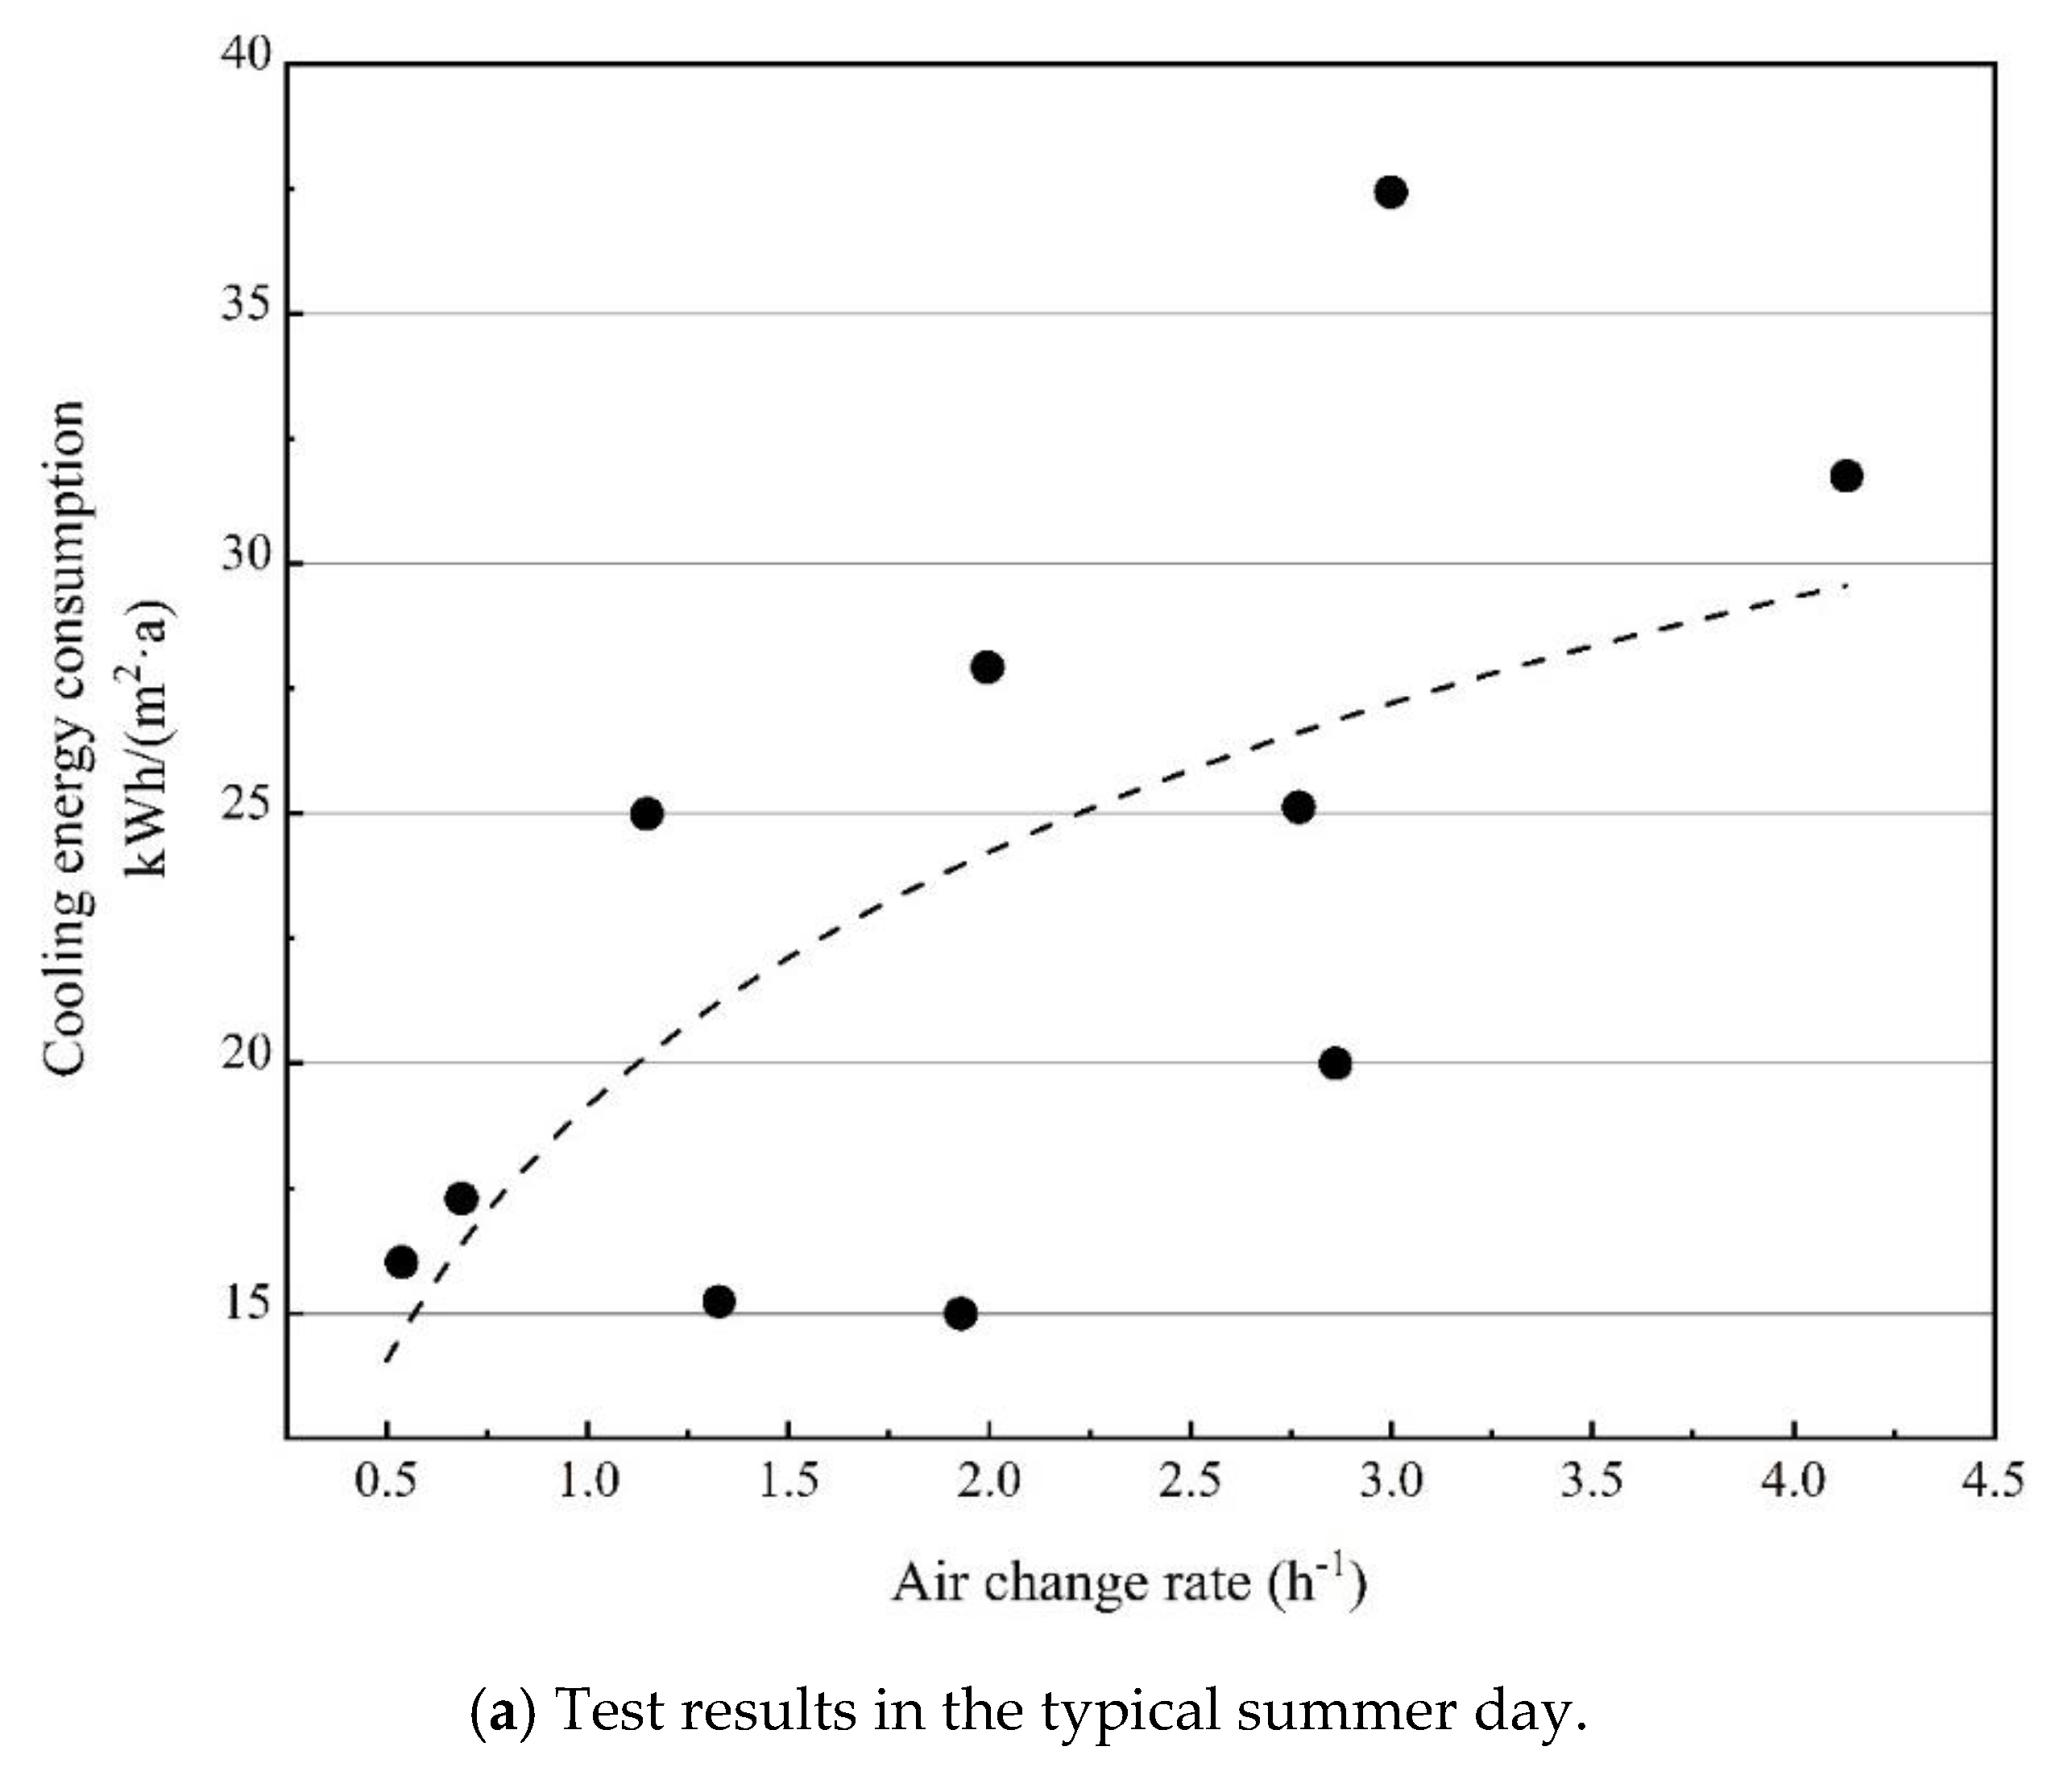
3.2.3. Air Infiltration

Due to the high ceiling height (18–40 m) and the large number of openings in the ground floor, the air infiltration of the high-speed railway station is much larger than that of other public buildings. CO2 concentration can be used as an index to evaluate the fresh air volume and the air quality in buildings. The permeable air volume of the stations is determined by measuring the average values of indoor and outdoor CO2 concentrations in stations both in winter and in summer.
Ventilation standard proposed by ASHARE requires that the difference between the indoor and the outdoor CO2 concentration should be less than 700 ppm, equivalent to the indoor CO2 concentration of less than 1000 ppm [50], In this standard, the minimum fresh air volume for personnel is stipulated as well. The passenger flow of high-speed railway station is larger and it has more openings than other types of buildings. Test results show that the number of openings in winter in regions A and B is 4~8, and that in regions C and D it is 12~20. Table 8 shows the air change rate and the proportion of air infiltration to the load during typical days in winter and in summer for each station. Through interviews with staff, the introduction of mechanical fresh air in regions A and B in winter will do damage to the equipment because of very low outdoor temperature (−20~10 °C). Heating capacity of the heat pump in region C is insufficient in winter, and it cannot meet the fresh air load caused by plenty of mechanical fresh air. The main reason is the low temperature in stations in this area. Therefore, mechanical fresh air in winter is not used in these areas, while in regions D and E, the mechanical ventilation is opened.
The measured CO2 concentration in the waiting lounge of each station is very close to the outdoor value. Results show that the infiltration air volume in the station can meet or even exceed the indoor fresh air demand. Therefore, if the infiltration air volume cannot be controlled in the design, the mechanical fresh air can be adjusted to save energy. There is a logarithmic relationship between air infiltration volume and EUI (Figure 13), and the influence of osmotic wind on the station energy consumption in winter is greater than that in summer. Since the fresh air volume in the station is sufficient to meet the human body’s needs (the number of ventilations in the specification is 1 h−1), reducing the permeable air volume has become the most feasible energy saving method, and it is very effective to reduce the ceiling height or increase the resistance at the opening.

4. Conclusions

This paper carries out some field measurements in 15 high-speed railway stations in five climatic regions in China. Some important findings are concluded as follows:
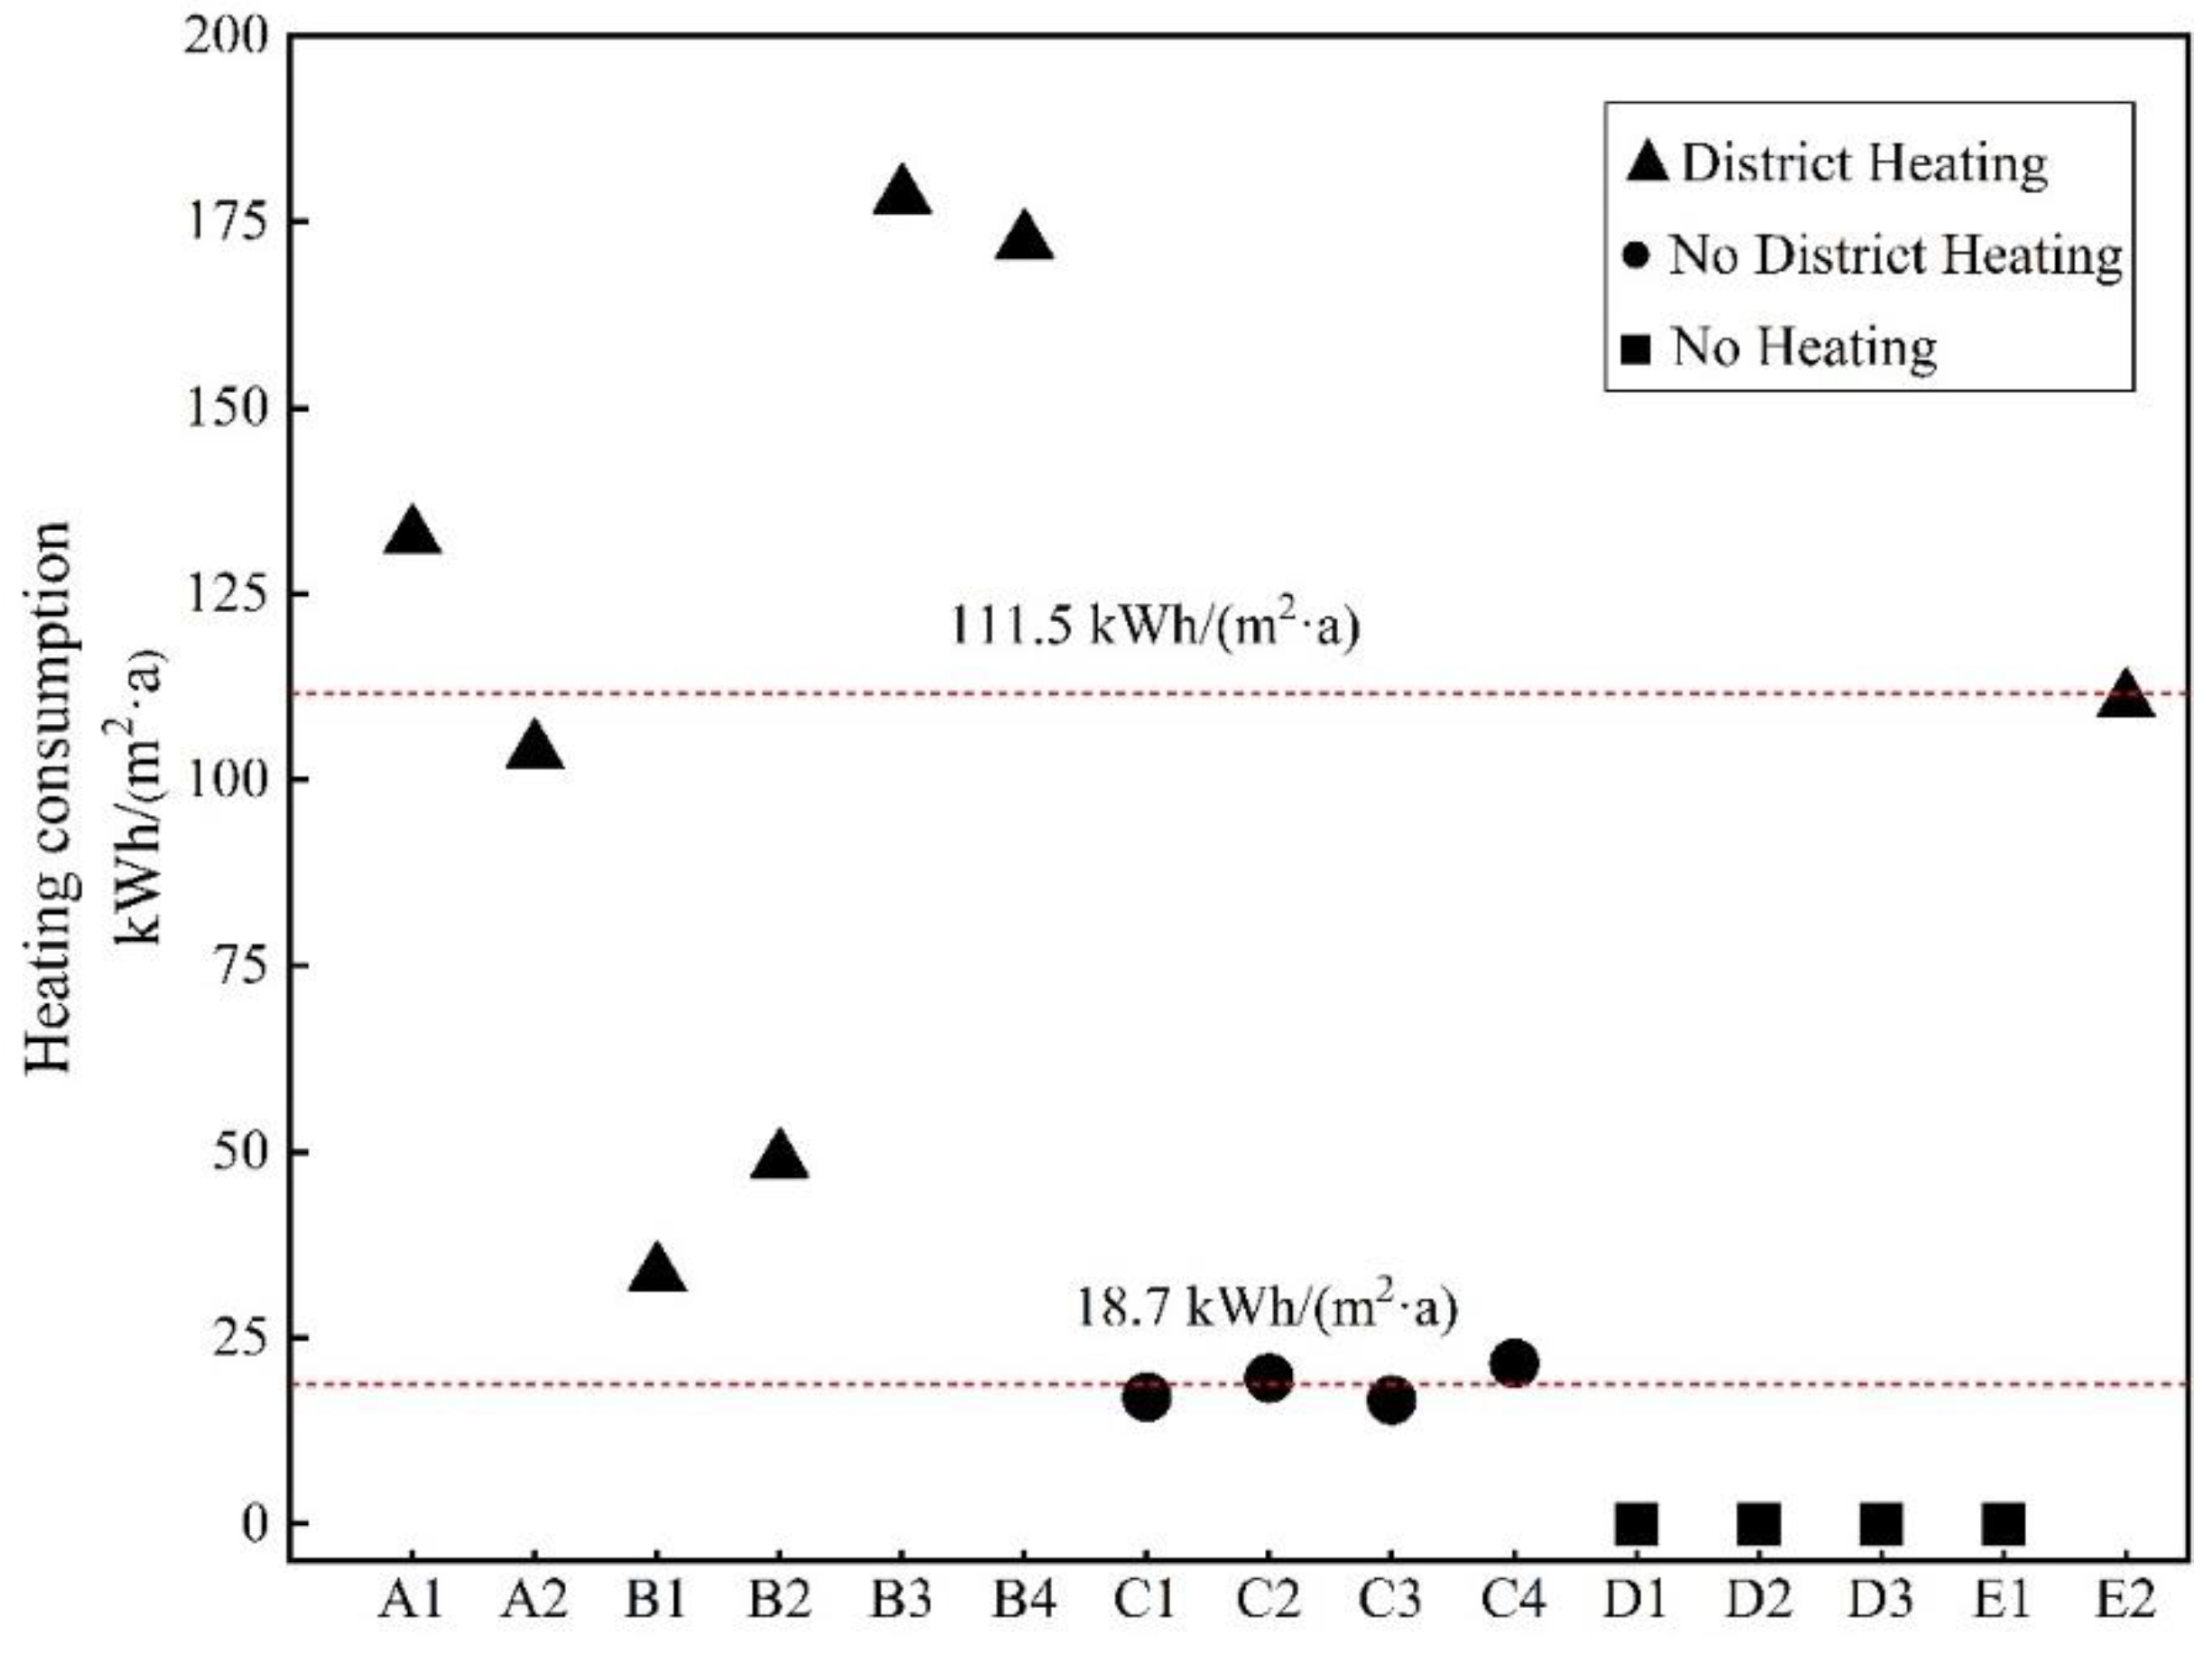
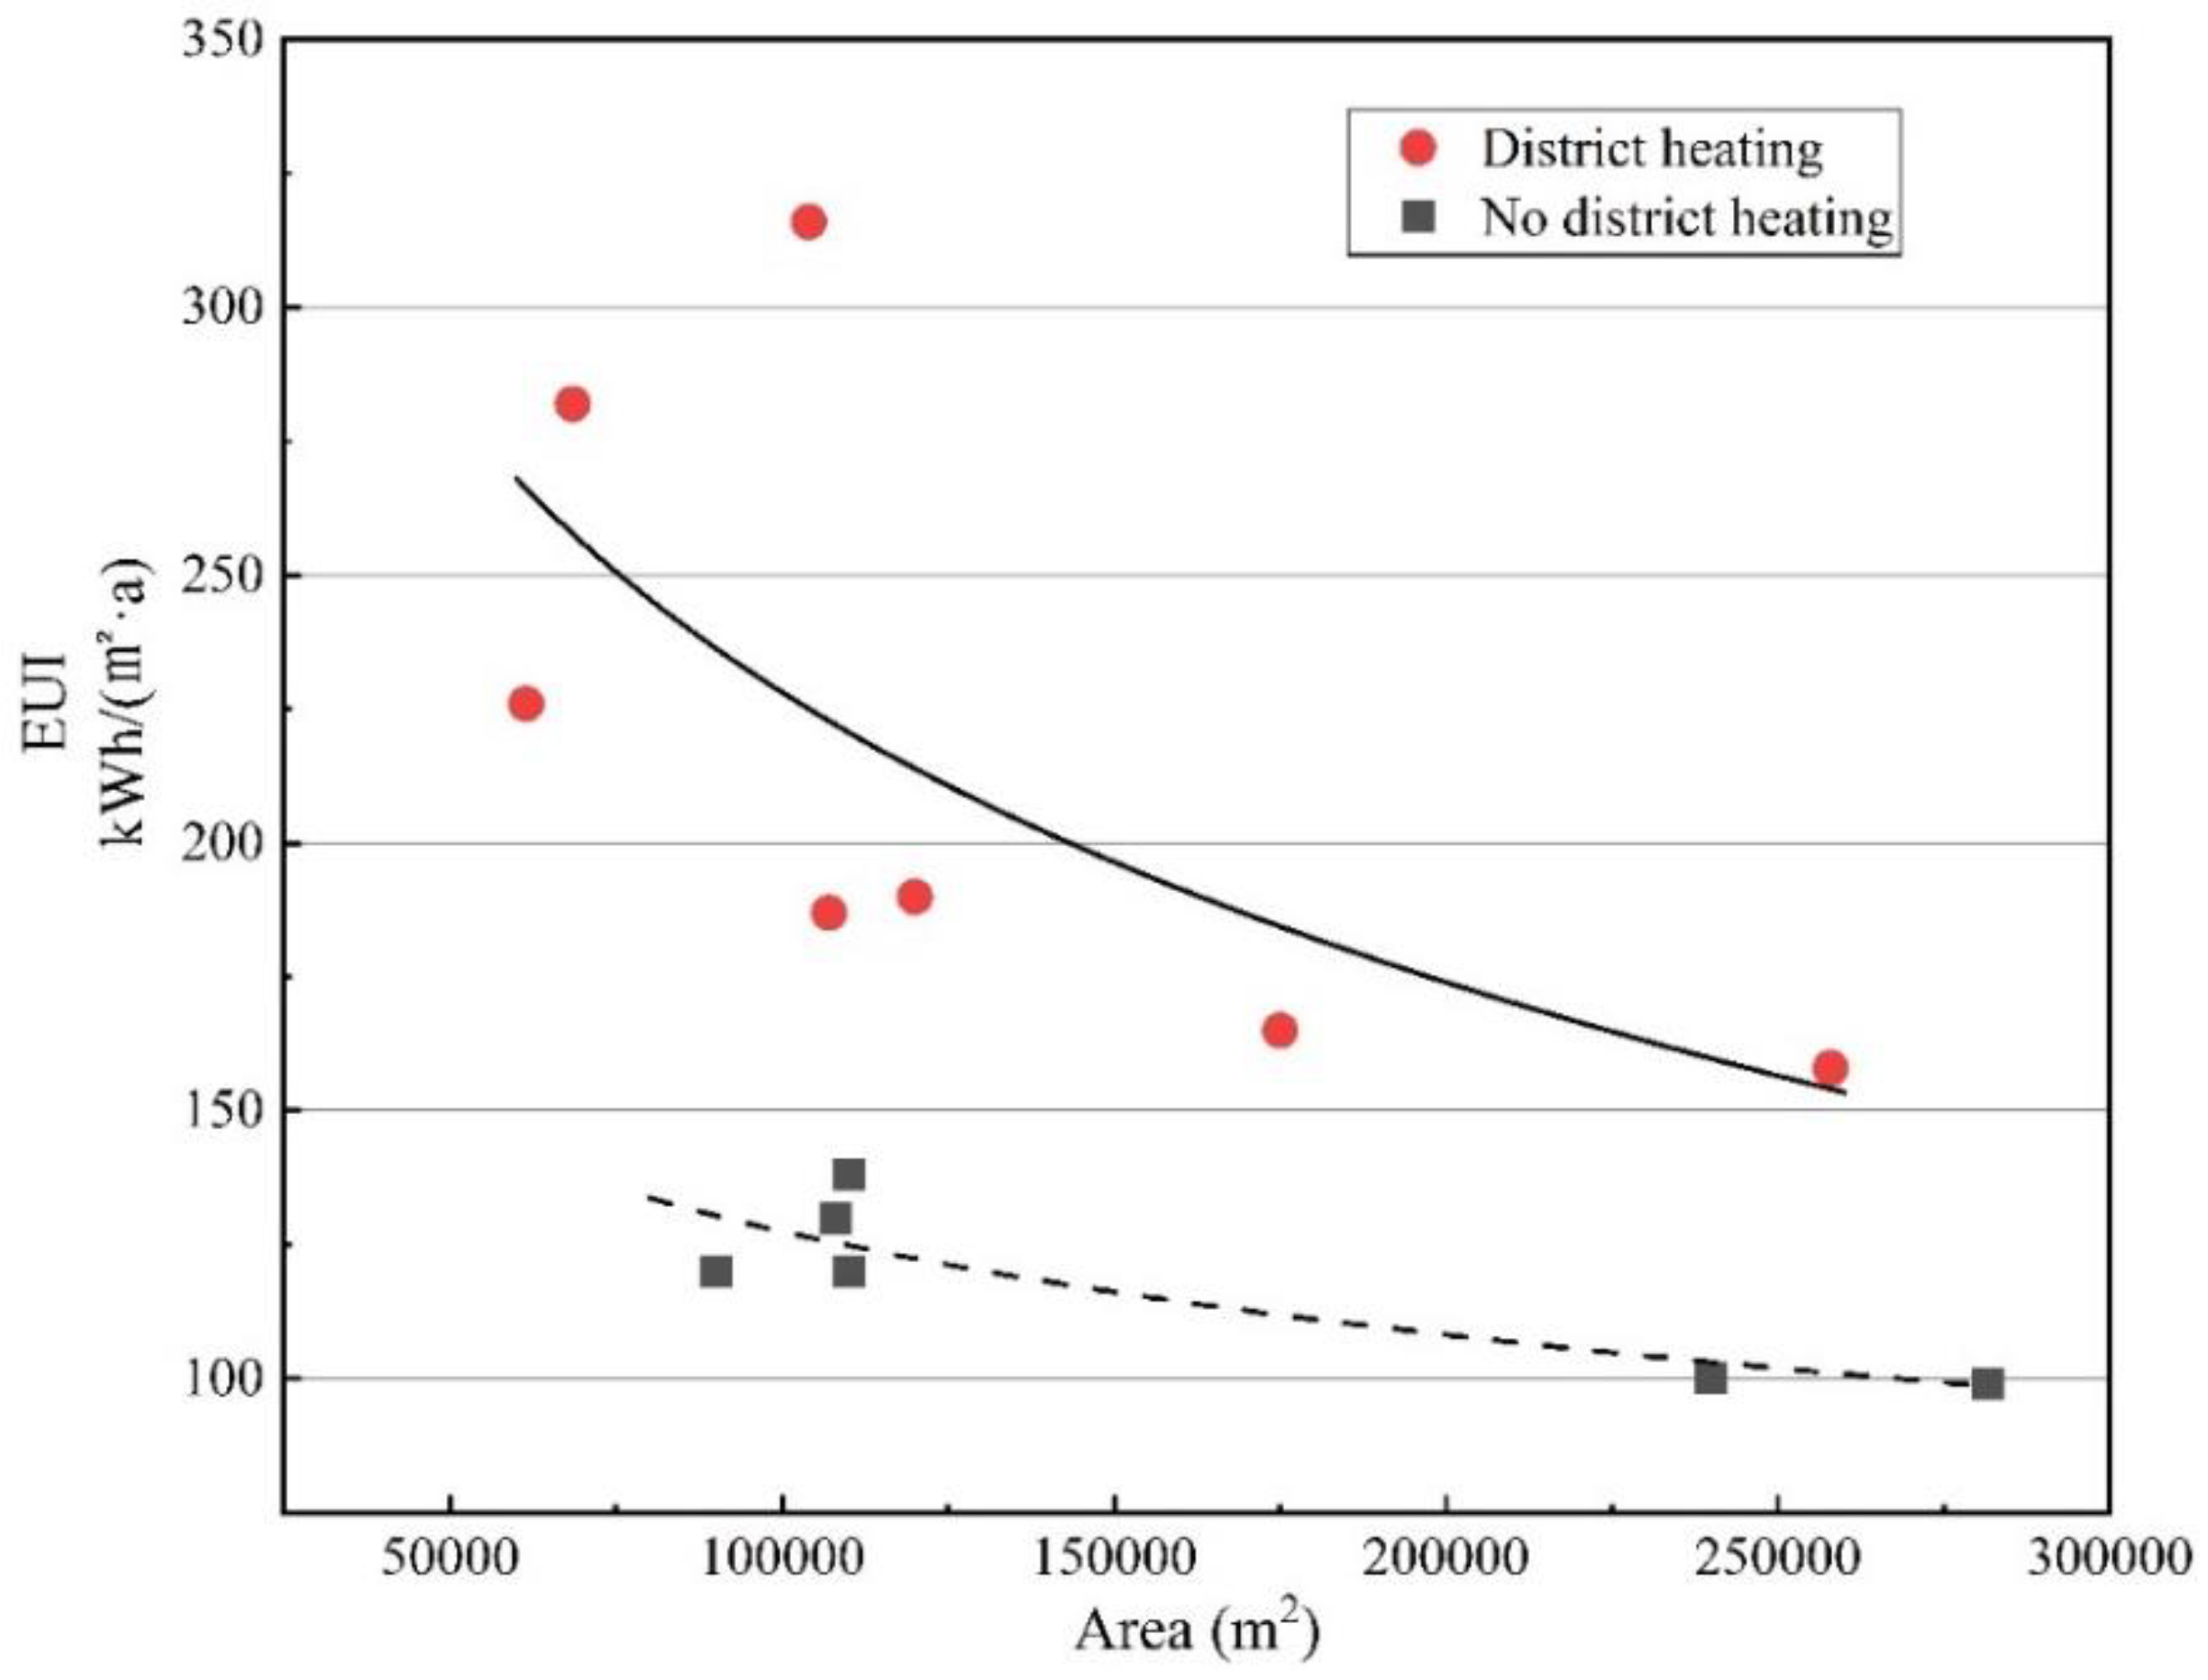
  • The EUI of different high-speed railway stations is between 115 and 470 kWh/(m2·a), which is related to the climate region and the area of the station. The average energy consumption of a station using district heating is 11.5 kWh/(m2·a), while that of a station without district heating is 18.5 kWh/(m2·a). EUI in stations decreases with the increase of area, and this trend is more obvious in stations using central heating.
  • The use of a large number of glass maintenance structures makes the illumination in the station vary greatly during the day. The average illumination in most stations is much higher than the standard requirement of 100 Lux. However, this does not mean that the good lighting effect is obtained, and the distribution needs to be considered. The lighting evenness and the height of the station are related to the depth of the lighting direction. Increasing the height can achieve better evenness but with the increasing energy consumption of HVAC.
  • The thermal neutral temperature of the waiting lounge varies greatly in different climate regions. Most passengers can accept the indoor temperatures below 18 °C or lower, which is related to the outdoor temperature. The main reason is that the short waiting time (40–60 min) of passengers and the requirements of thermal environment are different from those of office buildings. The acceptable temperature range in high-speed railway stations is larger in winter than in summer.
  • The measured CO2 concentration in the waiting lounge of each station is very close to the outdoor value. Results show that the infiltration air volume in the station can meet or even exceed the indoor fresh air demand. Maybe the mechanical fresh air can be canceled to save energy. There is a logarithmic relationship between the infiltration air volume and the energy consumption of the station and influence of infiltration air on energy consumption in winter is greater than that in summer.
In summary, compared with traditional railway stations, high-speed railway stations have higher energy consumption due to more openings, higher ceiling height, and a large number of glass maintenance structures. Passengers in high-speed trains also have different waiting habits, so their thermal comfort needs are also different. The high-speed railway station has considerable energy saving potential in the utilization of air infiltration, uniform lighting, and indoor temperature control. In addition, an efficient energy management platform is very important for the construction of high-speed railway stations.

Author Contributions

Conceptualization, B.Q. and H.B.; methodology, B.Q.; validation, B.L., T.Y.; formal analysis, B.Q.; investigation, B.Q.; data curation, B.Q.; writing—original draft preparation, B.Q.; writing—review and editing, B.L. H.B. and T.Y. All authors have read and agreed to the published version of the manuscript.

Funding

This research was funded by “National Key R&D Program of China” grant number [No. 2018YFC0705000], and The APC was funded by [No. 2018YFC0705000].

Acknowledgments

This work is supported by the “National Key R&D Program of China” (No. 2018YFC0705000).

Conflicts of Interest

The authors declare no conflict of interest.

References

  1. Omer, A.M. Energy, environment and sustainable development. Renew. Sustain. Energy Rev. 2008, 12, 2265–2300. [Google Scholar] [CrossRef]
  2. Perez-Lombard, L.; Ortiz, J.; Pout, C. A review on buildings energy consumption information. Energy Build. 2008, 40, 394–398. [Google Scholar] [CrossRef]
  3. Jiang, Y. Annual Report on China Building Energy Efficiency; Building Energy Conservation Research Center of Tsinghua University; China Architecture & Building Press: Beijing, China, 2018. (In Chinese) [Google Scholar]
  4. Xiao, H.; Wei, Q.; Jiang, Y. The reality and statistical distribution of energy consumption in office buildings in China. Energy Build. 2012, 50, 259–265. [Google Scholar] [CrossRef]
  5. Bracke, W.; Delghust, M.; Laverge, J.; Janssens, A. Building energy performance: Sphere area as a fair normalization concept. Build. Res. Inf. 2019, 47, 549–566. [Google Scholar] [CrossRef]
  6. Zhou, N.; Lin, J. The reality and future scenarios of commercial building energy consumption in China. Energy Build. 2008, 40, 2121–2127. [Google Scholar] [CrossRef] [Green Version]
  7. Doctor-Pingel, M.; Vardhan, V.; Manu, S.; Brager, G.; Rawal, R. A study of indoor thermal parameters for naturally ventilated occupied buildings in the warm-humid climate of southern India. Build. Environ. 2019, 151, 1–14. [Google Scholar] [CrossRef]
  8. Hoyt, T.; Arens, E.; Zhang, H. Extending air temperature setpoints: Simulated energy savings and design considerations for new and retrofit buildings. Build. Environ. 2015, 88, 89–96. [Google Scholar] [CrossRef] [Green Version]
  9. Nicol, J.F.; Humphreys, M.A. Adaptive thermal comfort and sustainable thermal standards for buildings. Energy Build. 2002, 34, 563–572. [Google Scholar] [CrossRef]
  10. Song, L.; Wang, Y.; Li, X. Energy performance and environmental quality of typical railway passenger stations in northern China. Indoor Built Environ. 2016, 27, 296–307. [Google Scholar] [CrossRef]
  11. Yan, H.; Wang, K. 2011 National Railway Passenger Station Energy Consumption Special Investigation Situation Analysis. Railw. Econ. Res. 2012, 5, 8–13. [Google Scholar]
  12. Wang, L.; Li, Q.; Dang, R.; Liu, G.; Liu, H. Comfort-Based Energy Efficiency Reconstruction of Waiting-room of Railway Station. Build. Energy Effic. 2014, 3, 97–102. [Google Scholar]
  13. Yang, L.; Xia, J. Case Study of Space Cooling and Heating Energy Demand of a High-speed Railway Station in China. Procedia Eng. 2015, 121, 1887–1893. [Google Scholar] [CrossRef] [Green Version]
  14. Ma, W.W.; Liu, X.Y.; Zhou, C.Q. Research on the waiting time of passengers and escalator energy consumption at the railway station. Energy Build. 2009, 41, 1313–1318. [Google Scholar] [CrossRef]
  15. Shi, L.; Xie, M.J. Optimal Simulation Analysis of Day lighting Design in New Guangzhou Railway Station. In Advanced Information Technology in Education; Thaung, K.S., Ed.; Springer: Berlin/Heidelberg, Germany, 2012; pp. 197–206. [Google Scholar]
  16. Brenna, M.; Dolara, A.; Foiadelli, F.; Leva, S.; Longo, M.; Zaninelli, D.; Casiraghi, F.M. Power quality analysis of LED lighting system for railway applications. In Proceedings of the IEEE International Conference on Harmonics & Quality of Power, Bucharest, Romania, 25–28 May 2014. [Google Scholar]
  17. Xiao, J.; Liu, C.J. Lighting Control and Its Power Management in Railway Passenger Station. In Proceedings of the 2009 Asia-Pacific Power and Energy Engineering Conference, Wuhan, China, 28–30 March 2009. [Google Scholar]
  18. Sengor, I.; Kilickiran, H.C.; Akdemir, H.; Kekezoglu, B.; Erdinc, O.; Catalao, J.P.S. Energy Management of a Smart Railway Station Considering Regenerative Braking and Stochastic Behaviour of ESS and PV Generation. IEEE Trans. Sustain. Energy 2018, 9, 1041–1050. [Google Scholar] [CrossRef]
  19. Dounis, A.I.; Caraiscos, C. Advanced control systems engineering for energy and comfort management in a building environment—A review. Renew. Sustain. Energy Rev. 2009, 13, 1246–1261. [Google Scholar] [CrossRef]
  20. Arens, E.; Humphreys, M.A.; de Dear, R.; Zhang, H. Are ‘class A’ temperature requirements realistic or desirable? Build. Environ. 2010, 45, 4–10. [Google Scholar] [CrossRef] [Green Version]
  21. Tong, Z.; Chen, Y.; Malkawi, A.; Liu, Z.; Freeman, R.B. Energy saving potential of natural ventilation in China: The impact of ambient air pollution. Appl. Energy 2016, 179, 660–668. [Google Scholar] [CrossRef] [Green Version]
  22. Kalz, D.E.; Pfafferott, J. Thermal Indoor Environment, Thermal Comfort and Energy-Efficient Cooling of Nonresidential Buildings; Springer: New York, NY, USA, 2014; pp. 15–20. [Google Scholar]
  23. Nakano, J.; Tanabe, S.; Morii, T.; Uruno, M.; Goto, Y.; Sakamoto, K. Field Study on Optimum Thermal Environmental Control of Train Stations; The Society of Heating, Air-Conditioning Sanitary Engineers of Japan: Tokyo, Japan, 2006. [Google Scholar]
  24. Kwong, Q.J.; Adam, N.M.; Sahari, B.B. Thermal comfort assessment and potential for energy efficiency enhancement in modern tropical buildings: A review. Energy Build. 2014, 68, 547–557. [Google Scholar] [CrossRef]
  25. Boerstra, A.C.; te Kulve, M.; Toftum, J.; Loomans, M.G.; Olesen, B.W.; Hensen, J.L. Comfort and performance impact of personal control over thermal environment in summer: Results from a laboratory study. Build. Environ. 2015, 87, 315–326. [Google Scholar] [CrossRef]
  26. del Ferraro, S.; Iavicoli, S.; Russo, S.; Molinaro, V. A field study on thermal comfort in an Italian hospital considering differences in gender and age. Appl. Ergon. 2015, 50, 177–184. [Google Scholar] [CrossRef]
  27. Caniato, M.; Gasparella, A. Discriminating People’s Attitude towards Building Physical Features in Sustainable and Conventional Buildings. Energies 2019, 12, 1429. [Google Scholar] [CrossRef] [Green Version]
  28. Sant’Anna, D.O.; Dos Santos, P.H.; Vianna, N.S.; Romero, M.A. Indoor environmental quality perception and users’ satisfaction of conventional and green buildings in Brazil. Sustain. Cities Soc. 2018, 43, 95–110. [Google Scholar] [CrossRef]
  29. Huang, M.; Lin, Y. Thermal comfort of railway station’s waiting room in severe cold regions of China. Sustain. Energy Build. 2017, 134, 749–756. [Google Scholar] [CrossRef]
  30. Kawamoto, R.; Umemiya, N.; Atsuta, H.; Cie, T.S. Relation between Light Environment Evaluation and Personal Attributes; C I E Central Bureau: Vienna, Austria, 2011. [Google Scholar]
  31. Liu, Y.; Yu, G.; Zheng, S.W. Gymnasium Natural Light Environment Optimization Design Oriented by Environment-behavior Studies. In Advanced Materials Research; Albahar, S.K., Zhao, J.Y., Eds.; Trans Tech Publications: Zurich, Switzerland, 2014; pp. 223–227. [Google Scholar]
  32. Durak, A.; Olgunturk, N.C.; Yener, C.; Guvenc, D.; Gurcinar, Y. Impact of lighting arrangements and illuminances on different impressions of a room. Build. Environ. 2007, 42, 3476–3482. [Google Scholar] [CrossRef] [Green Version]
  33. Li, D.H.W.; Lam, J.C.; Wong, S.L. Daylighting and its implications to overall thermal transfer value (OTTV) determinations. Energy 2002, 27, 991–1008. [Google Scholar] [CrossRef]
  34. Ai, Z.T.; Mak, C.M.; Cui, D.J.; Xue, P. Ventilation of air-conditioned residential buildings: A case study in Hong Kong. Energy Build. 2016, 127, 116–127. [Google Scholar] [CrossRef]
  35. Caciolo, M.; Cui, S.Q.; Stabat, P.; Marchio, D. Development of a new correlation for single-sided natural ventilation adapted to leeward conditions. Energy Build. 2013, 60, 372–382. [Google Scholar] [CrossRef]
  36. de Dear, R.J.; Brager, G.S. Thermal comfort in naturally ventilated buildings: Revisions to ASHRAE Standard 55. Energy Build. 2002, 34, 549–561. [Google Scholar] [CrossRef] [Green Version]
  37. Ai, Z.T.; Mak, C.M.; Cui, D.J. On-site measurements of ventilation performance and indoor air quality in naturally ventilated high-rise residential buildings in Hong Kong. Indoor Built Environ. 2015, 24, 214–224. [Google Scholar] [CrossRef]
  38. Huang, C.; Zou, Z.; Li, M.; Wang, X.; Li, W.; Huang, W.; Yang, J.; Xiao, X. Measurements of indoor thermal environment and energy analysis in a large space building in typical seasons. Build. Environ. 2007, 42, 1869–1877. [Google Scholar] [CrossRef]
  39. Said, M.N.A.; Macdonald, R.A.; Durrant, G.C. Measurement of thermal stratification in large single-cell buildings. Energy Build. 1996, 24, 105–115. [Google Scholar] [CrossRef]
  40. Taraldsen, G. On the ISO Guide to the Expression of Uncertainty in Measurements. J. Radioanal. Nucl. Chem. 1995. [Google Scholar]
  41. Design Stand for Energy Efficiency of Public Buildings; GB50189-2015; China Architecture & Building Press: Beijing, China, 2015. (In Chinese)
  42. Code for Design of Railway Passenger Station; TB 10100-2018; China Railway Publishing House: Beijing, China, 2018. (In Chinese)
  43. Ma, W.; Li, L.; He, S.; Cheng, J.; Huang, G.; Zhou, C.Q. Influencing Factors on Energy Consumption of Air Conditioning System in Railway Passenger Station Based on Orthogonal Experiment. In Proceedings of the Second International Conference on Intelligent System Design & Engineering Application, Sanya, China, 6–7 January 2012. [Google Scholar]
  44. Wu, Z.; Huang, K.; Wei, Y. Energy Consumption Division of HVAC System in Building Energy Audits. In Building Energy Efficiency; Shenyang, China, 2012. [Google Scholar]
  45. Bouden, C. Influence of glass curtain walls on the building thermal energy consumption under Tunisian climatic conditions: The case of administrative buildings. Renew. Energy 2007, 32, 141–156. [Google Scholar] [CrossRef]
  46. Classification and Presentation of Civil Building Energy Use; GB T34913-2017; China Quality and Standards Publishing: Beijing, China, 2017. (In Chinese)
  47. Liu, X. Research on Air-Conditioning Energy Consumption at the Passenger Railway Station in Summer; Central South University: Changsha, China, 2010. (In Chinese) [Google Scholar]
  48. Code for Design of Railway Passenger Station Buildings; GB 50266-2007; Standardization Administration of China (SAC): Beijing, China, 2007. (In Chinese)
  49. Enescu, D. A review of thermal comfort models and indicators for indoor environments. Renew. Sustain. Energy Rev. 2017, 79, 1353–1379. [Google Scholar] [CrossRef]
  50. Liu, X.; Ma, W. Research of Waiting Time of Passengers at Railway Stations. J. China Railw. Soc. 2009, 31, 104–107. (In Chinese) [Google Scholar]
  51. Concepts, R. Thermal Environmental Conditions for Human Occupancy; ASHRAE Standard: Atlanta, GA, USA, 2014. [Google Scholar]
  52. Thermal Environmental Conditions for Human Occupancy; ASHARE 55-2017; American Society of Heating, Refigerating and Air-Conditioning Engineers: Atlanta, GA, USA, 2017.
  53. Candido, C.; de Dear, R.J.; Lamberts, R.; Bittencourt, L. Air movement acceptability limits and thermal comfort in Brazil’s hot humid climate zone. Build. Environ. 2010, 45, 222–229. [Google Scholar] [CrossRef]
  54. Moderate Thermal Environment-Determination of the PMV and PPD Indices and Specification of the Condition for Thermal Comfort; ISO 7730; International Standard Organization: Copenhagen, Denmark, 2016.
  55. Peeters, L.; de Dear, R.; Hensen, J.; D’haeseleer, W. Thermal comfort in residential buildings: Comfort values and scales for building energy simulation. Appl. Energy 2009, 86, 772–780. [Google Scholar] [CrossRef] [Green Version]
Figure 1. Five climates in China.
Energies 13 00168 g001
Figure 2. Gas use record of E2 station.
Energies 13 00168 g002
Figure 3. Statistical results of energy consumption of high-speed railway stations.
Energies 13 00168 g003
Figure 4. Box plot of EUI (energy use intensity) of high-speed railway stations.
Energies 13 00168 g004
Figure 5. EUI of heating of high-speed railway stations.
Energies 13 00168 g005
Figure 6. The relation between station area and EUI of different heating methods.
Energies 13 00168 g006
Figure 7. Layout of measuring points for B3.
Energies 13 00168 g007
Figure 8. Tests of waiting lounge for B3.
Energies 13 00168 g008
Figure 9. Glass curtain wall of high-speed railway station.
Energies 13 00168 g009
Figure 10. Mean of illumination of different depth position of B2 station.
Energies 13 00168 g010
Figure 11. The relationship between illumination uniformity and station shape. H/L: The ratio between the height of the station and the length of the lighting direction. Illumination uniformity: The ratio of the lowest value of illumination to the average value.
Energies 13 00168 g011
Figure 12. PMV and waiting time proportion of stations.
Energies 13 00168 g012
Figure 13. The relationship between air infiltration and energy consumption.
Energies 13 00168 g013aEnergies 13 00168 g013b
Table 1. General situation of stations.
Climate ZoneStation NumberConstruction Area (104 m2)Annual Passenger Flow (104)Station ScaleArea of Waiting Lounge (104 m2)Maximum Height (m)
AA112.02675Large2.730
A26.21500Medium1.718
BB110.72500Large6.021
B225.88546Large5.018
B310.4892Medium4.137
B46.9649Medium2.530
CC124.04486Large7.821
C228.26667Large8.133
C310.84564Large4.025
C411.02448Large3.418
DD116.86796Large7.620
D29.03650Medium4.320
D36.9680MediumNA aNA
EE112.0858Large5.418.5
E211.02448Large4.021
a NA, not available.
Table 2. Energy consumption data of different buildings.
AnnualCoolingHeatingLightingOthers
High-speed station (kWh/(m2·a))117–45025%39%13%23%
Traditional station (kWh/(m2·a))101–26920%44%18%18%
Urban office building (kWh/(m2·a))30–10735%40%15%10%
Table 3. Parameters of the instrument.
NameTypeParameterAccuracyMeasurement Error
Hot wire anemometerTesto-425Wind speed±0.03 m/s0.017 m/s
Range finderBS-GLM80Distance±0.002 m0.001 m
Multifunctional TesterTesto-435Temperature, humidity and CO2 ±0.2 °C, ±1%, ±10 ppm0.115 °C, 0.57%, 5.7 ppm
LuminometerTES-1335Illumination±0.01 Lux0.0057 Lux
Black-bulb thermometerAZ8758Black-bulb temperature±0.2 °C0.115 °C
Table 4. Winter test results.
NumberIndoor Temperature (°C)Humidity (%)Radiation Temperature (°C)Outdoor Temperature (°C)Wind Speed (m/s)
MaxMinMeanMaxMinMeanMaxMinMeanMaxMinMeanMaxMinMean
A122.016.118.524.414.118.822.117.219.44.2−0.23.10.80.050.3
A222.511.618.712.96.58.122.111.618.4−4.7−5.6−5.31.70.050.5
B117.510.615.325.414.817.217.44.814.91.50.21.01.20.010.4
B221.211.817.419.811.115.120.611.717.30.7−3.3−0.91.80.010.5
B320.213.617.721.89.920.319.411.712.25.71.73.61.00.010.2
B421.613.518.940.024.328.821.516.119.45.53.74.41.00.010.4
C120.812.016.140.423.531.219.310.815.86.92.84.81.10.020.3
C223.116.420.165.745.352.422.715.520.113.89.912.11.00.010.3
C420.812.016.140.423.531.219.310.815.86.92.84.81.10.020.3
D123.116.420.165.745.352.422.715.520.113.89.912.11.00.010.3
D222.020.521.467.761.664.622.420.521.521.118.920.10.50.010.2
D320.017.618.886.873.282.821.817.819.620.520.120.30.50.10.2
E115.413.014.070.562.465.815.011.713.612.511.611.90.80.10.3
E218.514.616.863.955.359.118.614.616.917.015.616.50.60.010.2
Table 5. Summer test results.
NumberIndoor Temperature (°C)Humidity (%)Radiation Temperature (°C)Outdoor Temperature (°C)Wind Speed (m/s)
MaxMinMeanMaxMinMeanMaxMinMeanMaxMinMeanMaxMinMean
A125.923.224.644.434.138.925.723.224.627.624.226.30.60.10.2
A225.521.524.132.930.131.525.722.524.227.324.625.21.50.10.5
B127.725.426.546.235.138.427.325.626.527.327.327.31.60.10.5
B229.224.126.340.131.135.230.224.527.030.627.529.61.20.00.3
B325.022.723.941.830.939.225.122.624.025.923.124.81.80.00.4
B425.924.124.955.544.348.925.724.125.027.124.025.41.50.10.5
C125.924.125.169.561.565.525.724.124.927.524.326.11.20.10.4
C227.823.224.570.159.863.927.823.524.627.326.325.31.60.10.6
C326.123.324.468.860.765.425.322.224.025.323.824.61.50.00.3
C425.523.824.865.454.061.325.924.625.324.924.324.70.90.10.2
D132.527.430.078.565.470.236.728.131.333.433.433.41.00.10.2
D229.726.128.082.570.278.229.926.728.337.237.237.21.10.00.3
D328.826.927.780.269.577.629.027.127.727.637.237.21.50.00.3
E127.022.224.875.562.470.126.422.724.627.423.325.30.90.00.1
E224.722.023.770.565.367.827.622.325.325.823.324.51.50.00.3
A125.923.224.644.434.138.925.723.224.627.624.226.30.60.10.2
A225.521.524.132.930.131.525.722.524.227.324.625.21.50.10.5
B127.725.426.546.235.138.427.325.626.527.327.327.31.60.10.5
B229.224.126.340.131.135.230.224.527.030.627.529.61.20.00.3
Table 6. Thermal neutral temperature of high-speed railway stations.
Station NumberA1A2B1B2B3B4C4D1E1E2
WinterT0 (°C)18.920.317.919.918.318.817.116.517.016.6
Test temperature (°C) 18.518.615.117.317.51913.916.816.215.2
SummerT0 (°C)25.426.026.425.525.625.825.1NA26.026.3
Test temperature (°C) 24.624.226.526.623.924.925.1NA25.025.2
Table 7. Acceptable temperature range in winter for waiting lounge (Unit: °C).
A1A2B1B2B3B4C4D1E1E2
Winter17.9–19.818.1–21.516.4–20.017.4–21.717.5–19.917.9–20.915.1–18.815.4–18.515.2–18.615.6–18.0
Summer24.6–26.525.5–26.525.0–26.525.4–26.424.5–26.525.3–26.525.0–26.325.5–27.025.6–26.725.7–26.9
Table 8. Test results of infiltration air.
A1A2B1B2B3B4C1C2C4D1D2E1E2
WinterAir change (h−1) 0.96.21.91.85.02.91.24.25.15.62.32.25.6
Percent (%)1036252163241834NANANA22NA
SummerAir change (h−1) 0.72.01.91.21.32.90.53.02.71.31.24.12.8
Percent (%) 101910292234483940NA205133

