Article

Dynamics for Sustainable Nuclear Buildup Based on LWR and FBR Technologies and Its Impact on CO2 Emission Reduction

1
Technical School Fran Bosnjakovic, 10000 Zagreb, Croatia
2
Faculty of Electrical Engineering and Computing, University of Zagreb, 10000 Zagreb, Croatia
*
Author to whom correspondence should be addressed.
Energies 2020, 13(1), 134; https://doi.org/10.3390/en13010134
Submission received: 22 November 2019 / Revised: 17 December 2019 / Accepted: 22 December 2019 / Published: 26 December 2019
(This article belongs to the Section L: Energy Sources)

Abstract

:
In recent years, most of the growth in electricity demand is covered by renewable and nuclear energy sources. However, electricity generation in fossil-fired power plants is also increasing resulting in the increase of CO2 emissions. Nuclear energy has to be considered as one of the available tools to accomplish CO2 emission reduction in electricity sector. Light water reactors (LWR) are currently the dominant nuclear technology but their intensive application in long-term period is constrained by available uranium fuel resources. Fast breeder reactors’ (FBR) technology is not used on a larger scale. Plutonium resources are limited, but do have the potential of stronger buildup if light water reactors, as the source of plutonium, are used on a larger scale. The appropriate dynamics for LWR/FBR buildup till the end of the 21st century is developed under assumptions of different LWR life times, and different uranium fuel resources available. The possible CO2 emission reduction is calculated with World Energy Outlook 2015 development scenarios being set as reference ones. It is shown that nuclear fuel resources do not represent an obstacle for strong nuclear buildup leading to significant CO2 emission reduction. However, the reduction is mostly achieved in the second half of the century.

1. Introduction

In the report from March 2019, the International Energy Agency (IEA) states that in 2018 global energy demand grew by 2.3%, which is the fastest rate in a decade, resulting in 1.7% growth of the energy-related CO2 emissions [1]. Demand for electricity grew faster than for any other energy source with an increase of 4%. Although renewable energy sources and nuclear power covered most of the growth in demand, generation from fossil-fired power plants (coal and gas) also increased resulting in the CO2 emissions from the electricity sector to increase by 2.5%. According to the United Nations Framework Convention on Climate Change (UNFCCC) and IEA press releases, it is evident that the global trends in energy demand and generation, especially in electricity sector, continue to be opposite to the objective of the Paris Agreement to limit the global average temperature rise to as close as possible to 1.5 °C compared to preindustrial levels [2,3]. Achieving that goal would require global greenhouse gases (GHG) emissions to peak in 2020 and then be followed by a swift decrease. IEA Executive Secretary Fatih Briol stated that “But despite major growth in renewables, global emissions are still rising, demonstrating once again that more urgent action is needed on all fronts—developing all clean energy solutions, curbing emissions, improving efficiency, and spurring investments and innovation, including in carbon capture, utilization and storage.” [3]. Numerous studies have shown that nuclear energy has to be considered as the best available tool to accomplish the required “urgent action” for GHG, namely CO2, emissions reduction. Brook et al. argue that nuclear fission technology is the only developed energy source capable of delivering safe, reliable, economical, and sustainable energy on a large scale required to run modern industrial society [4]. Knapp et al. [5] investigate the possibility of a large-scale expansion of nuclear power based on once-through nuclear fuel technology and conclude that a strong reduction of carbon emission by the targeted 2065 might be possible. Their results indicate that nuclear power might contribute up to 40% in the total reduction of carbon emission needed to reduce World Energy Outlook (WEO) 2009 reference scenario down to level of WEO 450 scenario, which limits the global temperature increase to 2 °C [6]. However, the proposed nuclear buildup up to 2065, resulting in 3333 GW of installed nuclear capacity in 2065, cumulatively requires 16.7 Mt of uranium, which entirely consumes conventional resources [7]. Nuclear operation after 2065 would therefore require additional resources to be identified and available within reasonable price range. Pevec et al. [8] argue that based on geological arguments, further exploration of relatively unexplored regions should increase those uranium resources that are within acceptable cost range of 20–25 Mt, thus enabling strong nuclear fleet operation well beyond 2065. In the continuation of their research, Knapp et. al. [9] investigated the introduction of fast breeder reactor (FBR) and molten salt thorium reactor (MSTR) technology into the nuclear buildup, thus combining the open and closed fuel cycle. They concluded that operation of LWR reactors linearly replacing coal power plants in the period 2025–2065 and operating until the end of their working life would result in enough plutonium to launch FBR or MSTR fleet, large enough to fulfill targeted climate goal. They investigate three focal years, 2025 as the beginning of the nuclear expansion, 2065 as the end of LWR buildup and 2105 or 2125 as the end of the last LWR reactor life time, depending on whether 40 or 60 years life time is considered. The authors argue that both, FBR and MSTR technologies have advantages and disadvantages when compared one to other. On one hand, FBR technology is more developed with a number of reactor-years of operating experience but requires frequent extraction and recharging of plutonium fuel. On the other hand, MSTR technology has limited operating experience but offers superior operation safety, as well as proliferation safety. Since the definite judgment of two technologies is premature at the moment, both should be examined thoroughly. The FBR technology was chosen for this research based on slight advantage in technological status. MSTR technology will be considered in detail in our future work.
It is the aim of this paper to deepen the aforementioned analysis in two directions. The first one is the development of the dynamics for LWR and FBR deployment, roughly by the end of the century, adequate for partial or full fossil power plants replacement while satisfying the available nuclear fuel resource constraint. The second one is the assessment of the possible impact on CO2 emission reduction resulting from fossil sources being replaced by nuclear ones.

2. Methodology

To evaluate the impact of possible strong nuclear buildup until the end of the century, the forecasts of the total electricity generation and generation of electricity by specific energy sources are required. The International Energy Agency (IEA) analysis, recommendations, and forecasts are based on all-fuels, all-technology approach. Therefore, we believe that IEA forecasts published as World Energy Outlook are objective and applicable for the purpose of our research. WEO 2015 scenarios [10], which span from 2013 to 2040, have been selected as the reference ones. WEO gives three scenarios, namely current policies scenario (CPS), new policies scenario (NPS), and 450 scenario. The CPS scenario takes into account only the energy policies validated by appropriate acts of law, while the NPS scenario is influenced by validated policies as well as by those adopted but not yet enforced into regulative form. The 450 scenario is the one aiming at 2 °C reduction climate goal; thus imposing strong demands on the new technologies not yet fully commercial as well as on the mankind energy consumption habits. As a result, estimate of the electricity generation/demand is highest for the CPS scenario, slightly lower for the NPS scenario, and significantly lower for the 450 scenario. Apart from nuclear sources of electricity, fossil sources, primarily coal, are in the focus of our interest.
The forecast of electricity generation by the end of the century has been based on the extrapolation of the trends on electricity generation observed in WEO scenarios for the period 2013–2040. Extrapolation has been performed using only mathematical fitting tools aiming toward the lowest possible coefficient of determination (R2 value). Possible socio-political factors influencing overall electricity demand, i.e., generation, were not taken into account. Due to the relatively small number of data points available in the WEO, small discrepancies between the values given in the WEO and the values obtained by the fitting process might be present, but do not influence overall findings.
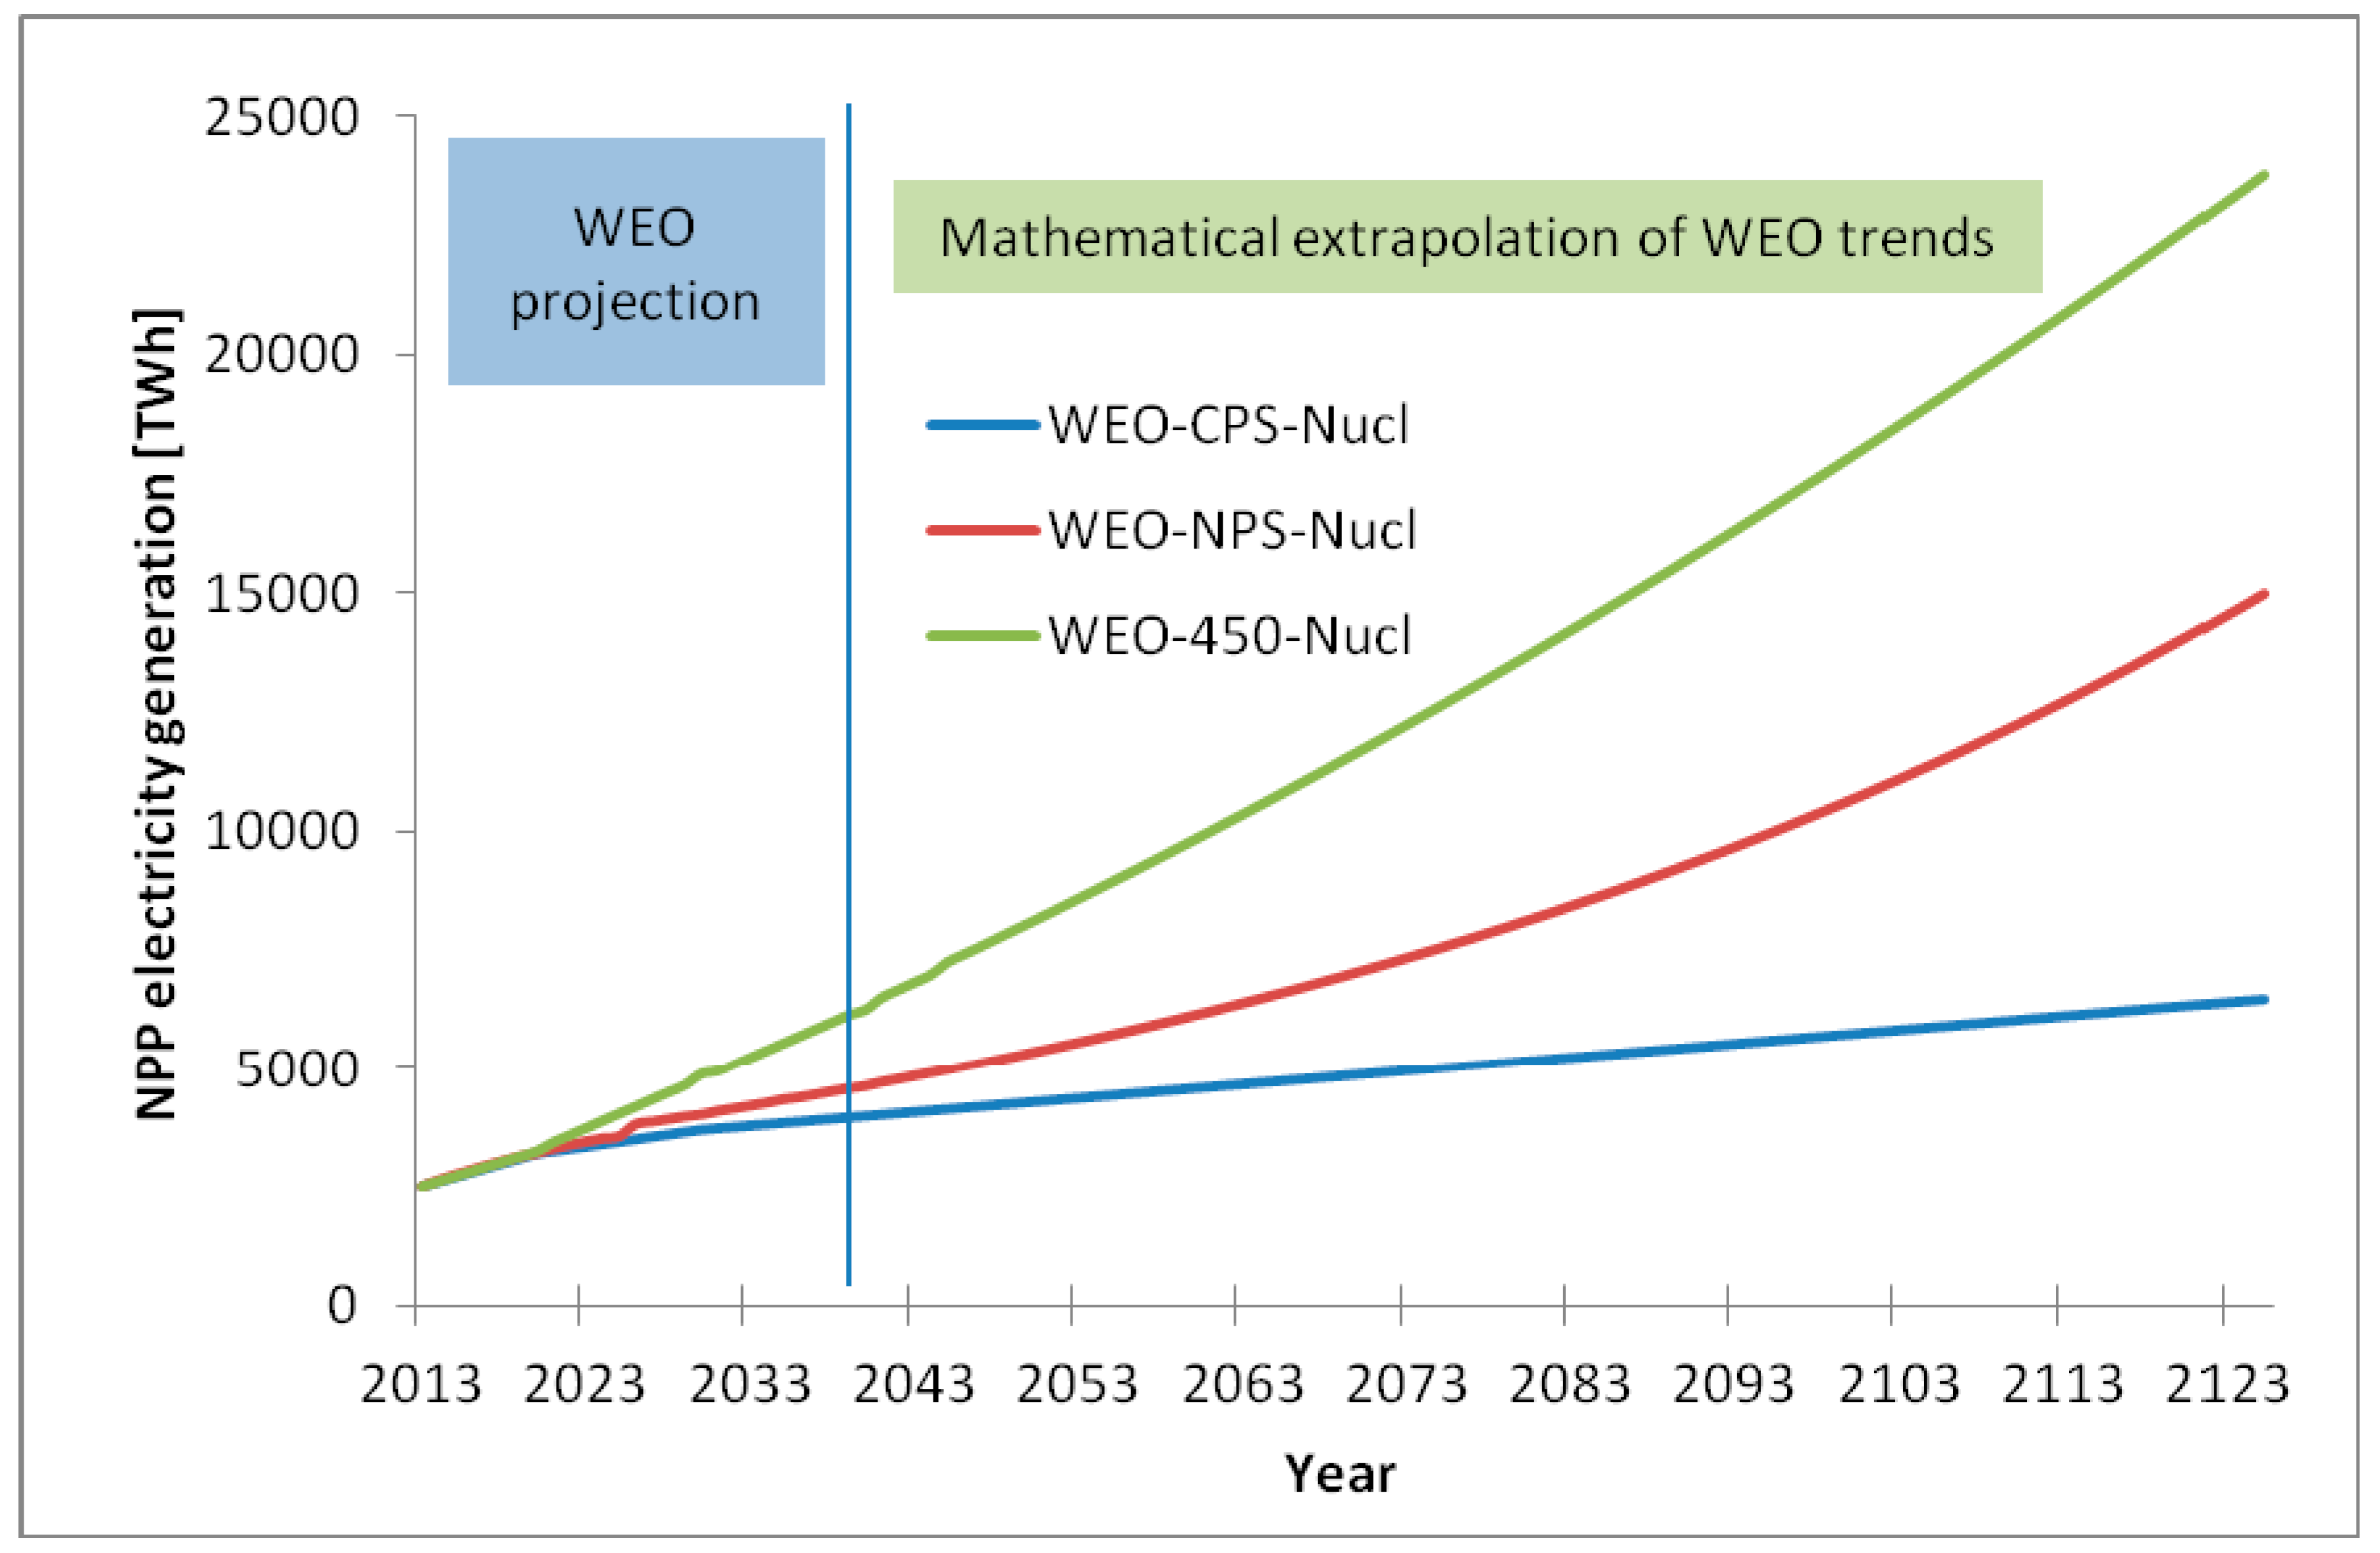
The described approach suggests that the overall electricity generation in 2100 would be around 72,000 TWh, 75,000 TWh, and 98,000 TWh for WEO-450, WEO-NPS, and WEO-CPS scenarios, respectively. The share of electricity produced in coal power plants in 2100 vary from almost 45% in WEO-CPS scenario down to 0.5% in WEO-450 scenario, with the share of 24.5% in WEO-NPS scenario. The share of electricity produced in nuclear power plants vary from 25% in WEO-450 scenario down to 6% in WEO-CPS scenario, with the share of 14.1% in WEO-NPS scenario. The forecasts for electricity generation in nuclear power plants (NPP) are graphically depicted in Figure 1. In 2025, nuclear share in overall electricity generation would vary from 15.1% in WEO-450 scenario down to 10.7% in WEO-CPS scenario, with the share of 11.8% in WEO-NPS scenario. In 2065, the nuclear share of 23.2% would be observed in WEO-450 scenario, while in the WEO-NPS and WEO-CPS the observed nuclear shares would be 12.1% and 7.3%, respectively. In 2100, nuclear share in overall electricity generation would vary from 24.8% in WEO-450 scenario down to 5.8% in WEO-CPS scenario, with the share of 14.2% in WEO-NPS scenario.
Long-term analysis, especially the one spanning over a period of more than 80 years is prone to a high degree of uncertainty and risk. Therefore, the results should be interpreted qualitatively, rather than quantitatively. However, the speculative nature of the analysis reported in this manuscript allows a more relaxed approach when technological aspects are considered, as long as the required input parameters for the analysis are within currently feasible limits. For example, breeding ratio of the FBRs depends on the type and design of the reactor and can range from 1.01 as in the Shippingport Nuclear Power Plant up to 1.2 as for Russian BN-350 liquid-metal-cooled reactor, or even 1.8 as shown by theoretical models of breeders with liquid sodium coolant flowing through tubes inside fuel elements. Aforementioned relaxed approach to parameter selection applied to the specified breeding ratio interval resulted in the selection of breeding factor of 1.1 for the conducted research. Selection of all other required parameters has undergone similar investigative process combined with engineering judgment and experience. The following input parameters and constraints have been used in the analysis:
  • conventional uranium resources of approximately 16 million tons have been used as the bottom uranium fuel resource constraint [7], while 20–25 million tons have been used as the top uranium fuel resource constraint [8];
  • conversion factor addressing the amount of uranium required for production of 1 TWh of electricity has been set to 25.009 tU/TWh; the factor has been calculated based on electricity production in nuclear power plants for the year 2007 (2719 TWh) and uranium consumption of 68,000 t for the same year [7]; the value for the conversion factor has been verified theoretically [11];
  • conversion factor addressing the production of plutonium based on installed nuclear capacity is 0.15 tPu/GWe; the factor is lower than factors found in literature [11] to insure conservative approach of the analysis;
  • capacity factor for nuclear power plants equals 0.88;
  • quantity of 6.5 t of plutonium per GW is required to cover initial charge and first annual replenishment for the FBR;
  • Intergovernmental Panel for Climate Control’s (IPCC’s) median lifecycle CO2 equivalent emissions data, including direct emissions, and emissions from infrastructure and supply chain, have been used [12]: coal 820 gCO2eq/kWhe, nuclear 12 gCO2eq/kWhe, and gas-combined cycle 490 gCO2eq/kWhe.
The initial parameters used in the analysis are those for the year 2013 based on the WEO 2015 [10] and joint report by OECD Nuclear Energy Agency and the International Atomic Energy Agency regarding uranium resources [7]. Although, newer versions of the aforementioned referenced reports do exist, we decided to perform the analysis using stated data to enable us the comparison to other internal calculations and reports, which are not included in this manuscript. The impact on general findings is negligible.

3. Results and Discussion

Two scenarios have been analyzed based on the presumed NPP life time expectancy, each one having two sub scenarios defined by considered uranium fuel resources. Thus for each scenario, a range of nuclear electricity production and CO2 reduction possibilities have been obtained. There are three key milestone years used in all of the scenarios. The year 2025 is set as the beginning of the extensive LWR buildup; the year 2065 as the final year for LWR build and the beginning of the FBR buildup, and finally the targeted end of the 21 century.
All of the data used in the calculations, as well as overall and extensive results of the calculations, are provided in the Supplementary Materials zip file containing two Microsoft Excel Open XML Format Spreadsheet files: crnobrnja_mdpi_S1.xlsx containing data for scenario S1 calculations, and crnobrnja_mdpi_S2.xlsx containing data for scenario S2 calculations.

3.1. Scenario S1

In the first scenario (S1), the 40 years’ NPP life time is assumed for all NPPs build within the period 2025–2065. The period from 2013 to 2025 is characterized by low growth of nuclear capacity expressed as the linear growth of nuclear capacity by 1.8% per year containing both, the new builds, as well as old nuclear power plants being decommissioned. In 2025, extensive LWR nuclear buildup would begin and span until 2065.
For sub scenario A, the linear growth of nuclear capacity by 3.85% per year is assumed. However, to account for decommissioning of nuclear power plants build pre-2025, decrease of the total nuclear capacity is obtained by yearly subtraction of the constant value equal to the nuclear capacity in 2025 divided by investigated interval (2065–2025). For example, the proposed 3.85% growth of nuclear capacity in 2026 compared to 485.5 GWe that would exist in 2025 would result in 18.7 GWe of new plants, i.e., total capacity of 504.3 GWe. However, due to foreseen closure of 12.1 GWe of pre-2025 nuclear power plants, the total installed nuclear capacity for 2026 would be considered to be 492.1 GWe. For the year 2027, the growth of 3.85% would be applied to the uncorrected value of 504.3 GWe resulting in 19.4 GWe newly build nuclear capacity, which after subtraction of 12.1 GWe of decommissioned plants results in total nuclear capacity of 499.4 GWe. Although, a simpler type of calculation, similar to the one applied for the period 2013–2025, could have been used, we believe that the aforementioned approach is better in simulating the decommissioning of pre-2025 nuclear power plants. For the period 2065–2105, no new LWR builds are foreseen. The total LWR nuclear capacity decreases due to decommissioning. For example, all nuclear power plants that would be built in 2026 with the capacity of 18.7 GWe are foreseen for closure in 2066. The applied dynamics of LWR capacity buildup in the overall period 2013–2065 results in cumulative uranium requirements until 2105 reaching approximately 16 MtU, which were preset as the bottom uranium fuel resource constraint.
For sub scenario B, the linear growth of nuclear capacity by 4.85% per year is assumed, following same methodological approach as described for sub scenario A. The applied dynamics of LWR capacity buildup in the overall period 2013–2065 results in cumulative uranium requirements until 2105 reaching approximately 24 MtU, which were preset as the top uranium fuel resource constraint.
In sub scenario A, the overall LWR capacity in 2065 is 1715 GW, while in sub scenario B it reaches 2743 GW.
FBR buildup starts in the year 2066 and spans until 2105. The proposed and investigated dynamics of the FBR buildup for both of the sub scenarios is based on the compensation of nuclear capacity lost due to LWR decommission. For example, in sub scenario A it is assumed that 18.7 GWe of FBR capacity would become operational in 2066, thus replacing 18.7 GWe of LWRs scheduled for decommission in that year.
The proposed dynamics of LWR/FBR buildup for scenario S1 is presented in Table 1 with results given for selected years enabling a better understanding of the methodology used.
Annual and cumulative uranium requirements, as well as plutonium production and requirements for LWR/FBR buildup proposed in scenario S1 sub scenario A are given in Table 2 (bottom uranium fuel resource constraints are applied). Table 3 gives the corresponding data for sub scenario B where top uranium fuel resource constraints are applied. Plutonium buildup resulting in LWR operation by 2065 would be used to start the gradual buildup of FBR fleet. Due to decommission of LWRs, annual plutonium production in LWRs would decrease after 2065 while, at the same time, plutonium requirements due to FBR operation would increase. However, due to the breeding ratio of 1.1, additional plutonium is also generated in FBRs. With proposed FBR buildup dynamics, overall production of plutonium becomes higher than its requirements by 2080 for both sub-scenarios (lines marked by red in Table 2 and Table 3).
To estimate the possible impact of strong nuclear buildup on CO2 emission reduction one has to compare the production of electricity in proposed scenarios to the ones obtained by extrapolation of WEO reference scenarios. Electricity surplus could then be used to replace electricity produced in fossil-fired power plants. Electricity surpluses for scenario S1, sub-scenarios A and B are given in Table 4 and Table 5, respectively. It is interesting to notice that negative electricity surplus was obtained when comparing electricity production in proposed sub-scenarios with the WEO 450 scenario. However, the electricity production in WEO 450 scenario is a result of mathematical extrapolation of the values given for the period 2013–2040 without taking into account nuclear fuel resources’ constraints imposed on proposed scenarios. Under such conditions, WEO 450 scenario would run out of resources by 2088 (bottom constraint) and 2105 (top constraint), leaving the LWR fleet, even the LWRs that would be just then built, without necessary uranium. Despite the fact that in the proceeding analysis WEO 450 scenario would still be examined, the obtained results should be carefully considered having in mind previously stated facts.
As previously indicated, the surplus of nuclear electricity production could be used to replace fossil produced electricity, thus effectively reducing the CO2 emission. The extrapolation of electricity production in coal power plants from WEO scenarios indicates that the obtained surplus (Table 4 and Table 5) is smaller than the coal-produced electricity for CPS and NPS scenarios. Therefore, the difference of the lifecycle CO2 emission factors between coal and nuclear (820 gCO2eq/kWhe−12 gCO2eq/kWhe) can be used to calculate possible CO2 reduction. As far as WEO 450 scenario coal electricity extrapolation and its comparison to obtained WEO 450 nuclear electricity surplus is concerned, the problem would arise for the period from 2063 till 2071 for sub-scenario A and period from 2053 till 2105 for sub-scenario B. The obtained surplus is higher than the extrapolated coal electricity production. Therefore, the surplus should be used to replace electricity from gas power plants with smaller difference between lifecycle CO2 emission factors (490 gCO2eq/kWhe−12 gCO2eq/kWhe). Possible CO2 emission reduction for scenario S1, sub-scenarios A and B are given in Table 6 and Table 7, respectively.
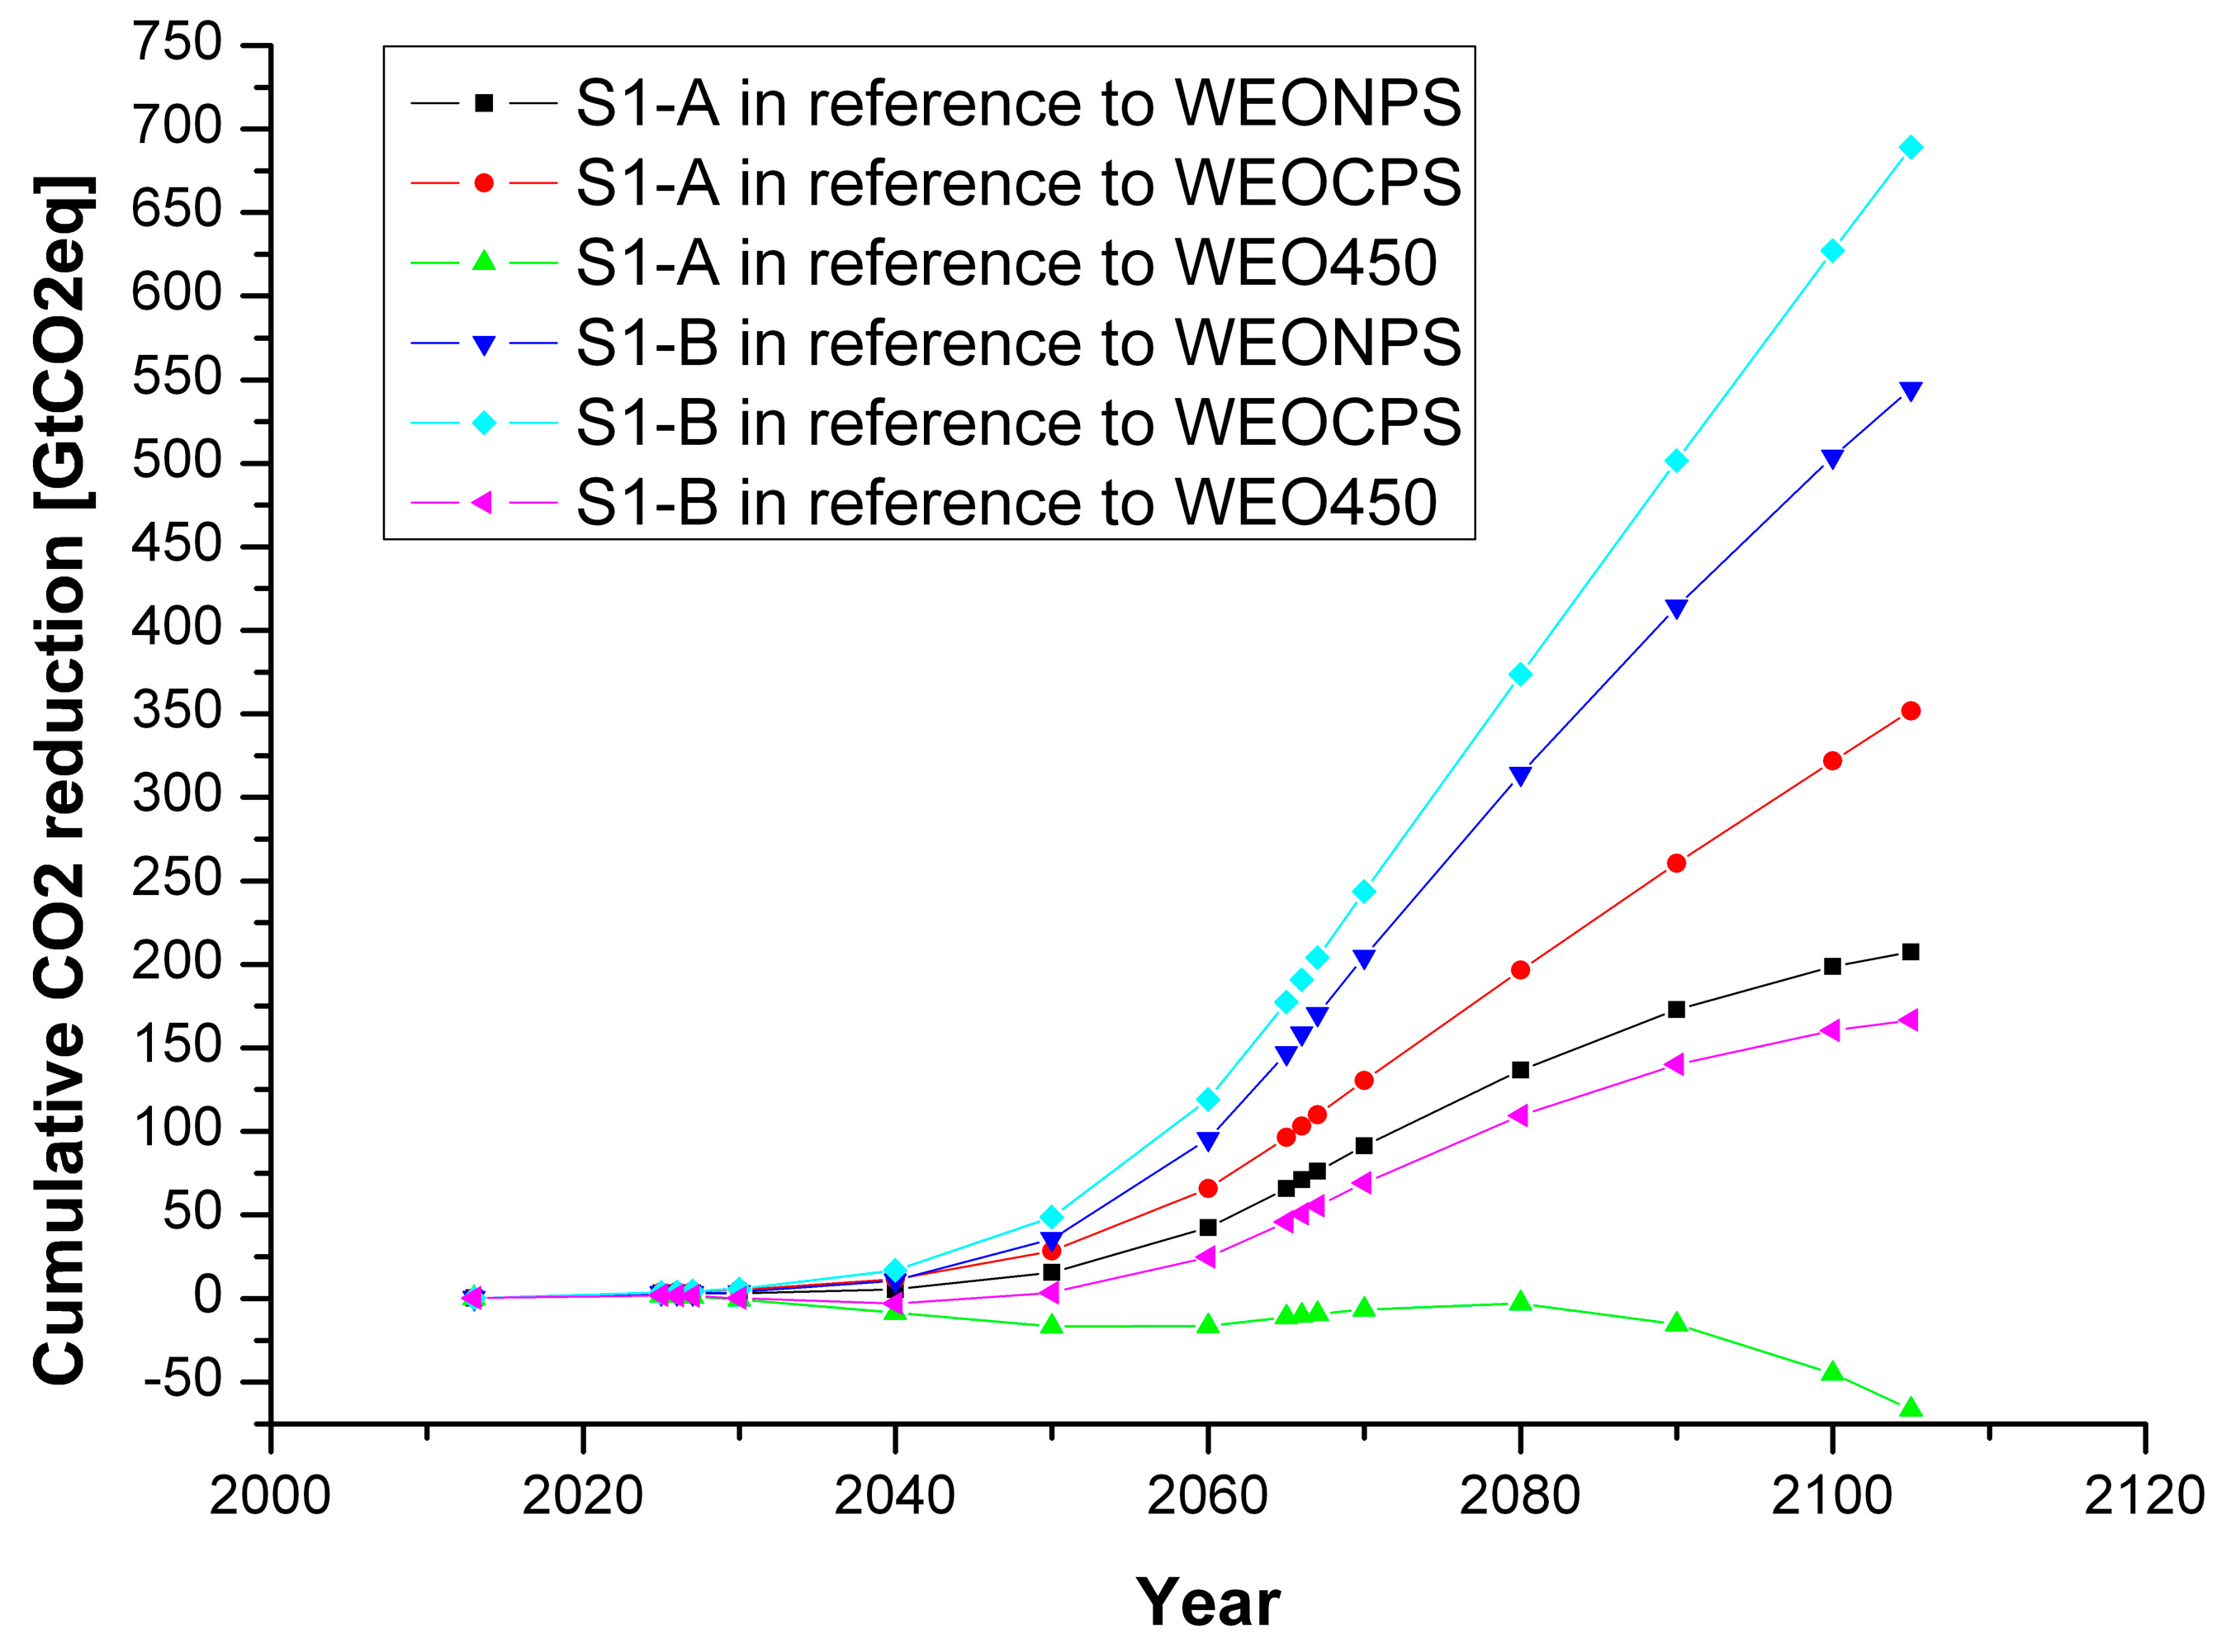
The possible CO2 emission reduction is significant, especially in the period 2060–2080 for both sub scenarios. However, in the first half of the century, the proposed investigated sub scenarios result in modest CO2 reduction when the analysis is performed in the context of WEO NPS and WEO CPS scenarios’ extrapolation. For WEO 450 scenario extrapolation, there is no CO2 reduction. On contrary, the emission increases. One has to be reminded that WEO 450 scenario extrapolation is unfeasible due to uranium fuel outage. Since available research, for example [13], indicates that CO2 emission reduction should be urgently accomplished, it is evident that investigated LWR/FBR buildup could not solely accomplish the task. Cumulative CO2 reduction for both sub scenarios in comparison to WEO reference data extrapolation is graphically depicted in Figure 2.

3.2. Scenario S2

In the second scenario (S2), the 60 years NPP life time is assumed for all NPPs that would be built within the period 2025–2065. As in the scenario S1, the period from 2013 to 2025 is characterized by low growth of nuclear capacity expressed as the linear growth of nuclear capacity by 1.8% per year containing both, the new builds, as well as old nuclear power plants being decommissioned. In 2025, extensive LWR nuclear buildup begins and it spans until 2065. Two sub scenarios are analyzed: sub scenario A affected by the bottom uranium fuel resource constraint, and sub scenario B affected by the top uranium fuel resource constraint. The methodology that would be used for LWR buildup in the period 2025–2065 is identical to the one used for scenario S1. To satisfy the imposed constraints, the resulting linear growths of nuclear capacity by 3.1% and 3.98% for sub scenarios A and B, respectively, have been assumed. In sub scenario A, the overall LWR capacity in 2065 is 1161 GW, while in sub scenario B it reaches 1828 GW. As expected, both values are substantially lower than those obtained in scenario S1 (1715 GW and 2743 GW, respectively).
Due to the 60 years’ life time NPP, in the period 2065–2085 the LWR capacity would not change and would maintain the values from 2065. After that, gradual decrease of capacity starts due to decommissioning, and finally reaches zero level in 2125.
FBR buildup would start in the year 2066. As opposed to scenario S1 where the dynamics of FBR build has been linked to decommissioning level of LWRs, in scenario S2 there is more flexibility in setting up the FBR dynamics, especially for the period 2066–2085. After analyzing a number of options, we decided to present the dynamics of FBR build based on linear growth of installed capacity, which would result in CO2 emission reduction in 2105 similar to the one obtained in scenario S1. It is assumed that the capacity of the FBR fleet does not change after 2105.
The methodology used in the analysis is identical to the one used in the previous scenario. Therefore, calculational intermediate steps are not given. The proposed dynamics of LWR/FBR buildup for scenario S2 is presented in Table 8, while finally obtained CO2 emission reduction for scenario S2, sub-scenarios A and B are given in Table 9 and Table 10, respectively.
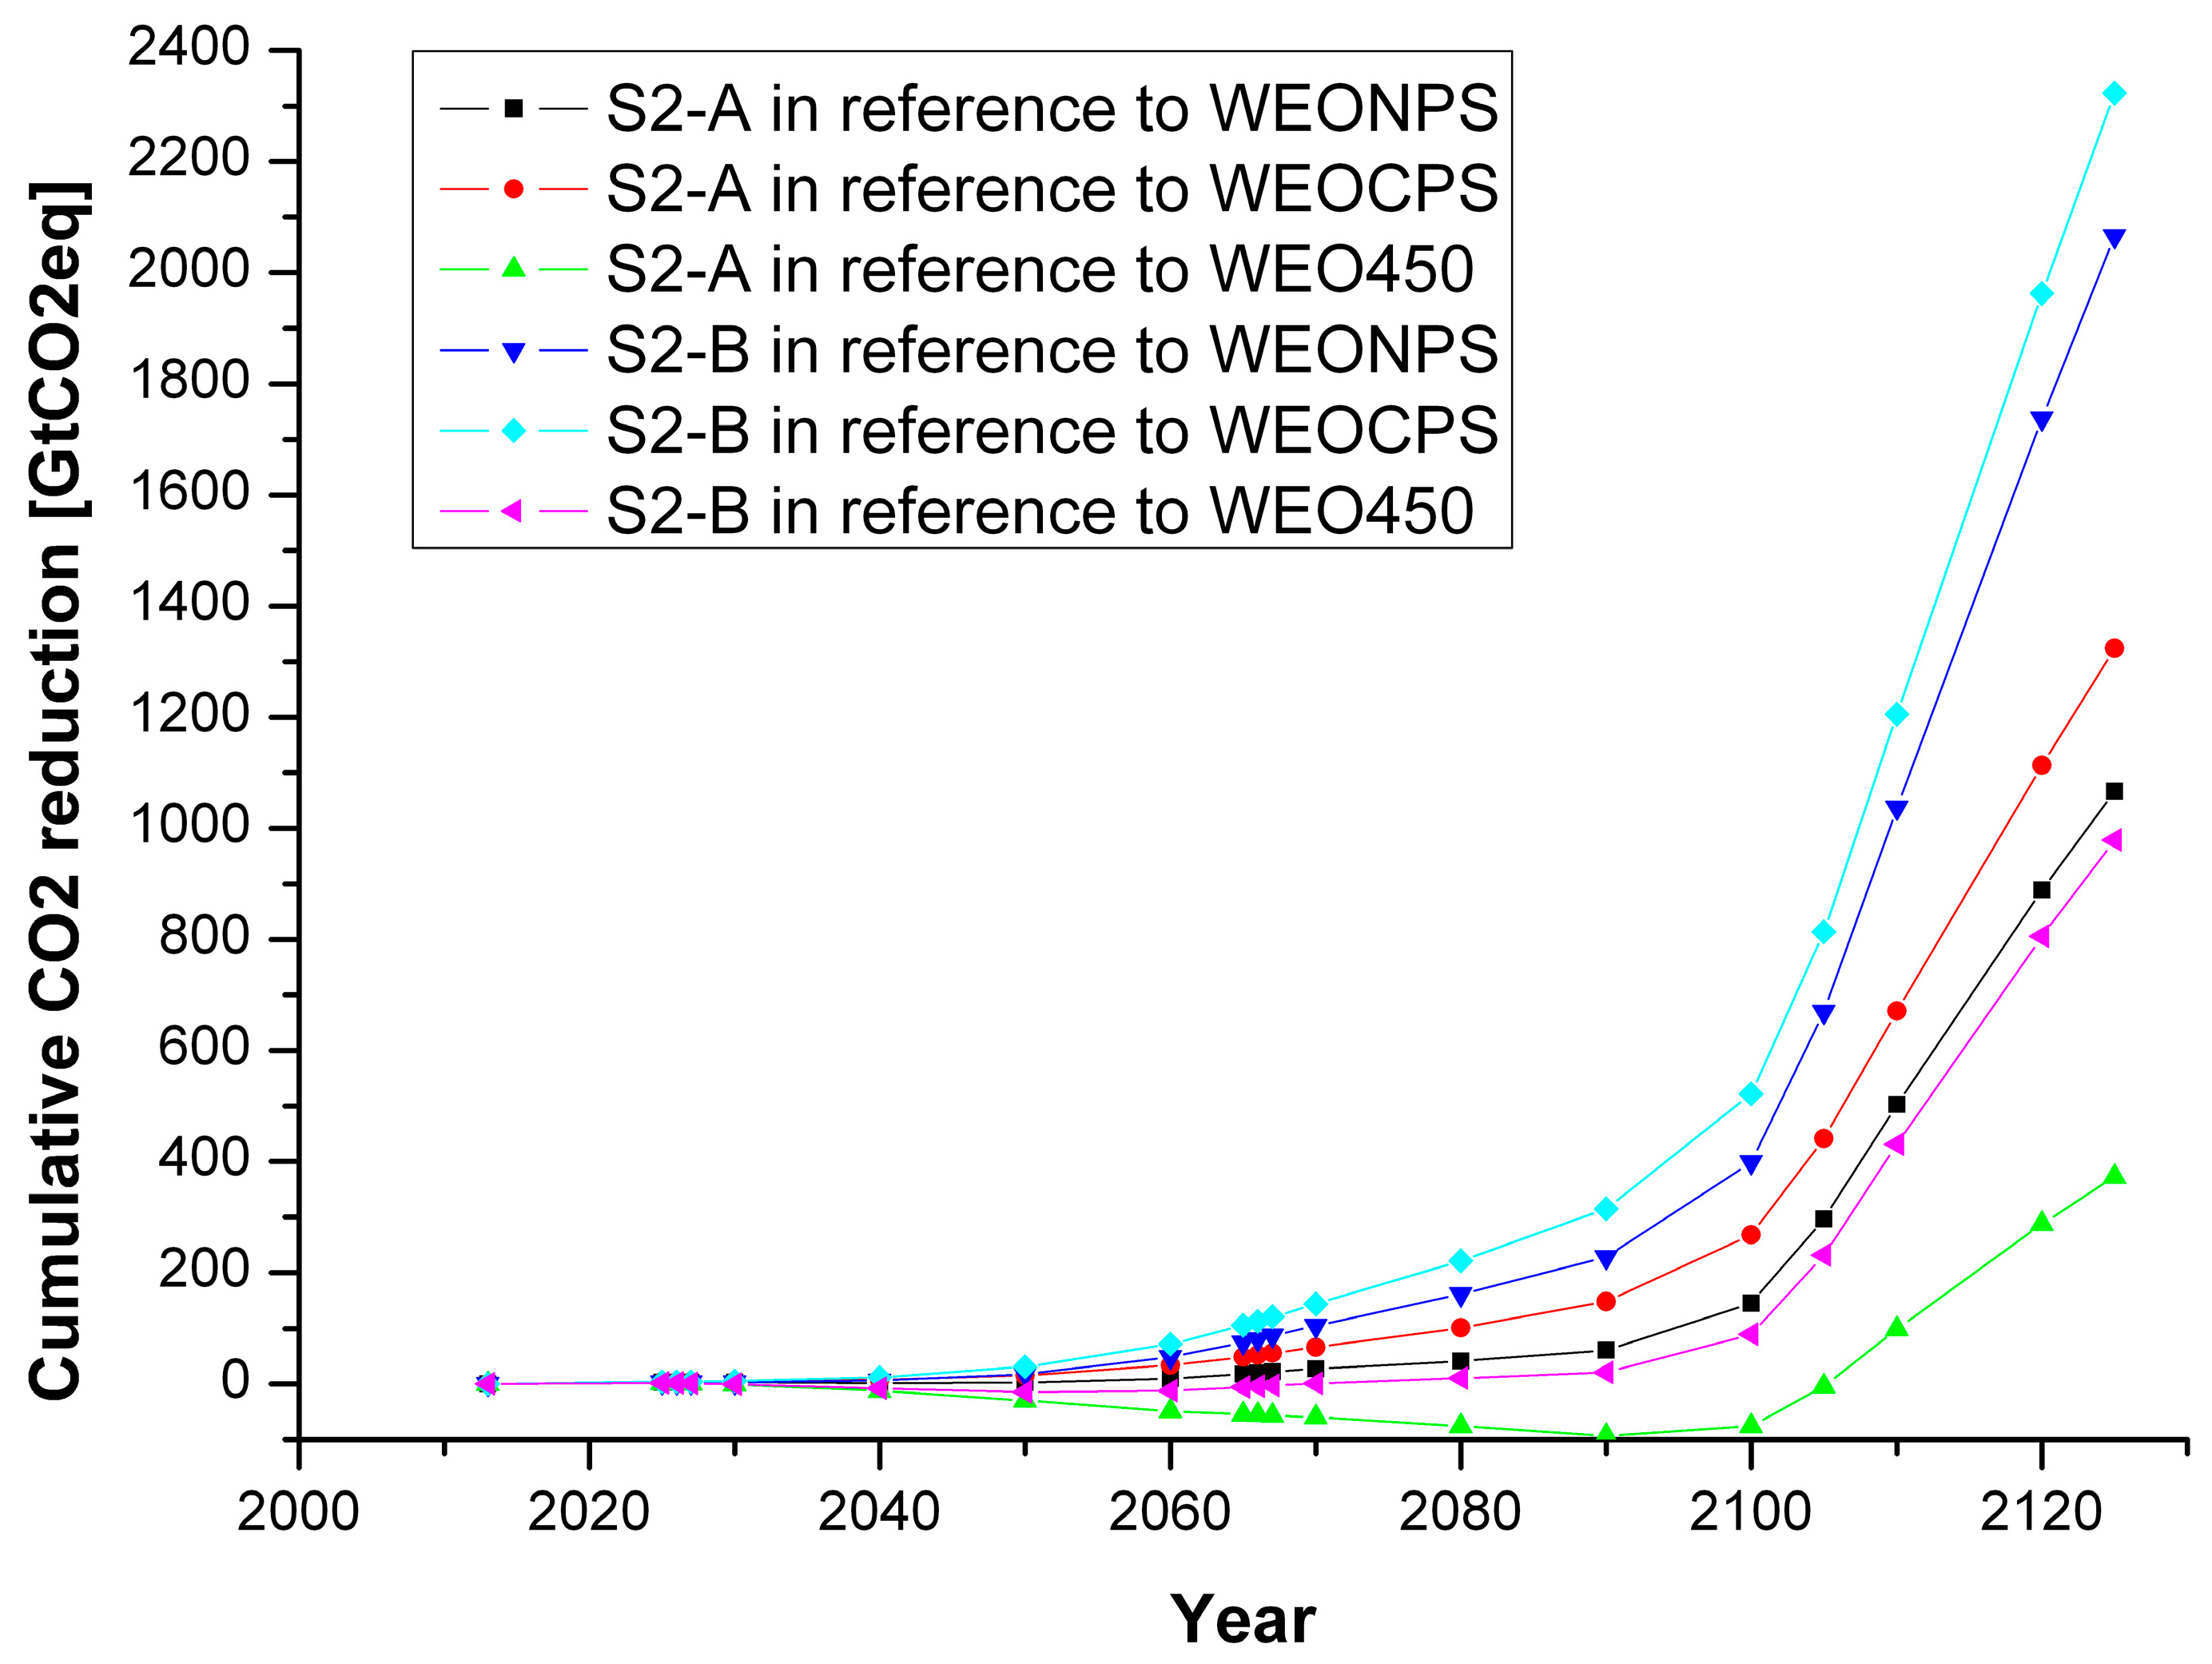
Similar to scenario S1, the possible CO2 emission reduction in both S2 sub scenarios is significant. However, the reduction is achieved mostly at the end of the century and at the beginning of the 22nd century. Once again, it is evident that nuclear energy cannot solely solve the CO2 emission reduction task. Cumulative CO2 reduction for both sub scenarios in comparison to WEO reference data extrapolation is graphically depicted in Figure 3.
4. Conclusions

The aim of this paper was to develop appropriate dynamics for LWR and FBR deployment, roughly by the end of the century, adequate for partial or full fossil power plants replacement while satisfying the available nuclear fuel resource constraint. The assessment of the possible impact on CO2 emission reduction resulting from fossil sources being replaced by nuclear ones has also been performed.
It was shown that, in general, nuclear fuel resources do not represent an obstacle for strong nuclear buildup. Even conservatively set bottom and top uranium resources would allow LWR deployment in the period 2025–2065 that could result in adequate plutonium buildup for proceeding FBR build. It was also shown that accumulated plutonium resources are more than adequate for proposed FBR buildup, and in addition leaving space for further FBRs commission.
In general, after the deployment of FBR fleet starting in 2065, targeted CO2 emission reduction could easily be achieved. However, the obtained CO2 emission reduction for all investigated scenarios and sub scenarios is modest in the first half of the century, during which the crucial reduction should have been achieved to meet the objective of the Paris Agreement.
To modify the LWR/FBR deployment scenarios resulting in significant influence on CO2 emission reduction in the first half of the 21st century, uranium fuel resources constraints should be relaxed and FBR deployment should commence prior to 2065. Therefore, our research will continue by investigation of the newest uranium fuel resources data, as well as on the technological breakthroughs that might enable FBRs to be deployed in large scale as soon as possible.
Apart from FBR technology applicable for the extension of fissile nuclear energy application in long-term, future, low CO2 electricity production, MSTR technology is also a viable option. The prolonged operation of LWR reactors could also be achieved by application of Mixed Oxide Fuel (MOX). These are the issues that we will consider in detail in our future research.
There are a number of issues raised when discussing application of nuclear energy for electricity generation, including safety of operation and radioactive waste management. Although we believe that from the technological aspects these issues have been solved, it is clear that in general, public and political views on nuclear energy do not reflect our position. It is also evident that without wide public and political support, nuclear fleet in scale required for major CO2 emission reduction is not achievable in due time. Further analyses of the impact of larger nuclear buildup on public and political views, and vice versa, are planned for the future research.

Supplementary Materials

The following are available online at https://www.mdpi.com/1996-1073/13/1/134/s1, zip file containing two Microsoft Excel Open XML Format Spreadsheet files: crnobrnja_mdpi_S1.xlsx, and crnobrnja_mdpi_S2.xlsx.

Author Contributions

Conceptualization, B.C. and K.T.; methodology, B.C. and K.T.; software, B.C. and M.M.; validation, K.T. and D.P.; formal analysis, B.C. and K.T.; investigation, B.C.; data curation, B.C. and M.M.; writing—original draft preparation, B.C. and K.T.; writing—review & editing, D.P. and M.M.; visualization, K.T.; supervision, D.P. All authors have read and agreed to the published version of the manuscript.

Funding

This research received no external funding.

Conflicts of Interest

The authors declare no conflict of interest.

References

  1. International Energy Agency (IEA). Global Energy CO2 Status Report; IEA Publications: Paris, France, 2019. [Google Scholar]
  2. United Nations Framework Convention on Climate Change (UNFCCC). Coal Drove Global CO2 Increase of 1.7% in 2018. 27 March 2019. Available online: https://unfccc.int/news/coal-drove-global-co2-increase-of-17-in-2018 (accessed on 9 September 2019).
  3. International Energy Agency (IEA). Global Energy Demand Rose by 2.3% in 2018, Its Fastest Pace in the Last Decade. 28 March 2019. Available online: https://www.iea.org/newsroom/news/2019/march/global-energy-demand-rose-by-23-in-2018-its-fastest-pace-in-the-last-decade.html (accessed on 9 September 2019).
  4. Brook, B.W.; Alonso, A.; Meneley, D.A.; Misak, J.; Blees, T.; Van Erp, J.B. Why nuclear energy is sustainable and has to be part of the energy mix. Sustain. Mater. Technol. 2014, 1, 8–16. [Google Scholar]
  5. Knapp, V.; Pevec, D.; Matijević, M. The potential of fission nuclear power in resolving global climate change under the constraints of nuclear fuel resources and once-through fuel cycles. Energy Policy 2010, 38, 6793–6803. [Google Scholar] [CrossRef]
  6. International Energy Agency (IEA). World Energy Outlook 2009; IEA Publications: Paris, France, 2009. [Google Scholar]
  7. Organization for Economic Co-operation and Development/Nuclear Energy Agency-International Atomic Energy Agency (OECD/NEA-IAEA). Uranium 2007: Resources, Production and Demand; OECD Publications: Paris, France, 2008. [Google Scholar]
  8. Pevec, D.; Knapp, V.; Trontl, K. Long Term Sustainability of Nuclear Fuel Resources. In Advances in Nuclear Fuel; Revankar, S.T., Ed.; InTech: Rijeka, Croatia, 2012. [Google Scholar]
  9. Knapp, V.; Matijević, M.; Pevec, D.; Crnobrnja, B.; Lale, D. Long Term Fuel Sustainable Fission Energy Perspective Relevant for Combating Climate Change. J. Energy Power Eng. 2016, 10, 651–659. [Google Scholar]
  10. International Energy Agency (IEA). World Energy Outlook 2015; IEA Publications: Paris, France, 2015. [Google Scholar]
  11. Bodansky, D. Nuclear Energy Principles, Practices, and Prospects, 2nd ed.; Springer: New York, NY, USA, 2004. [Google Scholar]
  12. Schlömer, S.; Bruckner, T.; Fulton, L.; Hertwich, E.; McKinnon, A.; Perczyk, D.; Roy, J.; Schaeffer, R.; Sims, R.; Smith, P.; et al. Annex III: Technology-specific cost and performance parameters. In Climate Change 2014: Mitigation of Climate Change; Contribution of Working Group III to the Fifth Assessment Report of the Intergovernmental Panel on Climate Change; Edenhofer, O., Pichs-Madruga, R., Sokona, Y., Farahani, E., Kadner, S., Seyboth, K., Adler, A., Baum, I., Brunner, S., Eickemeier, P., et al., Eds.; Cambridge University Press: Cambridge, UK; New York, NY, USA, 2014. [Google Scholar]
  13. Rogelj, J.; Shindell, D.; Jiang, K.; Fifita, S.; Forster, P.; Ginzburg, V.; Handa, C.; Kheshgi, H.; Kobayashi, S.; Kriegler, E.; et al. Mitigation Pathways Compatible with 1.5 °C in the Context of Sustainable Development. In Global Warming of 1.5 °C. An IPCC Special Report on the Impacts of Global Warming of 1.5 °C above Pre-Industrial Levels and Related Global Greenhouse Gas Emission Pathways, in the Context of Strengthening the Global Response to the Threat of Climate Change, Sustainable Development, and Efforts to Eradicate Poverty; Masson-Delmotte, V., Zhai, P., Pörtner, H.-O., Roberts, D., Skea, J., Shukla, P.R., Pirani, A., Moufouma-Okia, W., Péan, C., Pidcock, R., et al., Eds.; In press.
Figure 1. Forecast for electricity generation in nuclear power plants based on WEO 2015 scenarios.
Energies 13 00134 g001
Figure 2. Cumulative CO2 reduction for scenario S1, sub scenarios A and B, in comparison to WEO 2015 extrapolation.
Energies 13 00134 g002
Figure 3. Cumulative CO2 reduction for scenario S2, sub scenarios A and B, in comparison to World Energy Outlook (WEO) 2015 extrapolation.
Energies 13 00134 g003
Table 1. Proposed dynamics of lightwater reactor (LWR)/fast breeder reactor (FBR) buildup for scenario S1.
YearSub Scenario A (16 MtU)Sub Scenario B (22–25 MtU)
LWR New Builds [GW]LWR True Capacity [GW]FBR Capacity [GW]LWR New Builds [GW]LWR True Capacity [GW]FBR Capacity [GW]
20130.0392.00.00.0392.00.0
20258.6485.60.08.6485.60.0
202618.7492.10.023.6497.00.0
202719.4499.40.024.7509.50.0
203021.7525.80.028.5554.60.0
204031.7673.70.045.7806.00.0
205046.3945.10.073.41283.10.0
206067.51396.90.0117.82122.90.0
206581.61714.90.0149.32742.90.0
20660.01696.218.70.02719.323.6
20670.01676.838.10.02694.648.2
20700.01614.0101.00.02613.1129.7
20800.01344.7370.20.02240.4502.5
20900.0951.9763.00.01641.91101.0
21000.0378.71336.20.0680.72062.2
21050.00.01714.90.00.02742.9
Bold data refer to the three key milestone years: 2025 as the beginning of the extensive LWR buildup; 2065 as the final year for LWR build and the beginning of the FBR buildup; 2100 as the end of the century.
Table 2. Uranium requirements and plutonium production and requirements for scenario S1, sub scenario A.
YearAnn. Uranium Req. (ktU)Cum. Uranium Req.(ktU)Ann. Plutonium Prod. (tPu)-LWRCum. Plutonium Prod. (tPu)-LWRAnn. Plutonium Req. (tPu)-FBRAnn. Plutonium Prod. (tPu)-FBROverall Plutonium Res. (tPu)
201375.675.658.858.80.00.00.0
202593.61095.972.8852.70.00.0852.7
202694.91190.875.6928.30.00.0928.3
202796.31287.078.61006.90.00.01006.9
2030101.41585.888.01261.10.00.01261.1
2040129.92740.2128.42350.50.00.02350.5
2050182.24303.2187.33939.90.00.03939.9
2060269.36569.9273.36258.90.00.06258.9
2065330.68094.9330.17791.40.00.07791.4
2066327.08421.9327.38118.6121.50.07997.1
2067323.38745.1324.48443.0247.7133.78329.0
2070311.29691.0314.99397.5656.2566.39307.6
2080259.212,533.2274.512,337.22406.22420.012,351.0
2090183.514,732.7215.614,776.94959.65124.614,941.9
210073.015,994.5129.616,487.08685.19070.716,872.6
21050.016,146.072.816,969.111,146.911,678.317,500.5
Bold data refer to the three key milestone years: 2025 as the beginning of the extensive LWR buildup; 2065 as the final year for LWR build and the beginning of the FBR buildup; 2100 as the end of the century. Data in red refer to the year when the overall production of plutonium becomes higher than its requirements.
Table 3. Uranium requirements and plutonium production and requirements for scenario S1, sub scenario B.
YearAnn. Uranium Req. (ktU)Cum. Uranium Req.(ktU)Ann. Plutonium Prod. (tPu)-LWRCum. Plutonium Prod. (tPu)-LWRAnn. Plutonium Req. (tPu)-FBRAnn. Plutonium Prod. (tPu)-FBROverall Plutonium Res. (tPu)
201375.675.658.858.80.00.00.0
202593.61095.972.8852.70.00.0852.7
202695.81191.776.4929.00.00.0929.0
202798.21289.980.11009.10.00.01009.1
2030106.91601.592.31273.40.00.01273.4
2040155.42909.3148.22482.10.00.02482.1
2050247.44924.2238.04423.10.00.04423.1
2060409.38216.2382.27539.80.00.07539.8
2065528.810,608.7484.39747.30.00.09747.3
2066524.311,133.0480.710,228.0153.10.010,074.9
2067519.511,652.5477.010,705.0313.6168.410,559.8
2070503.813,180.0464.812,112.1843.3724.111,992.9
2080431.917,850.6408.916,474.43266.23266.016,474.2
2090316.521,580.2319.120,104.57156.77347.620,295.5
2100131.223,798.5174.922,558.913,404.013,901.823,056.7
21050.024,073.472.823,136.917,828.818,543.923,852.1
Bold data refer to the three key milestone years: 2025 as the beginning of the extensive LWR buildup; 2065 as the final year for LWR build and the beginning of the FBR buildup; 2100 as the end of the century. Data in red refer to the year when the overall production of plutonium becomes higher than its requirements.
Table 4. Electricity surplus for scenario S1, sub scenario A.
YearElectricity Total (LWR + FBR) [TWh]Electricity WEONPS Nuclear [TWh]Electricity Surplus NPS [TWh]Electricity WEOCPS Nuclear [TWh]Electricity Surplus CPS [TWh]Electricity WEO450 Nuclear [TWh]Electricity Surplus 450 [TWh]
20133021.82478.0543.82478.0543.82478.0543.8
20253743.23540.0203.23426.5316.74017.3−274.0
20263793.83792.01.83477.0316.84168.5−374.7
20273849.83846.33.63527.5322.34319.8−469.9
20304053.63998.055.63679.0374.64861.0−807.4
20405193.24606.0587.23974.01219.26243.0−1049.8
20507285.75323.71962.04269.03016.78074.7−789.1
206010,768.16124.94643.24564.06204.19814.1954.0
206513,219.96568.06652.04711.58508.410,724.72495.2
206613,219.96660.26559.74741.08478.910,910.12309.8
206713,219.96753.76466.24770.58449.411,096.52123.4
207013,219.97041.96178.04859.08360.911,662.51557.4
208013,219.98090.75129.25154.08065.913,619.8−399.9
209013,219.99289.63930.35449.07770.915,686.2−2466.3
210013,219.910,659.12560.85744.07475.917,861.5−4641.6
210513,219.911,415.01804.95891.57328.418,990.0−5770.1
Bold data refer to the three key milestone years: 2025 as the beginning of the extensive LWR buildup; 2065 as the final year for LWR build and the beginning of the FBR buildup; 2100 as the end of the century.
Table 5. Electricity surplus for scenario S1, sub scenario B.
YearElectricity Total (LWR + FBR) [TWh]Electricity WEONPS Nuclear [TWh]Electricity Surplus NPS [TWh]Electricity WEOCPS Nuclear [TWh]Electricity Surplus CPS [TWh]Electricity WEO450 Nuclear [TWh]Electricity Surplus 450 [TWh]
20133021.82478.0543.82478.0543.82478.0543.8
20253743.23540.0203.23426.5316.74017.3−274.0
20263831.23792.039.23477.0354.24168.5−337.3
20273928.03846.381.73527.5400.54319.8−391.8
20304275.53998.0277.53679.0596.54861.0−585.5
20406213.14606.01607.13974.02239.16243.0−29.9
20509891.35323.74567.74269.05622.38074.71816.6
206016,364.76124.910,239.84564.011,800.79814.16550.6
206521,144.46568.014,576.44711.516,432.910,724.710,419.7
206621,144.46660.214,484.24741.016,403.410,910.110,234.3
206721,144.46753.714,390.74770.516,373.911,096.510,047.9
207021,144.47041.914,102.54859.016,285.411,662.59481.9
208021,144.48090.713,053.75154.015,990.413,619.87524.6
209021,144.49289.611,854.85449.015,695.415,686.25458.2
210021,144.410,659.110,485.35744.015,400.417,861.53282.9
210521,144.411,415.09729.45891.515,252.918,990.02154.4
Bold data refer to the three key milestone years: 2025 as the beginning of the extensive LWR buildup; 2065 as the final year for LWR build and the beginning of the FBR buildup; 2100 as the end of the century.
Table 6. Possible CO2 emission reduction for scenario S1, sub scenario A.
YearCO2 Reduction NPS [Gt CO2eq]Cumulative CO2 Reduction NPS [Gt CO2eq]CO2 Reduction CPS [Gt CO2eq]Cumulative CO2 Reduction CPS [Gt CO2eq]CO2 Reduction 450 [Gt CO2eq]Cumulative CO2 Reduction 450 [Gt CO2eq]
20130.40.40.40.40.40.4
20250.23.10.33.7−0.22.0
20260.03.10.34.0−0.31.7
20270.03.10.34.2−0.41.3
20300.03.20.35.1−0.7−0.3
20400.55.41.011.3−0.8−8.3
20501.615.52.428.4−0.6−16.7
20603.842.25.065.80.8−16.4
20655.465.76.996.31.2−11.1
20665.371.06.9103.21.1−10.0
20675.276.26.8110.01.0−9.0
20705.091.46.8130.30.7−6.4
20804.1136.76.5196.6−0.3−2.9
20903.2173.06.3260.4−2.0−15.3
21002.1198.86.0321.9−3.8−44.8
21051.5207.35.9351.8−4.7−66.3
Bold data refer to the three key milestone years: 2025 as the beginning of the extensive LWR buildup; 2065 as the final year for LWR build and the beginning of the FBR buildup; 2100 as the end of the century.
Table 7. Possible CO2 emission reduction for scenario S1, sub scenario B.
YearCO2 Reduction NPS [Gt CO2eq]Cumulative CO2 Reduction NPS [Gt CO2eq]CO2 Reduction CPS [Gt CO2eq]Cumulative CO2 Reduction CPS [Gt CO2eq]CO2 Reduction 450 [Gt CO2eq]Cumulative CO2 Reduction 450 [Gt CO2eq]
20130.40.40.40.40.40.4
20250.23.10.33.7−0.22.0
20260.03.10.34.0−0.31.7
20270.13.20.34.3−0.31.4
20300.23.70.55.6−0.50.2
20401.310.81.816.80.0−2.8
20503.735.54.548.51.53.4
20608.395.49.5119.03.124.7
206511.8146.913.3177.55.045.7
206611.7158.613.3190.84.950.6
206711.6170.213.2204.04.855.4
207011.4204.613.2243.64.569.2
208010.5314.012.9373.83.6109.5
20909.6414.312.7501.72.6140.0
21008.5504.112.4627.21.6160.4
21057.9544.612.3689.11.0166.7
Bold data refer to the three key milestone years: 2025 as the beginning of the extensive LWR buildup; 2065 as the final year for LWR build and the beginning of the FBR buildup; 2100 as the end of the century.
Table 8. Proposed dynamics of LWR/FBR buildup for scenario S2.
YearSub Scenario A (16 MtU)Sub Scenario B (22–25 MtU)
LWR New Builds [GW]LWR True Capacity [GW]FBR Capacity [GW]LWR New Builds [GW]LWR True Capacity [GW]FBR Capacity [GW]
20130.0392.00.00.0392.00.0
20258.6485.60.08.6485.60.0
202615.1488.50.019.3492.80.0
202715.5491.90.020.1500.70.0
203017.0505.00.022.6529.50.0
204023.1585.50.033.4689.90.0
205031.3738.20.049.3984.80.0
206042.5988.70.072.91478.40.0
206549.51161.10.088.51827.80.0
20660.01161.110.00.01827.810.0
20670.01161.111.90.01827.812.0
20700.01161.119.70.01827.820.7
20800.01161.1107.70.01827.8128.4
20900.01081.0587.80.01723.2795.0
21000.0879.13209.40.01441.44922.2
21050.0752.57499.20.01253.512,248.1
21100.0605.07499.20.01025.112,248.1
21200.0233.17499.20.0410.112,248.1
21250.00.07499.20.00.012,248.1
Bold data refer to the five key milestone years: 2025 as the beginning of the extensive LWR buildup; 2065 as the final year for LWR build and the beginning of the FBR buildup; 2100 as the end of the century; 2105 to enable comparison with scenario S1; 2125 as the last year of LWR operation.
Table 9. Possible CO2 emission reduction for scenario S2, sub scenario A.
YearCO2 Reduction NPS [Gt CO2eq]Cumulative CO2 Reduction NPS [Gt CO2eq]CO2 Reduction CPS [Gt CO2eq]Cumulative CO2 Reduction CPS [Gt CO2eq]CO2 Reduction 450 [Gt CO2eq]Cumulative CO2 Reduction 450 [Gt CO2eq]
20130.40.40.40.40.40.4
20250.23.10.33.7−0.22.0
20260.03.10.23.9−0.31.7
20270.03.00.24.2−0.41.2
2030−0.12.80.24.7−0.8−0.7
2040−0.11.60.47.6−1.4−12.1
20500.32.51.115.4−1.9−29.7
20601.29.92.533.6−1.8−48.6
20651.918.13.448.7−0.8−54.7
20661.920.03.552.2−0.9−55.6
20671.821.83.555.6−1.0−56.6
20701.727.03.465.9−1.2−60.0
20801.441.43.7101.2−1.8−76.0
20902.960.86.0148.2−1.3−93.2
210016.9145.120.8268.26.5−76.1
210542.2296.446.6440.921.3−4.3
211040.6502.645.6671.020.299.1
212036.8888.743.01113.517.7288.0
212534.61066.341.51324.116.3372.3
Bold data refer to the five key milestone years: 2025 as the beginning of the extensive LWR buildup; 2065 as the final year for LWR build and the beginning of the FBR buildup; 2100 as the end of the century; 2105 to enable comparison with scenario S1; 2125 as the last year of LWR operation.
Table 10. Possible CO2 emission reduction for scenario S2, sub scenario B.
YearCO2 Reduction NPS [Gt CO2eq]Cumulative CO2 Reduction NPS [Gt CO2eq]CO2 Reduction CPS [Gt CO2eq]Cumulative CO2 Reduction CPS [Gt CO2eq]CO2 Reduction 450 [Gt CO2eq]Cumulative CO2 Reduction 450 [Gt CO2eq]
20130.40.40.40.40.40.4
20250.23.10.33.7−0.22.0
20260.03.10.34.0−0.31.7
20270.03.10.34.2−0.41.3
20300.13.20.35.1−0.6−0.3
20400.66.11.112.0−0.7−7.6
20501.817.92.730.8−0.4−14.3
20604.348.45.572.10.8−12.0
20656.175.07.6105.61.6−5.8
20666.181.07.6113.21.6−4.2
20676.087.07.6120.81.5−2.8
20705.8104.77.6143.61.21.2
20805.6161.18.0220.90.710.1
20908.2227.411.3314.81.820.5
210031.0398.835.0522.014.989.2
210574.9669.279.3813.740.7231.4
211072.81037.577.81205.839.3430.7
212067.51737.973.71962.635.9805.5
212564.22065.771.12323.533.8978.7
Bold data refer to the five key milestone years: 2025 as the beginning of the extensive LWR buildup; 2065 as the final year for LWR build and the beginning of the FBR buildup; 2100 as the end of the century; 2105 to enable comparison with scenario S1; 2125 as the last year of LWR operation