1. Introduction
The attention on the photovoltaic power generation system (PV system) has been increased over the last decades owing to the fact that sunlight is abundant, clean, and sustainable. In addition, PV system requires relatively lower operation and maintenance costs [
1]. However, prolonged operation of the PV system would cause high degradation rates with a median of 0.5%/year in its power generation [
2]. Furthermore, the system typically operates in a harsh outdoor environment, making it vulnerable to suffer various types of faults [
3]. Faults in the PV system not only reduce the power generation drastically and accelerate system ageing but also make the availability of the whole system at risk [
3,
4]. Hence, it is important to carry out fault detection and diagnosis (FDD) in order to enhance reliability, efficiency, and safety especially in PV system [
1,
3,
4].
There are several fault detection methods for PV modules such as visual, thermal, electroluminescence (EL) imaging, and electrical methods. The visual and thermal methods require qualified personnel to closely observe hot spots and color changes that may have occurred within the PV modules. These methods require thermal cameras to capture the thermal images of the array. On the other hand, EL imaging is a versatile technique for spatially resolved analysis of different electrical properties of the PV module and individual cells within the module [
5]. The individual cell performance of the PV module is diagnosed by capturing the movement of electrical charge using a charge-coupled device (CCD) camera in the darkroom. From the literature, PV module performances in terms of shunt resistance and series resistance, microcrack analysis, and diffusion length of minority carriers at PN junction have been explored through EL imaging [
5].
In comparison with the three aforementioned fault detection methods, electrical methods based on statistical signal and processing approaches [
6,
7,
8], power losses analysis [
9,
10,
11], I-V characteristic analysis [
12,
13,
14], and voltage-current measurements [
15,
16,
17,
18,
19,
20] are found to be more advantageous and promising [
4]. These electrical methods can be used to investigate numerous faults in PV systems such as short-circuit faults, open-circuit faults, shading conditions, degradation faults, the line to line faults, bypass diode faults, DC arc faults, bridging faults, MPPT errors, and others. In these methods, the electrical parameters must be measured and monitored to enhance the PV system performances. The I-V characteristic analysis method, for instance, requires an I-V tracer to measure the corresponding current and voltage by sweeping a variable load on the output terminals of the PV source, and the test is conducted when the PV system is shutdown [
21,
22]. The analysis involved in power losses and voltage-current measurement methods are typically the comparison between the monitored data and the simulation results of the PV system [
16]. A monitoring system typically records various parameters such as PV input power, AC output power, including weather conditions while the PV system is operating.
Monitoring systems can be broadly classified into wired and wireless systems [
23]. The conventional wired monitoring system provides a reliable solution in data transmission, but it suffers from several limitations. On the other hand, the wireless monitoring system is designed and built as an alternative to overcome the physical limitations of the conventional wired monitoring system. The monitoring system proposed in [
24] used a Zigbee-based network to monitor PV voltage, PV current, inverter voltage, inverter current, ambient temperature, module temperature, and solar irradiation for a grid-connected PV system that was equipped with a web-based application. Zigbee configuration is a mesh network comprising low power wireless transceivers with the transmission distance up to 100 m line-of-sight. The system was designed using a point-to-point network topology, which is the simplest form of Zigbee networks.
This paper presents a novel method for analyzing PV string failure based on the real-time operating voltage (Vop) of the PV module. A health monitoring system has been developed and installed in a grid-connected PV system for verification of the proposed detection and diagnosis method. In the proposed solution, all modules in a PV string are equipped with voltage sensors to measure their operating voltages by using the wireless sensor network. This enables the voltage of each module to be closely monitored, unlike the conventional methods which measures the PV string voltage only. The conventional monitoring system also requires weather sensors (solar irradiance and temperature) in addition to the voltage and current sensors, therefore increases the overall system costs. A GUI program has also been developed to display the real-time PV module performances in both figure and visual forms, which are useful for early identification of PV system faults.
Section 2 presents the analysis of PV string failure, in which the module-operating voltages under several fault conditions are investigated for identification purposes. In
Section 3, the development of the wireless PV health monitoring system to verify the proposed identification method based on the actual PV operating voltage is discussed in detail. In
Section 4, the results obtained from the developed monitoring system are presented and discussed, and the conclusion is provided in
Section 5.
2. PV String Failure Analysis
There are several failure modes and degradation mechanisms which reduce the power output or even cause PV modules to fail [
1,
23]. Electrical fault scenarios in a PV string can be classified as partial shading, line-to-line fault, bypass diode fault, degradation fault, bridging fault as well as open-circuit fault [
4]. The faults cause various effects on the PV string electrical characteristics, such as reduced open-circuit voltage (V
oc), reduced short circuit current (I
sc), and reduced fill factor (FF), which consequently shift the normal operating point of the PV array.
The detailed study of the impact of all possible faults, particularly on a PV string is performed by using PSIM software. Detailed PV module characteristics can be obtained by analyzing the solar cell equivalent circuit.
Figure 1 shows the equivalent circuit of a solar cell based on the single diode model [
22].
Equations (1)–(6) represent the mathematical model of a PV module. The parameters
i,
iph,
id, and
ir are output current, photon current, diode current, and shunt resistor current.
Rs is a small series resistance and
Rsh is a large shunt resistance defined as 0.008 Ω and 1000 Ω respectively. More accurate identification of the one-diode model or so-called the five-parameter model for PV modules from datasheet values can be obtained in the literature [
25,
26,
27].
S0 is the standard light intensity (1000 W/m
2),
Tref is the reference temperature (25 °C),
isc0 is the short-circuit current at the reference temperature (7.9 A),
is0 is diode saturation current at the reference temperature (2.16 × 10
−8A),
Eg is the band gap energy defined as a function of temperature (approximately 1.1 eV),
A is the ideality factor (for polycrystalline silicon, about 1.2),
Ct is the temperature coefficient (for PV-AE125 is −0.343%/°C) [
28],
ks is the coefficient that defines how light intensity affects the solar-cell temperature,
q is the electron charge (1.6 × 10
−19),
k is the Boltzmann constant (1.3806505 × 10
−23),
S (W/m
2) is the light-intensity input, and
Ta (°C) is the ambient-temperature input.
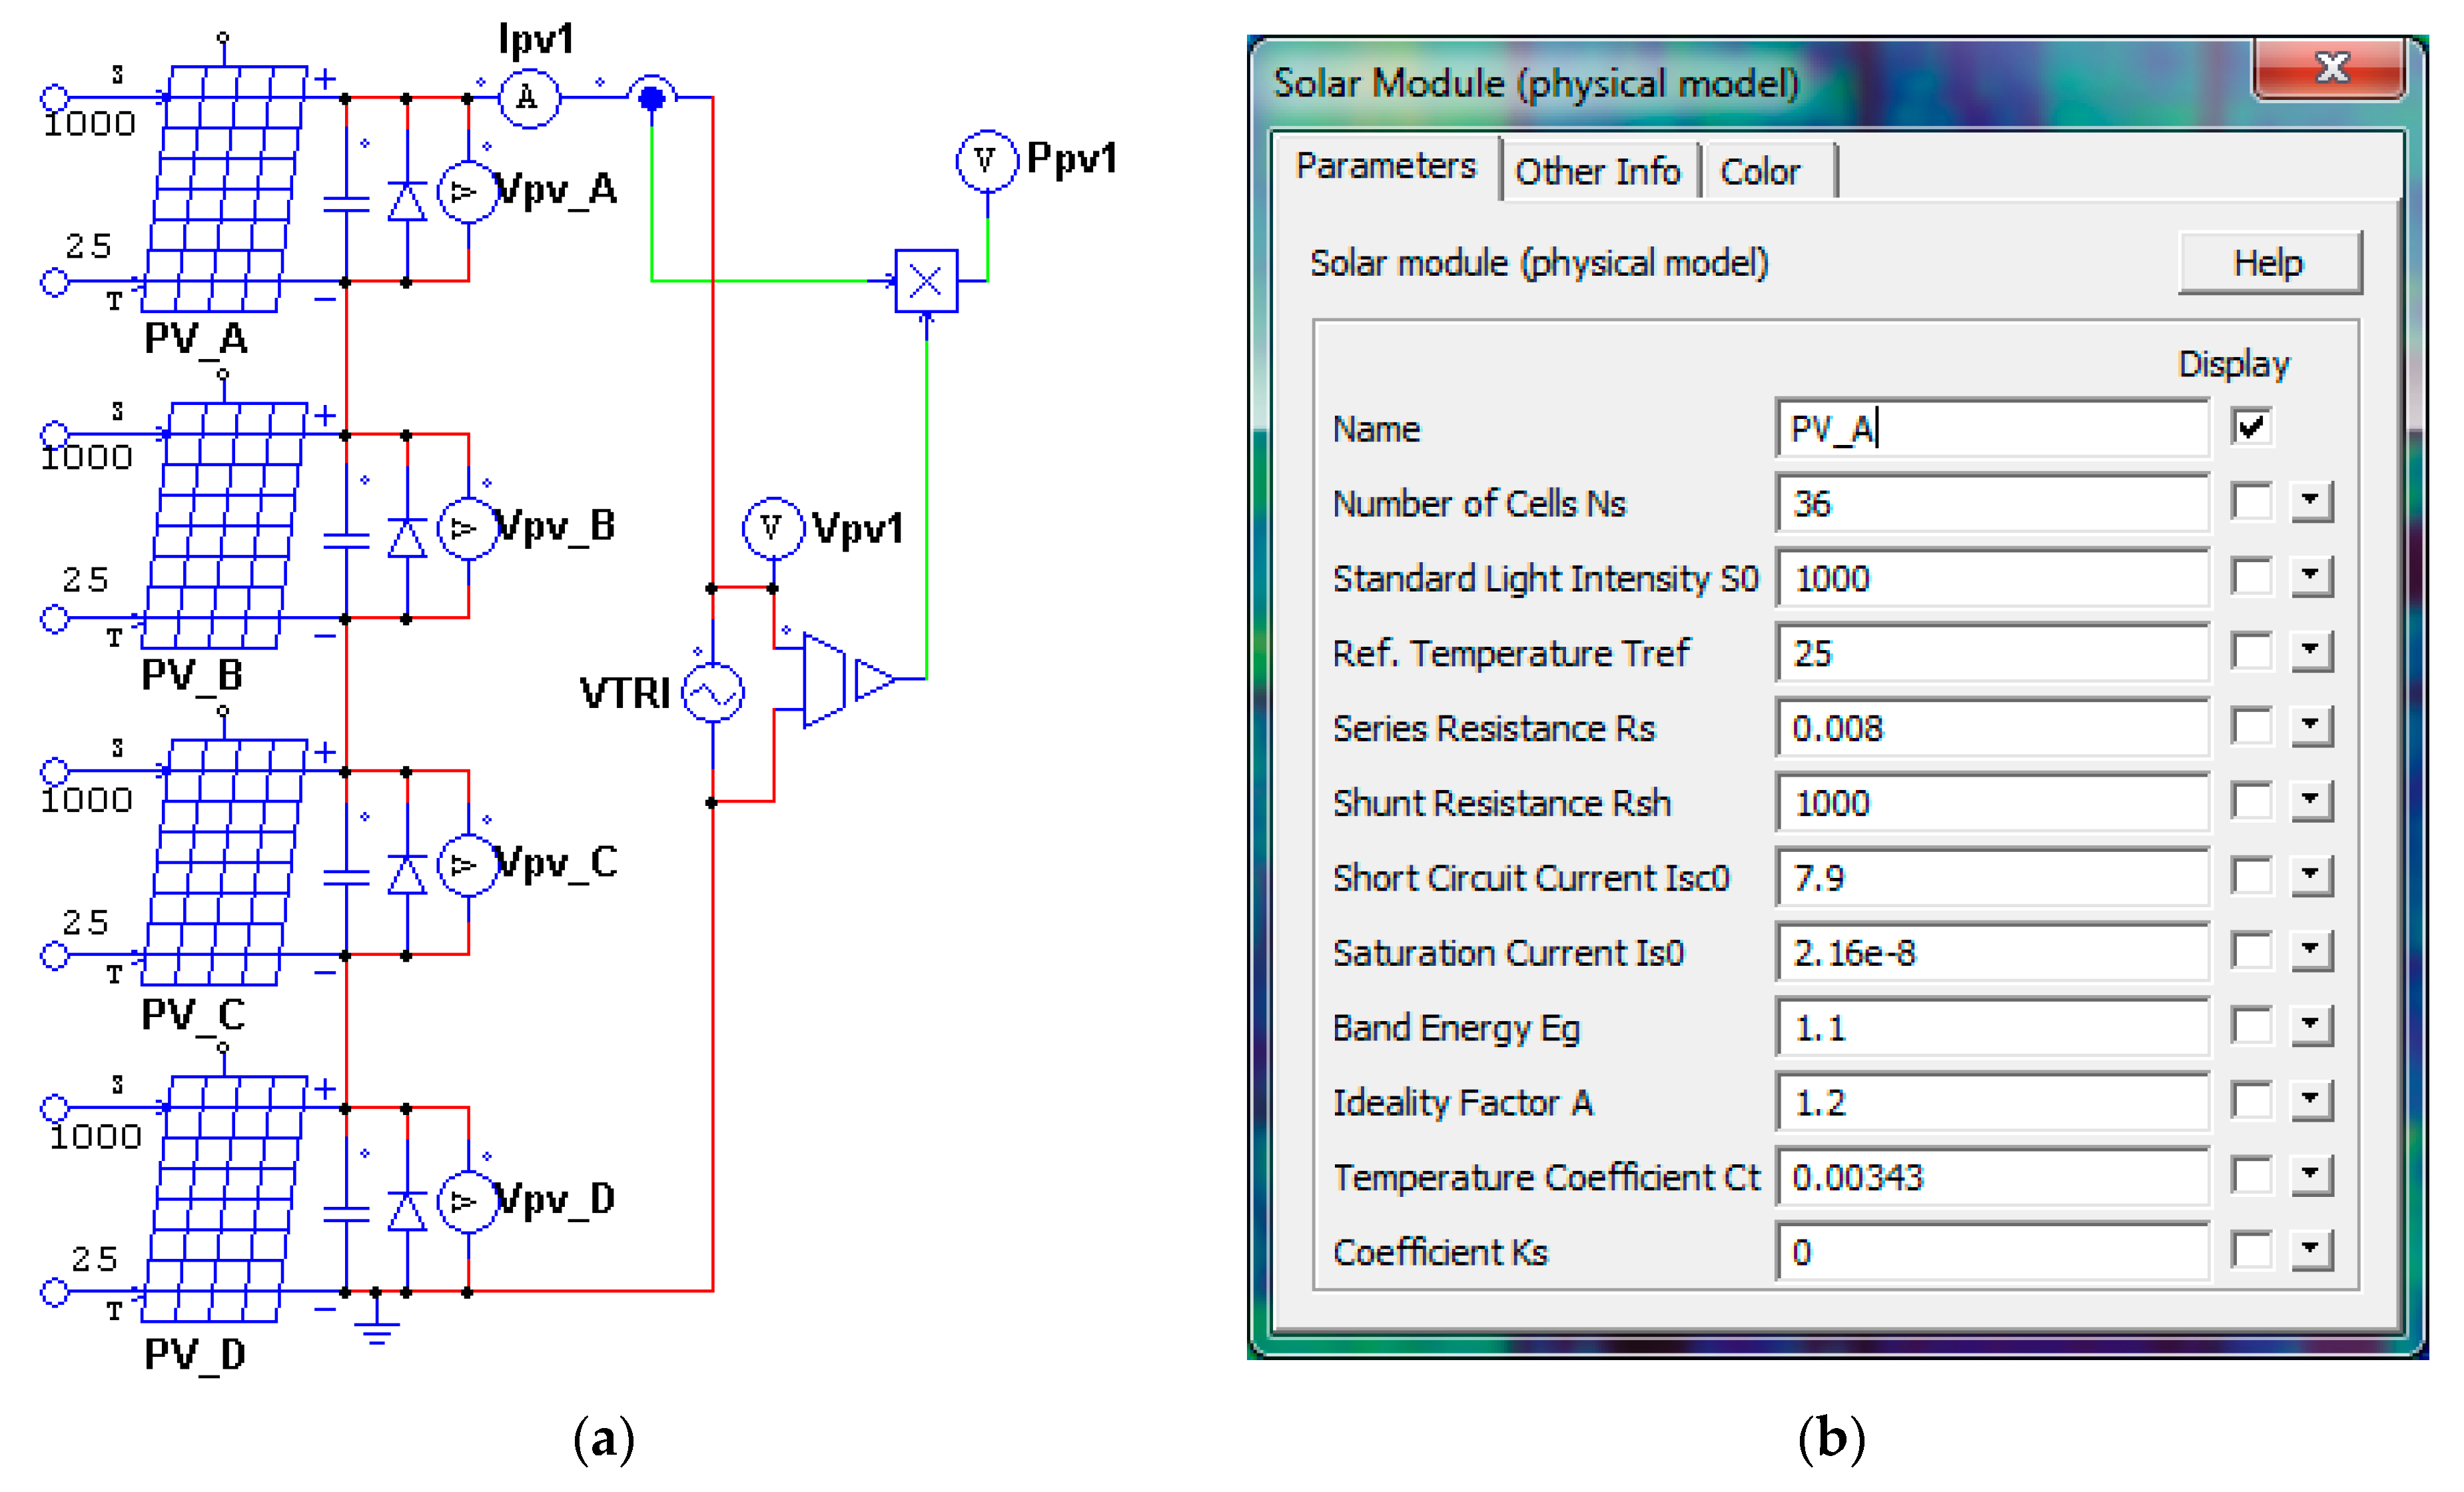
The PV string is modelled with four PV modules (PV_A, PV_B, PV_C, and PV_D) that are connected in series whereby each PV module consists of 36 series-connected solar cells. The simulation circuit for analyzing several PV string conditions is shown in
Figure 2a. A bypass diode is needed since the PV module is operated under different configurations and parameters. A very small capacitor is needed across each PV module for numerical convergence [
29]. The PV string is connected to a triangular-wave voltage source to trace its I-V characteristics. The voltage of each PV module is also measured to track the individual operating condition.
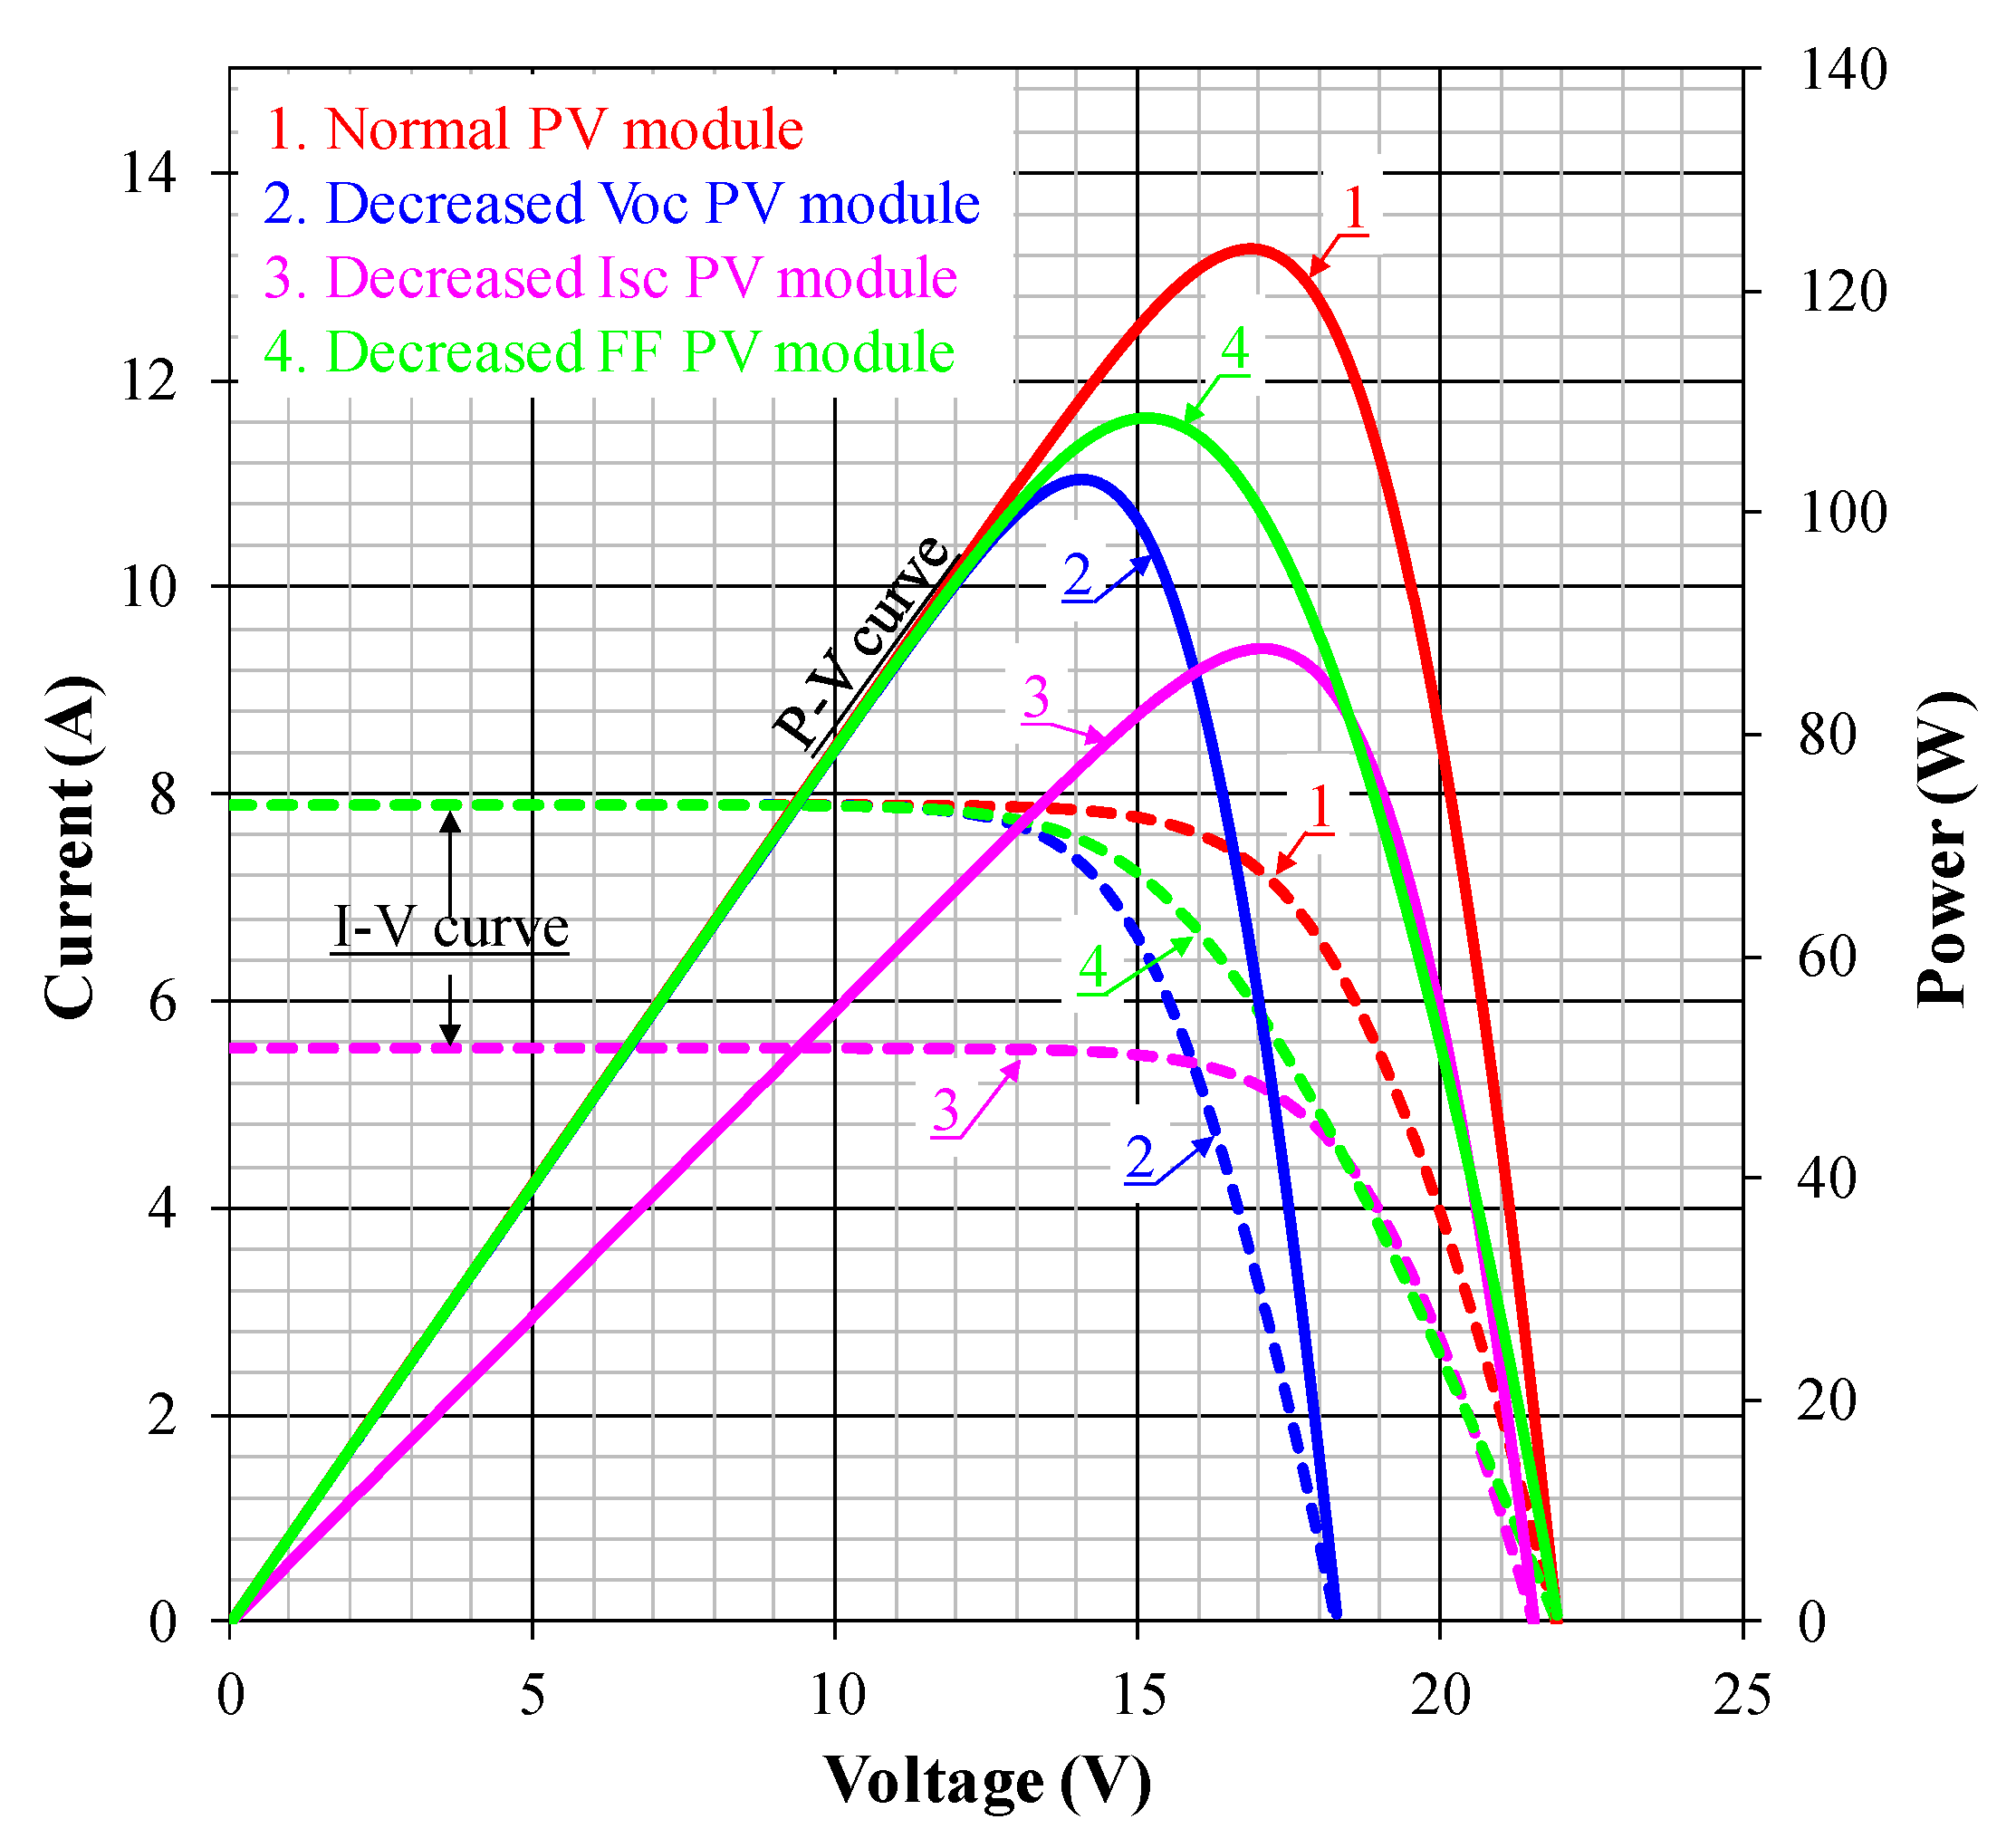
For simulation, four different PV module conditions which represent most of the PV system’s operation is defined. The first condition is normal while the rest are faulty conditions, namely decreased V
oc, decreased I
sc, and decreased fill factor (FF). The parameter setup for normal PV module is shown in
Figure 2b, where the light-intensity input
S is 1000 W/m
2, and the ambient-temperature input
Ta is 25 °C. The decreased V
oc model is obtained by reducing the number of cells in a PV model from 36 to 30. The decreased I
sc model is obtained by reducing the light-intensity input,
S from 1000 W/m
2 to 700 W/m
2. The decreased FF condition can be achieved by increasing
Rs or decreasing
Rsh or varying both values. For simplicity, only
Rs is considered where the value varies from 0.008 Ω to 0.016 Ω. The simulation results showing the detailed PV module parameters under normal and faulty conditions are listed in
Table 1, and their corresponding P-V and I-V curves are illustrated in
Figure 3.
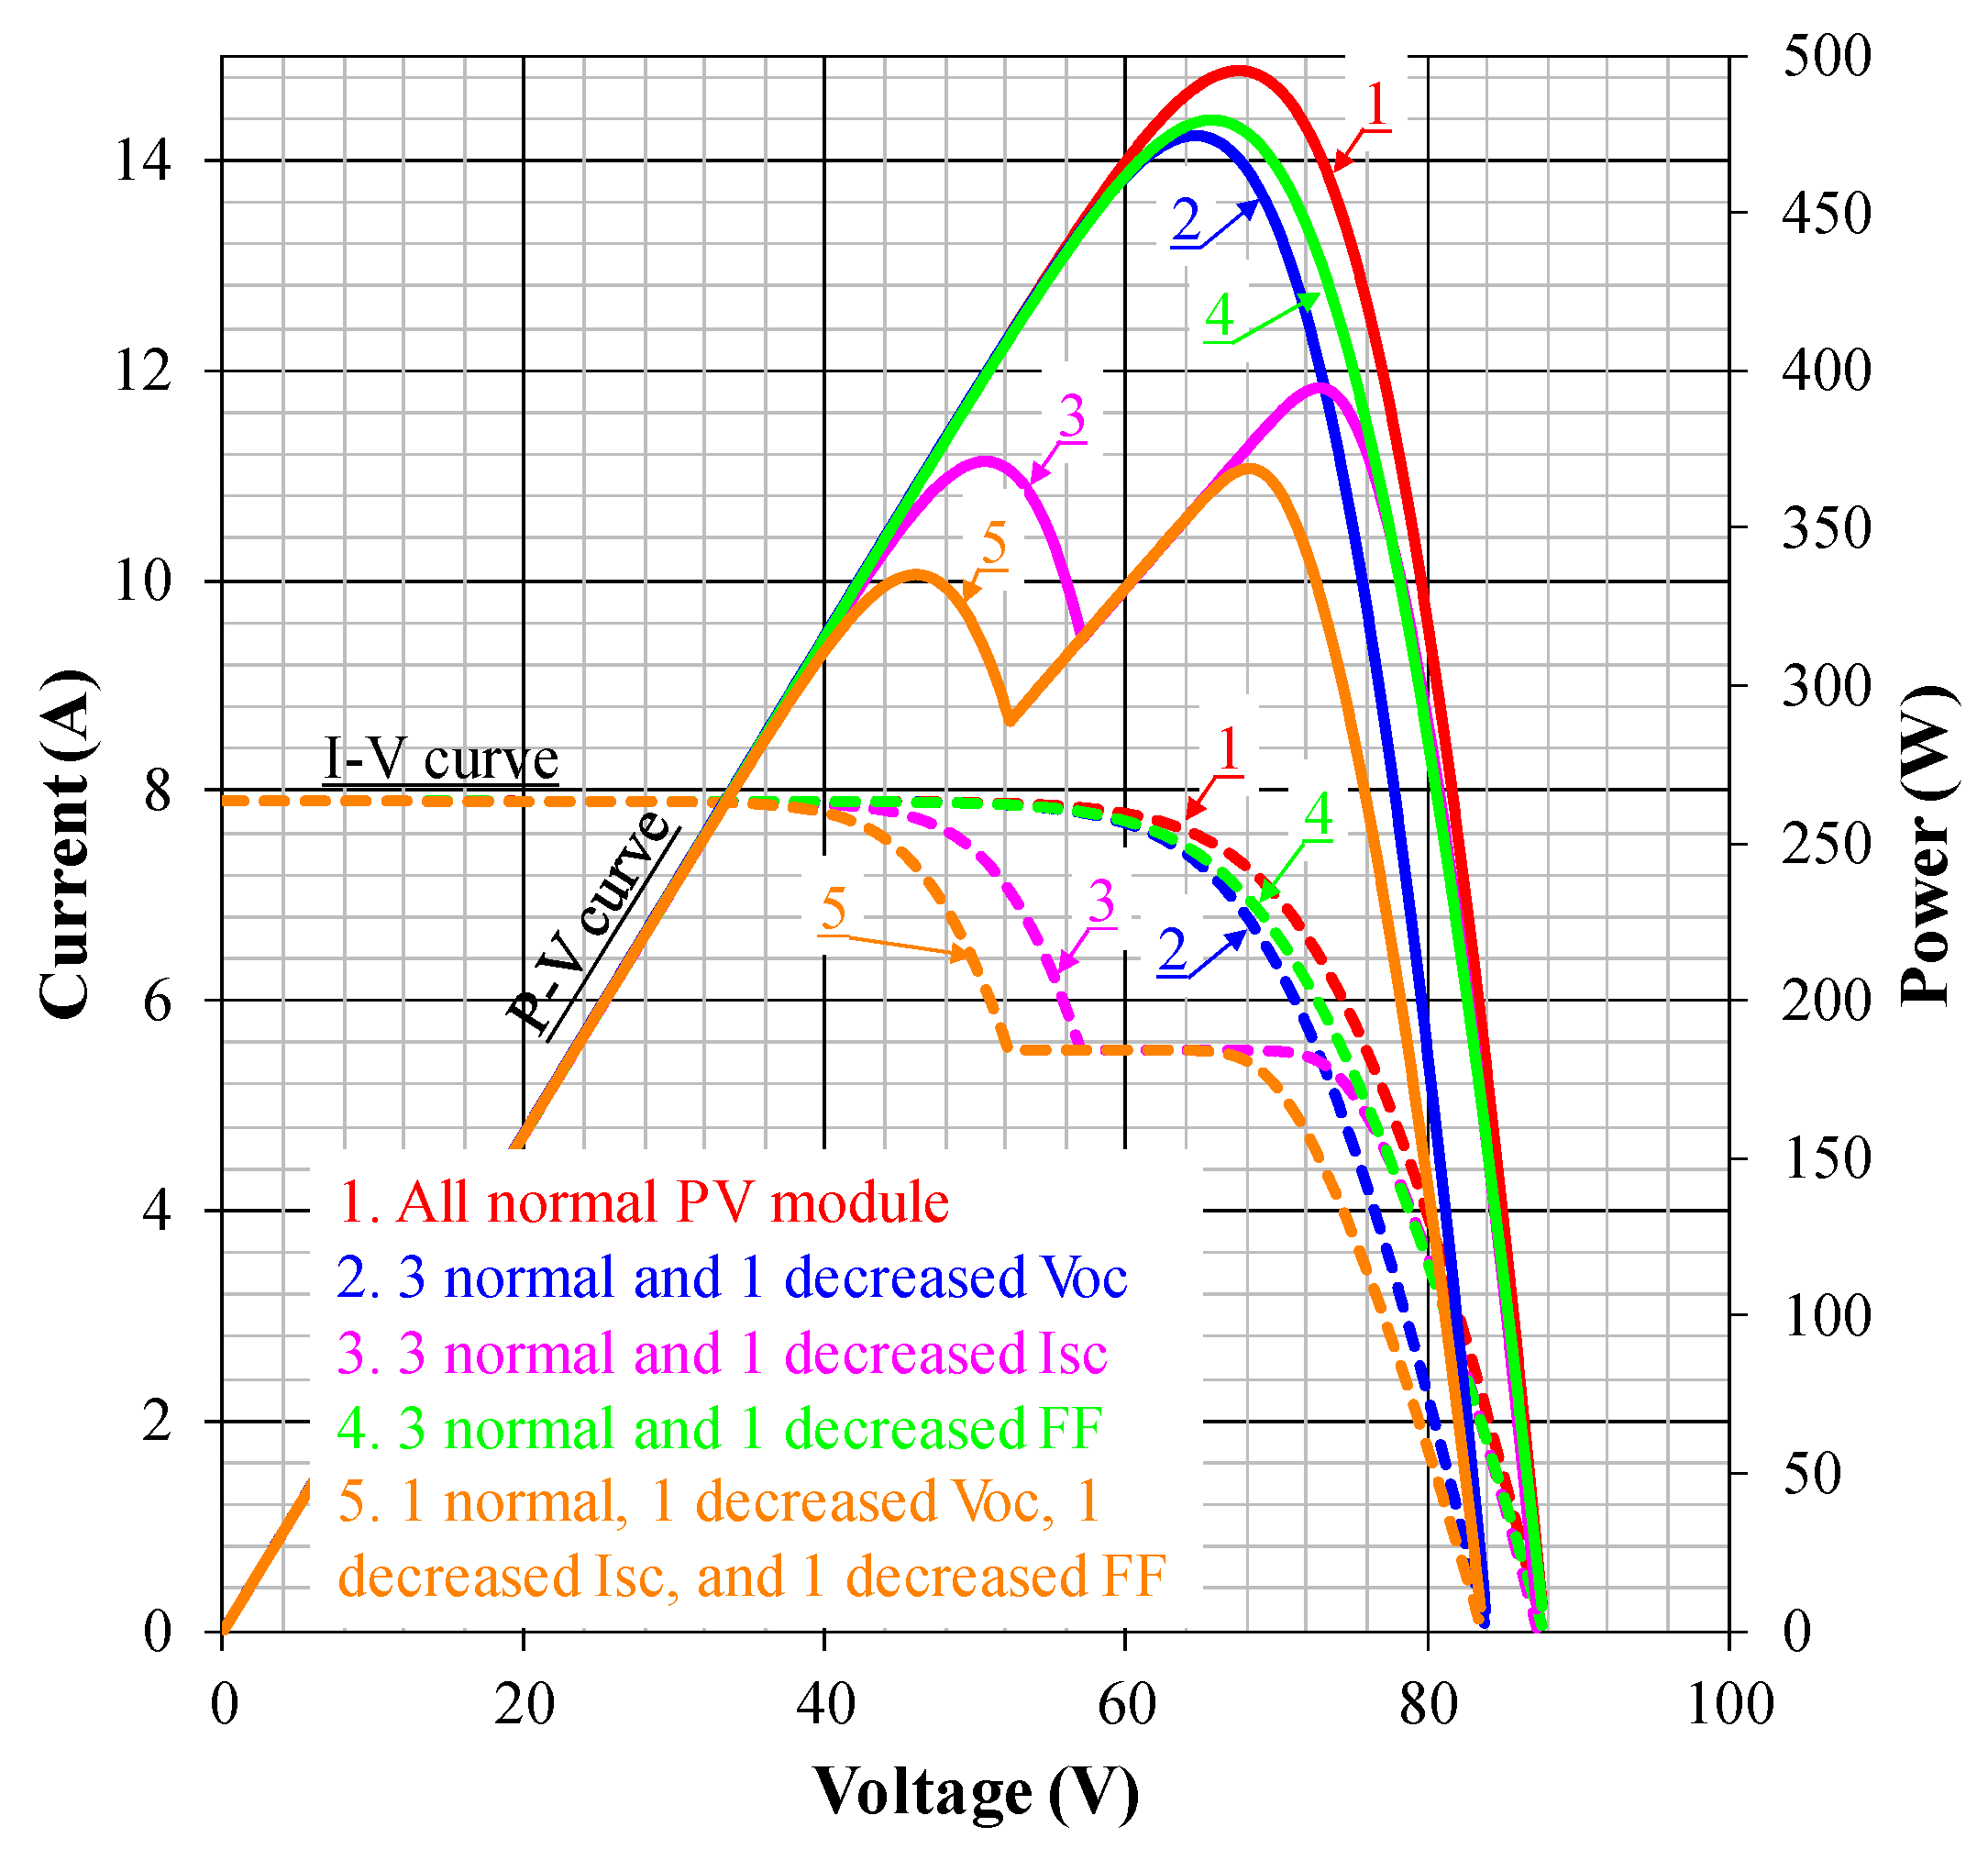
The analysis of PV string failure is performed based on five PV string conditions defined in
Table 2. Each PV module parameters are set according to the simulated module condition which are either normal or under fault. The PV string performance in terms of I-V and P-V characteristic curves are shown in
Figure 4. The simulation results showing the PV string parameters are shown in
Table 2. Since the PV modules are connected in series, the current of each PV module is equal to the PV string current. Each module operating voltage V
op is at the maximum power point V
pmax when all PV modules are normal. By referring to
Table 2, if all modules are normal (Case 1), the V
op of each module is the same. If one of the modules is faulty (Cases 2–4), the faulty module has the lowest V
op in the string. In the case of one module is normal and the rest are faulty (Case 5), the normal module has the highest V
op followed by modules with decreased FF, decreased V
oc, and decreased I
sc. In all cases, the faulty module produces the lower V
op as compared with the normal module. This characteristic can be used as an early fault identification where the voltage of each module in the PV string is continuously monitored.
3. Photovoltaic Health Monitoring System
In order to verify the effectiveness of using the operating voltage Vop to detect the occurrence of faulty modules in a PV string, a PV health monitoring system based on the wireless sensor network is developed. It consists of a group of spatially dispersed and dedicated sensors for monitoring and recording the current and voltage of PV modules and organizing the collected data at a central location. A GUI program is developed to display the configuration forms and performance of PV modules including its real-time operating voltage in both figure and color, making it easier for early PV system fault detection. This section presents the details of the whole system.
3.1. The Wireless Sensor Network (WSN) Design
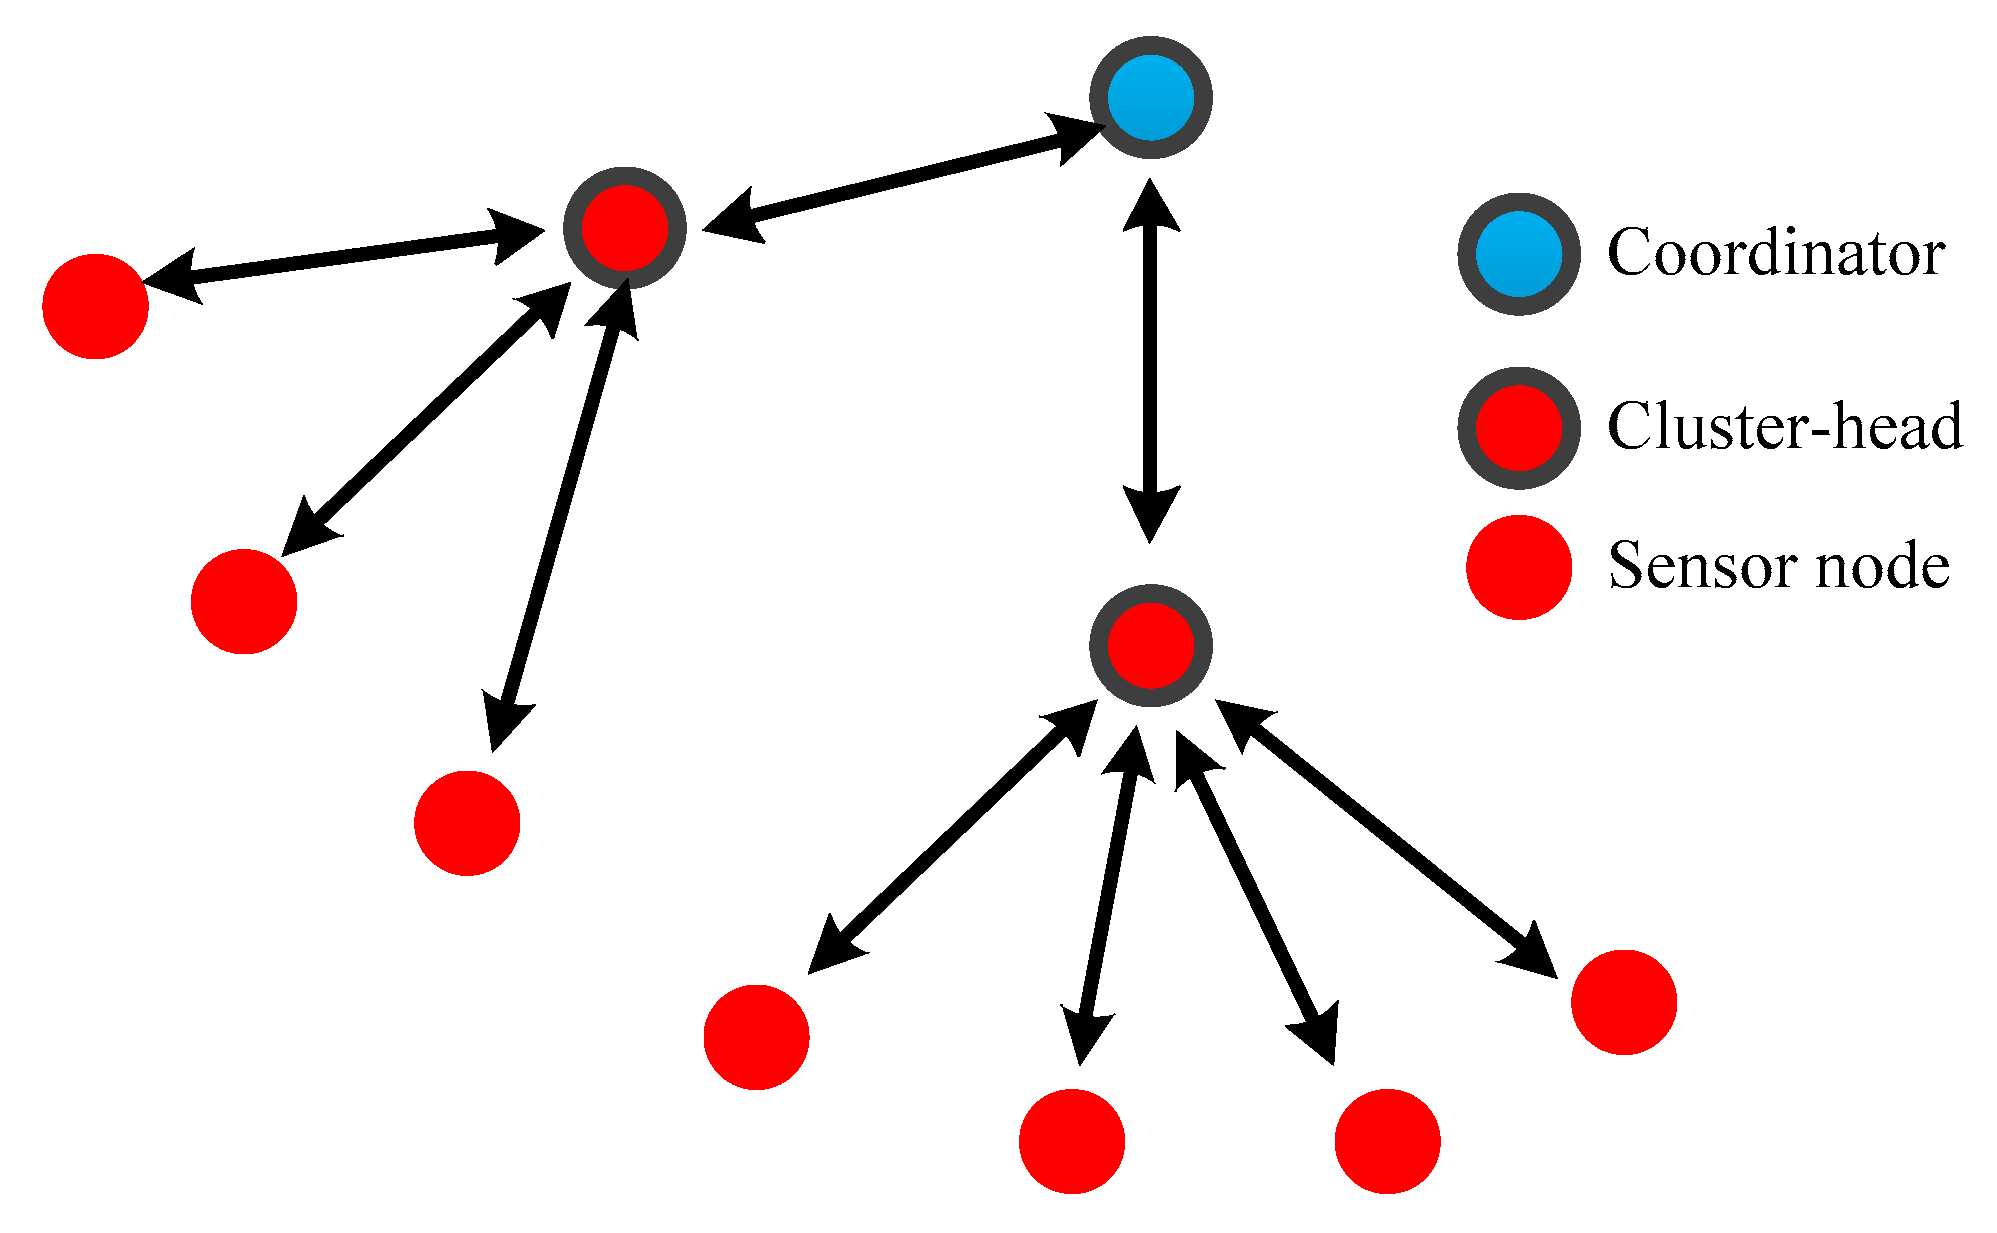
The wireless sensor network (WSN) for the proposed monitoring system is designed using the tree network topology, as shown in this
Figure 5. The main advantage of the tree topology is that the expansion of a network can be made, and error detection becomes easy. The proposed WSN consists of three elements, namely, sensor node, cluster-head, and coordinator. Each element has a unique id. The sensor node is used for measuring the PV module voltage. Cluster-head measures the voltage of the PV module and the current of the PV string. It is also used to forward the data of each sensor node to the coordinator. Coordinator sends data to the PC and displays data via the GUI. The PC is also used as a network gateway to allow data to be connected to another network.
The sensor node, cluster-head, and coordinator are developed based on an open-source Arduino platform that allows easy-to-use hardware and software [
30]. The programs are written and developed in the proprietary Arduino Integrated Development Environment (IDE) using C or C++ programming language. Several program libraries are also provided to support both basic and advanced functions. For instance, the RadioHead Packet Radio library for embedded microprocessors is used to provide a complete object-oriented library for sending and receiving packetized messages via a variety of common data radios and other means of transports [
31].
From the end-point, the sensor nodes read the PV module voltage via ADC and send to the cluster-head when requested. Then, the cluster-head reads the PV module current and forward the fetched data to the coordinator. The coordinator receives the data and subsequently sends it to the monitoring station. The programming flowchart of each wireless sensor network component is shown in
Figure 6.
3.2. The Monitoring Station Design
The monitoring station consists of a computer with the developed GUI program that store and display the real-time data in the table, graph, and figure format. It is linked to the coordinator via a serial communication interface. The GUI design uses visual studio programming for displaying actual data from the real field arrangement of PV module. Different colors are used to represent the voltage levels of each PV module.
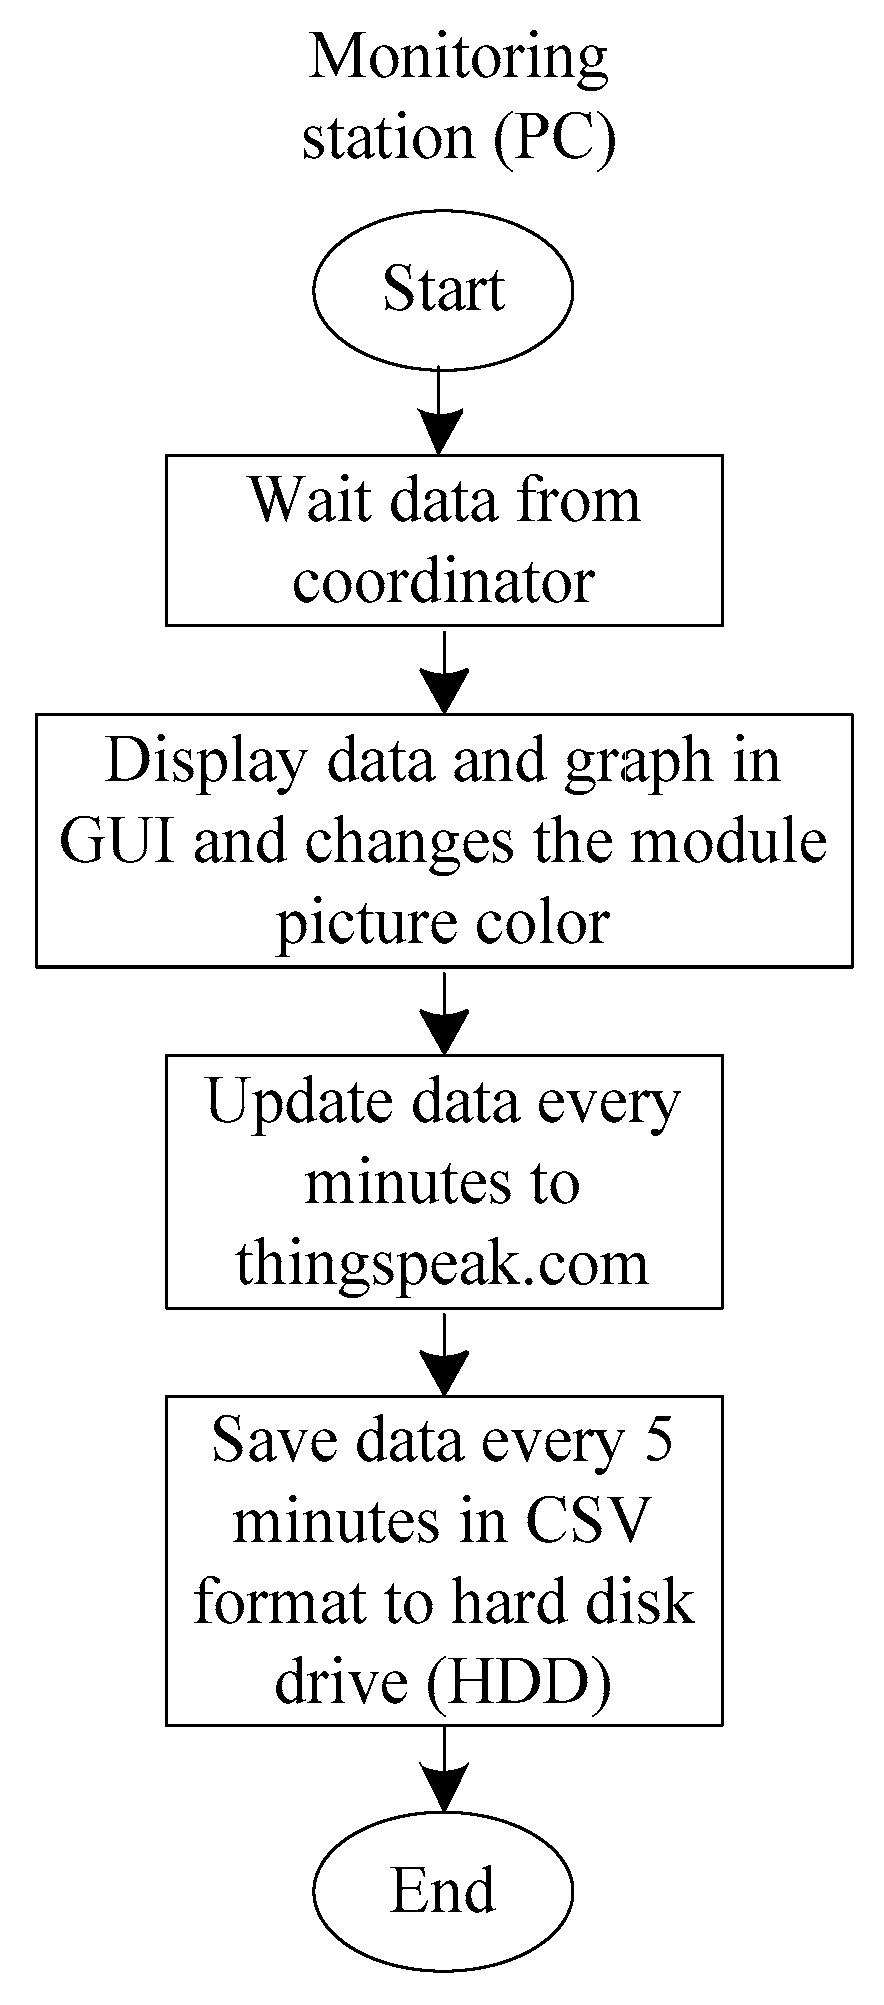
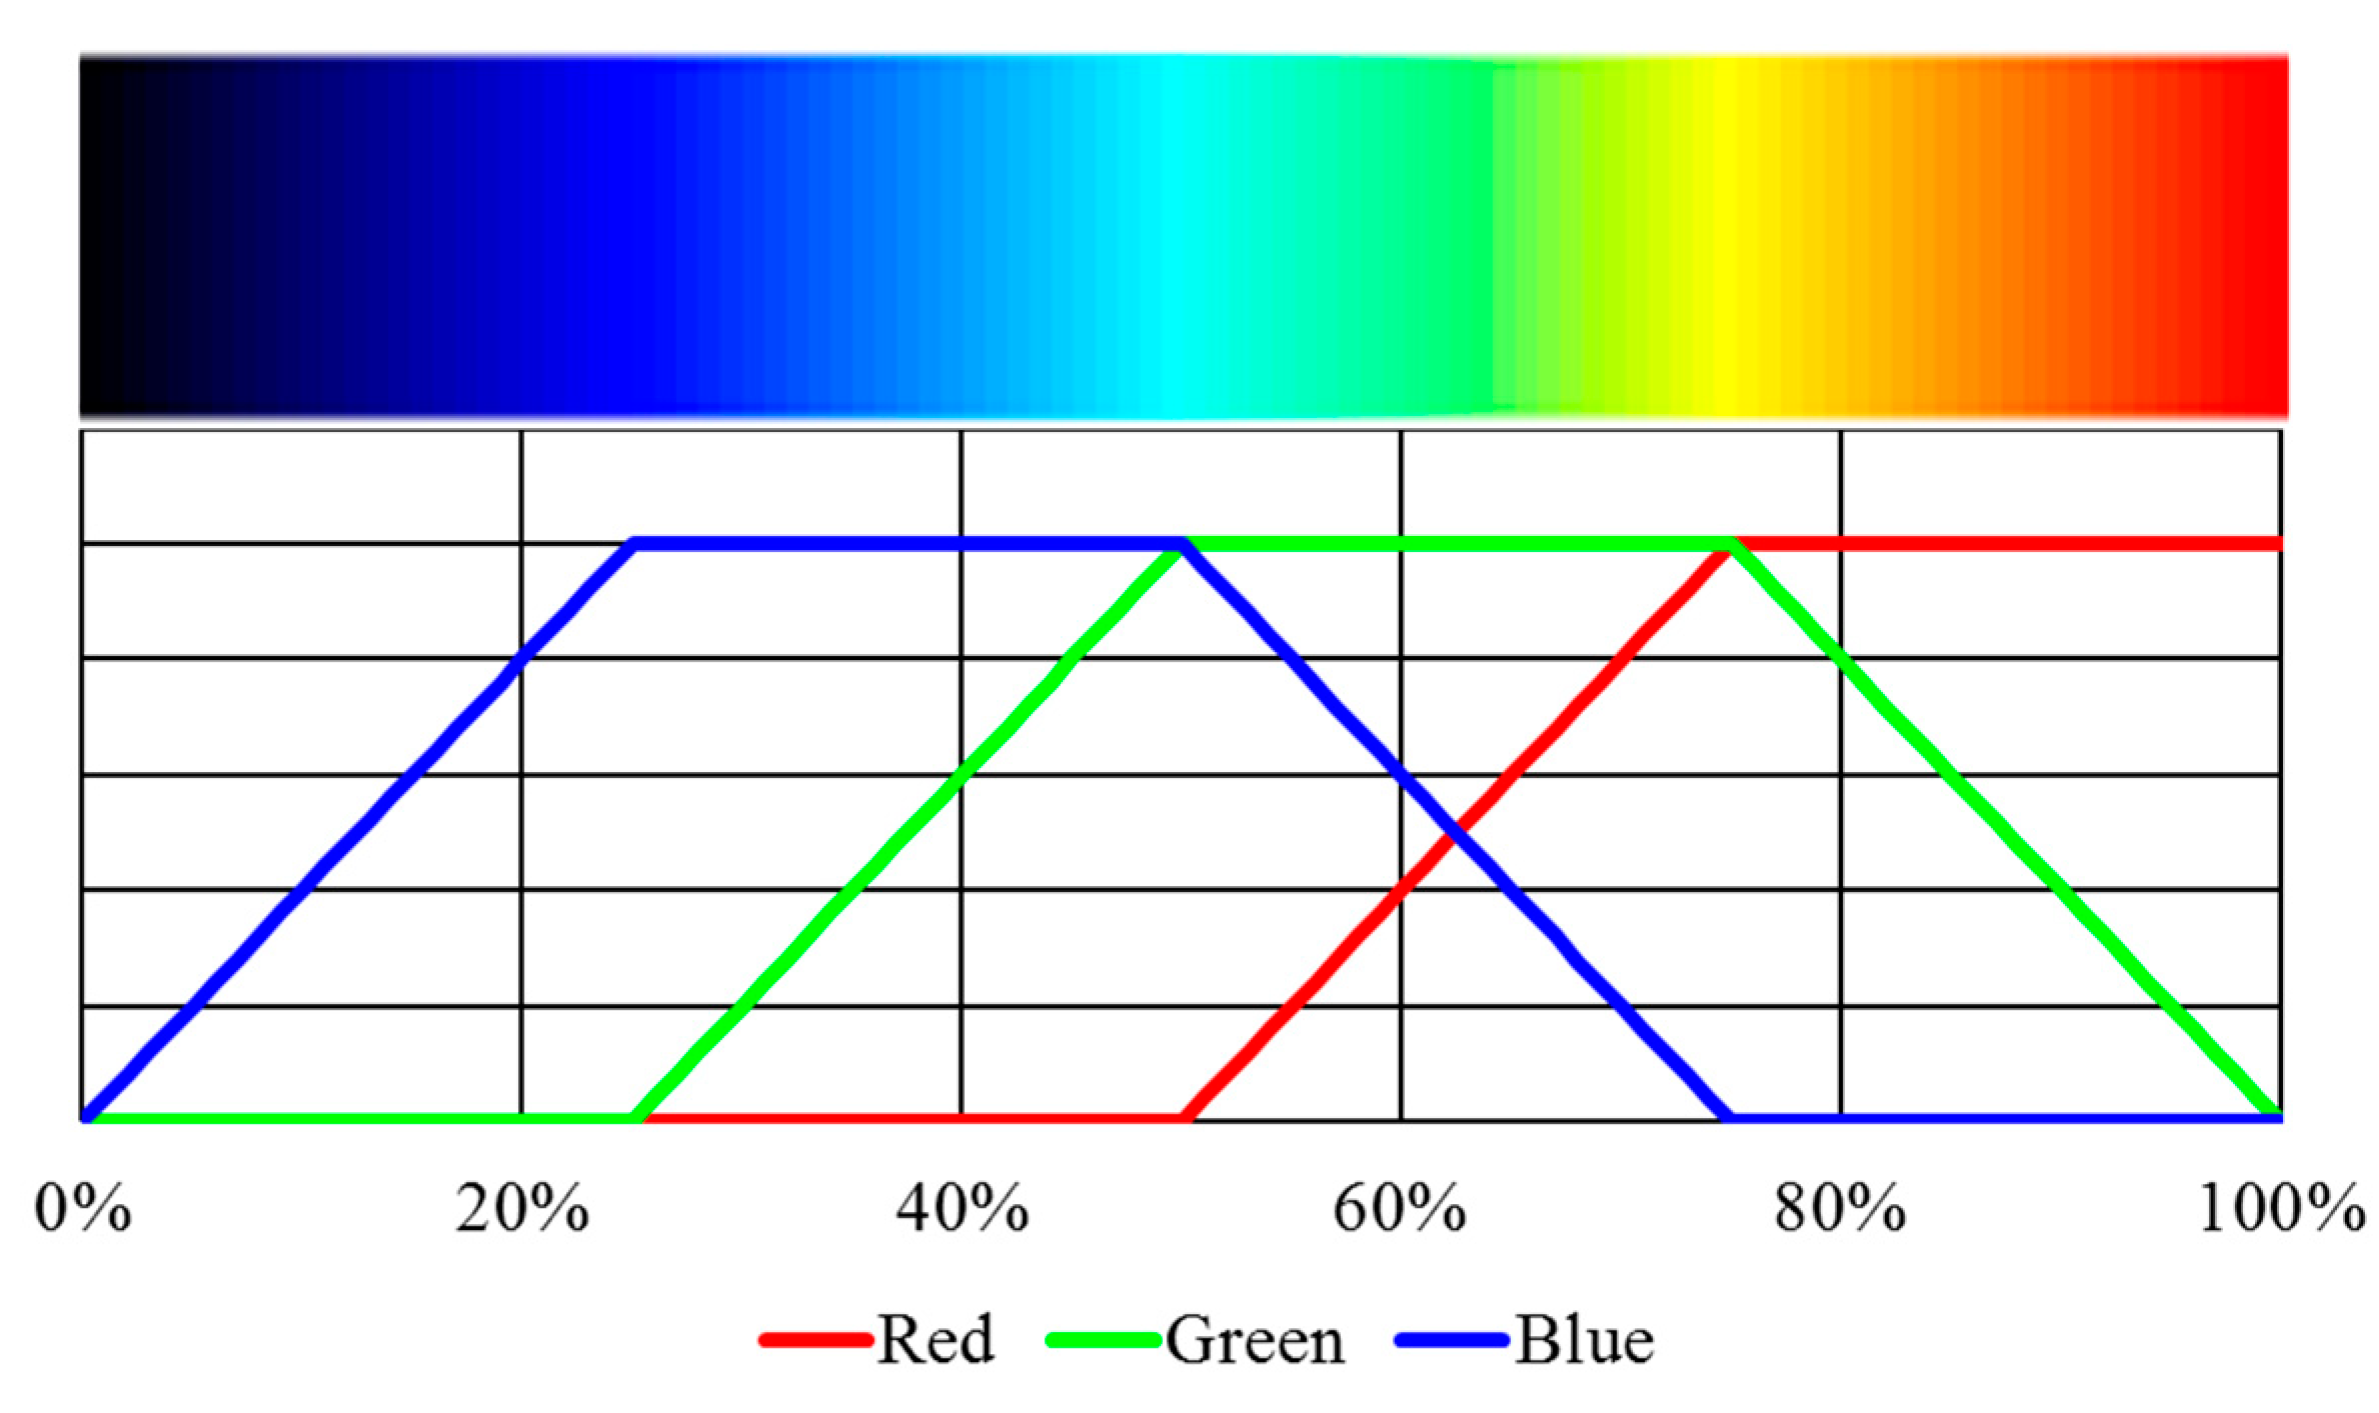
Figure 7 shows the software flowchart of the developed monitoring station. First, the monitoring station waits for the data sent from the coordinator. The received data is arranged and organized for the GUI display. The data format is sequentially started by cluster-head ID, followed by sensor-node ID, current data, and finally voltage data. The color variations to represent the voltage levels of each module are achieved using RGB color code. The RGB code represents different colors based on the composition of red, green, and blue light. The color is expressed as an RGB triplet (red, green, blue), where each component can vary from zero to a maximum value (255). The RGB code for the PV module’s voltage level representation is shown in
Figure 8 where the color gradient varies from black (minimum) to red (maximum). Equation (7) represents the function for the gradient color, where
x is the percentage of the ratio of voltage
v to the maximum voltage
vmax as defined in Equation (8).
The GUI program displays the real-time voltage, current, and power of each PV module. It also displays the real-time voltage, current, and power of the inverter. The inverter input voltage is obtained from the total voltage of the PV modules, and its current is obtained from the PV string current. The GUI program records the data in “csv” format. The inverter data is stored in the cloud in addition to the hard disk storage. The developed system uses ThingSpeak as a live cloud platform of the Internet of Things (IoT). It is an open-source platform that allows the collected data from sensors to be stored in the online cloud storage.
3.3. Hardware Implementation
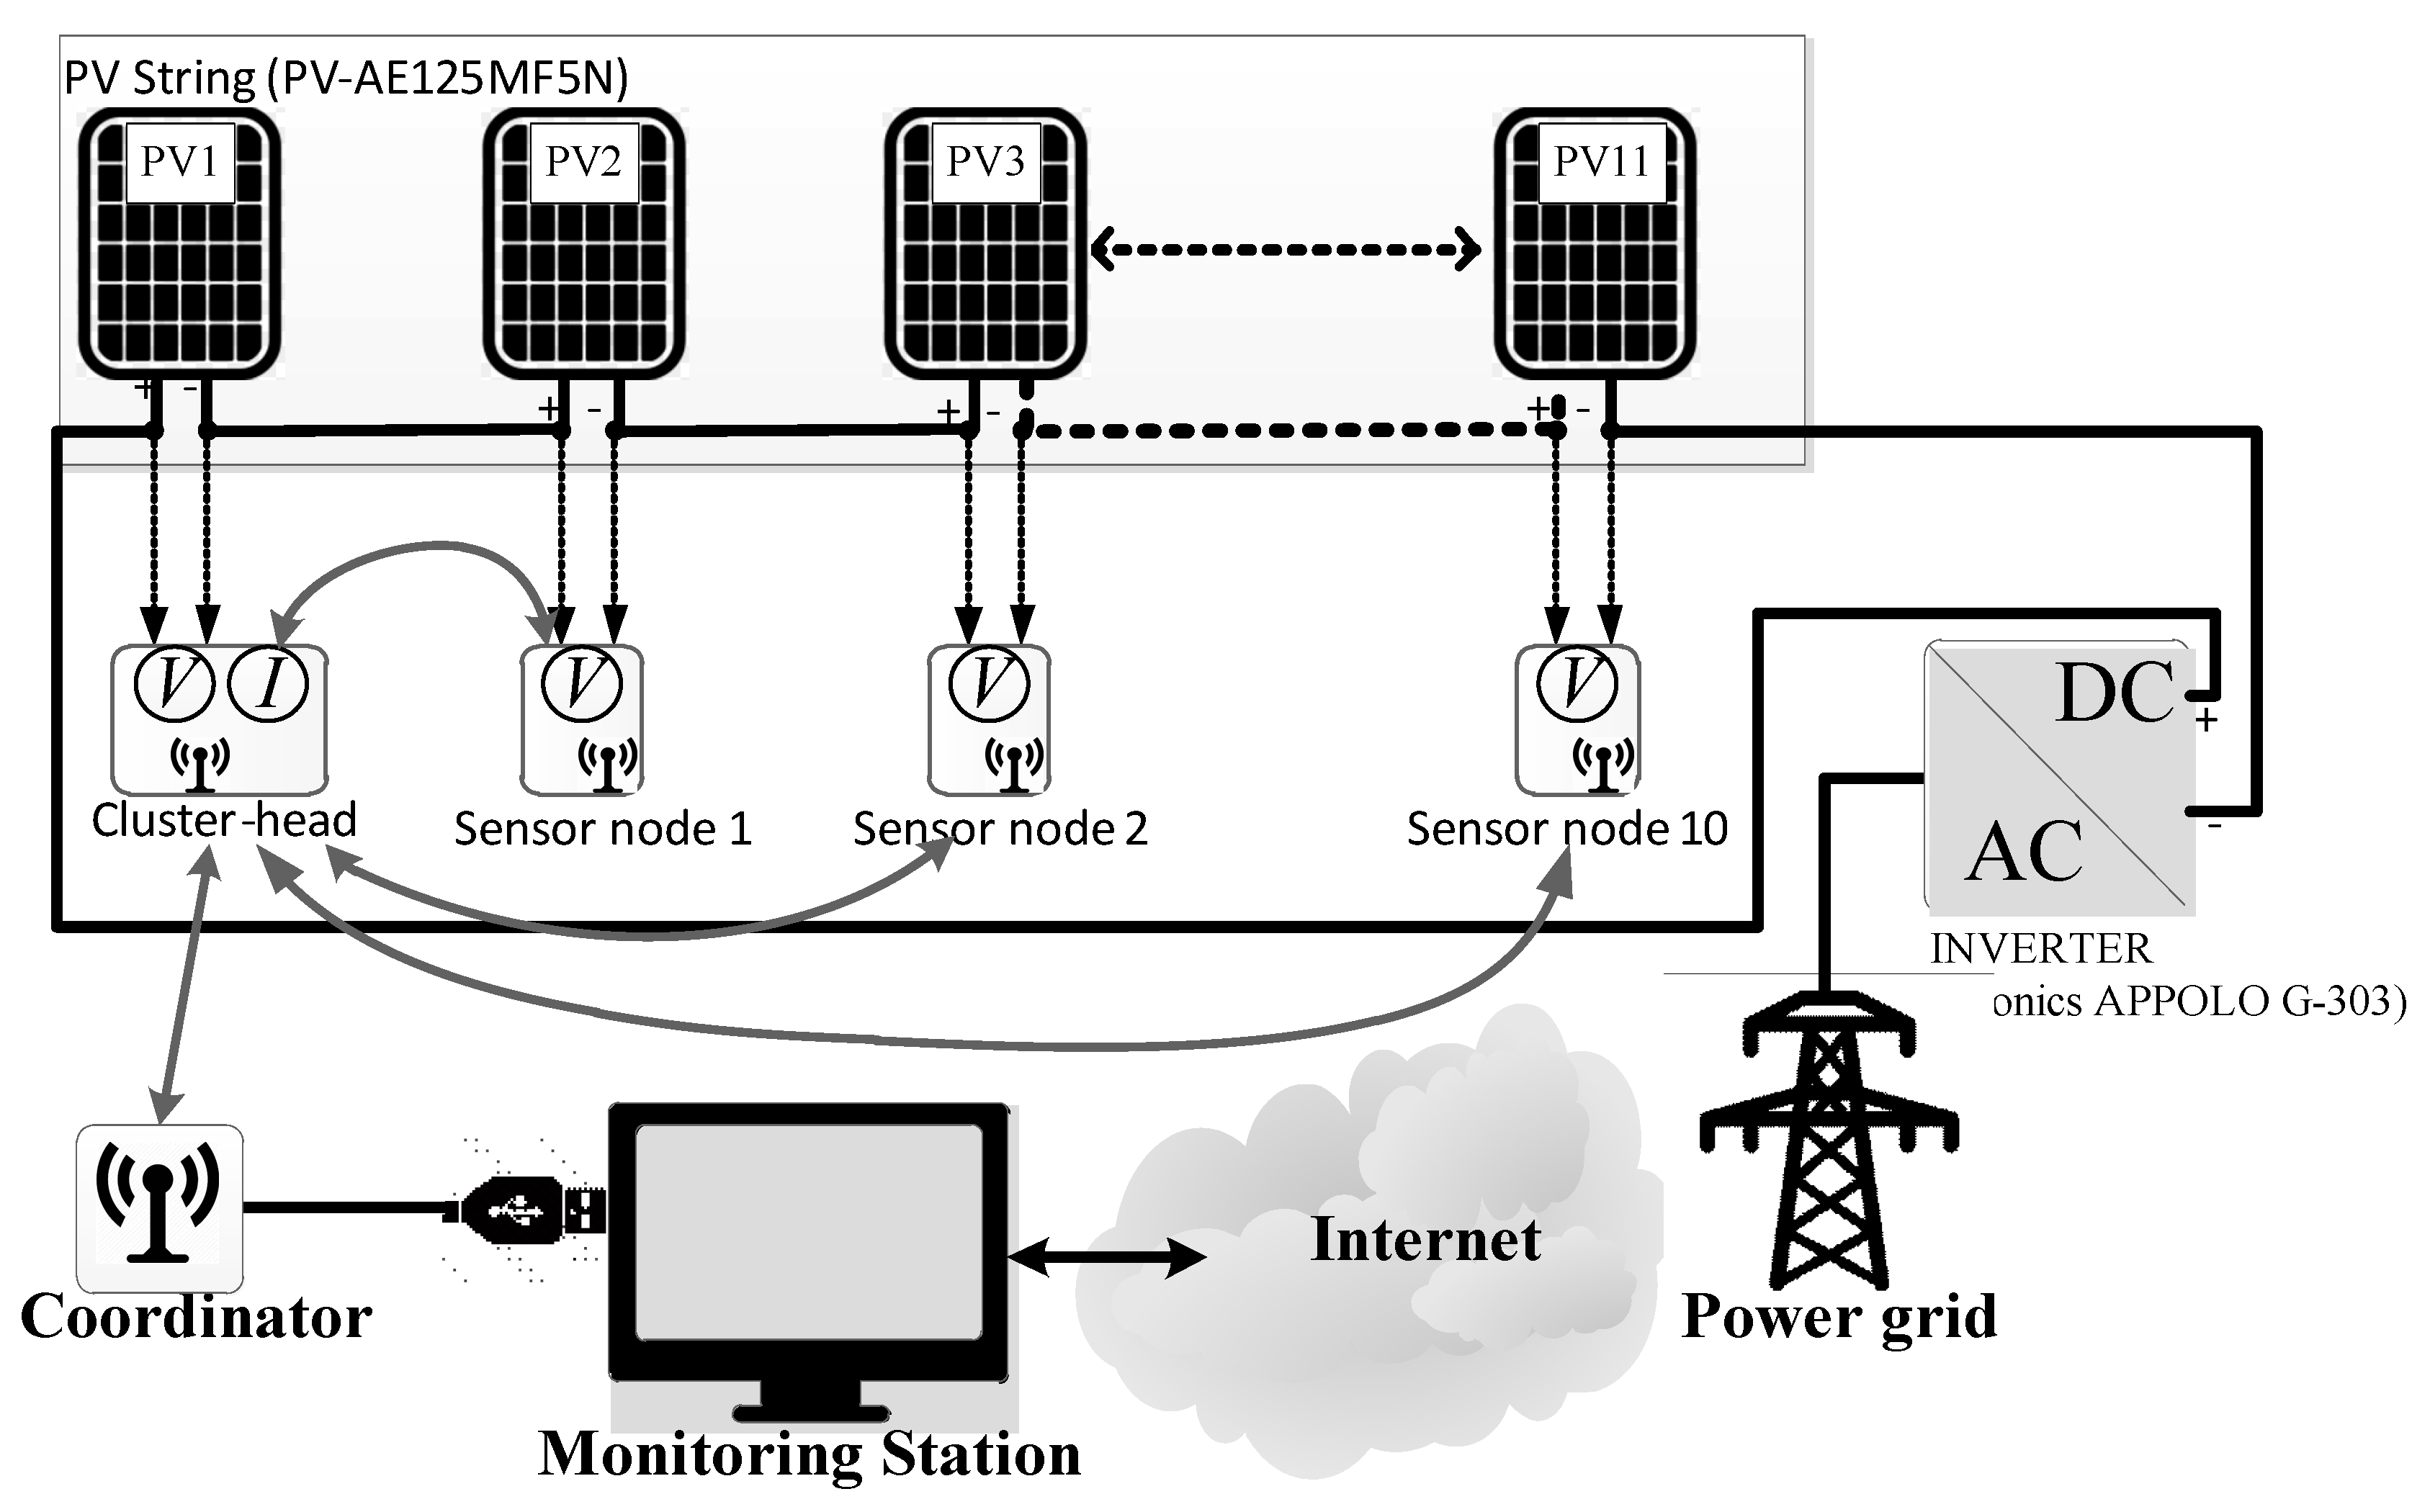
The developed monitoring system is installed in a grid-connected PV system. Eleven Mitsubishi Electric PV modules (PV-AE125MF5N) have been used to power a 2.5 kW string inverter (Leonics APPOLO G-303). The PV modules are located on the third floor of Wisma R&D, a research building owned by the University of Malaya in Kuala Lumpur, Malaysia (3°07’01.8” N, 101°40’00.9” E).
Figure 9 shows the overall setup of the monitoring system, as well as the data acquisition circuit installed on each PV module. The orientation of all PV modules is in a manner that the tilt angle is at 15° and the direction toward South. Meanwhile, the monitoring station is located on the fourth floor of the same building. Since the PV modules and the monitoring station are situated at separate locations, wireless-based monitoring system offers more advantages over the conventional wired system.
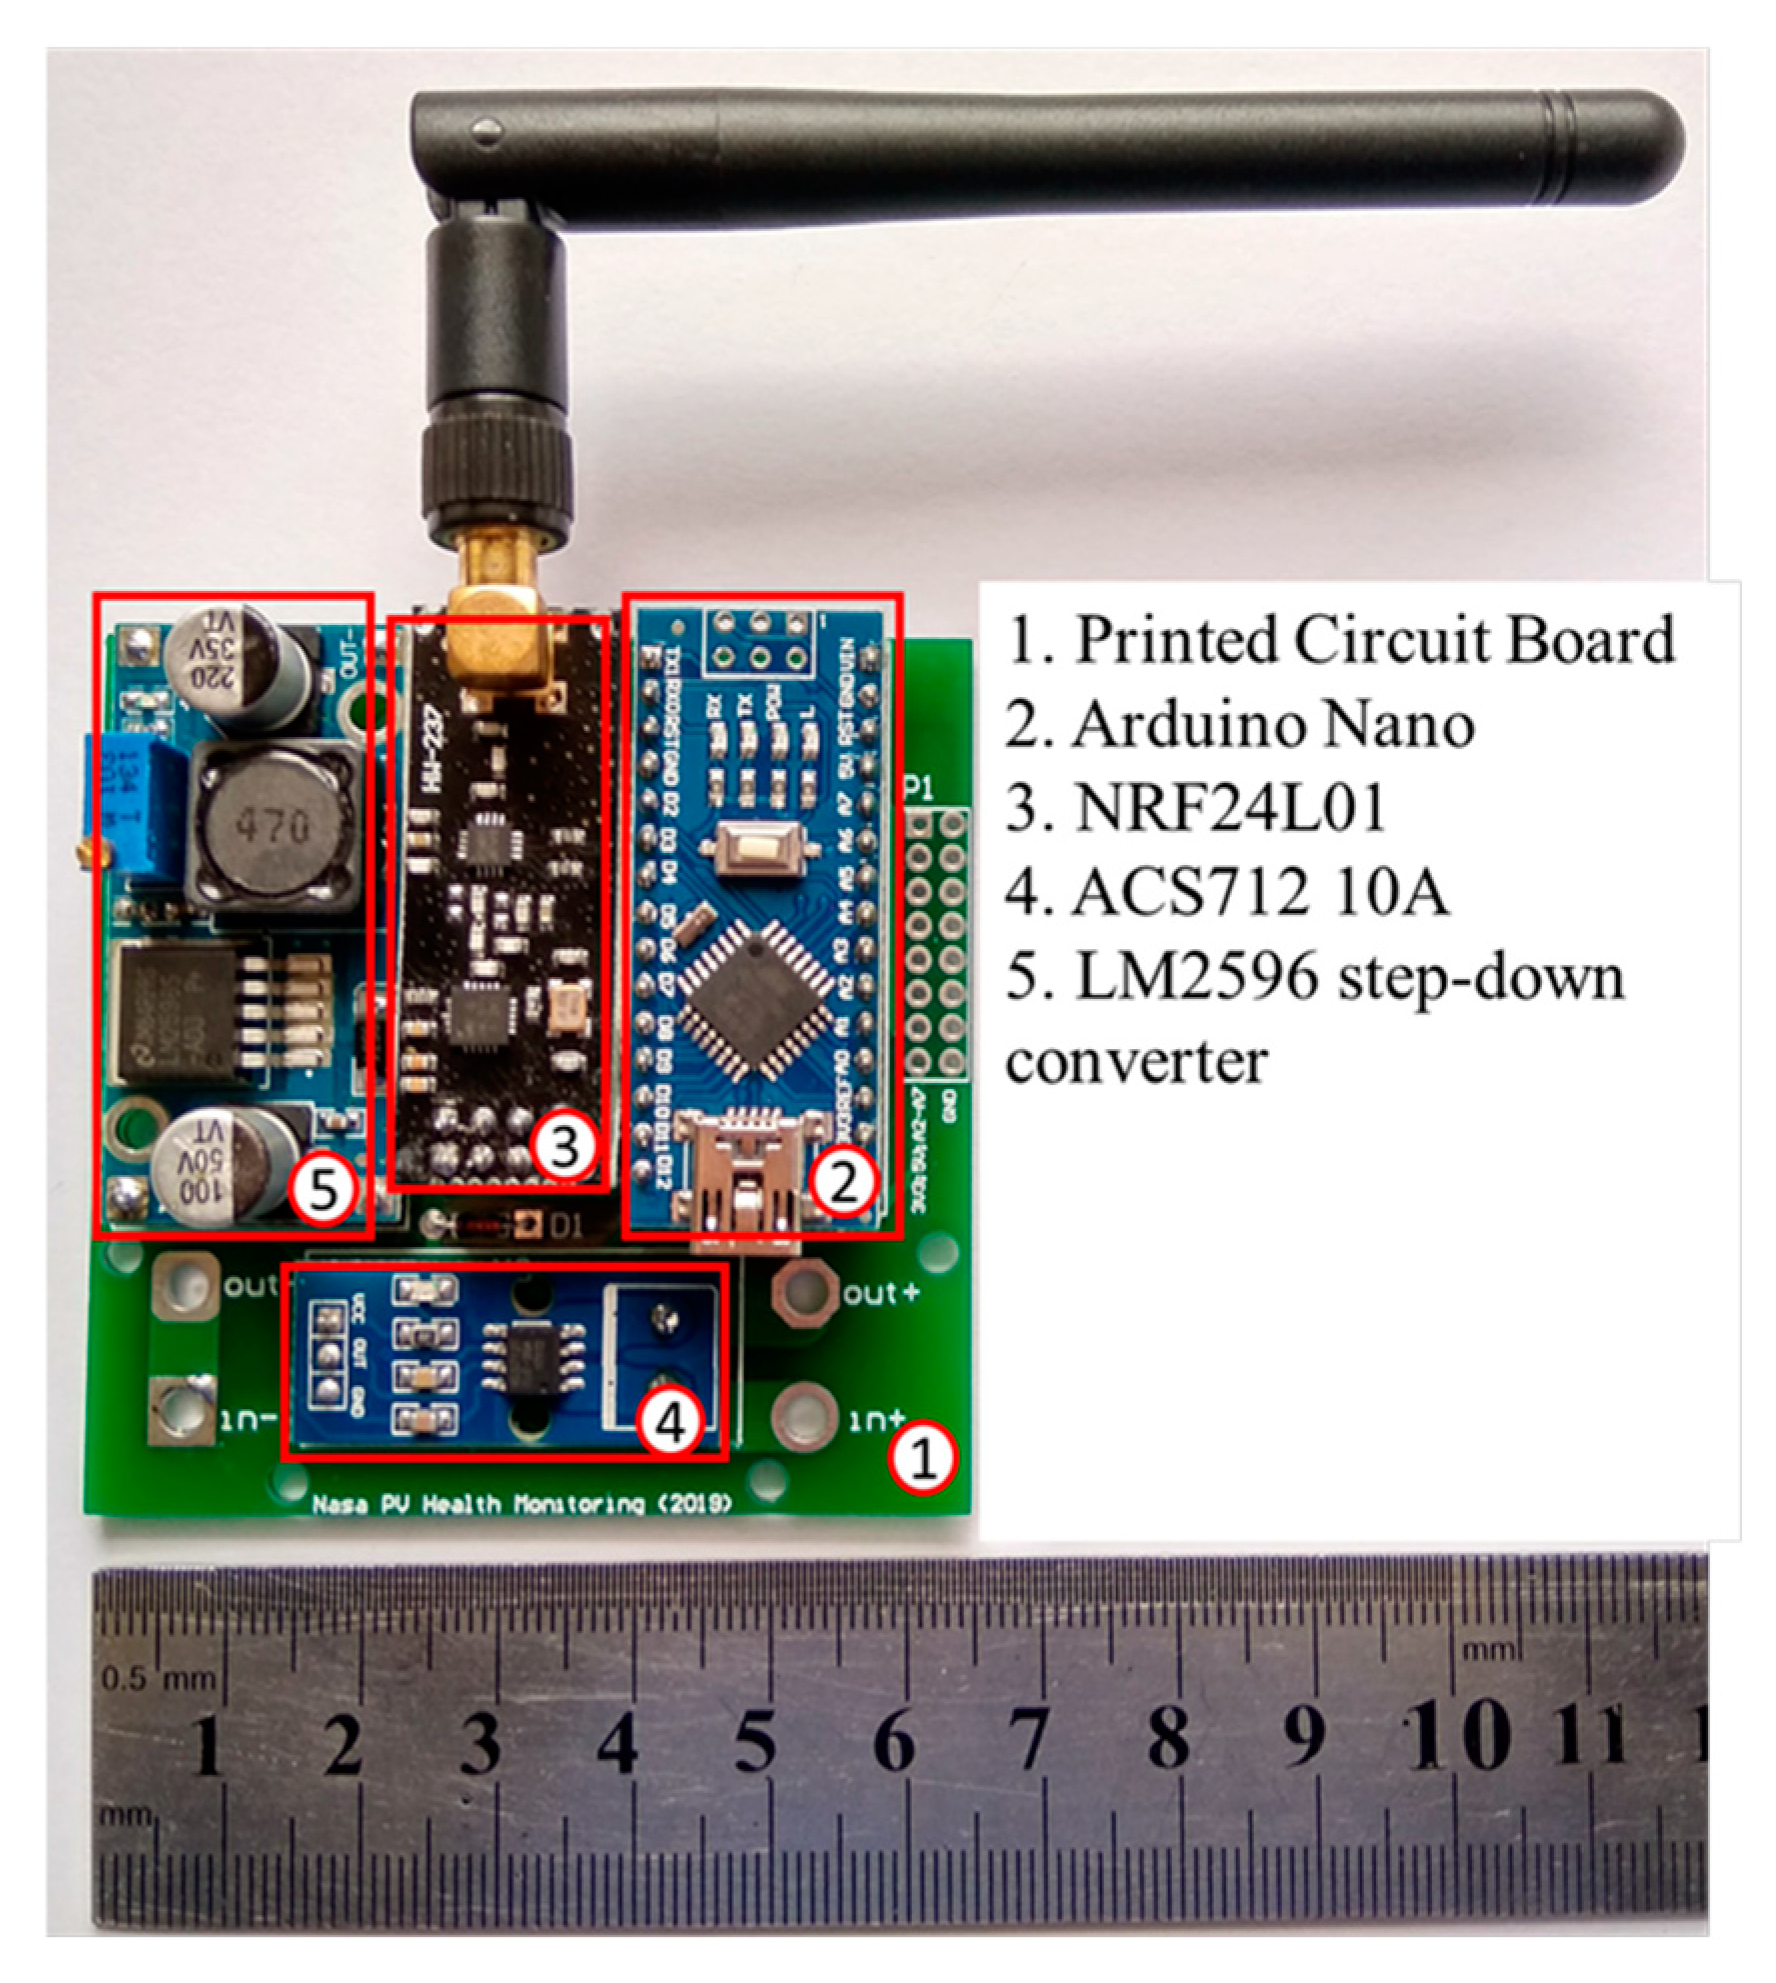
The WSN comprising sensor node, cluster-head, and coordinator is built using four modular circuits namely microcontroller module (Arduino Nano), power module (LM2596 step-down converter), Arduino current sensor module (ACS712 10A), and antenna wireless transceiver module (NRF24L01). A printed circuit board (PCB) for sensor node, cluster-head, and coordinator is designed to accommodate all the modular circuits required for monitoring current and voltage in each PV module. The developed PCB with modular circuits is shown in
Figure 10.
The cluster-head and sensor node board are designed without the requirement for an external power supply or batteries. The board is directly powered from the PV module using a dedicated power module that regulates the PV module’s voltage to 5 V, compatible with the microcontroller and current sensor module. The cluster-head and sensor node consume 350 mW and 300 mW respectively from the PV module for powering the boards. The power module is a buck converter driven by an LM2596 integrated circuit. It is a simple high-efficiency buck converter that provides the active function of a step-down switching regulator. The switching frequency is 150 kHz, allowing for the smaller size of filter components. The input voltage ranges up to 40 V, making it suitable for a single PV module [
32]. The output of the power module is regulated to 5 V to power up most of the module circuits. Another fixed voltage regulator AP1117E33G is used to produce 3.3 V which is required to power up the antenna wireless transceiver module (NRF24L01).
The NRF24L01 is a low-cost single-chip high-performance 2.4 GHz RF transceiver. It is designed for ultra-low-power (ULP) wireless applications for operation in the worldwide ISM frequency band at 2.400–2.4835 GHz [
33]. The transmission range of nRF24L01 is up to 1100 m. The communication between the microcontroller and the nRF24L01 is done by using serial peripheral interface (SPI). SPI is a synchronous serial data protocol used by microcontrollers for communicating with one or more peripheral devices quickly over short distances.
For obtaining a high measurement accuracy, the sensor is selected according to the rating of the PV module. The Arduino current sensor module is fully integrated, employing a Hall-Effect-Based Linear Current Sensor IC with a single supply (5 V). It has 2.1 kV RMS isolation and a very low-resistance (1.2 mΩ) current conductor with 100 mV/A sensitivity [
34]. Two resistors (7.5 kΩ and 30 kΩ) are used to form a voltage sensor with 200 mV/V sensitivity. The sensor’s output is connected to the analog to digital converter (ADC) of the microcontroller for measurement purpose.
The microcontroller selected for the proposed system should have an SPI port for communication with the NRF24L01 module. For cluster-head, 2-channel ADC is required for current and voltage sensing, whereas for sensor node only 1-channel ADC is required for voltage sensing. The Arduino Nano is chosen as the microcontroller module of the proposed system. It is a compact size board based on the ATmega328P microcontroller with 8-channel, 10-bit ADC, and has a serial peripheral interface (SPI) port.
As mentioned in
Section 3.1, the WSN consists of sensor node, cluster-head, and a coordinator where each element uses different modular circuits. For instance, the sensor node uses a microcontroller module, power module, antenna wireless transceiver module, and PCB with voltage sensor (voltage divider). Whereas, the cluster-head uses all modular circuits and the coordinator uses a microcontroller module, antenna wireless transceiver module, and PCB without voltage sensors. The coordinator is powered using the 5 V power source obtained from the USB port.
4. Results and Discussions
Figure 11 shows the GUI program of the developed PV health monitoring system. It is observed that the system functions properly as desired with good performance. The GUI displays the picture of each PV module with different colors, depending on the actual voltage levels of each module. The color for each PV module is updated whenever a new set of data is received from the coordinator. The detailed data of each PV module comprising voltage, current, and power are provided in both table and graph formats. Other information that is also included is the detailed inverter input data. The string power data is uploaded every minute to the ThingSpeak cloud for remote monitoring of the PV inverter performance.
Figure 12 shows the data collected on 23 April 2019 using the developed PV health monitoring system together with the solar irradiance and ambient temperature data. The solar irradiance and ambient temperature collected using the commercial weather monitoring station (Davis Vantage Pro2). The solar irradiance sensor is mounted horizontally with the tilt angle equal to 0°. From 7:12 AM to 7:07 PM the monitoring station received each PV module data from the coordinator.
The monitoring station started receiving data when the PV modules received sufficient solar irradiance to power up the sensor nodes and cluster-head circuits. The minimum PV module’s voltage required to power up the cluster head and sensor node circuits is about 5 V. From
Figure 12, the inverter started transferring power to the grid at 8:20 AM. At this condition, the measured temperature and solar irradiances were 27.8 °C and 190 W/m
2, respectively.
Since the inverter was not operating in the early morning because of low solar irradiance levels, the monitoring station received the open-circuit voltage (V
oc) of each module. As the solar irradiance level rose, the PV modules produced a sufficient amount of energy, and therefore, the inverter started operating to feed power to the grid. At this time, the monitoring station began receiving the real-time operating voltage (V
op) of each module.
Figure 13 shows the PV module voltage under four different operating conditions with a period of 5 min each.
Figure 13a shows the V
oc of all modules when the inverter was not in operation, and PV modules received low solar irradiance. Whereas,
Figure 13b,c show the V
op of the modules when the inverter was in operation at low and high solar irradiance respectively.
Figure 13d shows the V
op of all PV modules with one module operating under partial shading conditions. The detailed data for the four operating conditions are given in
Table 3. The average V
op was calculated every one minute for analysis. From
Table 3, it is found that PV1 has the highest average V
op and V
oc, whereas PV5 has the lowest average V
op and V
oc except for partial shading conditions at 8:55 AM. In this case, the shaded module PV6 has the lowest average V
op at 11.97 V. From
Figure 13, the V
op of PV6 is generally higher than PV5 in most of the time without partial shading.
The collected data have shown that the PV string did not operate in normal conditions since the V
op of all modules were different. This condition indicates that there are some faulty modules occurred in the PV string. As simulated in
Section 2, the V
op of a normal PV module is typically higher than the V
op of a faulty module. From the developed health monitoring system data, generally it is found that PV1 has the highest V
op, whereas PV5 has the lowest V
op in the PV string throughout the day as compared to other modules. It can be concluded that a fault may have been occurred in PV5, hence it is recommended to conduct further investigation.
In order to verify the diagnosis, PV1 and PV5 have been selected as the samples for verification with the electroluminescence (EL) imaging method. EL imaging was taken using the Greateyes LumiSolarProfessional BL system at room temperature. The system applies a constant current to the PV module while the CCD camera captures the EL image. The EL imaging results are shown in
Figure 14. Minor cracks have been found in both PV modules, but the number of cracks and the degraded dark regions are larger for PV5 as compared to PV1 module.

