Abstract
This work aims to study the influence of an oxidant agent on syngas quality. A series of tests using air and steam as oxidant agents have been performed and the results compared with those of a pyrolysis test used as a reference. Tests were carried out at Sapienza University of Rome, using an updraft reactor. The reactor was fed with hazelnut shells, waste biomass commonly available in some parts of Italy. Temperature distribution, syngas composition and heating value, and producible energy were measured. Air and steam gasification tests produced about the same amount of syngas flow, but with a different quality. The energy flow in air gasification had the smallest measurement during the experiments. On the contrary, steam gasification produced a syngas flow with higher quality (13.1 MJ/Nm3), leading to the best values of energy flow (about 5.4 MJ/s vs. 3.3 MJ/s in the case of air gasification). From the cold gas efficiency point of view, steam gasification is still the best solution, even considering the effect of the enthalpy associated with the steam injected within the gasification reactor.
1. Introduction
In the last decades, because of increased interest in greenhouse gas emissions and related issues, biomass is becoming more attractive for several applications. Biomass gasification provides a syngas (also called producer gas) that can be used, for instance, in internal combustion engines after a cleaning process. It would widen the use of biomass and accordingly reduce greenhouse gas emissions. According to the last WEO (World Energy Outlook) by IEA (International Energy Agency) [1], biomass is the fourth most used energy source in the world, covering about 10% of the world’s primary energy demand and 87% of it consists of solid (wooden) materials [2]. As reported in [3], in UE28 countries 13.2% of the gross inland energy consumption is covered by bioenergy, about 65% of which represents biomass, showing a slow but continuous increase over the last decade [3]. Italy is the fourth country in the UE28 in terms of gross inland energy consumption, representing 9% of the total, after the UK (12%), France (15%), and Germany (19%). Renewables in Italy represent 8% of the gross inland consumption, with about 50% provided by biomass and renewable wastes [3]. Biomass used for energy purposes comprises a wide range of substances, deriving from both dedicated crops and residues. However, well known energy-dedicated crops may collide with food-dedicated crops, subtracting lands and altering food prices and security. On the contrary, using residual biomass, that is biomass waste coming from production processes, is not expected to have any effect on food crops. Therefore, residual biomass should be considered a valuable option for fueling distributed energy systems [4] in all possible applications.
Biomass conversion processes can be classified into two main groups: Thermo-chemical (such as direct combustion, gasification, and pyrolysis), and biochemical (such as anaerobic digestion and alcoholic fermentation) [5]. Thermochemical processes are the most appropriate for wooden biomass, and therefore they are the most used.
Different biomass and reactors have been studied and used by researchers in the last decades. For instance (to cite some of the many papers published in the last years), Zainal et al. [6] tested wood chips and charcoal gasification in a downdraft reactor, analyzing the effect of the equivalence ratio on the gas composition and tar production. Wang et al. [7] performed steam gasification of municipal solid waste, varying steam to fuel ratio and gasification temperature to find optimal operative conditions for better gas yield. Borello et al. [8] performed an experimental and numerical campaign on gasification of olive pomace in an updraft reactor for a small scale CHP plant. Lucas et al. [9] tested gasification of wood pellets in an updraft gasifier using steam and air preheated up to 1250 °C as oxidant agents. Aghaalikhani et al. [10] and Ancona et al. [11] studied the use of poplar wood chips from phytoremediation as fuel for an updraft gasification reaction. Also, de Sales et al. [12] deepened the gasification of eucalyptus chips in a two-stage downdraft reactor.
Narvaez et al. [13] present the technical validation of novel, low complexity alternative remote, small-scale gasification facilities based on the inclusion of a new packed bed for improving performance. Mehta et al. [14] show a gasification experimental study of a top-lit updraft cook stove.
The use of a top-lit updraft gasifier is also analyzed by James et al. [15] for deepening the effect of woodchips physical properties. In addition, Huang et al. [16] carried out pilot-scale experiments with an updraft gasifier with the aim to remove and convert tar in syngas from woody biomass gasification.
Götz et al. [17] and Brunner et al. [18] explained the EU Horizon 2020 project HiEff-BioPower, which aims to develop a new, innovative, fuel-flexible, and highly efficient medium-scale biomass CHP (combined heat and power) technology for a capacity range of 1 to 10 MW total energy output. Other important recent research studies on the biomass gasification using updraft reactors include the effects of wood biomass type and airflow rate on the fuel and soil amendment properties of a solid by-product [19]; an experimental study of wood chips and grass waste gasification [20]; as well as lab-scale hydrogen production by supervised machine learning algorithms [21].
Yilmaz et al. presented a detailed thermodynamic performance assessment of an integrated system based on gasification for generation of cooling, heating, hydrogen, electricity and freshwater [22]. Bai et al. deepened kinetics and mechanisms of steam gasification from woody biomass treated with a hydrothermal process [23]. Huang et al. analyzed the effects of water content and particle size on pyrolysis and gasification of lignite chars [24]. Tian et al. carried out studies on the coupling of pyrolysis and gasification (CPG) process in the fluidized bed reactor to produce methane-rich syngas [25].
In the present paper, we focused our attention on the gasification of hazelnut shells. Hazelnut is one of the most important and investigated crops in Italy, located especially (but not only) in the central regions. The provinces of Rome, Avellino, and Naples have the most relevant hazelnut cultivations, but other significant spots are in Cuneo and Messina. These areas alone cover about 80% of the entire Italian production [26,27,28,29]. Hazelnut shells, as a waste byproduct, are currently used (in some cases) as fuel for household heating system. From a circular economy perspective, they would have better exploitation in more extensive and efficient plants.
Hazelnut shells are lignocellulosic matter; thus, they can be profitably used as fuel in thermo-chemical processes, such as direct combustion or gasification. The latter process in particular, produces a fuel gas that allows widening the applicability of this kind of substance. Gasification produces a syngas that is a mixture of gases mostly composed of CO, H2, CO2, CH4, N2, and tar (condensable hydrocarbons released during gasification). Syngas composition depends on the biomass used, in terms of lower heating value (LHV) and moisture, type of oxidant (air, pure oxygen, steam), and technologies and operative conditions, such as the equivalence ratio (ER), temperature, and pressure. The adoption of air as an oxidant agent produces syngas with the worst quality in terms of LHV (less than 6 MJ/Nm3). It increases up to 9–10 MJ/Nm3 in the case of oxygen, and 17–18 MJ/Nm3 when using steam. The latter oxidant, usually employed in fluidized bed gasifiers, provides a syngas with high hydrogen content [30,31,32,33,34]. Syngas composition is also affected by the presence of impurities, including particulate, tar, and other elements (such as sulfur-based compounds), that make a cleaning process necessary before syngas is used [34,35,36,37,38,39]. Therefore, it is crucial to obtain syngas with a high LHV, and low particulate and tar content. Cerone et al. [40] analyzed the gasification of almonds and hazelnuts for syngas production through an updraft gasifier with a capacity up to 20–30 kg/h of biomass. Their experimental data were worked out by surface response analysis as a function of the equivalence ratios (ER) in relation to complete combustion and water reaction. By using only air at ER (O2) 0.24 the ratio of H2:CO in the syngas was 0.33; when adding steam at ER (H2O) 0.28 the ratio reached a value of 1.0.
In the present paper, we aim to study the effect of an oxidant agent on syngas quality (namely its LHV), composition, producible energy, and cold gas efficiency. Moreover, the temperature distribution within the reactor is analyzed.
The adoption of an externally heated reactor also allows to analyze the effects of the system coupling with renewable energy sources such as the solar energy. The latter, for instance, would be possible through the use of a concentrating solar power (CSP) [35]. This system could supply the energy needed by the endothermic reactions of the gasification process, resulting in a better use of fuel energy content [36].
2. Materials and Methods
2.1. Experimental Setup
The gasification reactor used for the tests discussed in the present paper is an updraft reactor, which is the simplest type of reactor and, for this reason, it is also the most used one. The reactor (Figure 1, left) was installed at the laboratory of the Department of Mechanical and Aerospace Engineering, Sapienza University of Rome (Italy), and consisted of an AISI 310 stainless steel cylinder with a diameter of 8.3 cm and a height of 59.0 cm. It was equipped with an electric heating system (Figure 1, right), controlled by a Watlow 96 series temperature controller. The external surface was insulated with glass wool and aluminum in order to reduce thermal losses. At the top, a feeding cochlea transported the biomass within the reactor. In order to avoid any chocking of the feeding system and a syngas backflow from the reactor, a small flow of inert gas (namely N2) was used to generate a slight overpressure in the feeding channel without altering the gasification reactions. Also, from the lower part, in the pyrolysis and hydrogasification tests, some nitrogen was introduced to allow the correct flow of the gases produced towards the reactor outlet. Within the reactor (at the bottom), a perforated metal plate worked as a support for the gasification bed which allowed the oxidant to flow through the bed itself. Underneath there was a “wind box” for preheating the oxidant agent, which was injected at the bottom. Oxidant temperature within the wind box can be regulated from the room temperature up to 450 °C. Syngas was extracted from the top, thus realizing a counter-current configuration. Downstream the reactor, syngas was cleaned first using a cyclone and a ceramic filter for particulate removal, and then through the passage in three bubblers containing isopropyl alcohol for tar removal. The bubblers were immersed in a thermal bath maintained at a constant temperature equal to−10 °C. Part of the syngas flow was then collected through a vacuum pump into the sampling box for the gas chromatography characterization using a VARIAN CP-4900 micro GC. The remaining syngas was sent to a flare for combustion. At different positions within the reactor, four K thermocouples (TH1–TH4, Figure 1, right) monitored the temperature evolution during the gasification process. Sensor TH4 was placed close to the syngas extraction duct, where the presence of the heating plates allowed for a constant temperature. The remnant sensors (TH1–TH3) were placed in the lower part of the reactor, at 2.0, 15.0, and 29.0 cm from the perforated metal plate, respectively. A sketch of the whole test plant is reported in Figure 2 which also shows a secondary reactor. It was used in another experimental campaign as a reformer to capture CO2 and was filled with the catalyst/sorbent powder and thermally controlled [33], but was not employed here.
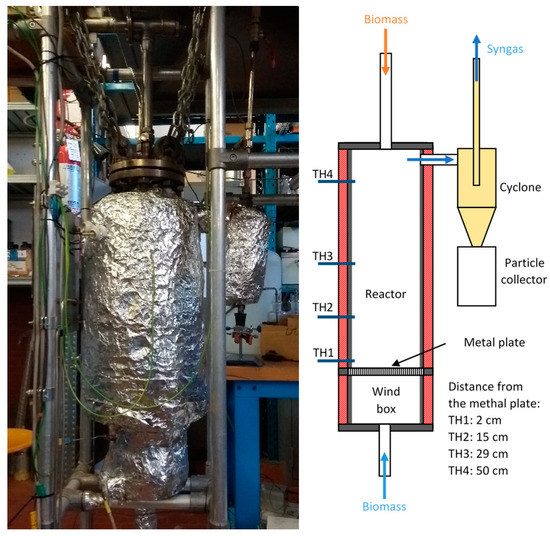
Figure 1.
A gasification reactor installed at the Department of Mechanical and Aerospace Engineering Laboratory, Sapienza University of Rome (left). Detailed scheme of the reactor interior (right).
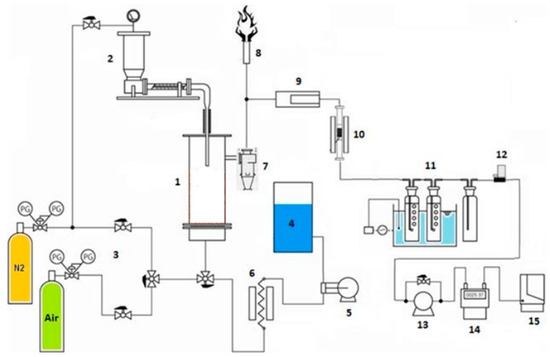
Figure 2.
Scheme of the test plant. (1) updraft reactor; (2) feeding system; (3) air and nitrogen feeding systems; (4) steam generating unit; (5) pump to extract the distilled water; (6) water heater; (7) cyclone for particulate removal; (8) flare; (9) high temperature de-dusting system; (10) secondary reactor; (11) bubblers; (12) flow control system; (13) vacuum pump; (14) flowmeter; (15) gas-chromatograph.
2.2. Characterization of the Gasification Bed
The gasification bed is composed of biomass and inert material.
In the present experiments, we used olivine sand as inert material (Table 1 reports its main properties) and hazelnut shells as biomass. The latter came from the Soriano (VT) countryside, a small town in Central Italy. The only treatment the shells underwent before the test was shredding to about 2.5 mm. Table 2 reports proximate and elemental analysis of hazelnut shells. Data were obtained through a preliminary thermogravimetric analysis (using a Mettler–Toledo system) and thermal conductivity detection to measure element concentrations, after combusting and reducing a biomass sample (with the Leco 2000 CHN system). LHV was evaluated through the calorimetric bomb Parr 6200. Results show that hazelnut shells had a minimal moisture content (about 7.9 %) and a medium LHV. The main elements hazelnut shells are composed of are carbon and oxygen, covering together more than 85 % wt of the fuel. Accordingly, hazelnut shells raw formula is C4H5O2 [33].

Table 1.
Characterizationof the olivine sand.
Table 2.
Physical and chemical properties of hazelnut shells.
2.3. Tests Description
Since the aim of the present paper is studying the influence of oxidant agents on syngas quality, we performed a series of tests using air (AG) or steam (SG), and another series with no oxidant (pyrolysis tests, PYR) as a reference. We fixed an arbitrary biomass feeding rate (namely 5.30 g/min) that was then kept constant during all the experiments. Moreover, to avoid possible clogging of the feeding channel and syngas backflow from the reactor, a small amount of nitrogen (0.4 Nl/min) was injected together with the biomass. N2 was used because it is an inert gas; thus, it does not affect the gasification process itself. Of course, this amount of N2 was then removed from the syngas composition, in order to not alter the measurements.
In order to compare operating conditions that provided about the same syngas flowrate while disregarding the oxidant agent used, the AG test showed that the reactor worked with an equivalence ratio (that is the ratio between the actual and stoichiometric airflow) equal to 8%, which means about 2.10 L/min air. On the other hand, SG tests were performed adopting a steam-to-biomass ratio equal to 0.5, corresponding to 2.70 × 10⁻³ L/min steam. The temperature of the electric heater was 845 °C for PYR and AG, and 900 °C for SG. In the latter case, we had to increase the temperature to compensate the smaller amount of heat produced by an exothermal reaction occurring within the fuel bed. Table 3 summarizes the test conditions.
Table 3.
Test conditions.
Before each test the reactor, connection tubes, cyclone filter, and ceramic filter were cleaned in order to avoid any char/ash deposition from previous tests or tar condensation.
Since in real applications tar content has to be removed because it is dangerous for the environment and people as well as for combustion devices [41], in our test plant we placed some bubblers before the gas-chromatograph inlet (Figure 2) in order to remove it. We are not interested in discussing tar composition in this study—this will be the focus of a further publication.
Syngas composition was studied through gas-chromatography analysis. In order to have significant values, eight measurements were performed for each test with a maximum error of ±1.8%, and averaged values were computed. Results were corrected to not account for the nitrogen used to help the biomass feeding. Since tar was removed from the gas stream, syngas composition was measured considering only nitrogen, methane, hydrogen, carbon monoxide, and carbon dioxide. Other trace gasses were neglected.
3. Results and Discussion
In this section, the results obtained in the above experimental campaign are presented together with a discussion of the motivations that carried out each of these outputs. The selected outcomes concern the temperature distribution within the reactor, the syngas quality in terms of its composition, the LHV, the cold gas efficiency, and the producible energy per unit time. They are indeed the main characteristics to evaluate the influence of the oxidant agent on syngas produced through biomass gasification, also in view of coupling with an external energy source.
During all tests, the biomass flow rate was kept constant while the oxidant agent varied.
3.1. Temperature Distribution within the Reactor
Reactor characteristics strongly affected the temperature. At the bottom, where exothermic reactions occur and where one would expect a higher temperature, there was actually a lower temperature. This was mainly due to the temperature at which the oxidant was injected within the reactor. As reported in Section 2.1, the oxidant was heated up to 450 °C, thus affecting the temperature within the reactor at the bottom. To have an idea of the cooling effect of the oxidant, we performed a preliminary test in which we set the temperature of the electric heating system to 845 °C (controlling TH2, see Figure 1) and injected air at 450 °C. In this case, the temperature measured by TH1, which was just 13 cm below TH2, was about 580 °C.
Figure 3 reports the average temperature distributions within the reactor in the three tests performed. Most of the works in the literature [34,35,37,38,42] show a close link between the amount of oxidant injected within the reactor and the temperature reached inside it. The temperature depends on the energy developed by the combustion reactions, which in turn depends on the amount of oxidant available for the reactions. In the present case, while the temperature measured by TH1 during AG and PYR tests varied in 555–712 °C, the temperature measured by the other thermocouples was mostly constant, slightly decreasing going toward the top. This means that despite the heat supplied by the electric heating system being rather large, the temperature in the oxidation region is still strongly influenced by exothermic reactions, as is also demonstrated in [41]. As previously stated, in steam gasification (SG) because of the strong endothermic reactions occurring within the fuel bed, and because of the huge amount of steam at 450 °C entering the reactor, to obtain an acceptable temperature in the oxidation zone we had to set a larger control temperature (about 900 °C). This resulted in a temperature at TH1 very close to that obtained during AG experiments, but a nearly constant temperature gap remained according to measurements by the other thermocouples. This is an indirect confirmation that reactions mostly occur at the bottom of the gasification reactor.
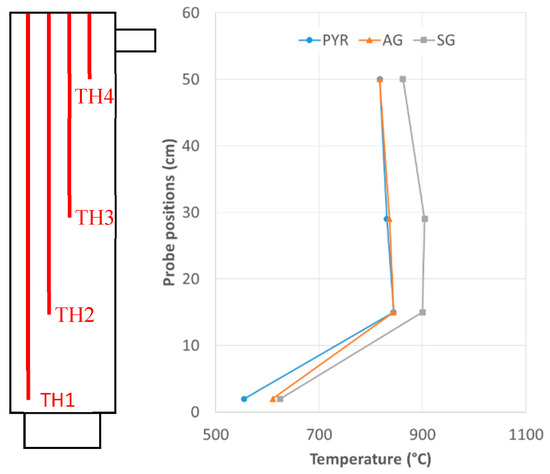
Figure 3.
Temperature distribution within the reactor during PYR, AG and SG tests.
3.2. Syngas Composition
Figure 4 and Figure 5 show the volume flow rate and composition of the syngas which was produced during the three tests. It is clear that both the flow rate and composition depend on the amount of oxidant injected. The PYR test produced about 2880.1 mL/min (0.0433 Nm3/h) syngas, in which CO was the most relevant compound (about 42%). Content of CO, H2, and CH4 were similar, about 18–21%. During AG and SG tests the syngas flow rate was very similar (0.0885 vs. 0.0875 Nm3/h), but the compositions were not. The producer gas in AG tests contained 50.0% nitrogen, while methane and hydrogen content were quite small, covering together about 13% of the total volume. CO equaled 25.3% and CO2 11.6%. Syngas in the case of SG experiments was mostly composed of H2 (35.5%) and CO (31.8%), then CO2 (18.1%) and CH4 (14.6%). In SG tests, N2 content was negligible.

Figure 4.
Volume flow rate (in ml/min) of syngas compounds.
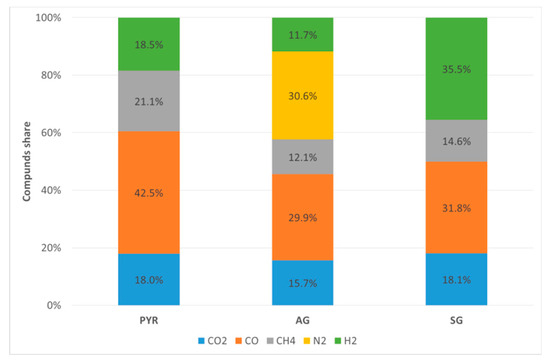
Figure 5.
Syngas composition (vol %).
By removing N2 (which is an inert) from the gas stream, we can better understand the effect of oxidant on syngas composition. Since nitrogen content in hazelnut shells is negligible, nitrogen in the syngas could only be due to the air injected which alters the concentration of different species composing the syngas. Figure 6 shows the N2-free syngas composition. By comparing PYR and AG it is clear that oxygen injected with the air is mostly used in partial oxidation of C. Indeed, in the PYR test where the only oxygen available for oxidations was that contained in the biomass, we found a large amount of CH4 (21.1%), 42.5% CO, 18.0% CO2, and 18.5% H2. Injecting air (AG tests), and thus increasing the amount of oxygen available for reactions, resulted in a reduction of CH4 content (17.4%) and an increase of both CO (43.1%) and CO2 (22.6%). H2 content decreased a bit (16.9%) due to its partial oxidation. The amount of these components is interconnected by gas-phase reactions [41] and by those of carbon oxidation in the heterogeneous phase.
| (1) Combustion | |
| (2) Combustion | |
| (3) Combustion | |
| (4) Dry reforming | |
| (5) Steam reforming | |
| (6) Water gas-shift |
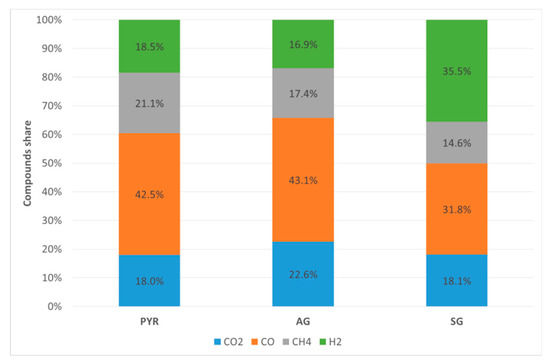
Figure 6.
Syngas composition (vol %, N2-free basis).
In SG tests, reactions (1)–(3) are very limited by the small amount of oxygen injected within the reactor. On the contrary, reactions (4)–(6) are enhanced. By comparing syngas composition in PYR and SG tests, it is evident that the use of steam as an oxidant results in a more significant amount of H2. This mainly comes from the water gas-shift reaction (6), transforming CO into CO2 and H2, but also from dry and steam reforming (Equations (4) and (5)). CO2 content is about the same in PYR and SB, meaning CO2 produced by reactions (6) and destroyed by reaction (4) are almost in equilibrium. CO content decreases going from PYR to SG, which means that the water gas-shift reaction (6) is more active than reactions (4) and (5).
3.3. Syngas Heating Value and Energy Produced
LHV of the syngas depends on its content of fuel gases, namely H2, CO, and CH4. Since other fuel gases are negligible, and the tar content is captured bythe bubblers, here we can compute LHV according to Equation (7) [37]. Figure 7 reports the LHVs of the dry syngas from different tests.
LHV = 107.98H2 + 126.36CO + 358CH4
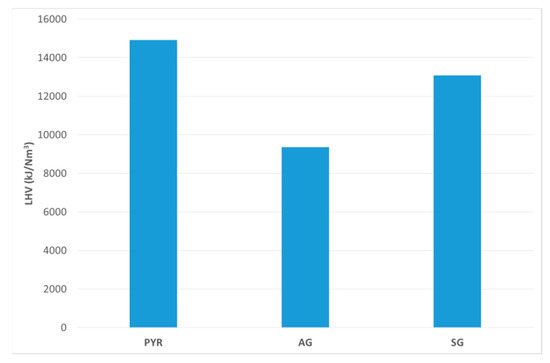
Figure 7.
LHV (kJ/Nm3) of syngas produced during the tests.
The PYR test is the one producing the best LHV, while AG is the worst, which is related to the amount of nitrogen present within the reactor. In the case of the AG test, we were injecting air, and thus nitrogen, which was reflected in the decrease of LHV. Syngas from SG test showed an LHV closer to the PYR test. This is due to the composition (Figure 5). In the SG test, H2 content is more than in the PYR test. On the contrary, CO and CH4 decrease, thus resulting in a slightly smaller LHV.
By multiplying LHV by the syngas flow rate (Figure 4), we evaluated the syngas energy producible per unit of time by the same amount of biomass but at different test conditions. Figure 8 reports this quantity. It is clear that the large amount of steam entering the reactor during SG tests results in a larger gas flow, which in turn results in a larger energy producible per unit time. On the contrary, the PYR test produces smaller gas flow, resulting in a smaller energy producible per unit of time. Lastly, the combination of a good LHV and high gas flow produce a high energy per unit time in the case of the SG test.
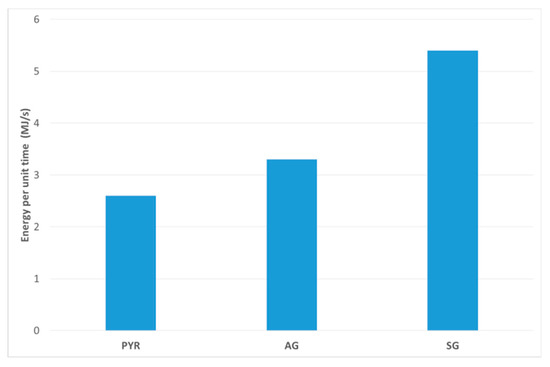
Figure 8.
Energy per unit time (MJ/s) of syngas produced during the tests.
3.4. Cold Gas Efficiency
Cold gas efficiency is a measurement of how efficient the gasification reaction is, being the ratio between the energy content of the syngas and that of the original biomass. According to Cao et al. [43], the cold gas efficiency can be written asEquation (8).
In the case of SG, the modified denominator in Equation (8) accounts for the enthalpy owned by the steam at 450 °C (3382.0 kJ/kg) entering the reactor. Therefore, the denominator is given by the sum of the LHV of the biomass used and the enthalpy of the steam injected per kg of biomass. Cold gas efficiency computed in the three test sets is reported in Table 4. As shown, despite the contribution given by the enthalpy of the steam, the cold gas efficiency is larger in the case of SG which is due to the larger amount of H2 present in the syngas.
Table 4.
Cold gas efficiency.
4. Conclusions
In the present paper, we reported an analysis of the influence of the oxidant agent on syngas produced through biomass gasification. In particular, we used waste biomass quite common in Italy, namely hazelnut shells, which are used from time to time as a fuel in small domestic combustion plants. The idea is to increase the energy content of the biomass profitably used by adopting it as a fuel in a gasification process. The effect of the oxidant agent is measured in terms of temperature distribution within the reactor, syngas quality in terms of its composition and LHV, as well as producible energy per unit of time.
Based on the experiments, AG and SB tests produce about the same syngas flow but have different quality in terms of composition, LHV, and cold gas efficiency.
The producer gas in AG tests contains 50.0% nitrogen (negligible in SG tests), while methane and hydrogen cover together about 13% of the total volume. CO equals 25.3% and CO2 11.6%. On the contrary, in the SG experiments the producer gas is mostly composed of H2 (35.5%) and CO (31.8%), then CO2 (18.1%) and CH4 (14.6%).
Due to the nitrogen content of the air, the AG syngas’ LHV appears very small, thus resulting in a small amount of energy producible per unit of time. On the contrary, the syngas flow produced during SG tests had a very high LHV (about 13.1 MJ/Nm3) because of its large content of hydrogen, CO, and CH4. This leads to a larger energy flow producible through syngas, and a better cold gas efficiency (0.18 versus 0.14 of the AG and 0.11 of the PYR), that can be seen as a measure of the reaction gasification efficiency. It indicates that steam gasification of biomass would be a possibility coupling the steam production with renewable sources (i.e., solar energy).
This analysis can be useful for external heat source exploitation, such as solar energy (i.e., a CSP plant) in order to supply part of the heat necessary for the gasification. Thus, the adoption of an external heat source allows the ER optimization and/or steam usage as an oxidant agent, with the aim of maximizing both the syngas flow rate and its quality (LHV).
Author Contributions
Data curation, E.V., F.R. and E.P.; Formal analysis, R.L. and L.S.; Project administration, F.G.; Supervision, F.G. and A.C.; Writing—review & editing, P.V. and M.C. All authors have read and agreed to the published version of the manuscript.
Funding
This research received no external funding.
Conflicts of Interest
The authors declare no conflict of interest.
References
- International Energy Agency. World Energy Outlook 2018 Report, 2018 Edition. Available online: https://www.iea.org/reports/world-energy-outlook-2018 (accessed on 12 November 2019).
- World Biomass Association. WBA Global Bioenergy Statistics 2018 Report, 2018 Edition. Available online: https://worldbioenergy.org/uploads/181017%20WBA%20GBS%202018_Summary_hq.pdf (accessed on 12 November 2019).
- Bioenergy Europe. Statistical Report, 2018 Edition. Available online: https://bioenergyeurope.org/statistical-report.html (accessed on 12 November 2019).
- Asadullah, M. Barriers of commercial power generation using biomass gasification gas: A review. Renew. Sustain. Energy Rev. 2014, 29, 201–215. [Google Scholar] [CrossRef]
- Dincer, I. Green methods for hydrogen production. Int. J. Hydrogen Energy 2012, 37, 1954–1971. [Google Scholar] [CrossRef]
- Zainal, Z.A.; Rifau, A.; Quadir, G.A.; Seetharamu, K.N. Experimental investigation of a downdraft biomass gasifier. Biomass Bioenergy 2002, 23, 283–289. [Google Scholar] [CrossRef]
- Wang, J.; Cheng, G.; You, Y.; Xiao, B.; Liu, S.; He, P.; Guo, D.; Guo, X.; Zhang, G. Hydrogen-rich gas production by steam gasification of municipal solid waste (MSW) using NiO supported on modified dolomite. Int. J. Hydrogen Energy 2012, 37, 6503–6510. [Google Scholar] [CrossRef]
- Borello, D.; Pantaleo, A.M.; Caucci, M.; De Caprariis, B.; De Filippis, P.; Shah, N. Modeling and experimental study of a small scale olive pomace gasifier for cogeneration: Energy and profitability analysis. Energies 2017, 10, 1930. [Google Scholar] [CrossRef]
- Lucas, C.; Szewczyk, D.; Blasiak, W.; Mochida, S. High-temperature air and steam gasification of densified biofuels. Biomass Bioenergy 2004, 27, 563–575. [Google Scholar] [CrossRef]
- Aghaalikhani, A.; Savuto, E.; Di Carlo, A.; Borello, D. Poplar from phytoremediation as a renewable energy source: Gasification properties and pollution analysis. Energy Procedia 2017, 142, 924–931. [Google Scholar] [CrossRef]
- Ancona, V.; Barra Caracciolo, A.; Campanale, C.; De Caprariis, B.; Grenni, P.; Uricchio, V.F.; Borello, D. Gasification treatment of poplar biomass produced in a contaminated area restored using plant assisted bioremediation. J. Environ. Manag. 2019, 239, 137–141. [Google Scholar] [CrossRef]
- De Sales, C.A.; Maya, D.M.; Lora, E.E.; Jaén, R.L.; Reyes, A.M.; González, A.M.; Andrade, R.V.; Martínez, J.D. Experimental study on biomass (eucalyptus spp.) gasification in a two-stage downdraft reactor by using mixtures of air, saturated steam and oxygen as gasifying agents. Energy Convers. Manag. 2017, 145, 314–323. [Google Scholar] [CrossRef]
- Narvaez, R.A.; Blanchard, R.; Dixon, R.; Ramirez, V.; Chulde, D. Low-Cost Syngas Shifting for Remote Gasifiers: Combination of CO2 Adsorption and Catalyst Addition in a Novel and Simplified Packed Structure. Energies 2018, 11, 311. [Google Scholar] [CrossRef]
- Mehta, Y.; Richards, C. Gasification performance of a top-lit updraft cook stove. Energies 2017, 10, 1529. [Google Scholar] [CrossRef]
- James, R.A.M.; Yuan, W.; Boyette, M.D. The Effect of Biomass Physical Properties on Top-Lit Updraft Gasification of Woodchips. Energies 2016, 9, 283. [Google Scholar] [CrossRef]
- Huang, J.; Schmidt, K.G.; Bian, Z. Removal and conversion of tar in Syngas from woody biomass gasification for power utilization using catalytic Hydrocracking. Energies 2011, 4, 1163–1177. [Google Scholar] [CrossRef]
- Götz, T.; Saurat, M.; Kaselofsky, J.; Obernberger, I.; Brunner, T.; Weiss, G.; Bellostas, B.C.; Moretti, C. First stage environmental impact assessment of a new highly efficient and fuel flexible medium-scale chp technology based on fixed-bed updraft biomass gasification and a SOFC. In Proceedings of the 27th European Biomass Conference and Exhibition, Lisbon, Portugal, 27–30 May 2019; pp. 1586–1594. [Google Scholar]
- Brunner, T.; Biedermann, F.; Obernberger, I.; Hirscher, S.; Schöch, M.; Milito, C.; Leibold, H.; Sitzmann, J.; Megel, S.; Hauth, M.; et al. Development of a new highly efficient and fuel flexible medium-scale CHP technology based on fixed-bed updraft biomass gasification and a SOFC. In Proceedings of the 26th European Biomass Conference and Exhibition, Copenhagen, Denmark, 14–17 May 2018; pp. 470–477. [Google Scholar]
- Diez, H.E.; Perez, J.F. Effects of wood biomass type and airflow rate on fuel and soil amendment properties of biochar produced in a top-lit updraft gasifier. Environ. Prog. Sustain. Energy 2019, 38, 13105. [Google Scholar] [CrossRef]
- Palencia Diaz, A.; Aguillon Martinez, J.E. Experimental study of forestry waste gasification: Pinewood chips-grass mixtures. J. Renew. Sustain. Energy 2019, 11, 044701. [Google Scholar] [CrossRef]
- Ozbas, E.E.; Aksu, D.; Ongen, A.; Aydin, M.A.; Ozcan, H.K. Hydrogen production via biomass gasification, and modeling by supervised machine learning algorithms. Int. J. Hydrogen Energy 2019, 44, 17260–17268. [Google Scholar] [CrossRef]
- Yilmaz, F.; Ozturk, M.; Selbas, R. Design and thermodynamic analysis of coal-gasification assisted multigeneration system with hydrogen production and liquefaction. Energy Convers. Manag. 2019, 186, 229–240. [Google Scholar] [CrossRef]
- Bai, L.; Kudo, S.; Norinaga, K.; Wang, Y.G.; Hayashi, J.I. Kinetics and mechanism of steam gasification of char from hydrothermally treated woody biomass. Energy Fuels 2014, 28, 7133–7139. [Google Scholar] [CrossRef]
- Huang, Y.; Wang, Y.; Zhou, H.; Gao, Y.; Xu, D.; Bai, L.; Zhang, S. Effects of water content and particle size on yield and reactivity of lignite chars derived from pyrolysis and gasification. Molecules 2018, 23, 2717. [Google Scholar] [CrossRef]
- Tian, B.; Qiao, Y.; Fan, J.; Bai, L.; Tian, Y. Coupling Pyrolysis and Gasification Processes for Methane-Rich Syngas Production: Fundamental Studies on Pyrolysis Behavior and Kinetics of a Calcium-Rich High-Volatile Bituminous Coal. Energy Fuels 2017, 31, 10665–10673. [Google Scholar] [CrossRef]
- Franco, S.; Pancino, B.; Cristofori, V. Hazelnut production and local development in Italy. Acta Hortic. 2014, 1052, 347–352. [Google Scholar] [CrossRef]
- Speranza, S.; Bucini, D.; Paparatti, B. New observations on biology of European shot-hole borer [Xyleborus dispar (F.)] on hazelnut in Northern Latium (Central Italy). Acta Hortic. 2009, 845, 539–542. [Google Scholar] [CrossRef]
- Paparatti, B.; Speranza, S. Biological control of hazelnut weevil (Curculio nucum L., Coleoptera, Curculionidae) using the entomopathogenic fungus Beauveria bassiana (Balsamo) Vuill. (Deuteromycotina, Hyphomycetes). Acta Hortic. 2005, 686, 407–412. [Google Scholar] [CrossRef]
- Balestra, G.M.; Bucini, D.; Paparatti, B.; Speranza, S.; Proietti Zolla, C.; Pucci, C.; Varvaro, L. Bio-etology of Anisandrus dispar F. and its possible involvment in dieback (Moria) diseases of hazelnut (Corylus avellana L.) plants in central Italy. Acta Hortic. 2005, 686, 435–444. [Google Scholar]
- McKendry, P. Energy production from biomass (part 2): Conversion technologies. Bioresour. Technol. 2002, 83, 47–54. [Google Scholar] [CrossRef]
- McKendry, P. Energy production from biomass (part 3): Gasification technologies. Bioresour. Technol. 2002, 83, 55–63. [Google Scholar] [CrossRef]
- Couto, N.; Ruoboa, A.; Silva, V.; Monteiro, E.; Bouziane, K. Influence of the biomass gasification pro-cesses on the final composition of syngas. Energy Procedia 2013, 36, 596–606. [Google Scholar] [CrossRef]
- Sisinni, M.; Di Carlo, A.; Bocci, E.; Micangeli, A.; Naso, V. Hydrogen-rich gas production by sorption enhanced steam reforming of wood gas containing tar over a commercial Ni catalyst and calcined dolomite as co2 sorbent. Energies 2013, 6, 3167–3181. [Google Scholar] [CrossRef]
- Dabai, F.; Paterson, N.; Millan, M.; Fennell, P.; Kandiyoti, R. Tar formation and destruction in a fixed bed reactor simulating downdraft gasification: Effect of reaction conditions on tar cracking products. Energy Fuels 2014, 28, 1970–1982. [Google Scholar] [CrossRef]
- Gallucci, F.; Liberatore, R.; Sapegno, L.; Volponi, E.; Venturini, P.; Paris, E.; Carnevale, M.; Rispoli, F. Biomass gasification: The effect of equivalence ratio on syngas quality in the case of externally heated reactor. In Proceedings of the 27th European Biomass Conference and Exhibition, Lisbon, Portugal, 27–30 May 2019. [Google Scholar]
- Liberatore, R.; Crescenzi, T.; Sapegno, L.; Volponi, E.; Venturini, P.; Rispoli, F.; Paris, E.; Carnevale, M.; Gallucci, F. Analysis on the coupling of biomass gasification process with a parabolic trough concentrating solar plant. In Proceedings of the European Biomass Conference and Exhibition, Lisbon, Portugal, 27–30 May 2019. [Google Scholar]
- Guo, F.; Dong, Y.; Dong, L.; Guo, C. Effect of design and operating parameters on the gasification process of biomass in a downdraft fixed bed: An experimental study. Int. J. Hydrogen Energy 2014, 39, 5625–5633. [Google Scholar] [CrossRef]
- Perez, J.F.; Melgar, A.; Nel Benjumea, P. Effect of operating and design parameters on the gasification/combustion process of waste biomass in fixed bed downdraft reactors: An experimental study. Fuel 2012, 96, 487–496. [Google Scholar] [CrossRef]
- Molino, A.; Chianese, S.; Musmarra, D. Biomass gasification technology: The state of the art overview. J. Energy Chem. 2016, 25, 10–25. [Google Scholar] [CrossRef]
- Cerone, N.; Zimbardi, F. Gasification of Agroresidues for syngas production. Energies 2018, 11, 1280. [Google Scholar] [CrossRef]
- Parthasarathy, P.; Narayanan, K.S. Hydrogen production from steam gasification of biomass: Influence of process parameters on hydrogen yield—A review. Renew. Energy 2014, 66, 570–579. [Google Scholar] [CrossRef]
- Houben, M.P.; de Lange, H.C.; van Steenhoven, A.A. Tar reduction through partial combustion of fuel gas. Fuel 2005, 84, 817–824. [Google Scholar] [CrossRef]
- Cao, Y.; Wang, Y.; Riley, J.T.; Pan, W.P. A novel biomass air gasification process for producing tar-free higher heating value fuel gas. Fuel Process. Technol. 2006, 87, 343–353. [Google Scholar] [CrossRef]
© 2019 by the authors. Licensee MDPI, Basel, Switzerland. This article is an open access article distributed under the terms and conditions of the Creative Commons Attribution (CC BY) license (http://creativecommons.org/licenses/by/4.0/).