Article

How Does Information and Communication Technology Capital Affect Productivity in the Energy Sector? New Evidence from 14 Countries, Considering the Transition to Renewable Energy Systems

1
Faculty of Economics, Kyushu University, 744 Motooka, Nishi-ku, Fukuoka 819-0395, Japan
2
Urban Institute & Faculty of Engineering, Kyushu University, 744 Motooka, Nishi-ku, Fukuoka 819-0395, Japan
*
Author to whom correspondence should be addressed.
Energies 2019, 12(9), 1786; https://doi.org/10.3390/en12091786
Submission received: 1 April 2019 / Revised: 25 April 2019 / Accepted: 7 May 2019 / Published: 10 May 2019
(This article belongs to the Special Issue Advances in Low Carbon Technologies and Transition)

Abstract

:
By focusing on a distributed energy system that has been widely diffused for efficient utilization of renewable energy generation in recent years, this paper investigates the relationship between productivity growth and information and communications technology capital in the energy sector. Information and communications technology is a key factor in operating distributed energy systems in a way that balances energy supply and demand in order to minimize energy loss and to enhance capacity utilization. The objective of this study is to clarify the determining factors that affect productivity growth, focusing on three different information and communications technologies: information technology capital, communication technology capital and software capital. Our estimation sample covers energy sectors in 14 countries from 2000 to 2014. The results show that information technology and software capital contribute to increasing material productivity and capital productivity in the energy sector, respectively. Meanwhile, communication technology capital negatively affects these two productivity indicators.

1. Introduction

1.1. ICT and Productivity

As a general-purpose technology, information and communications technology (ICT) can play an important role in productivity growth, which is the main driver of the wealth of nations and market competitiveness [1,2]. Investment in ICT enables new technologies to enter the production process and is viewed as a key factor in efficiency gains in ICT using industry [3,4]. The OECD [5] has noted that developments in ICT, combined with internationally fragmented production processes, are making business services increasingly dynamic, transportable and tradeable. According to Miller and Atkinson [6], approximately two-thirds of U.S. growth in total factor productivity (TFP) between 1995 and 2004 was due to ICT, and ICT has contributed roughly one-third of growth ever since. Kvochko [7] identified five common economic effects of ICT: direct job creation, contribution to GDP growth, the emergence of new services and industries, workforce transformation, and business innovation. Thus, ICT contributes to economic development through multiple pathways in various sectors.
The energy sector (e.g., electricity and gas supply) is one of the key industries investing in ICT to deliver cost savings and efficiency gains [8]. In particular, distributed energy systems have been widely diffused to efficiently utilize renewable energy generation in recent years. Figure 1 shows the investment trend related to the energy sectors. Figure 1a shows that investment in the global power sector has shifted from fossil fuel to renewable energy and networks in the past decade. Another important trend is that the ICT sector’s investment in new energy technology companies has rapidly increased in recent years (see Figure 1b)). The rapid growth in investment by the ICT sector has helped diffuse distributed energy systems with renewable energy generation in networked environments such as smart grids [9].
According to the Information Technology Industry Council [10], ICT can be used to improve the reliability, resiliency, and efficiency of grids’ transmission, storage and distribution infrastructure through better real-time monitoring and control of the grid systems under increasingly complex energy grids. Nagai et al. [11] explained that ICT can be used in energy infrastructure in three ways: (1) as a system for cost-based analysis of operational efficiency, (2) as a support system for optimizing operation and maintenance, and (3) as a visualization tool for the management of key performance indicators and risks. They also noted that ICT has the advantage of developing an autonomous decentralized energy system, which is essential for controlling large-scale and various types of renewable energy supplies. According to the World Energy Council [12], ICT, especially software tools, can provide data and information on how to better configure the various elements of an energy generation system so as to optimize its overall performance in a cost-effective manner.

1.2. Literature Review and Novelty of This Study

Many previous studies have analyzed how ICT contributes to productivity growth [13,14,15]. According to Polák [16], more than 70 articles in the last 20 years have investigated the contribution of ICT. For example, Edquist and Henrekson [17] examined the effect of ICT on the change in TFP in 50 industries in Sweden from 1993 to 2013. They concluded that ICT capital growth is not significantly associated with TFP growth. Strobel [18] compared the contribution of ICT capital to TFP and its spillover effect in thirteen manufacturing industries between the U.S. and Germany from 1991 to 2005. Strobel [18] clarified that ICT has a different function in affecting productivity growth. Regarding cross-country analysis, Ceccobelli et al. [19] investigated the impact of ICT capital on labor productivity (LP) using data on 14 countries from 1995 to 2005 and a nonparametric approach to estimate productivity change.
However, most previous studies focus on national-level activities or manufacturing sectors, with few studies addressing the energy sector (e.g., the German energy sector [20]). Additionally, many previous studies cast a spotlight on the differences between ICT capital data and non-ICT capital data, and most of them use ICT gross capital stock to investigate the impact of ICT capital on productivity. ICT capital is composed of several different types of capital, including information technology (IT) capital, communication technology (CT) capital, and software capital.
To clarify the details on the relationship between ICT capital and productive performance in the energy sector, the differences in the characteristics of ICT capital must be considered. Notably, not all ICTs contribute equally to improved productive performance in the energy sector. Certain ICTs directly contribute to reducing labor costs, such as smart meters and sensors for remote measuring, whereas others contribute to improving efficiency because they improve the grid management system. Therefore, the incentives for the energy sector to invest in ICT vary depending on the type of technology considered. A determinant analysis of productive performance that focuses on the characteristics of each type of ICT is important for suggesting effective policies to encourage development and to induce activities in such technology in the energy sector.
Another important contribution of this study is that it focuses on the period from 2000 to 2014. As explained above, previous studies on the effect of ICT capital mainly focus on the period from 1990 to 2005. Meanwhile, innovative ICT utilization, such as the internet of things, has dramatically advanced in recent years [21]. Considering recent ICT innovations is important for proposing policy. Energy strategies, especially with regard to nuclear power and renewable energy diffusion, have been strongly affected by the Fukushima Daiichi nuclear disaster on 11 March 2011 [22]. Investigating the relationship between ICT capital and productivity change using a recent dataset on the energy sector can provide key information for strategy building for future energy systems and ICT investments.
Based on this background, this study investigates the effect of ICT capital stock share as a determining factor in market competitiveness using both production efficiency as a performance evaluation method and an econometric approach for the analysis of determinants. The objective of this study is to clarify the ICT capital effect on productivity in the energy sector, focusing on the characteristics of each type of ICT.

1.3. Research Framework

To focus on the characteristics and effects of ICT capital stock, this study clarifies how each aspect of ICT capital concentration affects the productive performance in the energy sector. As explained above, ICT contributes to the performance of the energy sector through various pathways [10,11]. Thus, the contribution of ICT should be investigated not only from a one-dimensional perspective but also from a multidimensional perspective using multiple indicators. To investigate this relationship, this study applies four productive performance evaluation indicators: LP, capital productivity (CP), material productivity (MP), and TFP.
Figure 2 shows the research framework for this study. The methodological approach involves two steps. First, this study evaluates the performance of the energy sector using four indicators. A performance evaluation indicator can be applied as a proxy for market competitiveness in the industrial sector, and the four indicators allow us to perform a multidimensional evaluation of productive performance in the energy sector.
Second, this study tries to explain the differences in the productive performance indicators among countries based on three multidimensional factors: (1) the ICT capital share, (2) the renewable energy share, and (3) the electricity price and research and development (R&D) capital share. The ICT capital share focuses on the concentration of IT capital, CT capital, and software capital within the gross capital stock. Next, this study investigates the effect of a distributed electricity system on the performance of the energy sector, focusing in particular on solar photovoltaic and wind power generation.
Additionally, this study applies electricity price and R&D capital share as the control variables in the determinant analysis. According to the OECD [23], investment in intellectual property products, such as R&D, not only contributes to expanding the technological frontier but also enhances the ability of firms to adopt existing technologies, playing an important role in productivity performance. For this reason, the R&D share is selected as the control variable in the 2nd step of the analysis.
This paper contributes by seeking to explain productivity changes using econometric techniques, with a specific focus on the effect of ICT capital stock composition. This study investigates the effect of different types of ICT capital formations on measures of performance of the energy sector. More specifically, this study investigates the role of ICT capital in the energy sector, differentiating this type of capital according to factors such as renewable energy management systems.

2. Materials and Methods

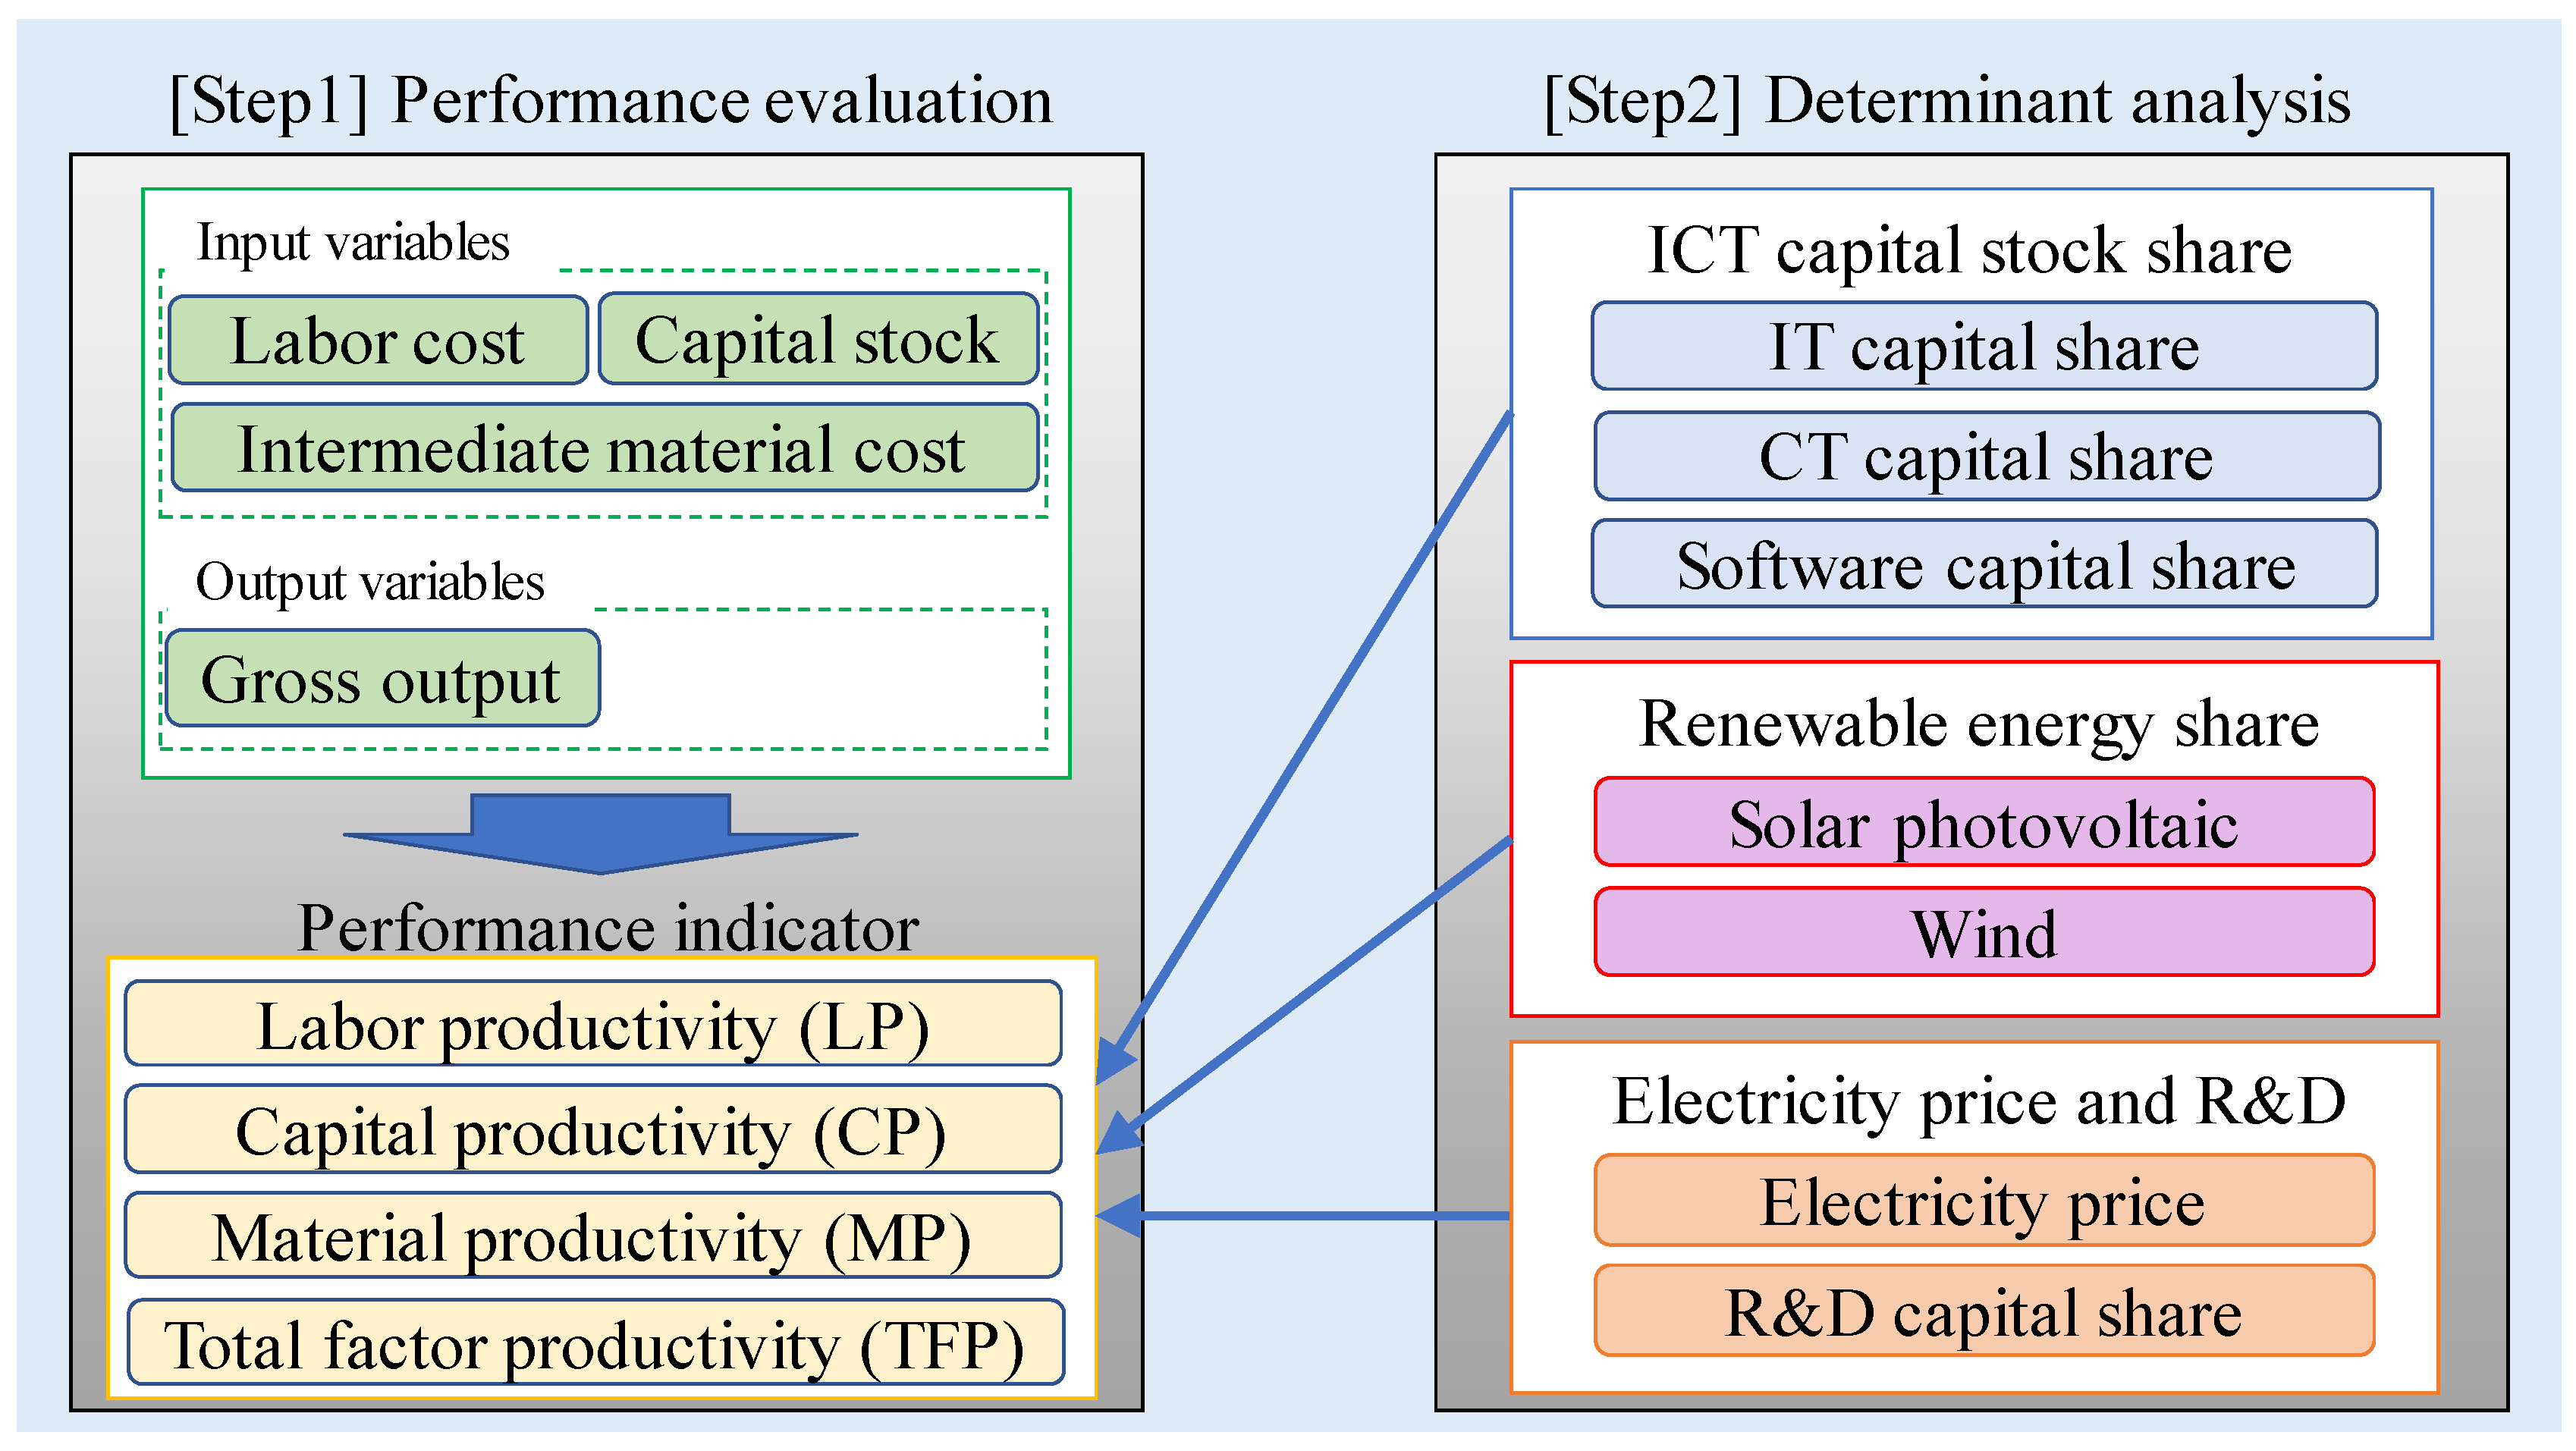
2.1. Performance Evaluation Indicators

2.1.1. Labor Productivity (LP)

LP is defined as the desirable output (e.g., sales, production amount) per labor input (e.g., labor cost, hours worked) [24]. LP can be increased by reducing the labor input while maintaining the same amount of production or by increasing the production amount with the same labor input. In other words, LP is the inverted score of the labor input per unit of production, which represents the production of scale-adjusted labor input. In this study, LP is estimated by the gross output divided by labor compensation.
LP growth, in which ICT capital is typically used, was generally much higher and more volatile between 1995 and 2013 [4]. ICT capital contributes to productivity growth in labor-intensive industries because transaction costs, including information sharing among laborers, can be decreased due to ICT capital utilization [25]. However, the energy sector, which is a typical capital-intensive industry, has not been investigated with regard to the relationship between LP and ICT capital stock. In general, productivity in the energy sector is strongly related to energy efficiency, which is determined by the technological level of equipment. Thus, this study assumes that the contribution of ICT capital to LP growth in the energy sector is limited.

2.1.2. Capital Productivity (CP)

CP is measured as the ratio between the volume of output and the volume of capital input, defined as the flow of productive services that the capital delivers in production [24]. CP can be increased by reducing the capital input while maintaining the same amount of production or by increasing the production amount with the same capital input. Therefore, CP reflects how efficiently capital is used to produce output [24]. In this study, CP is estimated by gross output divided by capital stock.
ICT capital utilization has an important role in increasing CP in the energy sector. One reason is that renewable energy systems, especially solar photovoltaic and wind power, are widely diffused worldwide. ICT capital is an important factor in the efficient use of renewable energy generation in distributed energy systems [26]. In particular, the control system for balancing energy supply and demand requires ICT capital to minimize energy loss and to enhance capacity utilization [27]. Based on this background, this study assumes that ICT capital stock contributes to CP growth and that this contribution effect is stronger in countries that achieve a high share of distributed energy (e.g., solar photovoltaic and wind power) in their total energy supply.

2.1.3. Material Productivity (MP)

MP is defined as the desirable output per intermediate input (e.g., natural resources). MP can be increased by reducing the intermediate input while maintaining the same amount of production or by increasing the production amount with the same intermediate input. Therefore, MP reflects the efficiency of intermediate input utilization [23]. Thus, in addition to LP and CP, MP is an important indicator for evaluating the energy sector from the resource efficiency perspective.
Notably, the definition of the material is often different between the economics and engineering research fields. Baptist and Hepburn [28] explain that engineers tend to define materials to mean physical inputs (e.g., iron ore), while economists often do not differentiate between materials and other intermediate inputs because it can be difficult to distinguish raw materials. Because of the data constraints on identifying raw materials, this study evaluates MP using monetary-based intermediate input data, following the idea in the economics research field. In this study, MP is estimated by gross output divided by intermediate material cost.
This study assumes that the IT and software capital contribute to increasing MP due to the automated control of resource inputs in the production process. Additionally, sensing technology can reduce the risk of resource waste, such as leakages of electricity and gas.

2.1.4. Total Factor Productivity (TFP)

TFP is defined as the portion of output not explained by the number of inputs used in production [29]. TFP is also interpreted as a proxy for advancements in production technology [30]. TFP can be increased by reducing the input factors while maintaining the same amount of production or by increasing the production amount with the same input factors. Therefore, TFP reflects the overall production technology, which is a key factor in gaining market competitiveness.
This study measures TFP change by examining the relative productivity among the energy sectors of 42 countries using a directional distance function (DDF) model. The formula for calculating the distance function for country k can be computed using the following optimization problem:
D ( x k l , y k m , g x l , g y m ) = Maximize β k
s . t .   i = 1 N λ i x i l x k l + β k g x l    l = 1 , , L
i = 1 N λ i y i m y k m + β k g y m    m = 1 , , M
λ i 0 ,    ( i = 1 , , N )
where β k is the production inefficiency score of country k, and i is the country name. λ i is the weight variable used to identify the reference point on the production frontier line. l and m are the input and output variable names, respectively; x is the production input factor in the L × N input factor matrix; and y is the output in the M × N output factor matrix. In addition, gx is the directional vector of the input factor, and gy is the directional vector of the output factors. To estimate the production inefficiency score of all countries, a model calculation must be applied independently N times for each country.
To estimate the productivity change indicators, this study sets the directional vector = ( g x l , g y m ) = ( x k l , y k m ) . This type of directional vector assumes that an inefficient firm can decrease its productive inefficiency while increasing its desirable outputs and that it can decrease its inputs in proportion to the initial combination of actual outputs. Under this directional vector setting and the selection of data variables in Figure 2, the following equation can be obtained:
D ( x k l , y k m , g x l , g y m ) = Maximize β k
i = 1 N λ i x i l ( 1 β k ) x k l    l = Labor ,   Capital   stock ,   material
i = 1 N λ i y i m ( 1 + β k ) y k m    m = gross   output
λ i 0    i = 1 , , N
This study employs the Luenberger productivity indicator (LPI) as a TFP measure because the LPI is believed to be more robust than the widely used Malmquist indicator [31]. The LPI is computed with the results of the DDF model and is derived as follows [31,32]:
TFP t t + 1 = 1 2 { D t + 1 ( x t , y t ) D t + 1 ( x t + 1 , y t + 1 ) + D t ( x t , y t ) D t ( x t + 1 , y t + 1 ) }
where x t is the input for year t, x t + 1 is the input for year t + 1, y t is the desired output for year t, and y t + 1 is the desired output for year t + 1. D t ( x t , y t ) is the inefficiency score of year t based on the frontier curve in year t. Similarly, D t + 1 ( x t , y t ) is the inefficiency score of year t + 1 based on the frontier curve in year t + 1.

2.2. Determinant Factor Analysis

To investigate the effect of ICT capital share on productive performance indicators in the energy sector, panel regression analysis is applied. Four performance indicators are regressed on the seven determinant factors (see Figure 2). In addition, the interaction terms of the ICT capital share and the renewable energy share to investigate the CP improvement effect. The specification for the regression is assumed to be that in Equation (2):
Performance i t j = k β 1 k I C T i t k + k β 2 k ( I C T i t k × R e n e w a b l e i t ) + X β + μ t + δ i + ε i t
The subscripts i, t, j, and k represent the country, time, type of performance indicator, and type of ICT capital, respectively, whereas β 1 , β 2 , and β are the coefficient parameters. To capture the characteristics of the energy sector in each country, the control variable vector X was incorporated into the models. μ t and δ i are unobserved time- and country-specific fixed effects, respectively. ε i t is an idiosyncratic error term.

2.3. Data

For the productivity analysis in the 1st step, this study uses four data variables in energy sector data from 42 countries between 2000 and 2014 (Table 1). In this study, the energy sector is defined as the electricity, gas, steam and air conditioning supply sectors following the WIOD and the United Nations Statistics Division [33].
The analysis includes observations on gross output, labor compensation, capital stock, and intermediate input data from the World Input-Output Database (WIOD) [34]. This study uses the following four data variables from WIOD: (1) the gross output by industry at current basic price (in millions of national currency), (2) intermediate inputs at current purchasers’ price (in millions of national currency), (3) compensation of employees (in millions of national currency), and (4) nominal capital stock (in millions of national currency).
All financial data are in 2010 dollars ($ U.S.), applying the currency exchange and price deflation factors from the WIOD. Using the dataset for the 1st step of the analysis, the four productive performance indicators are calculated. It should be noted that the DDF model for TFP estimation requires a large sample size to identify the production frontier line [35]. To estimate TFP change using a large dataset, the data of 42 countries are included in the 1st step of the analysis.
For the 2nd step of the analysis, this study uses four productivity indicators estimated as dependent variables and seven data variables as independent variables (Table 2). Seven independent variable datasets are obtained from three different databases. The first database is the EU KLEMS database, which provides capital stock data by type of usage [36]. Data on 14 countries from 2000 to 2014 are obtained from the EU KLEMS database. The data variables include IT capital stock, CT capital stock, software capital stock, R&D capital stock, and gross capital stock. This study estimates each capital stock share using the gross capital stock as the denominator.
The second database is the Renewable Energy Information 2017 published by the International Energy Agency (IEA). To investigate the ICT capital effect on distributed energy systems, energy production by solar photovoltaic and wind generation are used to estimate data on the share of renewable energy. Additionally, the total data on all energy sources are used as the denominator.
Finally, the electricity price index is obtained from the Energy Price and Taxes 2018 database published by the IEA. The electricity price index is used as the proxy of the market environment in the energy sector (e.g., a feed-in tariff policy makes the electricity price increase).
This study combines two datasets: the financial dataset for productivity analysis and the dataset for the determinant analysis. Data on 14 countries are available from both datasets; thus, these data are used for the 2nd step of the analysis. Table 2 shows the average value of the data variables for the 14 countries in the determinant analysis.
According to Stiroh [15], the share of ICT capital stock in total capital stock is the preferred way to measure ICT capital intensity. Thus, this study estimates the share of each type of capital stock in gross capital stock. Notably, the share of each capital type of stock in gross capital stock can reflect the relative priority of the accumulation of capital stock compared with other types of capital stock, including non-ICT capital. To conduct the determinant analysis of productive performance with ICT capital shares, this study clarifies the impact of ICT capital stock on productive performance.
This research uses three types of capital stock (IT capital, CT capital, and software capital) as data on ICT capital. This categorization follows the definition of ICT investments reported by the OECD. According to the OECD [24], ICT investment is defined as the acquisition of equipment and computer software, and ICT has three components: IT equipment (e.g., computers and related hardware), CT equipment (e.g., telecommunications equipment), and software (e.g., packaged software and customized software).
Notably, the sector integration method of the EU KLEMS database is different from that of the WIOD. The EU KLEMS database provides data only on the utility sector; such data integrate data on the energy sector and on the water supply sector. Therefore, it is difficult to distinguish the ICT capital data in the energy sector from the EU KLEMS database, which is a limitation of this research. To overcome this limitation, this study assumes that the ICT capital share in the energy sector is broadly similar to that in the utility sector. This assumption is based on the fact that the capital stock data on the energy sector are much higher than those on the water supply sector based on the WIOD database. For example, in 2014, the energy sector accounted for a 92% share and an 80% share of the capital stock in the utility sector in the U.S. and Italy, respectively. This evidence supports our assumption that the trend of capital stock formation between the energy sector and the utility sector is similar.
Table 1 and Table 2 describe the countries and the variables in the 1st and 2nd steps of the analysis. Because of the limited availability of data on ICT capital stock from the EU KLEMS database, the data sample was decreased from 42 countries in the 1st step of the analysis to 14 countries in the 2nd step of the analysis.
It should be noted that ICT capital utilization is just one dimension of the productive performance improvement in the energy sector; there are other ways to promote this improvement (e.g., fossil fuel combustion efficiency and distribution efficiency). One limitation of this study is that the data on R&D capital stock are limited to the total value and do not reveal the type of technology. Thus, this study assumes that technological innovation related to resource utilization (e.g., fuel combustion and distribution technology) is reflected in the R&D capital stock value. Based on this assumption, the R&D capital stock is applied as an innovation factor of resource utilization technology in the 2nd step of the analysis.

3. Results

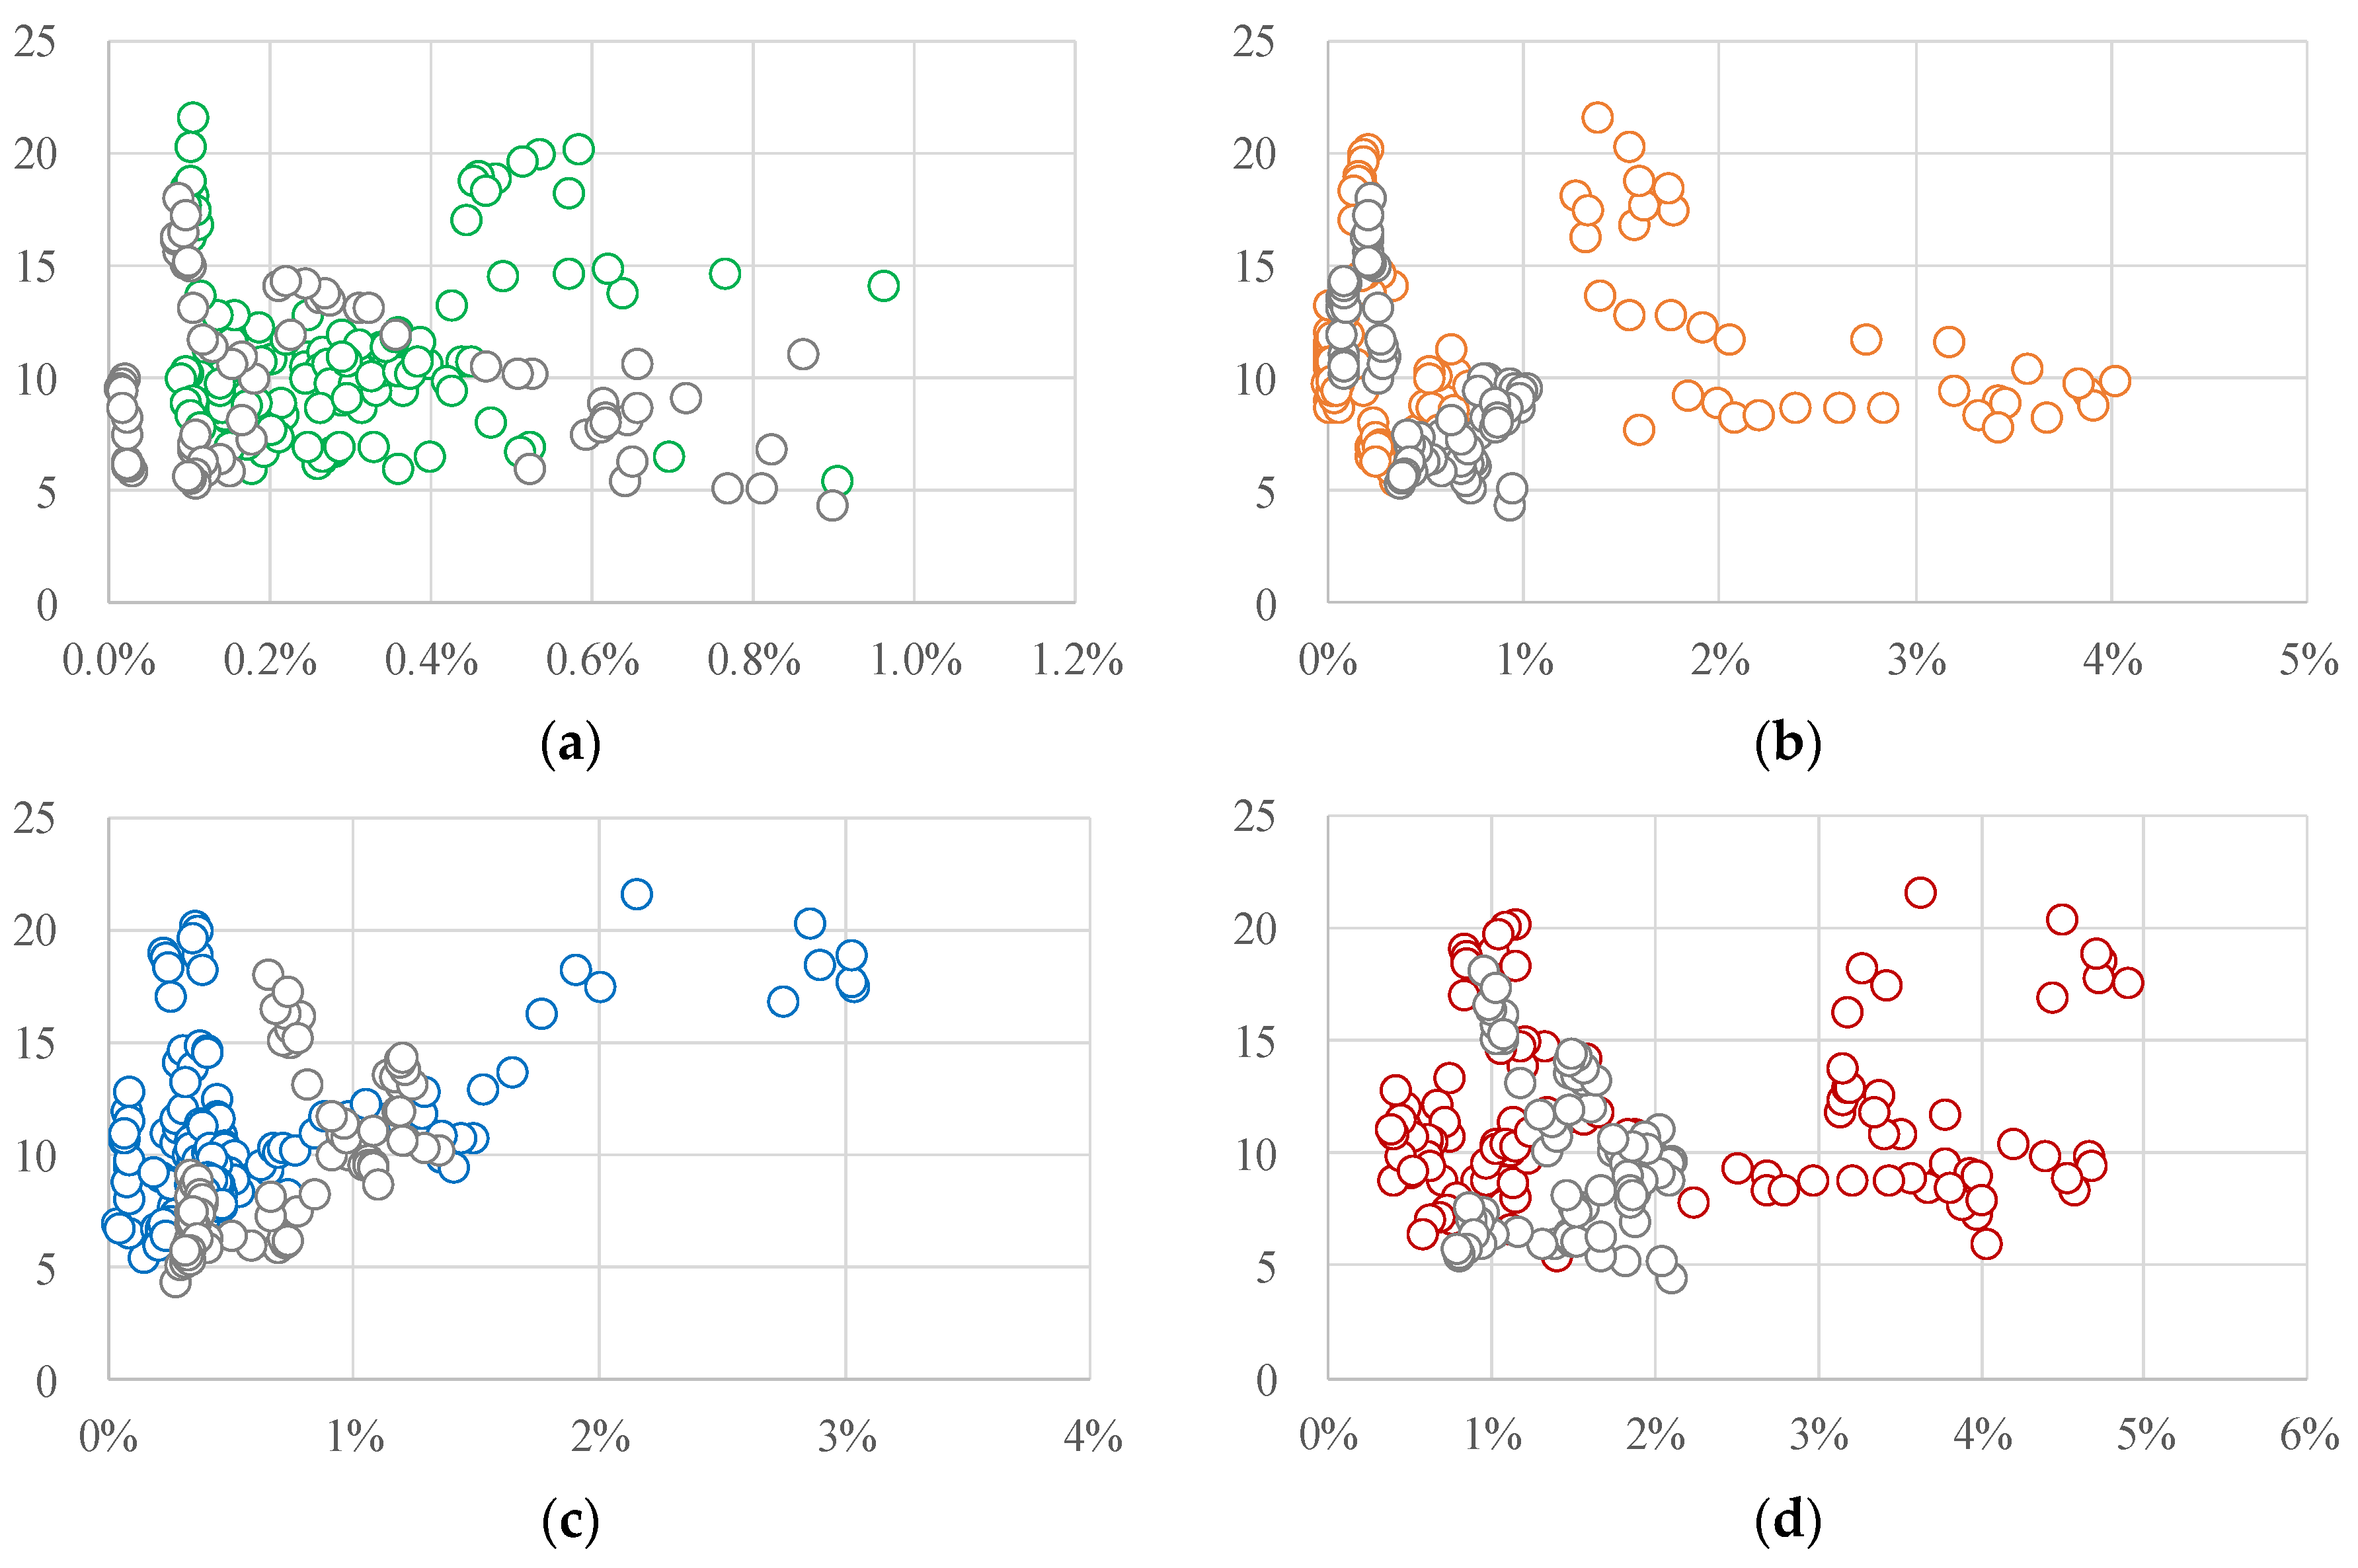
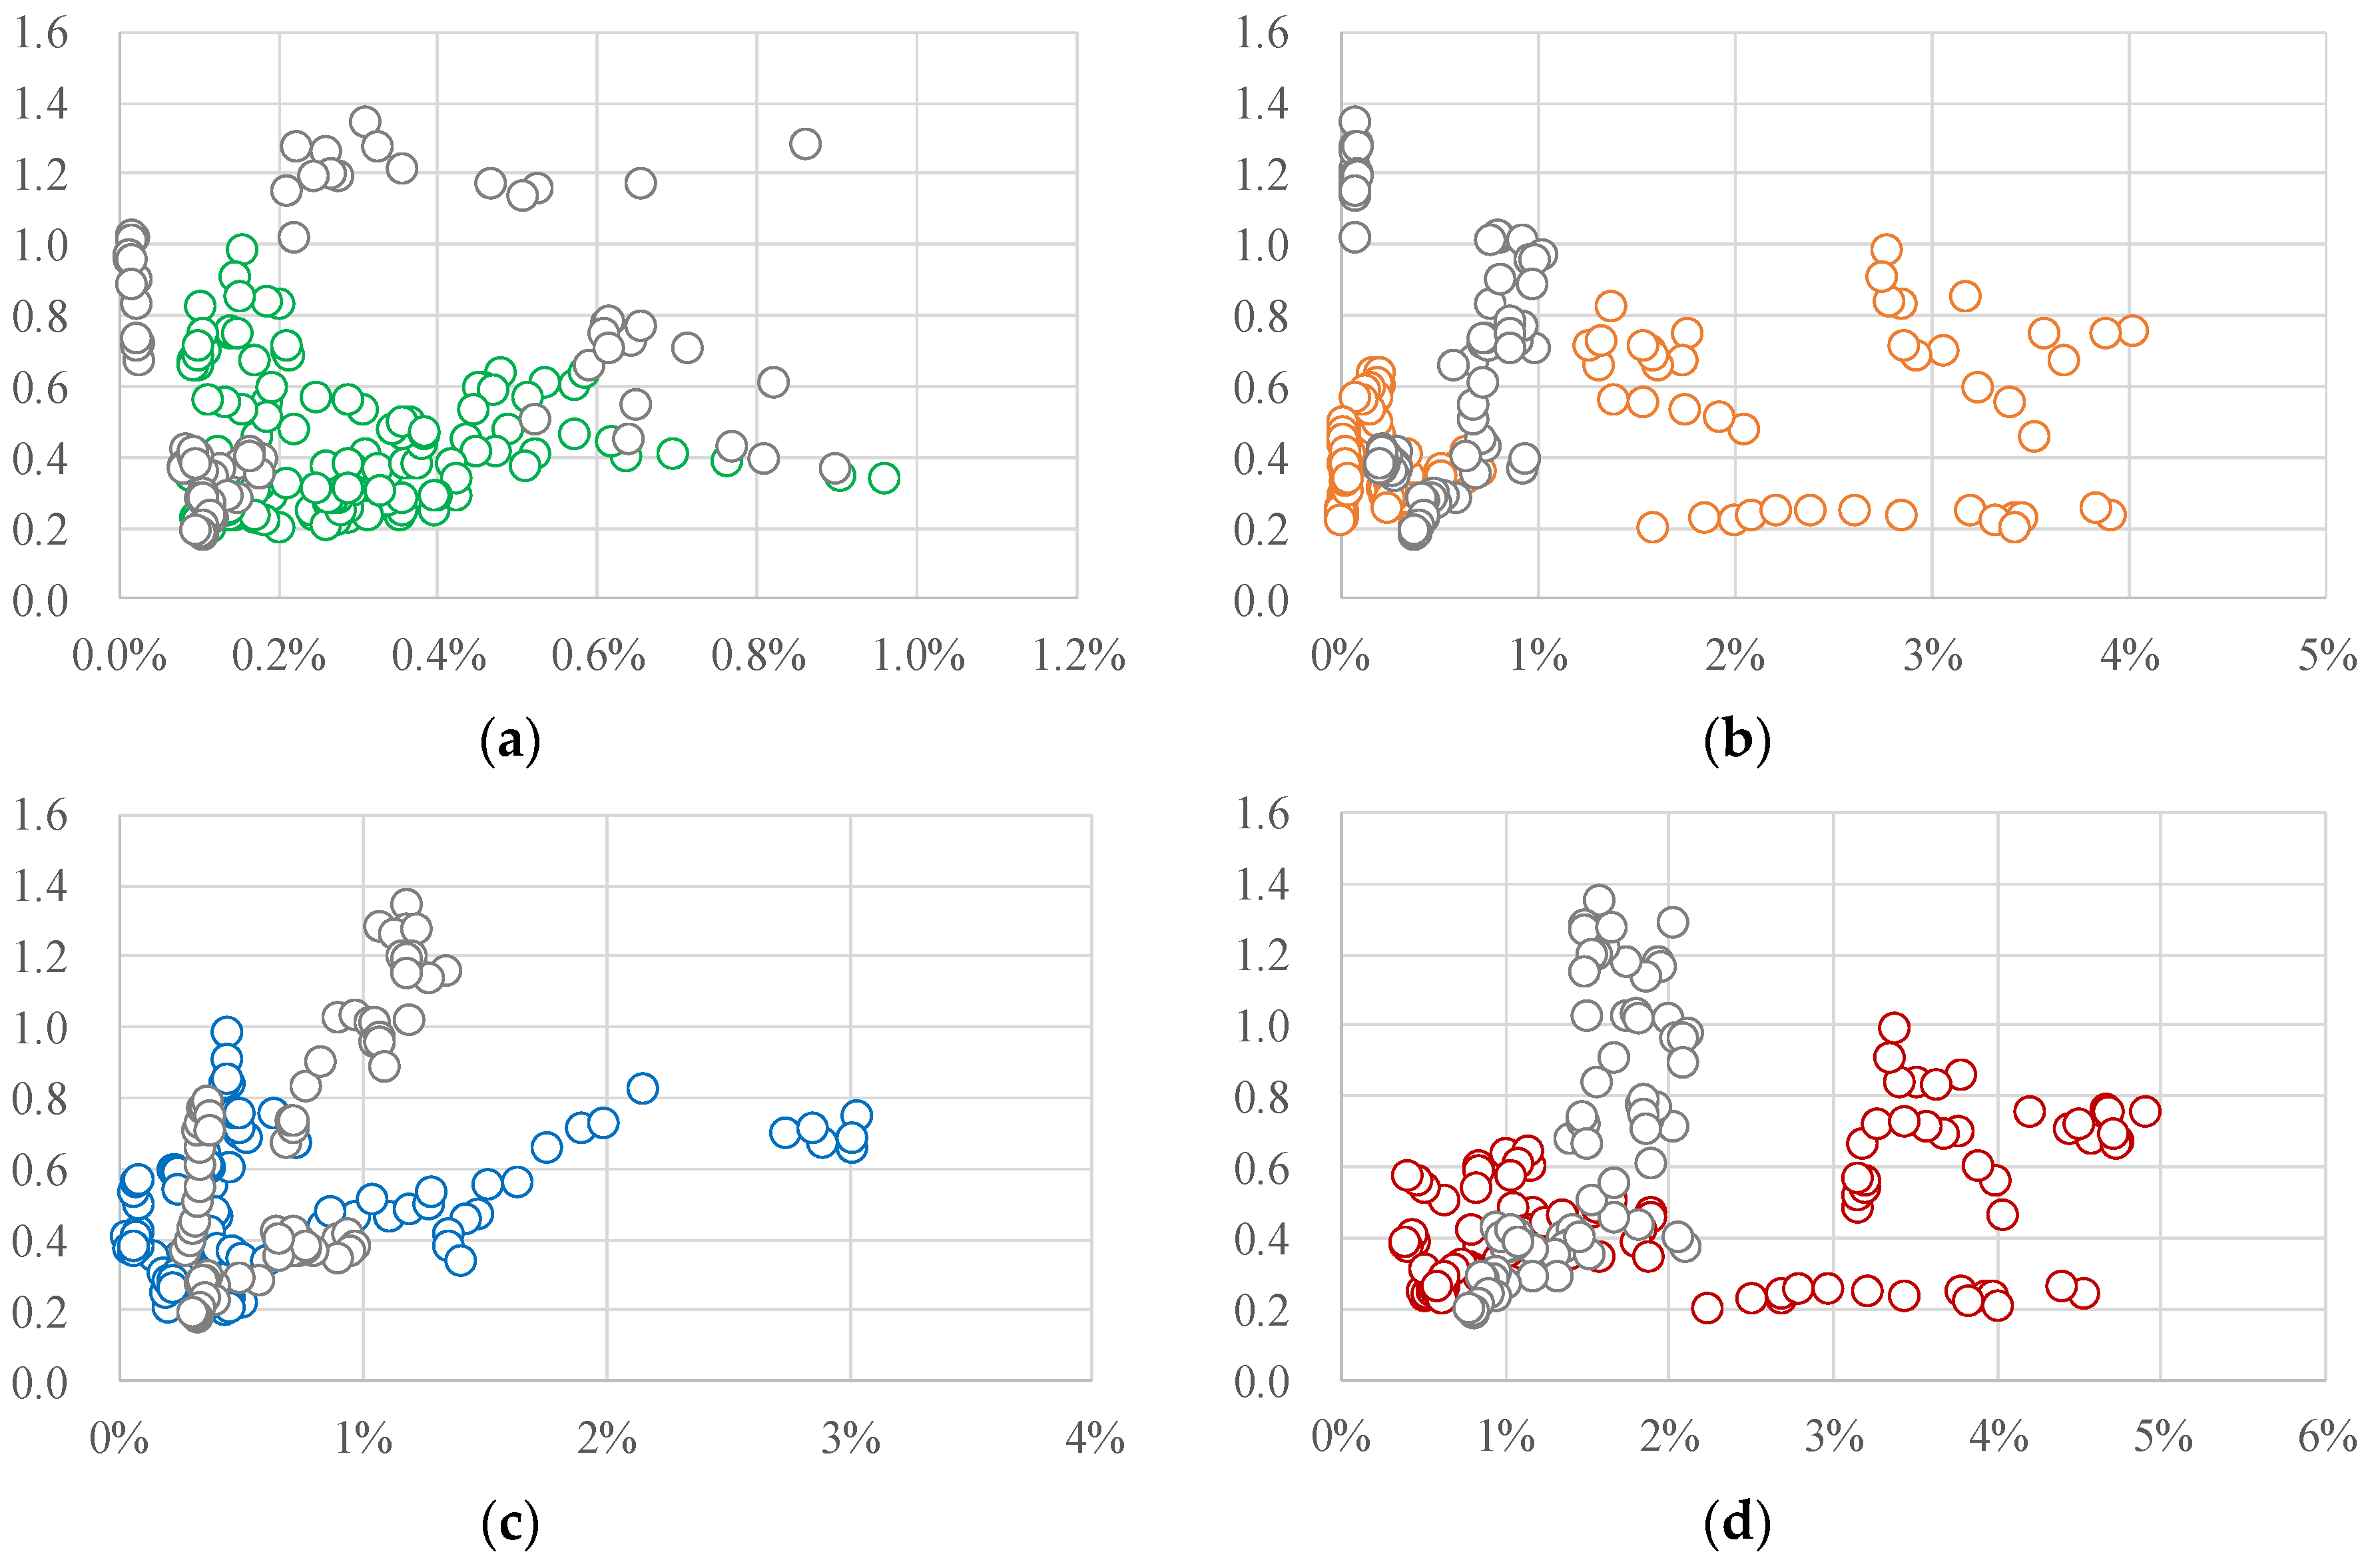
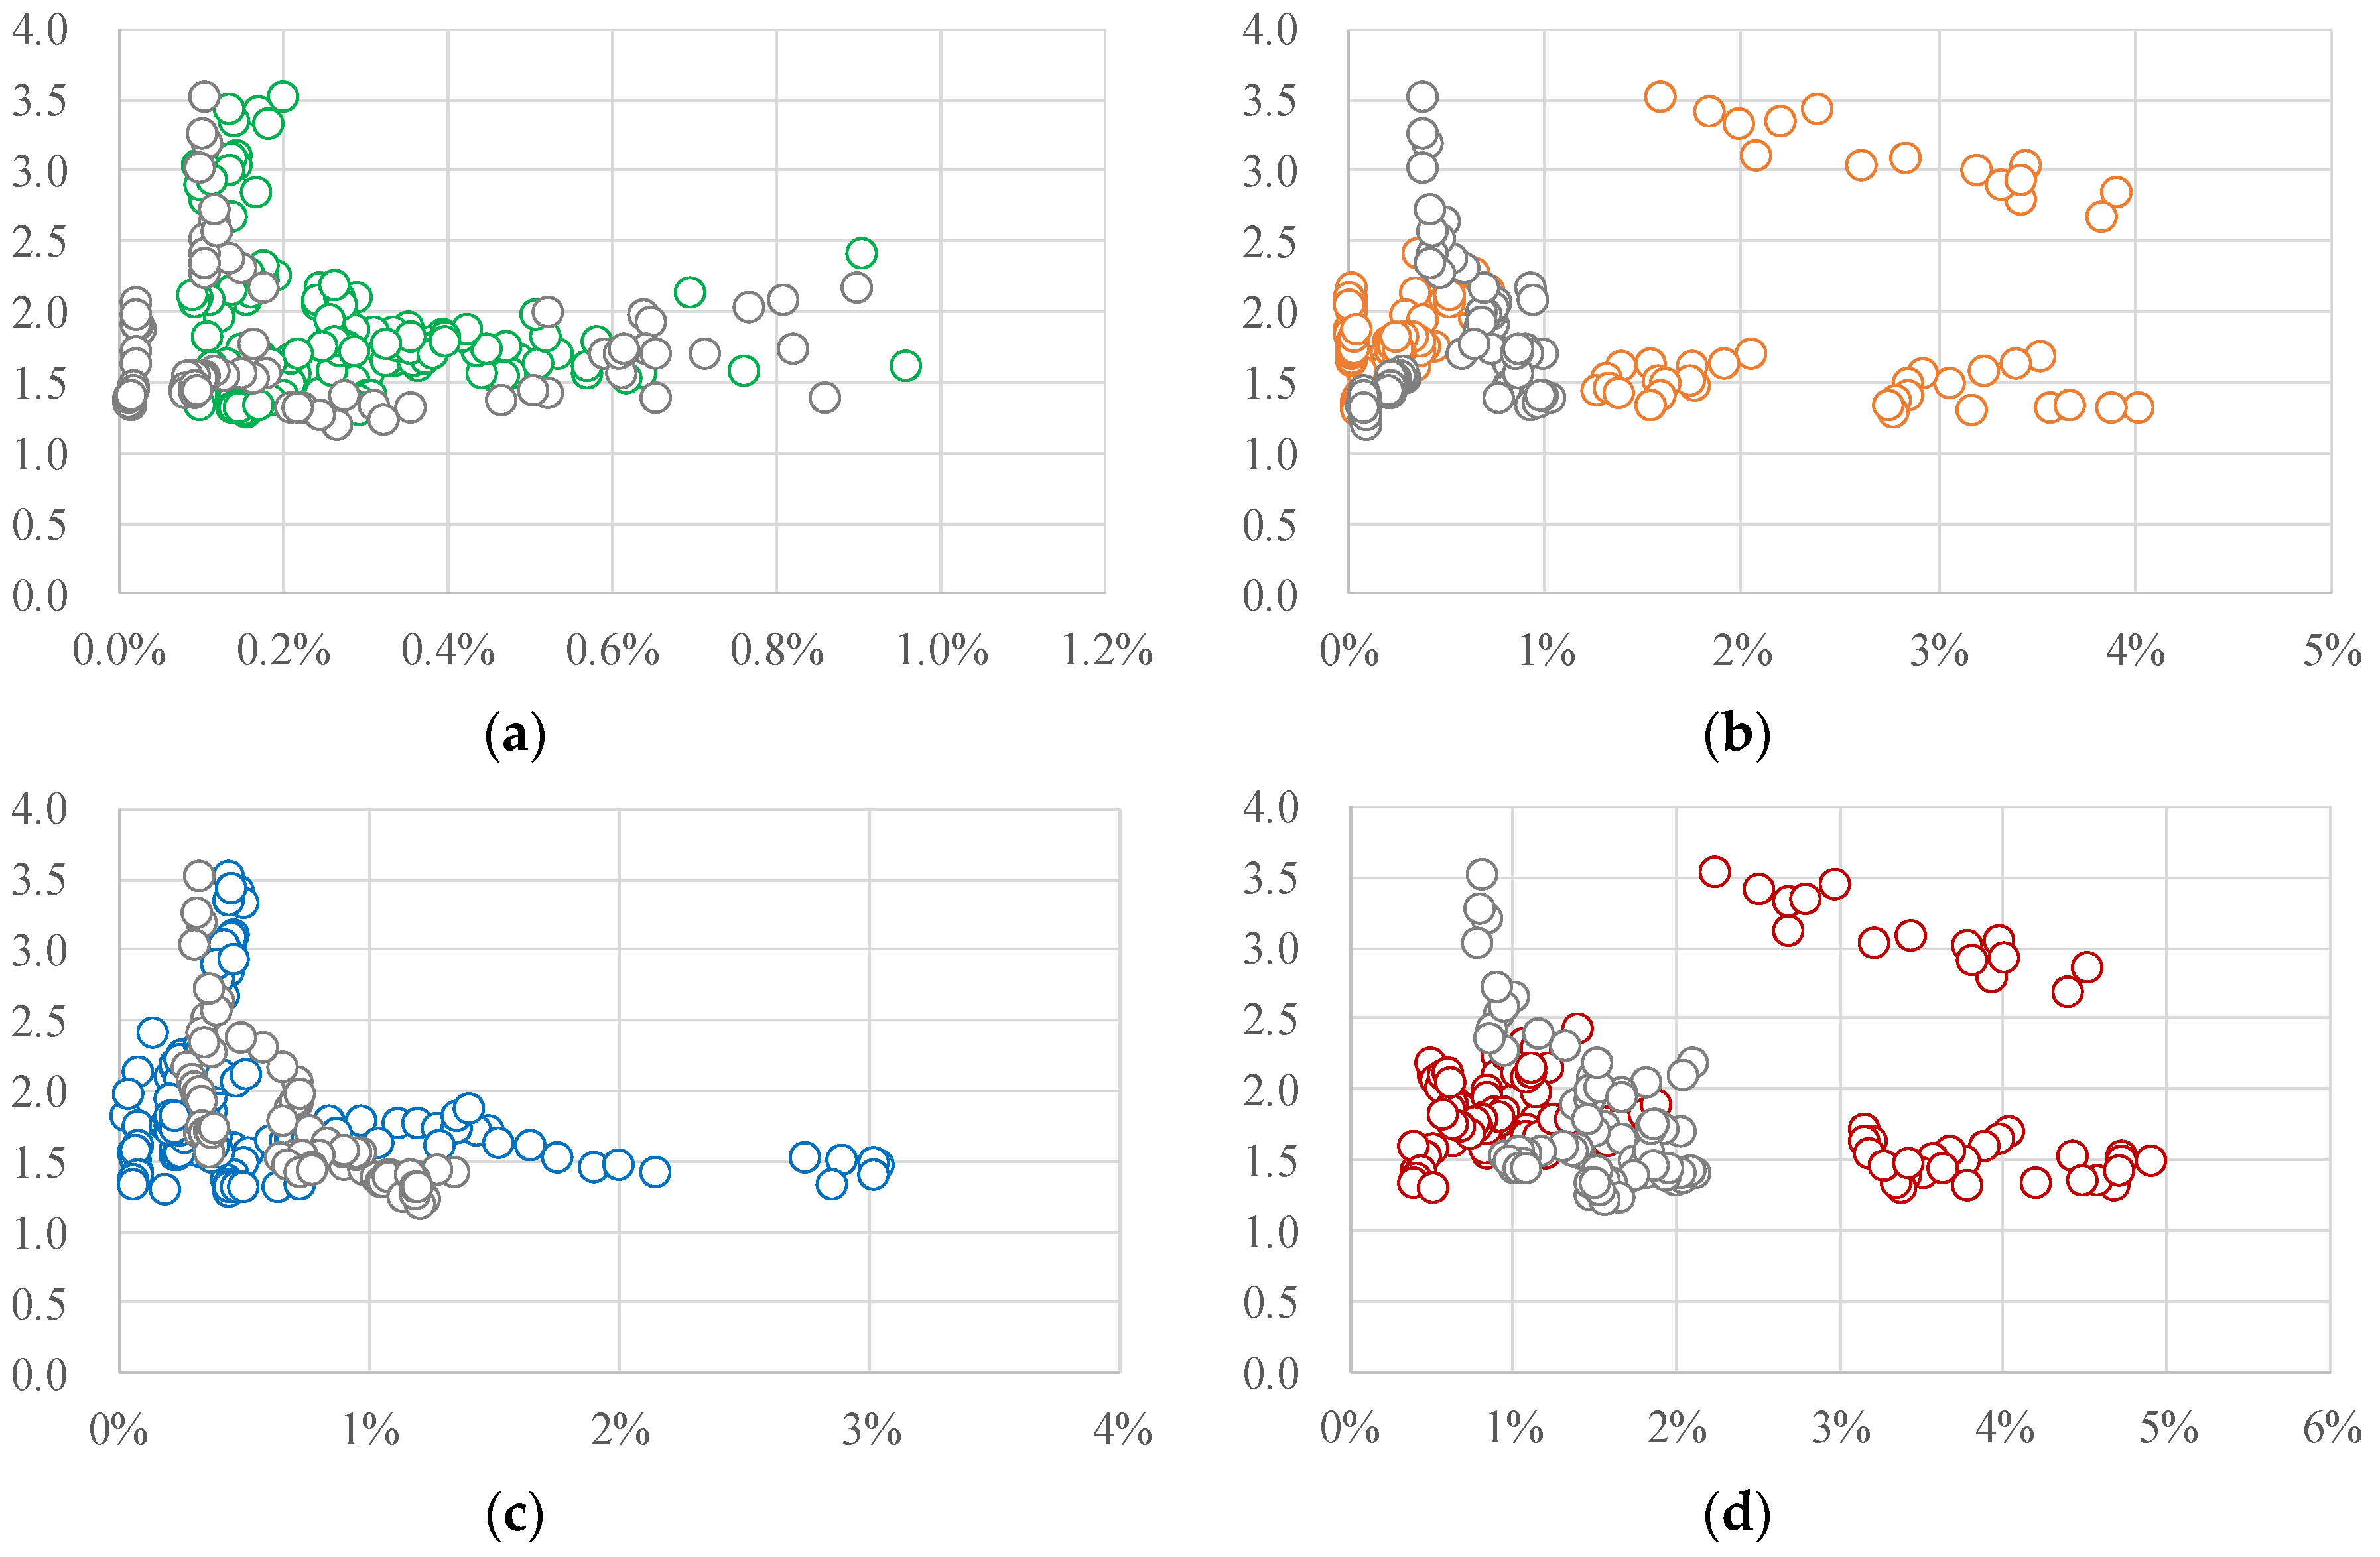
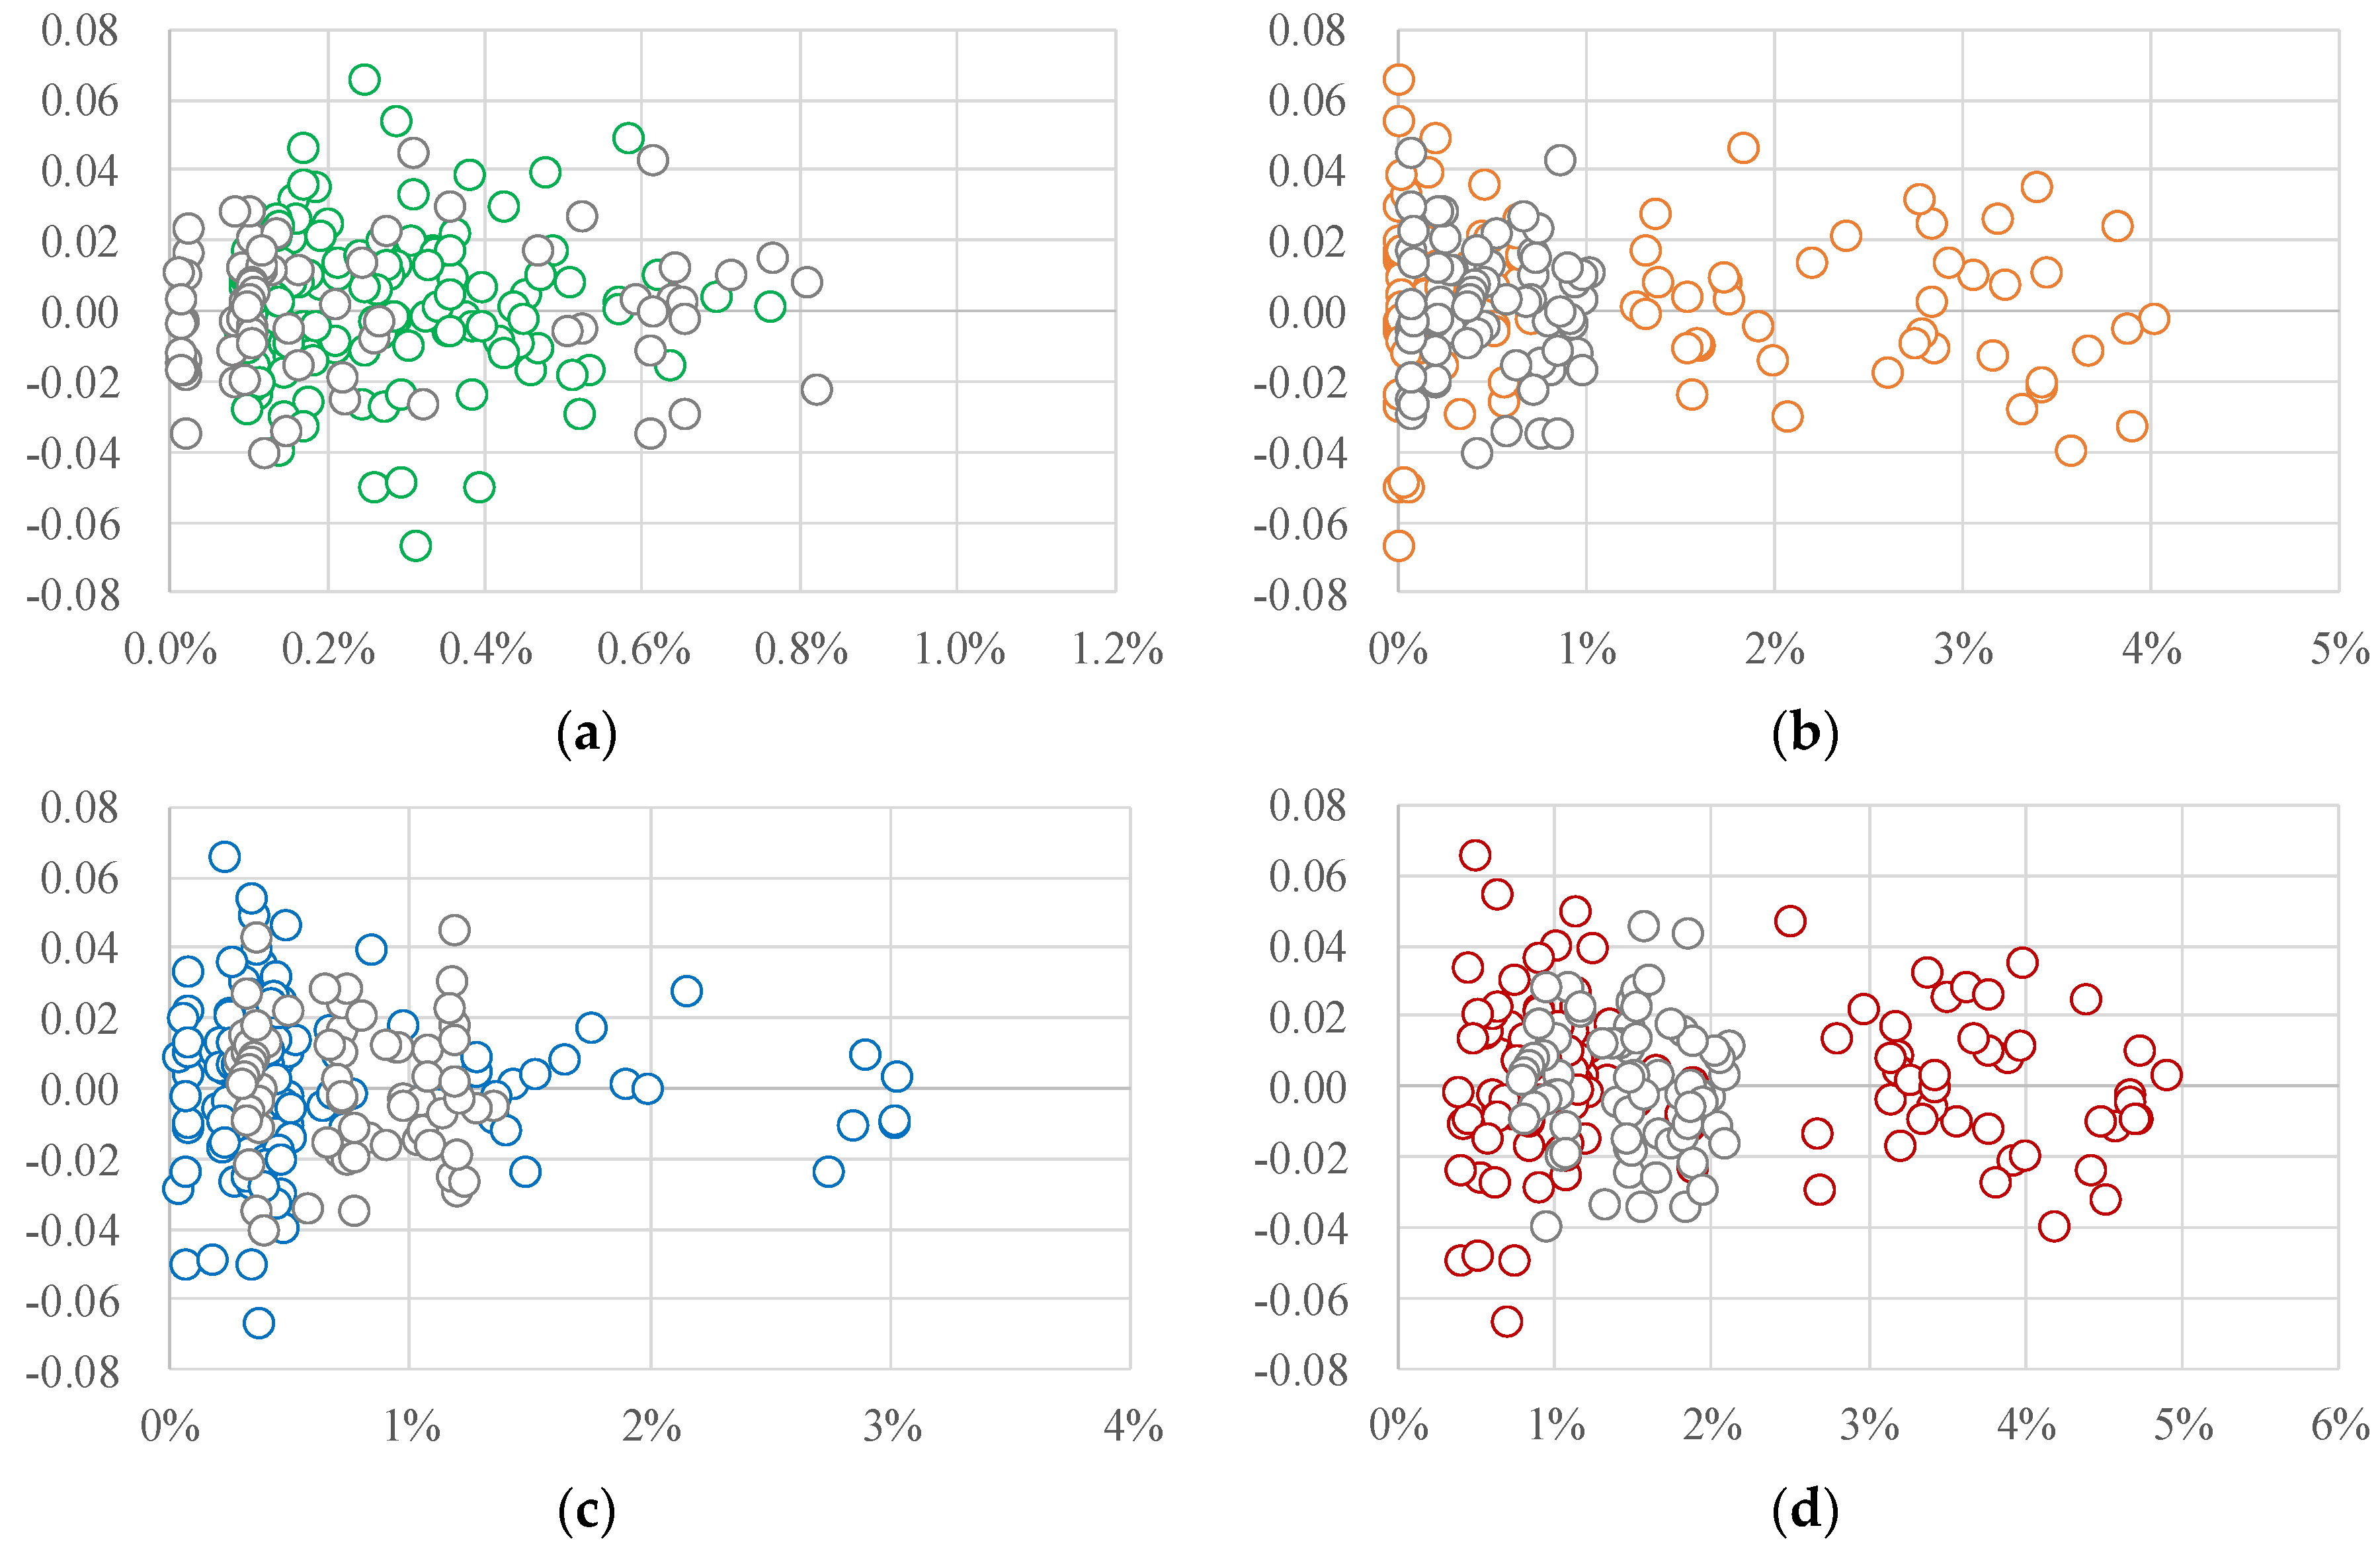
3.1. Bivariate Analysis of Productive Performance and ICT Capital

Figure 3, Figure 4, Figure 5 and Figure 6 present the relationships between the four performance indicators and the share of ICT capital stock. Each dot indicates pooled data on the energy sector in 14 countries from 2000 to 2014. The vertical axis shows the performance indicator and the horizontal axis shows the share of each type of ICT capital stock.
To compare the relationship between productive performance and ICT capital stock share among countries with different economic scales, this study divides the 14 countries into two groups. The first group comprises countries with a large economic scale. France, Germany, Italy, the U.K., and the U.S. are selected for this group. The other group comprises countries with a medium or small economic scale. Austria, the Czech Republic, Denmark, Finland, Luxembourg, the Netherlands, Slovenia, Spain, and Sweden are included in this group. These two groups are distinguished from one another by different colors in the scatter plot figure. Grey color is used to indicate the large-economic-scale group in each figure.
Figure 3 shows that the relationship between ICT capital and LP differs based on the type of technology. Figure 3a,b imply that there are negative relationships between LP and the shares of IT and CT capital. Meanwhile, Figure 3c implies that the share of software capital has a positive relationship with LP. These relationships are similar in both economic scale groups. Finally, Figure 3d indicates an ambiguous relationship between LP and the share of total ICT capital. These results indicate the importance of using not only total ICT capital data but also specific ICT capital data.
The ambiguous relationship between LP and total ICT capital should be investigated in more detail using specific ICT capital data because there are several possible explanations for it. One possibility is that each ICT capital stock has an ambiguous relationship with LP. Another possibility is that the effect of each type of ICT capital on LP is canceled out if the ICT capital data are integrated. In the former situation, there is an ambiguous relationship between LP and ICT capital. In the latter situation, the relationship between LP and each ICT capital share should be considered carefully. Otherwise, the estimation results might lead to a misleading discussion and policy implications.In addition to LP, CP is observed to have different relationships based on each type of ICT capital share. Figure 4 shows that there is a positive relationship between CP and software capital share (see Figure 4c), even though there is an ambiguous relationship with total ICT capital share (Figure 4d). Finally, Figure 5 and Figure 6 show the relationship of ICT capital with MP and TFP, respectively. In contrast to Figure 3 and Figure 4, there are similar trends in the four figures in Figure 5 and Figure 6, which show that there are diverse effects of ICT capital among the performance indicators. Additionally, there is no large difference between the economic scale groups. Based on these findings, this study further investigates the relationship between the performance indicators and ICT capital share using an econometric approach.

3.2. Determinant Analysis of the Productive Performance Indicators

Table 3, Table 4 and Table 5 present the results of the determinant analysis, focusing on the impact of ICT capital share on the productive performance indicators. Table 3 indicates the results of the determinant analysis that does not expressly consider the differences in the specific types of ICT capital. Table 4 shows the results of the determinant analysis that applies three ICT capital shares separately as determinant variables to consider the differences in specific ICT capital characteristics. In addition to the two models, this study applies the interaction term of each ICT capital share and the renewable energy share to investigate the hypothesis that the impact of ICT capital is different due to the degree of renewable energy diffusion (see Table 5).
The 2nd stage of the analysis includes the preferred specification from fixed effects or random effects based on the results of a Hausman test.
First, this study compares the impacts of specific ICT capital shares and the total ICT capital share on the productive performance indicators in Table 3 and Table 4. From Table 3, a significant effect of the total ICT capital share on CP and MP is not observed. Meanwhile, Table 4 shows that CT and software capital shares significantly affect CP, with different signs. Additionally, IT and CT capital shares significantly affect MP, with different signs. These results imply that the total ICT capital share does not significantly affect CP and MP because the effects of specific ICT capital shares are canceled out. This finding can be clarified if and only if specific ICT capital shares are applied separately to consider the differences in ICT capital characteristics, which is necessary to precisely understand the impact of ICT capital.

4. Discussion

This study discusses the impact of specific ICT capital shares on each productive performance indicator. Table 4 shows that IT and CT capital shares negatively affect LP. According to Biagi and Falk [25], IT capital and CT capital contribute to increasing LP in labor-intensive industries due to the reduction in transaction costs (e.g., smooth communication between employees). Meanwhile, the energy sector is a typical capital-intensive industry. Thus, the differences in industrial characteristics are one interpretation of the different results from those of the previous research.
Another finding is that the software capital share contributes to increasing the CP indicator even though the CT capital share negatively affects it (Table 4). According to Nagai et al. [11] and Paiho et al. [37], the software system contributes to improving CP by optimizing control and efficient capital utilization in the energy sector. Our results are consistent with those of these previous studies.
IT capital share contributes to increasing MP, while CT capital negatively affects MP. One interpretation of the positive contribution of IT capital share to MP is the increased incineration efficiency of fossil fuels due to the optimal control of resource utilization by sensing technology.
Finally, this study discusses the results of the determinant analysis model with the interaction terms in Table 5. From Table 5, the interaction terms of renewable energy with IT and CT capital shares significantly contribute to increasing CP. This result implies that the contribution effects of IT capital and CT capital are stronger in countries that achieve a high share of distributed energy systems. These findings have been introduced in previous results as case studies (e.g., References [26,27]), and our results empirically support this relationship using a panel dataset in 14 countries.
Notably, the determinant analysis with the interaction terms provides different information from the models without the interaction terms. From Table 4, a significant effect of the IT capital share on CP is not observed. Additionally, this study observes a significantly negative effect of the CT capital share on CP. These results mislead us to believe that IT and CT capital shares do not contribute to increasing CP in the energy sector if interaction terms are not applied. In recent years, the diffusion of renewable energy systems has become increasingly important to mitigate issues associated with climate change. To evaluate the impact of ICT capital under a widely diffused distributed energy system, a research framework with an interaction term between ICT capital and the renewable energy share is important.
In other words, these results indicate that ICT capital has an important role in managing distributed energy systems to increase CP. In particular, the interaction term of renewable energy and CT capital contributes to increasing CP even though the CT capital share negatively affects the three productive performance indicators. This result implies that the CT capital contributes more if an energy system is distributed.
An interpretation of this result is that decreasing the capital-labor ratio due to renewable energy penetration contributes to improving CP. To confirm this relationship, this study estimates the correlation between the capital-labor ratio and the share of solar photovoltaic and wind power generation using data on 14 countries from 2000 to 2014. The correlation score is 0.110 (p-value = 0.1130), which implies that there is no statistically significant relationship between renewable energy penetration and the capital-labor ratio in our dataset. Therefore, this study considers that renewable energy penetration contributes to improving productivity through the synergy effect with ICT utilization but does not decrease the capital-labor ratio.
Finally, this study does not observe a significant effect of ICT capital share on TFP in any of the estimation models. One interpretation of this result is that the main driver of technological progress in the energy sector is energy efficiency, which is determined by the field of engineering technology [38]. Therefore, the contribution of ICT, which supports technology for energy system management, is limited with regard to enhancing technological progress in the energy sector.

5. Conclusions

This study investigates the impact of information and communication technology in several ways using multiple productive performance indicators and data on three types of information and communication technology capital. The main results are summarized as follows.
Total information and communication technology capital do not significantly affect capital productivity and material productivity. Meanwhile, information technology and software capital contribute to increasing material productivity and capital productivity in the energy sector, respectively. On the other hand, communication technology capital negatively affects these two indicators. These results imply that the effects of specific types of information and communication technology capital are canceled out.
Another important finding is that the interaction term of renewable energy share with the information technology and communication technology capital shares significantly contributes to improving capital productivity. Meanwhile, information technology capital and communication technology capital negatively affect capital productivity when renewable energy diffusion is not considered. This result indicates the importance of a research framework that assumes that the impacts of information and communication technology capital on productive performance differ according to the degree to which there are renewable energy systems.
The limitation of this research is the detailed data (e.g., cost and investment) on specific information and communication technology capital. Further analysis with more detailed data regarding each technology is expected to compare the cost-effectiveness of different technologies in increasing the productivity of the energy sector.

Author Contributions

Conceptualization, H.F. and A.S.; methodology, H.F.; investigation, H.F.; writing—original draft preparation, H.F.; writing—review and editing, H.F., A.S., S.K., and S.M.

Funding

This research was funded by a Grant-in-Aid for Young Scientists (B) [JP17K12858] from the Ministry of Education, Culture, Sports, Science and Technology (MEXT), Japan.

Conflicts of Interest

The authors declare no conflict of interest.

References

  1. Basu, S.; Fernald, J. Information and communications technology as a general-purpose technology: Evidence from US industry data. Ger. Econ. Rev. 2007, 8, 146–173. [Google Scholar] [CrossRef]
  2. Kretschmer, T. Information and Communication Technologies and Productivity Growth: A Survey of the Literature; OECD Digital Economy Papers, No. 195; OECD Publishing: Paris, France, 2012. [Google Scholar]
  3. Bassanini, A.; Scarpetta, S. Growth, technological change, and ICT diffusion: Recent evidence from OECD countries. Oxf. Rev. Econ. Policy 2002, 18, 324–344. [Google Scholar] [CrossRef]
  4. OECD. OECD Compendium of Productivity Indicators 2015; OECD Publishing: Paris, France, 2015. [Google Scholar]
  5. OECD. OECD Compendium of Productivity Indicators 2018; OECD Publishing: Paris, France, 2018. [Google Scholar]
  6. Miller, B.; Atkinson, R.D. Raising European Productivity Growth through ICT; The Information Technology and Innovation Foundation: Washington, DC, USA, 2014. [Google Scholar]
  7. Kvochko, E. Five Ways Technology Can Help the Economy; World Economic Forum: Cologny, Switzerland, 2013. [Google Scholar]
  8. International Telecommunication Union. ICT for Energy: Telecom and Energy Working together for Sustainable Development; Telecommunication Development Bureau: Geneva, Switzerland, 2017. [Google Scholar]
  9. International Energy Agency. World Energy Investment 2018; IEA Publications: Paris, France, 2018. [Google Scholar]
  10. Information Technology Industry Council. Benefits of Information Communications Technology to Energy Infrastructure; Information Technology Industry Council: Washington, DC, USA, 2014. [Google Scholar]
  11. Nagai, K.; Murakami, M.; Oowada, K.; Fukumoto, T.; Sato, Y.; Matsubara, T. Energy infrastructure and ICT systems. Hitachi Rev. 2016, 65, 20–25. [Google Scholar]
  12. World Energy Council. The Role of ICT in Energy Efficiency Management; World Energy Council: London, UK, 2018. [Google Scholar]
  13. David, P.A. The dynamo and the computer: An historical perspective on the modern productivity paradox. Am. Econ. Rev. 1990, 80, 355–361. [Google Scholar]
  14. Jorgenson, D.W. Information technology and the U.S. Economy. Am. Econ. Rev. 2001, 91, 1–32. [Google Scholar] [CrossRef]
  15. Stiroh, K.J. Information technology and the US productivity revival: What do the industry data say? Am. Econ. Rev. 2002, 92, 1559–1576. [Google Scholar] [CrossRef]
  16. Polák, P. The productivity paradox: A meta-analysis. Inf. Econ. Policy 2017, 38, 38–54. [Google Scholar] [CrossRef]
  17. Edquist, H.; Henrekson, M. Do R&D and ICT affect total factor productivity growth differently? Telecommun. Policy 2017, 41, 106–119. [Google Scholar] [CrossRef]
  18. Strobel, T. ICT intermediates and productivity spillovers-evidence from German and US manufacturing sectors. Struct. Chang. Econ. Dyn. 2016, 37, 147–163. [Google Scholar] [CrossRef]
  19. Ceccobelli, M.; Gitto, S.; Mancuso, P. ICT capital and labour productivity growth: A non-parametric analysis of 14 OECD countries. Telecommun. Policy 2012, 36, 282–292. [Google Scholar] [CrossRef]
  20. Wissner, M. ICT, growth and productivity in the German energy sector-on the way to a smart grid? Util. Policy 2011, 19, 14–19. [Google Scholar] [CrossRef]
  21. Naveed, K.; Watanabe, C.; Neittaanmäki, P. The transformative direction of innovation toward an IoT-based society-increasing dependency on uncaptured GDP in global ICT firms. Technol. Soc. 2018, 53, 23–46. [Google Scholar] [CrossRef]
  22. Managi, S.; Guan, D. Multiple disasters management: Lessons from the Fukushima triple events. Econ. Anal. Policy 2017, 53, 114–122. [Google Scholar] [CrossRef]
  23. OECD. Green Growth Indicators 2017; OECD Publishing: Paris, France, 2017. [Google Scholar]
  24. OECD. OECD Digital Economy Outlook 2015; OECD Publishing: Paris, France, 2015. [Google Scholar]
  25. Biagi, F.; Falk, M. The impact of ICT and e-commerce on employment in Europe. J. Policy Model. 2017, 39, 1–18. [Google Scholar] [CrossRef]
  26. Trillo-Montero, D.; Santiago, I.; Luna-Rodriguez, J.J.; Real-Calvo, R. Development of a software application to evaluate the performance and energy losses of grid-connected photovoltaic systems. Energy Convers. Manag. 2014, 81, 144–159. [Google Scholar] [CrossRef]
  27. Nijhuis, M.; Gibescu, M.; Cobben, J.F.G. Assessment of the impacts of the renewable energy and ICT driven energy transition on distribution networks. Renew. Sustain. Energy Rev. 2015, 52, 1003–1014. [Google Scholar] [CrossRef]
  28. Baptist, S.; Hepburn, C. Intermediate inputs and economic productivity. Philos. Trans. A Math. Phys. Eng. Sci. 2013, 371, 20110565. [Google Scholar] [CrossRef]
  29. Comin, D. Total factor productivity. In The New Palgrave Dictionary of Economics; Macmillan, P., Ed.; Palgram Macmillan: London, UK, 2008; pp. 1806–1877. [Google Scholar]
  30. Elgin, C.; Çakır, S. Technological progress and scientific indicators: A panel data analysis. Econ. Innov. New Technol. 2015, 24, 263–281. [Google Scholar] [CrossRef]
  31. Chambers, R.G.; Chung, Y.; Färe, R. Profit, directional distance functions, and nerlovian efficiency. J. Optim. Theory Appl. 1998, 98, 351–364. [Google Scholar] [CrossRef]
  32. Luenberger, D.G. Benefit functions and duality. J. Math. Econ. 1992, 21, 461–481. [Google Scholar] [CrossRef]
  33. United Nations Statistics Division. International Standard Industrial Classification of All Economic Activities Revision 4; United Nations Statistics Division: New York, NY, USA, 2008. [Google Scholar]
  34. Timmer, M.P.; Dietzenbacher, E.; Los, B.; Stehrer, R.; de Vries, G.J. An illustrated user guide to the world input–output database: The case of global automotive production. Rev. Int. Econ. 2015, 23, 575–605. [Google Scholar] [CrossRef]
  35. Banker, R.D.; Charnes, A.; Cooper, W.W.; Swarts, J.; Thomas, D. An introduction to data envelopment analysis with some of its models and their uses. Res. Gov. Nonprofit Account. 1989, 5, 125–163. [Google Scholar]
  36. Jäger, K. EU KLEMS Growth and Productivity Accounts 2017 Release—Description of Methodology and General Notes; The Conference Board: New York, NY, USA, 2018. [Google Scholar]
  37. Paiho, S.; Saastamoinen, H.; Hakkarainen, E.; Similä, L.; Pasonen, R.; Ikäheimo, J.; Rämä, M.; Tuovinen, M.; Horsmanheimo, S. Increasing flexibility of Finnish energy systems-a review of potential technologies and means. Sustain. Cities Soc. 2018, 43, 509–523. [Google Scholar] [CrossRef]
  38. Johnstone, N.; Managi, S.; Rodríguez, M.C.; Haščič, I.; Fujii, H.; Souchier, M. Environmental policy design, innovation and efficiency gains in electricity generation. Energy Econ. 2017, 63, 106–115. [Google Scholar] [CrossRef]
Figure 1. The investment trend related to the energy sector. (a) Investment by global power sector; (b) Corporate investment in new energy technology companies, by sector of investing company. (Source: IEA World Energy Investment 2018).
Energies 12 01786 g001
Figure 2. The research framework for this study.
Energies 12 01786 g002
Figure 3. The scatter plot of labor productivity (LP) and information and communications technology (ICT) capital share. (a). Information Technology (IT) capital share; (b). Communication technology (CT) capital share; (c). Software capital share; (d). Share of total ICT capital. Note: The vertical axis shows the LP and the horizontal axis shows the capital share in gross capital stock. Grey color represents countries with a large economic scale.
Energies 12 01786 g003
Figure 4. The scatter plot of capital productivity (CP) and ICT capital share. (a). IT capital share; (b). CT capital share; (c). Software capital share; (d). Share of total ICT capital. Note: The vertical axis shows the CP and the horizontal axis shows the capital share in gross capital stock. Grey color represents countries with a large economic scale.
Energies 12 01786 g004
Figure 5. The scatter plot of material productivity (MP) and ICT capital share. (a). IT capital share; (b). CT capital share; (c). Software capital share; (d). Share of total ICT capital. Note: The vertical axis shows the MP and the horizontal axis shows the capital share in gross capital stock. Grey color represents countries with a large economic scale.
Energies 12 01786 g005
Figure 6. The scatter plot of the total factor productivity (TFP) change and ICT capital share. (a). IT capital share; (b). CT capital share; (c). Software capital share; (d). Share of total ICT capital. Note: The vertical axis shows the TFP change and the horizontal axis shows the capital share in gross capital stock. Grey color represents countries with a large economic scale.
Energies 12 01786 g006
Table 1. The description of data variables for the 1st step of estimation (productivity analysis).
Data CategoryData VariableUnitMean ValueStd. dev.Min.Max.
Output variableGross outputMillionU.S. $57,453108,921321999,835
Input variableLabor compensationMillionU.S. $5,92111,8413777,550
Capital stockMillionU.S. $145,438313,2948442,050,479
Intermediate material costMillionU.S. $36,33175,793147796,417
Countries
(42)
Australia, Austria, Belgium, Brazil, Bulgaria, Canada, China, Croatia, Cyprus, Czech Republic, Denmark, Estonia, Finland, France, Germany, Greece, Hungary, India, Indonesia, Ireland, Italy, Japan, Korea, Latvia, Lithuania, Luxembourg, Mexico, Netherlands, Norway, Poland, Portugal, Romania, Russia, Slovakia, Slovenia, Spain, Sweden, Switzerland, Turkey, Taiwan, United Kingdom, United States
Source: Figure created by the author using the World Input-Output Database (WIOD) [34].
Table 2. The description of data variables for the 2nd step of estimation (determinant analysis).
Data CategoryData Variable (Code)UnitMeanStd. dev.Min.Max.
Dependent variable
(Productivity indicator)
Labor productivity (LP)$/$10.3693.7134.24021.470
Capital productivity (CP)$/$0.5110.2820.1801.340
Material productivity (MP)$/$1.8300.5091.1803.510
Total factor productivity (TFP)-0.0010.020-0.0680.065
Independent variableICT capital stock share (ICT)%1.7441.1550.4004.920
IT capital stock share (IT)%0.2760.2040.0200.960
CT capital stock share (CT)%0.8131.0250.0104.030
Software capital stock share (Soft)%0.6560.5650.0503.040
R&D capital stock share (R&D)%0.9242.4000.00014.610
Share of solar photovoltaic and wind power generation (Renewable)%1.9633.0600.00015.840
Electricity price index (Price)-80.36416.74342.400115.200
Countries
(14)
Austria, Czech Republic, Denmark, Finland, France, Germany, Italy, Luxembourg, Netherlands, Slovenia, Spain, Sweden, United Kingdom, United States
Table 3. The results of the determinant analysis using integrated information and communications technology (ICT) capital data.
Dependent VariableLPCPMPTFP
Coef.SigCoef.SigCoef.SigCoef.Sig
ICT−90.60***−0.63-−5.49-−0.01-
R&D−27.23***−2.08***4.30***−0.07-
Price0.04***0.00**−0.00-−0.00***
Renewable35.37***0.77**−1.89**−0.04-
Constant8.12***0.44***2.06***0.02***
Observation210210210196
Within0.4630.2240.2030.060
Between0.0400.1490.0000.222
Overall0.1130.0470.0120.061
Wald chi2166.99051.62048.41012.490
Prob > chi20.0000.0000.0000.014
Note: *** and ** indicate significance at the 1 and 5% levels, respectively. The random effect model is applied for all estimations.
Table 4. The results of the determinant analysis using individual ICT capital data.
Dependent VariableLPCPMPTFP
Coef.SigCoef.SigCoef.SigCoef.Sig
IT−350.15***−9.56-71.38***−0.54-
CT−119.79***−4.19**−23.47***0.00-
Software56.01-9.41***−3.09-−0.12-
R&D−25.11***−1.90***4.55***−0.09-
Price0.04***0.00***0.00-−0.00***
Renewable22.42***−0.15-−2.40***−0.04-
Constant8.69***0.44***1.70***0.03***
Observation210210210196
Within0.4920.2770.3070.066
Between0.1590.0010.0540.170
Overall0.2290.0110.0180.064
Wald chi2 / F-value188.21070.39014.01012.850
Prob > chi2 / Prob > F0.0000.0000.0000.045
Note: *** and ** indicate significance at the 1 and 5% levels, respectively. The fixed effect model is applied for the model with the MP.
Table 5. The results of the determinant analysis using individual ICT capital with interaction terms.
Dependent VariableLPCPMPTFP
Coef.SigCoef.SigCoef.SigCoef.Sig
IT−245.66*−15.80**64.35***−0.84-
CT−128.26***−9.73***−22.02***0.09-
Software83.95-10.68**−27.52***−0.34-
R&D−23.35***−2.13***3.65***−0.09-
Price0.04***0.00-0.00*−0.00***
Renewable36.33***−1.12*−5.44***−0.16-
IT*Renewable−7,540.18**598.92***329.89-28.52-
CT*Renewable776.87-203.60***−81.32-−7.87-
Software*Renewable648.79-−101.97***259.97***9.45-
Constant8.02***0.52***1.87***0.03***
Observation210210210196
Within0.4970.4040.3470.077
Between0.2610.0010.0100.168
Overall0.3070.0150.0000.070
Wald chi2 / F-value180.11014.11011.03014.050
Prob > chi2 / Prob > F0.0000.0000.0000.121
Note: ***, **, and * indicate significance at the 1, 5, and 10% levels, respectively. The fixed effect model is applied for the model with CP and MP.

