1. Introduction
Japan’s Prime Minister, Shinzo Abe, has recently proposed a new economic policy, referred to as “Abenomics,” which suggests various directions for Japanese productivity improvements. A report prepared by McKinsey and Company [
1] has discussed a guidance regarding the Japanese industrial direction.
Acknowledging the importance of such a new policy direction, we have two major concerns. One of them is that Japan has been gradually losing productivity growth in manufacturing industries. The Japanese firms are now facing fierce competition with overseas firms. The Japanese manufacturing sectors need to improve their productivity. See a report by Nissay Asset Management [
2]. The other concern is that Japan has historically faced various environmental problems along with its industrialization.
Besides the two concerns, the participation in international agreements on pollution prevention (e.g, the Kyoto protocol in 1997 and the Paris agreement in 2016) provide the Japanese government with an official excuse on strict regulation, in particular on greenhouse gas (GHG) emission. A policy drawback of the Abenomics is that it does not explicitly discuss the policy necessity in addressing environmental pollution associated with economic activity and growth of industries. Saito [
3] has discussed the business direction of Japanese manufacturing sectors.
In discussing the current policy issues from Japanese sustainability, this study conducts an empirical investigation concerning the manufacturing industries. We use data envelopment analysis (DEA) that can provide us with a total performance measure on operational and environmental attainments. The method was first proposed by Charnes et al. [
4]. For additional references, see Glover and Sueyoshi [
5] and Sueyoshi and Goto [
6]. The latter provides a detailed historical review on the method.
This research uses DEA for our empirical purpose since it can avoid a specifying error to decide a functional form between production factors (i.e., inputs and outputs). The method provides a multi-dimensional productivity measurement. In DEA, the term of “efficiency” is specified by a percentage expression and it is used to measure a total productivity level that is different from a single performance measure such as “labor productivity”.
The purpose of this research is to measure the performance of Japanese manufacturing industries by Data Envelopment Analysis (DEA). To investigate our research concern, discussed above, we first restructure the method in the manner that it can measure their achievements on operational and environmental attainments. Then, we apply it to the Japanese industries and then discuss business implications obtained from the proposed application.
The remainder of this study is organized as follows:
Section 2 summarizes a literature study related to this research.
Section 3 discusses underling concepts used for the DEA assessment on industrial sectors.
Section 4 describes DEA’s analytical structure.
Section 5 reorganizes the method so that we can use the new approach for our empirical study.
Section 6 applies the new formulations for measuring the performance of Japanese manufacturing industries.
Section 7 concludes this study along with addressing future research tasks. The end of this article lists all abbreviations and variables used in the article.
2. Literature Summary
Previous studies on DEA applied to Japanese pollution prevention are classified into the following three groups:
The first group discussed DEA environmental assessment applied to Japanese industries. The group started with Sueyoshi and Goto [
7]. Their study applied DEA to assess the performance of Japanese manufacturing industries. The research indicated that large firms had financial and managerial capabilities to improve their environmental attainments because of their capital accumulations. However, the study could not find the similar business linkage in small and medium companies. Sueyoshi and Goto [
8] applied DEA for comparison between Japanese Chemical and Pharmaceutical industries. The research investigated their scale measures (i.e., returns to scale (RTS) and damages to scale (DTS)). Finally, Sueyoshi and Goto [
9] conducted comparisons between Japanese manufacturing and service industries. They concluded that the former outperformed the latter in their efficiencies.
The second group contained various studies on statistics and econometrics applied to Japanese industries. The group used DEA and traditional measures (e.g., total-factor productivity). The group was interested in performance assessment on many types of industrial sectors that utilized input resources to yield outputs, but often excluded pollution in their assessments. The group included Honma [
10] which discussed total-factor energy efficiency measurement regarding the Japanese regional economics. Sueyoshi et al. [
11] discussed a corporate governance issue from operational performance in the manufacturing industries. Oggioni et al. [
12] measured the environmental efficiency of the world’s cement industries, including the Japanese ones. Wen et al. [
13] proposed an asset based business model for sustainability competitiveness and applied it to examining the Japanese semi-conductor industry. Goto et al. [
14] discussed the deregulation issue between generation and transmission in the Japanese electric power industry. Sotome and Takahashi [
15] indicated that Japanese employment systems influenced corporate productivity. They also discussed that their employment systems harmed the productivity improvements. Honma and Hu [
16] discussed the total-factor energy efficiency in developed countries by comparing them with Japanese ones.
The third group was related to the energy and the environment. Sueyoshi et al. [
17] contained 693 articles on DEA applications on energy improvement and environment protection. Sueyoshi and Goto [
6] also included approximately 800 peer reviewed articles that discussed a use of DEA for environmental advancement and sustainability enhancement. Since both [
6] and [
17] summarize a long list of previous studies, this research does not need to specify them, except noting two findings on DEA applications. First, the electric power industry is the main research target in the early stage of DEA applications due to data accessibility to the industry. Second, the research on energy is classified into (a) electricity, (b) oil, (c) coal, (d) gas, (e) heat, (f) renewable and (g) energy efficiency and saving. The previous works on energy included 4 articles in the 1980s, 20 articles in the 1990s, 94 articles in the 2000s and 289 articles in the 2010s. Meanwhile, the environment and sustainability included 1 article in the 1980s, 6 articles in the 1990s, 41 articles in the 2000s and 222 articles in the 2010s. The applications in the two areas have been rapidly increasing during the past four decades.
This study methodologically belongs to the first and the third research groups. The DEA application belongs to the second group, but this study utilizes the method differently from the previous one used in the second group.
The proposed approach has four unique features. First, this research classifies outputs into two categories (i.e., desirable and undesirable). Then, we combine them for DEA-based performance assessment. Second, this study discusses how to identify a possible occurrence of undesirable congestion (UC, i.e., a limit on production) and that of desirable congestion (DC, i.e., eco-technology). Third, we reorganize DEA formulations under an occurrence of DC under the assumption that “undesirable outputs are the by-products of desirable outputs”. Lastly, this study discusses an analytical rationale concerning why we can examine DC in the DEA environmental assessment.
3. Concepts
This section prepares underlying concepts for the methodological development used in this study.
3.1. Disposability
To examine the performance of Japanese manufacturing industries, this study introduces two disposability concepts, where each concept implies the elimination of inefficiency. One of them is “natural disposability” where the priority is economic success. The other is “managerial disposability” whose priority is pollution reduction.
To describe how we include the two disposability concepts in this research, we consider as an input vector with m components, as a desirable output vector with s components, and as an undesirable output vector with h components. The subscript (j) indicates the j th decision making unit (DMU), whose components are strictly positive. Those components are specified by x, g and b.
Natural (N) disposability and managerial (M) disposability expresses unified production and pollution possibility sets as follows:
indicates the set for natural disposability. Meanwhile,
is that of managerial disposability. The subscript (v) implies variable RTS or DTS. The two axiomatic expressions incorporate the addition constraint (
) to express the variability on RTS or DTS. A difference between them is that the production technology under natural disposability has
. The constraint implies that DMUs attempt to attain an efficiency frontier by reducing
X. In contrast, the managerial disposability has an opposite direction of
X in the constraint of
.
3.2. Disposability Unification
The proposed assessment needs to classify outputs into desirable (good) and undesirable (bad) categories in this research because they are different in terms of their vector directions. After the output separation, we need to develop a conceptual guideline and its related computational process for unification.
Figure 1, separated from I to III, visually indicates the unification process. The three processes (I, II and III) are later integrated into the proposed DEA approach. The figure depicts a case of a single component of those vectors. Later, we extend the case to the case of multiple components in our framework.
The first process (I) has two sub-processes: (A) and (B). Process I (A) shows the relationship between x and g. In this process, all DMUs have the same amount of b. The production possibility set (PrPS) locates below a curve, depicting an efficiency frontier (EFg), in the x-g space. Most previous DEA investigations have considered the assessment within the PrPS. In the region, a DMU needs to decrease or maintain the current level of x for performance improvement along with an increase of g. Process I (A) depicts such a basis for measuring all conventional applications.
In environmental assessment, this research is conceptually different from the conventional DEA efforts. Such a difference may be found in Process I (B). A pollution possibility set (PoPS) locates above the curve, expressing an efficiency frontier (EFb), in the x-b space. In this case, all DMUs produce the same amount of g. In depicted Process I (B), we consider that the PoPS is independent from the PrPS. The relationship between them is different from the reality of modern business because b may not exist without g.
Next, Process II unifies the two sets of Process I. In the process, the vertical axis indicates g and b. The unification process identifies a region for production and pollution possibility set (Pr&PoPS) between EFg and EFb. The set depicts the area where we can identify an existence of “sustainability” in which all DMUs increase X and decrease B.
Such a case is attained in Process III that is the final stage for unification in which we incorporate the by-product assumption. The assumption changes the two efficiency frontiers to be shaped by convex curves, as visually specified in the bottom of
Figure 1. In the unification, the EF
g increase with the enhancement of
x. Meanwhile, the EF
b increases and then decreases because of green technology innovation on
b. Both curves are convex because of the by-product assumption. As a result of the assumption, the efficiency frontiers are structurally different from those of Processes I and II.
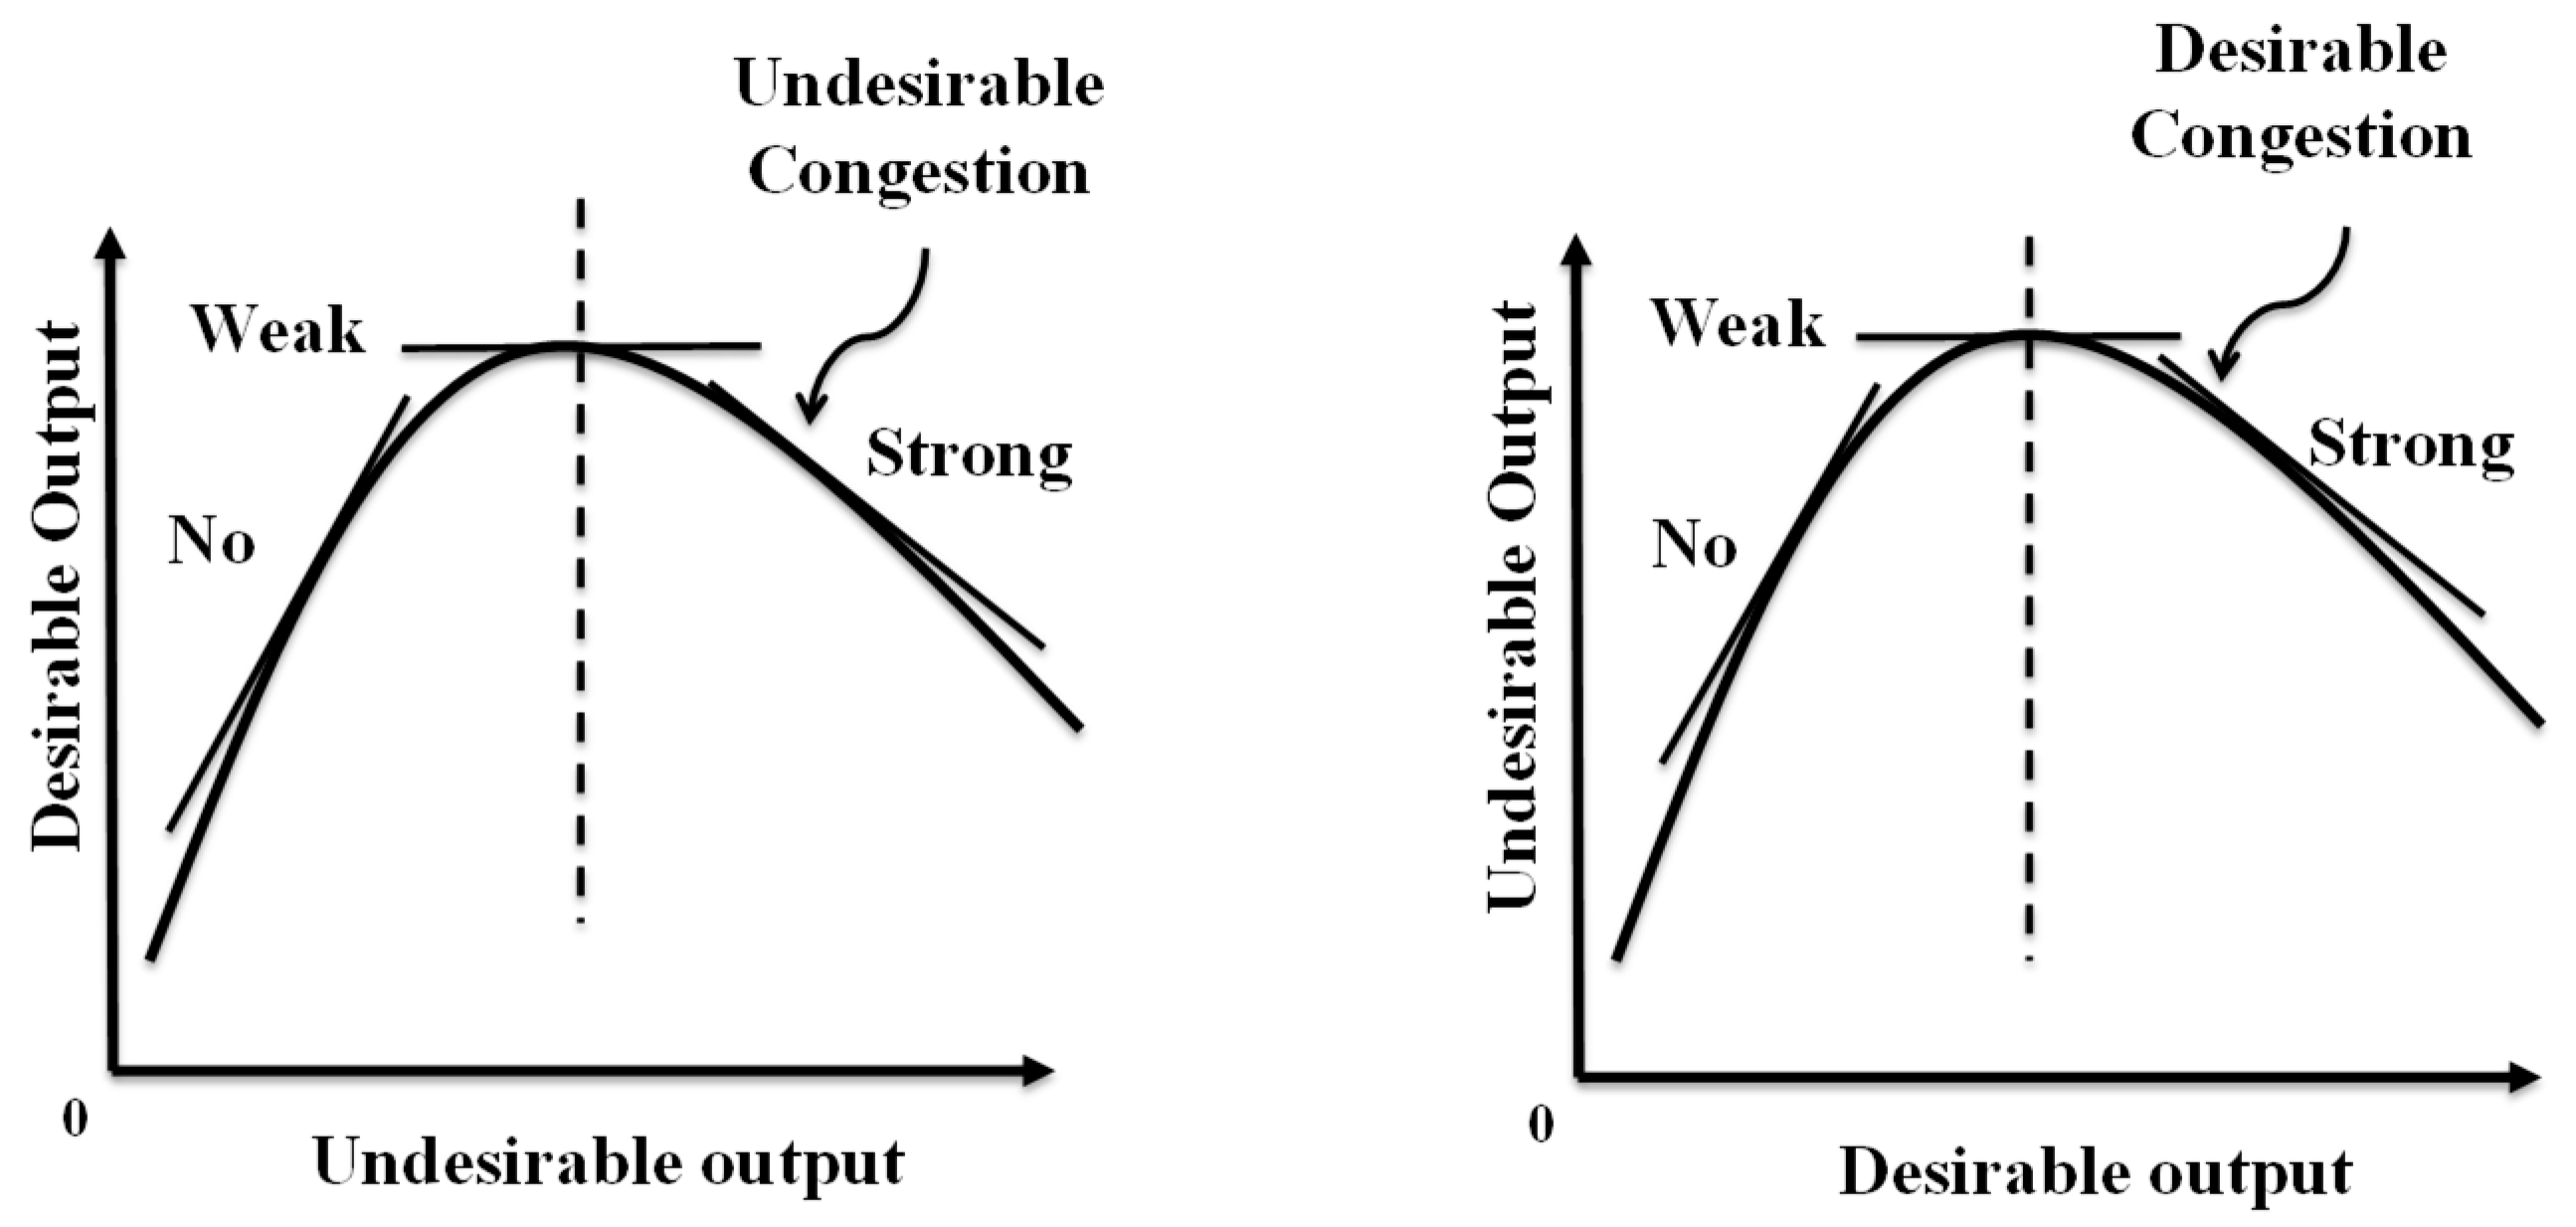
3.3. Undesirable Congestion (UC) and Desirable Congestion (DC)
Figure 2 illustrates the type of congestion that may occur on
g and
b. The concept is classified either UC or DC. The figure depicts dissimilarity between them. The left hand side shows the three types of UC on the horizontal axis (
b) and the vertical axis (
g). The right hand side shows the three types of DC in the space between
g on a horizontal axis and
b on the vertical axis.
The occurrence of UC can be identified on the slope of a supporting hyperplane. As depicted in the left hand side, the negative slope indicates an occurrence of “strong UC”. The occurrence indicates a capacity limit on a production facility that lessens efficiency (e.g., transmission congestion in an electric power industry). In contrast, the positive slope implies an opposite case, or “no UC”. The “weak UC” exists between them.
Admitting the importance of UC (e.g., Cooper et al. [
18]) in production analysis, however, we are interested in the sustainability development by pollution prevention. This research pays attention to the occurrence of DC, not UC, because the DC implies a potential of green technology for sustainability enhancement. The right hand side of
Figure 2, along with Process III of
Figure 1, exhibits such a DC development. The negative slope indicates “strong DC”. In contrast, the positive slope implies an opposite case, or “no DC”. The “weak DC” exists between them.
After describing the DC, we return to the three processes of
Figure 1 to specify the lower and upper bounds of an input change, because it is closely related to the scope of sustainability. First, in this research, a DMU can reduce
X until it can reach EF
g. The frontier serves as a “lower bound” for the input reduction. In contrast, the DMU can increase
X until it can reach EF
b. The frontier indicates an “upper bound” for the input increase. Thus, the sustainably is defined by the two frontiers depicted in
Figure 1.
In other words, the sustainability is visually specified as Pr&PoPS surrounded by EF
g and EF
b. See the last stage of
Figure 1. The frontier on the left hand in the region serves as the lower limit and the frontier in the right hand serves as the upper limit. In the sustainability development, the DEA assessment measures the lower limit by natural disposability where we need to reduce
X (thereby reducing
B) and increase
G. In contrast, the assessment measures the upper limit by managerial disposability where we need to increase both
X and
G. For the purpose, green technology and pollution prevention (e.g., recycling) are necessary in reducing
B.
Here, it is important to note that this research needs to discuss the economic activities of DMUs in terms of the sustainability measurement, but not considering their financial measures such as return on assets (ROA) and return on equity (ROE). Such financial measures are important in discussing corporate “survival” (e.g., avoiding bankruptcy), but they are not directly linked to B. So, we do not incorporate the financial measures in this research.
At the end of this section,
Figure 3 shows a whole flow for computation incorporated into the proposed DEA models. The application starts with specifying inputs and outputs. Then, we determine which models are used for empirical investigation. The upper part depicts such a conventional use of DEA. The lower part depicts how new concepts are included into the proposed DEA assessment. The process classifies outputs into
G and
B. The distinction needs the two concepts (i.e., N and M) for unifying between them. The unification includes equality allocation on constraints related to
G or
B so that we can identify an occurrence of DC and/or that of UC. This study also incorporates the hypothesis that
B is the by-product of
G. Finally, our new assessment produces the three types of unified efficiency measures under the two disposability concepts and the by-product assumption.
4. Methodology
4.1. Formulations
An underlying assumption is that DEA relatively evaluates n DMUs, denoted by j. Each DMU uses m inputs, denoted by i, to yield s desirable outputs, denoted by r. The production process is associated with h undesirable outputs, denoted by f. The end of this article lists all variables used in this section.
DEA has three different models to measure the unified efficiencies of DMUs. Those are radial, non-radial and intermediate models (e.g., [
19]). This research uses the non-radial model because it measures a level of unified efficiency by slacks on optimality, not depending upon an efficiency score, as found in the other two models. The type of measurement is referred to as the Pareto–Koopmans measure [
20] and widely used in DEA-based assessment. Another benefit on the use is that the model makes it possible that we can evaluate DMUs, whose data contains zeros and/or negative values in a data set [
21]. The analytical capability is important in assessing the attainment on various types of DMUs.
In the proposed model, this study needs to specify the following three types of data ranges (R) according to the upper and lower bounds on each factor:
for all
i, r and
f. The rationale for them is that DEA can avoid the case where zero is found in a dual variable(s). They function as weights among production factors. The zero implies that the corresponding factor is not employed in the assessment. That is problematic. Aida et al. [
22] first proposed the range allocation and referred to it as “range adjusted measure (RAM)”. Thus, this research has originated from the RAM. Sueyoshi and Sekitani [
23] mathematically compared RAM’s strengths and drawbacks with the other DEA models.
4.1.1. Formulation for Natural Disposability
To compute the level of
UEN under natural disposability, this research combines
G and
B regarding the
k-th DMU under variable RTS. The resulting model becomes follows:
The right hand side indicates an observed data concerning the
k-th DMU. Meanwhile, the left hand side shows the formulations for the best practice measures which are identified on the two efficiency frontiers. They correspond to the first process (I) in
Figure 1. Model (3) has the three types of slacks, denoted by
d-related variables, for the proposed inefficiency measurement. Among them, the model includes input deviations (
) to attain the status of natural disposability.
The unified efficiency (
) of the
k-th DMU is measured by:
Here, NR stands for non-radial and the three d-related slack variables are obtained from the optimality of Model (3). The equation within the parenthesis expresses the degree of unified inefficiency. As specified by the above equation (4), we subtract the inefficiency from unity to decide the degree of efficiency. The symbol (*) indicates optimality.
4.1.2. Formulation for Managerial Disposability
The managerial disposability compute the unified efficiency measure (
) of the
k-th DMU under variable DTS by the subsequent model:
Model (5) considers input deviations () to attain the status of managerial disposability. The other constraints in Model (5) are the same as those of Model (3).
The unified efficiency (
) concerning the
k-th DMU becomes
where all the slacks are found on optimality. The equation within the parenthesis, obtained from the optimality, implies the degree of unified inefficiency. We subtract it from unity to decide the level of efficiency.
4.2. A Possible Occurrence of Undesirable Congestion (UC) or Desirable Congestion (DC)
As depicted in the left hand side of
Figure 2, this study incorporates UC under natural disposability. To examine the occurrence, we use the following model that allocates equality constraints (i.e., no slack) on
B:
Model (7) eliminates slacks related to B. These related constraints are considered as equality. The other constraints regarding X and G are structured by inequality because they have slacks in the formulation (7).
A unified efficiency, or
, of the
k-th DMU becomes,
All variables used in Equation (8) are determined on the optimality of the Model (8). The equation within the parenthesis indicates the unified inefficiency. The efficiency is determined by subtracting it from unity.
As depicted in the right hand side of
Figure 2, this study incorporates DC into managerial disposability. To examine the DC occurrence, we utilize the following model which allocates equality constraints (so, no slack) on
G:
The model eliminates slacks related to G. These related constraints are considered as equality. The other groups of constraints on X and B have slacks so that they are inequality constraints.
A unified efficiency, or
, of the
k-th DMU becomes,
where all variables are determined on the optimality of Model (9). The equation within the parenthesis indicates the magnitude of unified inefficiency. The efficiency, along with a possible existence of DC, is determined by subtracting it from unity.
5. Extension: Formulation for By-Product Assumption
The structure of the final unification (III) incorporates the by-product assumption. The incorporation is important because B depends upon G. This assumption makes it possible that the production of G on EFg increases with the X enhancement. Meanwhile, the pollution of B on EFb increases and then decreases with the input increase due to the assumption. The increasing trend shifts to decreasing after the installation of new technology for environment protection. The green innovation may have such an impact on B.
Under the assumption on by-product assumption, Model (9) is reorganized as:
The formulation (11) replaces the sign of
in Model (9) by negative (
) in Model (11). The rationale is because both
G and
B have a similar (convex) structure on
X as in the last unification process. That is, EF
g and EF
b become convex as depicted in
Figure 1. Furthermore, Model (11) is prepared under managerial disposability and a possible existence of DC.
An efficiency score of the k-th DMU becomes where all variables are determined on the optimality of Model (11). The equation within the parenthesis denotes a degree of unified inefficiency.
To describe an analytical rationale regarding why Model (11) measures the degree of efficiency in the last unification process, this research documents the following dual formulation that is originated from Model (11):
To describe the analytical implication of the dual formulation (12), we need to consider the complementary slackness conditions between (11) and (12). That is, they have the following conditions:
Here,
indicates a reference set for the
k-th DMU that consists of efficient DMUs with
for
in Model (11). The supporting hyperplane is determined by,
The slopes of the supporting hyperplane are determined by the marginal rate of transformation (MRT) of
to
. Sueyoshi and Yuan [
24] provide a mathematical definition on MRT. The measure becomes
for all
r and all
f. Since
, the sign of
determines the direction concerning MRT. After solving Model (12), assuming a unique optimal solution, the MRT indicates a possible existence of DC by the following guideline:
Figure 4 depicts the whole computational flow that is utilized in this research.
6. Japanese Manufacturing Industries
To discuss the current situation in Japanese manufacturing industries, this study incorporates corporate resource and energy factors in the proposed assessment and compares their performance measures. Then, this study examines the following three research concerns:
First, Japanese firms look for their operational achievements to attain high sustainability [
7]. Economic success is the first priority for them because it allows them to operate under natural disposability. They need capital accumulation to invest in green technology innovation.
Second, Japanese firms need to prevent their industrial pollutions. The assessment for environmental protection belongs to managerial disposability [
6]. Large firms have capital accumulation at the level that becomes large enough to invest in green technology. In addition to the governmental regulation on environment, they need to pay attention to consumers’ consciousness on various pollution issues [
7].
Finally, we are interested in the influence of regulation. Japanese industrial policy regulates and controls all industries. Previously, it was believed that all manufacturing firms worked like a single entity, often referred to as “Japan Inc.” However, recent fierce competition changes the business environment. The commutation is brought about by information technology incorporated into an advanced world-wide supply chain system. Corporate behaviors are driven by their survival strategies in a global market [
6]. Consequently, a conventional relationship between government and business may not exist anymore in Japan. This study examines the current Japanese situation.
6.1. Data
This application examines the performance of Japanese manufacturing industries that include 13 industrial sectors with 110 companies during 2013 to 2015. The industrial sectors are food items (10), textile products (5), pulp and paper (3), chemicals (25), pharmaceutical products (9), gum products (3), glass, soil and stone products (2), iron and steel (3), non-ferrous metal and metal products (4), machinery (9), electrical equipment (23), transportation equipment and precision instrument (11), and other products (3), where the number in parentheses is that of companies per industrial sector. The total number of observations is 330 (the total number of companies = 110 firms × 3 years).
For the assessment, this study uses five input resources, two desirable outputs, and three undesirable outputs. We have collected economic data and environmental data from Toyo Keizai Inc. The database is well-known and often used for sustainability studies in Japan. All companies are listed in the first section of the Tokyo Stock Exchange. This study follows a guideline provided by the database in selecting the industrial groups and the three production factors.
Five inputs are the following items: (a) total assets: this item represents a total amount of each company’s assets used for plant operation, office property, and equipment for production. Those are listed in a balance sheet; (b) total operating expenses: this is a total amount of company’s incurred expenses used for day-to-day operation and production. Depreciation and amortization of assets are included but financial expenses are excluded from the item; (c) environmental protection cost: this is a company’s cost used for environmental protection and investment; (d) total energy input: this is an amount of energy used for operation; and (e) total water resource input: this is the total amount of water resource inputs used per operation.
Table 1 lists the data set used in this article.
The inputs and desirable outputs are obtained from “Toyo Keizai Financial Data Digest,” where Toyo Keizai is one of the well-known Japanese publishers. Undesirable outputs are from “Toyo Keizai CSR (Corporate Social Responsibility Souran: a comprehensive handbook in Japanese) that is the famous CSR database on Japanese firms.
6.2. Unified Efficiencies
Table 2 and
Table 3 represent unified efficiencies of pharmaceutical products and machinery industries which are obtained from Models (3), (5), and (11). The two industries are selected for illustration purposes. The dual variables for two desirable outputs and the type of DC are determined by Model (12).
Two desirable outputs are (a) revenues: total amount of sales gained from operation and (b) market capitalization: this represents a current aggregate value of a firm. It is calculated from a sum of current share price multiplied by the number of outstanding shares.
Three undesirable outputs are: (a) greenhouse gas emissions: a total amount of GHG emissions from an operation; (b) total waste discharges: this is an amount of waste discharged from an operation; and (c) total waste water discharges: this is an amount of waste water discharged from an operation.
For illustration, in the two tables, all three efficiency measures on average include UEN = 0.997 for the pharmaceutical product and UEN = 0.989 for the machinery, UEM = 0.987 for the pharmaceutical product and UEM = 0.933 for the machinery, and UEM(DC) = 0.843 for the pharmaceutical product and UEM(DC) = 0.804 for the machinery. The pharmaceutical product industry is higher than the machinery industry on average in the three unified efficiencies. The lower averages of the machinery industry are partly because of these large standard deviations, compared to the pharmaceutical industry. For example, these standard deviations of UEN are 0.005 for the pharmaceutical product and 0.010 for the machinery.
Another finding is that UEM(DC) is generally lower than the other two efficiency measures. This is because Model (11) needs to assess not only unified efficiency but also a potential of green technology enhancement. Along with the high averages in the three efficiency measures, the pharmaceutical companies exhibit a high percentage of strong DC, compared to the machinery industry. This indicates that machinery companies have a high potential to handle pollution problems by enhancing their production amounts.
Table 4 is the extension of
Table 2 and
Table 3 that summarize industry averages of the three efficiency measures.
Table 4 indicates two implications concerning the first and second research concerns. One of them is that most industrial sectors have their high
UEN measures. Those industries include the food item (
UEN = 0.996), the pharmaceutical product (
UEN = 0.997), the gum product (
UEN = 0.997), the glass, soil and stone product (
UEN = 0.990), the electrical equipment (
UEN = 0.993), the transportation equipment and precision instrument (
UEN = 0.994), and the other products (
UEN = 0.991) on average. The standard deviations of those industrial sectors are relatively small. In contrast, the average
UEM measures are generally lower than those of
UEN. An exception is the pulp and paper industry, whose average
UEN is 0.847, while average
UEM is 0.923. The pulp and paper industry used to be an environmentally lagged industry. Their recent corporate efforts have changed the status of environmental protection.
The other finding is that among the industrial sectors with high UEN, only the pharmaceutical product industry has exhibited higher UEM with 0.987 on average. It is followed by the transportation equipment and precision instrument as well as the other products with 0.968 in UEM. These measures indicate that companies with high UEN cannot always produce high UEM. The UEM(DC) also exhibits high average (0.999) in the pulp and paper as well as that (0.906) in the textile product, although the two industrial sectors do not exhibit high attainment in both UEN and UEM. This indicates, particularly for the pulp and paper sector, that companies of the sector put more weight on their environmental efficiencies than operational ones. The industry of glass, soil and stone products exhibits low average with 0.741 in UEM(DC). The industry has a large space for efficiency improvement by introducing green technology. The iron and steel sector exhibits low UEM(DC) = 0.714, revealing a high potential to improve its pollution prevention by investing in green technology. Currently, this industry produces high CO2 emissions among the manufacturing sectors.
The UEN outperforms the UEM in these degrees. This implies the implication that firms have first attempted to improve the sustainability by attaining their economic successes. To mitigate industrial pollution, they accumulate capital from their profits and invest it in green technology so that they can satisfy the minimum standard required by the government. It is indeed important that firms need to satisfy the environmental standard. However, it is difficult for them to follow the regulation guideline without economic sufficiency. The relatively low degree of UEM(DC) implies the current potential level for green technology innovation in Japanese manufacturing firms.
6.3. Statistical Test
Table 5 summarizes the rank sum test [
25] on the three models i.e.,
UEN, UEM, UEM(DC). The null hypotheses are related to the third research concern and summarized as follows:
- (a)
Ho: There is no difference among Japanese industrial sectors in their UEN measures;
- (b)
Ho: There is no difference among them in their UEM measures; and
- (c)
Ho: There is no difference among them in their UEM(DC) measures.
The first and second hypotheses originate from [
7]. The last examines the influence of DC and the by-product assumption. As indicated by
Table 5, the rank sum test rejects the three hypotheses at the 1% significance by the chi-squared distribution. This indicates that there is a significant difference among Japanese industrial sectors in their unified efficiencies. Historically, the nation was often referred to as “Japan Inc.” because the government carefully regulated and coordinated corporate operations. Such a government and business relationship has been admired and respected by the other industrial nations. However,
Table 5 indicates that the strong relationship may not exist among different industrial sectors because firms are now facing fierce competition in a global market.
6.4. Desirable Congestion (DC)
Table 6 documents the percentage on a possible occurrence of DC, measured by Model (12) and the rule (15). The table indicates that 41% of firms have a potential of efficiency improvement by employing green technology for pollution prevention and the others (59%) do not have such a capability. Among them, a high percentage of strong DC is observed in the industrial sectors such as pharmaceutical products (74%), glass, soil and stone products (100%), and non-ferrous metal and metal products (67%). These sectors exhibit relatively low
UEM (DC) in such a manner that these measures are 0.843, 0.741, and 0.818, respectively. Thus, investment in green technology in these industries becomes effective in reducing
B.
7. Concluding Comments
This study discussed how to enhance the sustainability of Japanese manufacturing firms by investing in green technology and other pollution prevention efforts (e.g., waste reduction) in their operations. The concept of sustainability is not clearly defined and, therefore, not analytically explored by previous studies. We have challenged the research task by DEA.
As the first step in our methodological development, this research separated outputs into two categories: desirable and undesirable. Second, we discussed how to unify them to compute their UEN and UEM scores. Finally, this research extended them for the development of a new measure, or UEM(DC), under both the existence of DC and the by-product assumption. The assumption provided us with a new formulation for DEA-based environmental assessment.
To describe the applicability, we investigated the performance of Japanese 13 industrial sectors. The application obtained the following five implications: First, their UEM(DC) measures were generally lower than their magnitudes of UEN and UEM because the former needed to consider a potential for green technology innovation, recycling activities and other efforts for pollution prevention. Japanese companies with low UEM(DC) need to enhance green technology and other activities for environmental protection. Second, several sectors maintained their high UEN measures. Meanwhile, their standard deviations were relatively smaller than the magnitude of UEM and that of UEM(DC). In other words, most industries now face different environmental surroundings. An exception was the pulp and paper industry. The industry used to be lagging in environmental protection, but its recent effort changed the current status on environmental protection. Third, among the industrial sectors with high UEN measures, only the pharmaceutical product sector exhibited high UEM with 0.987 on average. Transportation equipment and precision instrument were the second with 0.968 in UEM. The companies with high UEN may not necessarily lead to high UEM. This reveals a difficulty in balancing between operational and environmental efficiencies. Fourth, UEM(DC) exhibited high averages in the pulp and paper as well as the textile products, although they did not exhibit high achievement in both UEN and UEM. On the other hand, glass, soil and stone products presented low average with 0.741 in UEM(DC). The industrial sector has a large space for sustainability improvement by implementing green technology investment. Finally, a high percentage of strong DC was observed in pharmaceutical products (74%), glass, soil and stone products (100%), and ferrous and non-ferrous metal products (67%). These industries exhibited relatively low in UEM (DC) in the manner that they were 0.843, 0.741, and 0.818, respectively. Investment in green technology and/or pollution prevention in these industries becomes effective in reducing B. The results on UEM(DC) indicate that firms in different sectors produce different results in green management even if they are strictly regulated by the Japanese government.
This research has four drawbacks, all of which need to explored in future. First, we have discussed how to compute a degree of sustainability under DC. However, this study does not discuss corporate implications derived from scale benefits such as RTS and DTS. These scale measures provide us with a strategic direction (e.g., increasing, decreasing and constant) by a scale change on inputs [
27]. Second, we need to consider an efficiency change due to a time shift by a “Malmquist” index. The index examines a frontier shift among multiple periods. The shift indicates technology advancement and/or managerial improvement during the observed periods [
28]. Third, the proposed approach is useful in measuring the performance of other types of manufacturing and service industries. Finally, this research needs a methodological comparison. That is, different methodology may produce empirical results which cannot be found in this research. This type of empirical issue is referred to as “a methodological bias” [
29]. See also [
30], which discussed the methodological problems that exist in many empirical studies.
In conclusion, it is hoped that this article may contribute to DEA environmental assessment applied to Japanese industrial sectors.


