Article

Monitoring a Sample of Main Televisions and Connected Entertainment Systems in Northern Italy

by
Gianluca Ruggieri
1,*,
Paolo Zangheri
2,
Mattia Bulgarelli
1 and
Patrizia Pistochini
3
1
Department of Theoretical and Applied Sciences, Università degli Studi dell’Insubria, 21100 Varese, Italy
2
European Commission, Joint Research Centre (JRC), 21027 Ispra, Italy
3
Energy Efficiency Unit Department, Italian National Agency for New Technologies, Energy and Sustainable Economic Development (ENEA), 21027 Ispra, Italy
*
Author to whom correspondence should be addressed.
Energies 2019, 12(9), 1741; https://doi.org/10.3390/en12091741
Submission received: 21 February 2019 / Revised: 20 April 2019 / Accepted: 3 May 2019 / Published: 8 May 2019
(This article belongs to the Section G: Energy and Buildings)

Abstract

:
Energy labels are a powerful instrument to influence the electricity consumption of appliances and lighting devices in households. However, the real consumption data depend on a number of different factors, including marketing policies, purchase preferences, technology development, and last but not least behavioural habits. While white appliance consumption trends tend to change over a longer period, the use of entertainment devices changes quickly. A number of different devices (digital versatile disc (DVD) player, decoder, game console, home theater, video recorder) are normally connected to the main television set, and these devices change rapidly, and, at the same time, new behaviors are emerging. There is an increasing gap between, on one hand, the higher consumption of televisions and connected devices and the number of regulations developed for their regulation, and, on the other hand, the lack of knowledge on the real onsite consumption. In order to fill this gap, in 2017, a measurement campaign was promoted and developed in some households in northern Italy. The consumption of 28 main televisions and 14 entertainment systems was measured on a daily basis for at least two weeks. Standby consumptions were measured as well. On the basis of outcomes evaluated, it results that these devices are responsible for 9.3% of total electricity consumption as an average of 5.6% for televisions and 3.7% of the attached devices. Standby consumption is still considerably high (3.6% of the total electricity consumption), especially for satellite decoders. Some interesting correlations were studied highlighting the effect of the introduction of the energy labels or the increasing size of the TV over time. The main results obtained were compared to those of previous monitoring campaigns launched in Italy.

1. Introduction

In 2016, final energy consumption in the residential sector in the European Union (EU-28) still accounted for 26.4% of total energy consumption, although, in absolute terms, it slightly decreased from 291 to 285 Mtoe (−5.5%) between 2000 and 2016. In the same period, the final residential electricity consumption increased from 718 to 808 TWh (+12.5%) [1]. In Italy, the electricity consumption of the residential sector increased from 61.1 to 70.1 TWh between 2000 and 2011, and subsequently decreased to 65.5 TWh in 2017, for a total increase of +7% compared to the 2000 level [2].
These statistics appear to be counterintuitive, given the wide effort made by the EU in trying to boost energy efficiency of domestic electric appliances. In particular, the energy label system was designed to improve and reward the performance in terms of energy efficiency of the best available appliances, while the Ecodesign process was aimed at eliminating from the market the appliances with worst performance. At the same time, other consumption driver factors contributed to swelling the residential electricity expenditure [1]: increase in the number of households, upsurge in the number of electrical devices per home, and increment in the final service performance of the electrical devices (i.e., devices in the same energy class but with different size will have different consumptions). Consumer behaviors may also lead an important influence over consumption trends, but they are more difficult to monitor.
While trying to break down the residential electricity consumption, an interesting trend emerged; in 2003, in the EU-15, 43% of the electricity consumption was due to heating/cooling (including space and water heating, cooking, and air conditioning), 22% to white appliances (cold appliances, washing and drying machines, and dishwashers), 12% to lighting, 11% to television (TV), standby, and office equipment, and the remaining 12% to other miscellaneous components [3]. In 2009, the breakdown included the EU-27 countries, but the framework was quite similar [4]. Heating/cooling (−4%), white appliances (+2.7%), and lighting (−2%) showed only minor variations, while the sum of TV, entertainment, and office equipment increased from 12% to 17%. In 2007, electricity consumed by TVs in the EU-27 member states was estimated at 60 TWh: 54 TWh in on-mode and 6 TWh in standby/off-mode [5]. Between 2007 and 2009, the increase in consumption was estimated at around 2–3%, reaching 56 TWh in 2009 [4] despite an expected increase in energy efficiency.
In accordance with other authors [6], these results can be explained also by the increasing importance of TV and of entertainment devices in the household’s electricity consumption. This trend influenced deeply important policy actions. When energy labels for domestic appliances were introduced in the European Union in the 1990s, the main focus was addressed on white appliances. Cold appliances, washing (and drying) machines, and dishwashers were the most consuming appliances and, therefore, the first ones that needed to be regulated. The implementation of the energy labels directives on white appliances was effective in changing the market and, in the long run, the stock and total consumption. At the same time, it was necessary to define and adopt energy efficiency policy measures covering further energy used appliances. For this reason, in the second wave of energy labeling launched by the Directive 2010/30/EU, the scope was enlarged to other energy-related products, such as lamps, TVs, and air conditioners. Televisions were also included in the EU Ecodesign process. A comprehensive study [7] was developed between 2005 and 2007 with a view to identify the minimum requirements for a TV to be placed on the market. The legislative framework in the EU 27 was completed with the Commission Regulation [8] implementing the recast of the Ecodesign Directive [9] and the Commission Delegated Regulation [10] supplementing the recast of Energy Labeling Directive [11] with regard to energy labeling of televisions. Televisions are also subject to Commission Regulation concerning Ecodesign requirements for standby, off-mode electric power consumption of electrical and electronic equipment [12].
The work on standards and labels was aimed at changing the framework of the television market and (as a longer perspective) stock in the EU-28. However, the implementation of these instruments occurred at a time when two driven market technology transformations were discovered: firstly, the end of the cathode ray tube (CRT) era, when CRTs on the market were completely substituted by flat-panel screens; secondly, the success of the second-generation flat-screen liquid crystal display (LCD) technology using light-emitting diodes (LED) that overperformed and replaced LCDs with cold cathode fluorescent lamps (CCFLs) as backlight. In 2004, CRTs accounted for 89% of the EU sales and LCD TVs only accounted for 8% of the sales (Stobbe [7]). In 2007, more than two-thirds of the sold TVs were LCD TVs and the last few CRT TVs were sold out in 2011. In 2009, the CCFL-backlit LCD TV market share reached its peak with 87% of the sales. Within four years, the second market transformation was completed and, in 2013, LCD TVs with CCFL backlight accounted only for 4% of the sales, while LED screens dominated the market [13].
The main effect of these two transformations was the impressive 65% reduction of the on-mode power. In 2008, the average TV sold in the EU had an on-mode power of 156 W; in 2013, the average on-mode power was 55 W, although the average TV sale size increased over the same period. Between 2007 and 2013, the average screen diagonal increased by 20% from 29.3” to 35” (i.e., from 74.4 cm to 89 cm) [13]. However, the effect of the power reduction on the actual electricity consumption by televisions is not clear. First of all, the declared on-mode power is normally measured at the lowest possible power, corresponding to 65% of the maximum brightness which is defined by the Ecodesign regulation. However, the user may adapt the brightness to his requirements increasing the actual power demand. Furthermore, the peak in sales of new televisions occurred during the first market transformation when the on-mode power demand was higher than before. The stock of televisions is, therefore, much more energy-demanding than the current market average. Finally, it is expected that average on-mode time of use increased over the last decade [13], but this trend needs to be confirmed with actual onsite measurements.
Concerning user behavior, technology evolution periodically and radically changed the way we used to watch TV and use the connected entertainment systems. From the 1950s to the 1980s, the only way to use a television set was to watch the broadcasts on very high frequency (VHF) and ultra high frequency (UHF) frequencies (or via cable, if available). Later, the development of satellite transmissions and the switch to the digital encoding of terrestrial broadcasts enlarged the portfolio of TV viewers. At the same time, since the late 1970s, a number of specific devices were developed to be used with televisions: video games, magnetic tape video recorders and, more recently, digital versatile disc (DVD)/Blu-ray recorders and players. In the latest 20 years, game consoles with higher performances experienced a larger market success, and heavily energy-intensive consumption behaviors seem to be encouraged by the design and marketing of new televisions and the devices and services supported by them [14]. However, regulations regarding the minimum energy performance and the energy labeling of other entertainment systems remain to be proposed.
More recently, the development of streaming content and the proliferation of entertainment devices forced the quick evolution of TV use once more. Now, a consumer can access content anytime and anywhere also from his smartphone. Therefore, this time, the evolution may lead to two different and opposite results: on one side, the television may be used as a hub that collects inputs from different sources (including streaming contents) and also for social networking [15]; on the other side, television screens may be replaced by other monitors (laptops, tablets, and smartphones) that offer more flexible use.
Actual changes in using TV should be analyzed through specific onsite measurement campaigns. However, what is the state of knowledge concerning onsite measurements? In the past 20 years, several monitoring campaigns were arranged. Projects Eureco (2000–2001), Micene (2003), and REMODECE (2008) were the most interesting actions developed in Italy and focused not only on TVs, but also on entertainment systems. The European project Eureco monitored 102 Italian households. The individual electrical end uses were monitored for a whole month, while the characteristics of the monitored sample and its load curves were reported for each type of end use [16]. Just after this experience, the Italian project Micene examined 110 dwellings selected to touch different geographical areas and urbanization conditions. In the case of audio–visual equipment, overall measurements were made for the main audio–visual site, usually consisting of a television set, a video recorder, and other devices such as a decoder or a gaming console [17]. More recently, the European REMODECE project involved other 60 Italian households, carrying out a “light” measurement campaign for two weeks, focusing on new electronic loads, standby consumption, air conditioning, and lighting [18].
After these experiences, a few new monitoring initiatives were launched, and always outside the European Union [19,20,21,22]. This is quite strange, since the mandatory energy certification obligation for televisions was introduced in EU at the end of 2011 (European Union 2010), and the previous campaigns underlined that information technologies and entertainment loads were key contributors to the power demand [6].
Therefore, we are experiencing an increasing interest in the consumption of TVs (and connected entertainment systems) that are addressed with a number of regulations; however, at the same time, there is a total absence of data regarding the actual consumption. On the basis of this contradiction, a low-cost monitoring campaign was developed in 2017 in order to fill the gap of knowledge. The aim of the campaign was to highlight general trends in order to define requests for further campaigns rather than to define a statistically significant sample. This paper presents the results of the campaign. Section 2 describes the general monitoring strategy, the campaign organization, and the monitored sample. Section 3 presents the results obtained (in terms of electric consumption levels, standby power, and time of usage) and it provides analysis of determinants influencing the TV’s nominal power. Section 4 provides a comparison with values measured in previous campaigns and discusses some lessons learnt from this experience. Finally, the most relevant conclusions are outlined in the Section 5.

2. Materials and Methods

2.1. General Strategy

Although the electricity consumption patterns concerning entertainment devices are constantly evolving, a new measurement campaign (called HESCA for “home entertainment system consumption analysis”) was organized. The approach adopted was rather traditional and consisted of monitoring the main TV set and every device strictly connected to it. This is an approach that used to be typical before the development of entertainment content linked with online services. Even though we are aware that we are probably losing a part of the framework, we consider that this measurement campaign of TV electricity consumption could have a lot of worth because of the following factors:
  • At least in Italy, although new consumption behaviors are emerging, the TV is still largely used; at least one television is present in the 97% of Italian households and it is usually seen in all age groups (especially by young and mature people) [23,24].
  • TV is the only entertainment device with an EU energy label; it could be interesting and useful to analyze the effect of the introduction of energy label on the actual energy consumption, especially by comparing the results to the previous campaigns.
  • Previous monitoring campaigns show that the main TV causes a far higher energy consumption compared to a secondary TV set; for example, during the REMODECE project, main TVs had an average annual consumption of 307 kWh/year, while secondary TVs consumed only 47 kWh/year (−85%) [25].

2.2. Key Questions to be Addressed by the Campaign

The measurement campaign should investigate the following main issues:
  • Total energy consumption: what is the average daily/annual consumption of TVs and entertainment systems? What is the percentage of their consumption compared to the total electric consumption?
  • Standby energy consumption: what is the standby power demand for each device of the entertainment set?
  • Consumption driving forces: which are the main determinants influencing the total energy consumption (year of purchase, technology, energy class, screen size)?
  • Time of use: what is the average daily on-time use?

2.3. Monitoring System and Campaign Organization

The campaign adopted the wattmeter RCE PM600, which is able to measure energy consumption (from 0.001 to 9999 kWh ± (1% + one digit)), as well as power demand (from 0.400 to 3999 W ± (1% + 100 mW)). The investigation did not include the daily demand curve. Twenty different wattmeters were distributed in different households in four campaigns during spring and fall 2017.
The measurements were proposed to students in architecture and engineering as an applicative experience to do in their homes. Toward the support of the organization of the monitoring campaign, some volunteers were recruited among the course students. The volunteers, who were constantly assisted by the measurement campaign team, were asked to monitor on a daily basis the consumption of their main television set, as well as the entertainment systems, defined as all the devices (videocassette recorder (VCR), DVD, decoder, high-fidelity system (HiFi), game consoles, etc.) attached to the television selected for the campaign. Two different wattmeters were handed out, one to measure TV consumption, the other one to measure the entertainment system consumption. The volunteers were also asked to fill in a questionnaire aiming at helping the identification of the sample. The survey included questions on the type and size of the dwelling, number and age of people living in the dwelling, and annual total electricity consumption. A photograph of the rear label of the television set was also collected for a precise identification of the model and to obtain manufacturing data and eventually energy labels from the producer’s website.

2.4. Sample Identification

The campaign involved 44 households in the provinces of Milan and Varese, in the north of Italy. The first evaluation of the results reported that only 28 measurements were assessed as sufficiently complete and reliable for the purpose of the study. In these households, it was possible to collect consumption data for at least 14 consecutive days (excluding special periods, e.g., Christmas holidays), standby power demand data, and complete contextual information by questionnaire. The remaining 16 offered low-quality or incomplete data that could not be used for the complete analysis of energy consumptions, even if four of them were included in the study on standby power.
Twenty-eight households may seem a relatively small sample if compared to previous studies as shown in Table 1. It is not possible to draw general conclusions from our results; for example, we do not claim that our average consumption is a statistically significant estimation of the true average consumption. Nonetheless, we believe the results of this campaign deserve careful consideration since they highlight critical issues that suggest that further measurement and additional work is needed (and worth pursuing).
Twenty-six out of 28 participants lived with their family, while the remaining two shared the apartment with other students. Eleven lived in a single-family household, three in townhouses, six in small multifamily buildings (fewer than 10 dwellings), and eight in large multifamily buildings (more than 10 dwellings). On average, the apartment was occupied by 3.2 persons and the age classes most represented were those between 15 and 25 years (44%) and between 40 and 60 years (41%). A total of 2.6 televisions were in each household. Some key data of the monitored households are shown in Table 2.
The characteristics of the sample identified a particular set of household electric customers. The Italian Authority [28] identified eight different benchmark customers: four including typical residents (from one to 4+ members) and four for particular users (non-residents, holiday houses, etc.). The sample involved in our measurement campaign falls in benchmark classes C and D (families with three or more members) and can be considered as an example of high-consumption customers (2700 kWh/year for class C and 3200 kWh/year for class D).

2.5. The Monitored Television Sets

The main television was identified (i.e., the one that is more frequently used by the occupiers) and its consumption was monitored. The main television was 7.3 years old on average. The average diagonal screen size was 32.8 inches. As shown in Table 2, 15 out of 28 had CCFL backlight screens, eight had LED screens, one was a plasma screen, and one was a CRT (in three cases, the technology was not identified). Energy class was available only for eight televisions: two A+, four A, and two B.
On average, the main television was connected to 1.2 peripherals; in nine households; the main television was not connected to any peripherals; in 10 households, it was connected to one device; in five households, it was connected to two devices, while it was connected to three devices in three households, and five devices in one household.

3. Results

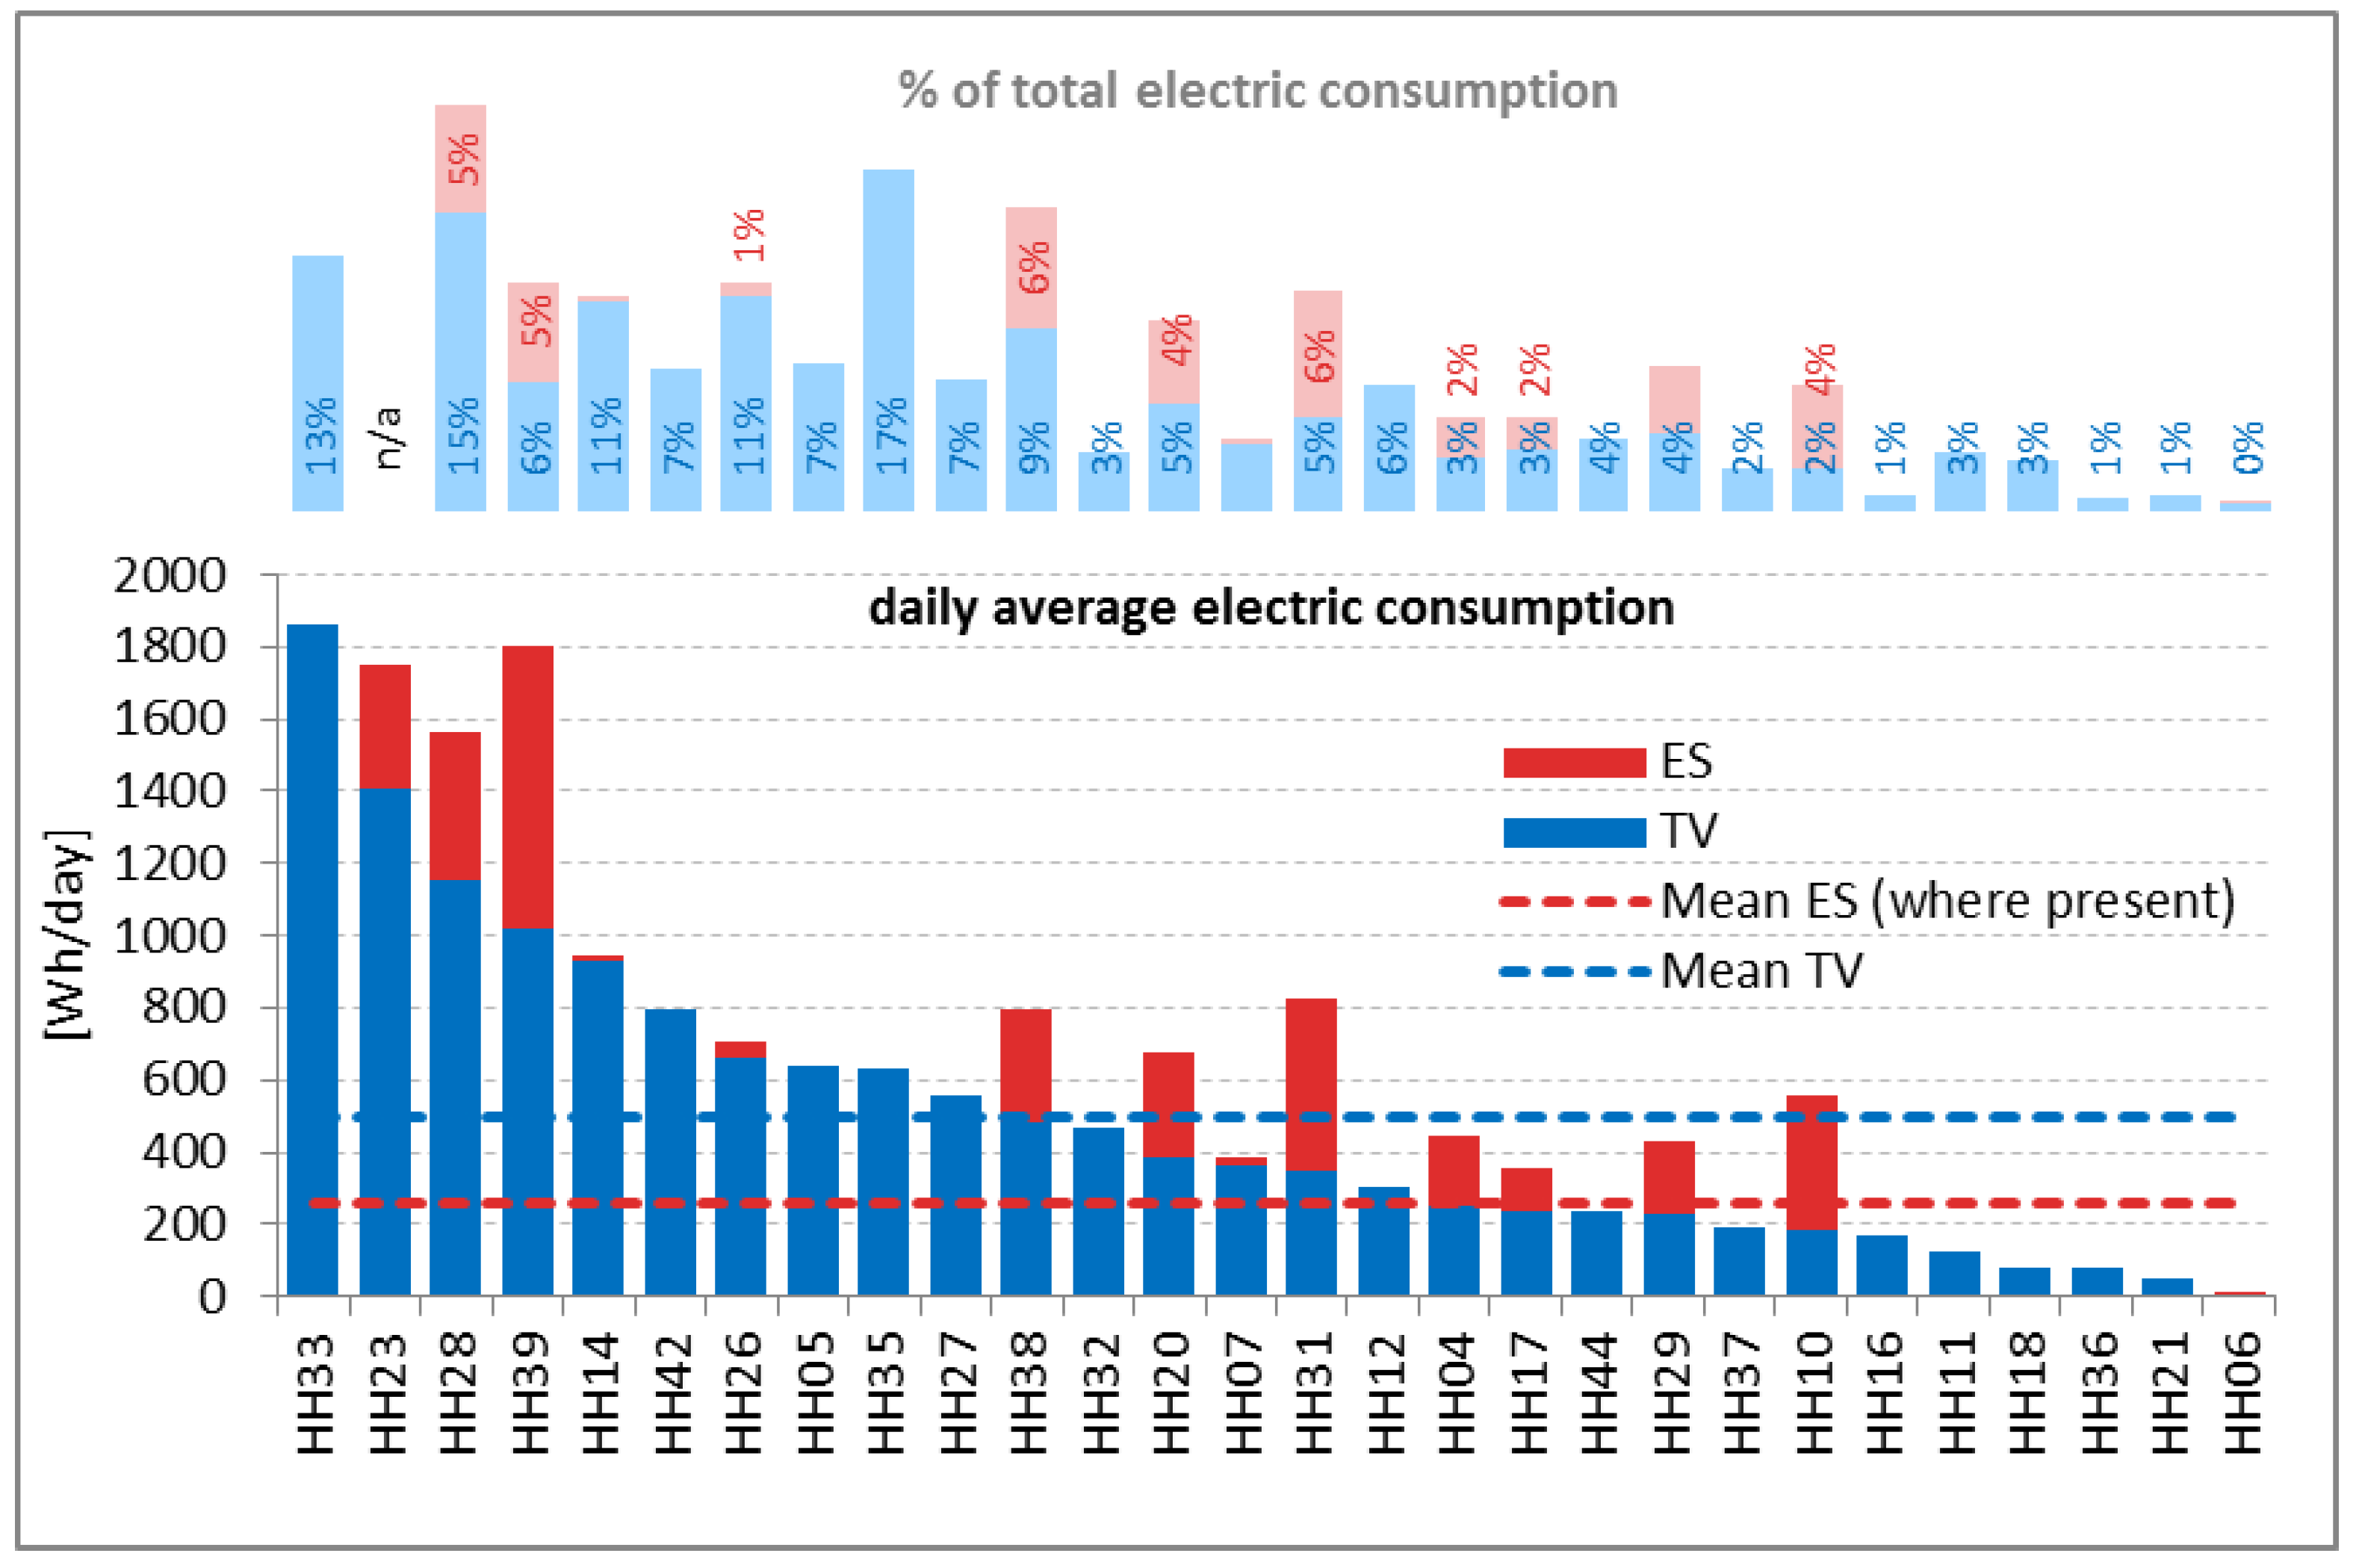
3.1. Electric Consumption Levels

The analysis of data monitored for the 28 main TV set-ups allowed deriving the following key findings:
  • The average daily consumption of the main television was equal to 494 Wh (between a maximum of 1862 Wh and a minimum of 7 Wh), and it represented 5% of the total electric consumption.
  • The average daily consumption of the entertainment systems (in the 13 households where they were present) was equal to 257 Wh (between a maximum of 782 Wh and a minimum of 2 Wh), and it represented 3% of the total electric consumption.
  • The average daily consumption of the overall set-up (main TV and connected devices) was 622 Wh (between a maximum of 1862 Wh and a minimum of 9 Wh). It represented 9% of the total electric consumption.
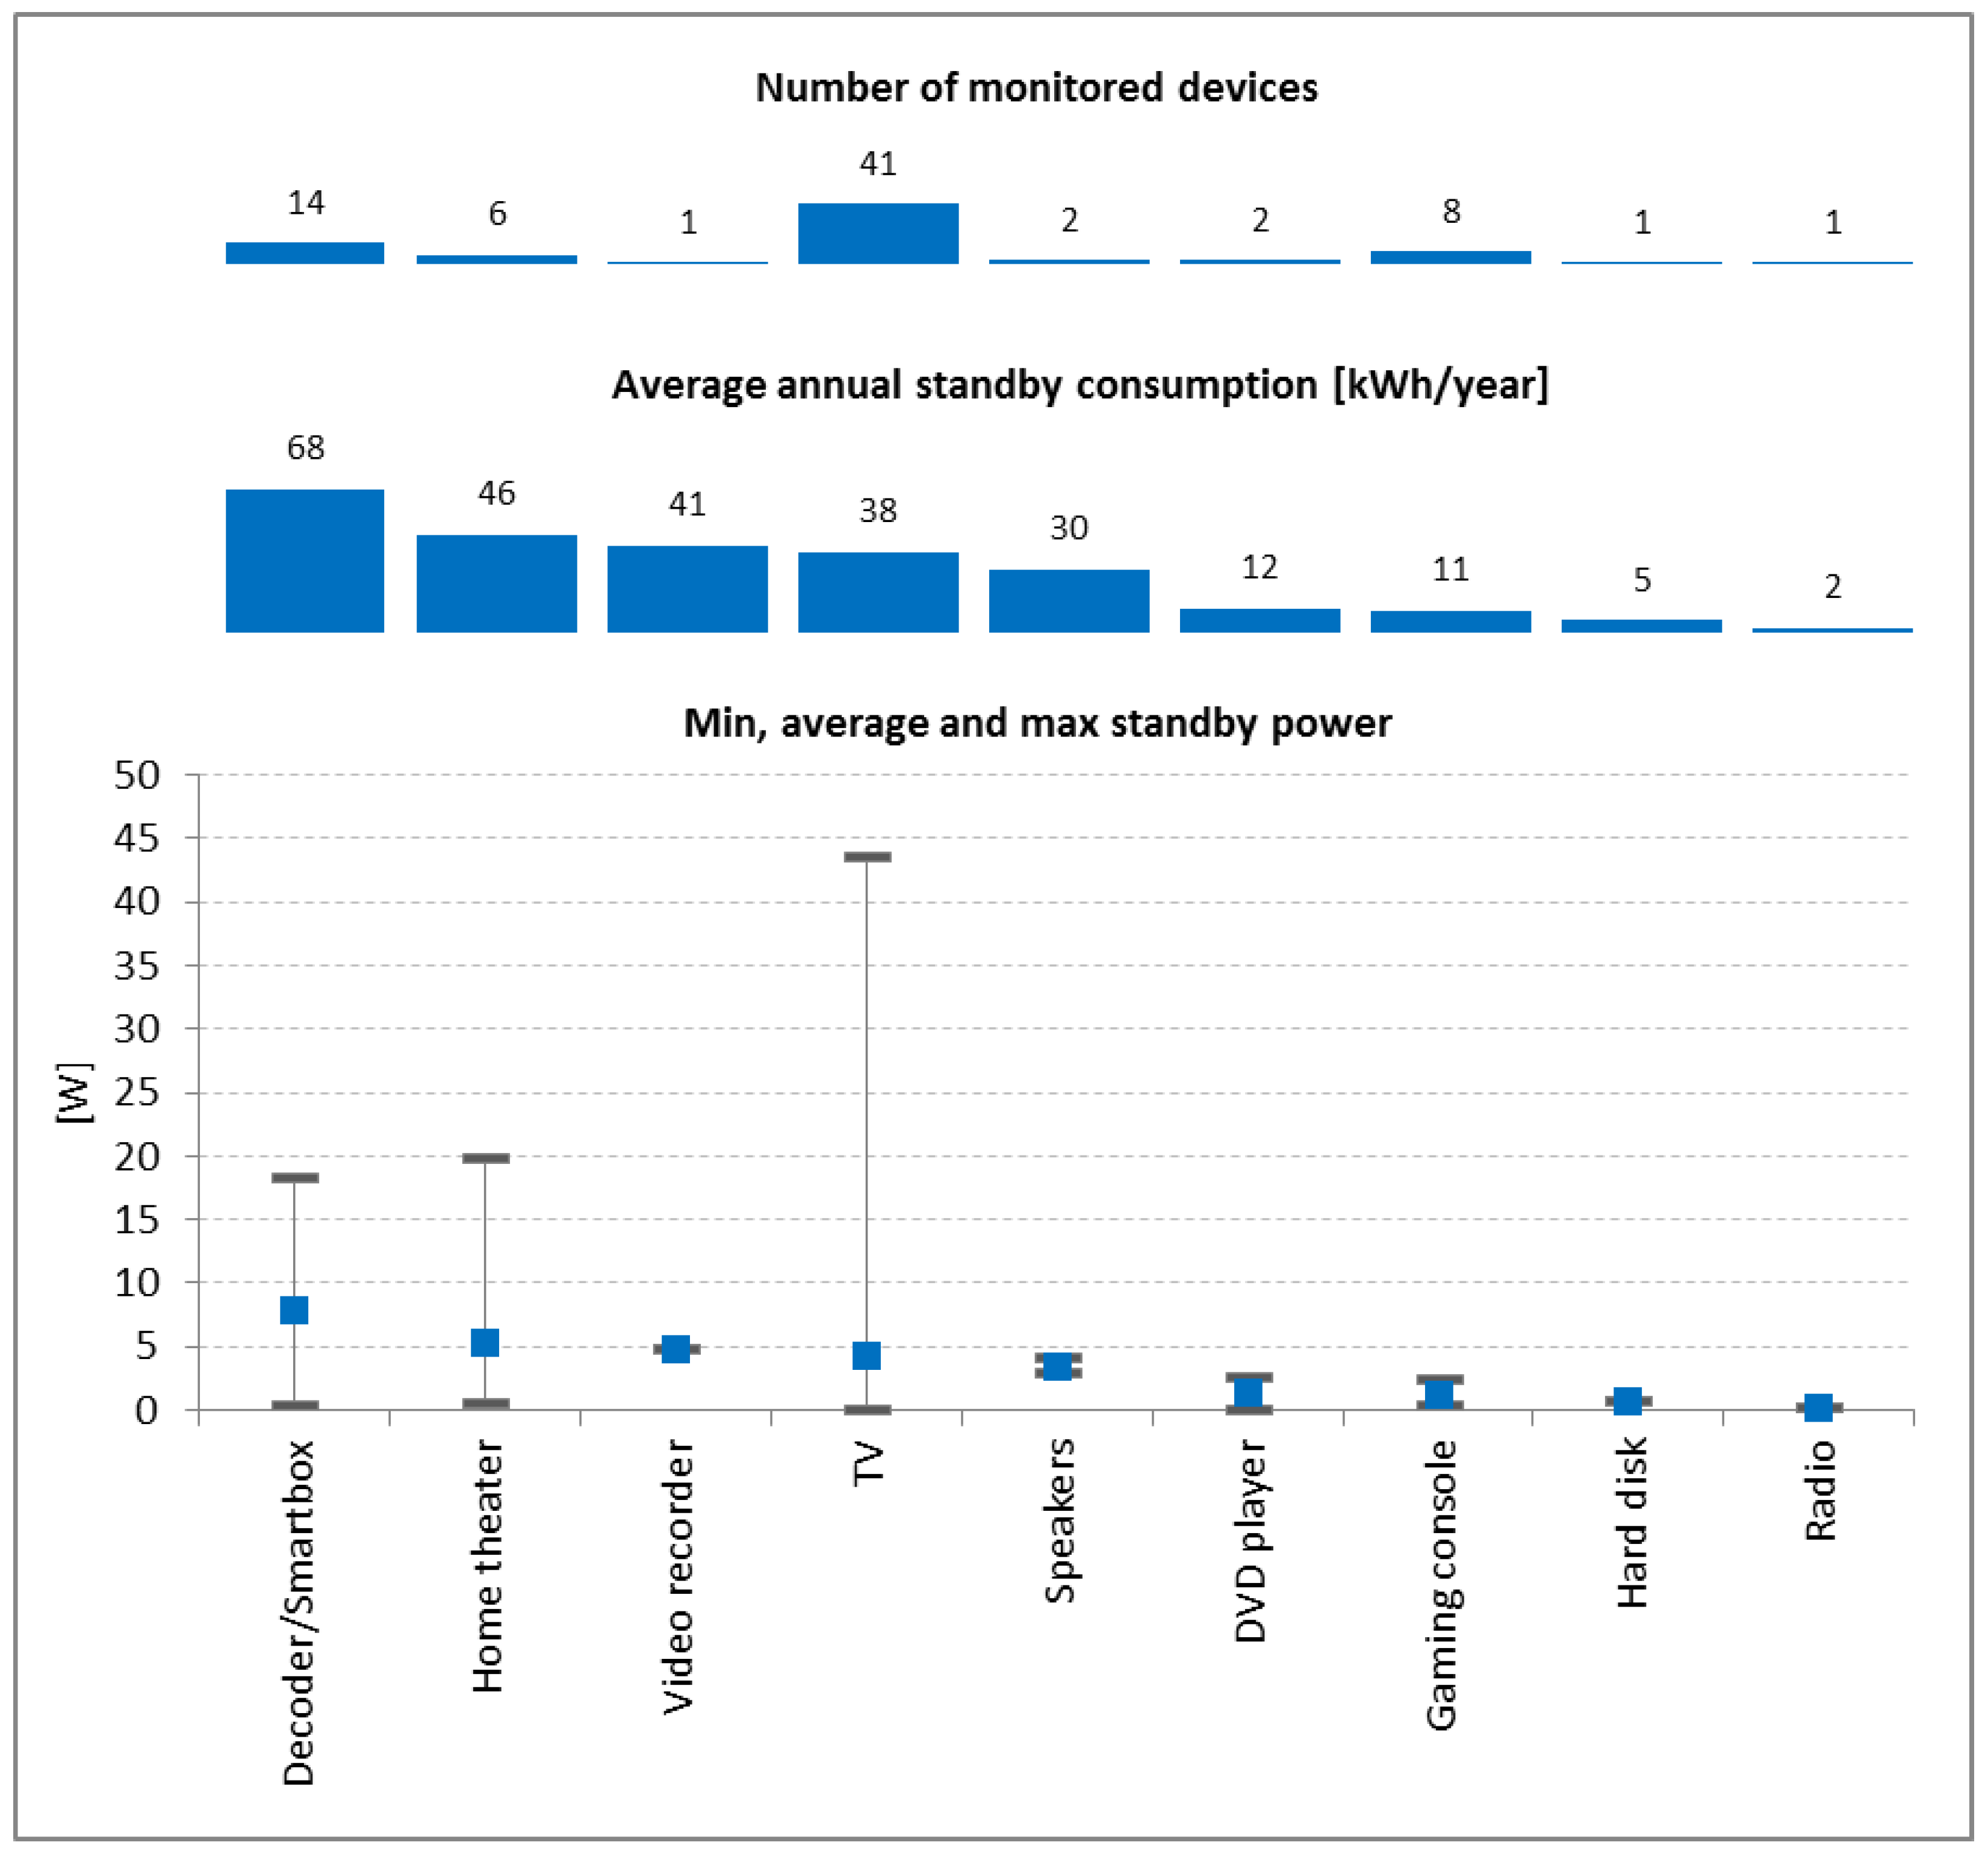
Figure 1 provides the average daily energy consumptions registered in the 28 households, as well as their contribution to the total electric consumptions.

3.2. Standby Power

Standby consumption can represent a relevant share of total consumption. This consumption is embedded in almost all appliances, but it is particularly critical for entertainment devices, on which this study focuses. In addition to the main audio–visual site, the standby analysis was extended to other appliances available in the households. Finally, 41 televisions and 35 entertaining systems were taken into account: specifically, 14 decoders and smartboxes, eight gaming consoles, six home theater systems, two speakers, two DVD players, one video recorder, one hard disk, and one radio.
The minimum, average, and maximum power for each device category and the associated average annual consumption are shown in Figure 2.
In total, 63% of TVs had a standby power demand lower than 1 W, which is the Ecodesign requirement in force for modes providing only information or status display, or providing only a combination of reactivation function and information or status display [8].

3.3. Determinants Influencing TV Consumptions
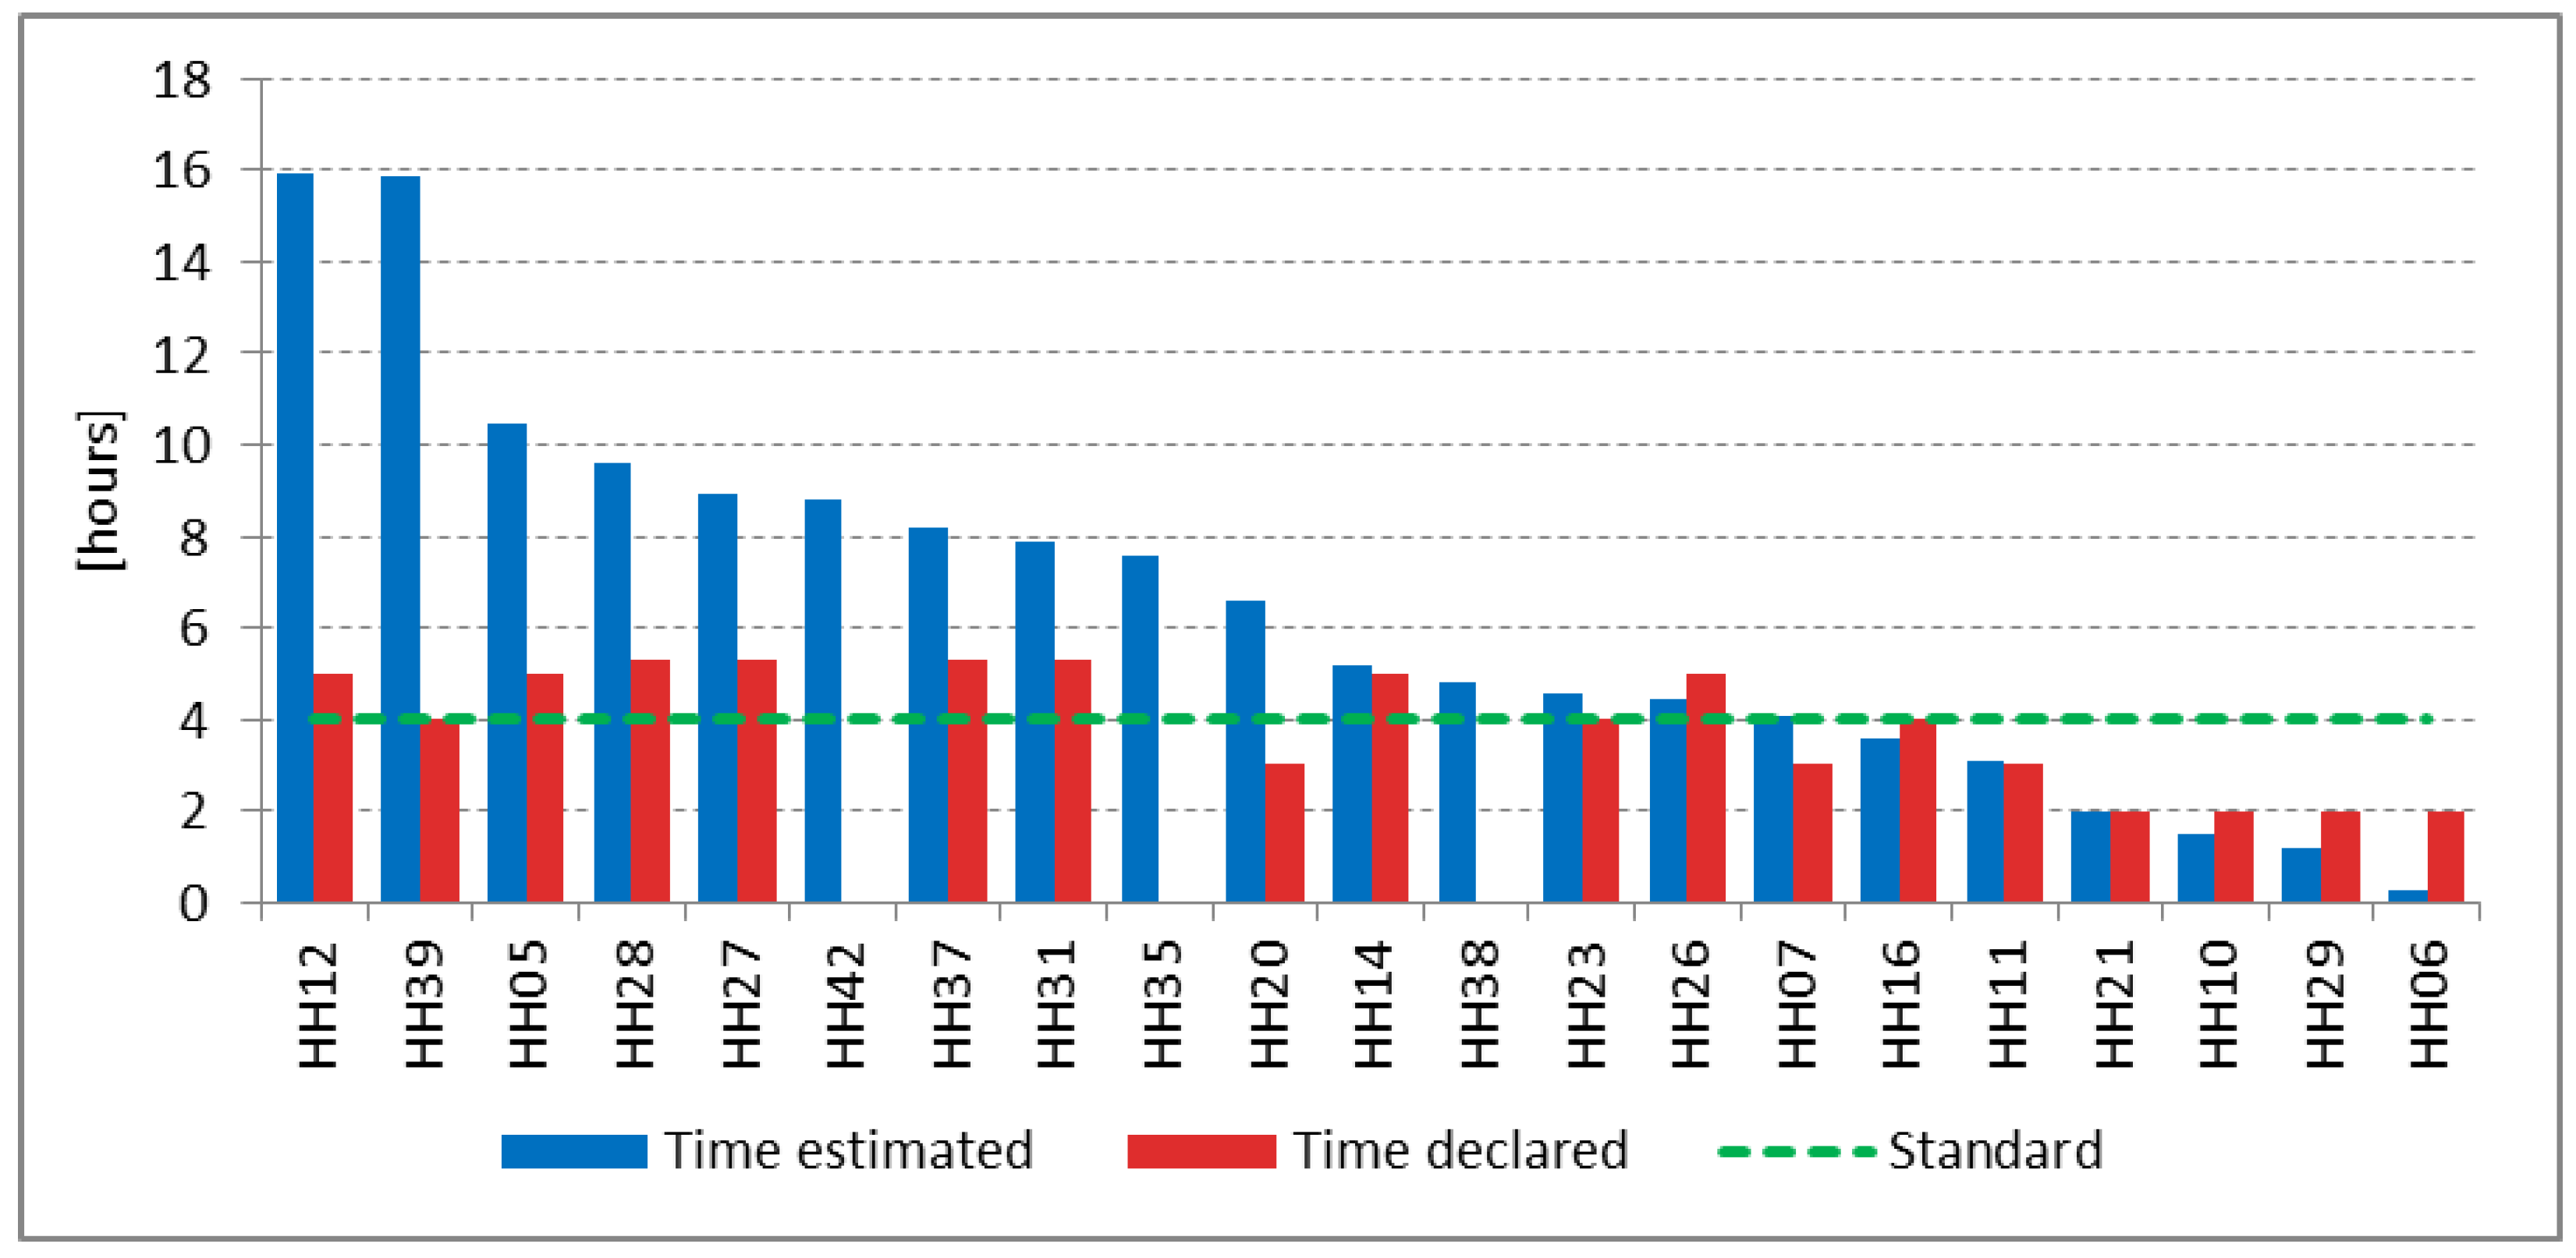
As suggested by previous studies [20], the TV power depends above all on display type, screen size, and year of purchase (to which a specific energy regulation is associated).
The analysis of manufacturing data and available energy labels allowed associating the nominal on-mode power to 20 main televisions (of which one was a plasma, 11 were LCDs with CCFLs, and eight were LCDs with LED lights). Excluding the plasma TV (as a single appliance cannot be representative of the whole category), the nominal powers were grouped by display type (Figure 3) and correlated to the screen size (Figure 4) and the year of purchase (Figure 5). By this selection, the devices with energy labels were differentiated from the appliances not labeled.
Among others, it is evident that the power reduction is correlated with the introduction of the energy labeling, since on average the nominal power of labeled LCD TVs was 43% lower than the non-labeled LCD ones. It is also interesting that good correlation was obtained between nominal power and screen size for LCD LED TVs with energy labels (Figure 4). Obviously, the small sample does not allow us to derive definitive conclusions, but the comparison with the worse correlation of LCD CFFL TVs without labels (R2 went from 0.9 to 0.3) seems to indicate that the advent of energy labeling, as well as the switch to LED light technology, lowered and stabilized the on-mode power density. However, due to the increase in screen size, the LCD LED segment also increased the nominal on-mode power in the last few years (Figure 5).
Moreover, it has to be noted that the comparison with the Ecodesign requirements [8] revealed that only two main televisions exceeded the power limit in force: specifically, the plasma TV of 2007 and an LCD CCFL TV of 2008 (i.e., bought three years before the introduction of the energy label and Ecodesign requirements).

3.4. Time of Usage

For these TVs, it was also possible to estimate the average usage time, dividing the daily average energy consumption by the nominal on-mode power. As shown in Figure 6, these data were compared with the usage declared with the questionnaires, when available.
The average estimated on-time was 6.4 hours per day, and about 40% greater than the declared time and 60% above the standard time (i.e., to the time considered for energy labeling which is four hours per day). This deviation is not surprising, since, as recognized in previous studies [29], the participants of surveys tend to underestimate their actual main television working hours because they do not want to feel judged by researchers that are analyzing their actual behavior.

4. Discussion

4.1. Comparison with Previous Studies

Table 3 shows a comparison of HESCA with the previous monitoring campaigns launched in Italy within the projects Eureco, Micene, and REMODECE, in terms of annual electric consumption (derived from the average daily consumption).
In comparison with Eureco and Micene results, HESCA registered a slight reduction (about 3%) in total electric consumptions and significant increases regarding TV (+48%) and entertainment systems (+32%). Contrariwise, after ten years, the new data seem to confirm the REMODECE results, with a small reduction (−9%) in TV consumption.
It is also interesting to compare the results with those obtained by Navigant [21] in almost the same period in Massachusetts (in 350 households) for the total energy consumption of the TVs and their peripherals. Italian results were lower in absolute terms (622 Wh per day instead of 1130 Wh per day), although higher in relative terms (9% of the total electricity consumption instead of 6% in Massachusetts). This comparison shows that the entertainment devices need to be addressed with higher attention in the EU context.
With regard to standby power, in most cases, it was far lower compared to the value measured in previous campaigns [17,25]. However, standby consumption appears to be still critical for at least two categories of devices as follows:
  • older televisions: 22% of the monitored devices have standby power demand higher than 5 W, with a peak of 43 W;
  • satellite decoders with advanced features have standby power greater than 13 W.

4.2. Lessons Learnt

This study focused on a small sample in a specific geographical area of northern Italy; thus, it was not intended as a statistical representative sample. Given these limitations, the results of the monitoring campaign provide new indicative references regarding the following:
  • the characteristics of the current TV stock, which is characterized by a high inertia (less than 30% of main TVs are labeled and almost 40% of all TVs have a standby power higher than the Ecodesign requirement);
  • the energy consumptions of different types of entertainment devices, which assume an increasing weight on the electricity bill of a household (on average, 9% in this case);
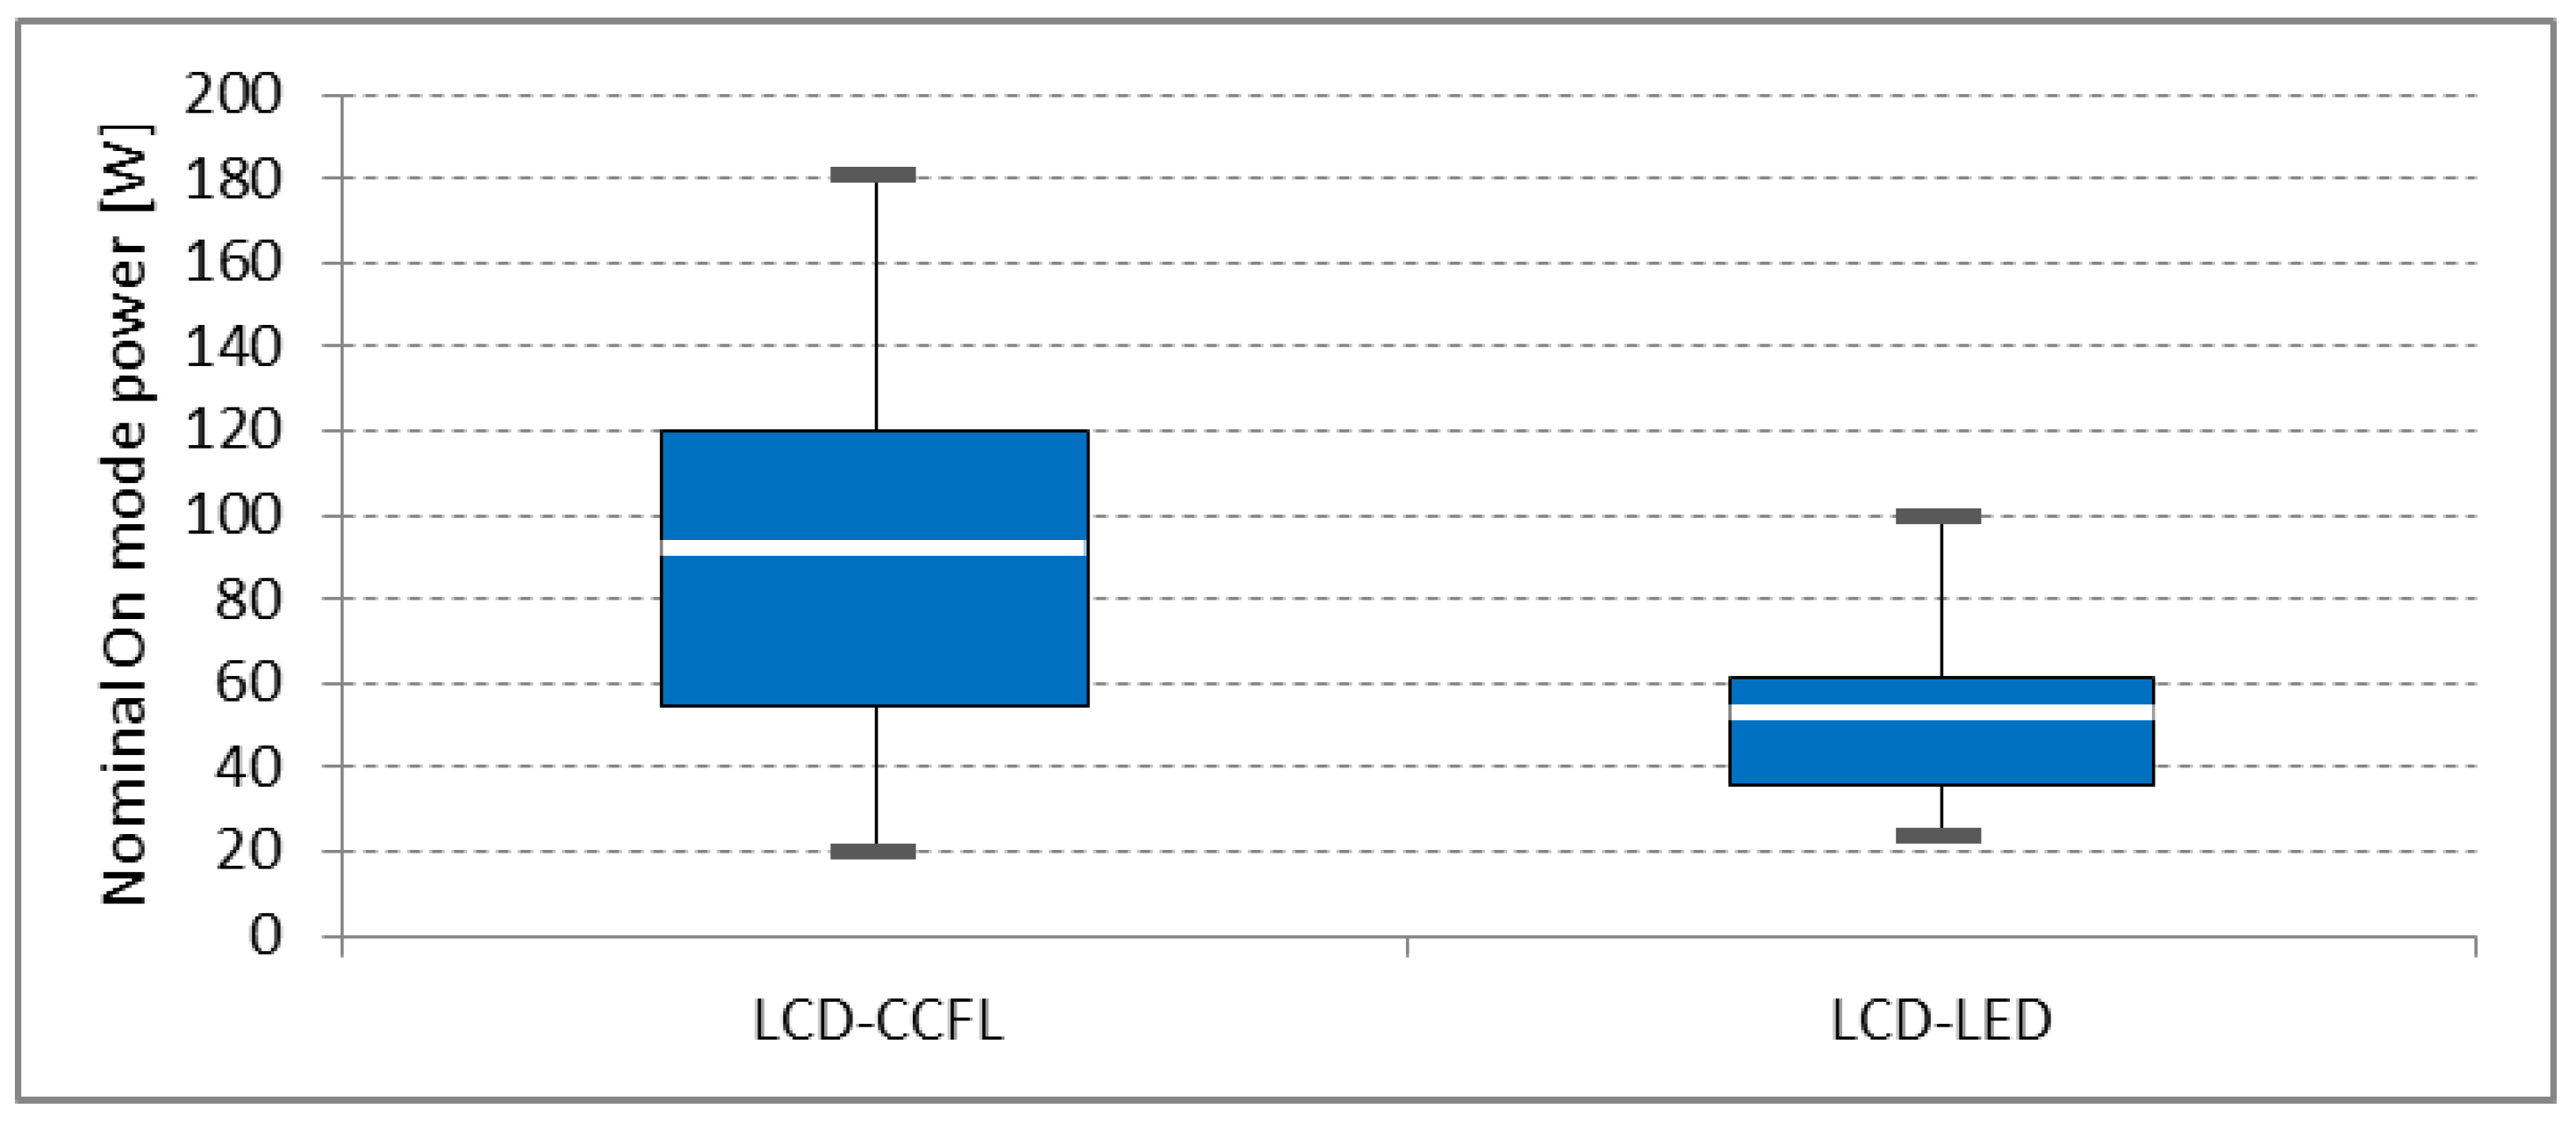
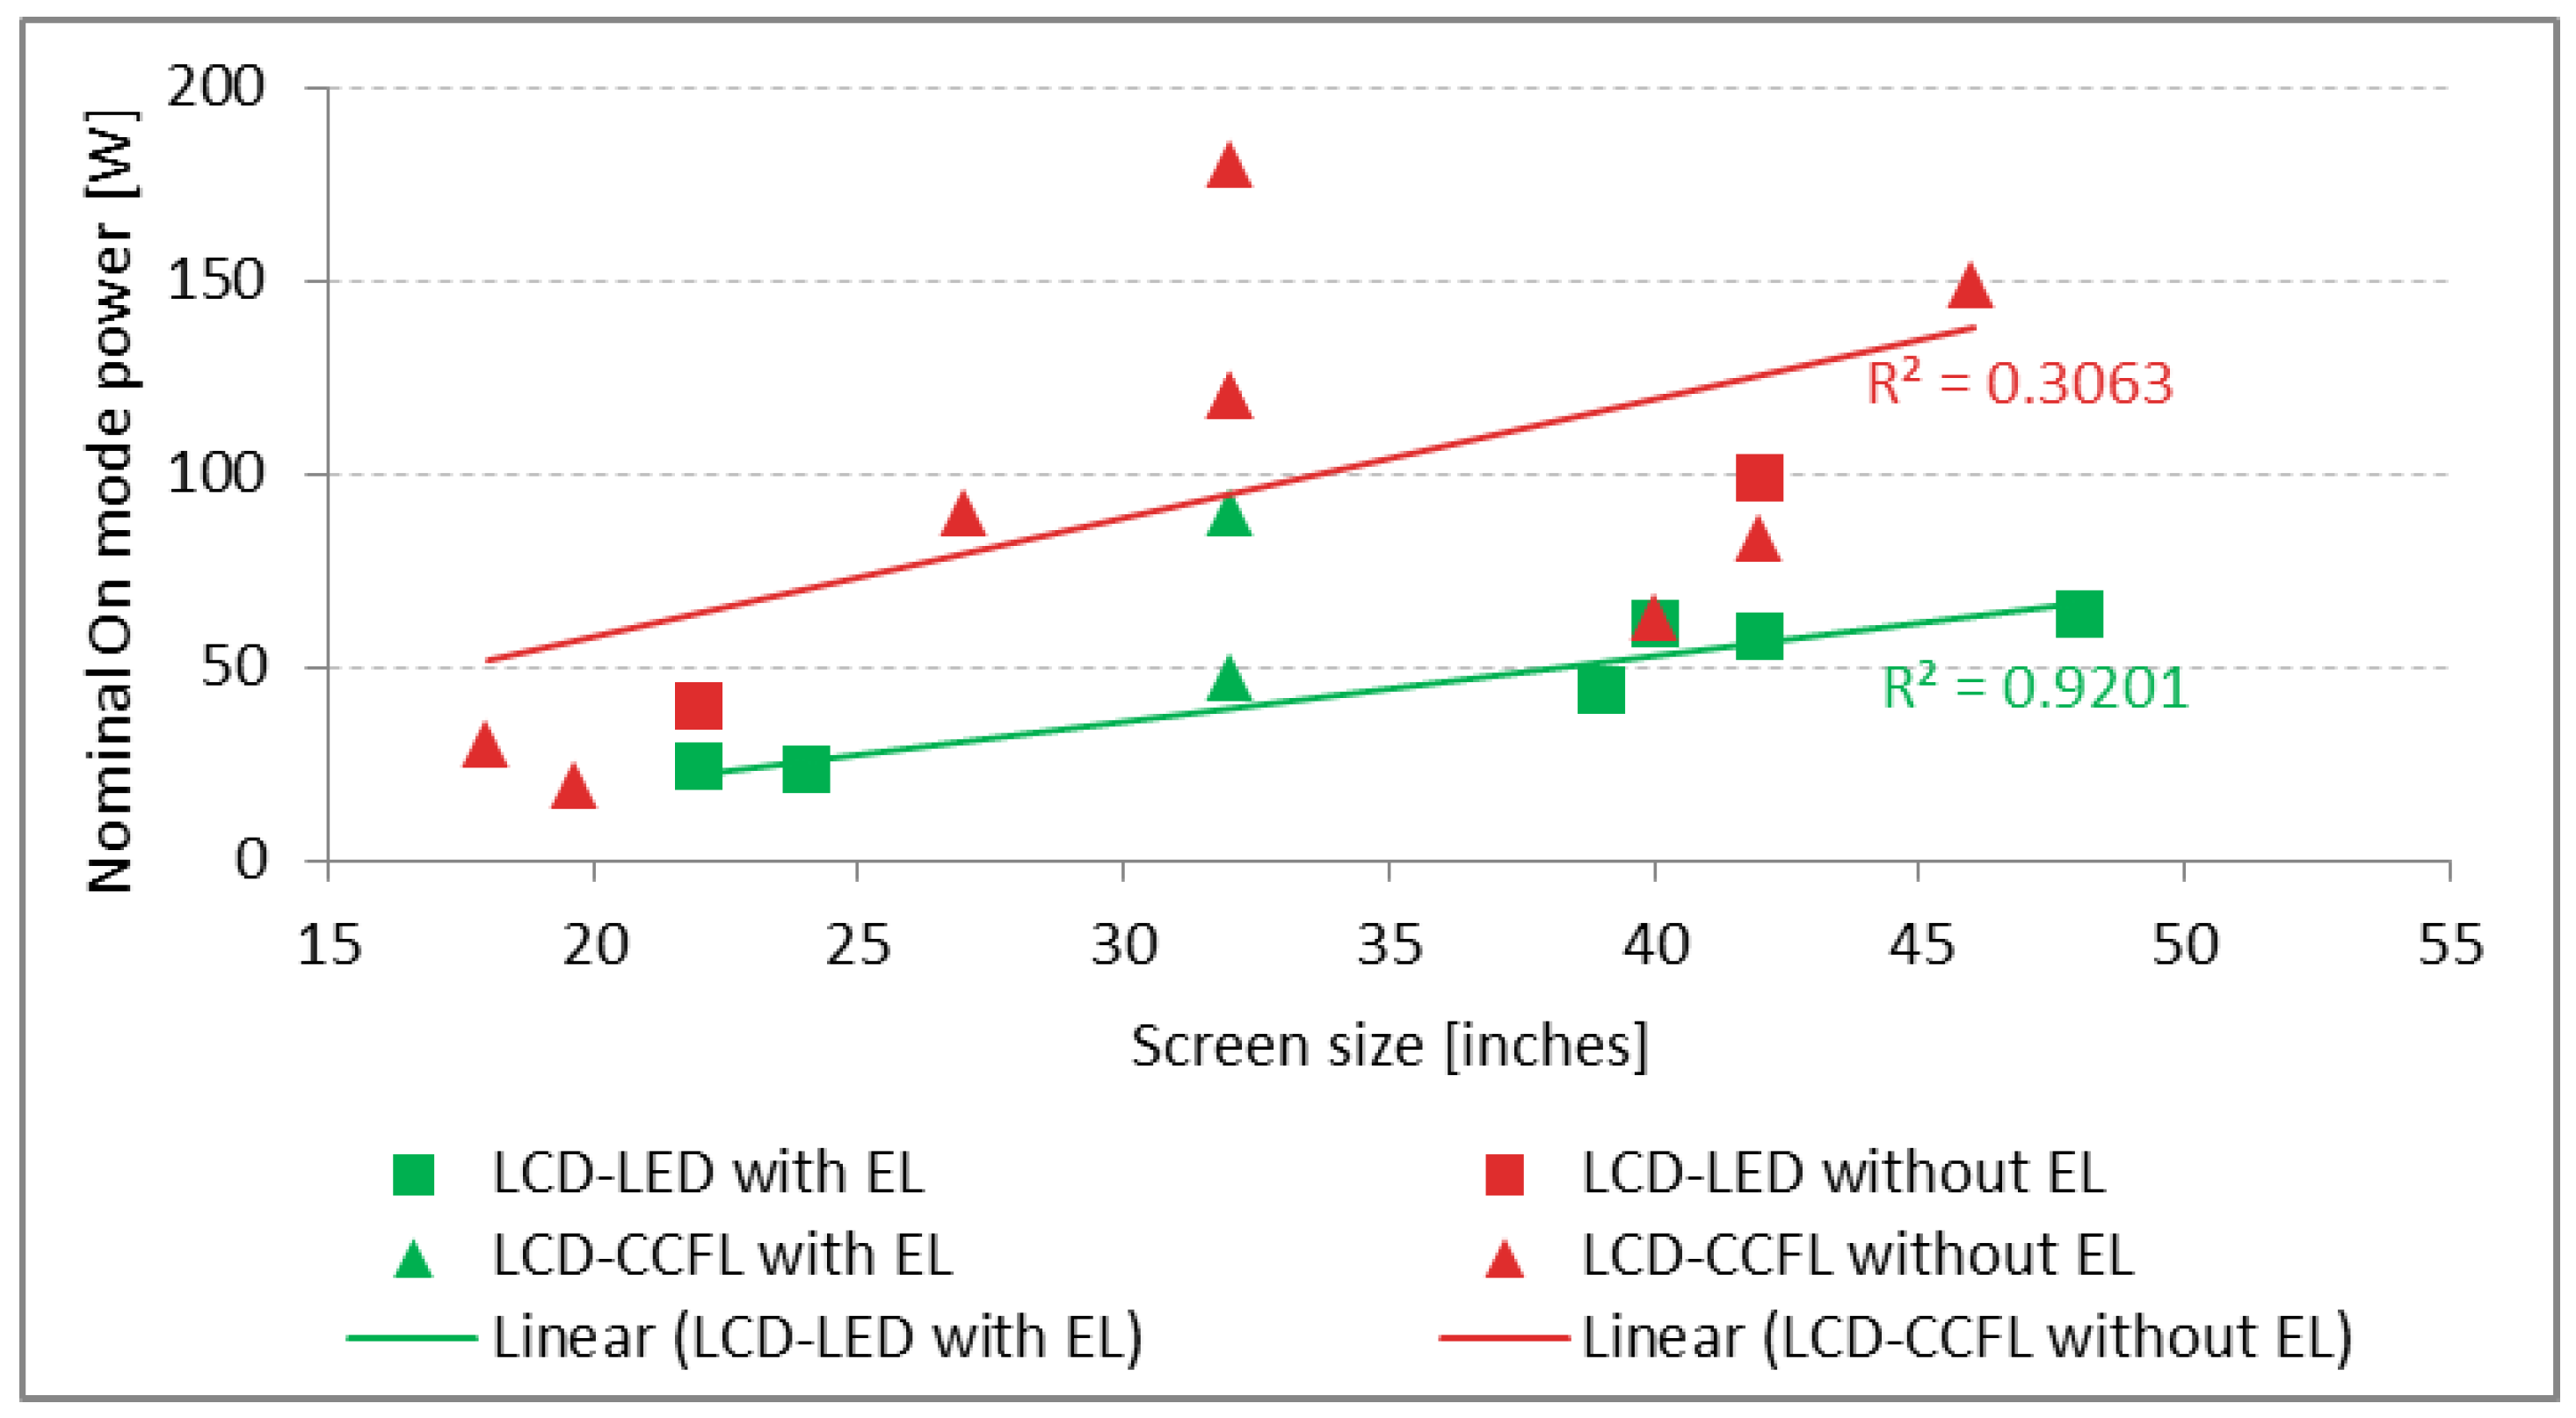
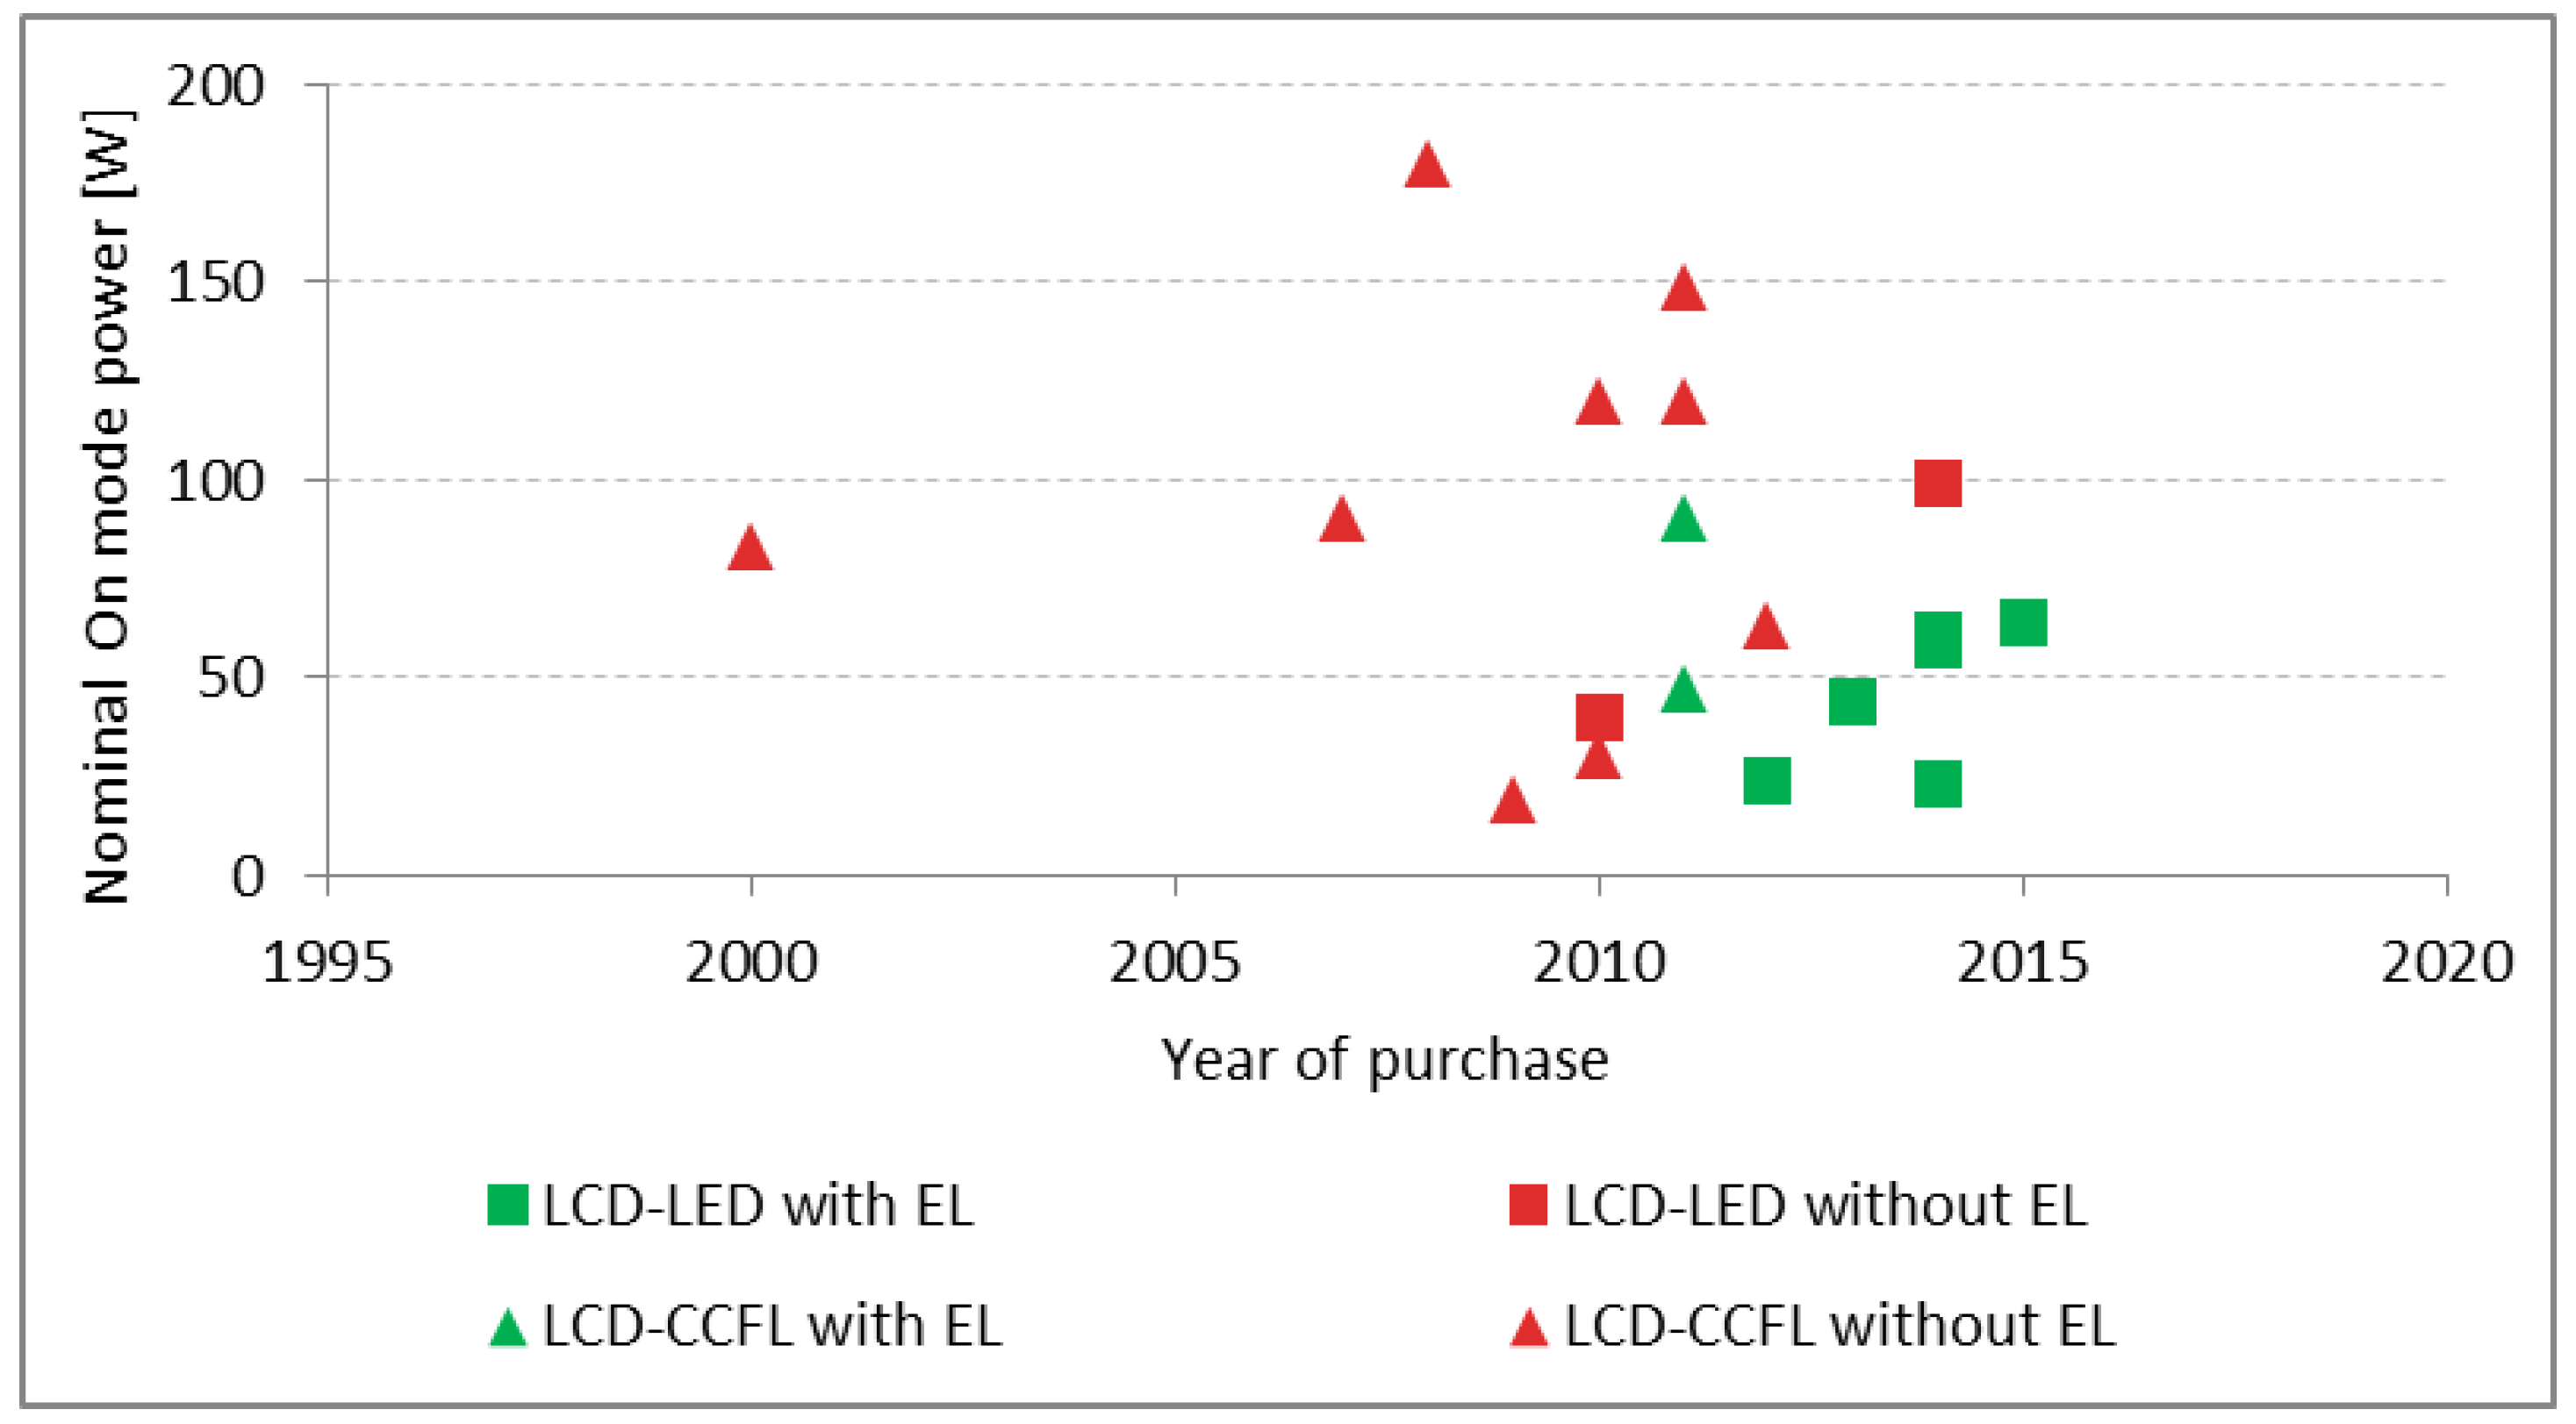
  • the better energy performance of LCDs with LED with respect to LCDs with CCFL (the average on-mode power is reduced by 43%), in addition to as a function of the screen size and the year of purchase;
  • the overall significant reduction of standby power and consumption;
  • the time of use of the main television, which results definitely higher than the reference used to calculate the annual consumption displayed on the energy label.
In terms of efficacy of the body of rules, some general consideration may be highlighted as follows:
  • although new consumption patterns are emerging, TV and its peripherals are still a major and increasing cause of electricity consumption;
  • in particular, the time of use seems to be underestimated and should be better investigated;
  • the legislation on standby power seems to be effective, but a specific regulation should be introduced for those appliances such as satellite decoders that are always on even when they are not used (because the TV to which they are connected is off).

5. Conclusions

Even if the energy consumption of the devices is becoming increasingly relevant in the energy bill of a household, very few new monitoring campaigns concerning TVs and connected entertainment systems were organized in the last ten years. This is true especially in the European Union, where the Ecodesign and energy labeling requirements for televisions entered in force in 2011.
For this reason, we organized a new low-budget campaign, which was focused on the energy consumption and time of usage of the main televisions and connected devices in 28 households in northern Italy. On one hand, the analysis of monitored data highlights the technological developments in recent years, which were strongly catalyzed by the international regulations that were introduced. On the other hand, significant reductions of real energy consumptions were not observed with respect to previous monitoring campaigns.
The information obtained with this experience can serve as a basis for future analysis of the real electricity consumption of visual entertainment systems. To support the decision-making process, more measurements are desirable. It is necessary to observe carefully the changes over time and include new (numerous) appliances that are now reaching the market. It is also crucial to keep track of the influence of new purchase preferences, such as choosing displays even larger and even more connected to decoders and streaming services, as well as the behavioral habits of users. Such measurements will permit us to provide better indications about the energy impact of our home entertainment, as well as to design suitable strategies to reach a saving potential that appears consistent.

Author Contributions

Conceptualization, G.R. and P.P.; methodology, G.R.; formal analysis, P.Z. and M.B.; investigation, M.B.; data curation, P.Z. and M.B.; writing—original draft preparation, G.R. and P.Z.; writing—review and editing, G.R., P.Z. and P.P.

Funding

This research received no external funding.

Acknowledgments

The measurement campaign was organized following the advice of Danny Parker, Florida Solar Energy Center. The analysis was discussed with Paolo Bertoldi European Commission, Joint Research Centre.

Conflicts of Interest

The authors declare no conflict of interest.

References

  1. Tsemekidi-Tzeiranaki, S.; Bertoldi, P.; Labanca, N.; Castellazzi, L.; Serrenho, T.; Economidou, M.; Zangheri, P. Energy Consumption and Energy Efficiency Trends in the EU-28 for the Period 2000–2016; Publications Office of the European Union: Luxembourg, 2018. [Google Scholar]
  2. EUROSTAT Database. Available online: https://ec.europa.eu/eurostat/data/database (accessed on 4 January 2019).
  3. Bertoldi, P.; Atanasiu, B. Electricity Consumption and Efficiency Trends in the Enlarged European Union; Status Report 2006 EUR 22753; EN Joint Research Centre, Institute for Environment and Sustainability: Ispra, Italy, 2007. [Google Scholar]
  4. Bertoldi, P.; Hirl, B.; Labanca, N. Energy Efficiency Status Report 2012 Electricity Consumption and Efficiency Trends in the EU-27 Report EUR 25405; EN Joint Research Centre, Institute for Energy and Transport: Ispra, Italy, 2012. [Google Scholar]
  5. International Energy Agency (IEA). Gadgets and Gigawatts. Policies for Energy Efficient Electronics; International Energy Agency: Paris, France, 2009. [Google Scholar]
  6. Almeida, A.; Fonseca, P.; Schlomann, B.; Feilberg, N. Characterization of the household electricity consumption in the EU, potential energy savings and specific policy recommendations. Energy Build. 2011, 43, 1884–1894. [Google Scholar] [CrossRef] [Green Version]
  7. Stobbe, L. EuP Preparatory Studies “Televisions” (Lot 5) Report for Tender No. TREN/D1/40 lot 5-2005; Fraunhofer IZM: Berlin, Germany, 2007. [Google Scholar]
  8. EU. COMMISSION REGULATION (EC) No 642/2009 of 22 July 2009 Implementing Directive 2005/32/EC of the European Parliament and of the Council with Regard to Ecodesign Requirements for Televisions. Available online: https://eur-lex.europa.eu/legal-content/EN/TXT/?uri=CELEX%3A32009R0642 (accessed on 2 May 2019).
  9. EU. Directive 2009/125/EC of the European Parliament and of the Council of 21 October 2009 Establishing a Framework for the Setting of Ecodesign Requirements for Energy-Related Products (Recast). Available online: https://eur-lex.europa.eu/legal-content/EN/ALL/?uri=celex%3A32009L0125 (accessed on 2 May 2019).
  10. EU. Commission Delegated Regulation (EU) No 1062/2010 of 28 September 2010 Supplementing Directive 2010/30/EU of the European Parliament and of the Council with Regard to Energy Labelling of Televisions. Available online: https://publications.europa.eu/en/publication-detail/-/publication/42aff9c5-a5f9-45a1-a0bf-004419737ded/language-en (accessed on 2 May 2019).
  11. EU. Directive 2010/30/EU of the European Parliament and of the Council of 19 May 2010 on the Indication by Labelling and Standard Product Information of the Consumption of Energy and Other Resources by Energy-Related Products (Recast). Available online: http://www.buildup.eu/en/practices/publications/directive-201030eu-european-parliament-and-council-19-may-2010-indication (accessed on 2 May 2019).
  12. EU. Commission Regulation (EU) No 801/2013 of 22 August 2013 Amending Regulation (EC) No 1275/2008 with Regard to Ecodesign Requirements for Standby, Off Mode Electric Power Consumption of Electrical and Electronic Household and Office Equipment, and Amending Regulation (EC) No 642/2009 with Regard to Ecodesign Requirements for Televisions. Available online: https://eur-lex.europa.eu/legal-content/EN/TXT/?uri=celex%3A32013R0801 (accessed on 2 May 2019).
  13. Michel, A.; Attali, S.; Bush, E. European TV Market 2007–2013 Energy Efficiency before and during the Implementation of the Ecodesign and Energy Labelling Regulations—Second Report, Complemented with 2013 Sales Data; Topten International Services: Zurich, Switzerland, 2014. [Google Scholar]
  14. Crosbie, T. Household energy consumption and consumer electronics: The case of television. Energy Policy 2008, 36, 2191–2199. [Google Scholar] [CrossRef]
  15. Pothitou, M.; Hanna, R.F.; Chalvatzis, K.J. ICT entertainment appliances’ impact on domestic electricity consumption. Renew. Sustain. Energy Rev. 2017, 69, 843–853. [Google Scholar] [CrossRef] [Green Version]
  16. Sidler, O. DSM: Major Findings of an End-Use Metering Campaign in 400 Households of Four European Countries ECEEE 2003 Summer Study; European Council for an Energy Efficient Economy (ECEEE): Saint Raphael, France, 2003; pp. 467–474. [Google Scholar]
  17. Di Andrea, F.; Danese, A. Risultati delle Campagne di Rilevamento dei Consumi Elettrici Presso 110 Abitazioni in Italia End-Use; Politecnico di Milano: Milan, Italy, 2004. [Google Scholar]
  18. Grinden, B.; Feilberg, N. Analysis of Monitoring Campaign in Europe Report D10 EIE/05/124/SI2.419657 REMODECE PROJECT. Available online: https://remodece.isr.uc.pt/ (accessed on 2 May 2019).
  19. Sutherland, K.; Parker, D.; Martin, E.; Chasar, D.; Amos, B. Phased Retrofits in Existing Homes in Florida Phase I: Shallow and Deep Retrofits. Available online: https://www.osti.gov/biblio/1238242 (accessed on 2 May 2019).
  20. Urban, B.; Roth, K.; Singh, M.; Howes, D. Energy Consumption of Consumer Electronics in U.S. Homes in 2017; Final Report; Consumer Technology Association, Center for Sustainable Energy Systems Fraunhofer USA: Plymouth, MI, USA, 2017. [Google Scholar]
  21. Navigant. Massachusetts Baseline Load Shape Study (RES 1). Available online: https://www.google.com.hk/url?sa=t&rct=j&q=&esrc=s&source=web&cd=2&cad=rja&uact=8&ved=2ahUKEwjKy-367YriAhVUfXAKHR34CD8QFjABegQIBBAC&url=http%3A%2F%2Fma-eeac.org%2Fwordpress%2Fwp-content%2Fuploads%2FRES-1-Baseline-Load-Shape-Study-Cooling-Season-Report-Final.pdf&usg=AOvVaw1bU_Ytdb8gxXR_8qUqo6yF (accessed on 2 May 2019).
  22. Sakah, M.; du Can, S.D.; Diawuo, F.A.; Sedzro, M.D.; Kuhn, C. A study of appliance ownership and electricity consumption determinants in urban Ghanaian households. Sustain. Cities Soc. 2019, 44, 559–581. [Google Scholar] [CrossRef]
  23. Istituto Nazionale di Statistica (ISTAT). Annuario Statistico Italiano. Available online: https://www.istat.it/it/files/2017/12/Asi-2017.pdf (accessed on 6 May 2019).
  24. Auditel-CENSIS. 1° RAPPORTO AUDITEL—CENSIS Convivenze, Relazioni e Stili di vita Delle Famiglie Italiane. Available online: http://www.auditel.it/media/pdf/rapporto-Censi-Auditel-2018-vers-integrale.pdf (accessed on 6 May 2019).
  25. Enertech. Mesure de la Consommation des Usages Domestiques de L’audiovisuel et de L’informatique—Projet REMODECE Rapport Final. Available online: https://remodece.isr.uc.pt/ (accessed on 6 May 2019).
  26. Sidler, O. Maîtrise de la Demande d’Electricité: Campagne de Mesures par Usages dans le Secteur Domestique—Projet Ciel—ADEME, EDF DER, Commission des Communautés Européennes—Rapport final—06/1996. Available online: https://www.enertech.fr/docs/Remodece_rapport_final.pdf (accessed on 6 May 2019).
  27. Sidler, O. Etude Expérimentale des Appareils Électroménagers à Haute Efficacité Énergétique Placé en Situation Réelle—Projet Ecodrôme—ADEME, Commission des Communautés Européennes—Rapport Final. Available online: https://www.enertech.fr/modules/catalogue/pdf/54/Economie%20electromenager%20performant_1995-1997.pdf (accessed on 6 May 2019).
  28. Autorità per l’Energia Elettrica il Gas e il Sistema Idrico (AEEGSI). Relazione di Analisi di Impatto della Regolazione—Riforma delle Tariffe di rete e delle Componenti Tariffarie a Copertura degli Oneri Generali di Sistema per i Clienti Domestici di Energia Elettrica Autorità per l’Energia Elettrica il Gas e il Sistema Idrico; AEEGSI: Milano/Roma, Italy, 2016. [Google Scholar]
  29. Jones, R.V.; Lomas, K. Determinants of high electrical energy demand in UK homes: Appliance ownership and use. Energy Build. 2016, 117, 71–82. [Google Scholar] [CrossRef] [Green Version]
Figure 1. Energy consumption of televisions and entertainment systems in the different households (in Wh/day and as a percentage of the total electricity consumption).
Energies 12 01741 g001
Figure 2. Average standby consumption (kWh/year). Minimum, average, and maximum standby power demand for different classes of devices (television (TV) and peripherals).
Energies 12 01741 g002
Figure 3. Statistical analysis of nominal on-mode power for different liquid crystal display (LCD) technologies: minimum, quartile Q1, quartile Q2 (median), quartile Q3, and maximum.
Energies 12 01741 g003
Figure 4. Relationship between nominal power and screen size for different LCD technologies (EL: energy label).
Energies 12 01741 g004
Figure 5. Relationship between nominal power and year of purchase for different LCD technologies (EL: energy label).
Energies 12 01741 g005
Figure 6. Comparison between estimated and declared time of usage. The standard use refers to the time considered for energy labeling.
Energies 12 01741 g006
Table 1. Sample size in previous monitoring campaigns.
Geographical ContextDateSample SizeCampaignReference
France1995111Enertech, Project Ciel[26]
Portugal199525CCE[26]
France199820Enertech, Project ECODROME[27]
Italy2001102EERG, Project EURECO[16]
Italy2002110EERG, Project Micene[17]
Italy200960EERG, Project REMODECE[25]
Florida201760Florida Solar Energy Center[19]
Massachusetts2018350Navigant[21]
Table 2. Main characteristics of the monitored households (SFH: single-family house, AB: apartment block, TV: television, ES: entertainment system, LCD: liquid crystal display, LED: light-emitting diode, CCFL: cold cathode fluorescent lamp, DVD: digital versatile disc, CRT: cathode ray tube).
HouseholdLocation (Province)Building TypeMain TV MonitoredStandby Monitored
TechnologyEnergy LabelTVESType of ES
HH04MilanSFHUnclear-11Gaming console
HH05MilanABLCD LEDA10-
HH06MilanABLCD CCFL-10-
HH07MilanSFHLCD CCFL-12Decoder/smartbox, gaming console
HH10MilanABLCD CCFL-11TV, gaming console
HH11MilanABLCD CCFL-10-
HH12MilanABLCD CCFL-11Decoder/smartbox
HH14MilanSFHLCD CCFL-12Decoder/smartbox, Home theater
HH16MilanABLCD CCFLB11DVD player
HH17MilanABLCD CCFL-10-
HH18MilanABUnclear-11Decoder/smartbox
HH20MilanABLCD LEDA11Decoder/smartbox
HH21VareseABLCD LEDA22Speakers, Decoder/smartbox
HH23VareseSFHUnclear-30-
HH26VareseSFHLCD CCFL-12Gaming console, radio
HH27VareseSFHLCD CCFL-10-
HH28VareseSFHLCD CCFL-23Satellite decoder, decoder/smartbox, home theater
HH29VareseSFHPlasma-22Home theater, video recorder
HH31VareseSFHLCD LEDA+34Home theater, home theater, decoder/smartbox, gaming console
HH32VareseSFHLCD CCFL-10-
HH33VareseABunclear-10-
HH35VareseSFHLCD CCFL-10-
HH36VareseSFHLCD CCFL-21DVD player
HH37VareseABLCD LEDA10-
HH38VareseABLCD LED-11Gaming console
HH39VareseSFHLCD LEDA+46Speakers, home theater, decoder/smartbox, gaming console, decoder/smartbox, gaming console
HH42VareseABLCD CCFLB 0-
HH44VareseSFHCRT-10-
HH09 *MilanUnclear--11Decoder/smartbox
HH24 *VareseSFH--11Decoder/smartbox
HH30 *VareseSFH--13Hard disk, decoder/smartbox, gaming console
HH43 *VareseUnclear--11Decoder/smartbox
* Households included only in the standby measurements and analysis.
Table 3. Comparison between annual consumptions derived from this study and previous monitoring campaigns.
Data ComparisonEURECO
(2001)
MICENE
(2003–2004)
REMODECE (2007–2008)HESCA
(2017)
Sample size (number of households)1021106028
Annual electric consumption (kWh/year)Average household3157322930503139
Average TV124122197180
Average entertainment devices70719694

