Article

Analysis of the Temperature Characteristics of Three-Phase Coaxial Superconducting Power Cable according to a Liquid Nitrogen Circulation Method for Real-Grid Application in Korea

1
Department of Electrical Engineering, Changwon National University, Changwon 641-773, Korea
2
Korea Electric Power Corporation Research Institute, Daejeon 34056, Korea
*
Author to whom correspondence should be addressed.
Energies 2019, 12(9), 1740; https://doi.org/10.3390/en12091740
Submission received: 14 April 2019 / Revised: 3 May 2019 / Accepted: 6 May 2019 / Published: 8 May 2019

Abstract

:
Large-capacity superconducting power cables are in the spotlight to replace existing underground transmission power cables for energy power transmission. Among them, the three-phase coaxial superconducting power cable has the economic advantage of reducing the superconducting shielding layer by enabling magnetic shielding when the three phases are homogeneous without an independent superconducting shielding layer for magnetic shielding. In order to develop the three-phase coaxial superconducting power cable, the electrical and structural design should be carried out to construct the superconducting layer. However, the thermal design and analysis for the cooling of the three-phase coaxial superconducting power cable must be done first, so that the electrical design can be made using the temperature transferred to the superconducting layer. The three-phase coaxial superconducting cable requires a cooling system to circulate the cryogenic refrigerant for cooling below a certain temperature, and the structure of the cable through which the cryogenic refrigerant travels must also be analyzed. In this paper, the authors conducted a longitudinal temperature analysis according to the structure of the refrigerant circulation system of the cable and proposed a refrigerant circulation system suitable for this development. The temperature profile according to this analysis was then used as a function of temperature for the electrical (superconducting and insulating layers) design of the three-phase coaxial superconducting power cable. It is also expected to be used to analyze the cooling structure of the three-phase coaxial superconducting power cable installed in the real grid system.

1. Introduction

In response to increasing global energy demand, interest in energy transmission as well as energy supply is increasing. Underground transmission power cables, one of the existing power transmission means, have already reached the saturation level due to insufficient space in downtown areas where power demand is concentrated. Superconducting power cables have been attracting attention in recent years to replace conventional power cables, which are power transmission means in such a saturated state. For superconducting power cables, the electric resistance becomes zero below a certain temperature. This characteristic makes it possible to transmit five to six times more power than the same-sized power cable [1,2,3]. Despite these advantages of superconducting power cables, the price of superconducting wire, which can realize superconducting characteristics, is expensive. In particular, the shielding layer, as well as the conductor layer, is formed using superconducting wire to shield the magnetic field flowing to the outside, making the production cost high. However, the three-phase coaxial superconducting power cable can prevent the leakage of the magnetic field to the outside, unlike the conventional superconducting power cable, because the three-phase superconducting conductor layer is formed in the radial direction with respect to the same axis. Also, the absence of a superconducting shield layer means that the amount of superconducting wire entering the superconducting power cable at the same capacity can be reduced to an ideal half, which means that the manufacturing cost of the superconducting power cable can be halved. A domestic project is underway to develop a three-phase coaxial superconducting power cable capable of transmitting a large amount of electric power and applying it to an actual system. In order to develop a three-phase coaxial superconducting power cable, the electrical and structural design of the cable must proceed. However, it is necessary to study the cooling circulation structure of cryogenic refrigerant through the cooling system to understand the characteristics of the superconducting power cable. Cryogenic liquid nitrogen is mainly used as a refrigerant for cooling a superconducting power cable. The superconducting power cable cooling system primarily uses the circulation structure of the cryogenic coolant. The three-phase coaxial superconducting power cable with such a circulation structure can be configured in various circulation forms according to the structure of the cable. Therefore, it is necessary to analyze the temperature profile of the cable according to the cooling structure of the refrigerant circulation system and according to various structures. In this paper, the authors conducted an analysis of the cable temperature distribution according to the refrigerant circulation method of the three-phase coaxial superconducting power cable with various structures as well as the optimum structure according to the cable application length. In the calculation of the temperature distribution of a typical superconducting cable, it is possible to apply a simple theoretical formula such as a calorific value calculation formula. However, in the analysis of the structure having a hollow pipe, it is necessary to consider the heat transfer between the superconducting layer and the PPLP insulating layer, so that the FEM simulation capable of heat transfer analysis is required. Therefore, in this paper, we present an optimal circulation system by analyzing liquid nitrogen circulation system in various cases using numerical method using FEM. The analytical results of this paper will serve as useful information for the analysis and determination of the cooling and circulating structure system of the commercial-grade three-phase coaxial superconducting power cable [4,5,6,7,8,9,10,11,12,13,14,15,16,17,18].

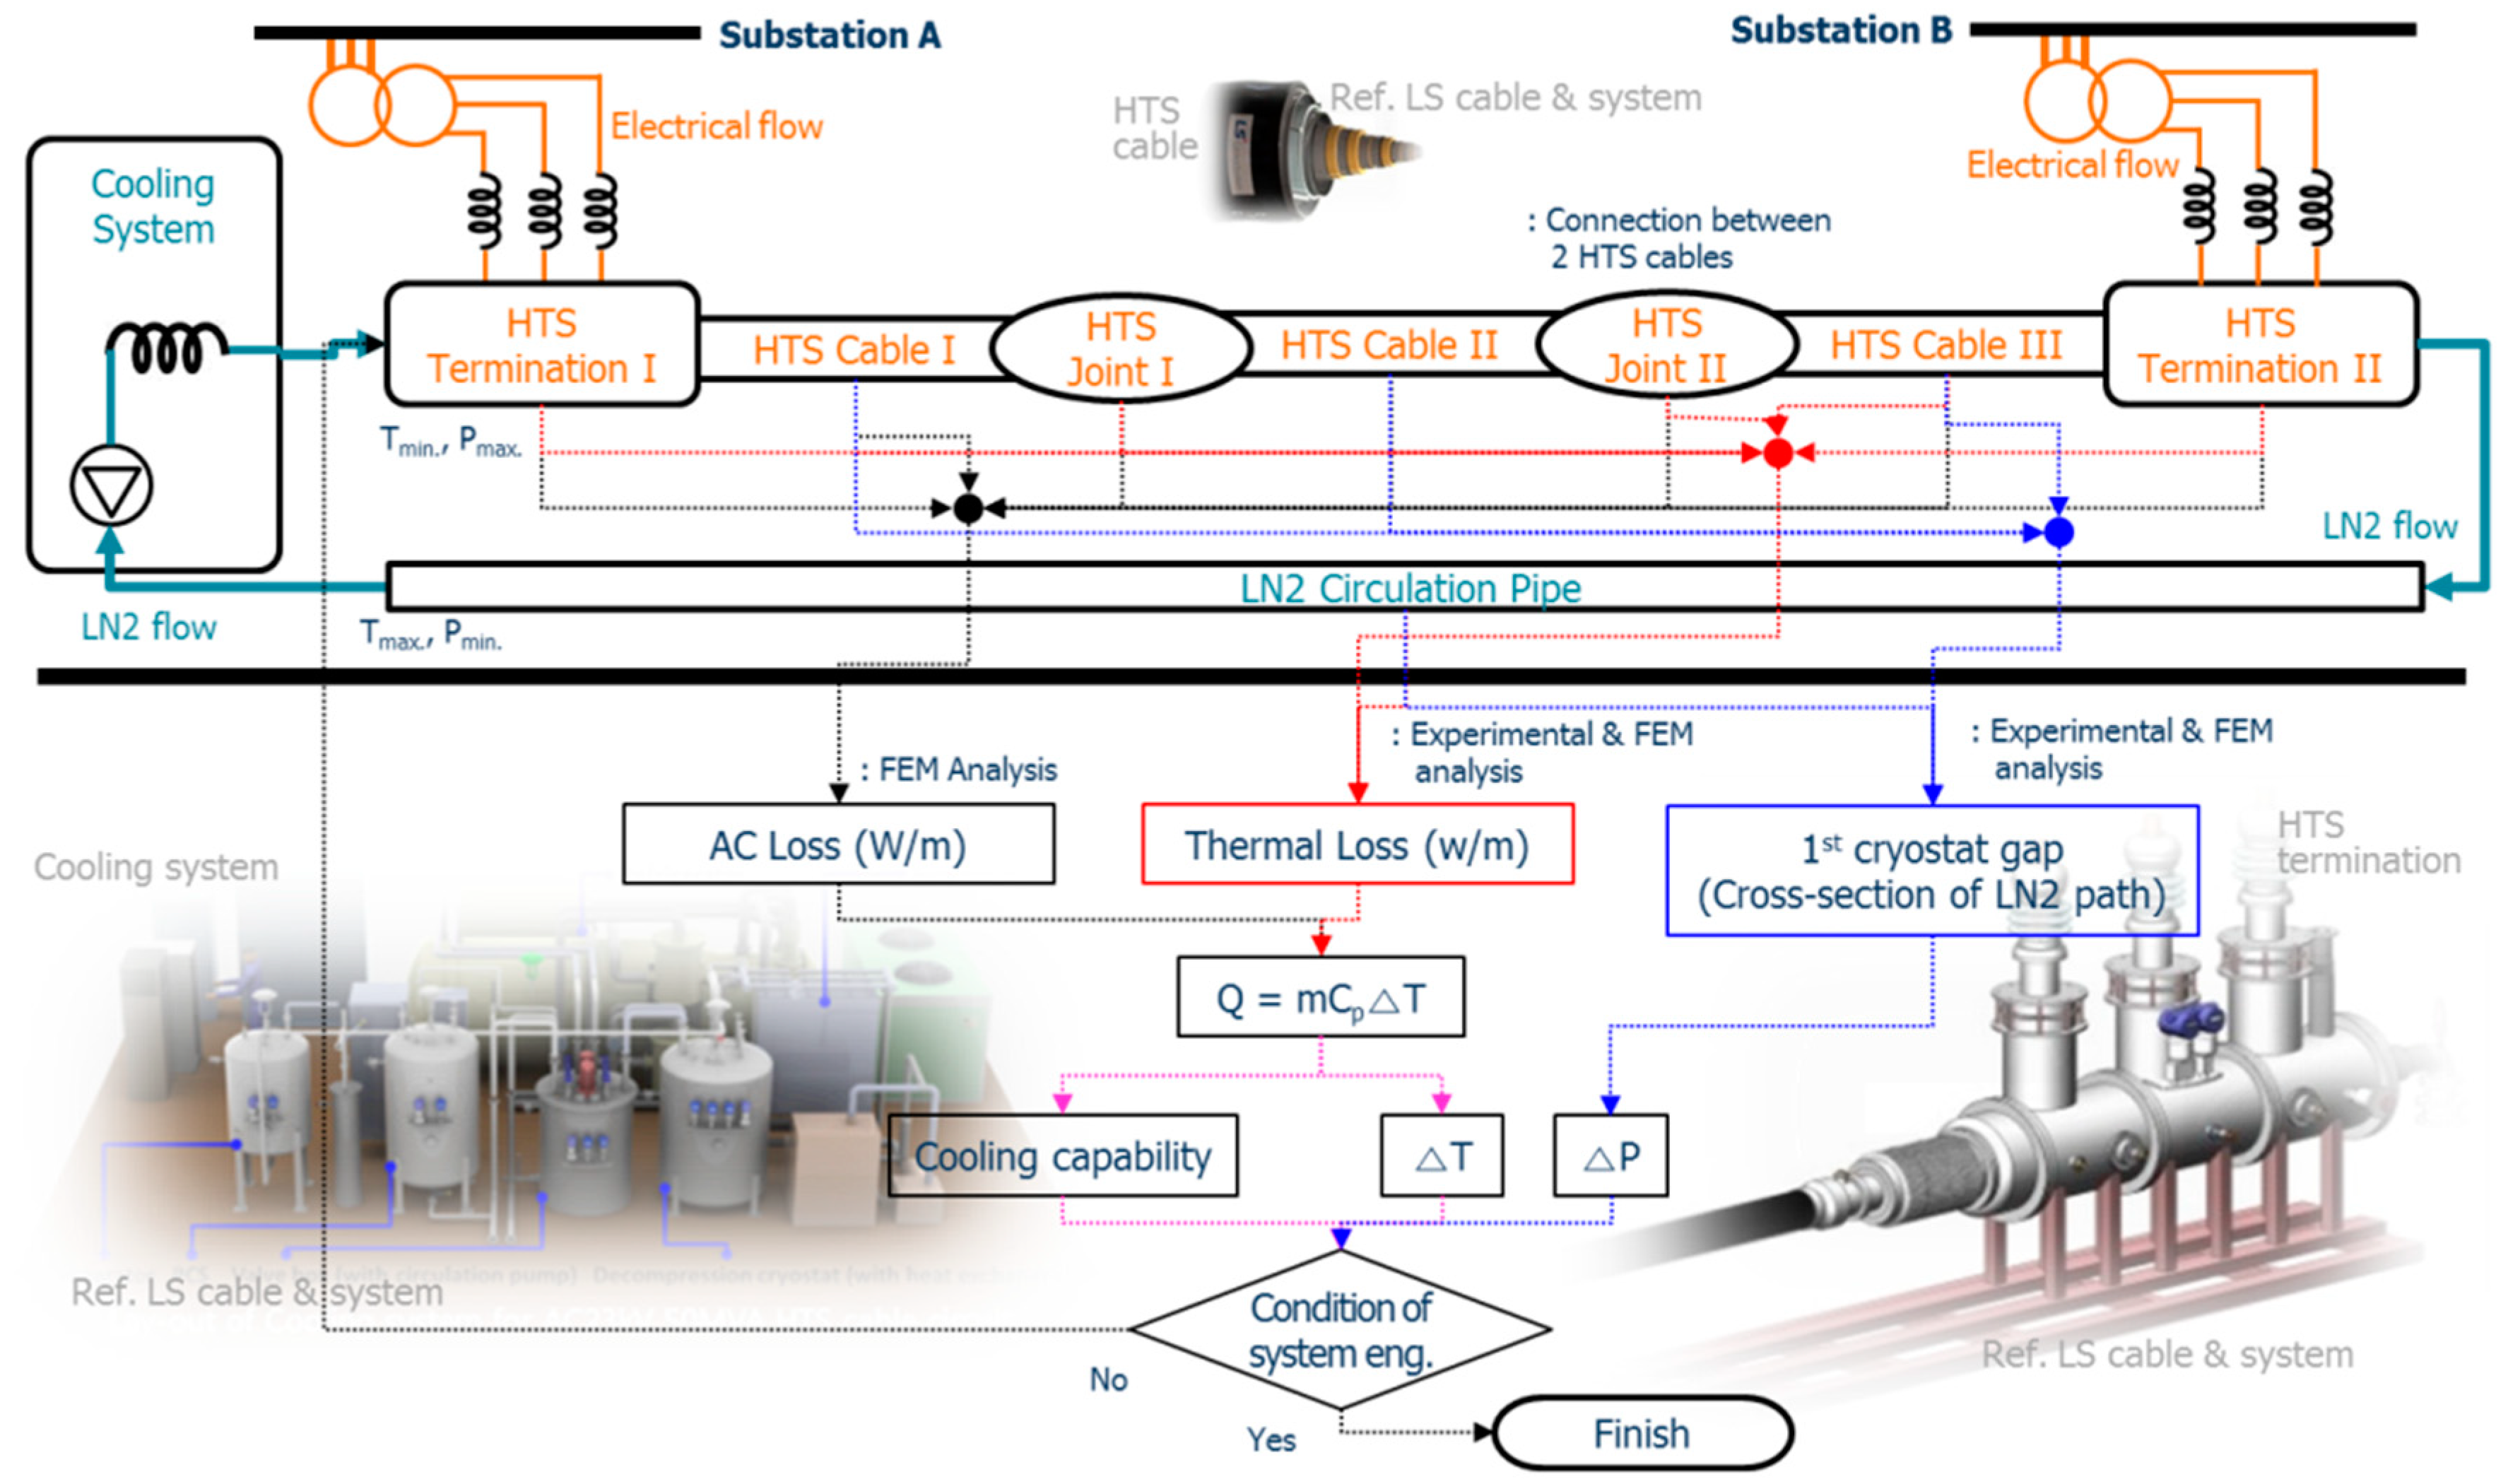
2. Total System and Configuration of Three-Phase Coaxial Superconducting Power Cable

Figure 1 shows the overall system configuration of a three-phase coaxial superconducting power cable. When installed between each substation, the superconducting terminal establishes an electrical connection to transmit power. An additional cooling system is constructed to circulate and cool the superconducting cable system. Such a cooling system requires analysis of the temperature change according to the structure of the cable. For the basic structure, the temperature distribution can be predicted through heat transfer equations like Equation (1). However, in the case of structures such as the liquid nitrogen internal circulation of the cable, the temperature distribution should be evaluated by the analytical method. The temperature distribution analysis results can then be applied to the electrical design values in the whole system.
Q = m ˙ C p Δ t
where Q is the calorific value [W/m], m ˙ is mass flow of LN2 [kg/s], Cp is the specific heat of LN2 [J/kg·K].

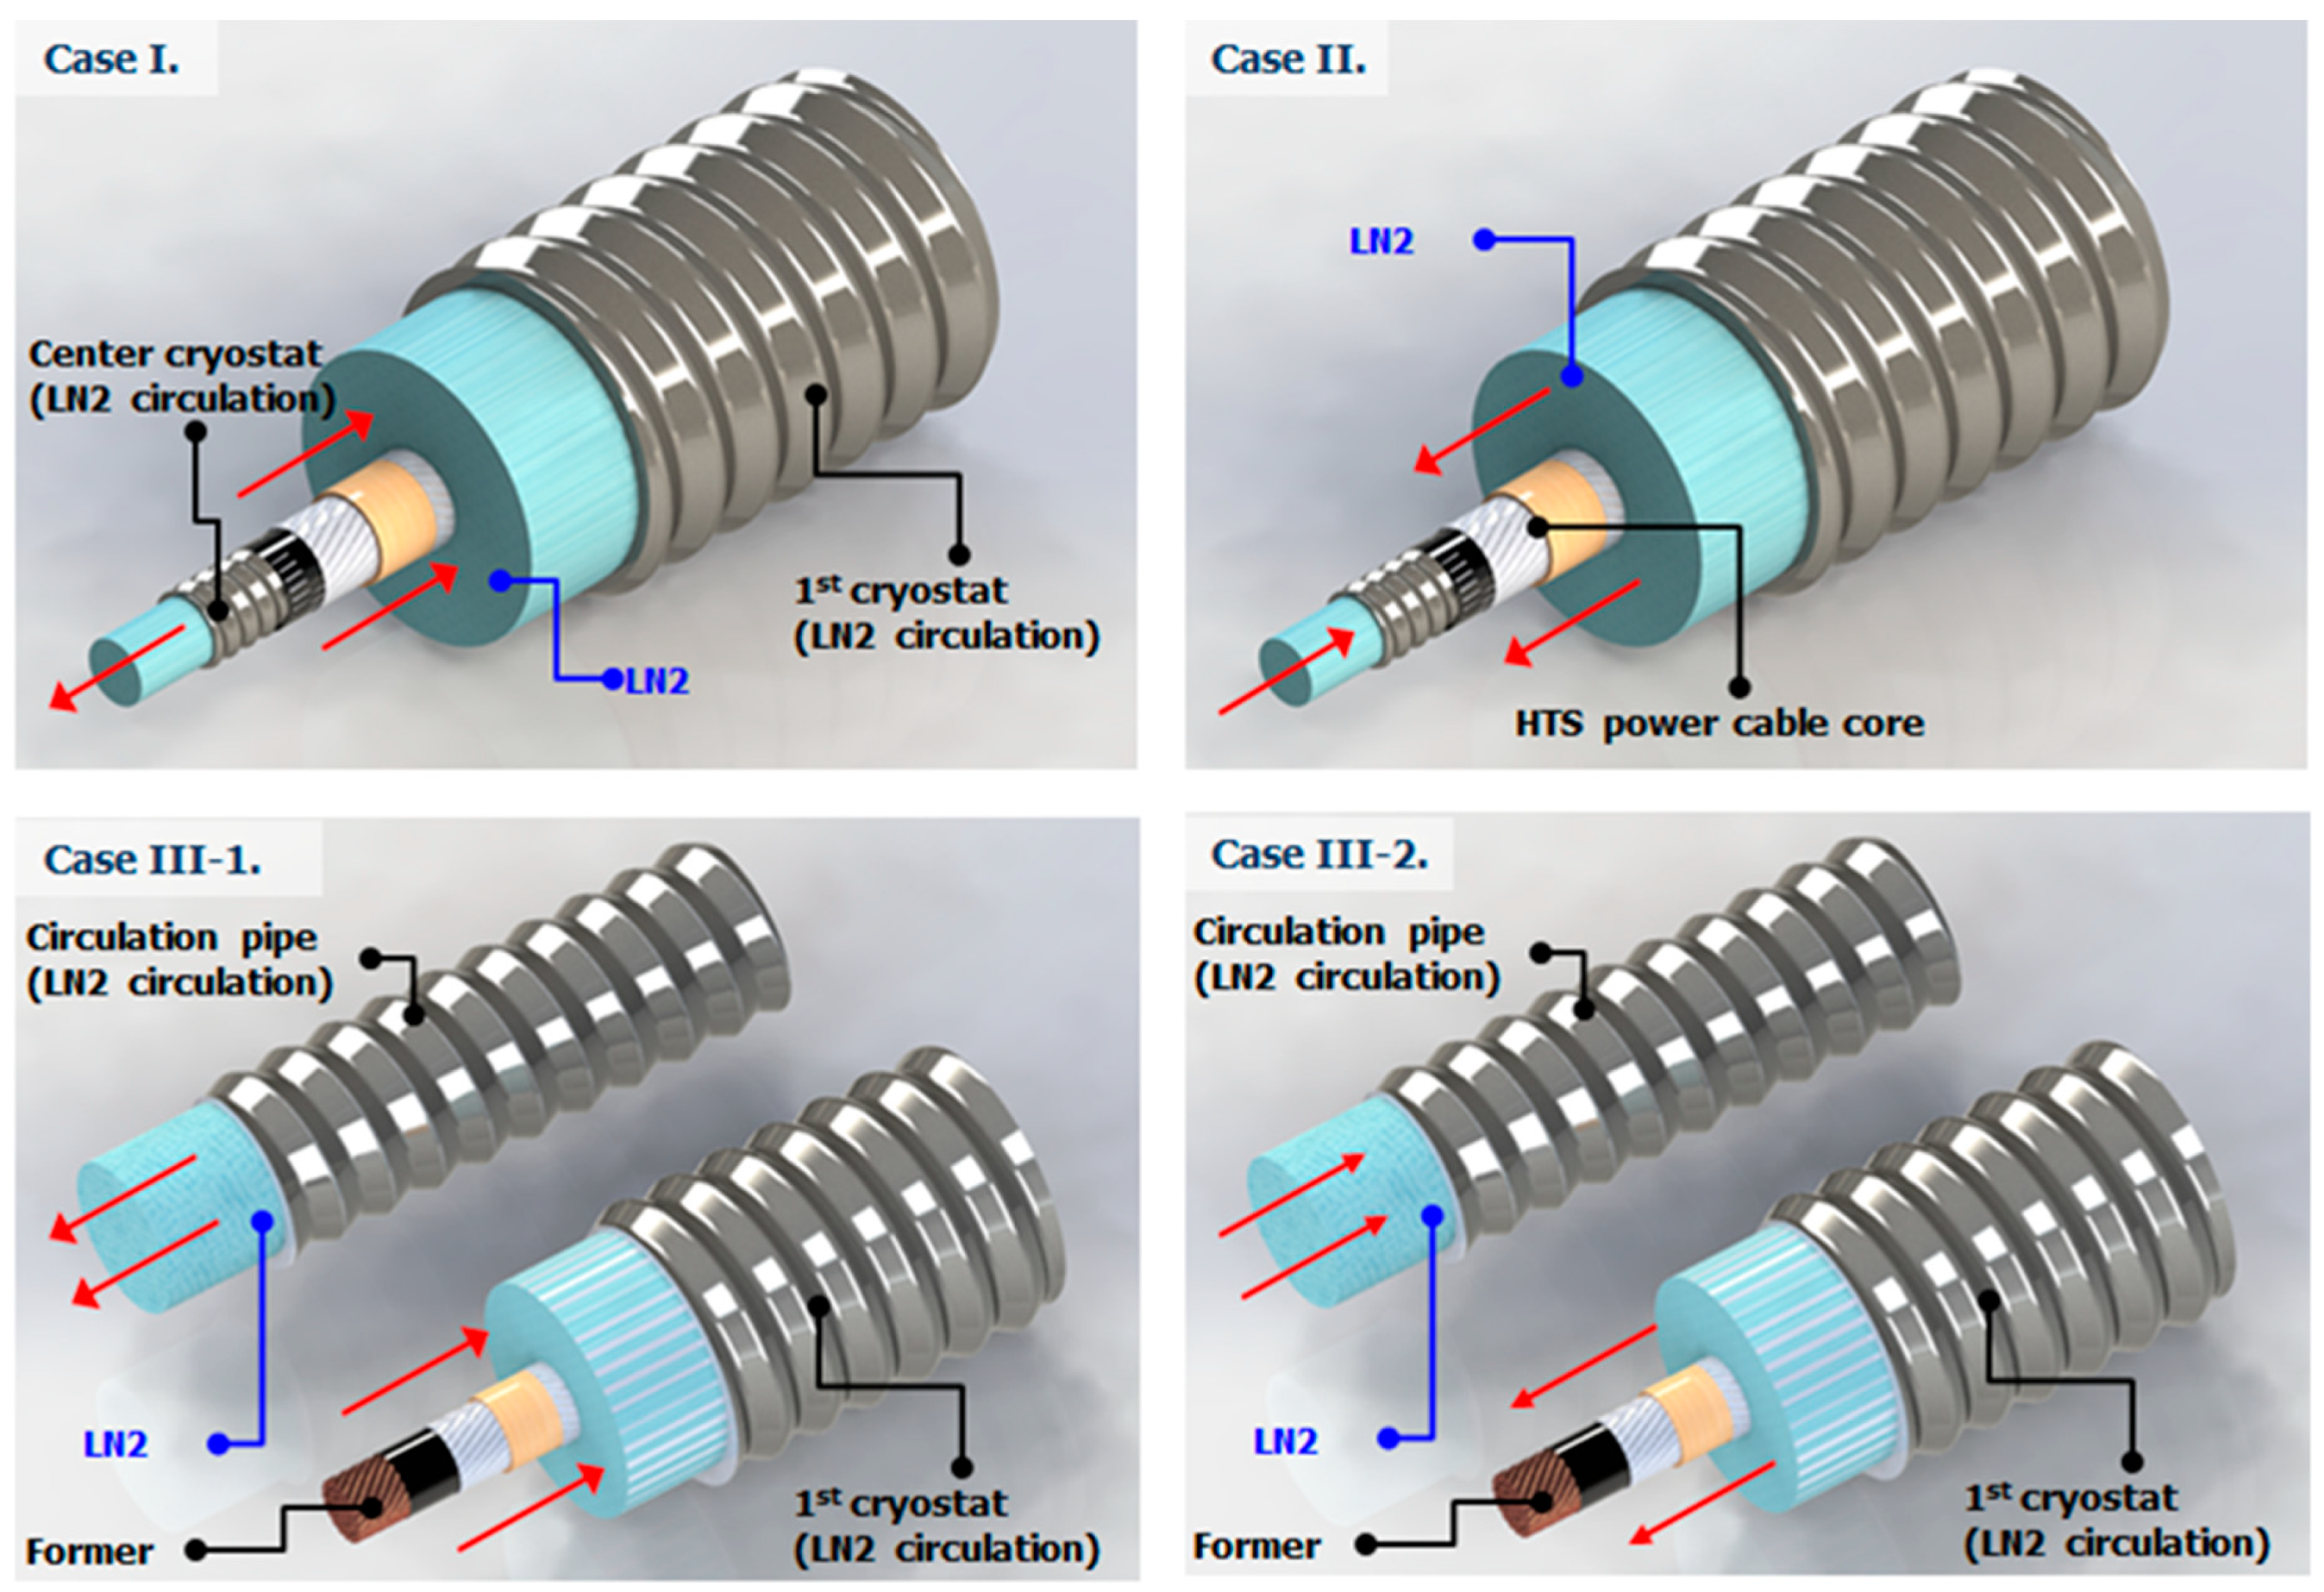
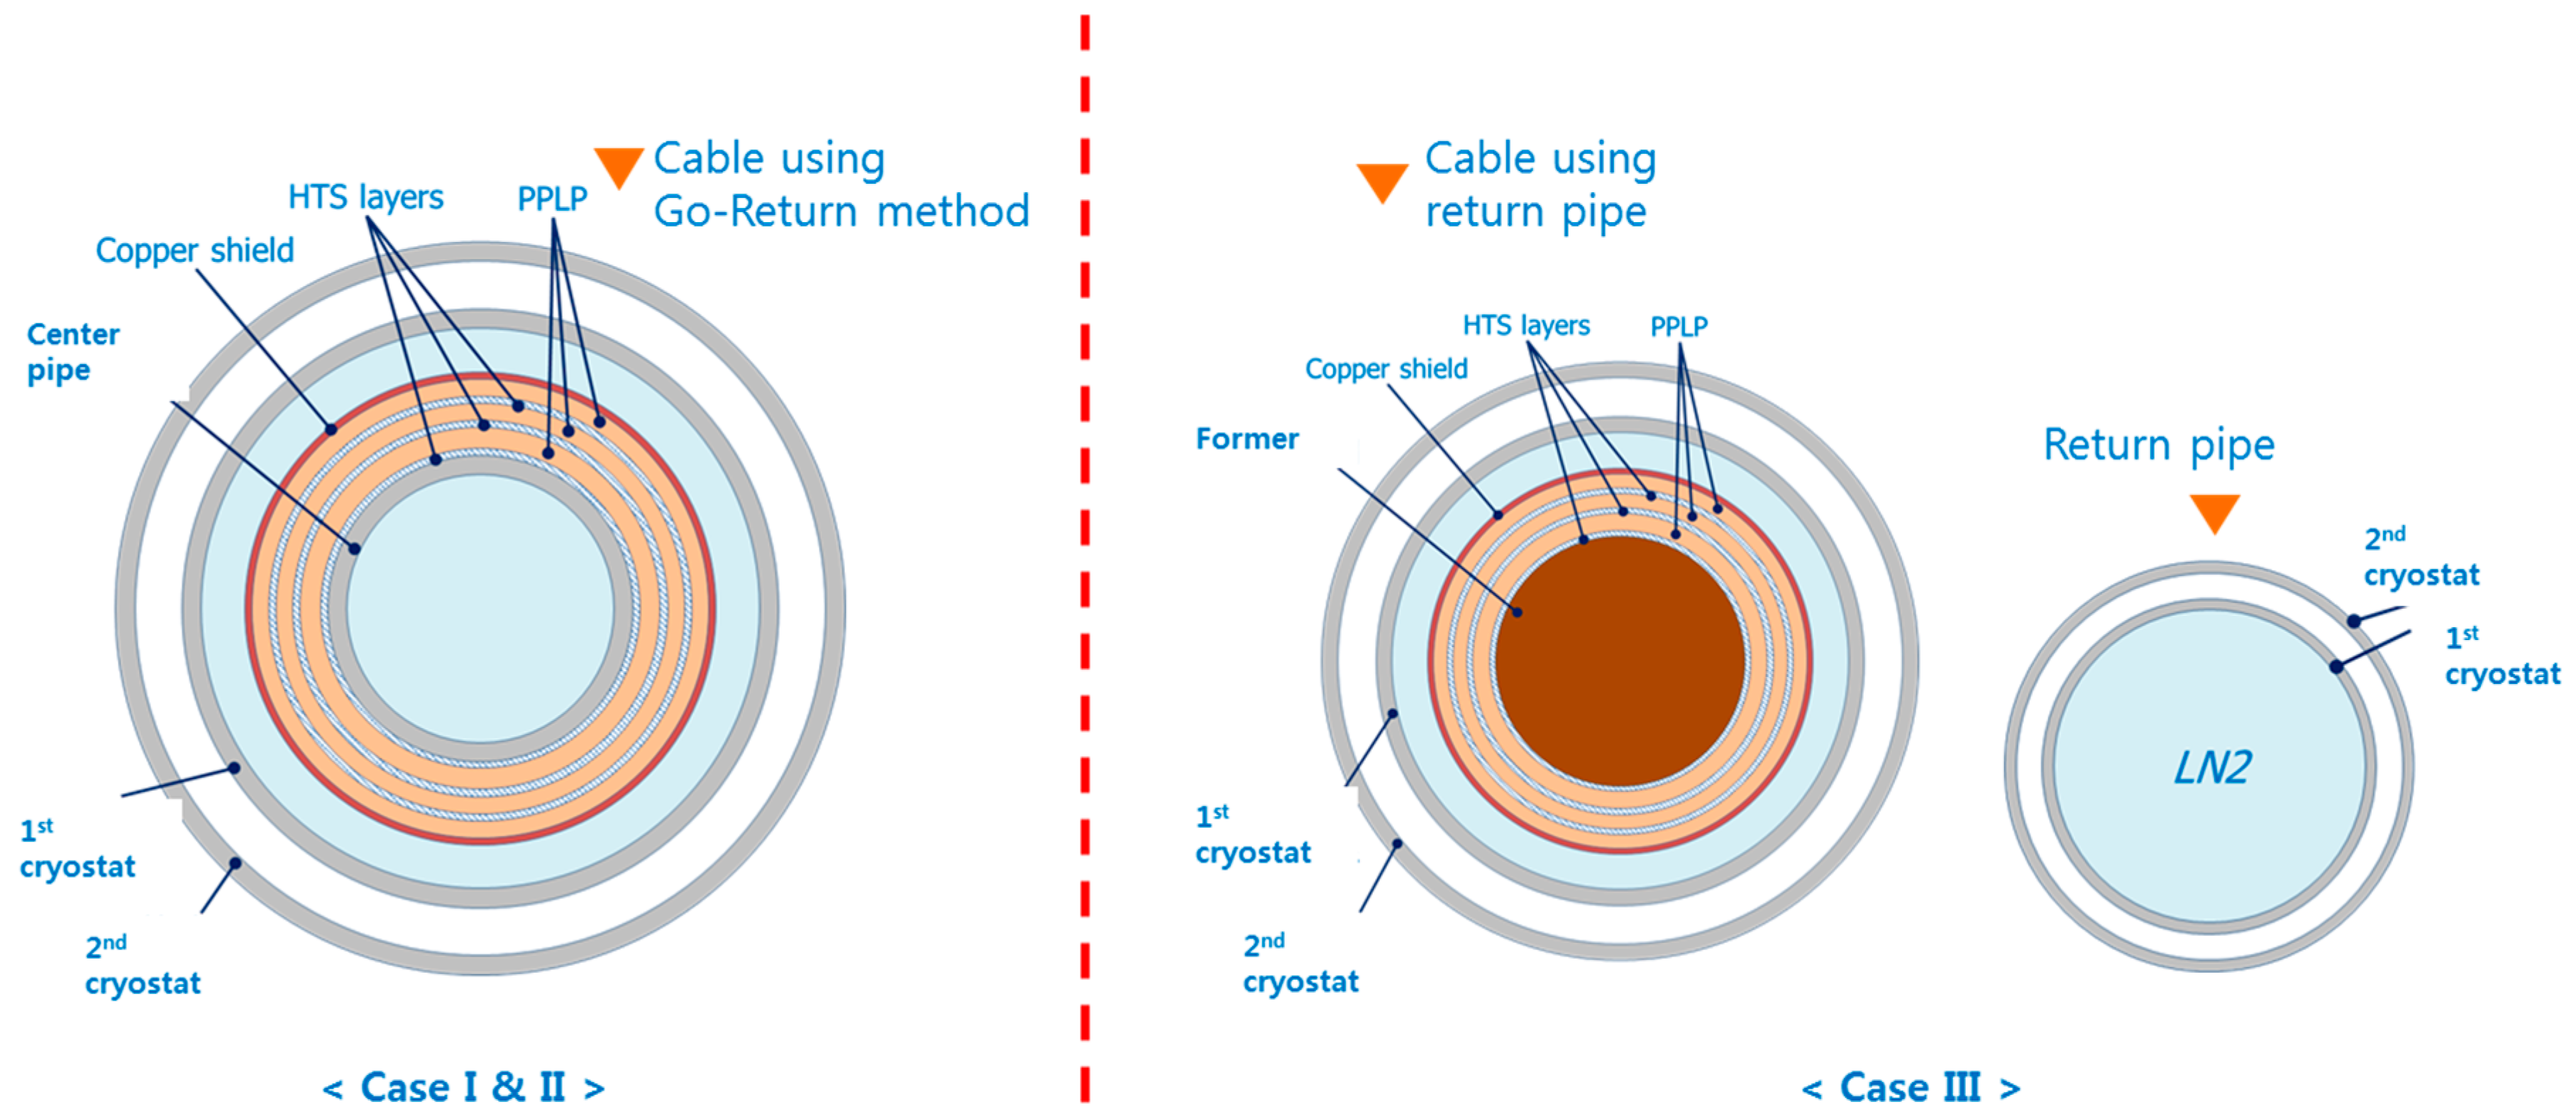
3. Cooling Circulation Structure of Three-Phase Coaxial Superconducting Power Cable

Figure 2 and Table 1 show a comparison of three-phase coaxial superconducting power cables according to the cooling cycle. In Cases I and II, additional refrigerant circulation piping is not necessary and can be circulated inside the cable. In the case of the cooling circulation method, it is difficult to predict the temperature gradient according to the length of the cable by the simple heat transfer equation. This is due to mutual heat transfer between the superconducting wire linking the hollow tube and the primary cryostat, and the insulating paper such as PPLP. Also, it is necessary to predict the temperature at the time of the load by considering the amount of heat generated by current conduction through the superconducting wire. Therefore, the temperature gradient of the cable should be analyzed with the same method as the FEM analysis. Case III has a disadvantage in that additional cooling circulation piping is required, but it is easy to predict the temperature of each cable length according to the circulation direction. In the case of installing a cable of more than two lines, separate circulation piping is not used, and cryogenic refrigerant can be circulated through the cable.

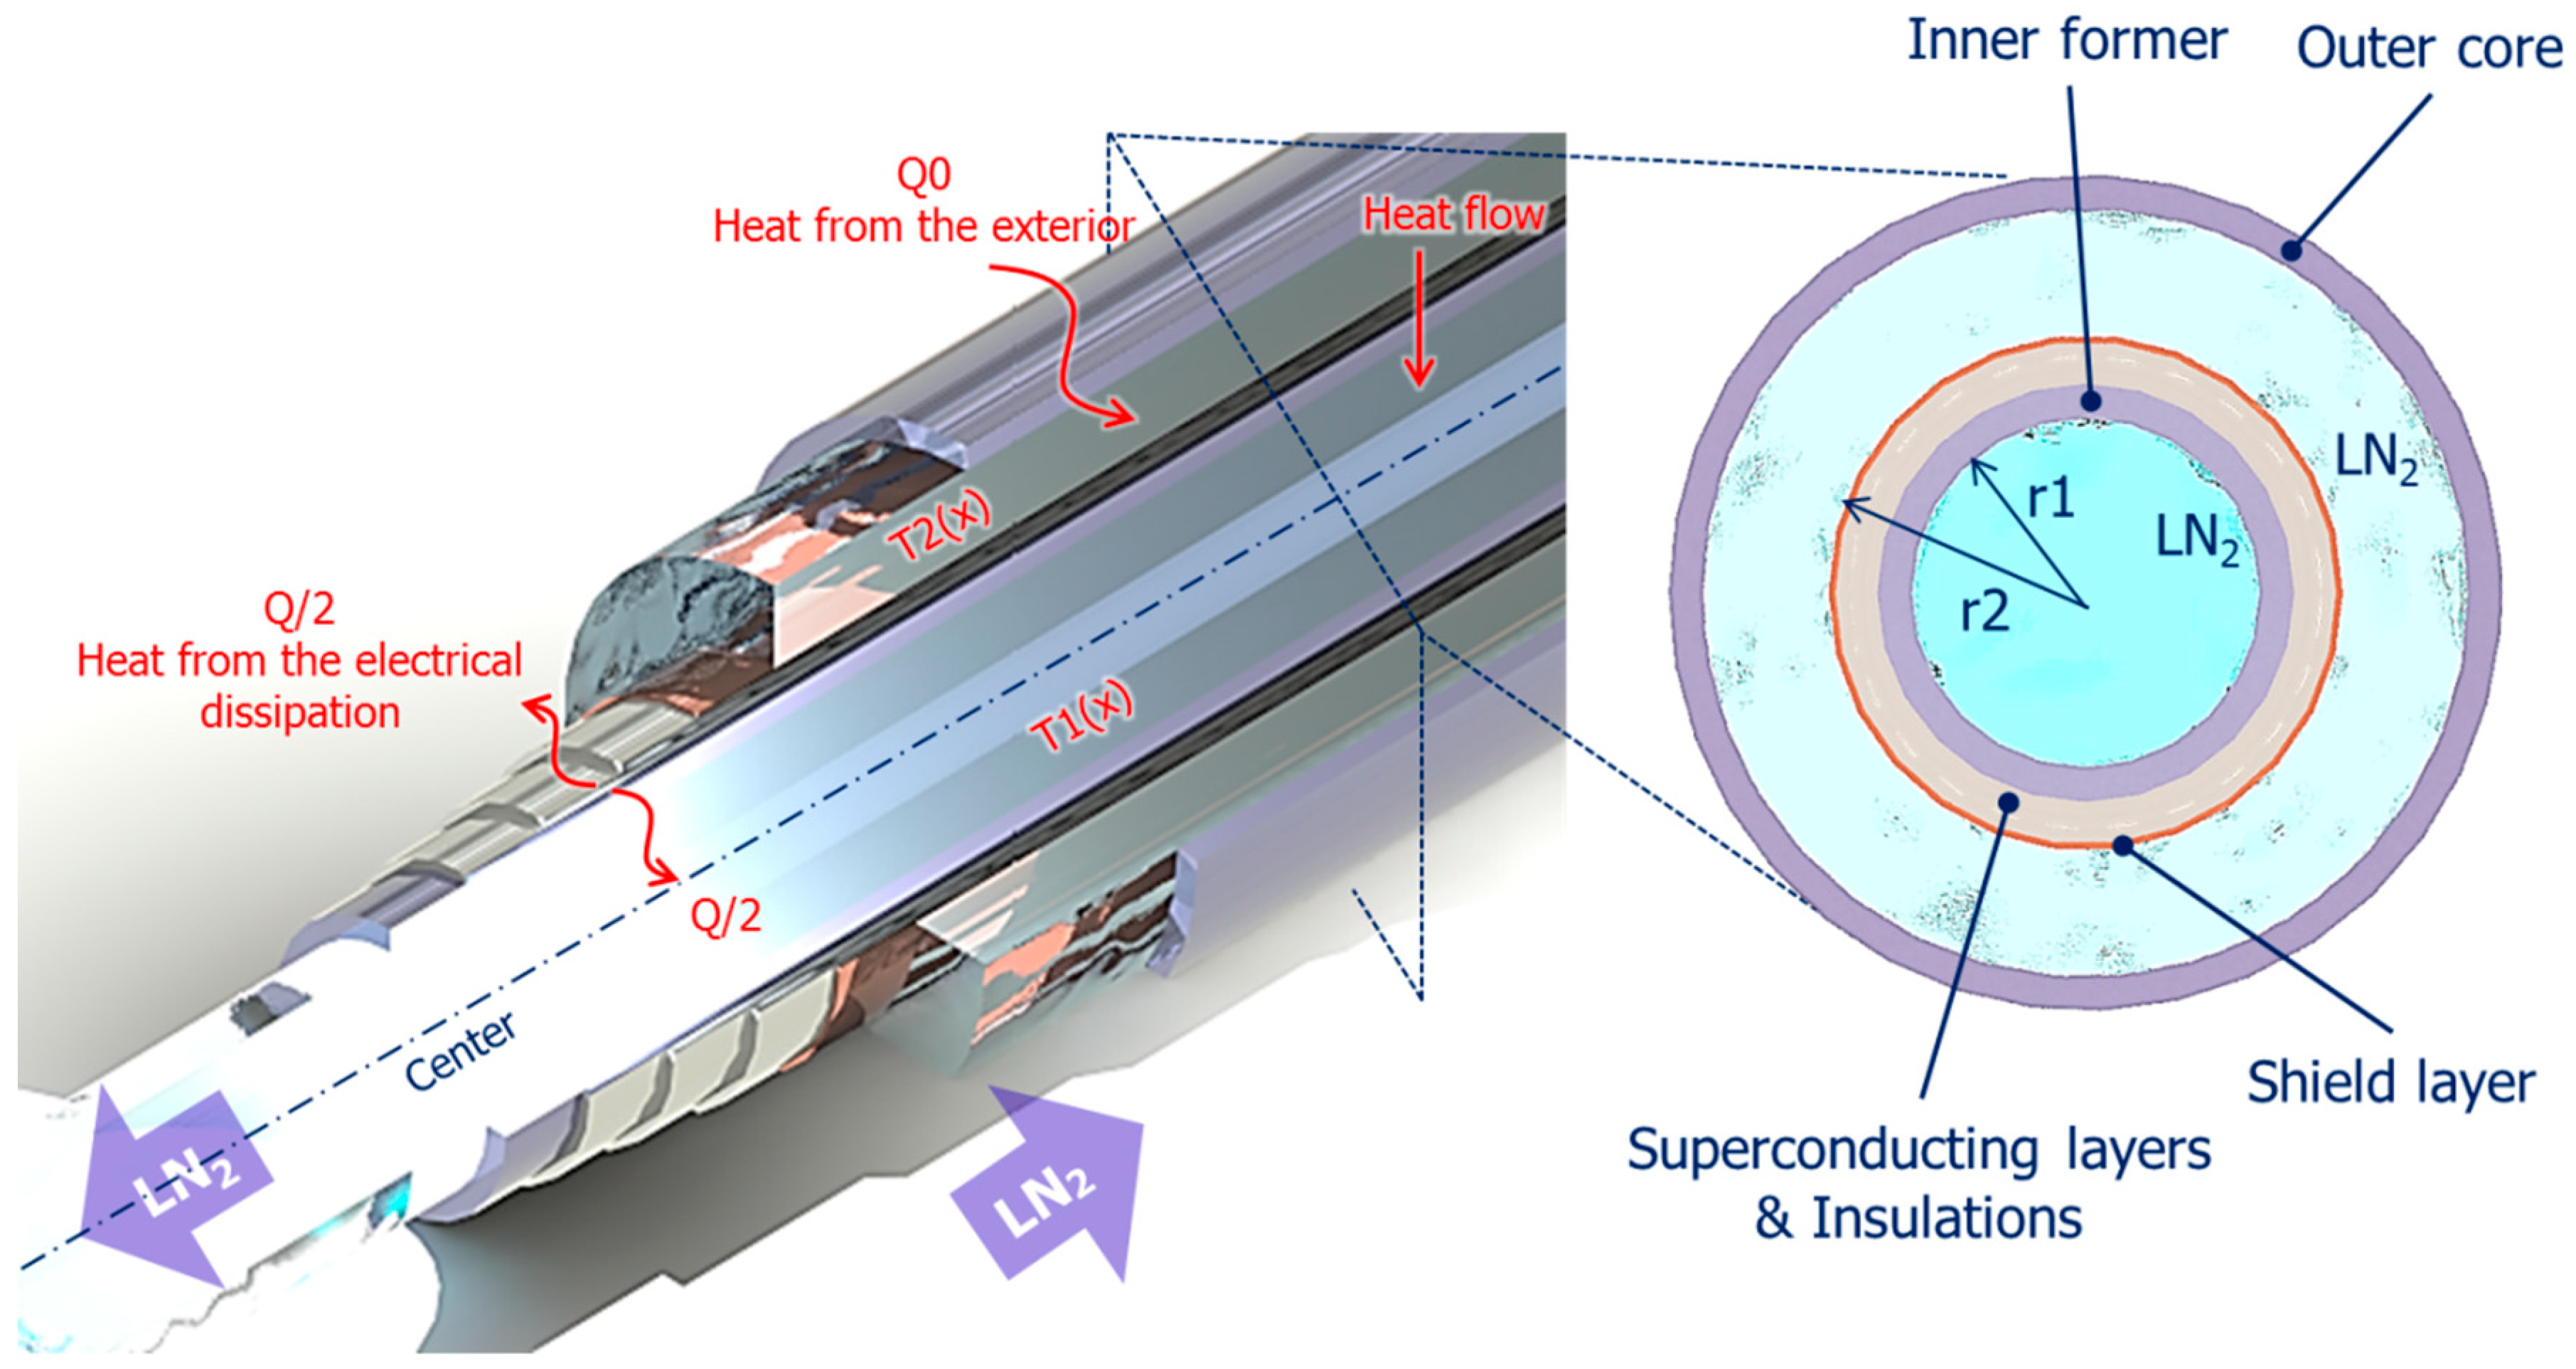
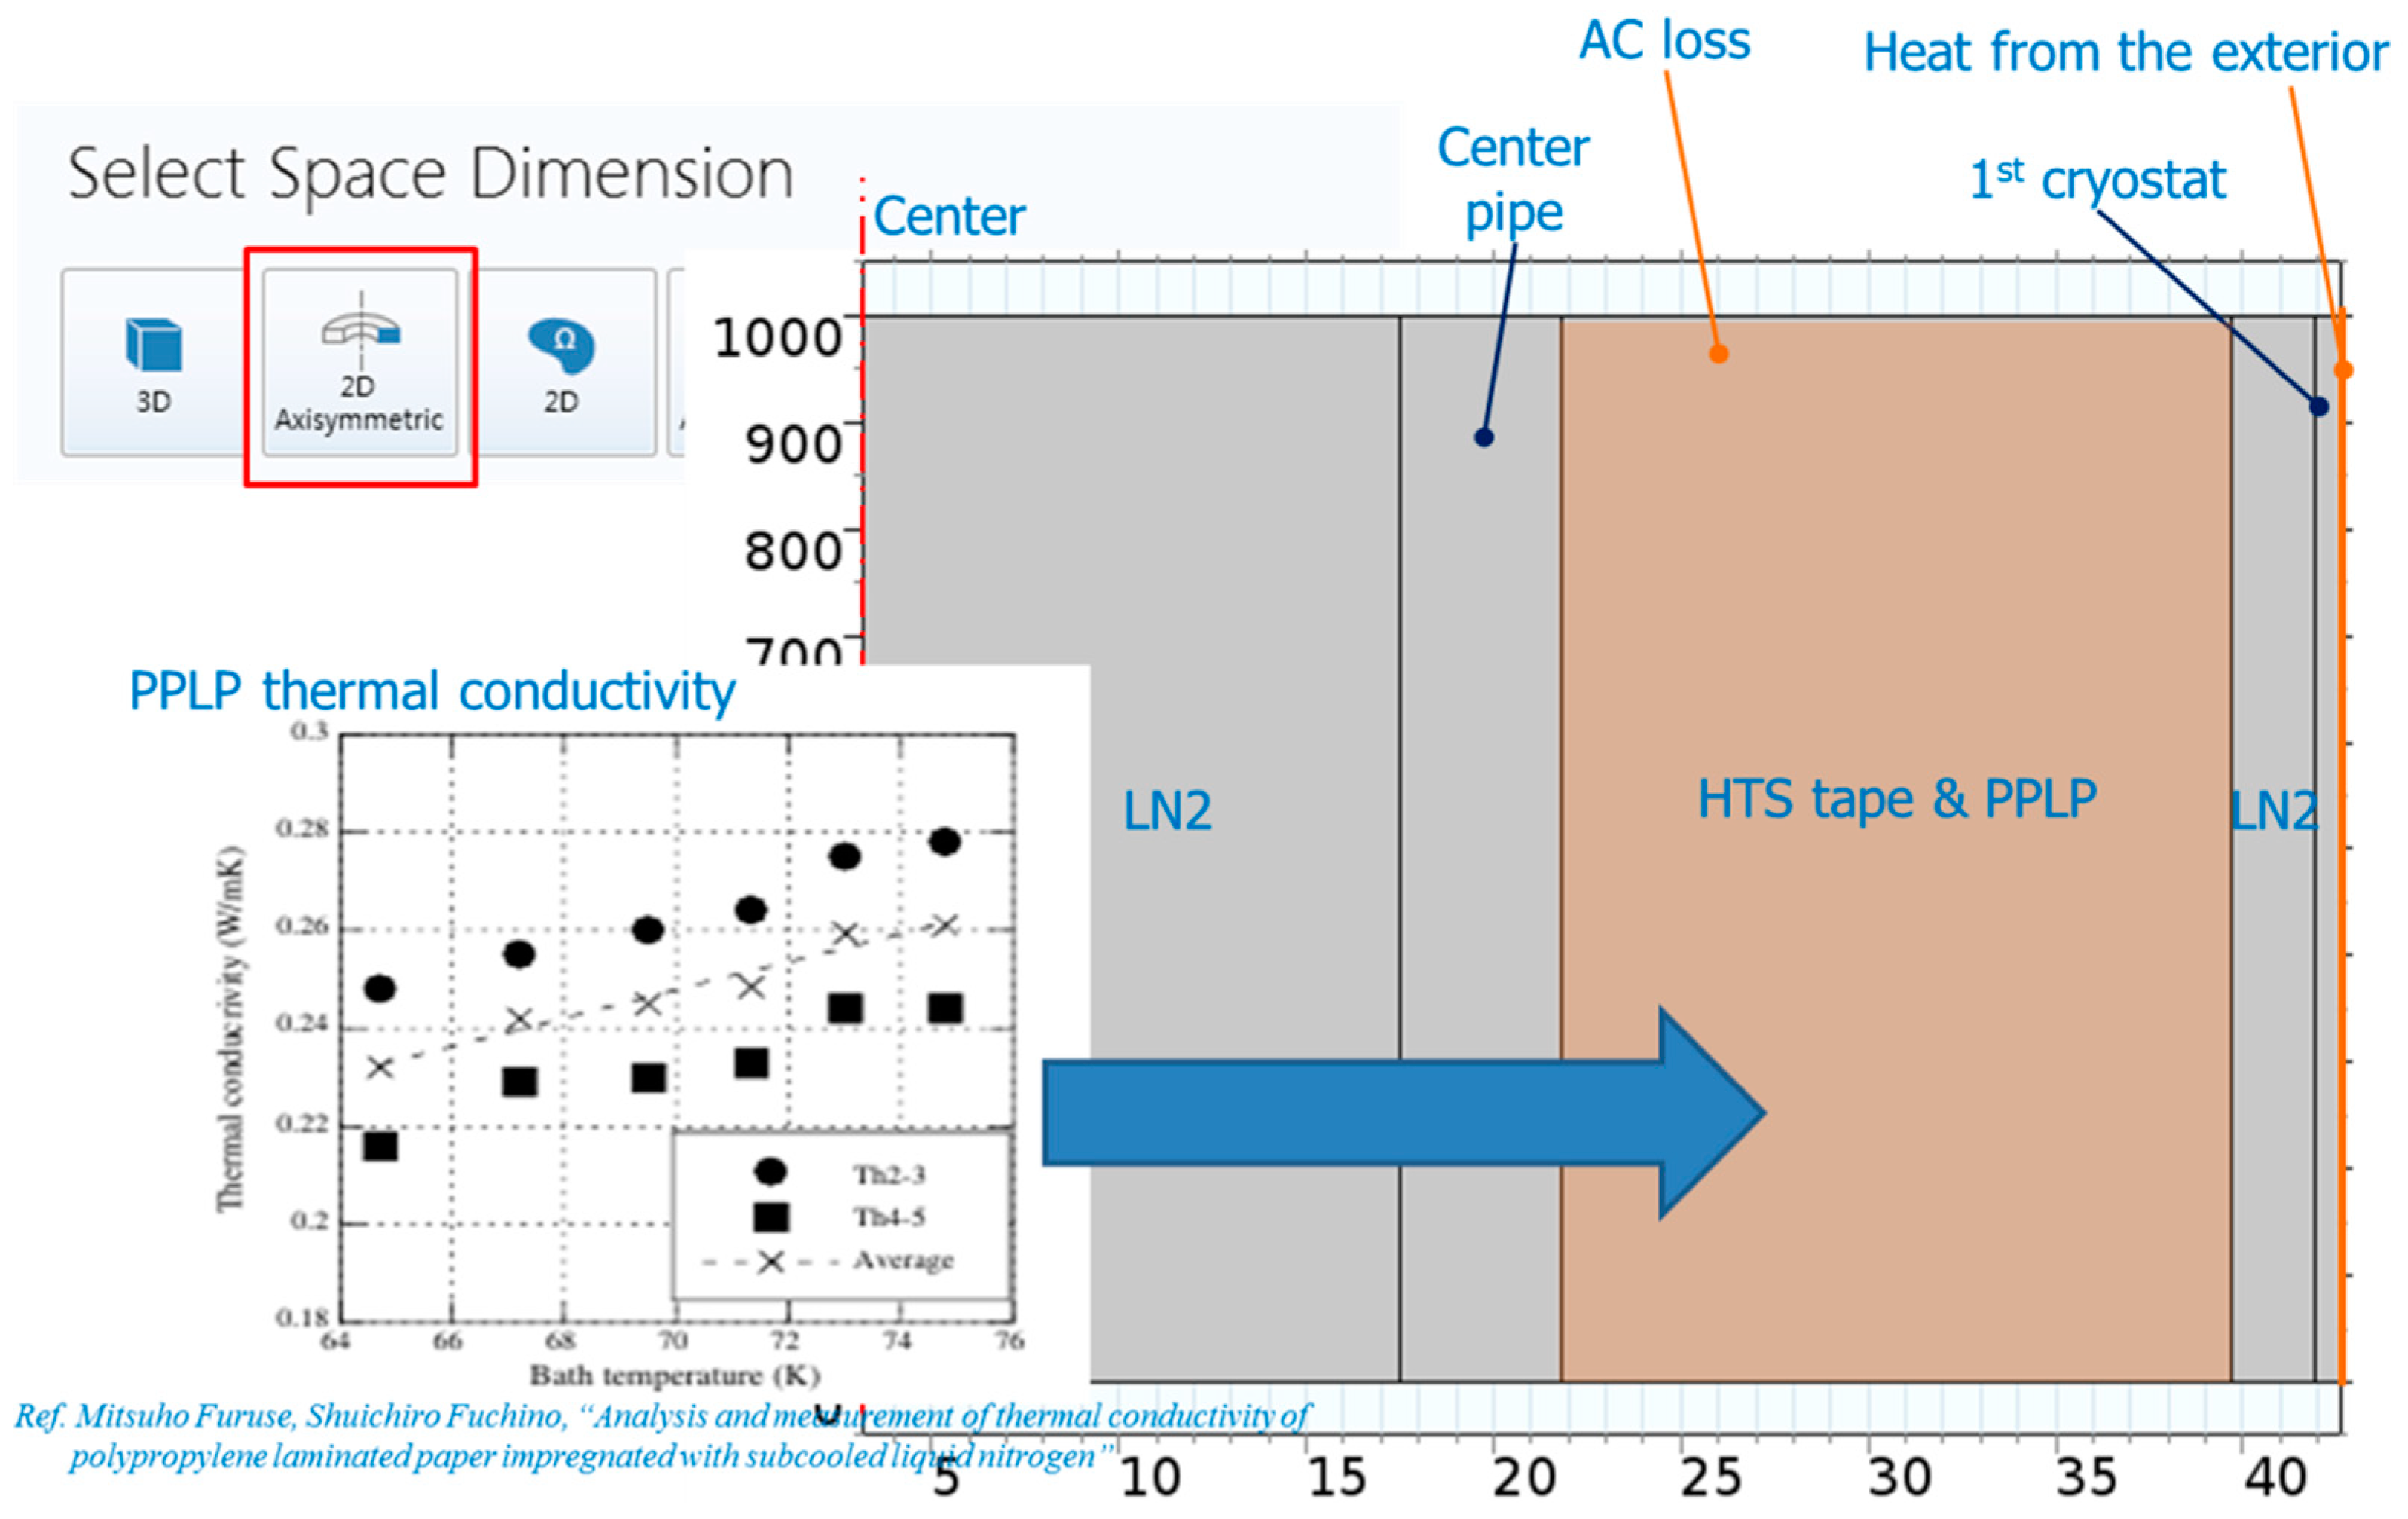
4. Temperature Analysis of Three-Phase Coaxial Superconducting Power Cable Using FEM Modeling

Figure 3 shows the conceptual modeling of temperature analysis for three-phase coaxial superconducting power cables according to cryogenic circulation. According to the circulation direction of liquid nitrogen, the heat transfer with mutual influences of the external primary cryostat through the inner hollow tube and the superconducting layer/insulation layer is analyzed, and temperature prediction according to the length of the superconducting cable becomes possible [11].
Figure 4 shows a 2D model of a three-phase coaxial superconducting power cable for thermal analysis using finite element method (FEM) tool. As shown in Figure 3, the structure of the hollow tube, the superconducting layer/insulation layer, and the primary cryostat allow the mutual heat transfer analysis. The horizontal axis of the figure shows the cable length, and the vertical axis shows the cable radius. The thermal conductivity of the superconducting layer and the PPLP is determined by the equivalent thermal conductivity through the equivalent thermal resistance [4].
As shown in Table 2, the thermal load conditions of the superconducting layer and the insulating layer when the transmission current of 23 kV 60 MVA is energized are taken into account, and the thermal conditions of the heat invasion and liquid nitrogen from the outside are set around 2 to 3 km. Temperature and flow rate are calculated. The thermal conditions of liquid nitrogen have been referred to in some references.
Figure 5 and Table 3 show the cable structure and circulation pipe specifications for thermal analysis according to the cooling circulation method of the three-phase coaxial superconducting power cable. The inner diameter of the hollow tube, return pipe, and primary cryostat was designed to maintain the pressure along the cable length. The thickness of the superconducting layer and the insulation layer was determined by the transmission capacity and the dielectric strength of the three-phase coaxial superconducting power cable of 23 kV 60 MVA class, respectively.

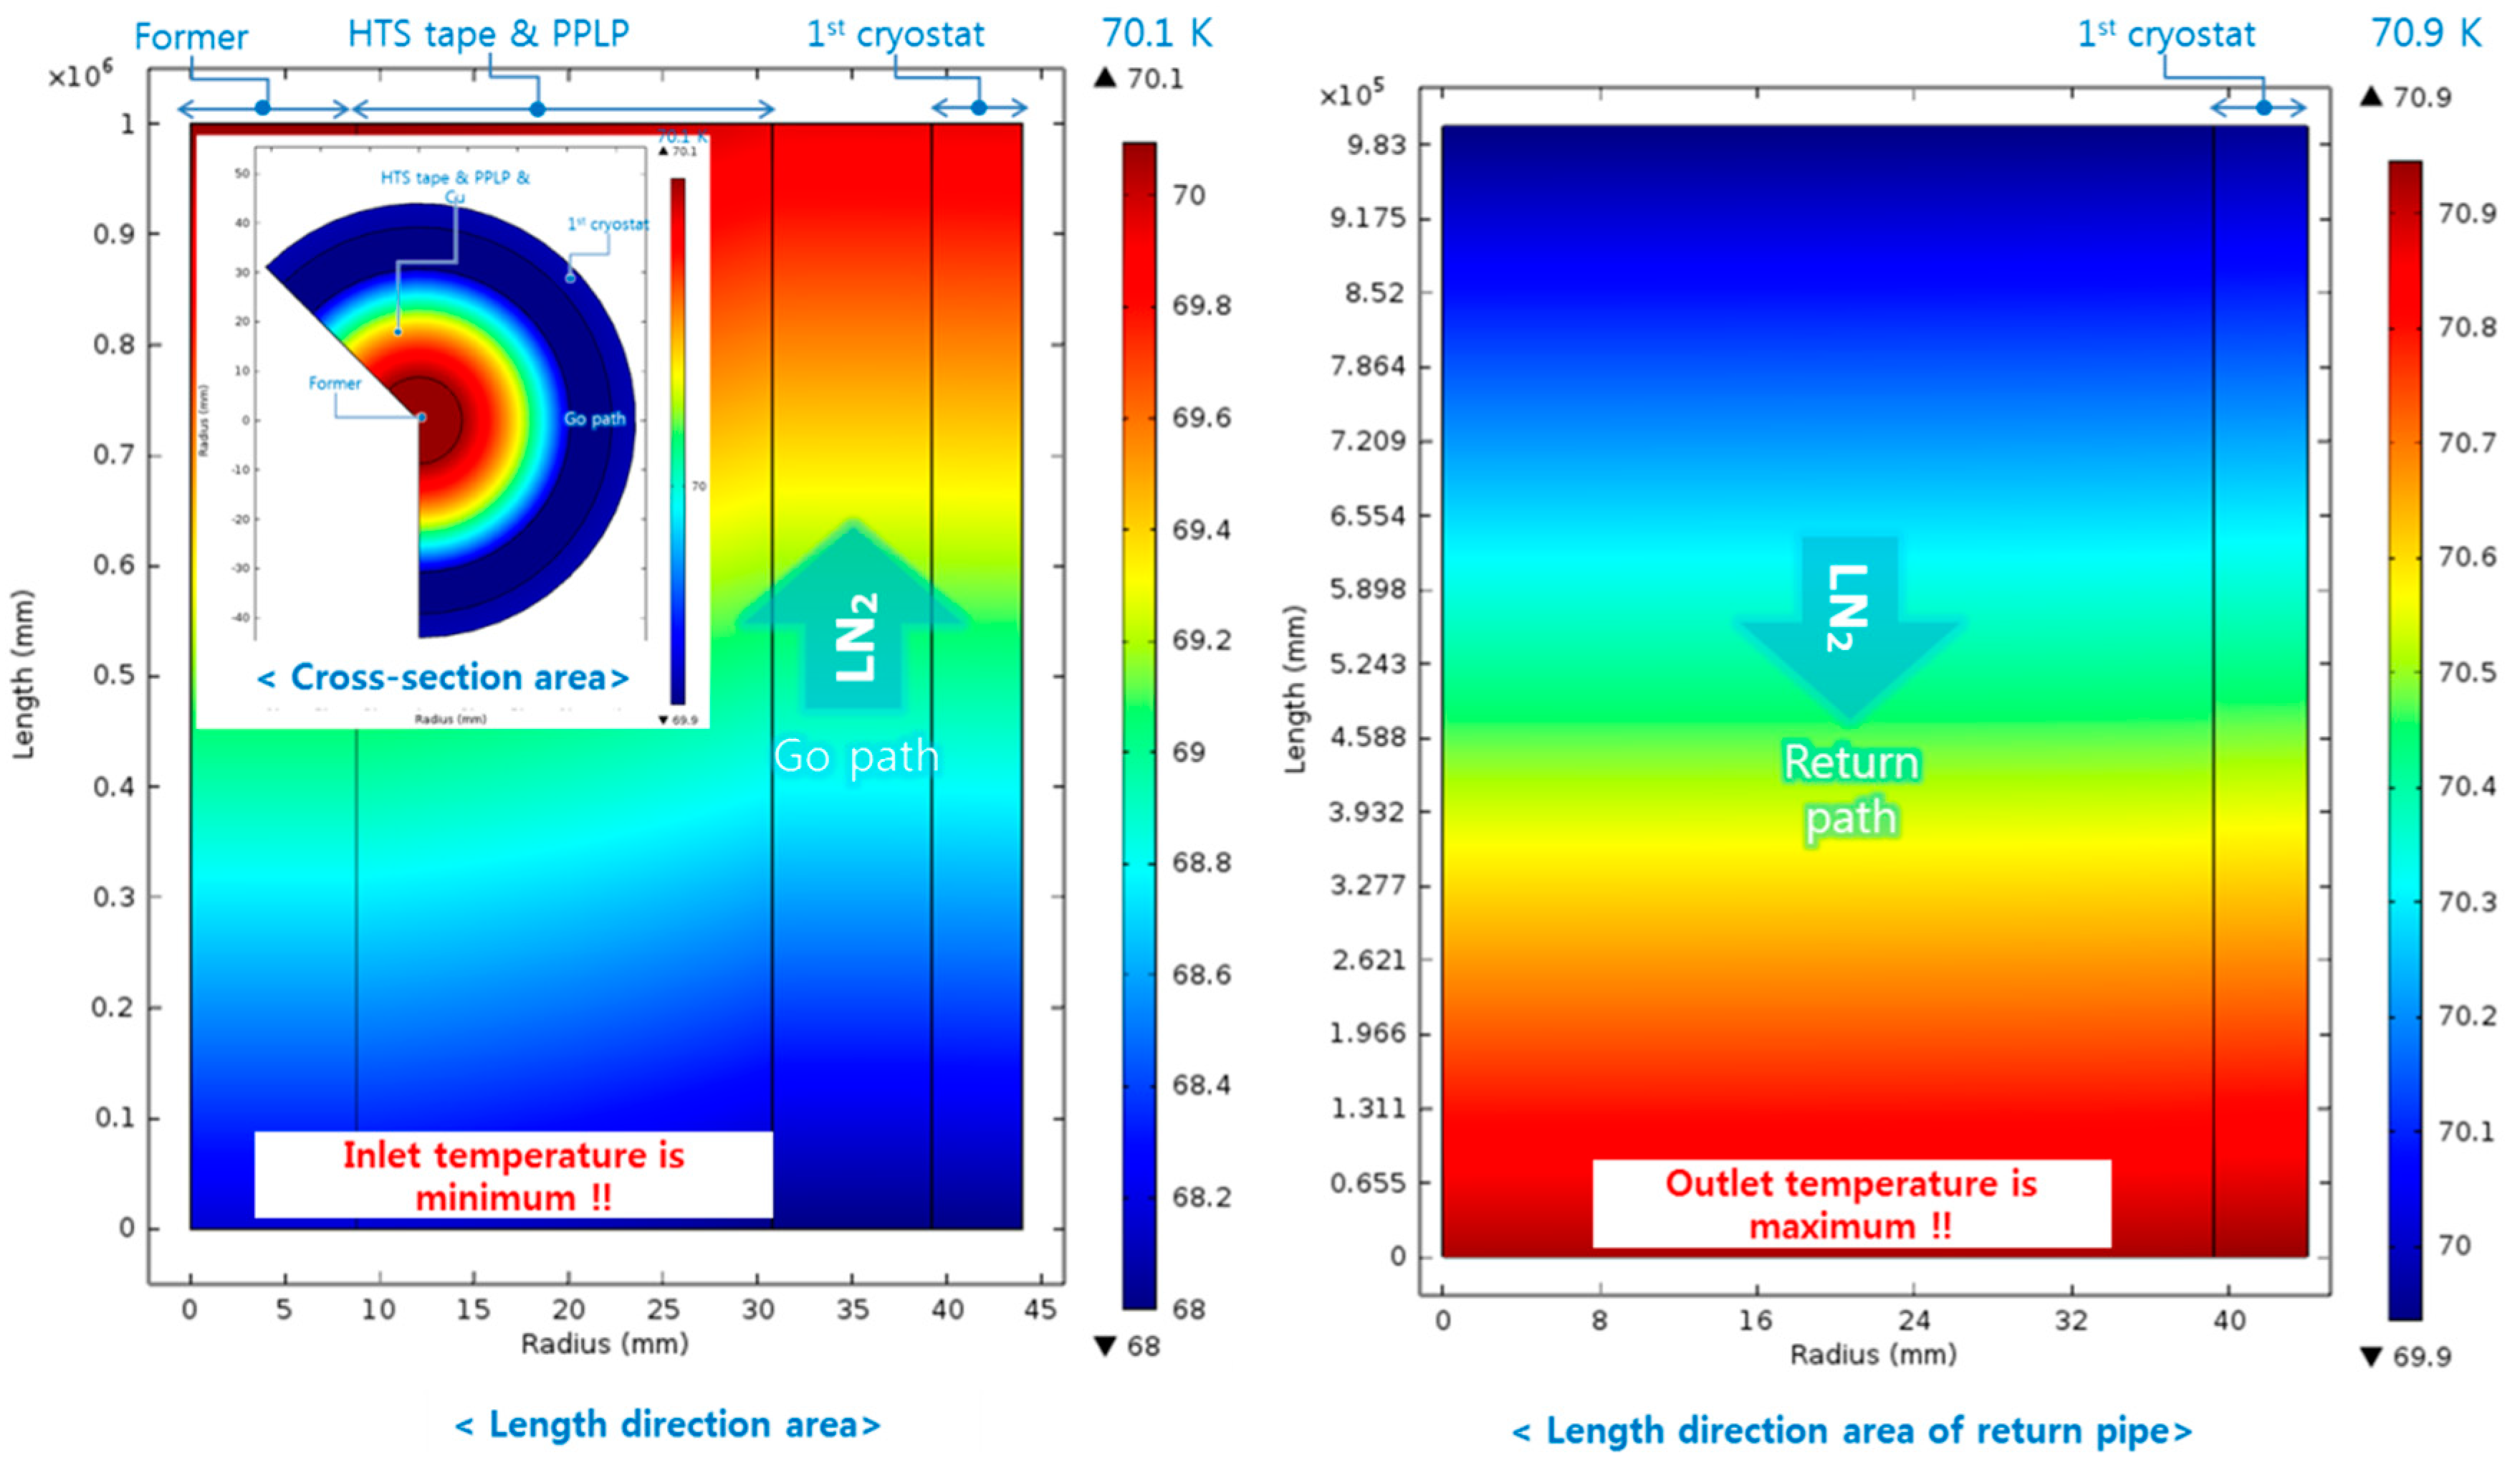
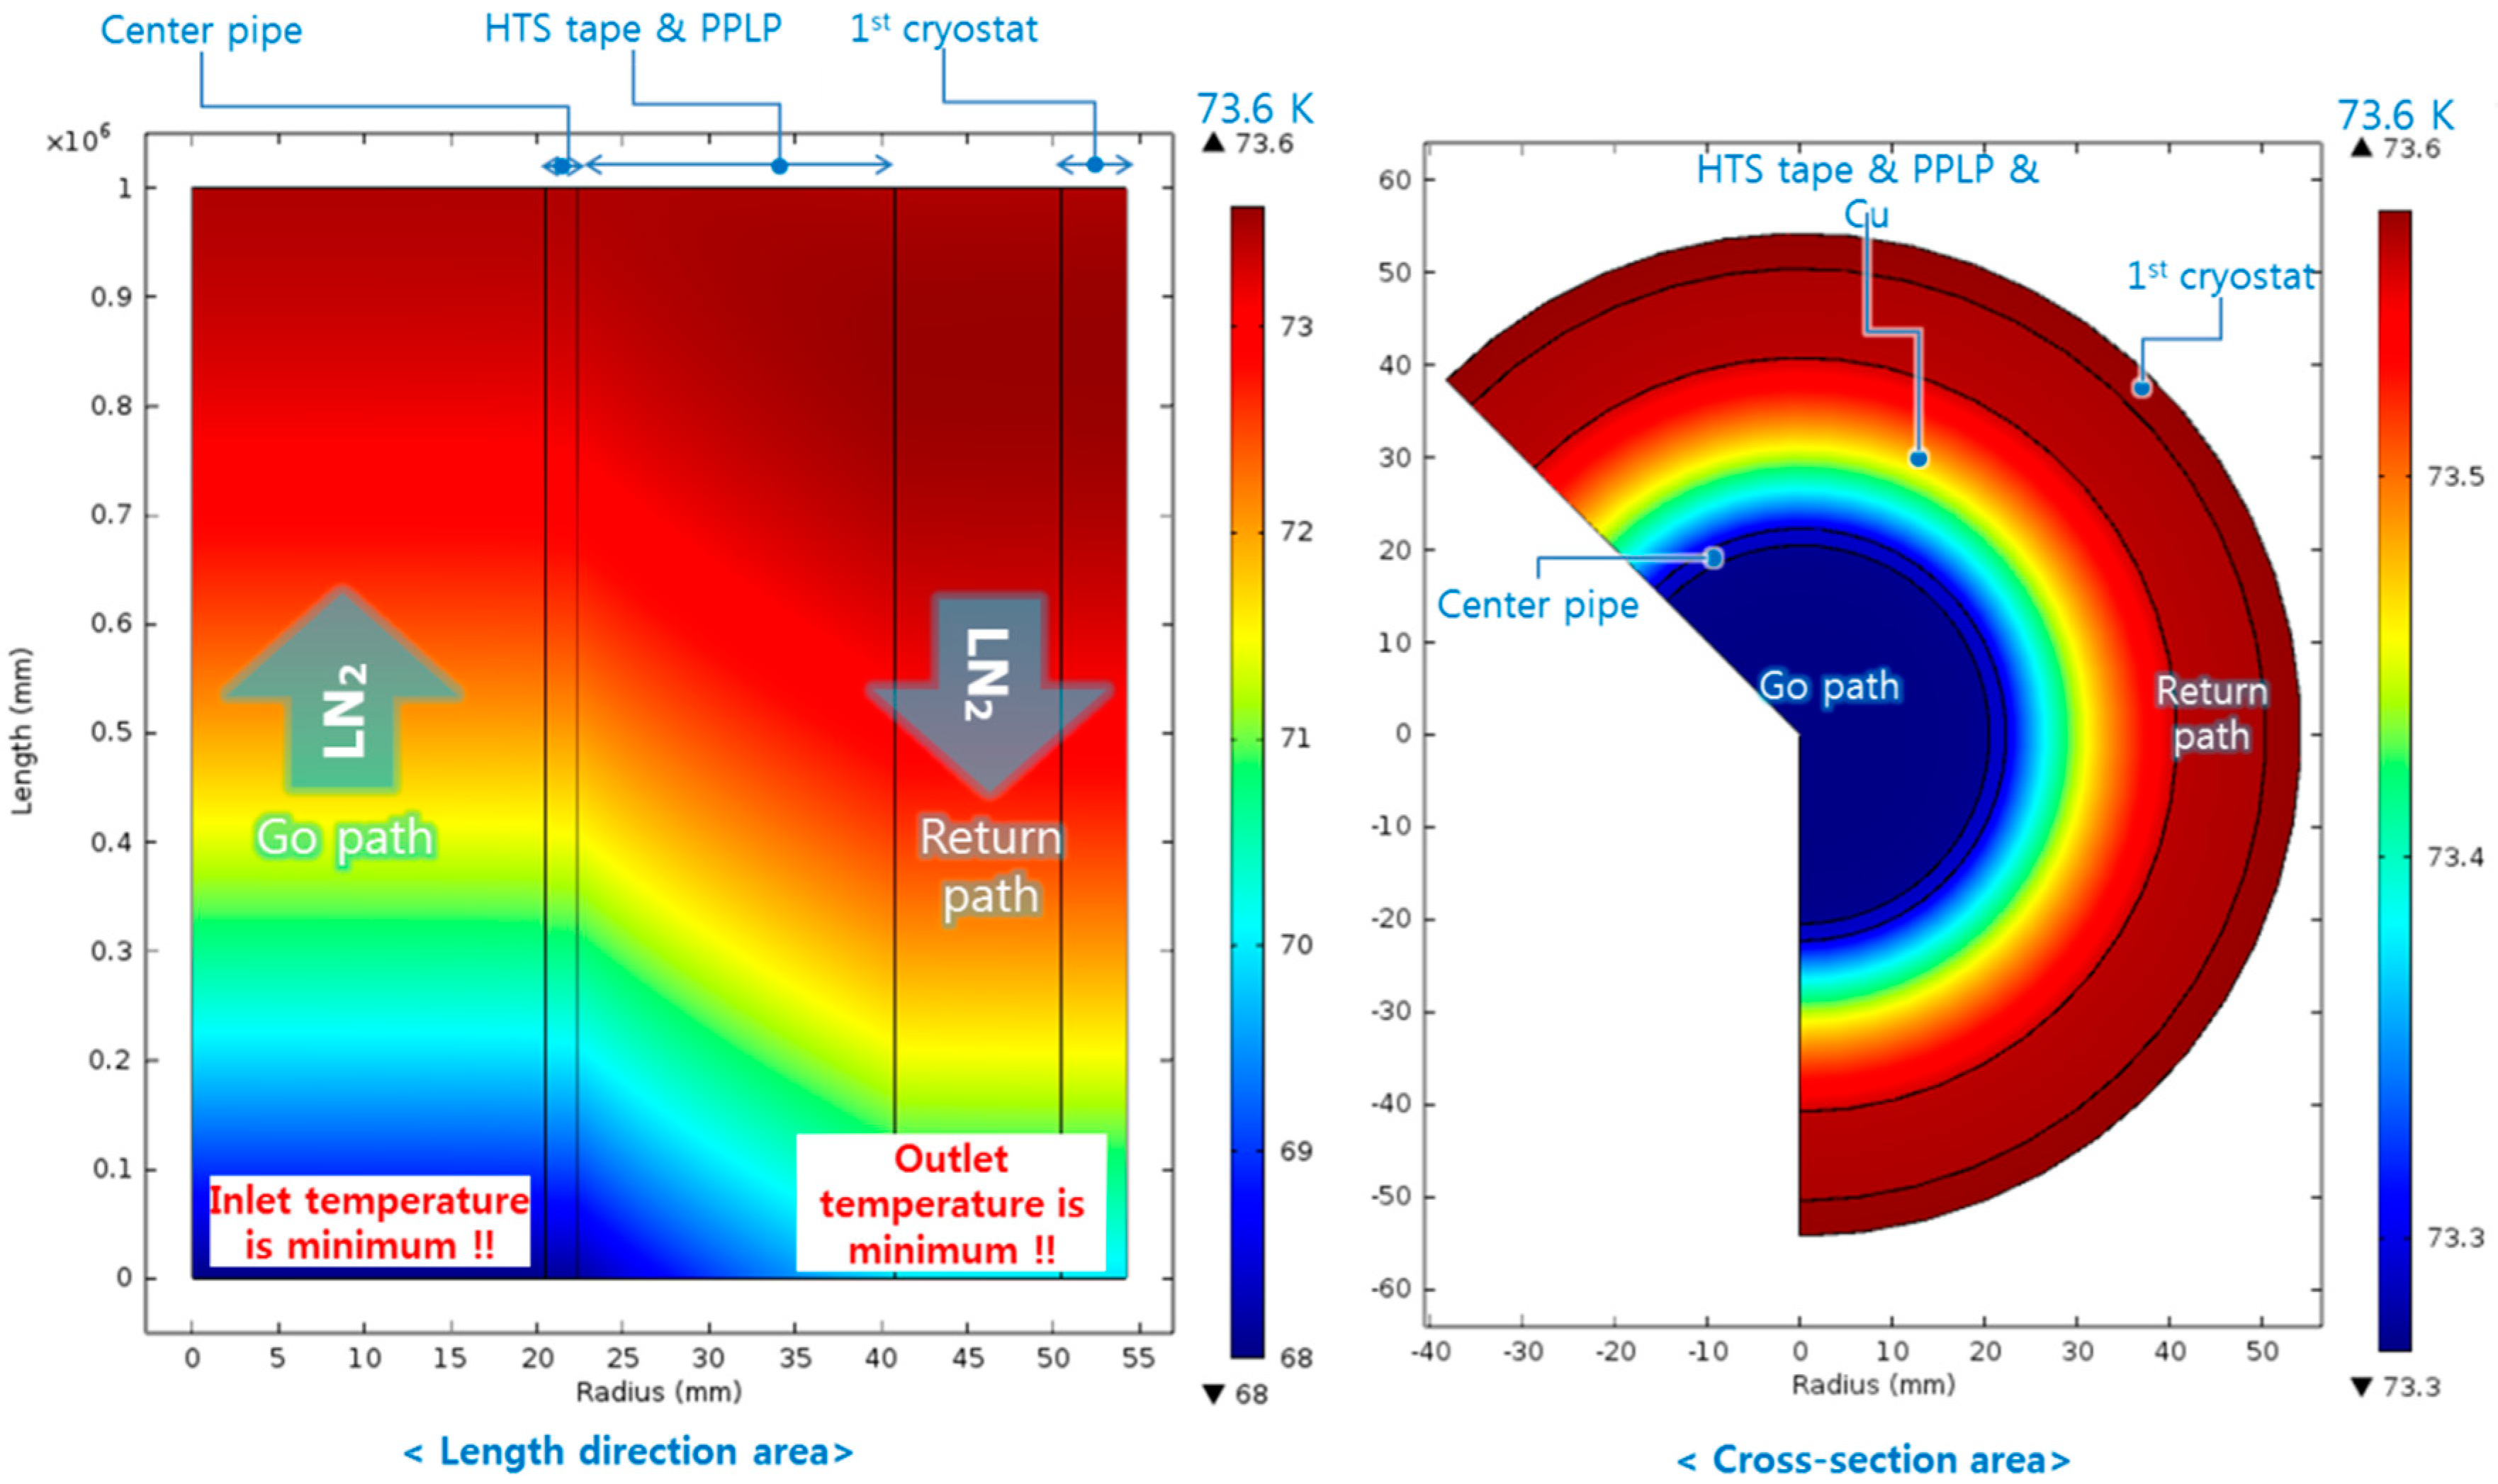
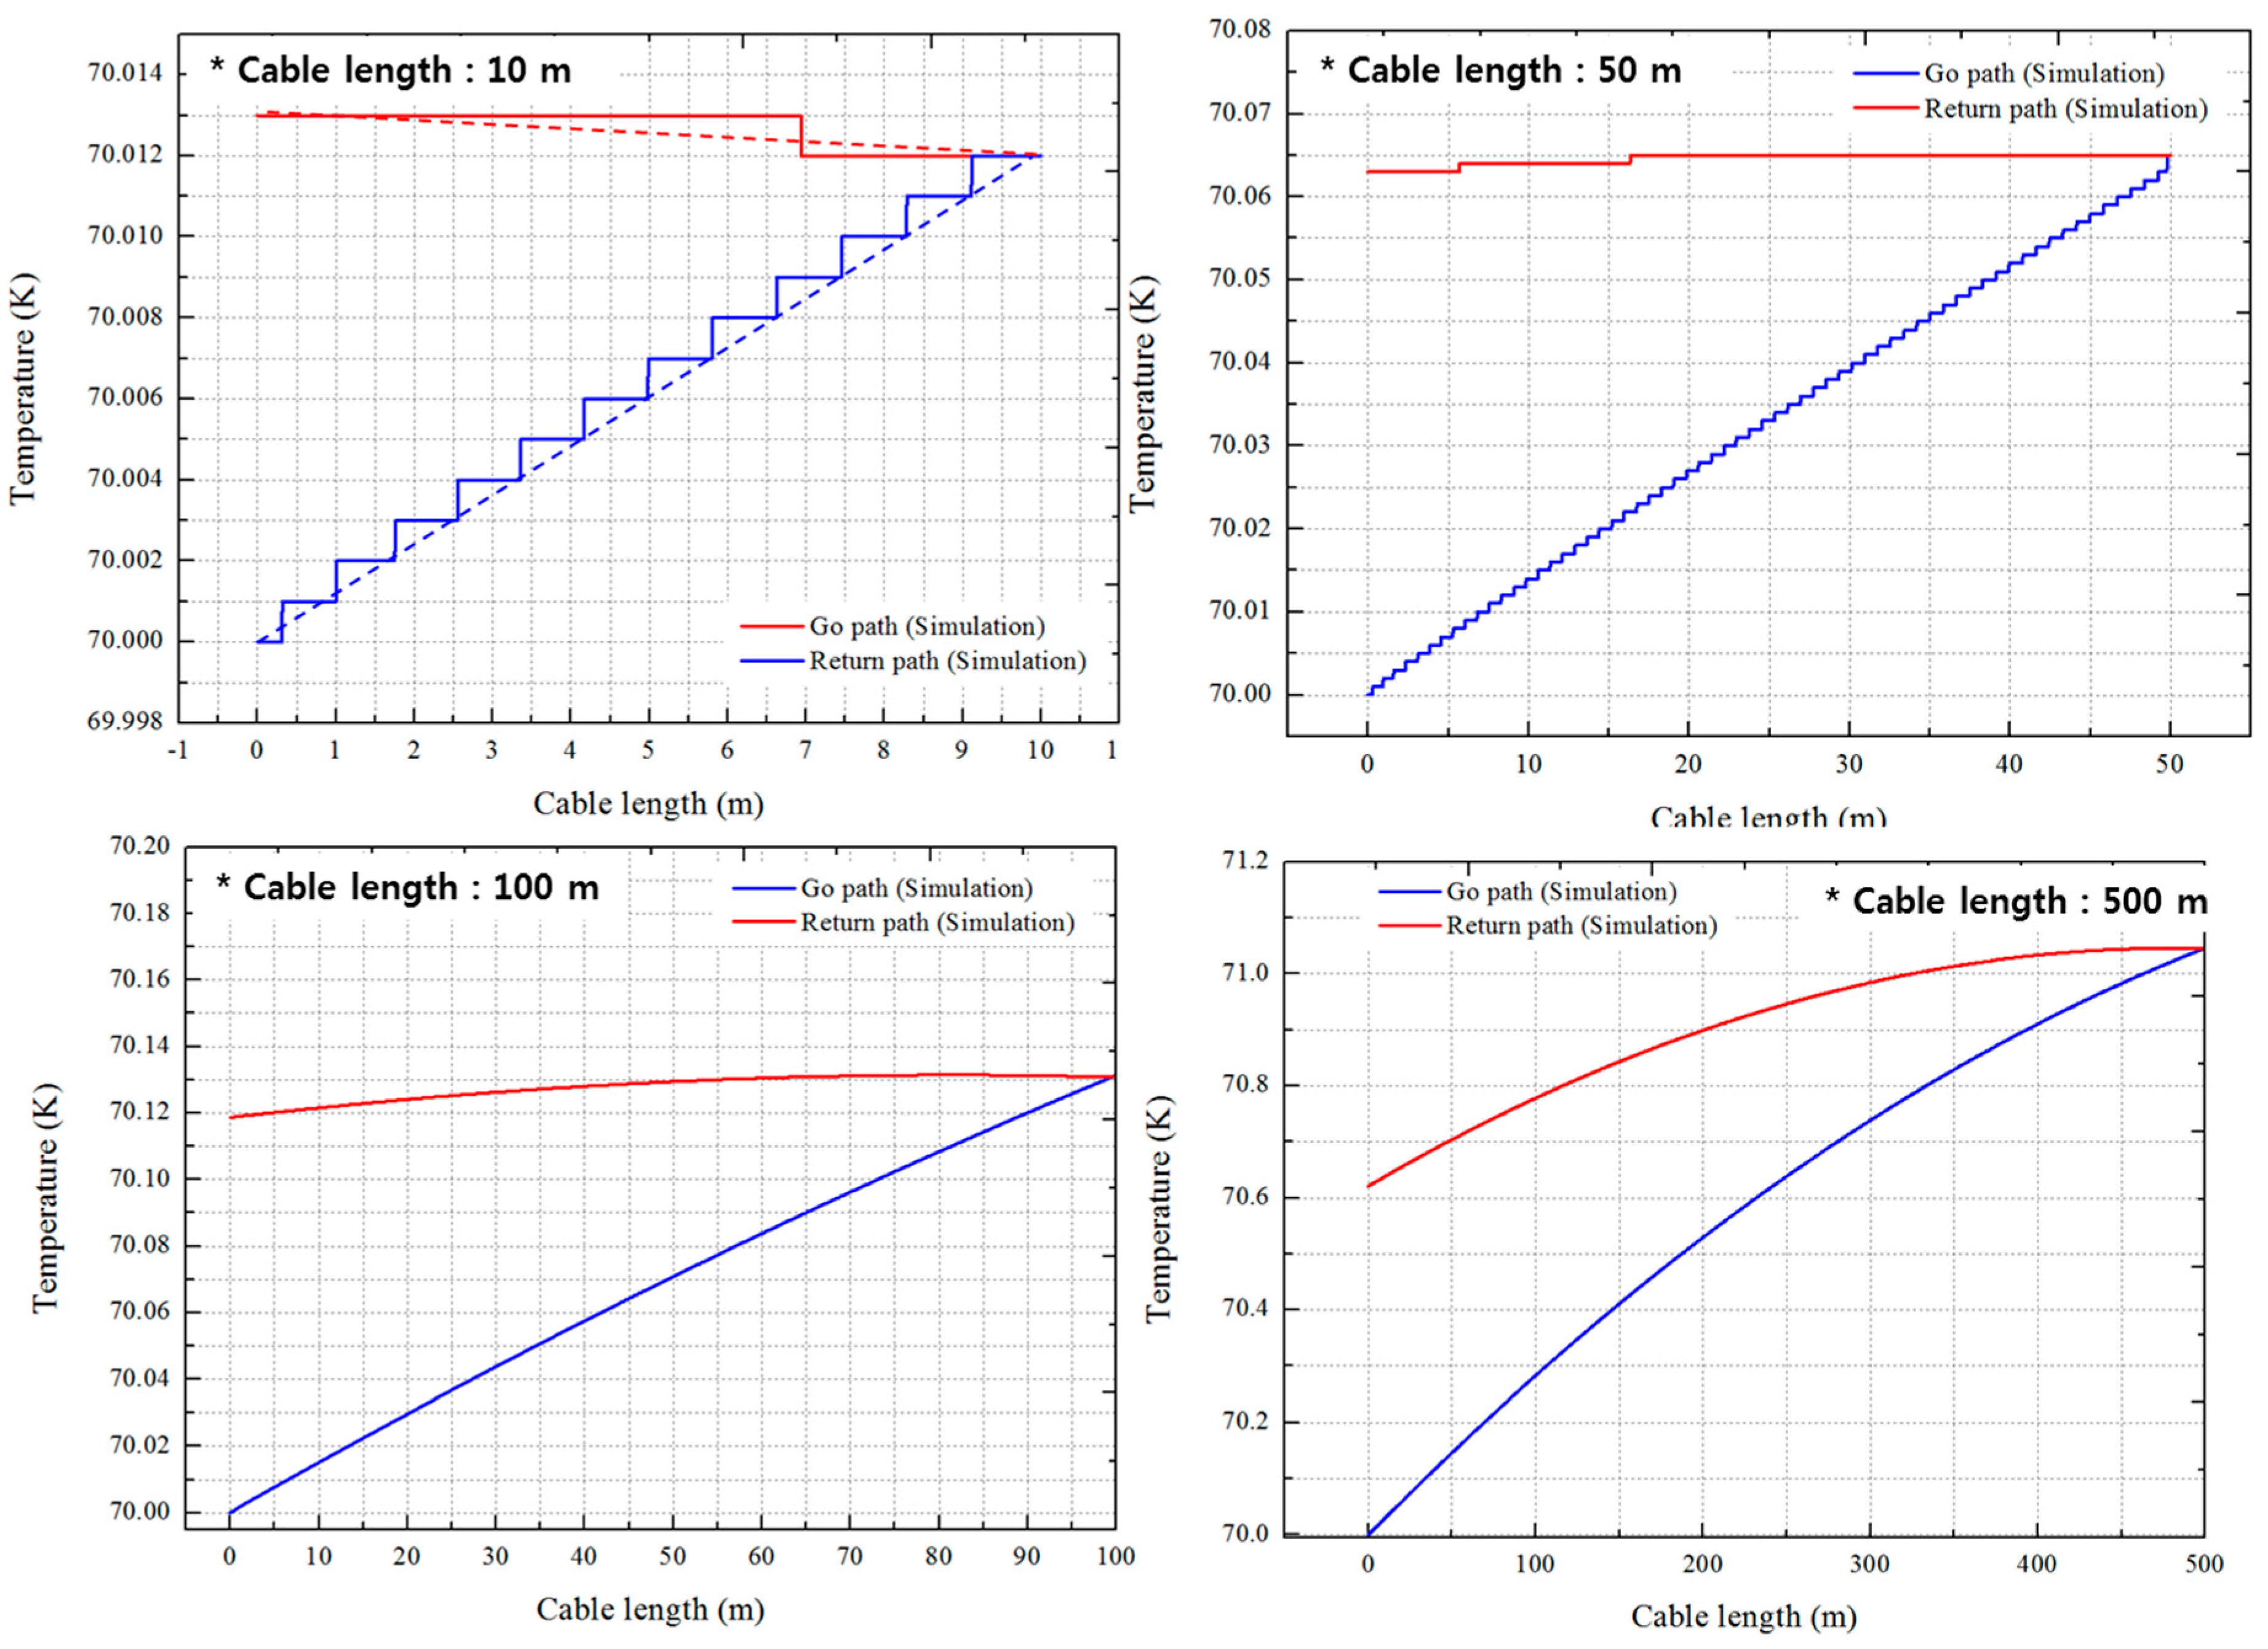
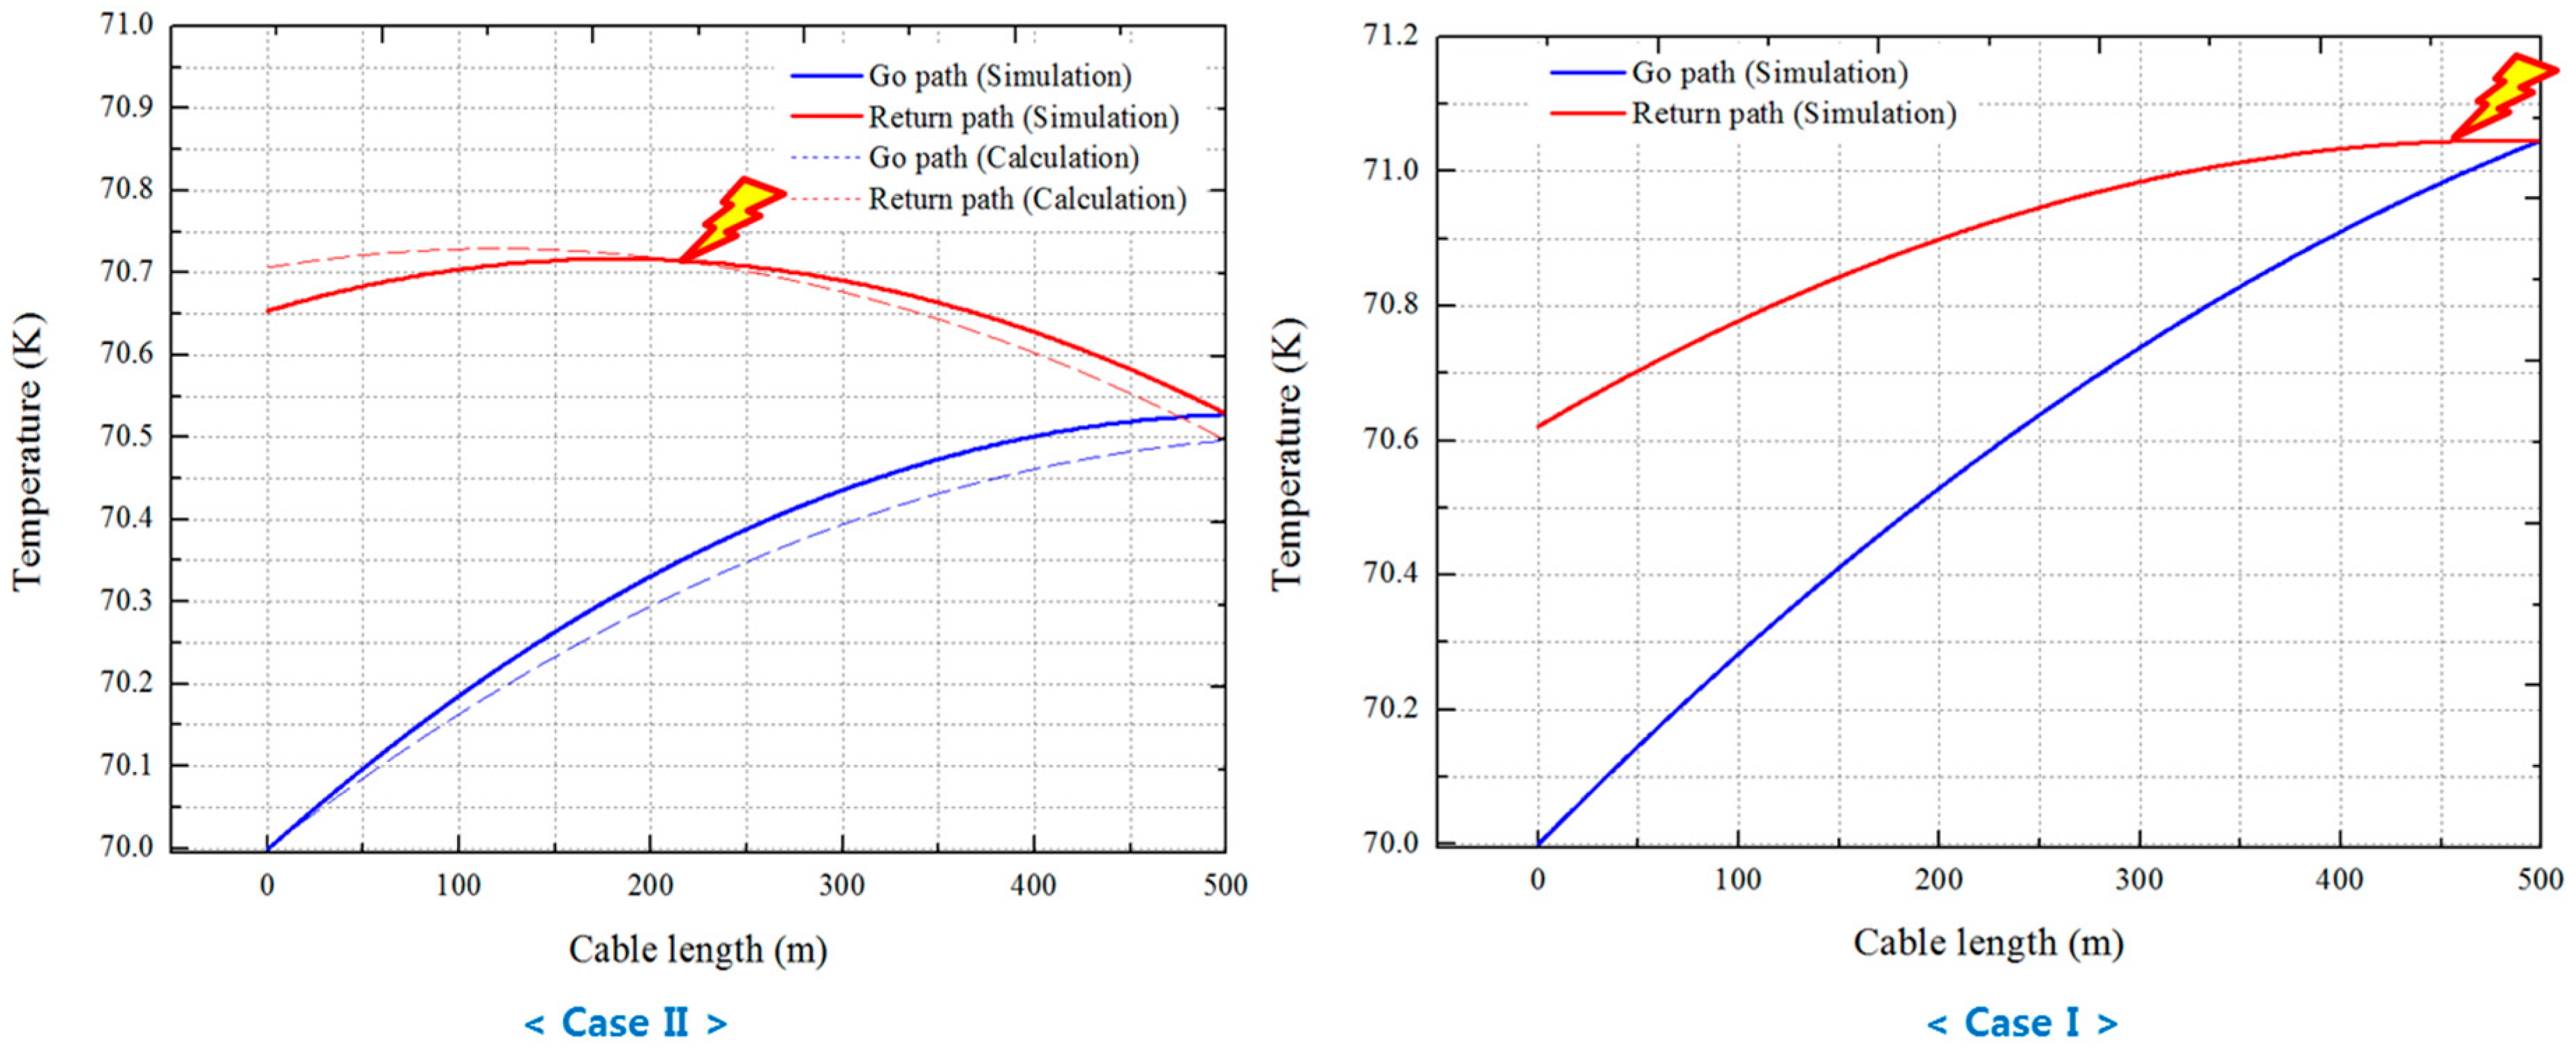
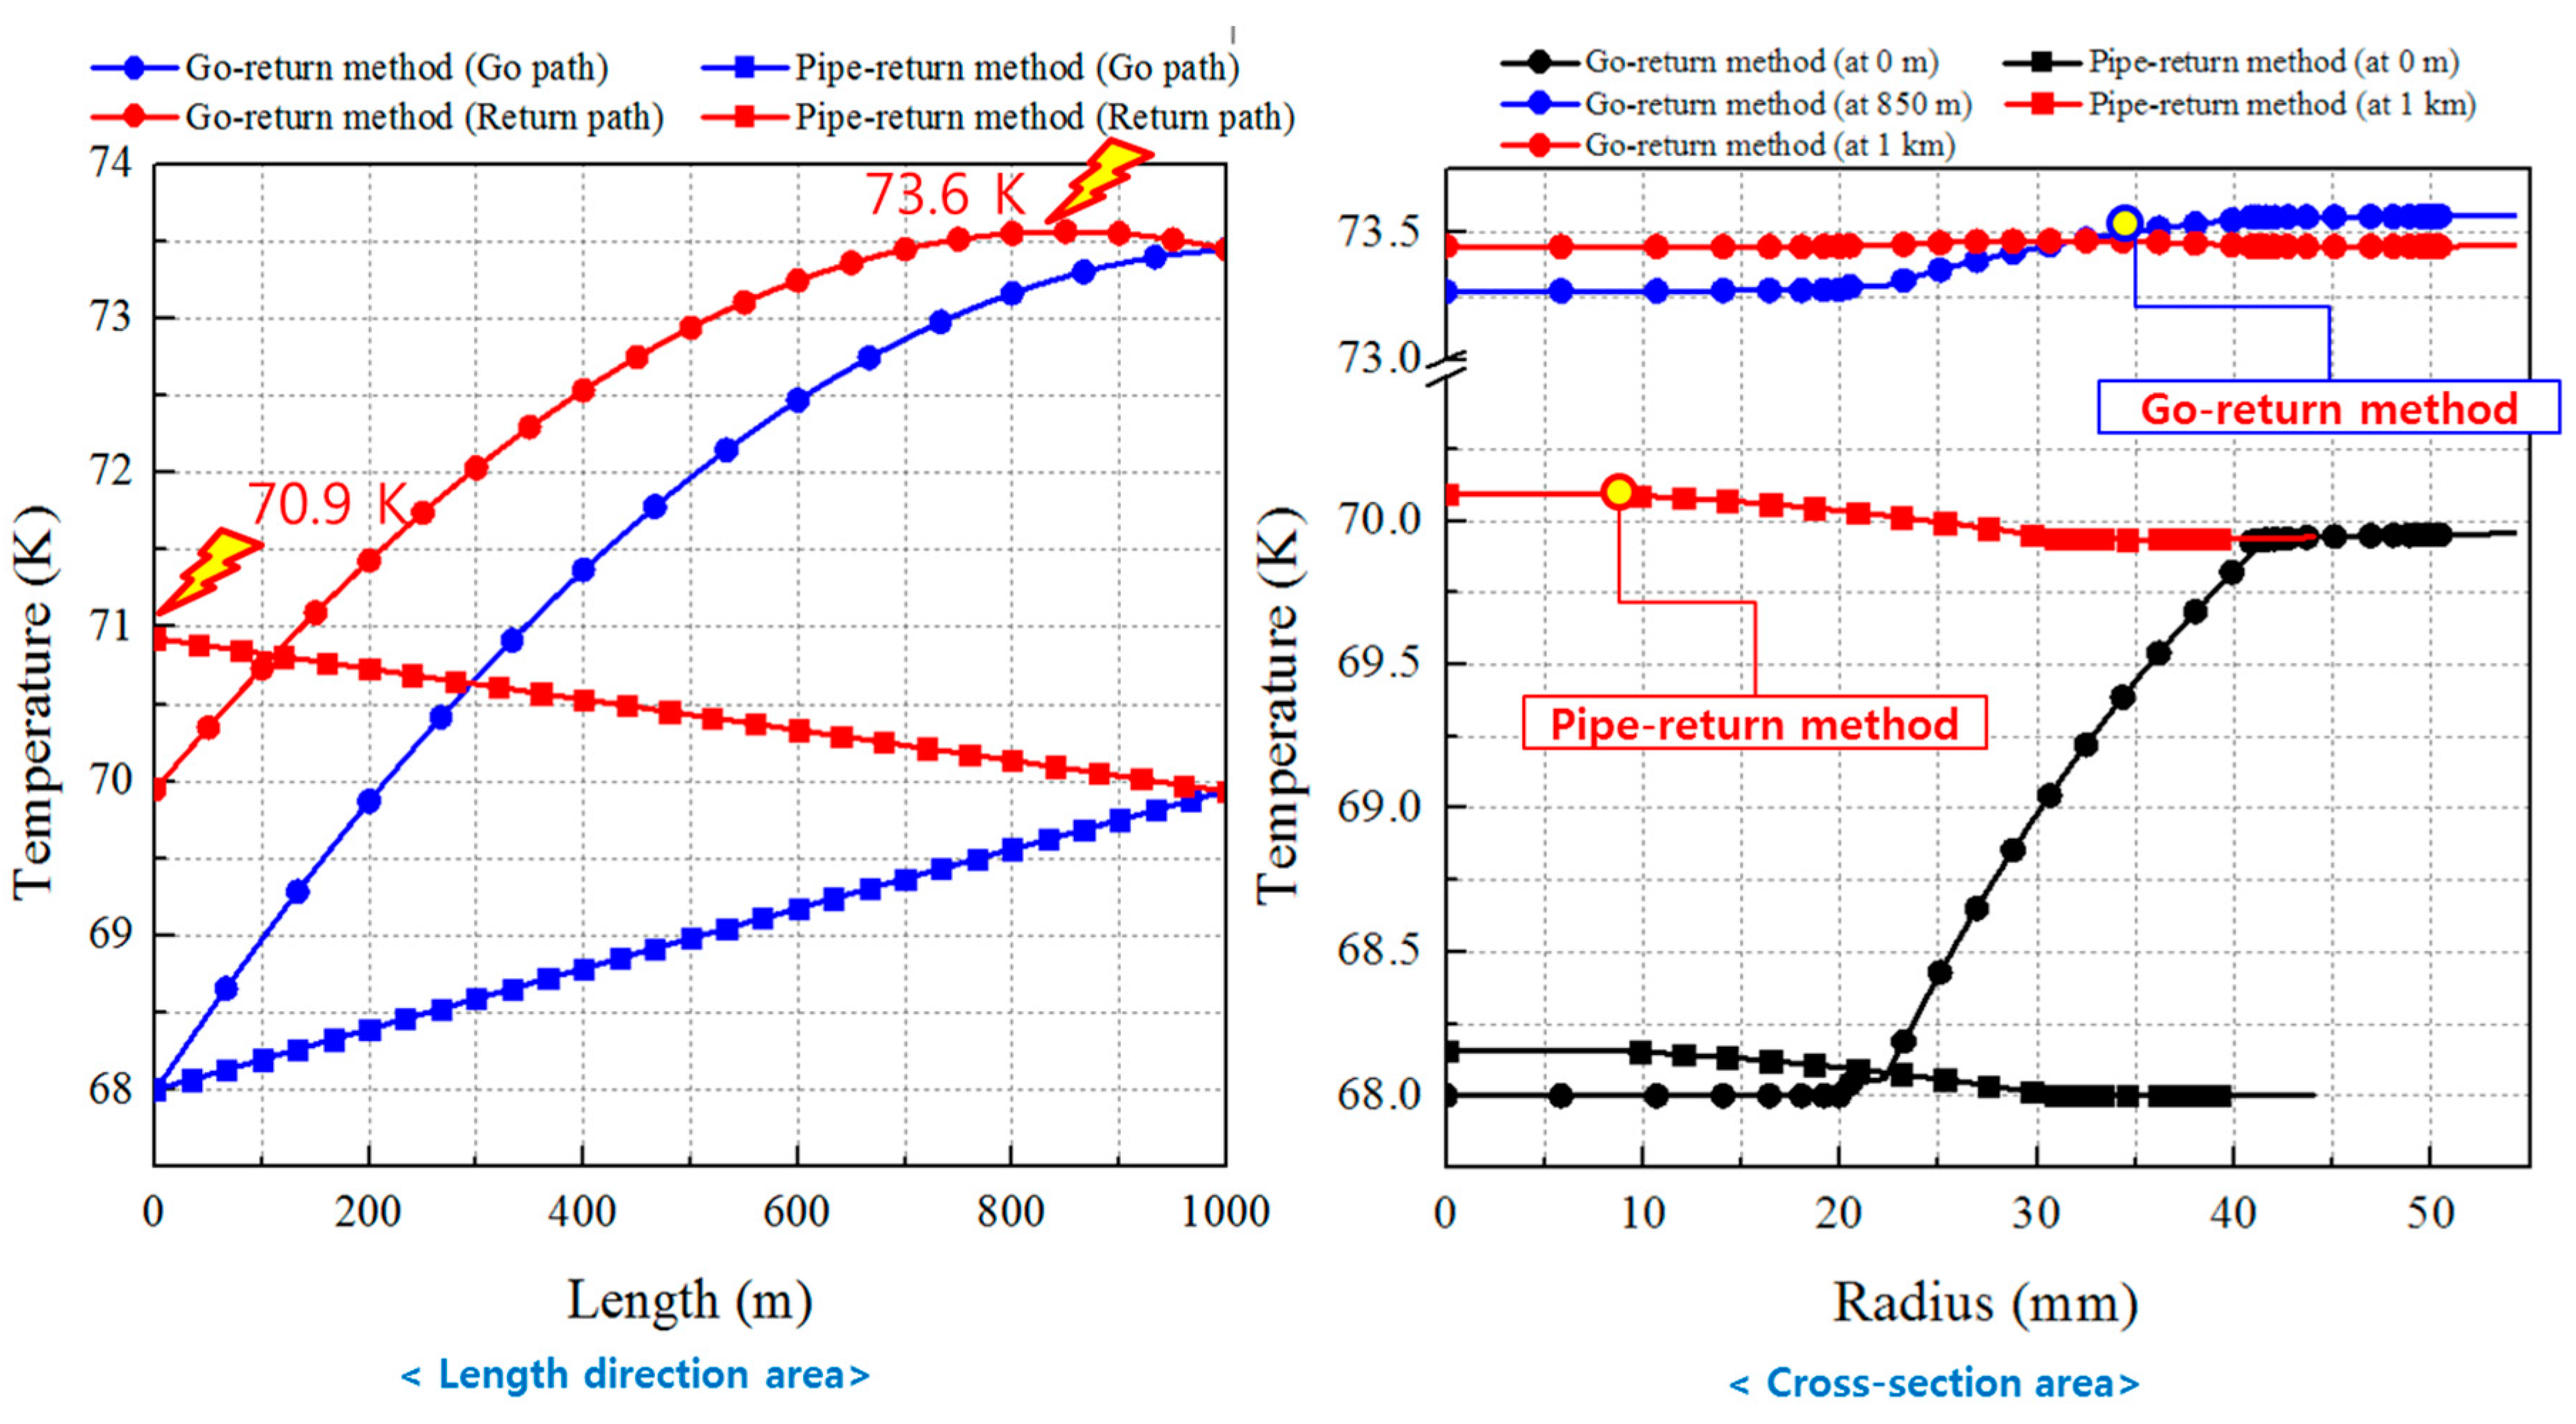
5. Simulation Results

Figure 6 shows the results of the temperature analysis in the longitudinal direction and the cross direction of Case II. The temperatures at the inlet and outlet sides do not reach the minimum and maximum values due to the heat transfer between the superconducting layer and the insulating layer between the go-path section and the return-path section.
Figure 7 shows the analysis result of the circulation-type Case III applying the return pipe. It can be seen that the entrance-side temperature and the exit-side temperature of the cable cooling system are minimized because the inlet pipe and the outlet pipe are insulated thermally from each other by applying the circulation pipe separately to the return pipe.
Figure 8 shows the result of the temperature analysis of Case I according to cable length. When the hollow tube is cooled by the refrigerant circulation pipe, the point at which the maximum temperature of the system rises as the cable length increases becomes the middle point of the outlet of the cable. The system temperature is difficult to predict. For short distances such as 10, 50, and 100m, the cryogenic circulation system consisting of a hollow pipe like Case I & II is useful because the cable outlet temperature has the highest temperature. However, when a long-distance transmission of more than 500 m is required, it is not appropriate to apply it to an actual system because the outlet temperature of the cable is not the highest.
Figure 9 shows the temperature distribution of Cases I and II in a 500-m cable cooling circulation system. Compared with Case I, the maximum temperature of Case II is located further in the middle of the cable, so the temperature of the actual system is difficult to measure. Case II and I are superconducting cable systems of the same structure with a hollow pipe. However, the liquid nitrogen circulation direction is opposite and the temperature profile of the cable shows different results. It is more advantageous to predict the temperature in an actual system because the temperature at the exit side is highest than that of the case II.
As can be seen in Figure 10, if the cable length is more than 1 km, the cooling cycle of the rest of the system except Case III will be at the midpoint of the cable where the maximum temperature of the system is reached. This will become even more serious as cable length increases. In case of the actual superconducting cable system, in most structures connecting substations, the cable length is at least 1 km or more. In this case, it is impossible to measure the temperature at the midpoint of the cable. Therefore, in this paper, we propose the application of the structure with return pipe as Case III for liquid nitrogen circulation system of superconducting cable system with length of more than 1km. Temperature is difficult to predict. For the three-phase coaxial superconducting power cable to be applied in Korea, we plan to apply the Case III circulation method because we are planning a site of 2 km or more.

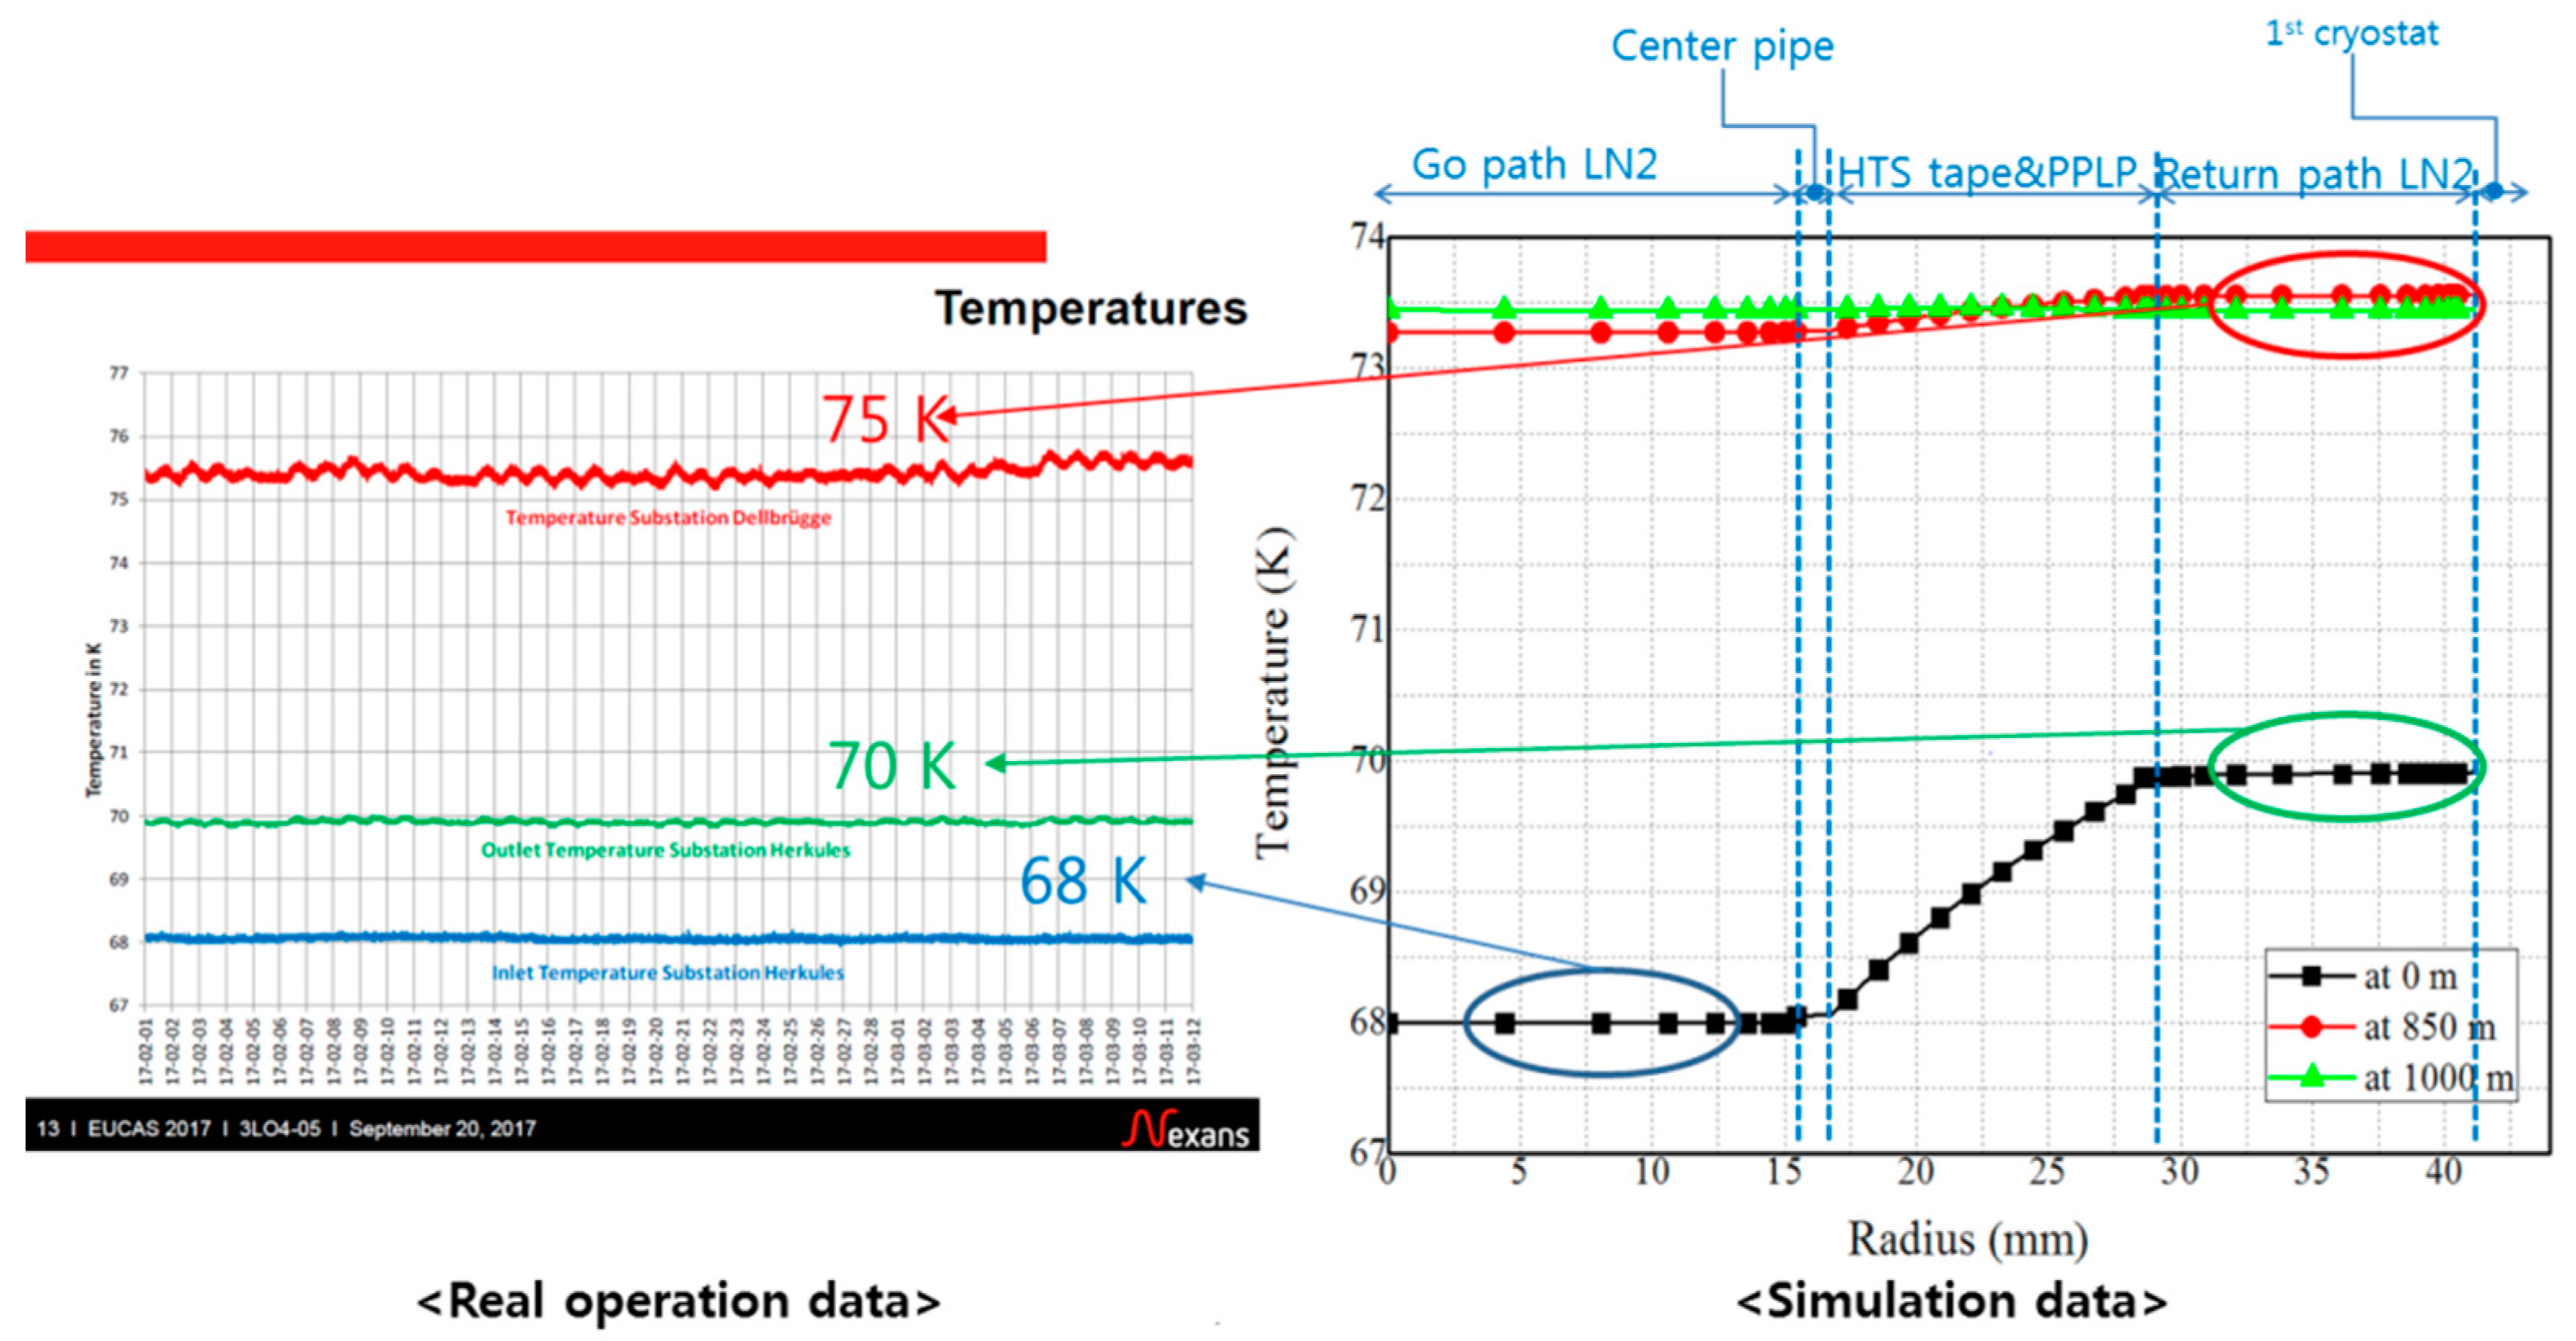
6. Simulation Results Verification

In order to verify the simulation results, the operational data of the Ampacity project with the same LN2 circulation structure as in case II of this paper was used. Reflecting the liquid nitrogen flow rate and heat loss operation data in Figure 11, simulation parameters were determined in Table 4 and the cable specifications were predicted. The total length of this cable system is about 1 km [19].
Figure 12 shows the actual operating temperature data of the “A” project and the simulation results of this paper. The inlet and outlet temperatures of the simulation show very similar results to the actual operating data. The comparison of the actual data with the simulation results implies that the simulation results of this paper are applicable to the design of the domestic superconducting cable project using Case III.

7. Conclusions

In this paper, we analyzed the temperature distribution of the cable according to the cooling circulation method of the three-phase coaxial superconducting power cable for domestic system application. As a result of the analysis, the refrigerant circulation system using the return pipe is easier to measure and to predict the actual system temperature than the refrigerant circulation method of the hollow tube in order to install by the structure of the long-distance cable. Failure of temperature measurement and prediction in a real system can lead to serious failure of the system because it cannot accurately grasp the state of the cable in a transient state such as a system failure or an abnormality. The simulation results show that case I and II have a maximum temperature of 73.6 K at the middle of the cable and case III has the maximum temperature of 70.9 K at the exit of the cable. Therefore, we propose to apply liquid nitrogen circulation system with return pipe as in case III in 3-phase coaxial superconducting cable system that requires more than 1km of long-distance transmission. Of course, when using a return pipe, additional cable space is required. However, if a cable system of more than two lines is used, the first cryostat of the remaining cable can be utilized as a return pipe. The analytical results of this paper will be applied to the actual structure of the three-phase coaxial superconducting power cable for the real grid system, and the circulation method can be designed and determined by using the same analysis method.

Author Contributions

Conceptualization, investigation, writing-original draft preparation and editing, S.-J.L.; Analysis, H.-J.S.; project supervision and administration, M.P.; funding acquisition, D.W., J.Y. and H.S.Y.

Funding

This work was funded by Korea Electric Power Corporation.

Conflicts of Interest

The authors declare no conflict of interest.

References

  1. Ivanov, Y.; Radovinsky, A.; Zhukovsky, A.; Sasaki, A.; Watanabe, H.; Kawahara, T.; Yamaguchi, S. A compact cooling system for HTS power cable based on thermal siphon for circulation of LN2. In Proceedings of the American Institute of Physics, CP1218, Advances in Cryogenic Engineering: Transactions of the Cryogenic Engineering Conferende—CEC, Tucson, AZ, USA, 28 June–2 July 2010; pp. 865–870. [Google Scholar]
  2. Demko, J.A. Experimental study of counterflow cooling using a test loop to simulate the thermal characteristics of a hts cable system. In Proceedings of the American Institute of Physics, CP1413, Advances in Cryogenic Engineering: Transactions of the Cryogenic Engineering Conferende—CEC, Spokane, WA, USA, 13–17 June 2012; pp. 283–290. [Google Scholar]
  3. Demko, J.A.; Duckworth, R.C.; Gouge, M.J.; Knoll, D. Heat transfer experiments and analysis of a simulated hts cable. In Proceedings of the American Institute of Physics, CP1218, Advances in Cryogenic Engineering: Transactions of the Cryogenic Engineering Conferende—CEC, Tucson, AZ, USA, 28 June–2 July 2010; pp. 429–436. [Google Scholar]
  4. Furuse, M.; Fuchino, S. Analysis and Measurement of Thermal Conductivity of Polypropylene Laminated Paper Impregnated with Subcooled Liquid Nitrogen; Elsevier: Cryogenics, Amsterdam, The Netherlands, 2014. [Google Scholar]
  5. Shuichiro, F.; Mitsuho, F.; Noboru, H. Longitudinal Temperature Distribution in Superconducting Power Cables with Counter-Flow Cooling. IEEE Trans. Appl. Supercond. 2002, 12, 1339–1342. [Google Scholar]
  6. Demko, J.A.; Sauers, I.; James, D.R.; Gouge, M.J.; Lindsay, D.; Roden, M.; Tolbert, J.; Willén, D.; Træholt, C.; Nielsen, C.T. Triaxial HTS Cable for the AEP Bixby Project. IEEE Trans. Appl. Supercond. 2007, 17, 2047–2050. [Google Scholar] [CrossRef]
  7. Chang, H.; Ryu, K.N.; Suk, H. Cryogenic Design of Liquid-Nitrogen Circulation System for Long-Length HTS Cables with Altitude Variation; Elsevier: Amsterdam, The Netherlands, 2017. [Google Scholar]
  8. Maguire, J.F.; Schmidt, F.; Bratt, S.; Welsh, T.E.; Yuan, J.; Allais, A.; Hamber, F. Development and Demonstration of a HTS Power Cable to Operate in the Long Island Power Authority Transmission Grid. IEEE Trans. Appl. Supercond. 2007, 17, 2034–2037. [Google Scholar] [CrossRef]
  9. Fisher, P.W.; Cole, M.J.; Demko, J.A.; Foster, C.A.; Gouge, M.J.; Grabovickic, R.W.; Lue, J.W.; Stovall, J.P.; Lindsay, D.T.; Roden, M.L.; et al. Design, Analysis, and Fabrication of a Tri-Axial Cable System. IEEE Trans. Appl. Supercond. 2003, 13, 1938–1941. [Google Scholar] [CrossRef]
  10. Dondapati, R.S.; Rao, V.V. Pressure Drop and Heat Transfer Analysis of Long Length Internally Cooled HTS Cables. IEEE Trans. Appl. Supercond. 2013, 23, 5400604. [Google Scholar] [CrossRef]
  11. Kottonau, D.; de Sousa, W.T.B.; Bock, J.; Noe, M. Design Comparisons of Concentric Three-phase HTS Cables. IEEE Trans. Appl. Supercond. 2019, 29. [Google Scholar] [CrossRef]
  12. Morgan, G.; Jensen, J.E. Counter-flow cooling of a transmission line by supercritical helium. Cryogenics 1977, 17, 259–267. [Google Scholar] [CrossRef]
  13. Demko, J.; Lue, J.; Gouge, M.; Stovall, J.; Butterworth, Z.; Sinha, U.; Hughey, R. Practical AC loss and thermal considerations for HTS power transmission cable system. IEEE Trans. Appl. Supercon. 2001, 11, 1789–1792. [Google Scholar] [CrossRef]
  14. Edney, K.; Fox, M.; Gilbert, G. Longitudinal temperature distribution in low temperature cables with counterflow cooling. Cryogenics 1967, 7, 355–358. [Google Scholar] [CrossRef]
  15. Weedy, B.M.; Rigby, S.J. Thermal and electrical assessment of flexible cryoresistive cables. Cryogenics 1977, 17, 453–459. [Google Scholar] [CrossRef]
  16. Demko, J.; Lue, J.; Gouge, M.; Fisher, P.; Lindsay, D.; Roden, M. Analysis of a Liquid Nitrogen Cooled Tri-Axial High Temperature Superconducting Cable System. Adv. Cryog. Eng. 2004, 49A, 913–920. [Google Scholar]
  17. Demko, J.; Duckworth, R. Cooling Configuration Design Considerations for Long-Length HTS Cables. IEEE Trans. Appl. Supercon. 2009, 19, 1752–1755. [Google Scholar] [CrossRef]
  18. Yang, L.; Yahui, L.; Guoqing, L.; Dongbo, Z.; Chen, C. Two-stage multi-objective OPF for AC/DC grids with VSC-HVDC: Incorporating decisions analysis into optimization. Energy 2018, 147, 286–296. [Google Scholar]
  19. Mark, S.; Kai, A.; Frank, M.; Torsten, K.; Friedhelm, H.; Thomas, K.; Jean -Maxime, S. Three Years Operation Experience of the Ampacity System Installation in Essen, Germany; EUCAS: Ceneva, Switzerland, 2017. [Google Scholar]
Figure 1. One-circuit configuration of the HTS cable system (about 1 km).
Energies 12 01740 g001
Figure 2. Cases of LN2 circulation structure.
Energies 12 01740 g002
Figure 3. Modeling of the thermal analysis of a three-phase coaxial HTS power cable.
Energies 12 01740 g003
Figure 4. 2D modeling of the thermal analysis of a three-phase coaxial HTS power cable.
Energies 12 01740 g004
Figure 5. Cable structure according to cooling circulation system.
Energies 12 01740 g005
Figure 6. Temperature analysis results of length direction and the cross section of Case II (1 km).
Energies 12 01740 g006
Figure 7. Temperature analysis results of length direction and the cross section of Case III (1 km).
Energies 12 01740 g007
Figure 8. Results of temperature analysis according to cable length of Case.
Energies 12 01740 g008
Figure 9. Comparison of temperature distribution between Case I and Case II (500 m).
Energies 12 01740 g009
Figure 10. Temperature distribution comparison between Case I and Case III (1 km).
Energies 12 01740 g010
Figure 11. Real operation data of “A” project for simulation certification (1 km).
Energies 12 01740 g011
Figure 12. Comparison of temperature results between actual operation and simulation.
Energies 12 01740 g012
Table 1. Comparison of cooling circulation methods of three-phase coaxial superconducting power cable.
CasesLN2 Path TypesRemark
Case I1st cryostat inlet
Center pipe outlet
No need for a circulation pipe
(one circuit)
Case IICenter pipe inlet
1st cryostat outlet
Increase the diameter of the HTS cable
(high pressure drop)
Uncertain temperature
Case III1st cryostat inlet
Another return pipe outlet
Estimation of max. temperature
Need for an extra pipe for the circulation of LN2
(two circuits)
Table 2. Parameter for thermal analysis.
PartParameterValueUnit
Condition of thermal loadHeat from HTS wire (AC loss)1W/m
Heat from the exterior1W/m
Condition of liquid nitrogenLN2 temperature of inlet68K
Mass flow0.5Kg/s
Dynamic viscosity1.64 ✕ 10−4Pa·s
Heat capacity2kJ/kg·K
Table 3. Cable circulation pipe specification for thermal analysis.
ParameterValueRemark
Case I&IICase III
Center PipeInner diameter40 mm-Corrugated tube
HTS & Insulation layerThicknessAbout 10 mmAbout 12 mm
1st cryostatInner diameter100 mm80 mmCorrugated tube
Return PipeInner diameter-60 mm
Table 4. Circulation pipe specification of real installation cable for comparison with simulation.
ParameterValue (Case II)Remark
Center PipeInner dia.32 mmCorrugated tube
HTS & Insulation layerThicknessAbout 10 mm
1st cryostatInner dia.85 mmCorrugated tube
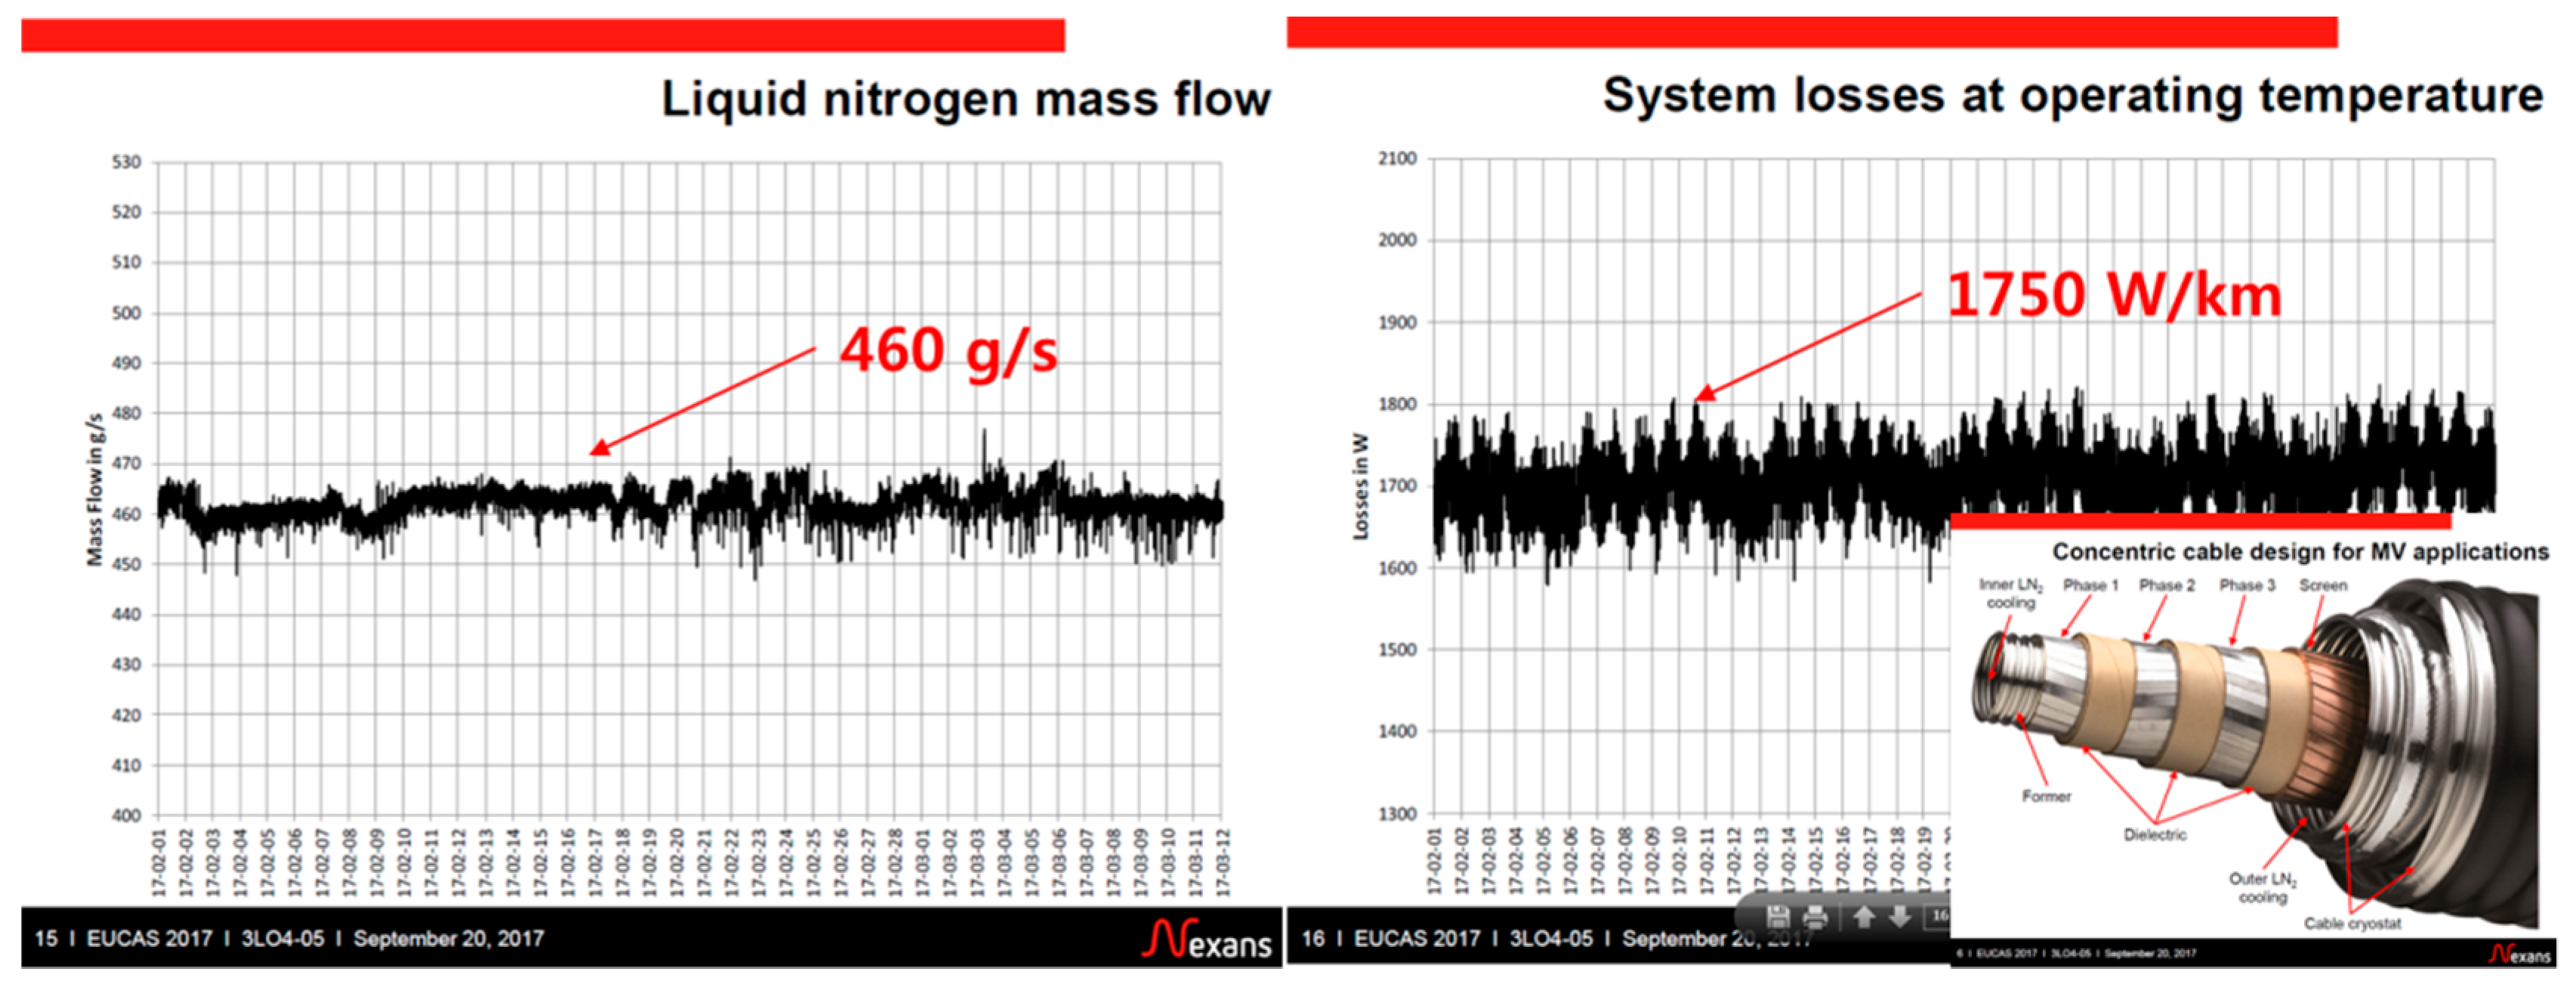
Heat from HTS wire & exterior
Mass flow of LN2
1.75 W/m
0.46 kg/s

