Abstract
Managing a large fleet of ageing assets has become a technical challenge faced by many electricity utilities in developed countries. Asset managers are increasingly interested in techniques that can help extend the useful lifetime of a transformer. Oil regeneration is one of such techniques. In this paper, oil regeneration experiments were performed on a 6.4/0.4 kV retired distribution transformer to investigate the effect of oil regeneration on improving paper conditions. Oil regeneration was conducted in two stages, with the first stage aimed at ‘cleaning the oil’ and the second stage targeted at ‘cleaning the paper’. Oil samples were collected at regular intervals throughout the process and paper samples were obtained from the transformer before and after each oil regeneration stage. It was found that oil regeneration restores oil parameters, including moisture and acidity, similar to those of new oils at the end of stage 1. Analysis of paper samples indicated a reduction in paper moisture at the end of stage 2 by nearly 40%, while low molecular weight acids (LMA) in paper exhibited a reduction by around 30% on average. It is found that the extended oil regeneration period, i.e., stage 2, is necessary to improve the paper condition and hence to reduce the paper ageing rate.
1. Introduction
Most of transformers in service today are of the oil-immersed type, with mineral oil and cellulosic paper/pressboard being used as the main liquid and solid insulation, respectively. As oil and paper age, they generate ageing by-products such as acids and moisture, the accumulation of which further accelerates the ageing process [1]. Thus, it is imperative that these ageing by-products are identified and removed from the system at an appropriate stage in order to slow down the ageing process. This is mainly achieved through oil regeneration, a process which removes the ageing by-products through physical and/or chemical processes [2,3,4]. Factors such as the duration of the maintenance, on-line and off-line preferences, effectiveness, investment and operating costs all have to be considered when selecting an oil regeneration technique.
The terms regeneration, reclamation and recycling are somehow interchangeably used in the field to describe the process which removes the ageing by-products from the oil and improves the quality of the oil. BS EN 60422 [5] defines oil reconditioning as “a process that reduces physical contaminants by means of physical processes” and oil reclamation as “a process that eliminates or reduces soluble and insoluble polar contaminants from the oil by chemical and physical processing”. CIGRE brochure 413 [6] defines reclamation as “the elimination of soluble and insoluble contaminants from an insulating liquid by chemical absorption means, in addition to mechanical means, in order to restore the properties as close as possible to the original values”. In this paper, the term ‘regeneration’ shall be used to describe the process involving circulation of oil at elevated temperatures accompanied by adsorbent-based reclamation cycles.
A typical oil regeneration process can be divided into two phases, a treatment phase and a reactivation phase [6]. In the treatment phase, oil is reclaimed by forced percolation through the adsorbent system. It is then filtered and degassed before being returned back into the tank. Depending upon the quality of oil, the quantity of oil processed and the capacity of the regeneration unit, the duration of this process may vary from case to case. Once the adsorbent is saturated, it needs to be ‘reactivated’ in order to restore its adsorbent capabilities. This is done by backwashing the adsorbent with certain chemicals or by a burning process. This process, termed as reactivation, could take more than ten hours, again depending on the capacity of the unit.
The history of oil reconditioning/regeneration dates back to early 20th century, the time when mineral oil was first used as an insulating liquid for transformers [7,8,9]. Lack of mineral oil resources in some countries and degradation of available oil leading to sludge formation in transformers were the main driving forces to consider oil reconditioning/regeneration [9]. For over a century various laboratory-based and field studies/trials have been conducted on the advantages and possible improvements of oil regeneration techniques [2,3,4,7,10,11,12,13].
With the rapid increase in aged transformer population in developed countries, asset managers have been trying to use regeneration as a life extension measure in order to defer transformer replacement investment costs. It has been suggested that the oil regeneration would not only remove the impurities from oil but also the impurities in paper, including moisture and low molecular weight acids (LMA), resulting in lifetime extension of the paper insulation [1,12,13].
Nevertheless, there is a lack of evidence to support the estimated life extension achievable through oil regeneration. It has been aware of that an improvement in the oil conditions alone is insufficient in effectively reducing the ageing rate of the transformer, as the paper condition plays a more crucial role in deciding the remaining life of the transformer [1]. This is highlighted by the existing ageing and lifetime estimation models, which focus on the paper parameters such as moisture and degree of polymerisation (DP) to estimate the transformer lifetime [11,14]. Therefore, it is necessary to investigate the changes to paper parameters, particularly through measurements of moisture and LMA. This could be made possible by subjecting a retired transformer to oil regeneration and measuring the paper parameters directly through invasive sampling before and after the oil regeneration process. This paper investigates the effect of oil regeneration on improving paper condition in terms of removal of ageing accelerator such as moisture and LMA by performing optimised oil regeneration process on a 6.4/0.4 kV retired distribution transformer. A pre-oil-regeneration inspection was first conducted to obtain the insulation conditions before oil regeneration. Oil regeneration was then performed on the transformer, with the oil conditions being constantly monitored. Paper samples were obtained in between and after the oil regeneration process. Changes to key paper ageing parameters were finally quantified.
2. Experimental Description
The oil regeneration experiment was conducted across three stages: pre-oil-regeneration inspection, stage 1 of oil regeneration aimed at ‘cleaning the oil’, and stage 2 of oil regeneration aimed at ‘cleaning the paper’.
2.1. Transformer under Test
The transformer under test was a 77-year-old, 6.4/0.4 kV, retired distribution transformer, the details of which are presented in Table 1.

Table 1.
Details of transformer under test.
2.2. Pre-Oil-Regeneration Inspection of the Transformer
Prior to conducting the oil regeneration experiment, multiple oil samples were taken from the top and bottom of the transformer tank. As shown in Table 2, variations of moisture and total acid number (TAN) among different sampling locations are small. This is because the transformer has been de-energised for over one year before the present experiment, during which the moisture and acid distributions within the transformer oil have reached quasi-/equilibrium. The average values of moisture and TAN of the oil samples are 18.4 ppm and 0.74 mg KOH/g, respectively.
Table 2.
Oil properties measured before post-mortem inspection.
The transformer was then de-tanked in order to carry out further inspection, paper sampling and sensor installation. The transformer was observed to be designed with a disc-type winding. The HV winding contained 64 discs, each of which had four turns. A top-view inspection of the LV side revealed that each LV disc contains three turns. The bottom discs of the HV winding exhibit a darker colour in comparison with the top discs. Closer observation revealed particle and sludge deposits on these bottom discs. Five tappings were observed on each phase near the centre of the HV winding. A central band of two discs in the tapped area of the HV winding were observed to be darker than its surrounding discs. The leads connecting to the tap changer were wrapped by crepe paper. No obvious tracking and treeing signs were observed on the winding insulation. The front view of the core and winding assembly is presented in Figure 1.
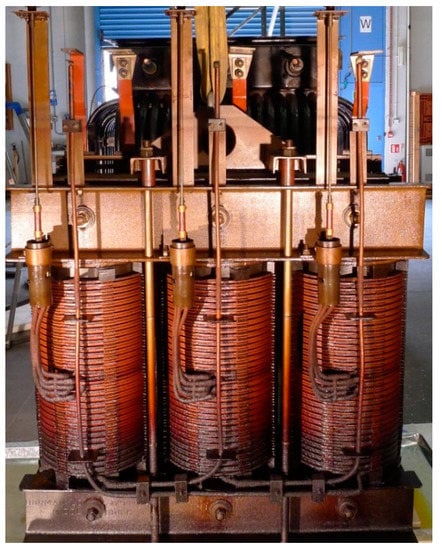
Figure 1.
Front view of the core and winding assembly of 6.4/0.4 kV distribution transformer.
After the physical inspection, samples of the winding were collected in order to measure the degradation state of paper insulation. The windings were observed to have two layers of wrapped paper insulation, each with a thickness of 0.4 mm on average. Finally, eight K-type thermocouples and a relative humidity sensor were installed on the windings as shown in Figure 2. Seven thermocouples were installed at the front side of the windings and one at the centre of the back side which would allow to obtain the temperature profile during the regeneration process. The Vaisala MMT330 solid state relative humidity sensor was installed at the centre of the winding, with the aim of observing moisture conditions inside the tank during oil regeneration.
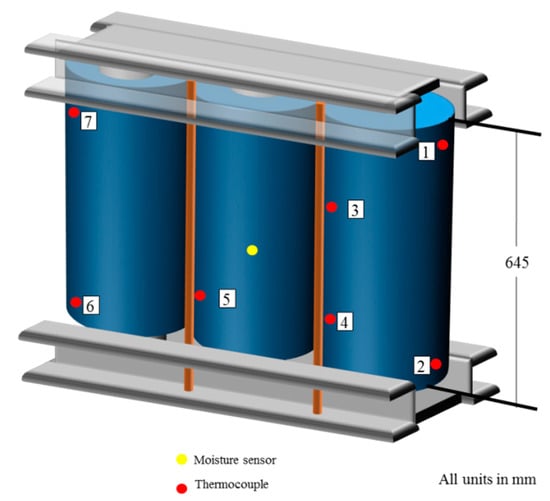
Figure 2.
Location of the installed temperature and moisture sensors.
2.3. Oil Regeneration Procedure
An oil regeneration unit particularly designed for indoor laboratory use with a capacity of 300 L/h, and with a single column of fuller’s earth was used for the study. Oil obtained from the bottom outlet of the transformer is sent through three stages including fuller’s earth reclamation, filtering and drying & degassing, before being sent back to the tank from the top of the transformer. A schematic diagram of the oil regeneration process is presented in Figure 3.
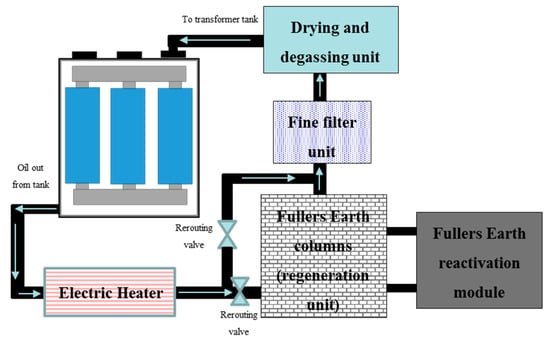
Figure 3.
Schematic diagram of the oil regeneration system.
Normal industrial practice comprises of conducting the oil regeneration till satisfactory values for the oil parameters are reached. Previous studies [6,15,16,17,18,19] have mainly focused on monitoring the condition of the oil. In order to gain a deep understanding of the effect of this process on the paper moisture and LMA, we chose to add an additional stage of processing beyond the ‘cleaning of the oil’. Thus, the oil regeneration process was conducted over two stages, henceforth labelled Stage 1 and Stage 2.
- Stage 1:
This stage would be targeted at bringing down the acidity of the oil to levels specified in BS EN 60296. The aim of this stage would be to investigate the effectiveness of the process on the oil, in reducing moisture and acidity. It was decided to execute this stage at a system temperature of about 60 °C within the transformer. The reduction of acidity in oil was used as the standard for determining the end of stage 1.
- Stage 2:
The primary aim of this stage is to improve the condition of the paper through prolonged circulation. The system temperature in this stage would also need to be higher than that of stage 1, and greater than the aniline point of the oil in order to increase the solvency of the oil for the materials in contact with it. It was decided to execute this stage at a temperature of around 70 °C within the transformer.
The duration of stage 2 was set to be longer than that of stage 1 in terms of processing through the fuller’s earth columns, considering the fact that any migration of acids and moisture from the paper into the oil would be slow, and therefore require longer periods of circulation. The capacity of the equipment used in this study was extremely low in comparison with industrial standards—an example would be the flow rate, which is in the range of thousands of L/h in commercial regeneration plants. Since this plant was designed for indoor laboratory research use, the capacity is only at 300 L/h. The low capacity of the equipment used in this study is further emphasised in explaining the perceivably longer total duration of the experiment.
2.4. Sampling and Measurement
Paper samples were collected from the same location and along the same disc numbers prior to the regeneration process, at the end of stage 1 and at the end of stage 2 of the regeneration experiment.
Oil samples were collected regularly throughout the regeneration process. The sampling interval varied from one hour during the stage 1 to two hours during stage 2. Temperature at the time of sampling was also noted. Measurements of moisture were carried out on all samples collected throughout the experiment, and measurements of TAN were carried out on samples specifically collected during the operation of the fuller’s earth regeneration unit.
TAN of oil was measured according to BS EN 62021-1, while LMA in paper was measured through an in-house developed water extraction method as in [20]. Moisture in oil and paper was measured by Karl Fisher (KF) titration according to BS EN 60814. DP of paper was measured using an Ubbelohde viscometer tube according to ASTM D4243.
3. Results
The oil regeneration experiment was conducted across three stages: pre-oil-regeneration inspection, stage 1 of oil regeneration aimed at ‘cleaning the oil’, and stage 2 of oil regeneration aimed at ‘cleaning the paper’.
3.1. An Overview of the Process
The initial volume of oil in the transformer was estimated to be 900 L. The flow rate for the equipment was set at approximately 300 L/h. This would translate into a time period of 3 h for a single pass of the entire volume of oil to be processed. The total duration of the regeneration experiment is given in Table 3. Oil temperature profile obtained from the eight sensors installed on the windings is shown in Figure 4.
Table 3.
Operating time of the oil regeneration experiment.
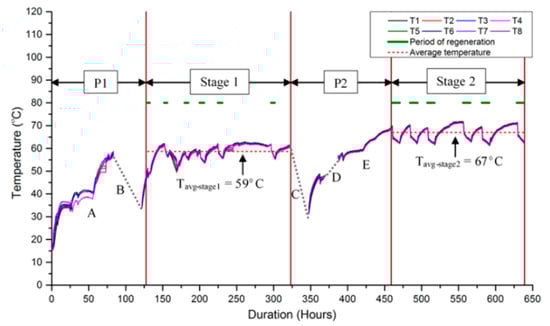
Figure 4.
Temperature profile during the regeneration experiment.
P1 refers to the initial preparation stage, during which the experimental setup and operational performance were tested, and the oil was heated to required temperatures. Several mitigating factors are to be noted for the extended timescale through the filtering, drying and degassing unit. During the initial stages of the experiment, it was impossible to maintain complete vacuum in the processor due to excessive foaming. While this was expected, it resulted in the system operating at low vacuum for a considerable period of time. In addition, it can be seen that initial temperature rise stabilises at around 40 °C, despite setting the temperature of the heater unit at 65 °C. Thus, it was decided to wrap an insulating jacket around the transformer, in order to reduce the heat dissipated to the environment. The oil temperature then reached satisfactory levels within a day. Point ‘A’ represents the time at which this jacket was installed, followed by a steady rise in temperature up to 60 °C. Region ‘B’ indicates a period of non-operation of the equipment due to an oil leak. The oil temperature dropped to around 35 °C when this issue was fixed, following which the system was restarted.
Stage 1 was initiated once the oil had reached satisfactory temperatures, and lasted a total of 201 h, as detailed in Table 3. The average oil temperature during this period was maintained at 59 °C. A total of 6 regeneration cycles were performed during Stage 1, which lasted a total of 29 h equivalent to approximately 10 passes of the entire volume of the oil through the fuller’s earth column. As the reactivation process of the fuller’s earth took between 7 and 10 h, the oil regeneration was conducted only for several hours a day. However, the oil processor unit had to be operated continuously throughout the day in order to maintain the oil temperature within the transformer.
P2 refers to the intermediate preparation stage. This stage started with the sampling of winding paper (represented by ‘C’ in Figure 4). During the sampling, the equipment was switched off completely and the temperature fell gradually to around 30 °C. After sampling, the oil was circulated through the heater to raise the oil temperature to around 70 °C for stage 2–10 °C higher than stage 1. The missing temperature data during ‘D’ was due to an instrument error. It was observed that the temperature saturated at 60 °C, the same temperature as stage 1. Since it was aimed to increase the oil temperature to 70 °C, the temperature setting on the heater was increased to 85 °C at ‘E’. This helped increasing the oil temperature to an average of 70 °C.
Stage 2 of the oil regeneration experiment was conducted for a period of 177 h, as detailed in Table 3. This stage included 6 cycles of regeneration which are 60 h of circulation through the fuller’s earth column. The oil temperature was at an average of 67 °C during stage 2. The fluctuating temperature pattern in both stage 1 and stage 2 is attributed to heat loss during circulation through the Fuller’s earth column. The reduced duration of filtering, drying and degassing in stage 2 in comparison with stage 1 is attributed to the low value of acidity of the oil during stage 2, enabling extended circulation through the fuller’s earth without everyday reactivation.
3.2. Oil Parameters
3.2.1. Acidity in Oil
The trend for oil acidity during stage 1 and stage 2 of oil regeneration is presented in Figure 5. Oil acidity was measured for the samples collected during the period which the circulation was routed through the fuller’s earth unit (regeneration periods shown in Figure 4). The reduction in acidity levels of the oil formed the basis for deciding the end of stage 1 of the oil regeneration experiment. It was anticipated that the oil acidity would reduce to low levels of around 0.05 mg KOH/g by the end of stage one, as this value represents the expected acidity range of new mineral oils. This value was reached within 29 h (approximately 10 passes) of circulation through the fuller’s earth regeneration unit.
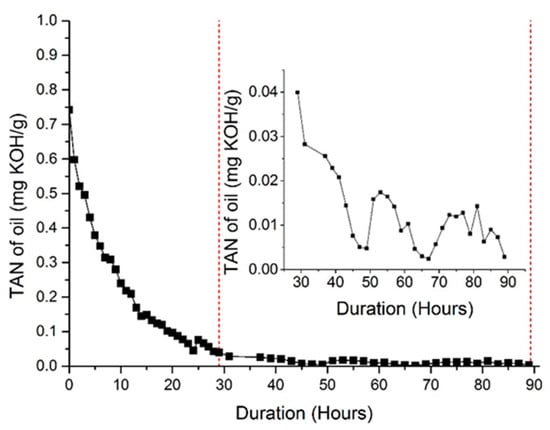
Figure 5.
Total acid number (TAN) of oil profile during the regeneration experiment.
It can be observed from Figure 5 that the reduction trend for TAN follows a negative exponential relationship with duration. The fluctuations of the TAN during stage 2 could be further indication of the removal of the acidic components from the paper. These results conform to previous studies, which indicated similar fluctuations of TAN values [21]. TAN trend during stage 2 of regeneration indicates that the final TAN value for oil was near 0.005 mg KOH/g. This value is extremely low, even in comparison with new oils.
3.2.2. Moisture in Oil
The profile of moisture in oil during stage 1 and stage 2 of oil regeneration are presented in Figure 6. Moisture in oil was below 10 ppm at the end of stage 1, and remained in the same level till the end of stage 2. During the first 75 h of the regeneration process, the moisture in oil was observed to fluctuate between 15 ppm and 35 ppm. This fluctuation is possibly due to moisture migration from paper to oil at increasing temperatures and also mixing of water content distributed in the transformer tank. From 75 h onwards, the oil moisture gradually reduced to around 10 ppm by the end of stage 1. During stage 2, the oil moisture was again observed to fluctuate between 6 ppm and 14 ppm, which could indicate further removal of moisture from the paper.
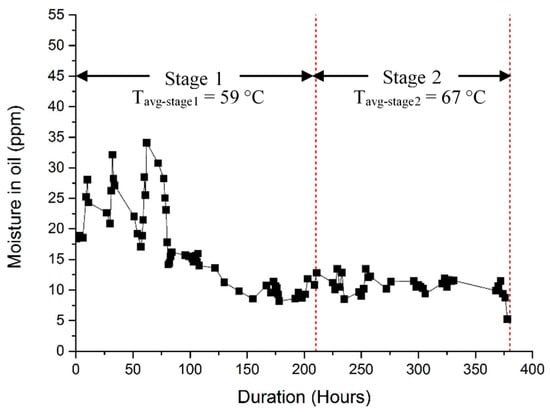
Figure 6.
Moisture in oil profile during the regeneration experiment.
A comparison of the moisture measured using KF titration and the moisture values calculated by the solid state sensor based on relative humidity (RH) is provided in Figure 7. RH values and subsequent moisture calculations, along with the oil temperatures, are represented in intervals of 30 min, whereas the values of moisture measured through KF are based on samples collected during the day in intervals of every 2 h on average. Figure 7 indicates a reasonable positive correlation between the values recorded by the RH sensor and those measured by KF titration. The gradual reduction of the RH value is a clear indication of the continuous drying of the oil throughout the process.
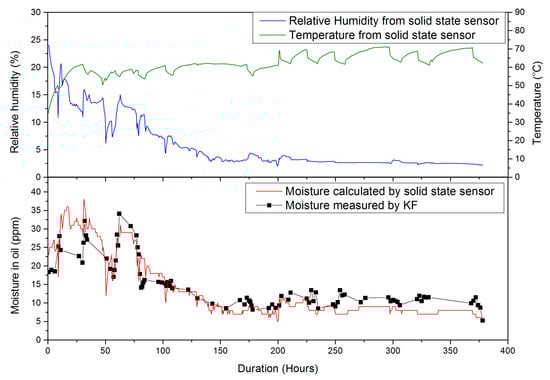
Figure 7.
Comparison of moisture in oil measured by KF titration and moisture in oil calculated by solid state sensor, along with oil relative humidity and temperature.
3.3. Paper Parameters
3.3.1. Moisture in Paper
Moisture in paper profiles for samples collected before oil regeneration, at the end of stage 1 and the end of stage 2 are presented in Figure 8. Initial moisture level in the paper before oil regeneration was 3.5% on average, exhibiting a flat trend from the bottom to the top of the winding. However, at the end of stage 1 a non-uniform moisture reduction in paper was observed. Moisture in the bottom one fifth of the winding reduced by an average of 50% whereas moisture in the rest of the winding reduced by only about 17%. Given that the temperature inside transformer was close to uniform, it is highly likely that a non-uniformity in the oil flow in the transformer could have resulted in the different moisture reduction rate along the winding. The bottom part winding is likely in contact with the main oil stream and hence more refreshed oil results in the more effective reduction of moisture.
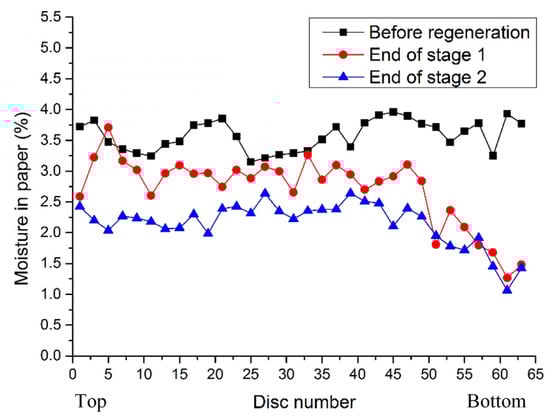
Figure 8.
Profile of moisture in paper before regeneration, at the end of stage 1, and the end of stage 2.
During the second stage of the oil regeneration process moisture in the bottom part of the discs reduced by further 10% whereas the remaining part of the winding had further 22% reduction in the moisture. As the oil condition throughout the transformer has been improved in the second stage, non-uniformity of the moisture reduction along the winding becomes less significant. When considering the whole winding, stage 1 of the regeneration reduced the moisture content in paper by an average of 23% while the stage 2 reduced the moisture by a further 23% resulting in a nearly 40% reduction in total.
Interpreting this reduction along with the various experimental and simulation-based drying curves and models proposed in the literature [15,17,22,23,24,25,26,27], it is possible that the moisture could reduce further with prolonged circulation. However, several factors could affect this, including the limitation of the off-line hot oil circulation process which does not heat the insulation from inside (i.e., affecting mainly the outer layers of insulation), and the thickness of the paper which directly affects the penetration of the drying.
3.3.2. LMA in Paper
Figure 9 illustrates the profile for LMA in the paper for samples collected before regeneration, at the end of stage 1, and the end of stage 2 of the regeneration experiment. Initial LMA in paper before oil regeneration was found to be at an average of 10 mg KOH/g. The LMA in paper remained fairly unchanged at the end of stage 1. However, at the end of stage 2, this value reduced to an average of 7 mg KOH/g. This is a positive indication of the effectiveness of stage 2 on improving the condition of the paper insulation. Similar to water, LMA due to their polar nature prefer the paper insulation. Furthermore, with increase of temperature some of these LMA move into oil [28]. From the results it can be seen that LMA require more effort to move from paper into oil which could be due to their larger molecular structure compared to water.
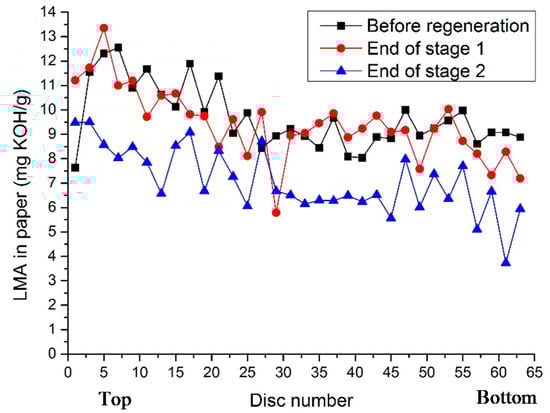
Figure 9.
Profile of LMA in paper before regeneration, at the end of stage 1, and the end of stage 2.
In an investigation of the acid removal during low frequency heating drying process [12], it was observed that LMA in paper dropped by approximately 20–30%, which was measured in paper samples collected before and after the drying process. This value conforms to the reductions observed in the present study, which were approximately at 30%.
3.3.3. DP of Paper
Figure 10 shows the DP profile of paper samples obtained before the oil regeneration process and after the regeneration process. The paper samples had DP values between 99 and 242 with an average DP of about 187. It can be seen that the DP profile along the winding follows the expected temperature gradient in the transformer when it is in operation. Having the lowest DP in the top part of the winding confirms that the hot spot was located in the top part of the winding. In order to verify that the DP values are not affected by the extended circulation of hot oil through the transformer, samples of paper from five different locations along the winding were tested post-regeneration. No noticeable changes to the DP values were observed, as seen in Figure 10.
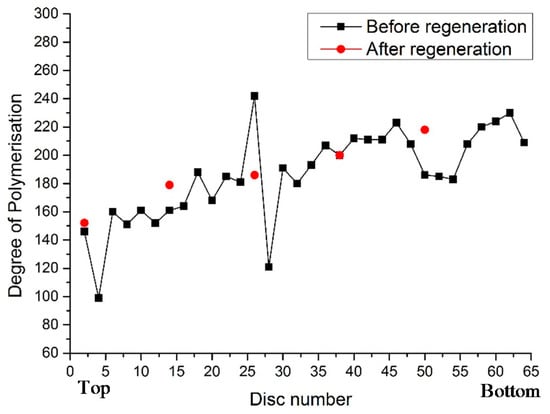
Figure 10.
Profile of DP of paper before regeneration, and at the end of stage 2.
4. Discussion
The regeneration studies conducted with the 77-year-old transformer confirmed that this process can be used to remove moisture and LMA from paper insulation, which could slow down the further degradation process of paper insulation. According to the Arrhenius reaction proposed by Dakin in 1948 [29] the rate of the insulation deterioration could be modelled as (1):
where A is the pre-exponential factor, EA is the activation energy, R is the gas constant (8.314 J /K/mol), and T is the temperature of the paper in degree Celsius.
Activation energy values varying from about 96 to 125 kJ/mol has been proposed for the degradation of cellulosic paper insulation [1,30,31,32]. Activation energy describes the temperature dependency of the ageing process and it depends on the ageing mechanism. It is generally accepted that every 6 to 7 °C increase in temperature could nearly double the rate of paper ageing through hydrolysis [33]. On the other hand, A represents the influence of other environmental factors such as moisture and LMA that affect the paper ageing rate. It was suggested that a relationship as shown in (2), could be used for assessing the combination effect of water and LMA on the pre-exponential factor [34]:
where, is the concentration of water in paper and is the concentration of LMA in oil or paper.
The A factor calculated based on Equation (2) shows an average of 54.8% reduction due to the oil regeneration through both stage 1 and stage 2 compared to just a 25.9% reduction by regenerating oil through only the stage 1. This suggests that oil regeneration through both stages reduces the ageing rate to half of the initial value which could potentially double the remaining lifetime.
Although it is evident that extended oil regeneration is indeed effective to improve paper conditions, implementation of the process in practice requires fine tuning depending on various factors including transformer insulation structure, material ratio, off-line/on-line regeneration mode, etc. In addition, selection of transformers to be treated also requires a cost-benefit analysis. If the transformer insulation condition is too bad, potential life extension from the oil regeneration might be minimal; if the insulation condition is too good, oil regeneration can be a waste of resource.
5. Conclusions
The possibility of improving the condition of the oil together with the retardation of the ageing of paper insulation through oil regeneration was demonstrated using a retired distribution transformer. In addition to the expected reductions of moisture and TAN in oil, reductions of LMA and moisture in paper were observed though paper sampling during the process. The need for an extended stage (stage 2) of the oil regeneration in addition to the conventional stage (stage 1) was stressed upon, in order to further retard the ageing of paper insulation. Measurements obtained before and after the oil regeneration confirmed that circulation of hot oil (60–70 °C) during the extended oil regeneration has negligible effect on the DP of paper. Overall, strong evidence has been provided to support the premise that oil regeneration can indeed positively affect the health conditions of the transformer oil-paper insulation system.
Author Contributions
Funding acquisition, Q.L. and Z.W.; Investigation, R.V.; Supervision, Q.L. and Z.W.; Writing–original draft, R.V. and S.M.; Writing–review & editing, S.M., Q.L. and Z.W.
Funding
This research was funded by Electricity North West, United Kingdom.
Acknowledgments
The authors would like to thank Filterall Limited for supporting the operation of the oil generation unit. The authors would also like to thank Frank Hogan for supporting the general setup of the experiments in the high voltage laboratory.
Conflicts of Interest
The authors declare no conflict of interest.
References
- Lundgaard, L.E.; Hansen, W.; Linhjell, D.; Painter, T.J. Aging of oil-impregnated paper in power transformers. IEEE Trans. Power Deliv. 2004, 19, 230–239. [Google Scholar] [CrossRef]
- Lamarre, C.; Duval, M.; Crine, J. Electrical properties and oxidation resistance of reclaimed transformer oils. In Proceedings of the Ninth International Conference on Conduction and Breakdown in Dielectric Liquids, Salford, UK, 27–31 July 1987; pp. 450–454. [Google Scholar]
- Cho, J.S.N.; Fofana, I.; Beroual, A.; Aka-Ngnui, T.; Sabau, J. Aged oils reclamation: Facts and arguments based on laboratory studies. IEEE Trans. Dielectr. Electr. Insul. 2012, 19, 1583–1592. [Google Scholar] [CrossRef]
- Safiddine, L.; Zafour, H.-Z.; Rao, U.M.; Fofana, I. Regeneration of Transformer Insulating Fluids Using Membrane Separation Technology. Energies 2019, 12, 368. [Google Scholar] [CrossRef]
- BSI. Mineral Insulating Oils in Electrical Equipment. Supervision and Maintenance Guidance; BS EN 60422; BSI Standards Limited: London, UK, 2013. [Google Scholar]
- Insulating Oil Regeneration and Dehalogenation; CIGRE Task Force D1.01.12; CIGRE Brochure; CIGRE: Paris, France, 2010; No. 413; Available online: https://e-cigre.org/publication/413-insulating-oil-reclamation-and-dechlorination (accessed on 27 April 2019).
- Friese, R. Process of Regenerating Oil Used for Electrical Purposes. U.S. Patent 1,103,499; filed 01 April 1913, and issued 14 July 1914, Available online: https://patents.google.com/patent/US1103499A/en?oq=US1103499A (accessed on 27 April 2019).
- Cox, D.C. Process of Reclaiming oil. U.S. Patent 1752238A; filed 18 March 1925, and issued 25 March 1930, Available online: https://patents.google.com/patent/US1752238A/en?oq=1752238 (accessed on 27 April 2019).
- Ambrose, H.A. Chemical progress on insulating oils. Dig. Lit. Dielectr. 1938, 3, III-12–III-16. [Google Scholar]
- Housley, J.E. Reconditioning of insulating oils by activated alumina. Electr. Eng. 1939, 58, 172–178. [Google Scholar] [CrossRef]
- Pahlavanpour, B.; Linaker, R.; Povazan, E. Extension of life span of power transformer by on-site improvement of insulating oils. In Proceedings of the Sixth International Conference on Dielectric Materials, Measurements and Applications, Manchester, UK, 7–10 September 1992; pp. 260–263. [Google Scholar]
- Koestinger, P.; Bruaroy, T.M. Drying of power transformers in the field, applying the LFH-Technology in combination with oil reclamation. In Proceedings of the CIGRE Paris Session, Paris, France, 27 August–1 September 2006. No A2-108. [Google Scholar]
- Sisic, E. Transformer insulation regeneration and drying in online mode. Transform. Mag. 2018, 5, 116–122. [Google Scholar]
- Jarman, P.; Wang, Z.; Zhong, Q.; Ishak, T. End-of-life modelling for power transformers in aged power system networks. In Proceedings of the Sixth CIGRE Regional Conference, Cape Town, South Africa, 17–21 August 2009; Available online: https://www.semanticscholar.org/paper/End-of-life-modelling-for-power-transformers-in-Jarman-Wang/ee89b66da19b32c41fba4fb9c3dac3c24cbe4808 (accessed on 27 April 2019).
- Dahlund, M.; Koestinger, P.; Meyer, P.; Khanna, P. Life Extension Of Power Transformers Oil Regeneration, On Site Drying And Onsite Repair. In Proceedings of the PdMSA 2010 Conference; 2010. Available online: https://library.e.abb.com/public/6aaaf23334be8d0ec125781d004c75ac/Transformer%20Life%20extension_PdMSA_SouthAfrica_2010.pdf (accessed on 30 April 2019).
- Gureev, A.; Evdokimov, A.Y.; Fal’kovich, M.; Solodovnikova, V. Regeneration of used industrial oils. Chem. Technol. Fuels Oils 1983, 19, 327–329. [Google Scholar] [CrossRef]
- García, D.F.; García, B.; Burgos, J.C. Modeling Power Transformer Field Drying Processes. Dry. Technol. 2011, 29, 896–909. [Google Scholar] [CrossRef]
- Leibfried, T.; Thiess, U.; Truant, S. On-site drying of aged power transformers through vacuum drying in combination with the LFH technique (SMART DRY). VGB Powertech 2003, 83, 60–64. [Google Scholar]
- Koestinger, P.; Aronsen, E.; Boss, P.; Rindlisbacher, G. Practical Experience with the Drying of Power Transformers in the Field, Applying the LFH Technology. In Proceedings of the CIGRE Paris Session, Paris, France; 2004. No A2-205. Available online: https://transform.ru/articles/pdf/SIGRE/a2-205.pdf (accessed on 30 April 2019).
- Azis, N.; Liu, Q.; Wang, Z.D. Ageing assessment of transformer paper insulation through post mortem analysis. IEEE Trans. Dielectr. Electr. Insul. 2014, 21, 845–853. [Google Scholar] [CrossRef]
- Azis, N.; Liu, Q.; Wang, Z.D.; Jones, D.; Wells, B.; Wallwork, G.M. Experience of oil re-generation on a 132 kV distribution transformer. In Proceedings of the International Conference on Condition Monitoring and Diagnosis, Jeju, Korea, 21 September 2014; pp. 993–996. [Google Scholar]
- Villarroel, R.; Garcia, D.; Garcia, B.; Burgos, J. Diffusion coefficient in transformer pressboard insulation part 1: Non impregnated pressboard. IEEE Trans. Dielectr. Electr. Insul. 2014, 21, 360–368. [Google Scholar] [CrossRef]
- Ketelaars, A.; Pel, L.; Coumans, W.; Kerkhof, P. Drying kinetics: A comparison of diffusion coefficients from moisture concentration profiles and drying curves. Chem. Eng. Sci. 1995, 50, 1187–1191. [Google Scholar] [CrossRef]
- Zabeschek, S.; Strzala, H. Drying Of High Voltage Power Transforners In The Field With A Mobile Vapor Phase Drying Equipment; Hedrich Vaccuum Systems: Ehringshausen, Germany, 2007. [Google Scholar]
- Oommen, T.V. Moisture Equilibrium Charts for Transformer Insulation Drying Practice. IEEE Trans. Power Appar. Syst. 1984, PAS-103, 3062–3067. [Google Scholar] [CrossRef]
- Garcia, D.; Garcia, B.; Burgos, J.C. Recommendations to improve the efficiency of drying processes in power transformer. In Proceedings of the XIX International Conference on Electrical Machines (ICEM), Rome, Italy, 6–8 September 2010; pp. 1–6. [Google Scholar]
- Almendros-Ibaez, J.; Burgos, J.C.; Garcia, B. Transformer field drying procedures: A theoretical analysis. IEEE Trans. Power Deliv. 2009, 24, 1978–1986. [Google Scholar] [CrossRef]
- Lundgaard, L.E.; Hansen, W.; Ingebrigtsen, S. Ageing of Mineral Oil Impregnated Cellulose by Acid Catalysis. IEEE Trans. Dielectr. Electr. Insul. 2008, 15, 540–546. [Google Scholar] [CrossRef]
- Dakin, T.W. Electrical Insulation Deterioration Treated as a Chemical Rate Phenomenon. Trans. Am. Inst. Electr. Eng. 1948, 67, 113–122. [Google Scholar] [CrossRef]
- Matharage, S.Y.; Liu, Q.; Wang, Z.D.; Wilson, G.; Krause, C. Aging assessment of synthetic ester impregnated thermally non-upgraded kraft paper through chemical markers in oil. IEEE Trans. Dielectr. Electr. Insul. 2018, 25, 507–515. [Google Scholar] [CrossRef]
- Emsley, A.M.; Stevens, G.C. Kinetics and mechanisms of the low-temperature degradation of cellulose. Cellulose 1994, 1, 26–56. [Google Scholar] [CrossRef]
- Gilbert, R.; Jalbert, J.; Tétreault, P.; Morin, B.; Denos, Y. Kinetics of the production of chain-end groups and methanol from the depolymerization of cellulose during the ageing of paper/oil systems. Part 1: Standard wood kraft insulation. Cellulose 2009, 16, 327–338. [Google Scholar] [CrossRef]
- Thermal Performance of Transformers; CIGRE Task Force A2.24; CIGRE Brochure; CIGRE: Paris, France, 2009; No. 393; Available online: https://e-cigre.org/publication/393-thermal-performance-of-transformers (accessed on 30 April 2019).
- Ageing of Liquid Impregnated Cellulose for Power Transformers; CIGRE Task Force D1.53; CIGRE Brochure; CIGRE: Paris, France, 2018; No. 738; Available online: https://e-cigre.org/publication/738-ageing-of-liquid-impregnated-cellulose-for-power-transformers (accessed on 30 April 2019).
© 2019 by the authors. Licensee MDPI, Basel, Switzerland. This article is an open access article distributed under the terms and conditions of the Creative Commons Attribution (CC BY) license (http://creativecommons.org/licenses/by/4.0/).