1. Introduction
Small islands have weaker power systems than continental ones. Therefore, they are more sensitive to disturbances. In addition, if renewable energy sources, such as wind or photovoltaic, are present, their generation changes could increase this sensitivity [
1]. In fact, there are grid codes with specific requirements for these systems [
2]. There are several approaches to solve this problem [
3,
4], but all of them benefit from steeper available power ramps.
Due to the incorporation of frequency controllers, wind turbines are increasing their contribution to power system stability [
5]. The weather forecast is very important in wind generation scheduling [
6]. However, the contribution of wind energy will not be available if wind generation is lost. Therefore, other resources should be available. One of the known methods to increase penetration of non-manageable power sources is the addition of pumped storage power plants. These plants can contribute to frequency regulation in generating and in pumping mode [
7]. The regulation quality of a power plant can be evaluated using its power response time [
8]: The shorter the better.
In island grids, frequency control is challenging because their inertia constant is usually lower, and generators are usually large compared with the system load [
9,
10,
11]. Therefore, a loss of generation will cause the system frequency to fall dramatically. In order to ensure a stable operation with the lowest impact on the system, the disturbed power balance must be equalized within a short-specified time by activating the reserve of on-line units or by load shedding or both [
12].
Depending on the aims of local system operators, there are different optimal solutions for increasing renewable energy sources integration, while maintaining power system stability [
13]. In a previous paper [
14], the authors have proposed a method of no-flow Pelton turbine operation to reduce the time needed to get full power in Pelton turbines. As stated in this paper, this time has a lower limit determined by the magnitude of the negative water hammer produced in the penstock after the power injection.
This negative water hammer problem is common to any type of hydro turbine. The consequences of this phenomenon appear mainly in the upper part of the penstock, where the under-pressure value depends heavily on the upper reservoir water level. In order to avoid this problem, a conservative governor tuning should limit the minimum, nozzles or wicked gates, opening time. Consequently, available power ramps are limited and in case of generation loss the load shedding system would trip part of the load.
Increasing this ramp limit could be critical in autonomous or weak power systems, especially those with high wind power penetration [
15]. In these power systems, loss of wind generation could produce a large frequency excursion and, consequently, a load-shedding trip. This needed disconnection of some consumers would balance power consumption and generation, but at a high cost, the quality of the power supply service would be reduced. These disconnections could be avoided if steeper power ramps were available because then frequency excursions would be lower.
As previously stated, the conservative governor tuning corresponds to the minimum water level in the upper reservoir. However, when the upper reservoir water level is higher than the minimum, the permissible power ramp could be steeper. Therefore, if this water level is continuously measured, the nozzle or wicked gates opening time could be fine-tuned for every upper reservoir water level. Consequently, the available power ramp could be made steeper and consequently the frequency excursion would be lower, and the power quality would be better.
The remaining of this paper is structured as follows:
Section 2 presents the proposed method for frequency regulation based on the upper reservoir level.
Section 3 presents a case study for a hydro power plant, located in El Hierro island (Canary Island, Spain). In it, the performance of this approach is tested by simulations on Pelton turbines, which are installed in the power plant. In this way the advantages of the proposed technique have been validated for different upper reservoir levels.
Section 4 describes the simulation model.
Section 5 analyzes the software simulations of the proposed system. Finally,
Section 6 concludes with the main contributions of the proposed strategy.
2. Frequency Regulation Based on the Upper Reservoir Water Level for Hydro Power Plants
Hydropower plants are usually controlled by proportional, integral and derivative (PID) governors [
16]. These controllers are tuned through several procedures [
16] seeking stability and a good dynamic response. In order to evaluate the quality of the dynamic response several error measures, such as the integral of the squared error, integral of the absolute error, maximum error and settling time, can be used [
17]. In cases where there are long penstocks, traditional rules [
18] do not achieve stability. Therefore, new tuning rules were developed based on the pole placement technique [
19].
It is also normal practice in small power systems that in case of generation loss, the remaining generating units should be able to supply all the power demanded by the system. Therefore, the generating units must not operate at full load. Although in the power system there are a certain spinning reserve, it is also important how fast this spinning reserve can act. Any additional power required should be injected in the system as fast as possible to avoid large frequency excursions.
In the case of hydro power plants, a negative water hammer in the penstock imposes a limitation to the steepness of their power ramps.
Due to the coupling between flow and pressure changes in the penstock, a fast rise in the flow comes at the price of a sharp decrease in the pressure. If the pressure becomes negative at any point in the penstock, it could collapse. Therefore, to maintain penstock integrity, maximum flow ramps should be limited. Consequently, the minimum opening time of flow control devices is also limited.
The problem, already described, of transient under pressures worsens in the zones of the penstock under lower static pressure. As the static pressure depends on the upper reservoir level, when the level is higher the transient under pressure could be larger without compromising penstock integrity. This allows a faster flow rise and, as a consequence, steeper power ramps.
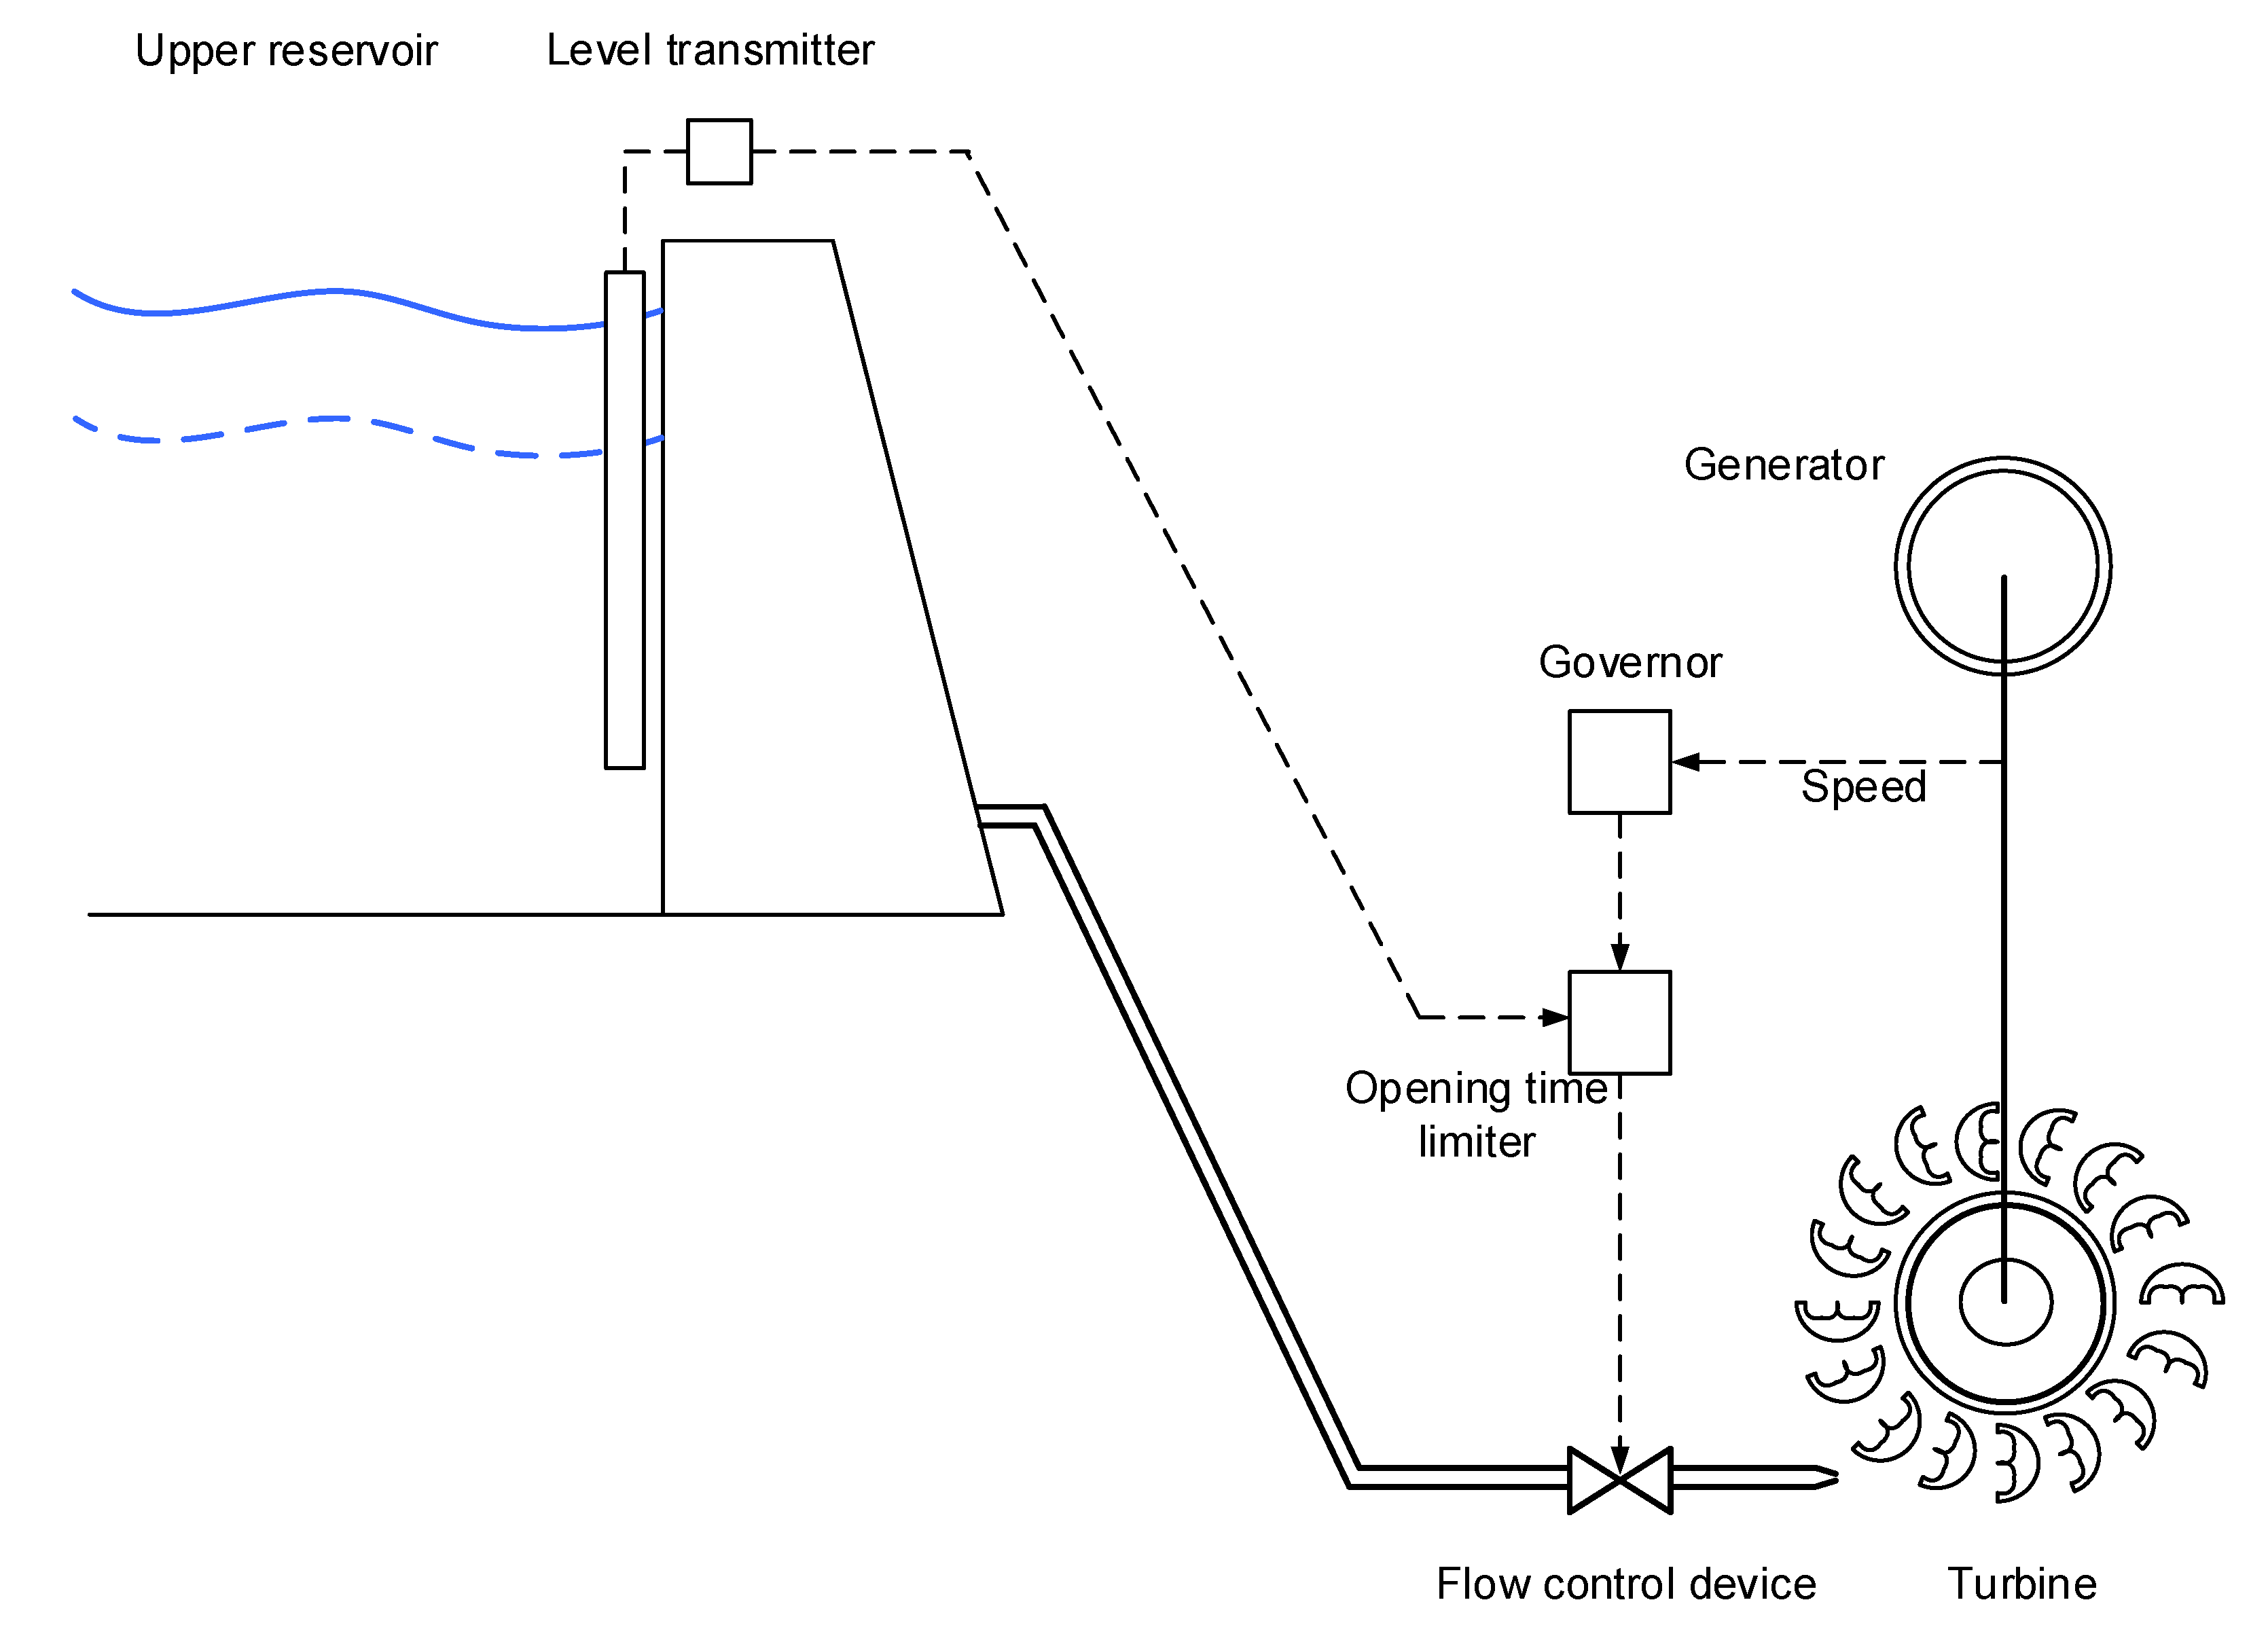
Therefore, if the upper reservoir level is not taken into account, a conservative limit to the maximum hydropower ramp applies. This limit corresponds to the minimum upper reservoir level, which is the worst case. However, if the digital control system has information about the water level in the upper reservoir, the limit to maximum power ramps could be fine-tuned in order to increase power ramp capability. This is achieved in practice through the injector, or wicked gates, opening time limiter. The layout of the control system is presented in
Figure 1.
Usually, hydropower plants have an upper reservoir water level transmitter and its readings are sent to a digital control system located in the powerhouse. This data could be also used to tune the opening time limiter. In this way, power ramps steepness could be adapted as a function of the upper reservoir water level.
3. Case Study: El Hierro Hydro Power Plant
In this section, the hydro power plant used as a case study for the proposed frequency regulation method is presented.
3.1. El Hierro Island Power System Brief Description
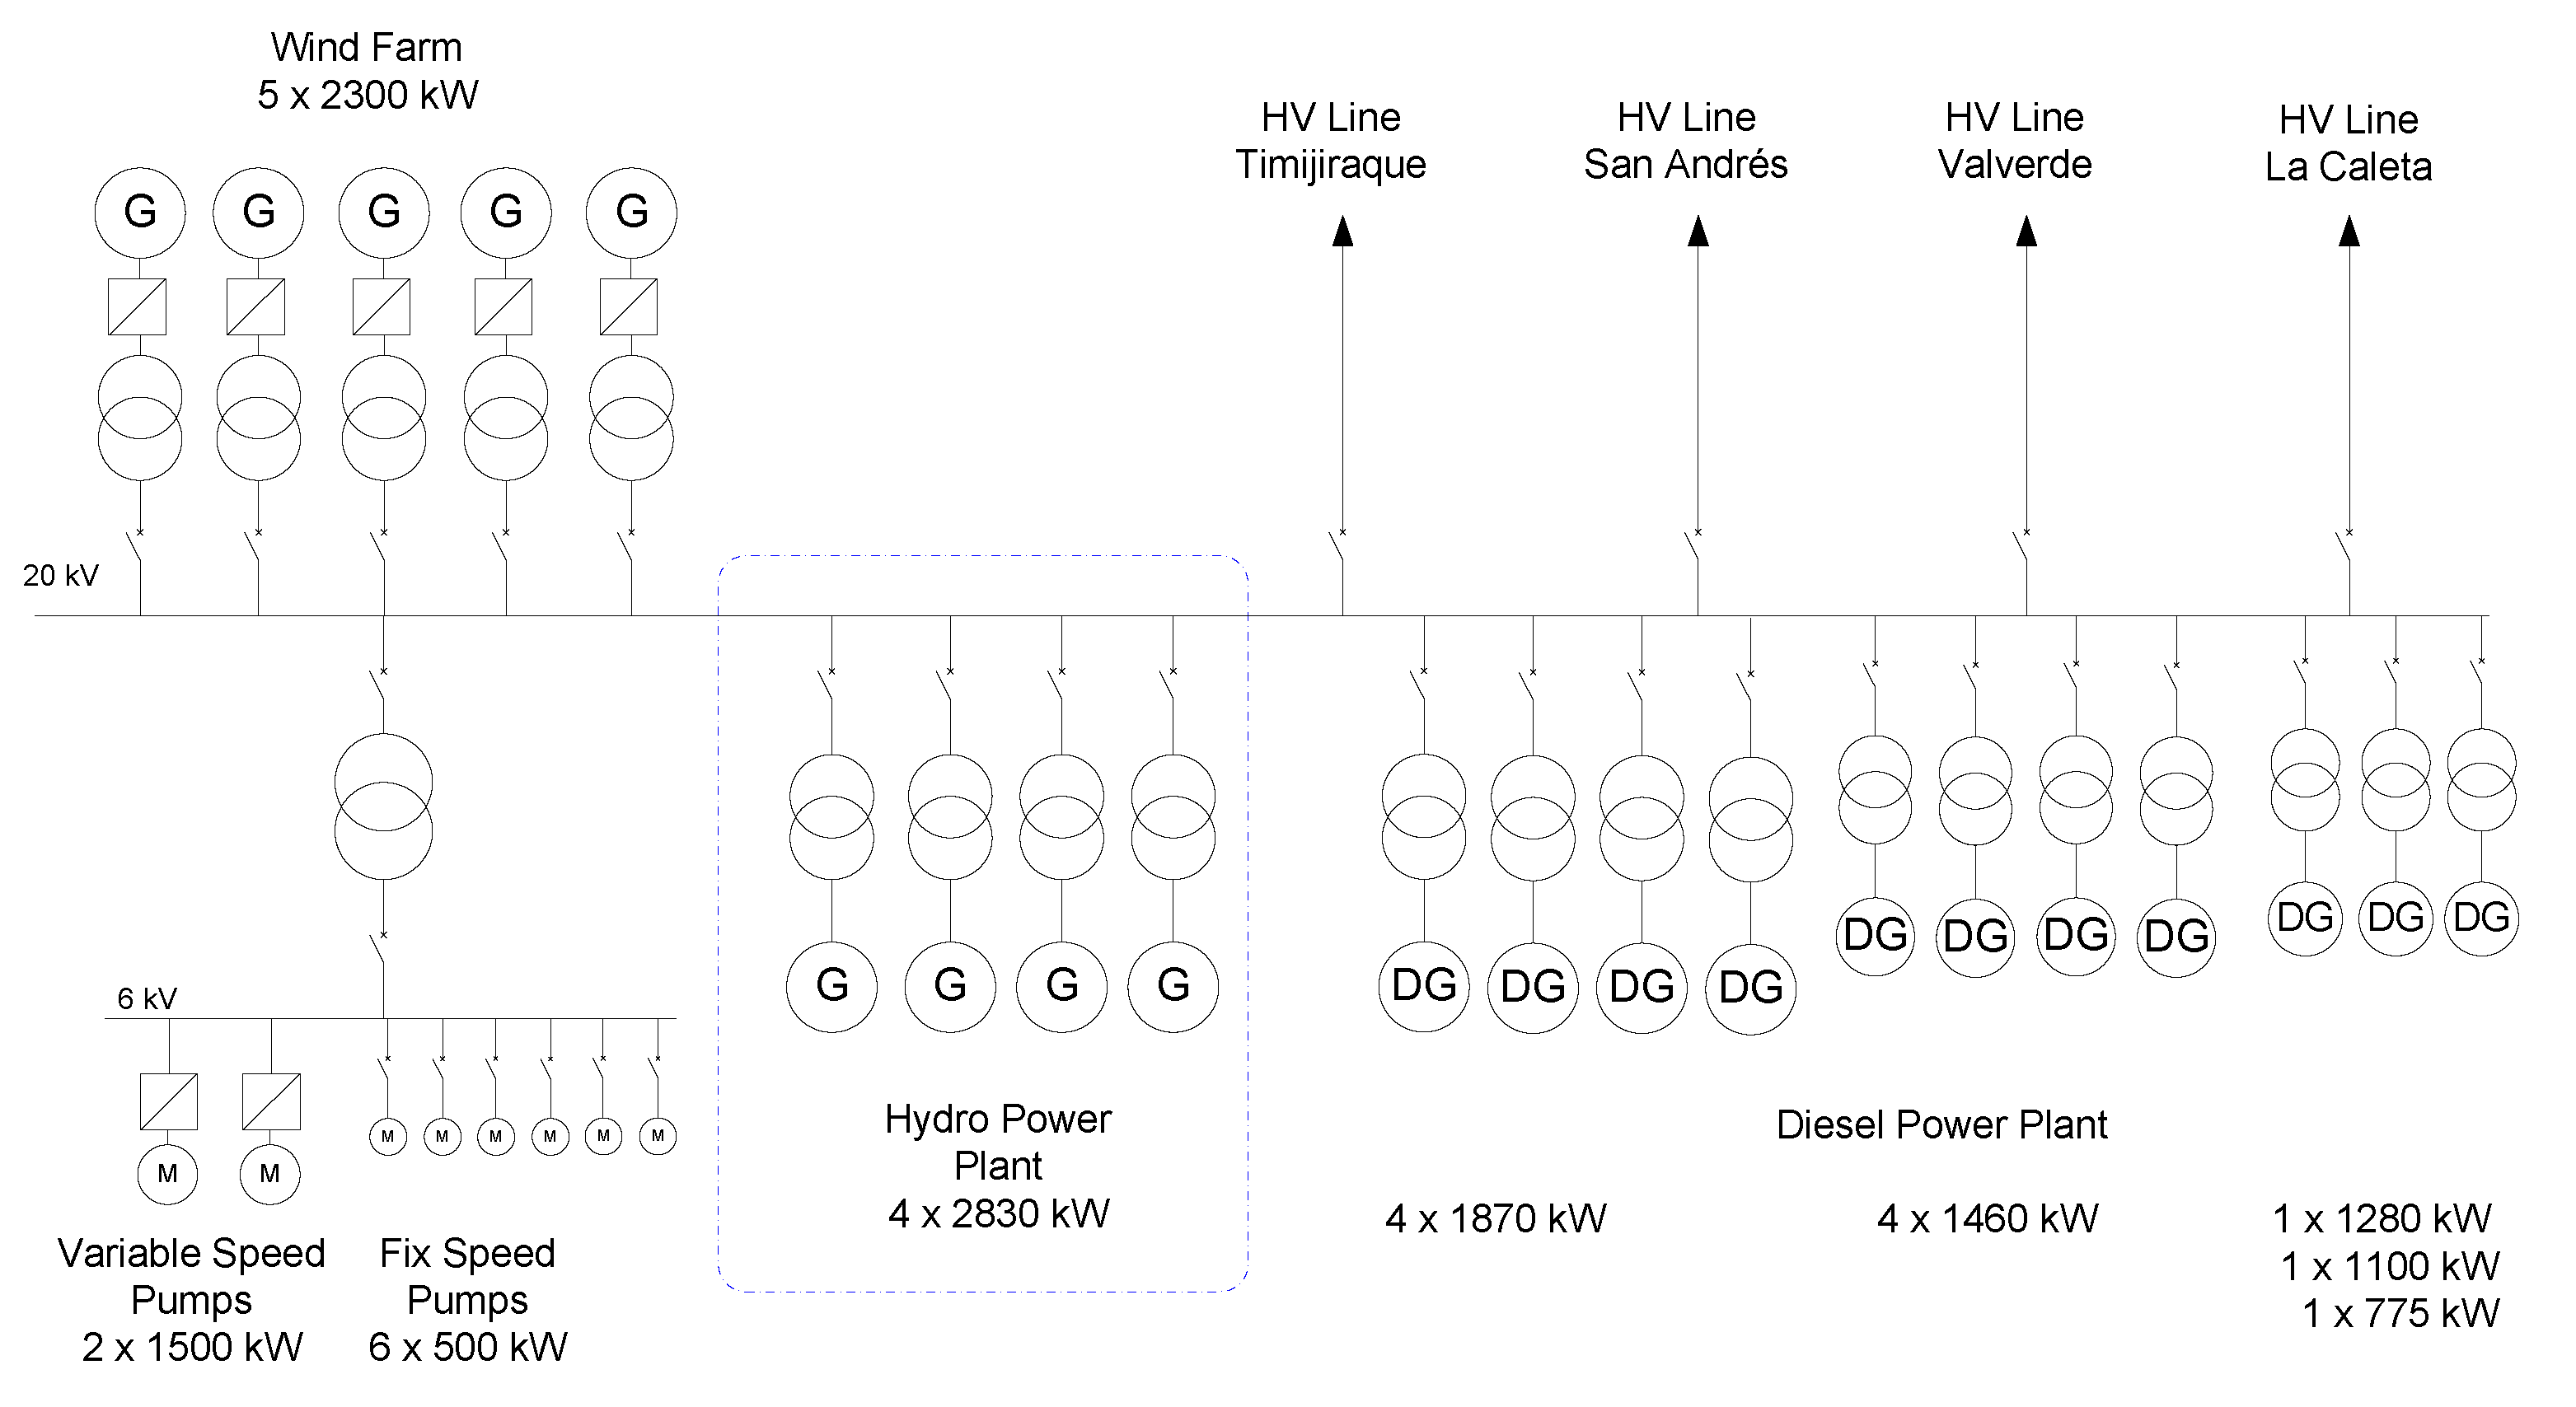
This power system is located on El Hierro Island, in the Canary Islands archipelago, Spain. The traditional power supply was based on diesel engine driven generators. There are 10 diesel engines with a rated power from 775 kW to 1870 kW installed along different extensions.
In 2015, a wind farm combined with a pumped storage power plant entered in service.
The wind farm has five Enercon E-70 wind turbines connected to the 20 kV grid, through separate transformers.
The units of the pumped storage power plant are of the 4-machine-type arrangement [
20,
21]. The pumping station comprises 2 × 1500 kW variable speed driven pumps and 6 × 500 kW fixed speed pumps. In case of high wind conditions these pumps transfer water from the lower to the upper reservoir, storing energy. The control of this pumping station should regulate the frequency of the power system [
22]. On the other hand, the hydro power plant has 4 × 2830 kW Pelton turbine driven generators. The turbines are fed from the upper reservoir and the discharge is carried out in the lower reservoir. Therefore, the coordinated operation of the pumping and hydropower stations provides energy generation or storage.
3.2. Hydro Power Plant
The hydro power plant generators are conventional synchronous machines. These generators use a conventional brushless excitation system and an automatic voltage regulator (AVR) to regulate voltage.
This hydropower plant has several one water jet Pelton turbines. These generators can operate as a synchronous condenser. In this operation mode, they can generate reactive power to contribute to the voltage regulation of the power system. Furthermore, in this operation mode they can generate active power, if required. The performance of this operation mode is analyzed by Platero in [
14].
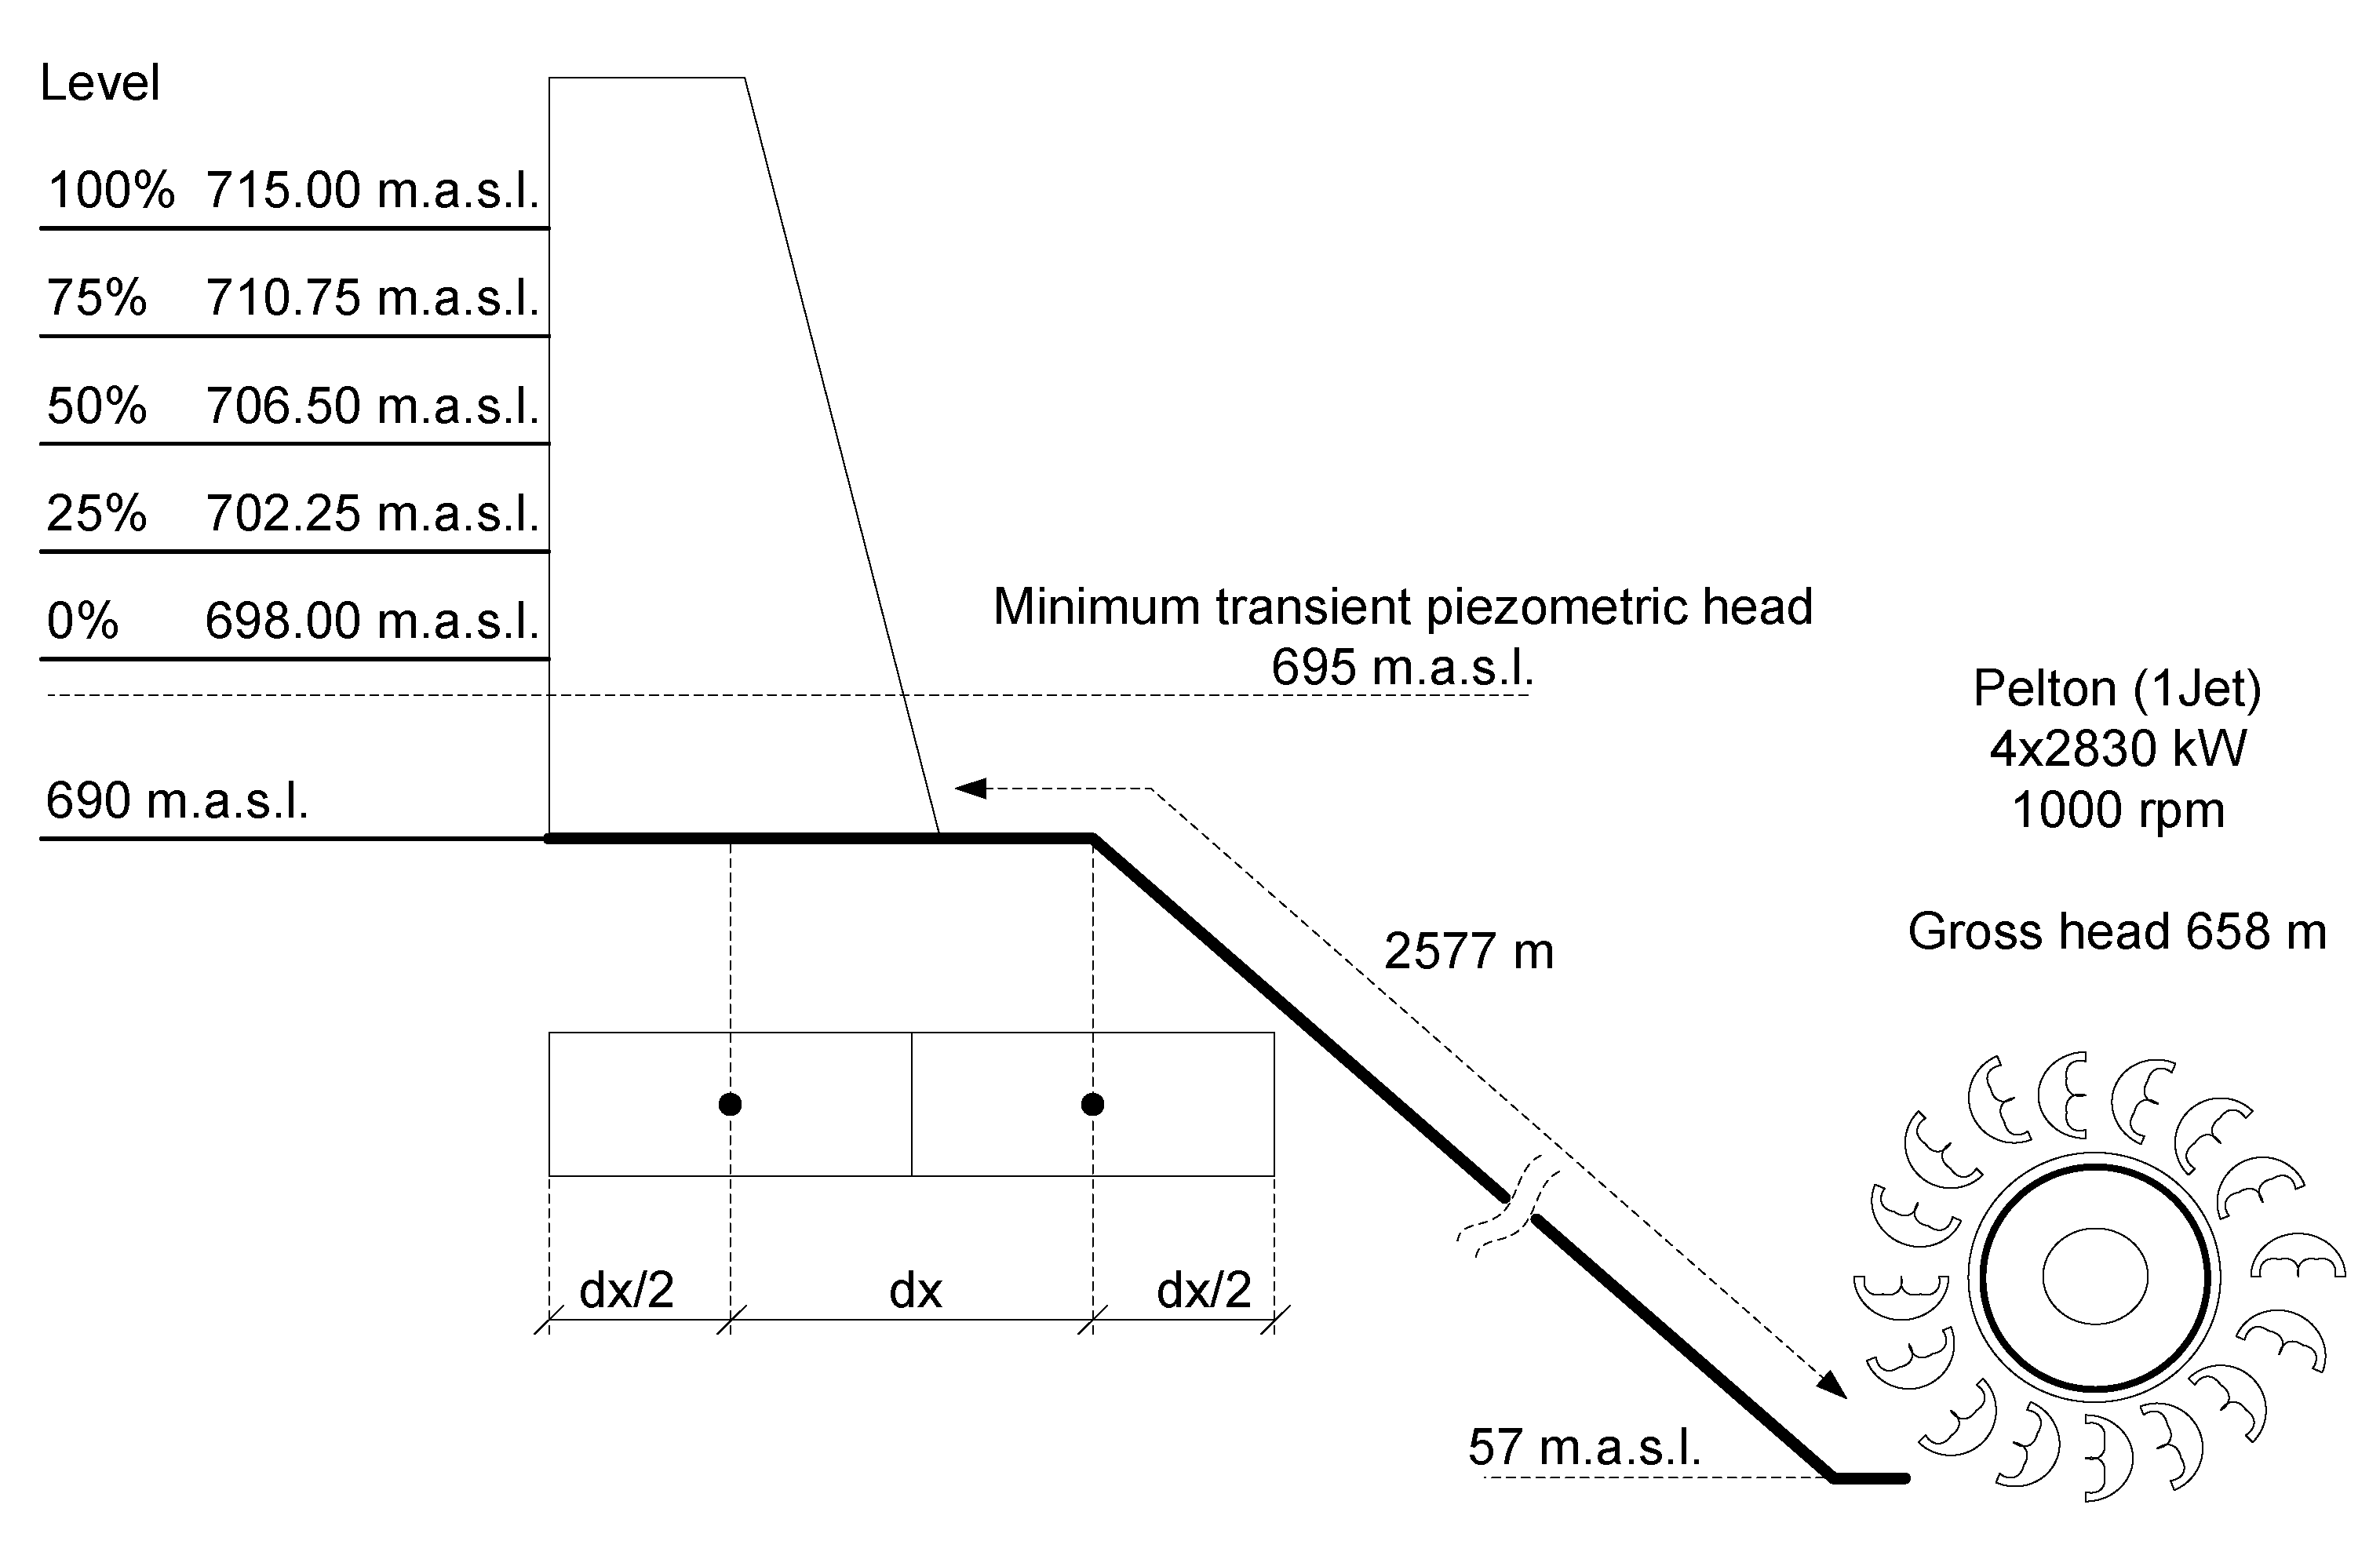
The island’s orography makes it possible to build an upper and a lower reservoir, with a useful capacity of 380,000 m
3 and 150,000 m
3 respectively. In the case of the upper reservoir, the difference between the maximum and minimum levels is 17 m corresponding to 715 m and 698 m above sea level (m.a.s.l.). A simplified hydraulic diagram of this scheme is in
Figure 3.
3.3. Operational Experience
Diesel engine driven generators traditionally supplied the island power demand. The maximum historic peak demand in this power system happened on 12th August 2010, as a result of a heat wave [
23], and reached 7.8 MW. The maximum peak demand in normal operation is around 7 MW. On the other hand, the valley hour consumption is circa 4 MW [
24].
This island has average wind speeds around 9 m/s, which made it a good candidate for wind power generation.
The integration of the new wind pumped storage power plant was not an easy task. The commissioning of this power plant was completed in July 2015 [
25]. During the first years of operation, its contribution to cover the island electric energy demand was 34.6%. Thus, the remaining 65.4% of the electric energy demand was covered by the diesel generators [
26]. In June 2017, the island power system accumulated 1000 h of 100% renewable energy supply operation [
27]. The last energy production record was in the month of July 2017, when the total production of the wind pumped storage power plant covered the 78.3% of the total island demand [
27].
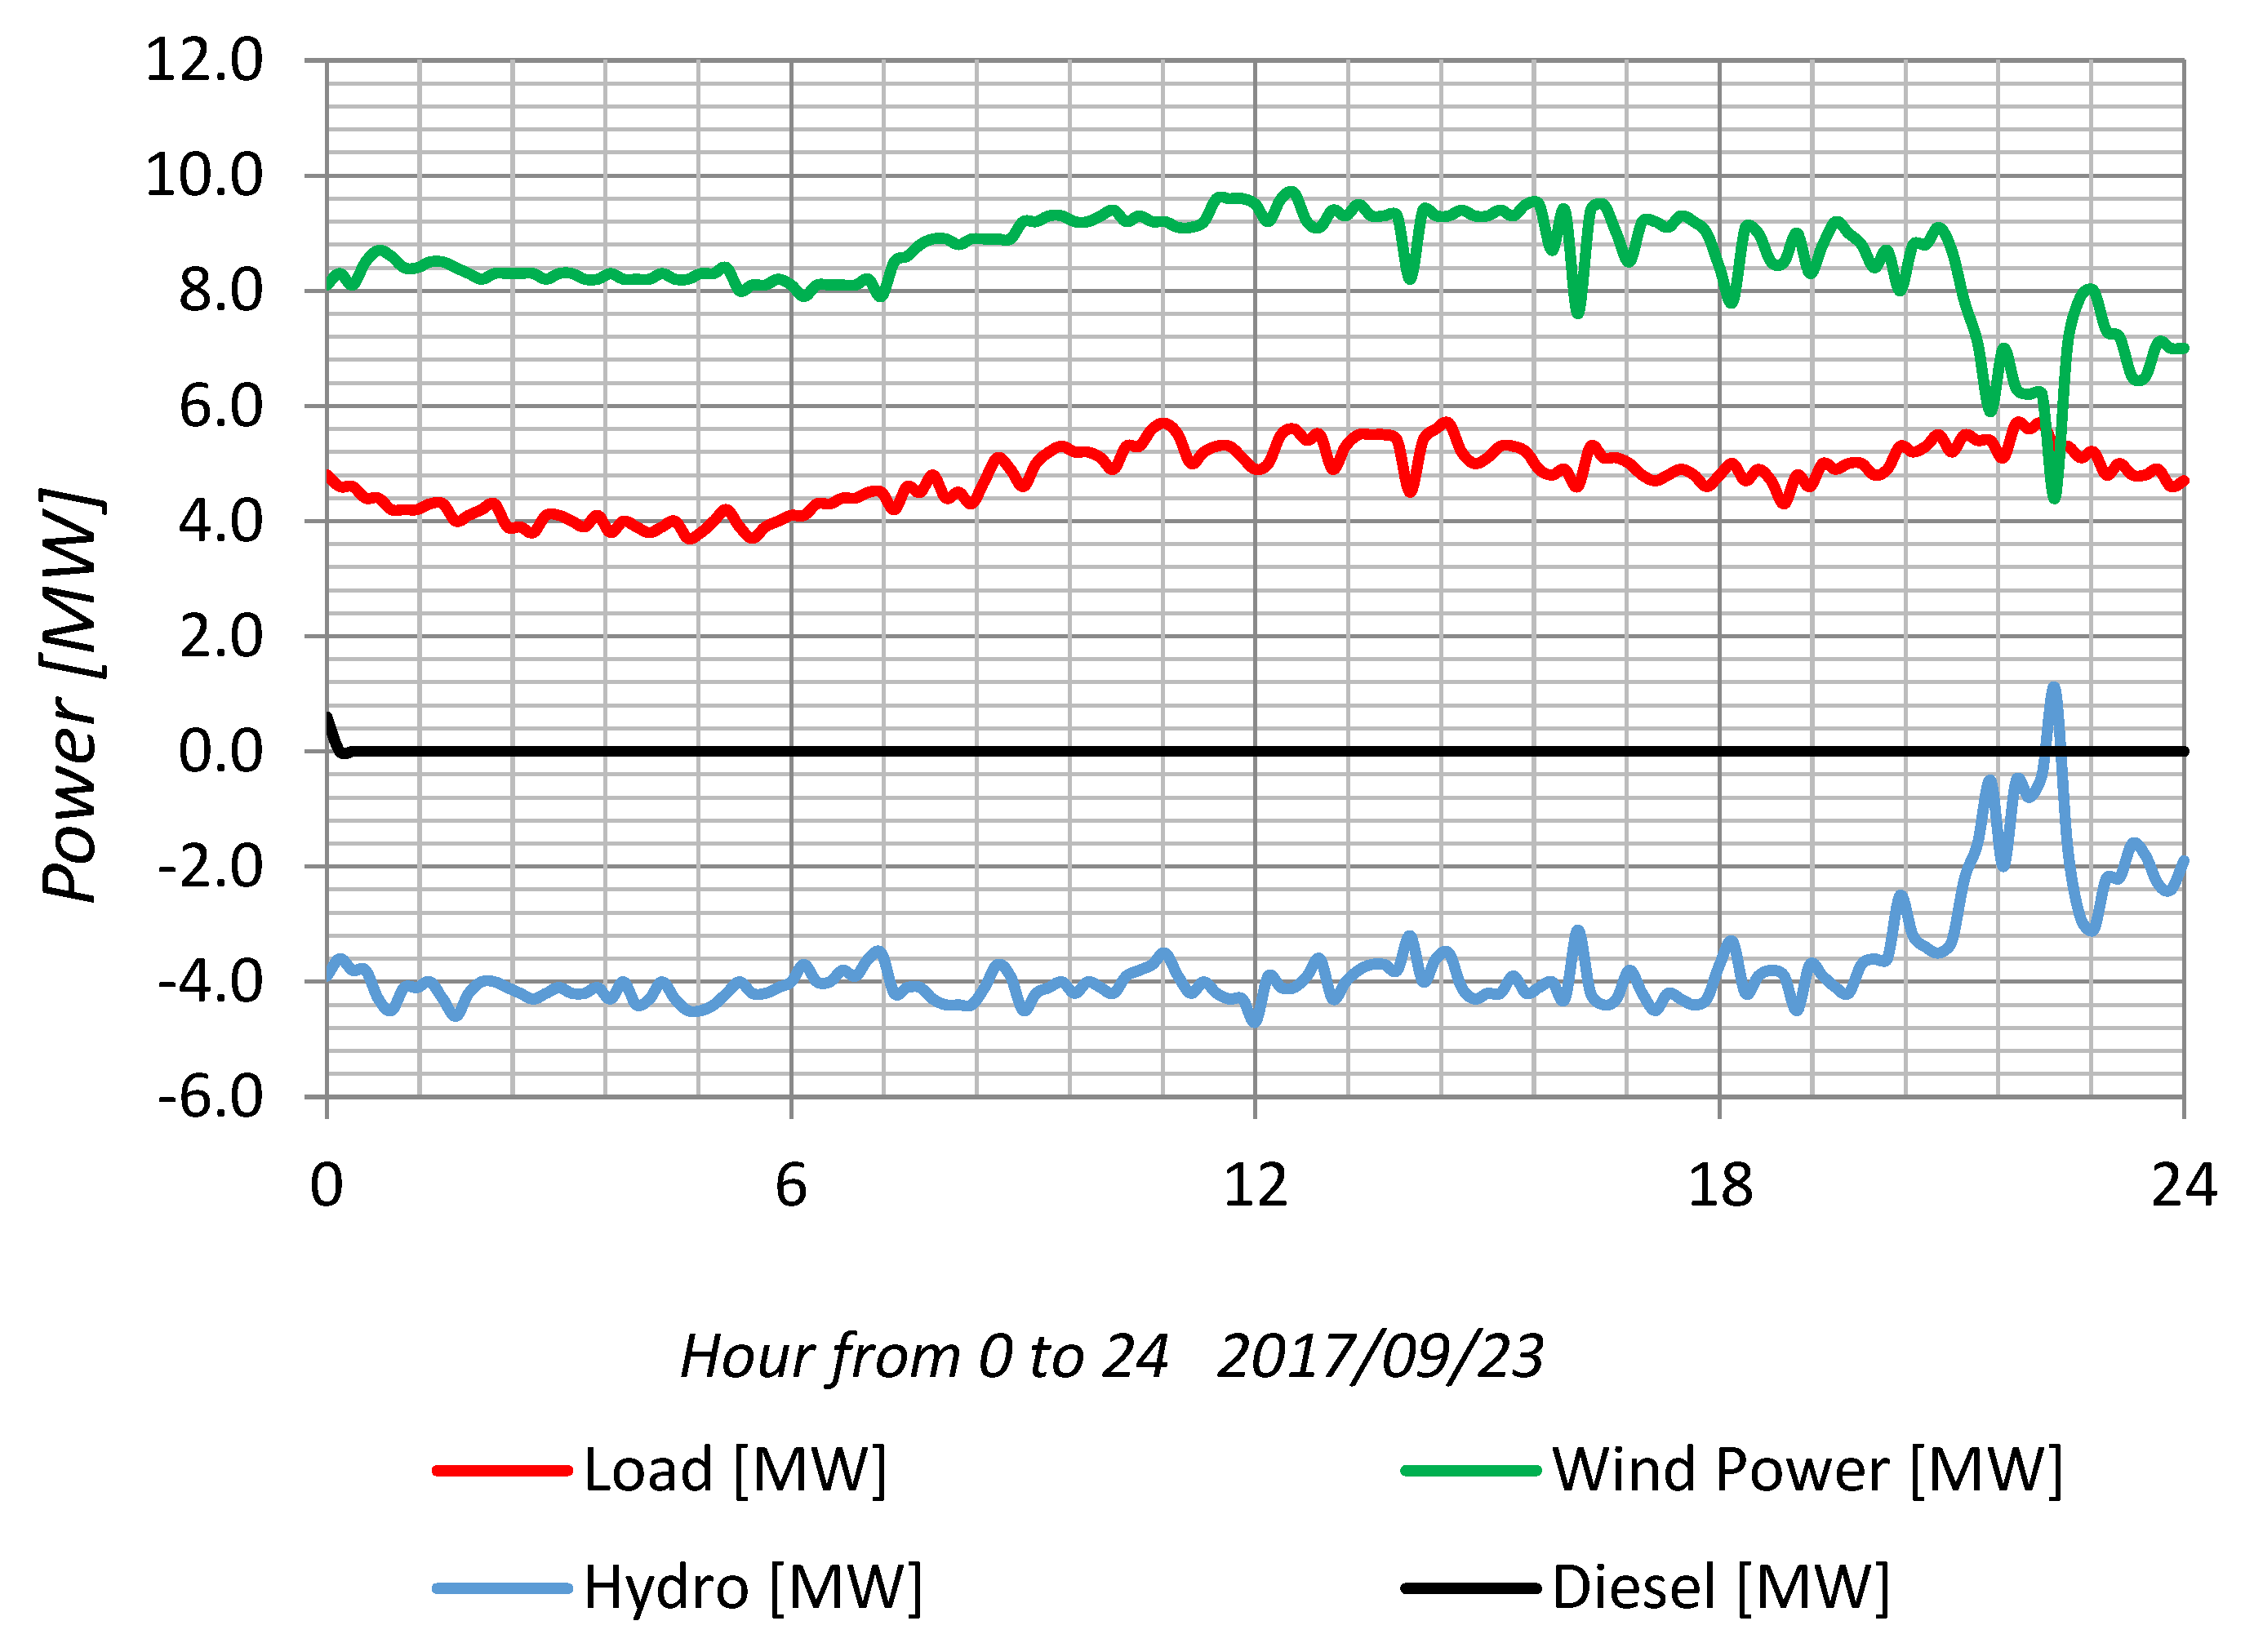
Wind farm operation at full load, feeding the demand and storing the energy surplus through the hydro station, has been achieved. This is the best pumping operation strategy. In
Figure 4, it is clearly observed that the wind farm production is around 10 MW, while the demand varies between 3.7 MW and 5.7 MW, and the pumping station varies accordingly [
27].
The operation of the power plant and thus, the renewable energy integration strategy, has largely improved during these two years, thanks to the experience acquired by the grid operator. Moreover, the power ramps could be improved with the technique presented in this paper.
4. Brief Computer Model Description
The penstock is modeled by means of a hyperbolic set of partial differential equations [
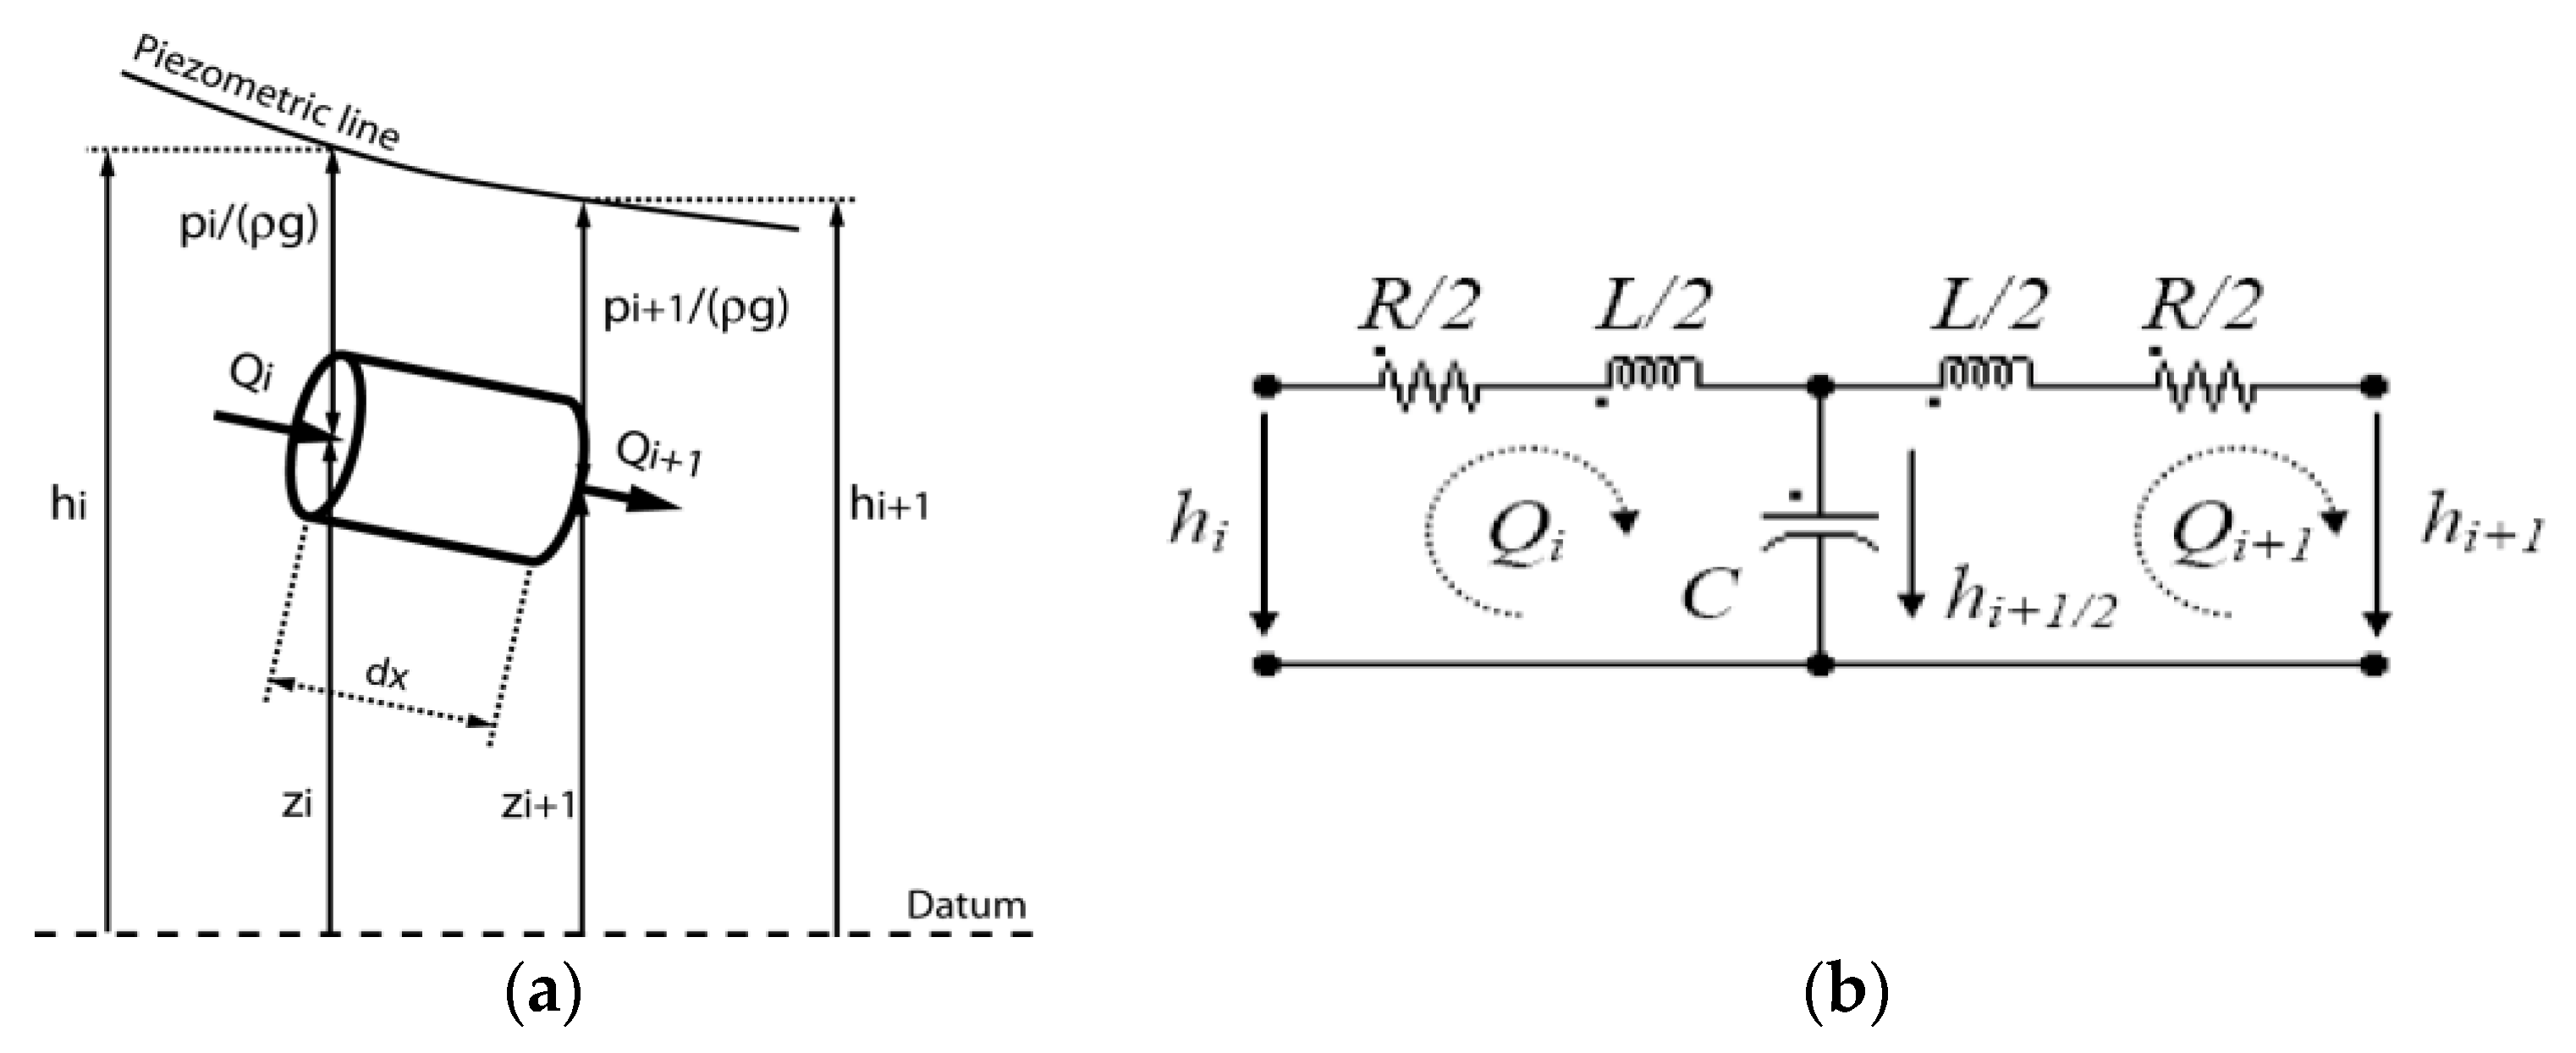
28] solved using a finite difference method with a 1st-order centre scheme discretization in space, and a scheme of Lax for the discharge variable. This method leads to a system of ordinary differential equations that can be represented as a T-shaped equivalent scheme, as presented by Nicolet [
29].
All models are based on the hydro-electrical analogy. The model of a pipe is composed by a series of elements, according to the equivalent circuit presented in
Figure 5. The hydraulic variables pressure (
h) and flow (
Q) are analogous to the electrical variables voltage and current. Therefore, hydraulic friction losses correspond to resistive losses (
R) in the electric circuit; kinetic energy correspond to magnetic energy stored in inductors (
L) and elastic energy storage corresponds to electrical capacitors (
C).
The system of equations relative to this model is set up using Kirchhoff laws. All the hydraulic models: Turbines, pipes, valves, surge tanks, etc., are implemented in software SIMSEN. This software was developed by the École Polytechnique Fédérale de Lausanne (EPFL), for the simulation of the dynamic behavior of hydroelectric power plants [
30,
31,
32]. A Runge-Kutta 4th-order algorithm is used in SIMSEN software to obtain the time-domain integration of the full system.
The modeling approach, based on equivalent schemes of hydraulic components, is extended to all the standard hydraulic components, such as valve, surge tanks, air vessels, cavitation development, Francis pump-turbines, Pelton turbines, Kaplan turbines, pump, etc. [
33].
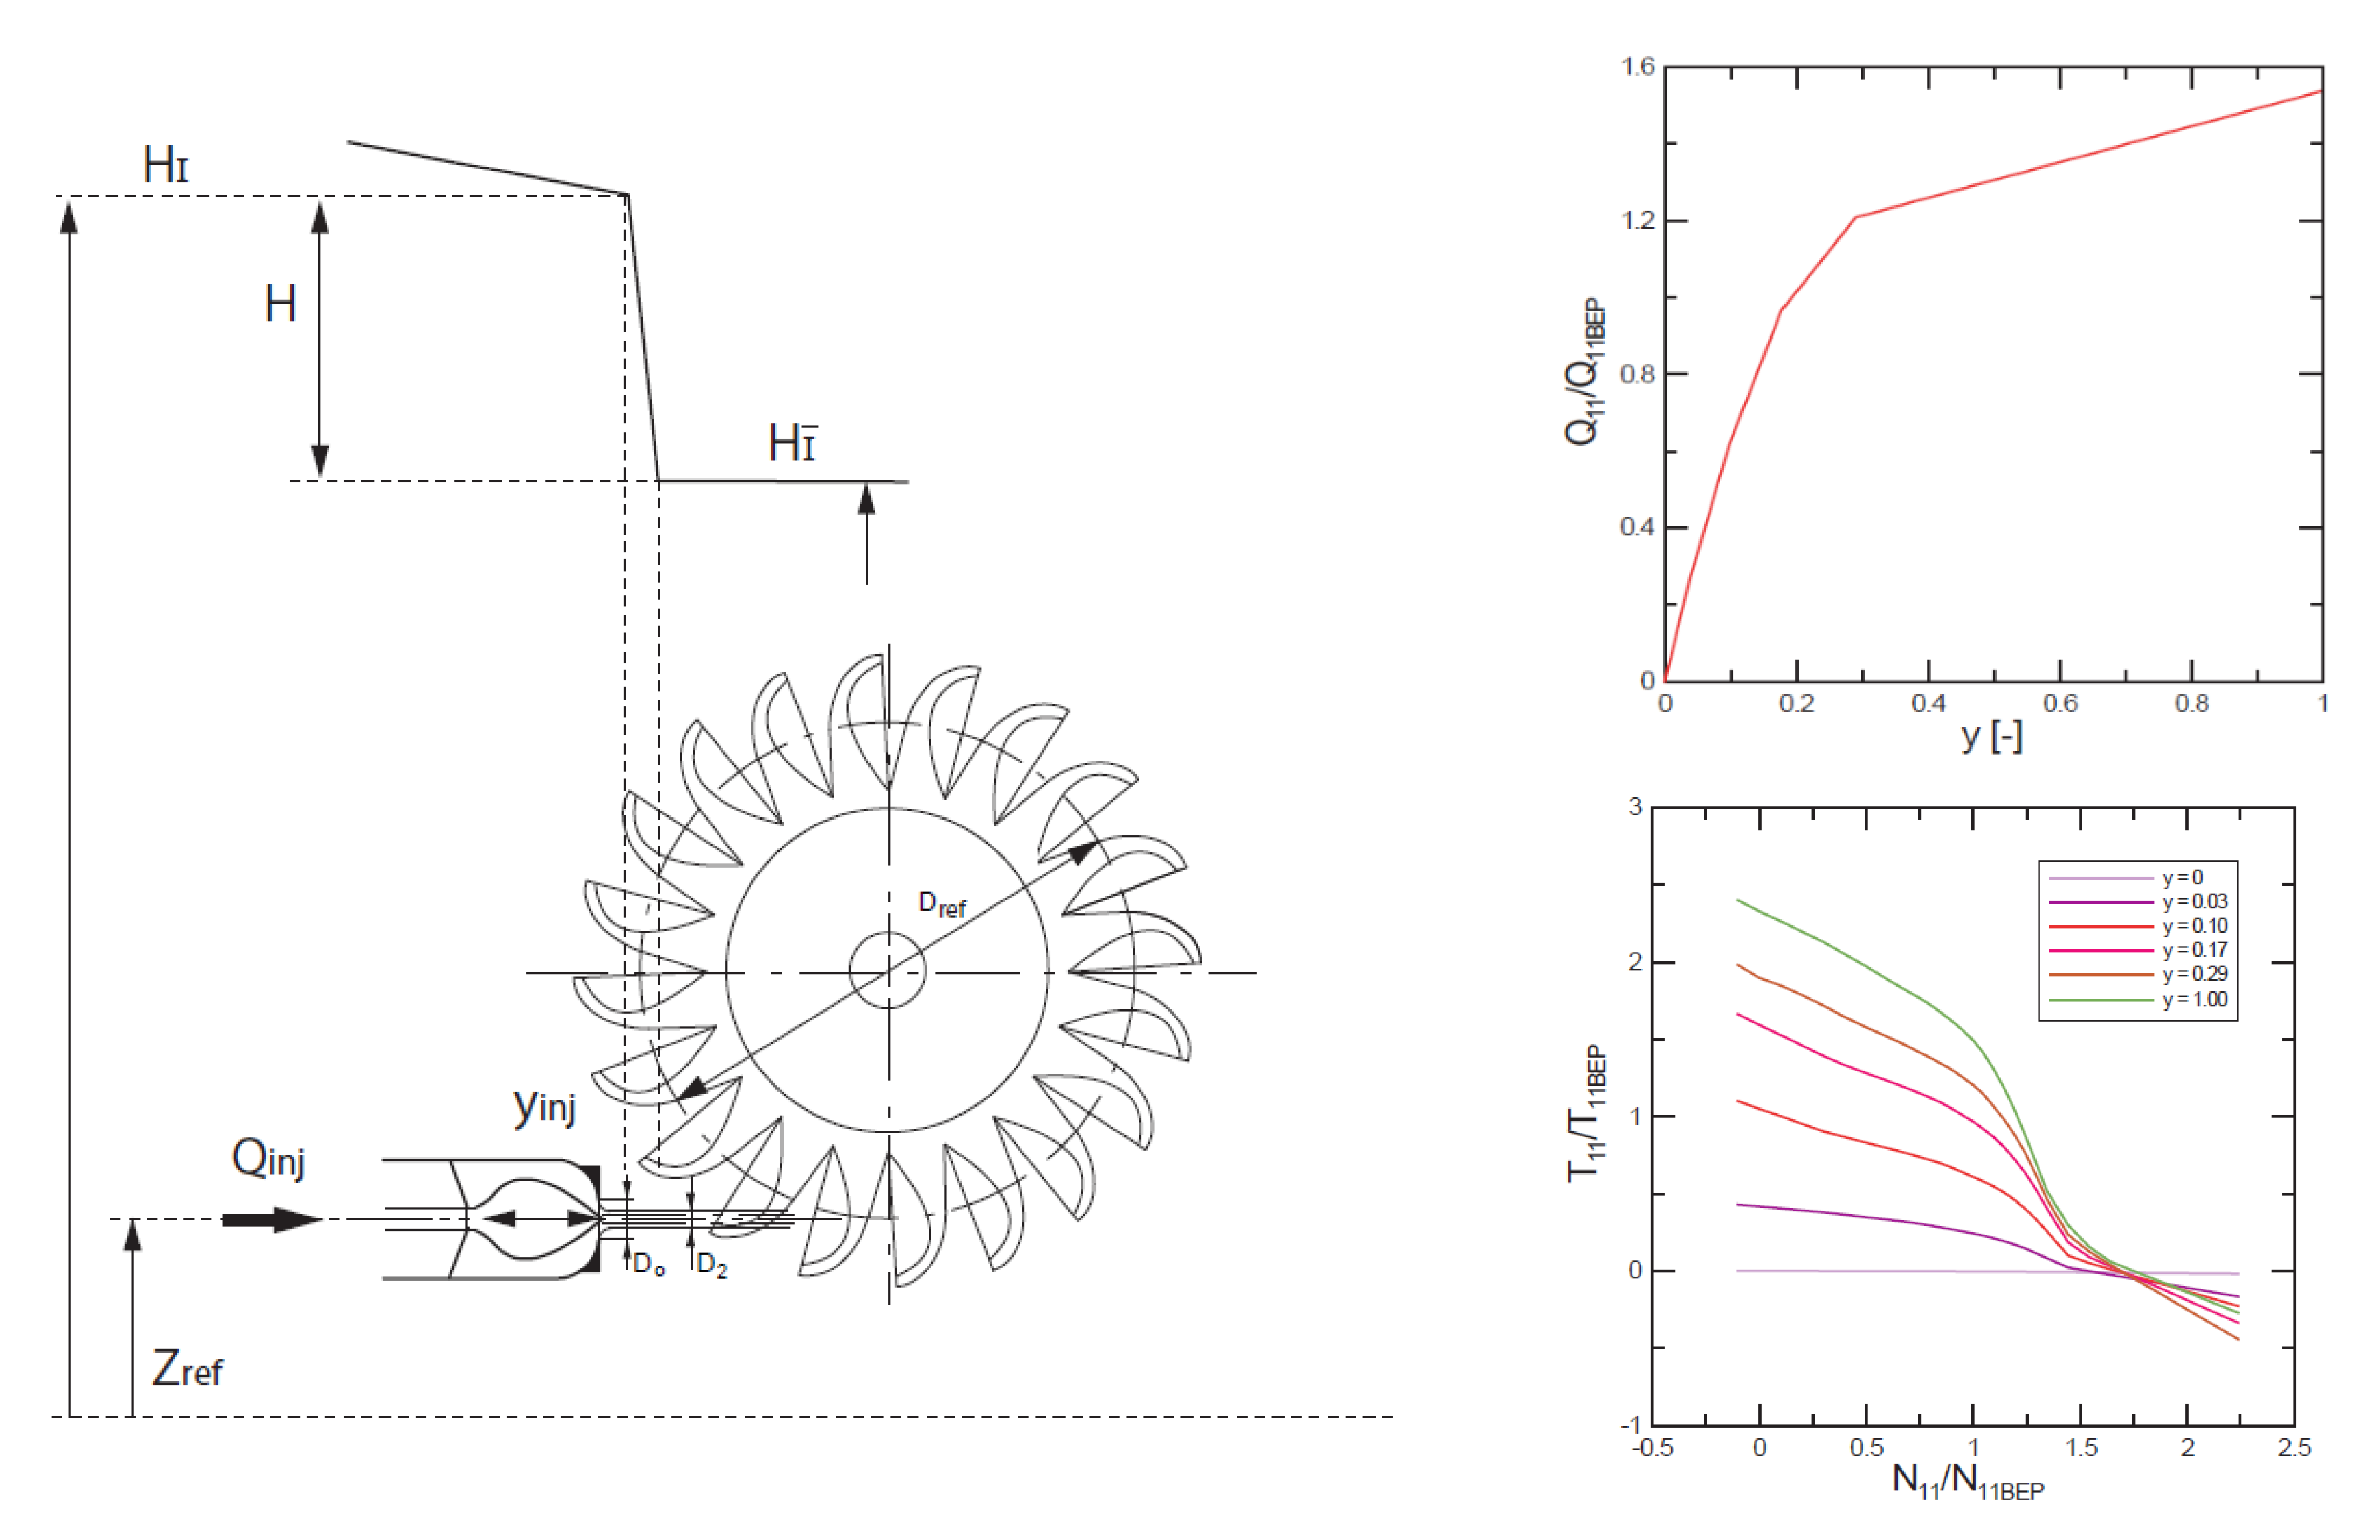
The model of Pelton turbine uses the turbine quasi-static characteristics. The energy transfer in Pelton turbines is achieved at a constant pressure. Therefore, the Pelton turbine model can be divided into two parts: One hydraulic and one mechanical. The model is shown in
Figure 6. In this Figure, the site elevation relative to the reference plane is represented as
Zref.
The hydraulic model of the Pelton turbine is an equivalent valve, considering the needle position of each injector to fix the water flow (Q) relative to the best efficiency point flow (Qbep).
On the other hand, the mechanical model should provide the torque contribution of each injector. The torques are deduced from the turbine torque characteristic according the injector position, net head and speed. In
Figure 6, the relation between torque (
T), relative to the best efficiency point (
BEP) torque, and rotational speed
N (also relative to
BEP speed
Nbep) for each needle valve position is shown. The deflectors were not considered in this study. Finally, the rotational speed of the unit is computed using the rotating momentum equation.
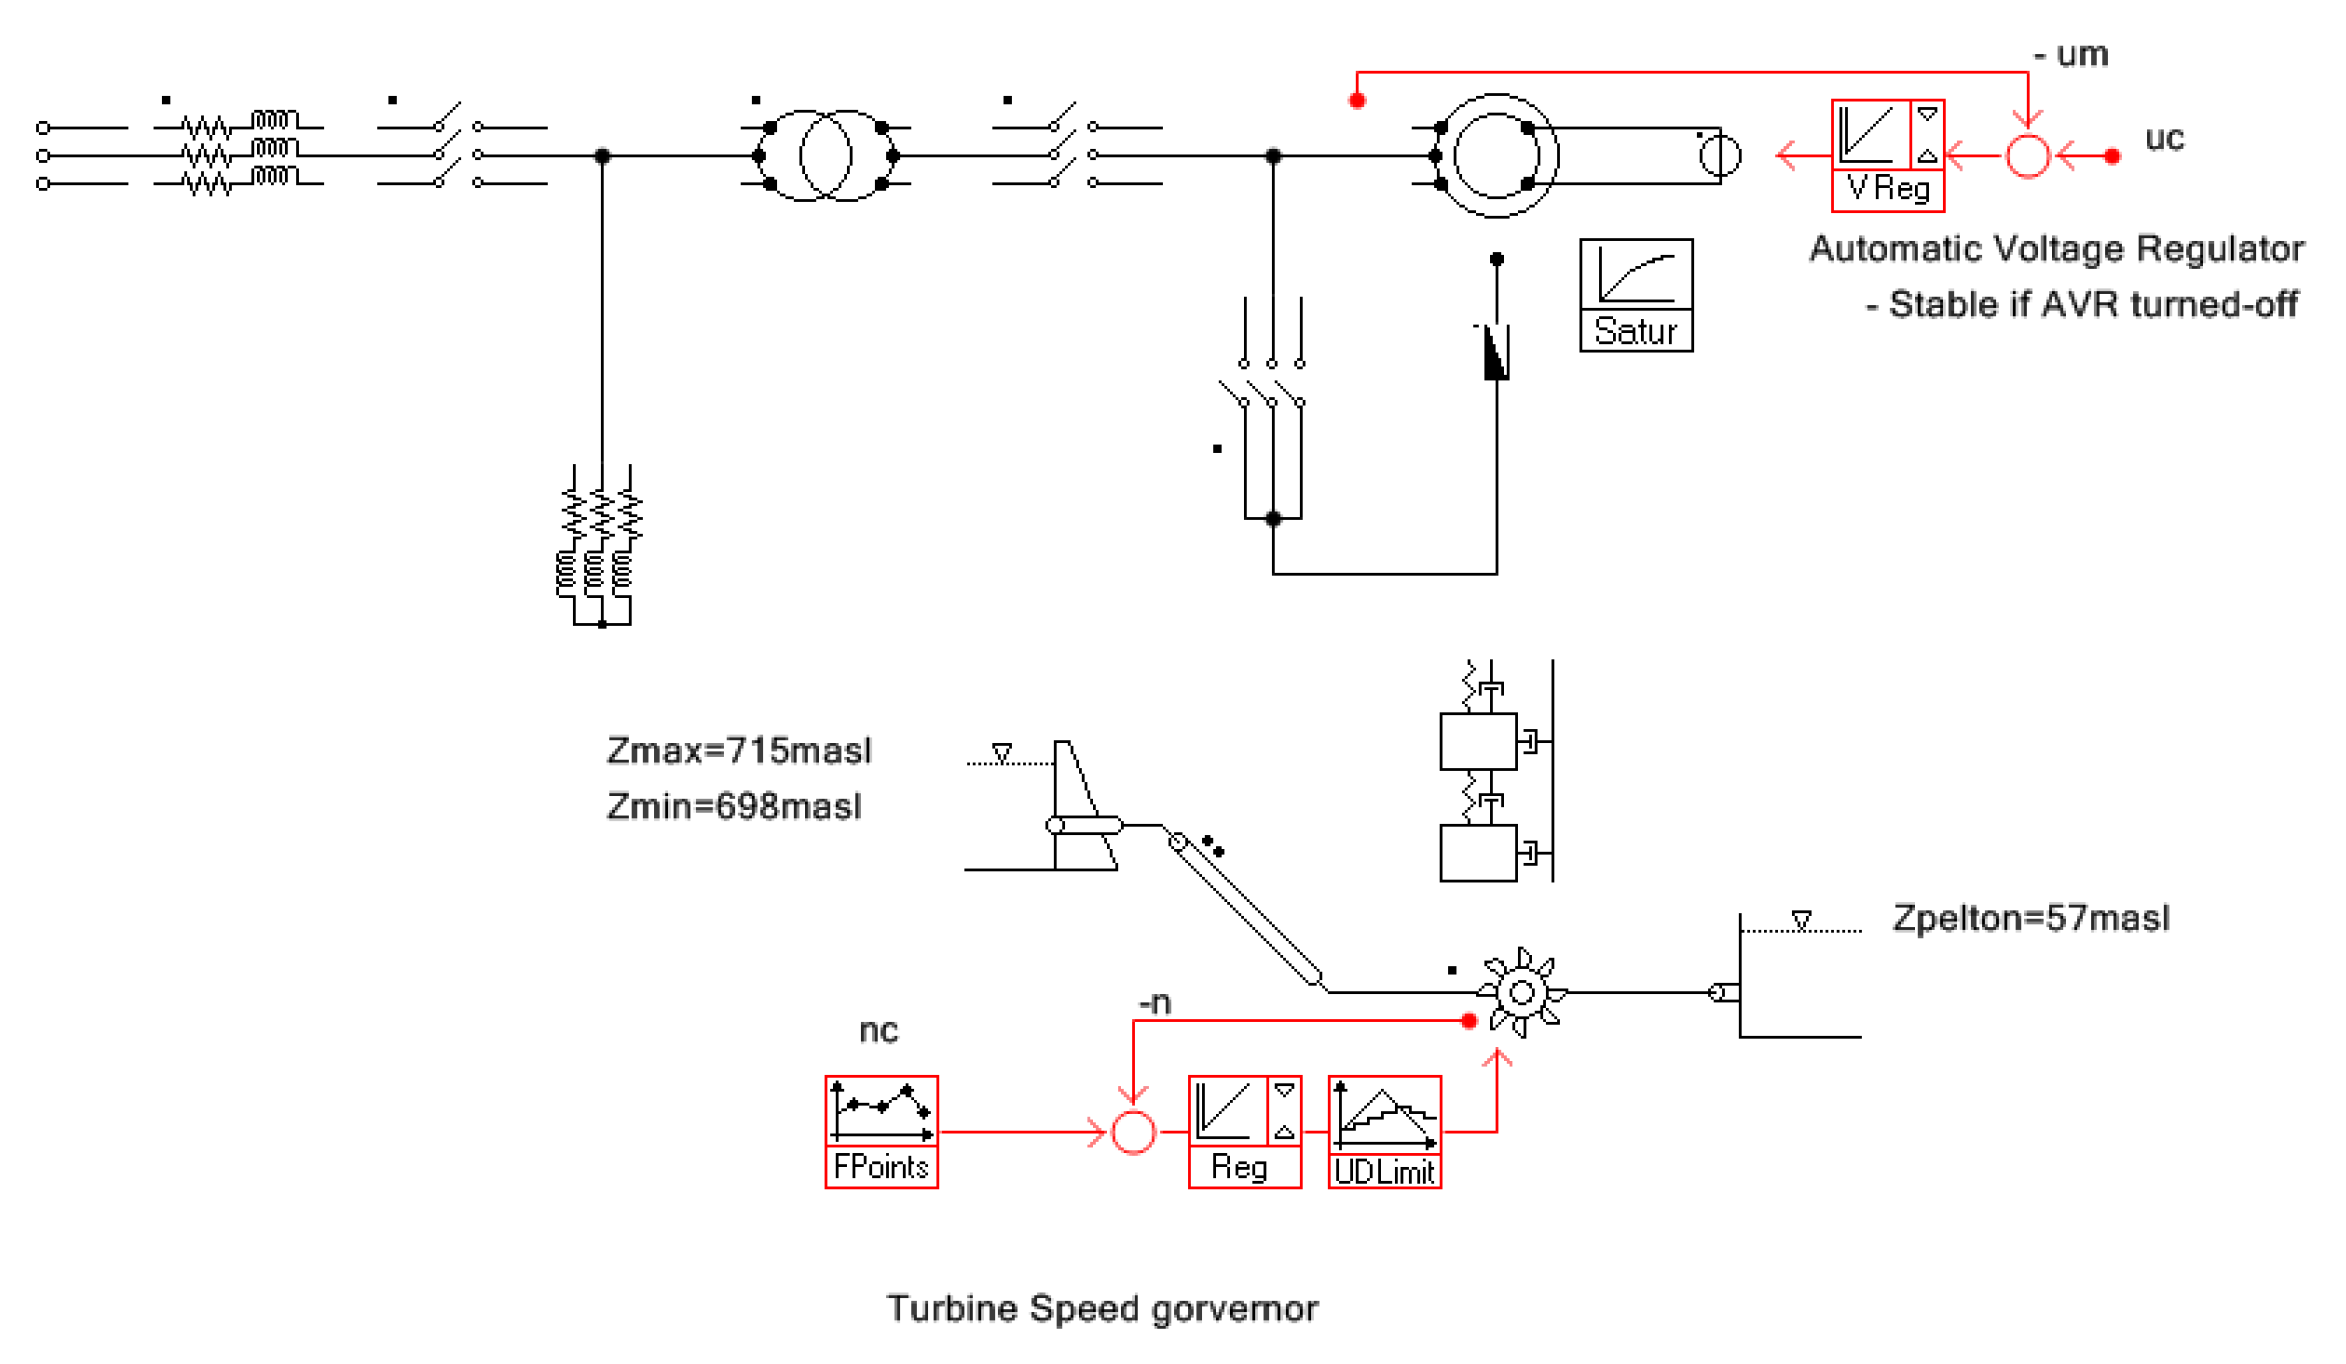
The power system is composed of two generating units: Wind generators; and Hydro turbine-driven generators. However, the model comprises only of the hydropower plant, because the case that would be simulated is a whole wind generation trip. There is also an electrical load representing the consumers (
Figure 7).
The model of the hydropower plant takes into account the upstream reservoir with constant water level, the penstock and the Hydro generator units, modeled as one equivalent turbine and one generator. The turbine speed governor is modeled as a proportional-integral-derivative controller PID, and includes limiters and rate limiters.
5. Analysis of Simulations Results
5.1. Loss of Generation Simulated
The most severe loss of generation corresponds to the shut down of a wind generator at full load when this is the only generator in operation. As the wind generator is supplying electricity to the whole power system, this represents a 100% loss of generation. Obviously, any other wind power fluctuation will be less severe than this one.
After the tripping of the wind generator, the hydro generators should supply the active power demanded by the power system (2.3 MW). The frequency of the power system will decrease until the turbines are able to supply the active power demanded by the load. While the four hydro generators are operating at a synchronous condenser mode, their power is slightly negative.
To summarize, the main requirements are maintaining the frequency within the power quality limits according to regulations [
34] and surviving the trip of the biggest generator without load shedding. The load shedding frequency relay is set to 48.5 Hz during 0.1 s. This requires a power plant with a fast injecting power capability.
5.2. Upper Reservoir Levels Considered
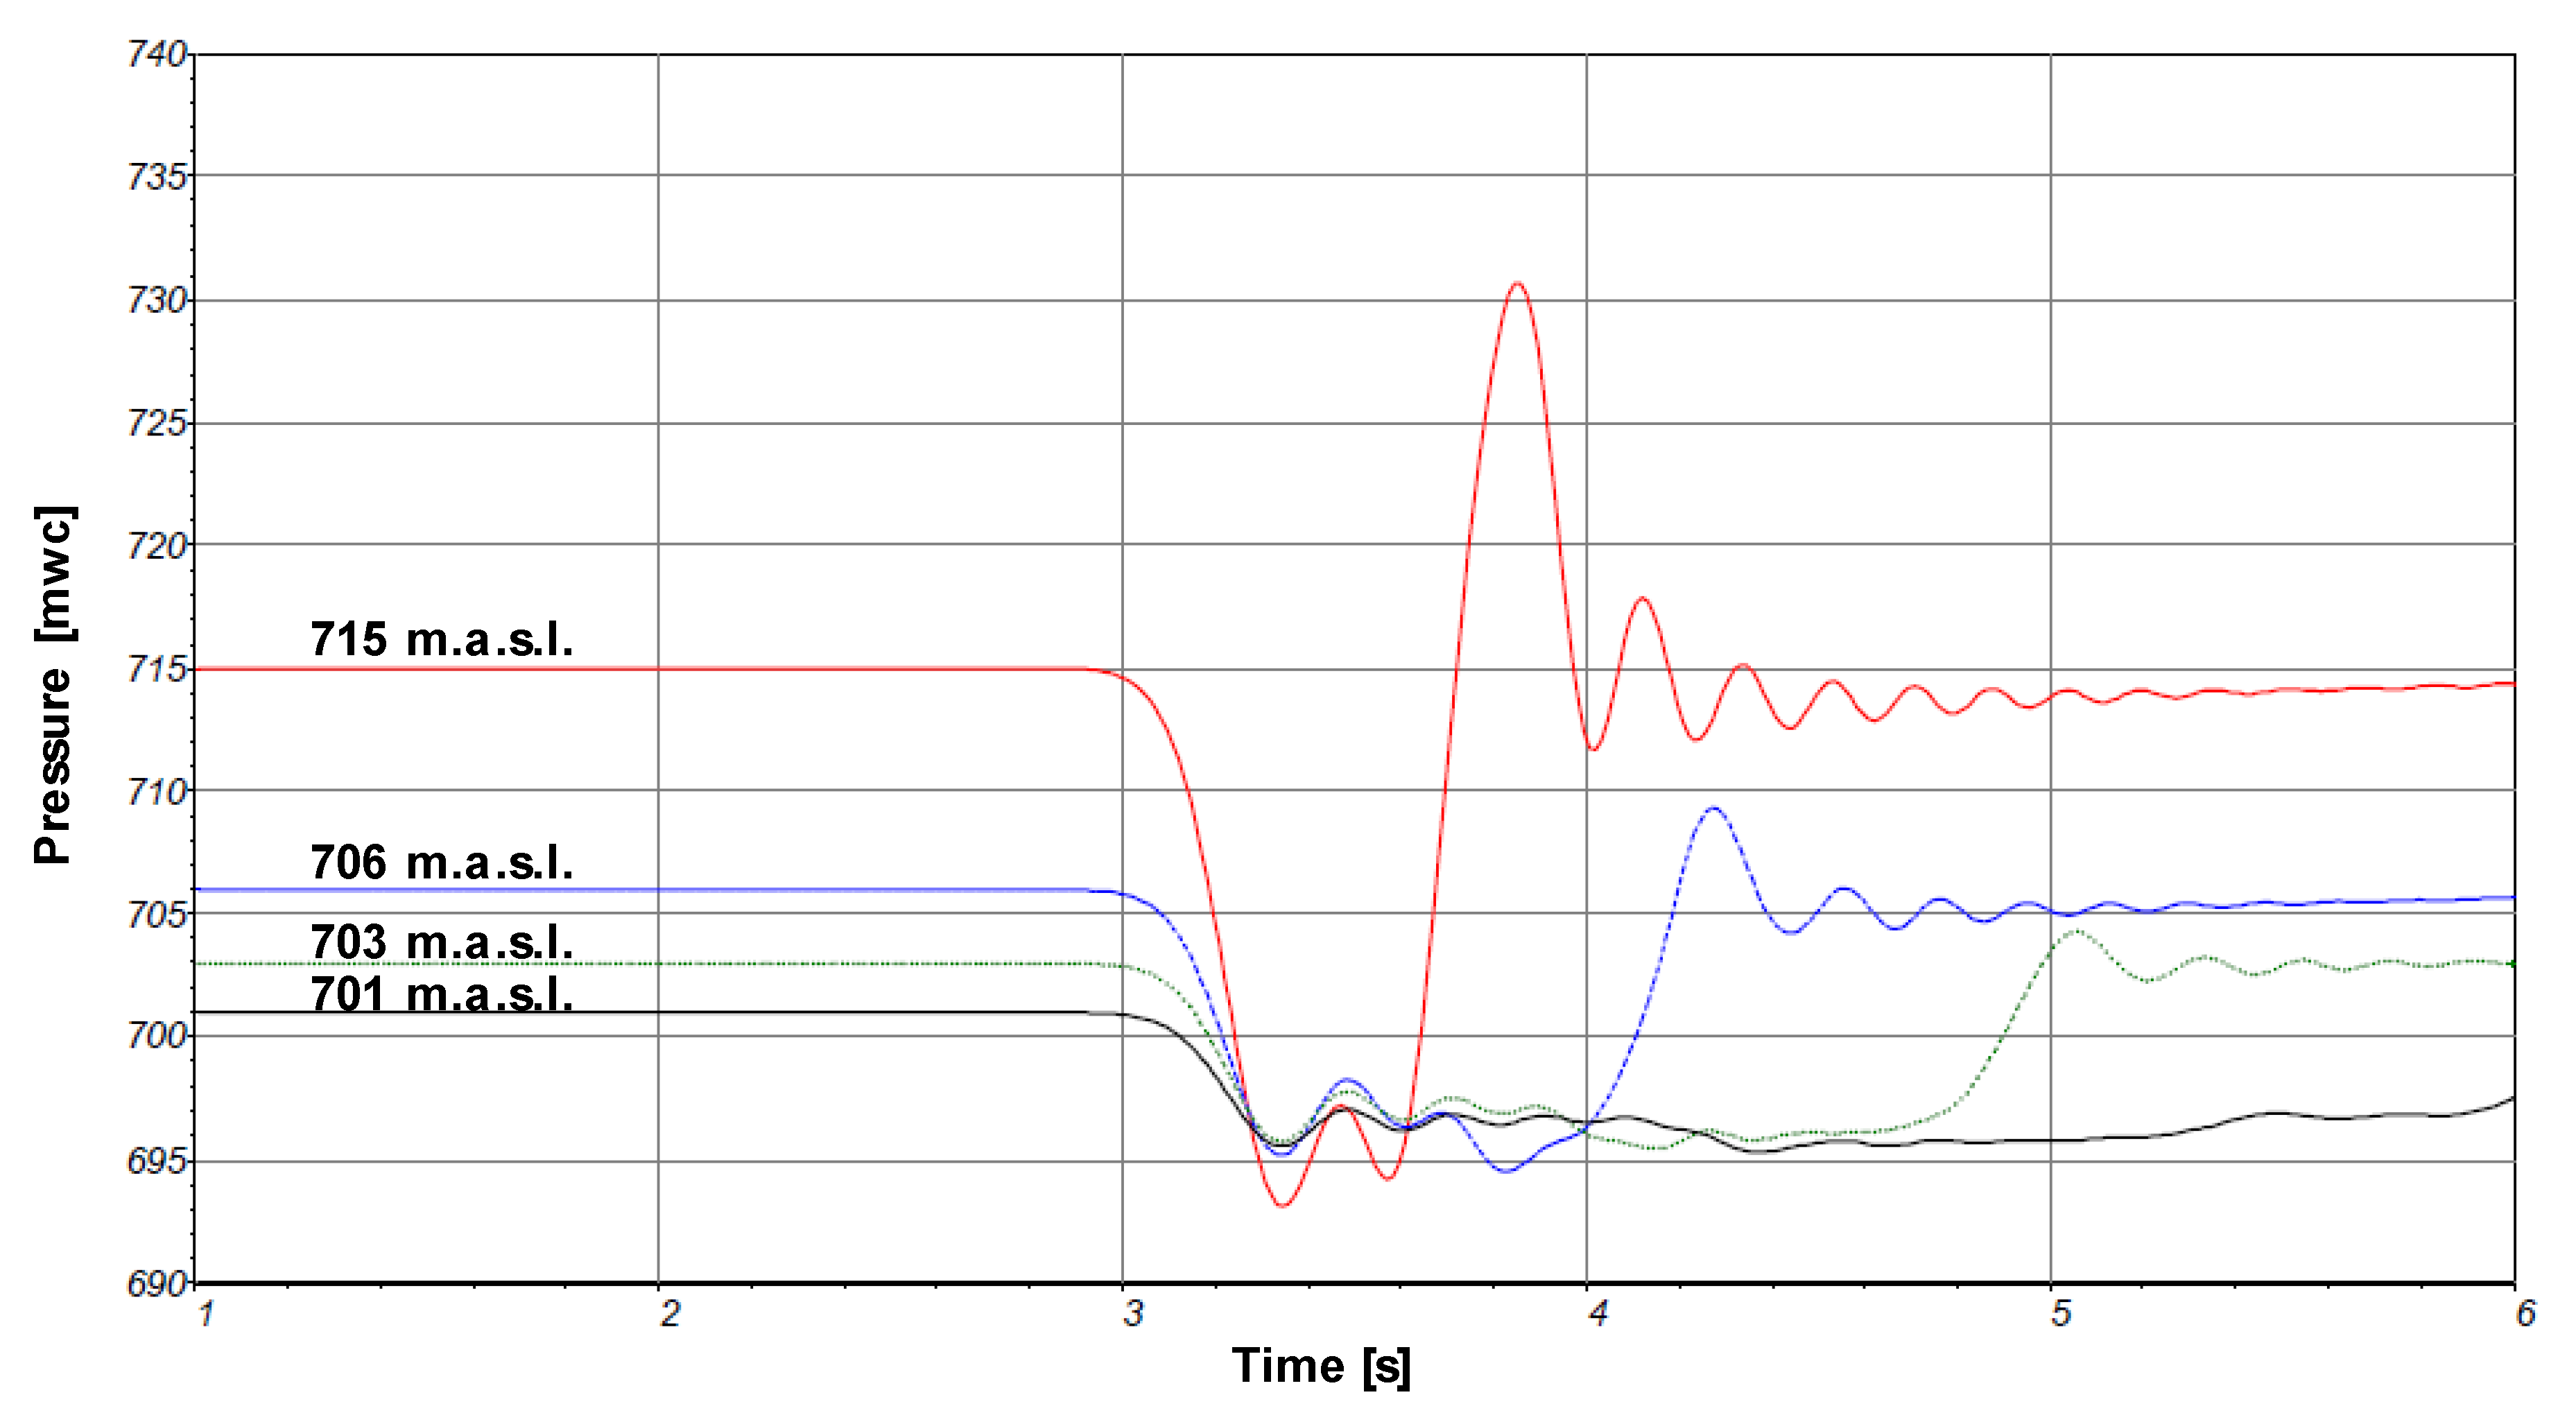
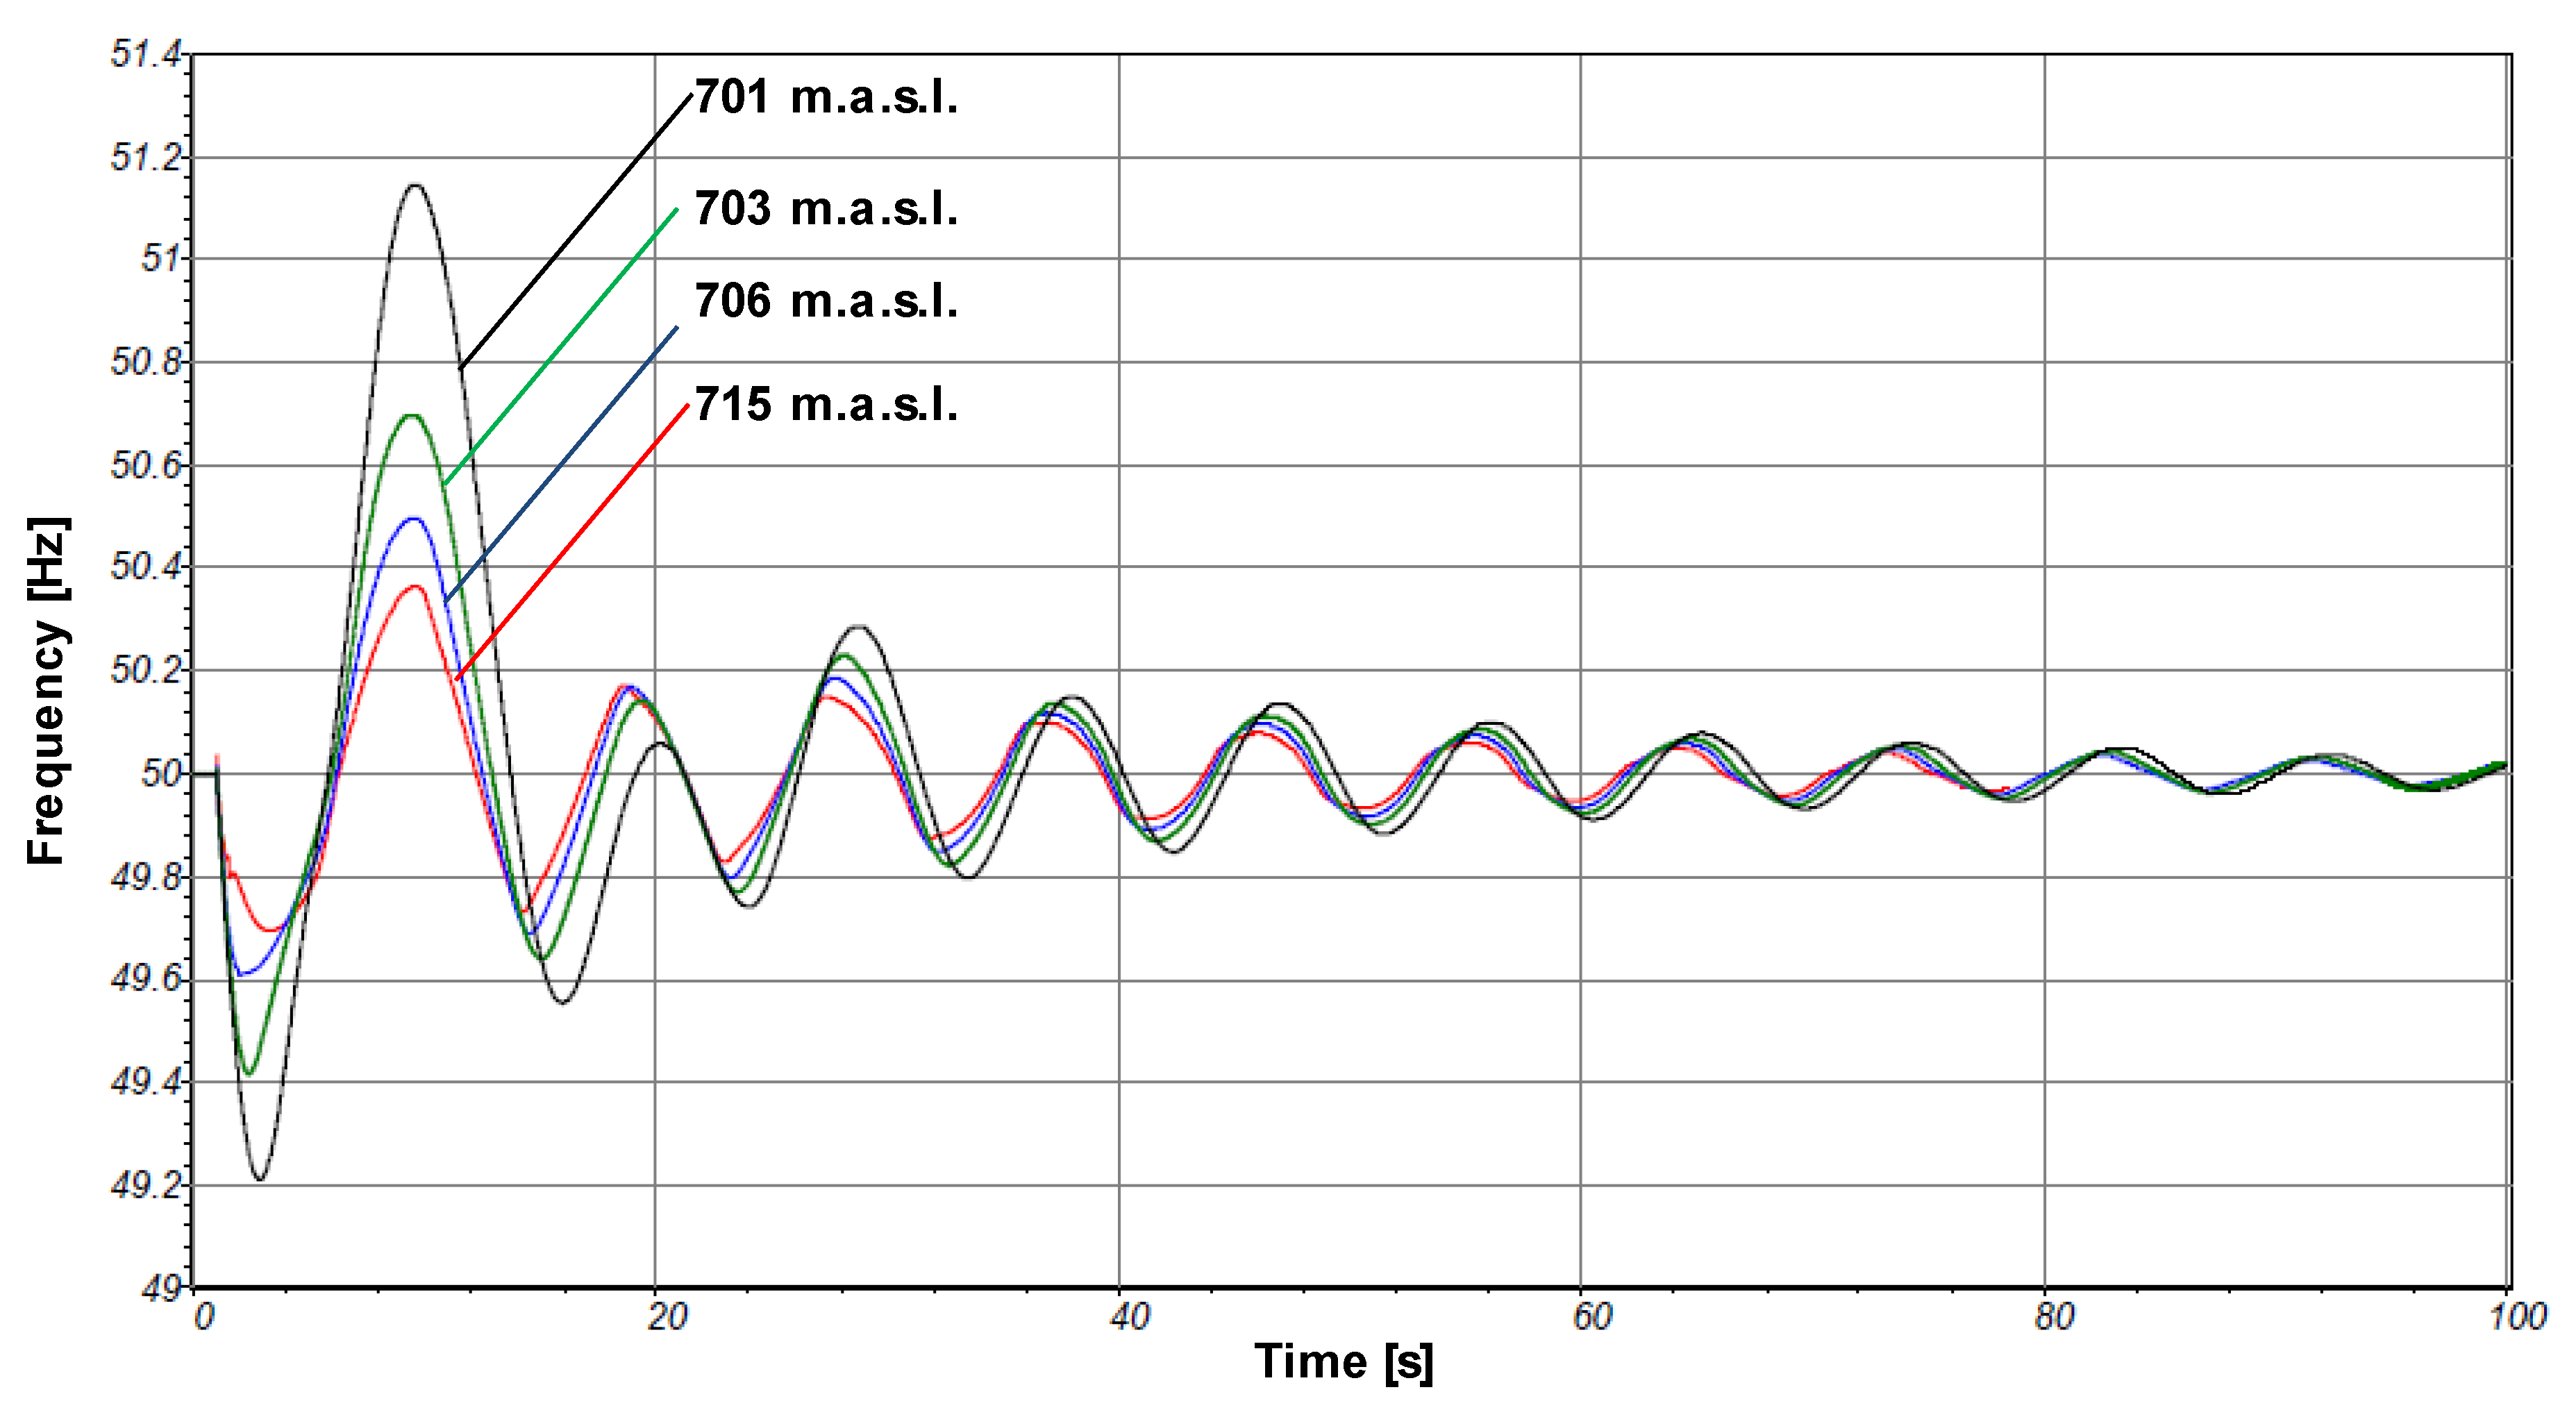
Four simulations of a wind generator trip corresponding to four upper reservoir levels (701, 703, 706 and 715 m.a.s.l.) have been performed. In these simulations, the injector opening time has been adjusted in order to avoid piezometric heads lower than 695 m.a.s.l. in the upper zone of the penstock.
Figure 8 shows the time evolution of this piezometric head in this zone of the penstock.
5.3. Pelton Turbine Driven Generators Transient Response
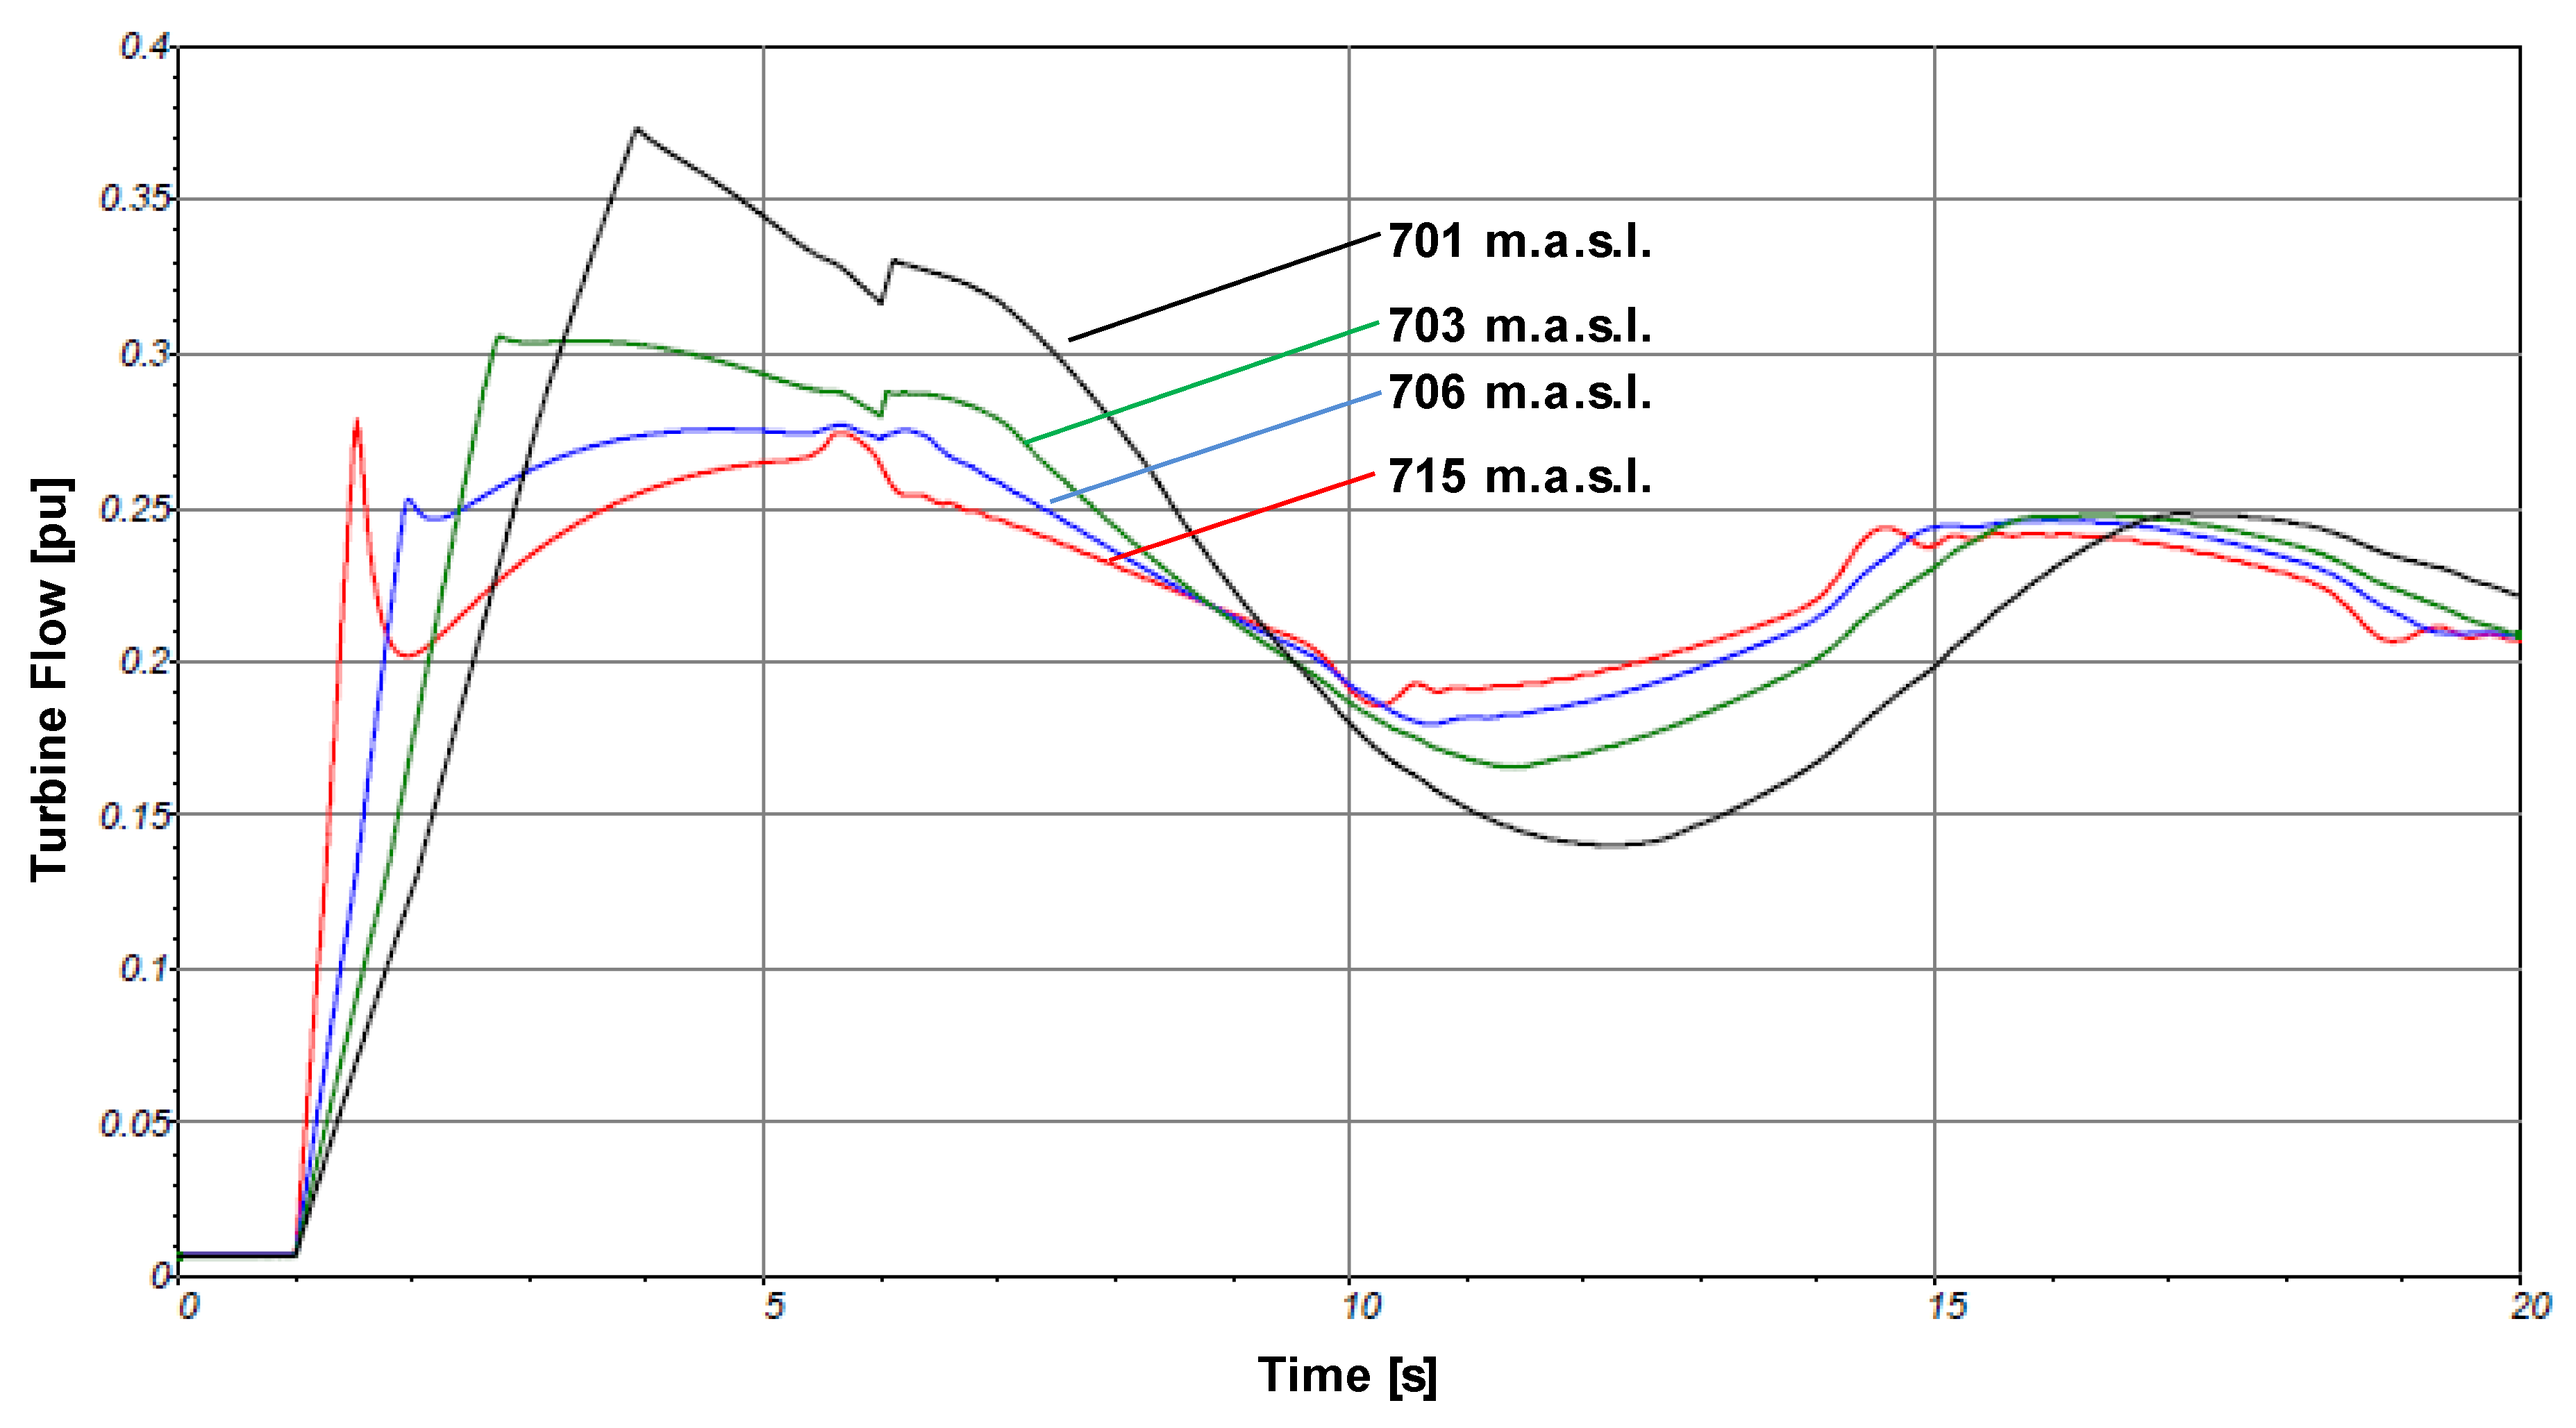
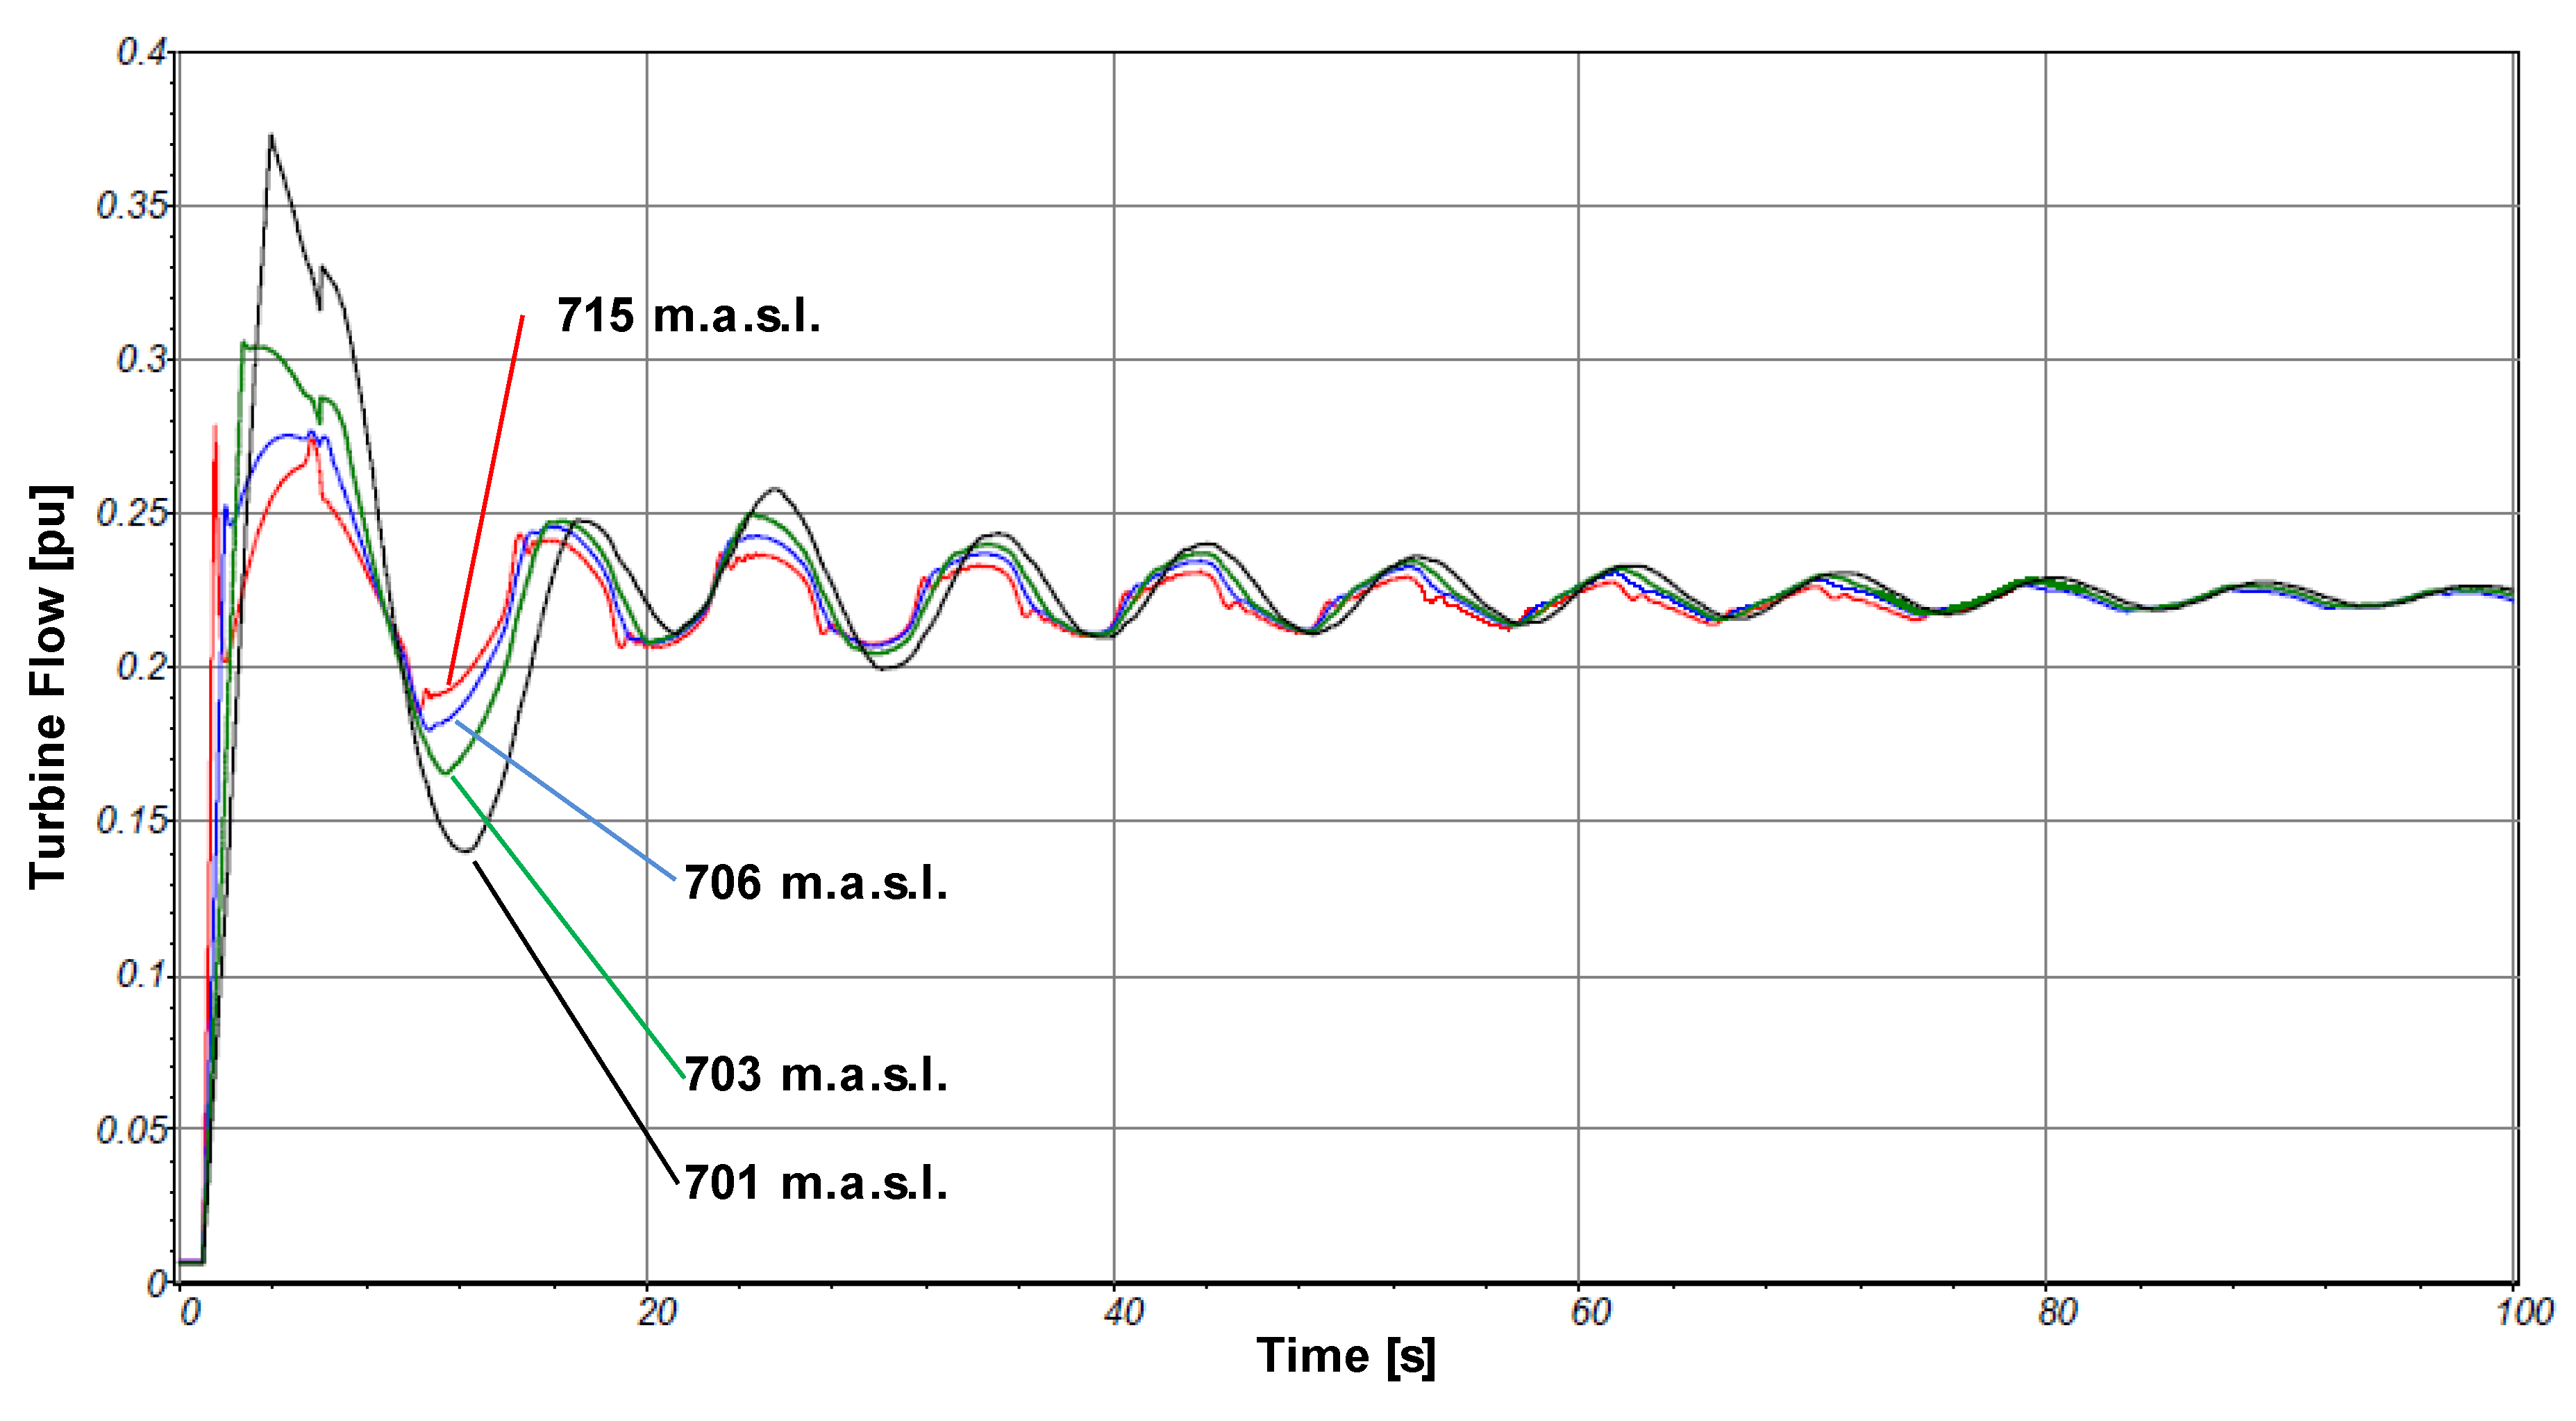
Figure 9 shows water flow in the turbines for the four upper water levels simulated. When the system reaches steady state operation, flow is around 22% of the rated flow. In
Figure 10, it can be clearly observed that the maximum turbines water flow (38%) corresponds with the lowest reservoir level (701 m.a.s.l). In case of maximum water level on the upper reservoir (715 m.a.s.l.), maximum water flow is only 28% of the rated flow. This is due to the different power ramps applied. As previously explained, the power ramp applied for each reservoir level is the maximum ramp that does not cause cavitation problemes in the upper part of the penstock.
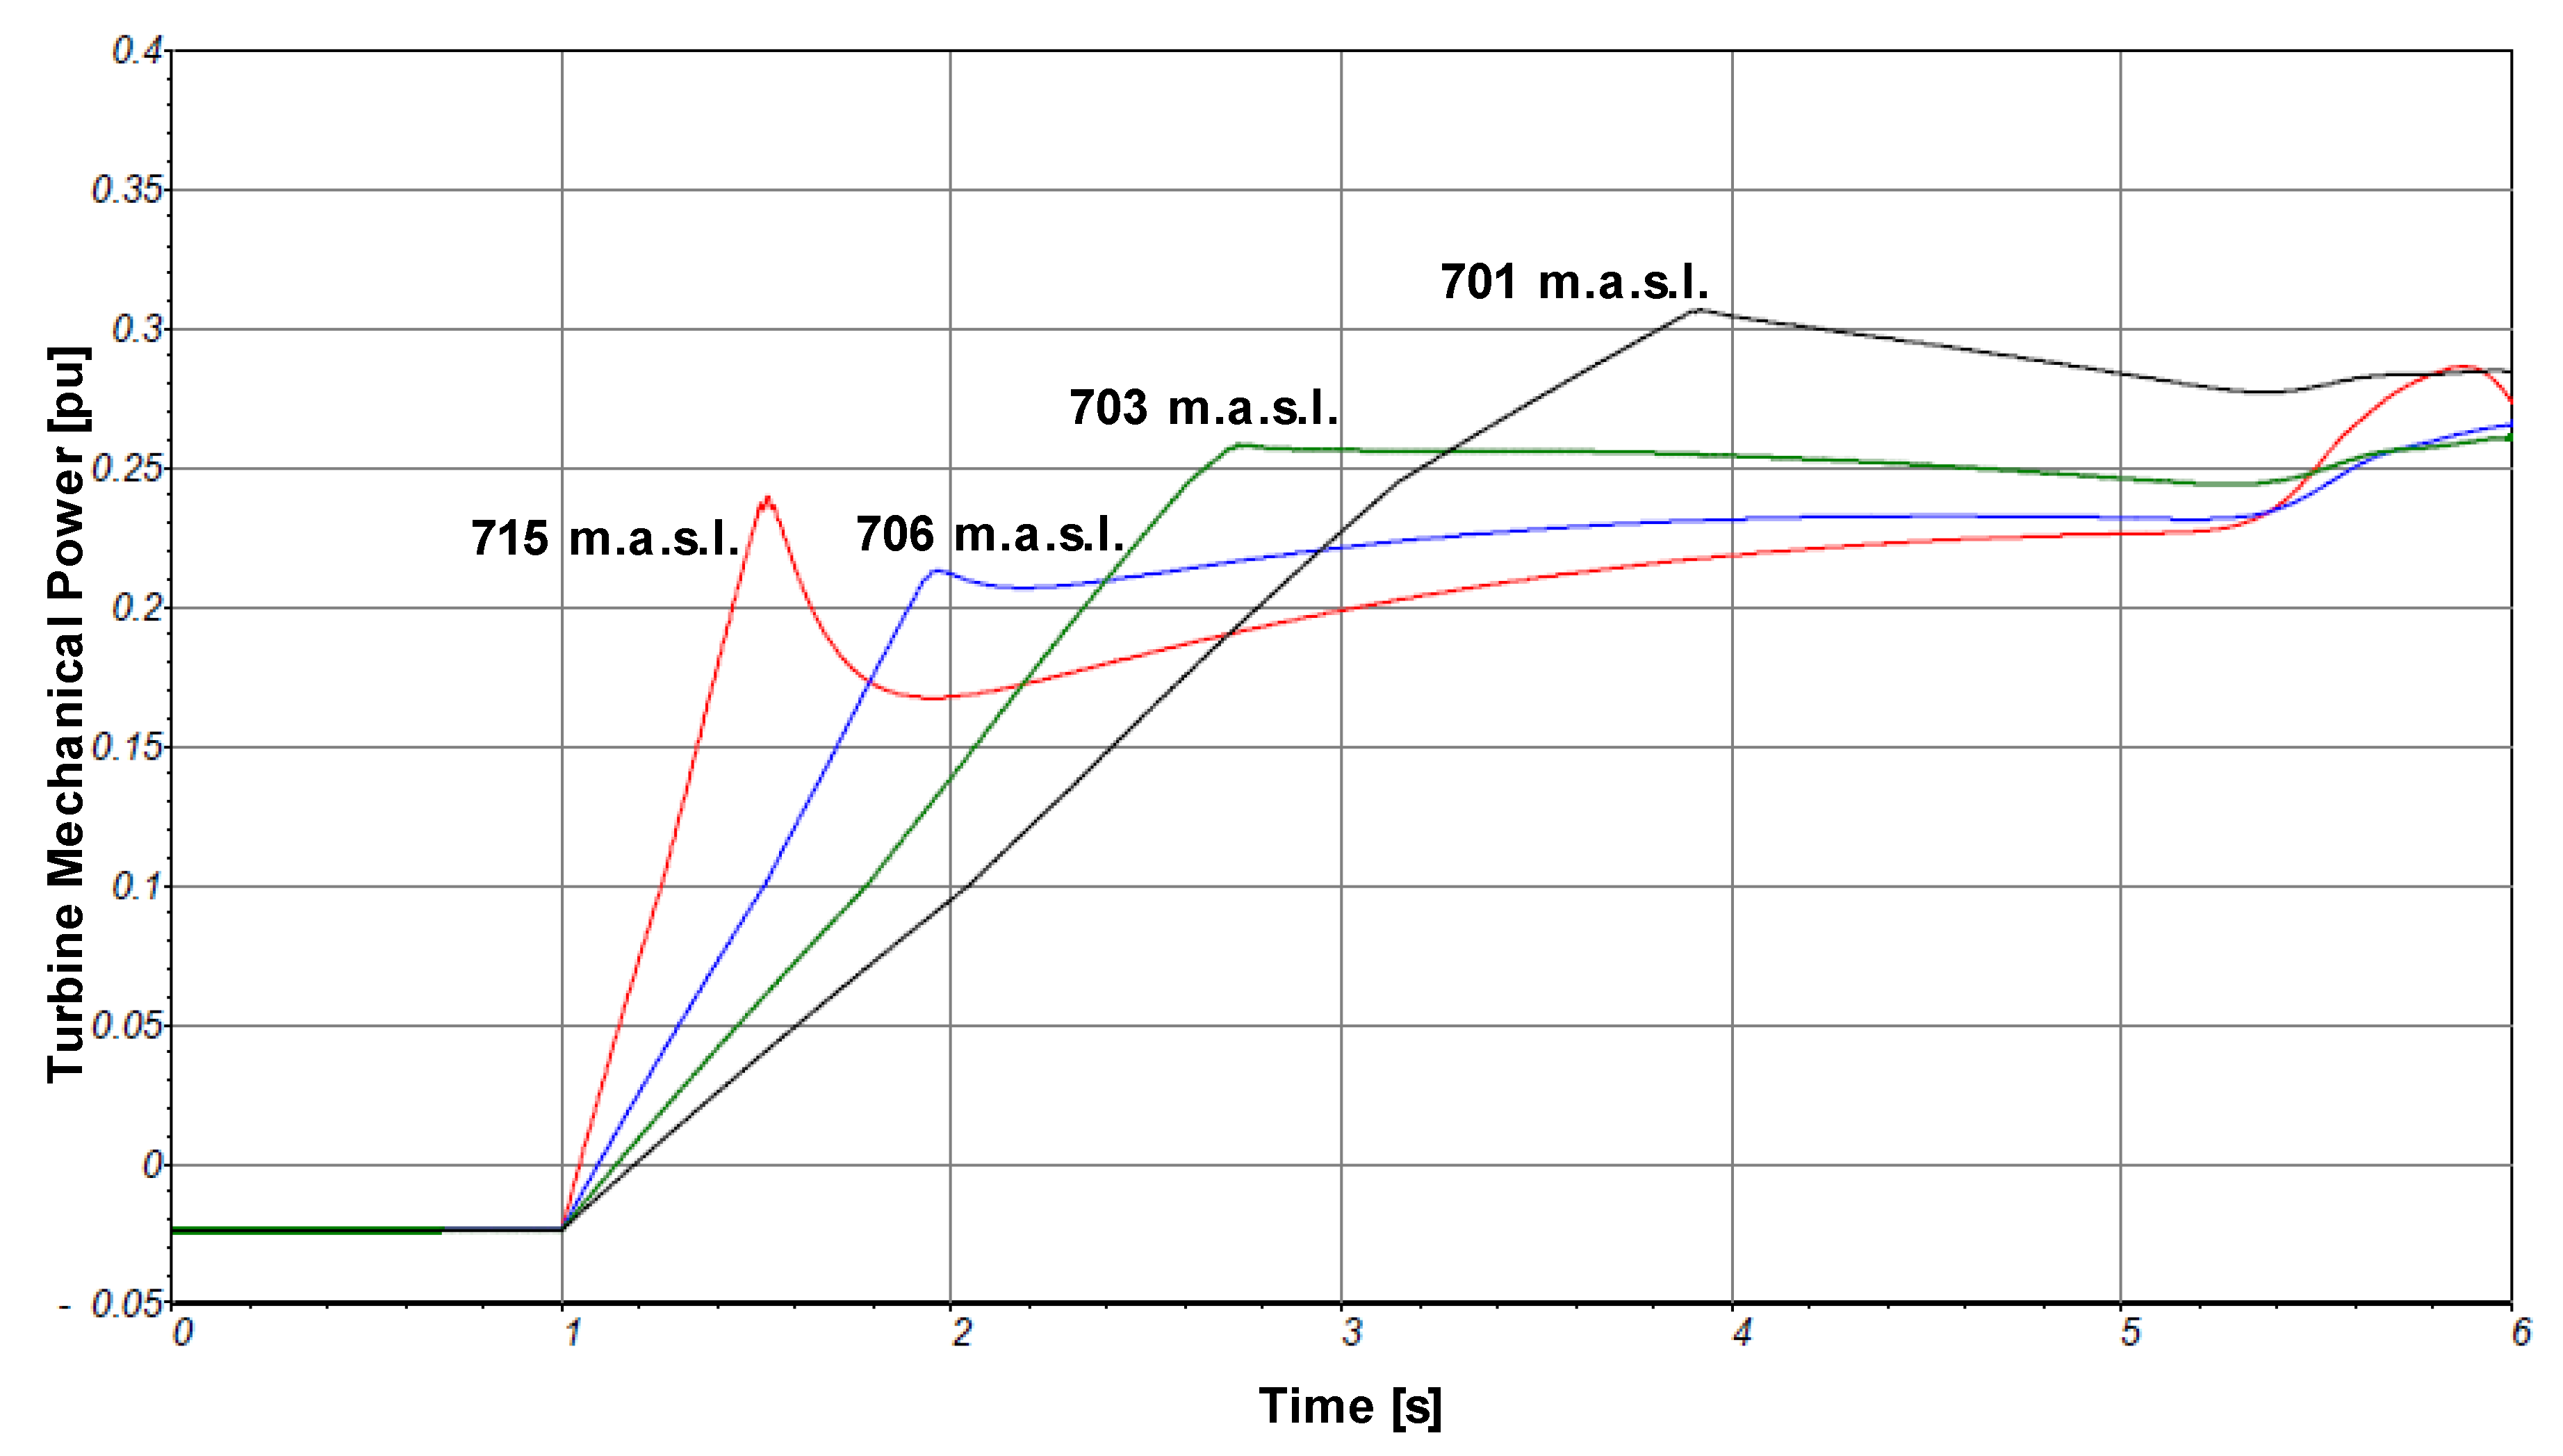
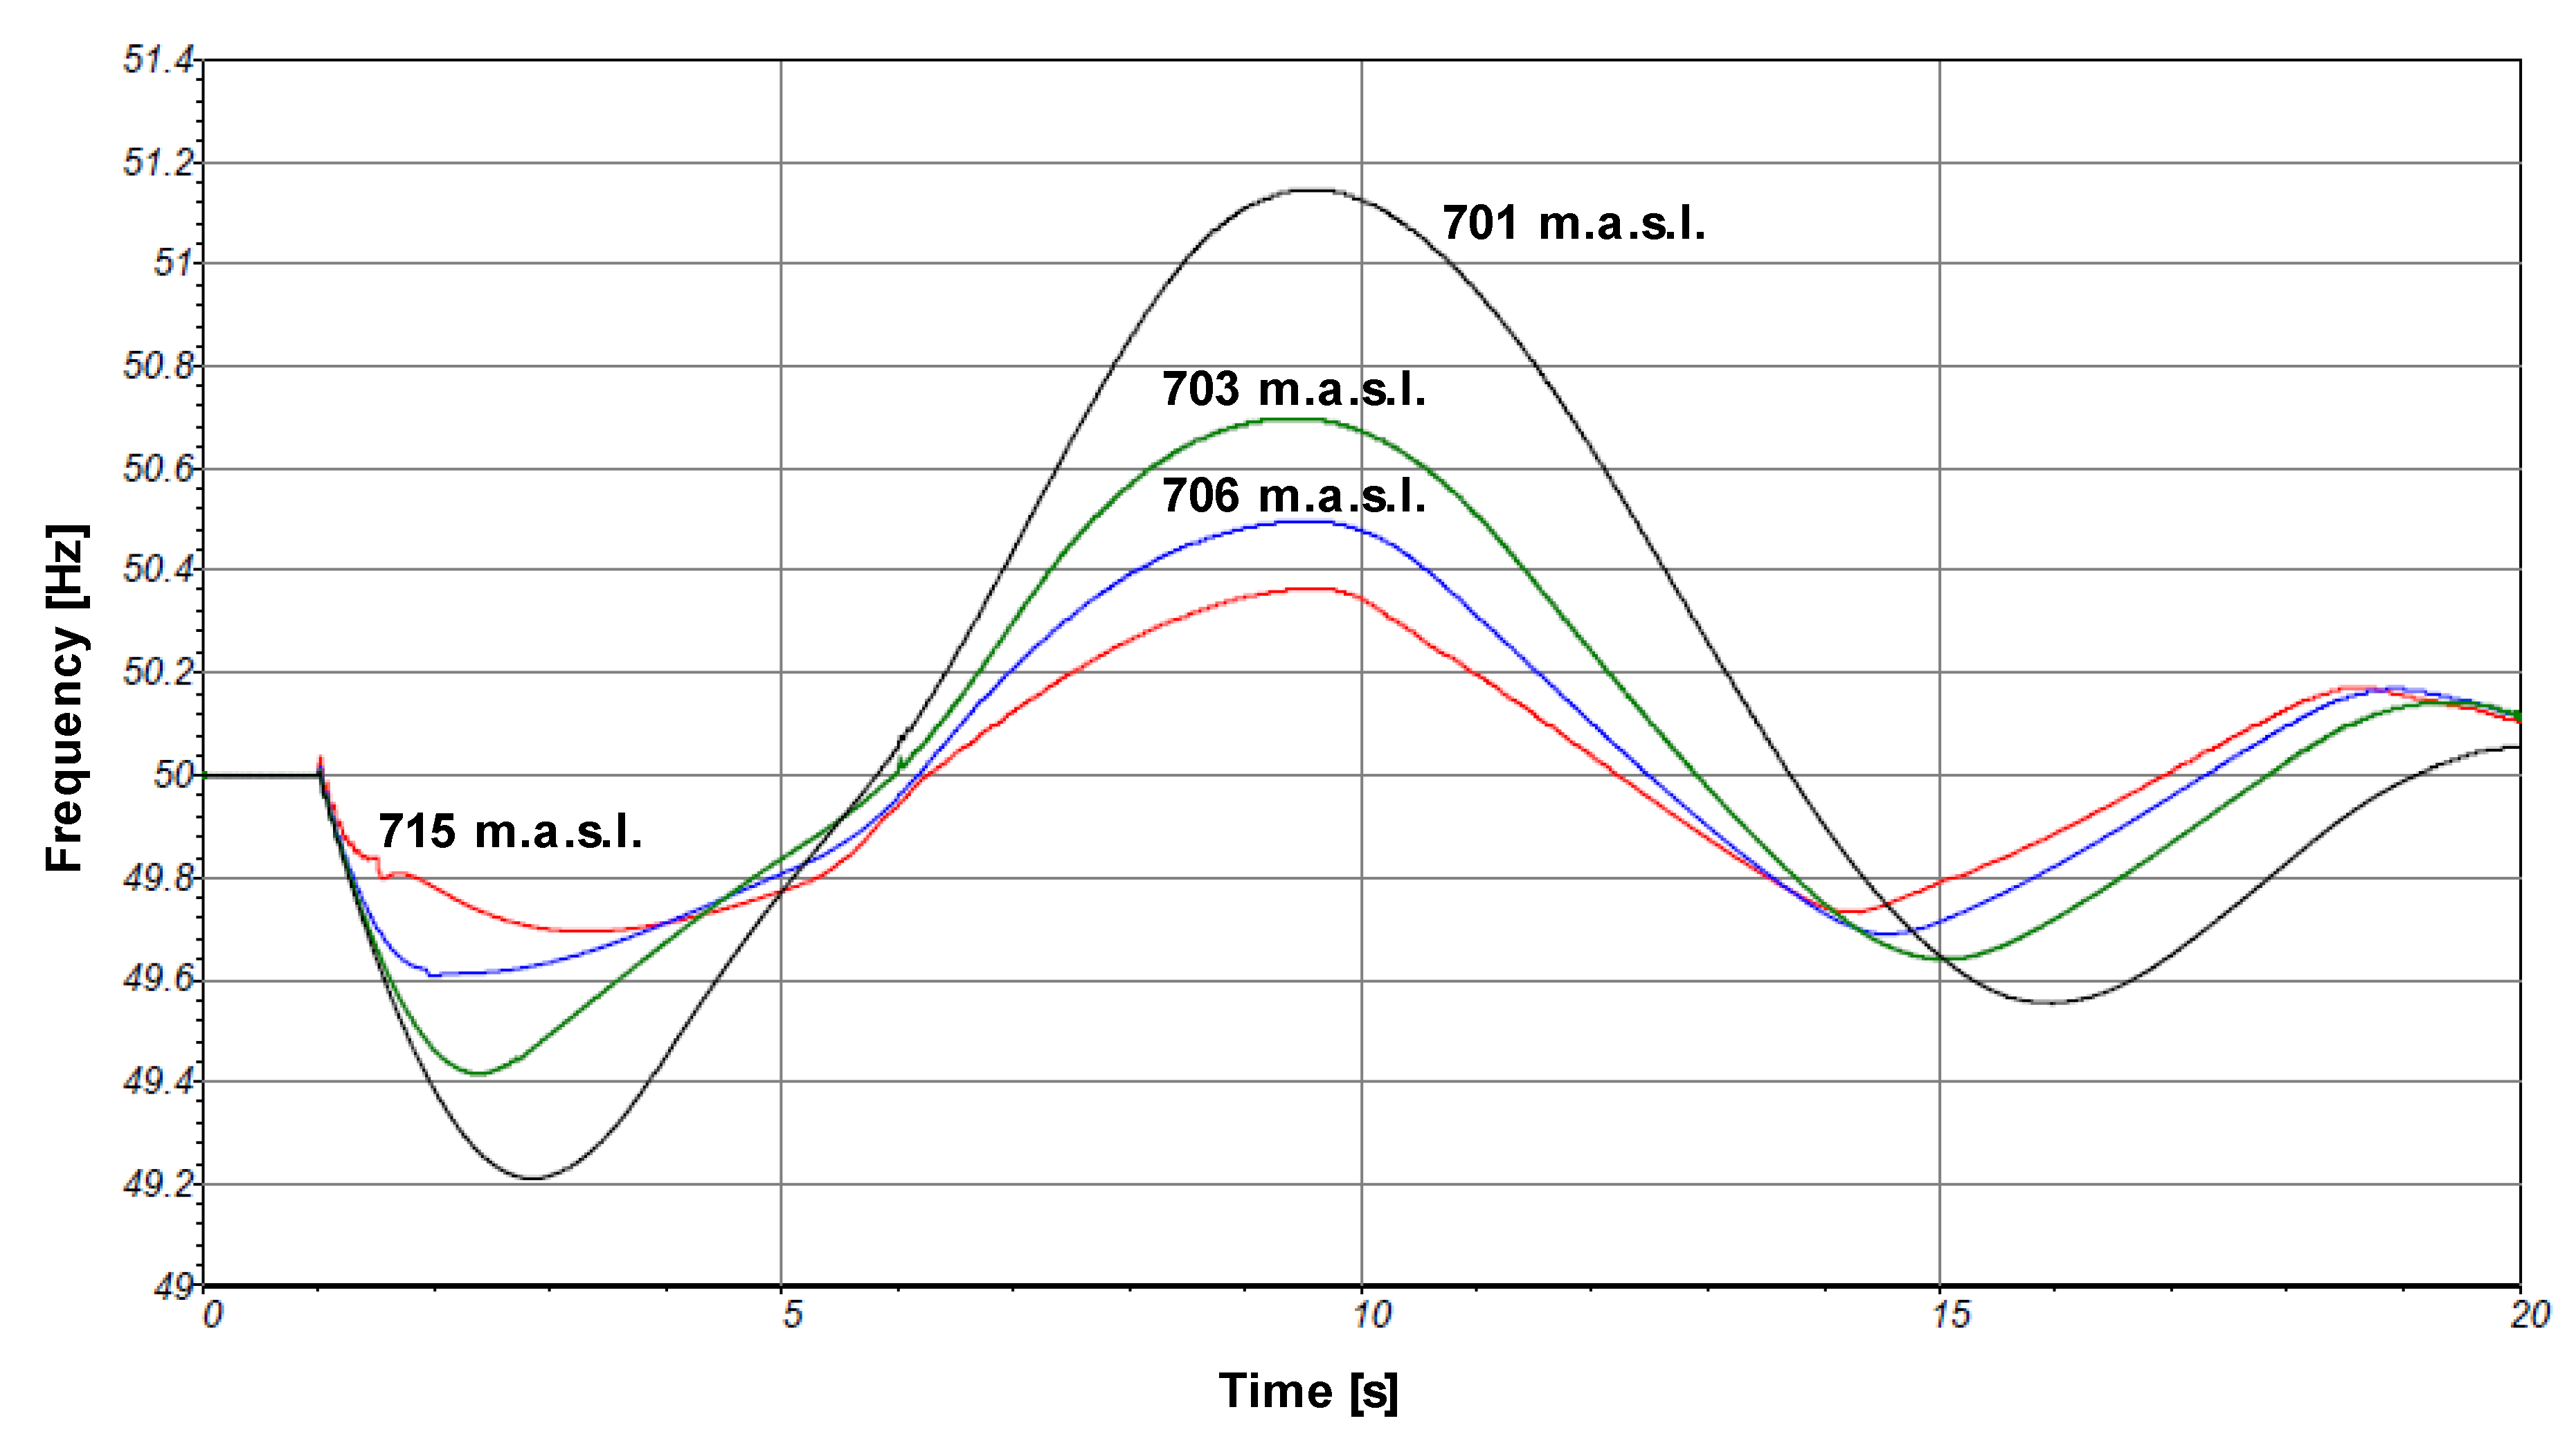
The first action of the governor is to open the injectors as fast as possible, because, as shown in Figure 12, the frequency of the power system decreases sharply (approximately at 1.2 Hz/s). Their opening time is limited to avoid damages in the penstock. The faster the opening time is, the faster turbine mechanical power response would be (
Figure 11), so the frequency of the power system does not fluctuate so much (
Figure 12).
Several seconds later, when the turbines supply greater power than the electrical load demands, the frequency of the power system would increase (
Figure 12) so the governor should reduce the water flowing through the turbines. Regardless of the governor settings, there is a subsequent over-frequency. These frequency oscillations are repeated until the steady state is reached (
Figure 13).
In
Figure 12 and
Figure 13, it can be clearly observed that the impact of the wind generator trip is lower when the hydro generators power ramp is steeper. This reduction of frequency excursions applies to the whole transient and not only to its first moments.
In order to summarize the results of the simulations, it can be concluded that the maximum water level in the upper reservoir corresponds to the injectors’ minimum opening time and to the maximum power ramp. Therefore, a large active power supply by the hydro generators just after the trip makes smoother frequency excursions and reduces the impact of wind power fluctuations.
6. Conclusions
In hydropower plants, power ramps are limited by the negative water hammer that could appear along the penstock. This negative pressure is critical in the upper part of the penstock in which cavitation problems could happen. The level of the upper reservoir has an important role in the developing of this cavitation risk. In fact, its minimum level determines the steepest power ramp permissible.
This paper has presented a method to increase turbines power ramp steepness taking into consideration the current water level in the upper reservoir. In this way, the frequency regulation and the power quality can be improved.
The higher the upper reservoir level is, the steeper the power ramps that could be achieved without cavitation problems are. Steeper power ramps reduce the impact of wind power fluctuations in the power system [
34]. This strategy could be combined with the Pelton no-flow operation [
35,
36]
The Pelton turbines of the Wind-Hydro pumped storage power plant located in El Hierro island, presented in the case study, can operate as synchronous condensers. This mode of operation allows increasing wind power penetration in autonomous power systems, due to a fast power injection. In addition, in this power plant, the presented method for increasing the steepness of available power ramps was tested by means of several computer simulations improving the frequency response of the system.
The simulation results showed that in the case of a wind generator trip, depending on the upper reservoir level, the minimum frequency improved from 49.20 Hz up to 49.70 Hz. Besides, the subsequent over-frequency improved from 51.10 Hz to 50.35 Hz.
According to the Spanish electric system operator (REE) [
37] normal operation means frequency between 49.75 Hz and 50.25 Hz for less than five minutes. Therefore, grid power quality could improve significantly using the proposed technique.
7. Patents
Platero et al., “Sistema y método de control de la rampa de potencia para grupos hidráulicos”, Spanish Patent P201430850, June 3, 2014.
Platero et al., “Control method and system for hydraulic wind farms with pumped accumulation.” Patent PCT/ES2010/070133 (WO2011110698), March 9, 2010.


