1. Introduction
In 2018, installed wind power capacity in Spain increased by 392 MW to reach a total of 23,484 MW, providing 19% of Spanish electricity consumption, and making it the second-largest wind energy producer in the European Union and fifth in the world [
1,
2]. This scenario highlights the resurgence of the Spanish wind energy sector and the renewed promotion of its activities, mainly as a result of the three wind energy auctions carried out in 2016 and 2017. Of the total new wind power capacity, 48.5% was installed in the Canary Islands, since the region offers highly suitable wind resources. Thus, Spain currently has around 1123 wind power plants (WPP) and 23,308 wind turbines (WT) installed, spread across 807 municipalities [
3].
The contribution of wind power to the Spanish energy demand in 2018 was also reflected in terms of financial savings, benefiting particularly industrial consumers. As an example, for an average industrial annual consumption of 1500 MWh, the total saving amounted to approximately 3500 [
3]. In view of the above achievements, the Spanish Wind Energy Association (AEE) is focused on the development and expansion of the wind energy sector in Spain, and its short-term objective is the commissioning, before March 2020, of the wind power auctioned in 2016 and 2017. This will lead to the growth of both the wind energy market and employment, reduction of greenhouse gases and social and economic development, among other important aspects. Moreover, during 2019, 3000 MW of wind power is expected to be installed.
On the basis of the above information, it is clear that wind energy is a key sector in Spain which will acquire even greater importance in the coming years. However, the unpredictable nature of wind poses a challenge in terms of the integration of the new installed wind power capacity into the grid. Voltage and frequency regulation problems may arise, making planning of network operation activities a pressing need. Thus, knowing the behavior of the grid in advance will allow power system operators to be prepared, overcoming potential power supply problems and forecasting the required power compensations from conventional power plants.
In this regard, dynamic simulation of WT [
4] and WPP models representing actual WTs and WPPs connected to the grid is required in order to forecast their active and reactive power responses when subjected to critical situations. Electrical disturbances such as voltage dips are the most important issues, as they cause a voltage reduction of between 10% and 90% and may last up to one minute. In this sense, the Spanish Grid Code developed an Operation Procedure for fault ride-through capability, Operation Procedure 12.3 (PO 12.3), which sets out in detail the response that Spanish WPPs must have under voltage dips. Following a procedure specifically developed for verification, validation and certification (PVVC), the requirements set by PO 12.3 must be complied with by the Spanish WPPs, except for some particular cases. Different adjustments, explained in more detail in
Section 2, must then be carried out in the Spanish WPPs to comply with PO 12.3. WTs in operation must therefore follow specific validation criteria, which involves the estimation of validation errors [
5].
Furthermore, also driven by the need to provide power system operators with dynamic WT and WPP models to analyze grid integration issues, the International Electrotechnical Commission (IEC) published standard IEC 61400-27-1 in 2015, which defined the so-called generic WT dynamic models [
6]. Specifically, four generic WT models are defined, which cover the four main WT typologies currently available in the market. Among them is the generic Type 3 WT model, which represents doubly-fed induction generator (DFIG) WTs. This typology is currently the most widely installed across different countries and, from a technical viewpoint, the most complex one [
7]. To validate the generic Type 3 WT model and, in general, all IEC-developed WTs, they must be compared with field measurements, studying their accuracy and testing their performance. To carry out this work, standard IEC 61400-27-1 issued validation guidelines, on which different studies, mentioned later in this document, are based [
8,
9].
Both the Spanish Grid Code through PO 12.3 and the IEC through standard IEC 61400-27-1 have mapped out the path to be followed in order to regulate the electrical behavior of wind power installations, developing their own validation procedures. However, given that IEC 61400-27-1 is an international standard, and in order to expand the use and scope of application of the originally developed dynamic WT models, this paper submits the generic Type 3 WT, i.e., the DFIG WT, to the requirements of Spanish PO 12.3 on the response of WPP installations in the event of voltage dips, studying its compliance with this grid code. The generic Type 3 WT model is also compared to a detailed model of a DFIG commercial WT, which was previously validated following the PVVC to also comply with the Spanish PO 12.3 [
10]. Therefore, this work will allow us to analyze to what extent generic IEC WT models are able to comply with validation criteria established by a national grid code, and to determine their limitations and, in the case of their failure to comply with these criteria, the reasons.
Other key works on this topic, such as [
10], focus on the compliance of an actual wind farm composed of Gamesa G52 WTs with Spanish PO 12.3, submitting the entire wind farm to the certification procedure, following the PVVC. In [
11], an extension of the work previously performed in [
10] is presented. In this case, instead of submitting the complete wind farm to the certification procedure, different voltage dips were applied to a single Gamesa G52 WT, analyzing its compliance with Spanish PO 12.3. Nevertheless, the present contribution goes a step further, studying, for the first time, the compliance of a generic Type 3 WT model developed by standard IEC 61400-27-1 (recently published in 2015) with a national grid code requirement, Spanish PO 12.3. This allows the scope of application of the standard to be extended, facilitating a more widespread use of the IEC-developed generic WT models. Moreover, this work fully implements of the generic model in MATLAB/Simulink with its subsequent dynamic simulation, which provides evidence for the significant differences of the current work with respect to [
10,
11].
Furthermore, the present work also aims to highlight the strengths and weaknesses of the WT models developed by standard IEC 61400-27-1. On the one hand, for instance, the IEC-developed models are generic enough to represent the wide range of actual WTs developed by different manufacturers. However, on the other hand, given their generic (i.e., simplified) condition, the transient periods of these actual WTs are not accurately represented by the IEC WT models. In this latter case, certain modeling modifications, further detailed in
Section 4, must be implemented in the IEC Type 3 WT model to improve its transient behavior. Moreover, the IEC models are clearly specifically designed to represent the different typologies of actual WTs. Hence, the submission of the generic Type 3 WT model to the Spanish grid code is an intermediary step that will allow the wide range of actual WTs in operation to be more rapidly verified, validated and certified according to PO 12.3, without the need for specific detailed WT simulation models.
The paper is structured as follows:
Section 2 explains the validation procedure that must be followed to comply with the Spanish grid code.
Section 3 presents the WT model studied, which is the Type 3 WT developed by international standard IEC 61400-27-1, while
Section 4 shows the results obtained, comparing field measurements and detailed simulation model with responses obtained from the generic IEC model. Finally,
Section 5 summarizes the main conclusions of the work.
2. Spanish Grid Code and Procedure for Verification, Validation and Certification
Generic WT models developed by IEC 61400-27-1 have been implemented, simulated and validated using field measurements in several scientific contributions, following the IEC validation procedure [
8,
9,
12,
13]. In [
8], a Type 3 WT developed by standard IEC 61400-27-1 was validated using the measurements of a real WT following the IEC guidelines. In [
9], a Type 4 WT was also validated, although this was done according to both IEC and WECC guidelines (WECC is the Western Electricity Coordinating Council, the other International Organization that has defined generic WT models), while [
12] also performed the validation of a generic Type 3 WT according to the IEC Standard. Finally, [
13] performs the validation of a Type 1 WT. Moreover, studies such as [
11], cited in
Section 1, address the validation of a specific-vendor model of DFIG WT following the Spanish grid code, while [
14] is based on the improvement of the response of a simplified mechanical model when submitted to fault-ride through capability requirements. However, to the best of the authors’ knowledge, there are no studies addressing the simulation process of generic WTs to comply with national grid code requirements. Hence, aiming at a more widespread use of these IEC 61400-27-1 models, the DFIG generic model defined by the IEC is compared to the detailed model of a Gamesa G52 commercial WT, which was, in turn, submitted to the operation procedure for fault ride-through capability within the Spanish Grid Code, PO 12.3 [
10]. Furthermore, both the generic and the detailed Type 3 WT models are compared with field measurements, which leads to highly reliable and accurate results. This triple comparison allows the IEC-developed generic WT model to be assessed under different response requirements, thus analyzing its limitations and studying its compliance with the conditions of PO 12.3, based on the PVVC guidelines.
Regarding the development of the PVVC, a specific working group in which WPP owners, WT manufacturers and certification entities and laboratories took part, was created. The corporation that operates the transmission grid in Spain, Red Eléctrica de España, also participated actively in its development. After its completion, this working group was recognized as the technical committee for verification, responsible for monitoring the compliance of WPPs with the Spanish grid code. Hence, based on the active and reactive power responses of WTs, as well as the current reactive ones, which usually define the electrical behavior of the machines during fault and post-fault periods, thus characterizing the fault ride-through capability requirements set by the grid code, the working group developed several editions of the PVVC (the latest released in September 2018). The evolution of the different editions of the PVVC is shown in
Table 1 (note that
is the nominal power of the WT).
It is also worth noting that the Spanish Wind Energy Association (AEE) reported on the problems in adapting the existing WPP installations to the requirements of Spanish national grid code PO 12.3 [
15]. Certification forecasts for WPPs were also reflected in the document. The constraints for complying with the PO 12.3 were mainly found in WPPs consisting of WTs equal to or less than 500 kW rated power, since they had insufficient space in the generator to implement the technical solutions required. Moreover, the potential solutions proposed for these types of WPPs to comply with PO 12.3, such as FACTS (flexible alternating current transmission systems), gave rise to administrative and land problems. Old WTs, the manufacturers of which no longer existed, also gave rise to difficulties when looking for specific technical solutions, and were therefore considered beyond the scope of PO 12.3. In this regard, it was also proposed to exclude WPP installations near the end of their expected lifetimes from the certification process, as further financial investment was meaningless. Singular WTs prototypes or machines located in environmentally sensitive areas were also outside the scope of PO 12.3.
2.1. Certification of WTs and WPPs According to the PVVC
Two verifications must be complied with when assessing the response of WTs and WPPs according to Spanish Grid Code PO 12.3: (i) WPPs must remain connected at the point of common coupling (PCC) during voltage dips, which is related to the correct clearance of short-circuits based on the time/voltage curve defined in the grid code, (ii) active and reactive power consumption at the PCC, in case of balanced and unbalanced faults, must be less or equal to the levels specified in the operation procedure.
According to the PVVC, there are two possible ways to certify and verify the response of a WPP installation, described below [
5]:
Particular procedure. This procedure involves compliance of the WTs with PO 12.3, without the need to submit the whole WPP to the certification procedure. Verified WTs following this certification process are known as `Type Wind Turbines’, i.e., WTs which have an accredited testing report. Indeed, a WPP composed of WTs comparable to Type Wind Turbines, i.e., meeting specific conditions, may be directly certified with no extra field tests required, since these WTs have their corresponding verified types of WTs and comply with the requirements set by the PVVC, presenting a certain behavior during voltage dips.
General procedure. In this case, the simulation of the whole WPP installation is required once the individual WTs and the dynamic compensation systems (FACTS) have been properly tested and their models validated and simulated. For some WT typologies, such as the ones equipped with squirrel cage asynchronous generators, the use of simplified models is allowed, with no additional field tests needed. Moreover, in some cases, the installation of FACTS allows the particular procedure to be conducted. In such situations, the certification entity makes the final decision about the validity of the pertinent accredited report, requiring the general certification procedure to be conducted if necessary.
Drawing on the above, Ref. [
15] showed that, in Spain, out of a total of 388 WPPs, 375 were certified following the particular procedure, 9 using FACTS solutions, while the remaining 13 were certified following the general procedure, also using FACTS. Furthermore, approximately 90% of the WTs had to be submitted to specific design modifications to comply with the voltage dip requirements, enabling or disabling protections so they remained connected to the grid during such situations.
2.2. DFIG WT Validation Procedure According to the PVVC
The present work focuses on the achievement of a more widespread use of the IEC-developed generic Type 3 WT model, in addition to the extension of the scope of its applications. This is done by comparing the performance of the generic Type 3 WT with the field tests conducted in a Gamesa G52 commercial WT, as well as with the responses of its detailed simulation model, which was previously verified according to the PVVC to comply with the Spanish Grid Code PO 12.3 [
10]. It is, therefore, necessary first to highlight the steps followed to verify, validate and certify the Gamesa G52 WT. Hence, as listed in
Section 2.1, two verifications regarding the behavior of WPPs must be complied with according to PO 12.3, and there are two possibilities to certify such compliance with the specified requirements, according to the PVVC. In this particular case, the general verification procedure approach was followed, which consisted of individually validating the WTs and subsequently simulating the WPP by using those validated WT models. As a result, three general steps were followed [
10]: (i) wind turbine testing, (ii) wind turbine model validation, (iii) wind farm simulation. Since the first two steps form the basis of this study, the present work focuses on these, paying particular attention to the WT model validation process.
Based on the flowcharts presented in [
10,
11], once the field tests were conducted following the validity criteria and the equipment specified in the PVVC [
5], and the accredited report was received, the model validation process with the field measurements was performed. To carry out this task, the dynamic simulation of the WT model was required. First, based on the data provided by the field tests and the power calculation methodology described in Section 9.2 of the latest edition of the PVVC (Ed. 11), the active and reactive power, as well as the fundamental harmonic of voltage and current Root Mean Square (RMS) values were calculated. Secondly, a voltage source was implemented, along with the detailed WT simulation model, to accurately reproduce the instantaneous voltage measurements corresponding to the field tests, thus obtaining the same instantaneous variables as those recorded during the tests. The time step set during the simulation must be equal to or less than the time interval corresponding to the sample frequency recorded during the field tests [
5].
Therefore, both the WT simulation model responses and the WT field measurements can then be compared and analyzed. Based on the PVVC validation criteria, a WT model is considered to be validated when the absolute value of the difference between the field tests’ active and reactive power measured values (
) and the active and reactive power simulation values (
) do not exceed the nominal value (
) by 10% in 85% of the data series, (see Equation (
1)). Earlier versions of the PVVC (see
Table 1) also required the RMS fundamental phase voltage and the RMS fundamental phase current to comply with that criterion.
This validation criterion is applied to the generic IEC-developed Type 3 WT model to study its compliance with Spanish grid code PO 12.3. The RMS values of the measured voltage dip were reproduced at the high voltage side of the transformer -implemented along with the generic IEC WT. The results obtained are analyzed in
Section 4.
3. Generic Type 3 Wind Turbine Model Based on Standard IEC 61400-27-1
Based on the current needs of network operators, who must ensure integration of new installed wind power capacity without compromising grid stability, different grid codes have been developed by different countries. Indeed, grid codes were compared and assessed in works such as [
16]. However, the European Network of Transmission System Operators for Electricity (ENTSO-E), the aim of which is the regulation of the electricity market in European countries, underlined the need to standardize the technical requirements demanded by the different grid codes. Moreover, some grid codes also included the technical requirements to be complied with by WT and WPP models. In this regard, and with the objective of unifying the technical procedures to assess wind power integration in the grid, the IEC began developing generic, also known as standard, dynamic WT models in October 2009. The tasks conducted resulted in two different parts of standard IEC 61400-27, Part 1 and Part 2, based on the development and validation procedure of the WT and WPP models, respectively. The working group continued the development process with the Final Draft International Standard (FDIS) being issued in 2014, and published one year later, in February 2015. However, the initial structure of the standard was later modified, finally resulting in two different editions: Ed. 1, involving both the WT and the WPP models, and Ed. 2, currently under development, and including their validation procedures.
Regarding WT technologies, Type 3 WT, i.e., the DFIG WT, is the most advanced and currently most widespread model across different countries. It consists of a doubly-fed induction generator with the stator directly connected to the grid and the rotor connected through a back-to-back power converter [
17,
18]. The IEC-developed Type 3 WT model [
6] can be further divided into two sub-models, depending on the generator system implemented: Type 3A and Type 3B. The output signal of both generator systems is a current injected through a current source with parallel impedance, neglecting losses in the generator as the generator air gap power is equal to the power measured at the WT terminals. The main difference lies in the protection system, modeled through a set of dynamic blocks in the case of generic Type 3B WT. Internally, at simulation level, the Type 3B protection system decreases to zero both the active and reactive current signals from the active and reactive control models, respectively, when the voltage differential is above a specific threshold. This whole set of dynamic blocks representing the protection system is therefore not modeled in the case of generic Type 3A WT [
6].
In line with the above, since the Gamesa G52 Commercial WT has a break chopper protection, the main function of which is to burn the excess energy to avoid the DC bus voltage increasing outside the set limits, the detailed DFIG WT model simulated using the PSCAD/EMTDC software tool also has a break chopper protection, as it must be capable of representing the fault-ride through capability of the actual WT. Regarding the generic IEC WT, the Type 3A model, which has no specific protection system included, was implemented. This is because, on the one hand, this model is able to control the voltage during the fault and, on the other hand, IEC Type 3B WT is only used to represent actual WTs equipped with active crowbar protection systems [
19].
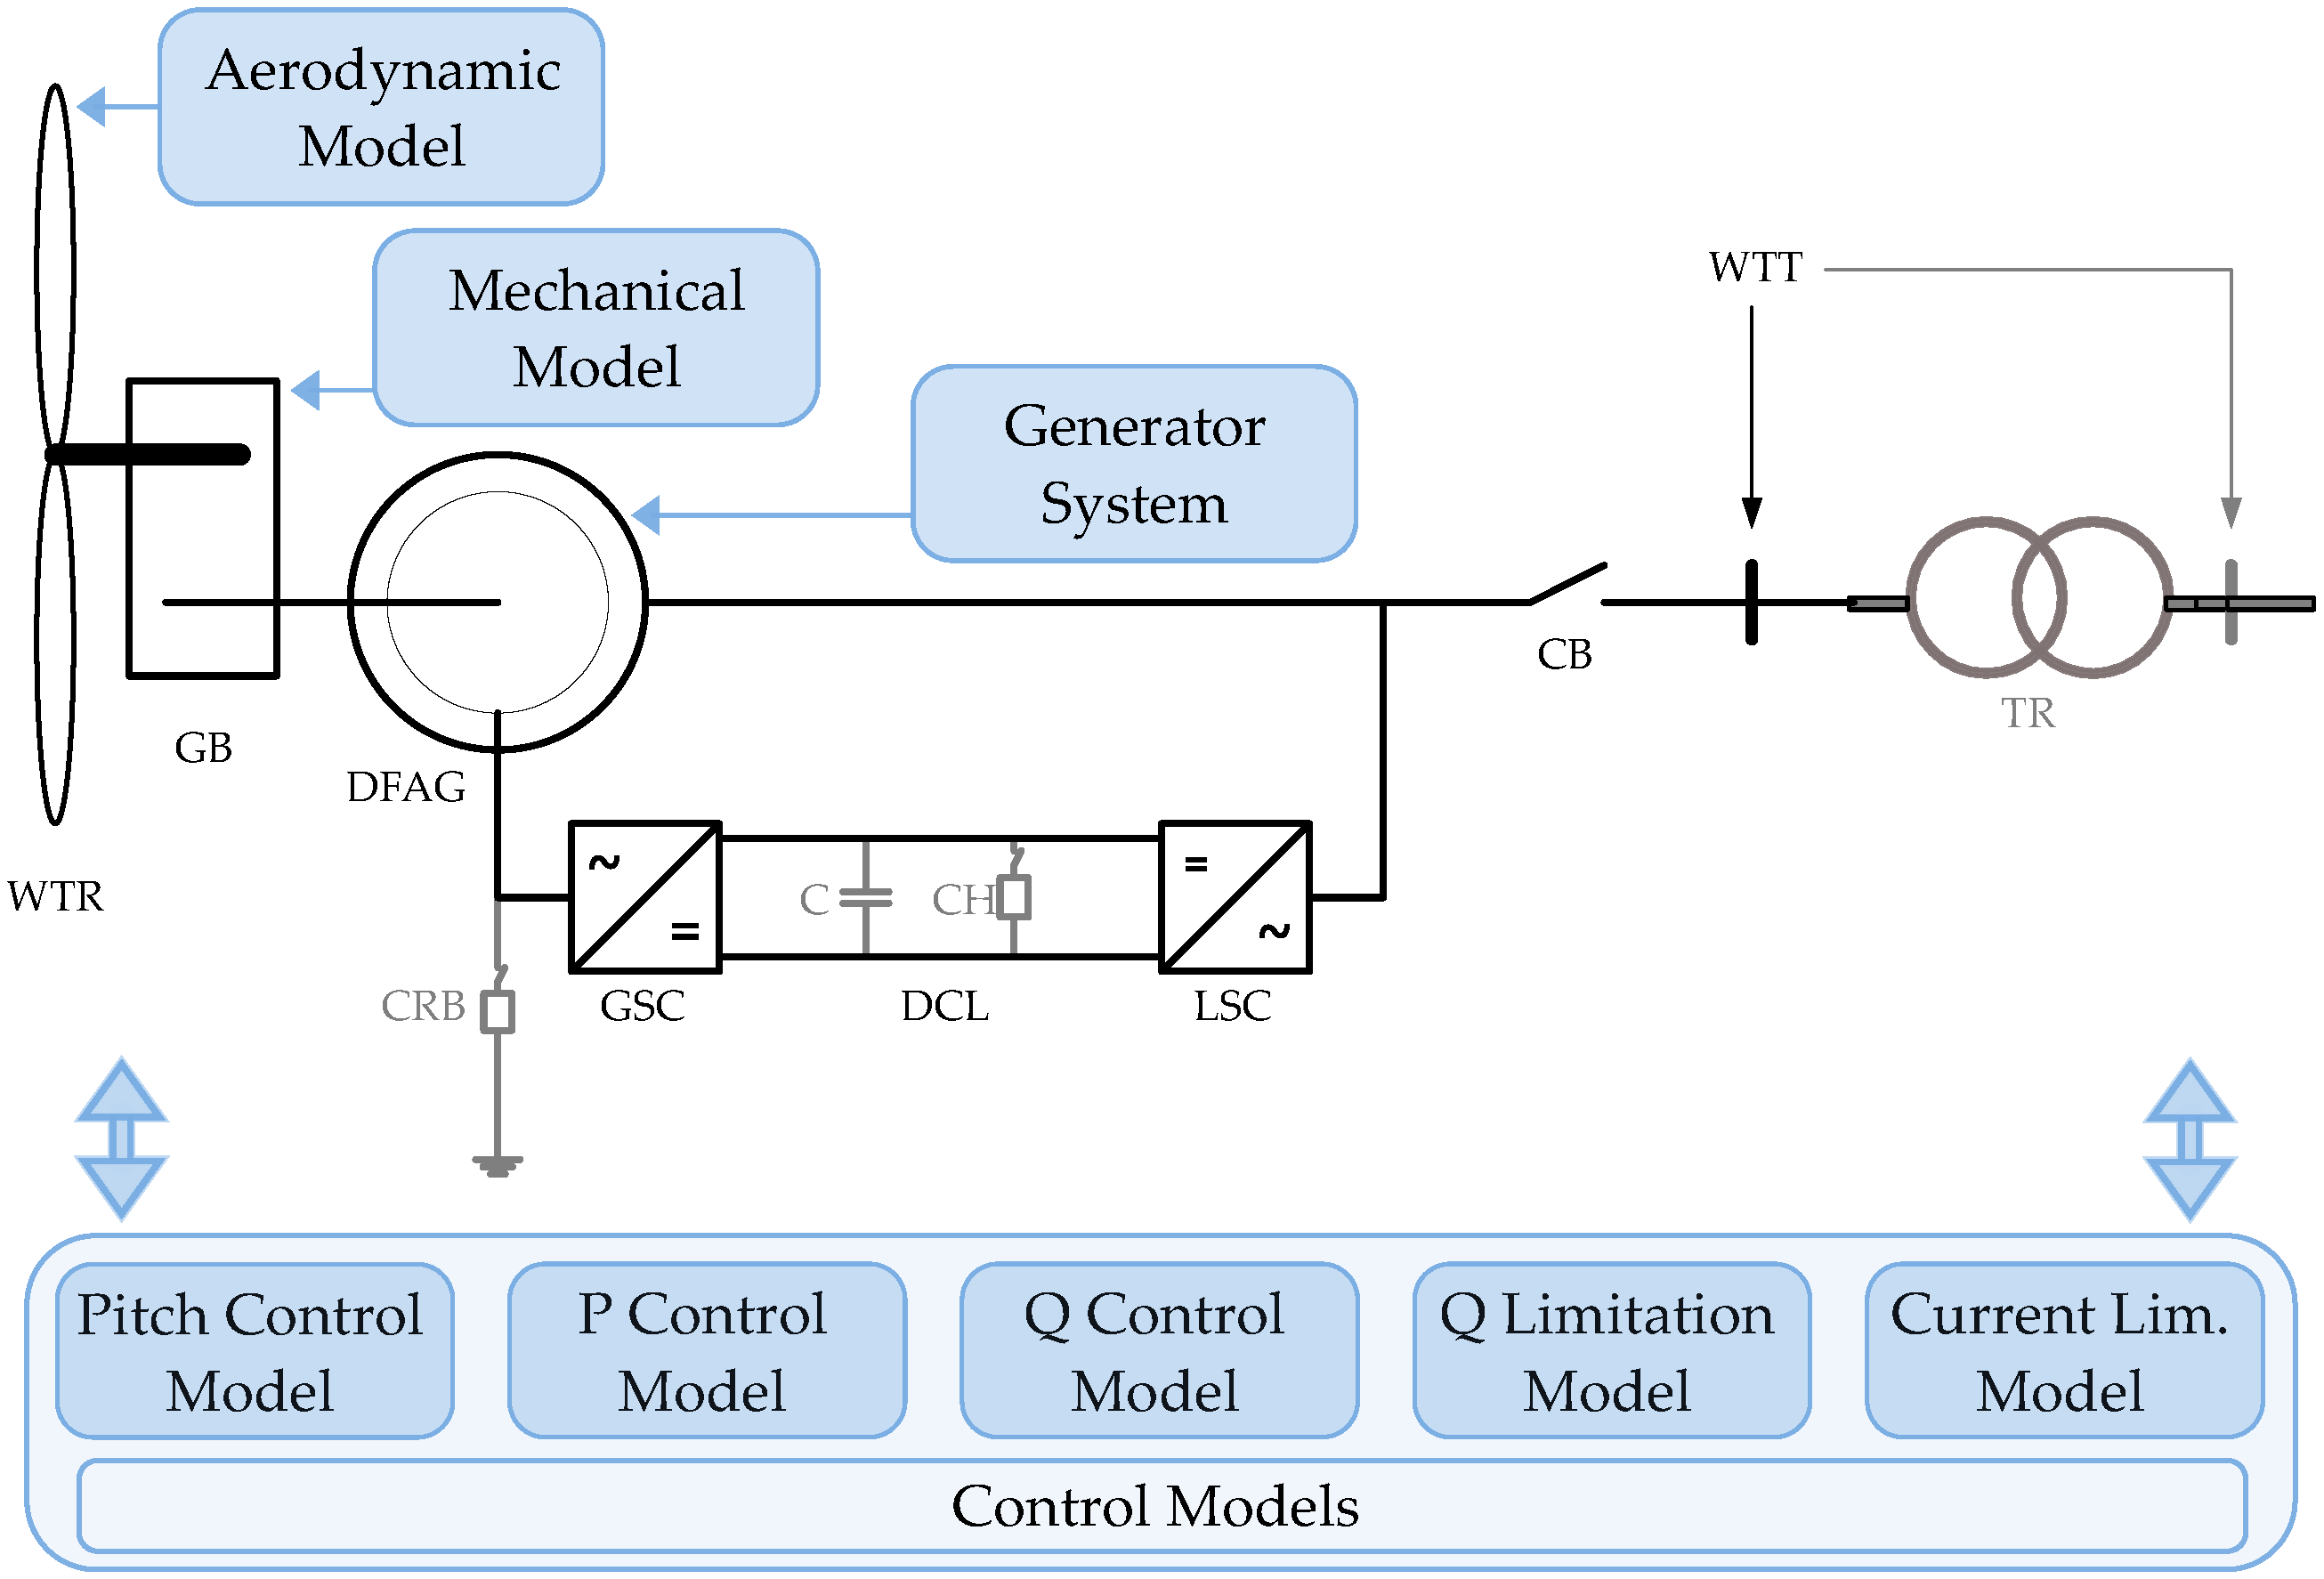
Figure 1 shows a schematic representation of generic Type 3 WT and its control models [
20]:
aerodynamic model, representing the wind turbine rotor (WTR) and providing the value of the wind aerodynamic power; two-mass
mechanical model, representing both the low and high speed sides of the gear box (GB);
generator system, which provides the values of the active and reactive current injected into the grid and represents the doubly-fed asynchronous (or induction) generator (DFAG);
pitch control model, which adjusts the position of the WT blades through calculation of their pitch angle;
active power control model (P Control Model), the main output of which is the active current command;
reactive power control model (Q Control Model), which provides, based on the reactive power reference, the reactive current command;
reactive current limitation model (Q Limitation Model), which calculates the maximum and minimum reactive power allowed; and
current limitation model, which provides the active and reactive current’s limit values. Moreover, the power converter, also shown in
Figure 1, consists of the generator side converter (GSC), the direct current link (DCL), the DC capacitor (C), the chopper protection system (CH) and, lastly, the line side converter (LSC). In addition, as mentioned above, some Type 3 WTs include a crowbar protection system (CBR). Finally, the wind turbine terminals (WTT) are connected to the grid through a transformer (TR), and the circuit breaker (CB) may disconnect the WT from the network. The way in which the control models are related to each other may be seen in [
6] in more detail.
As will be explained in greater depth in
Section 4, the voltage dips were applied to the high voltage side of the WT transformer, so that one of the measurement points to apply the PVVC validation criteria coincides with the testing point. In this way, detailed and generic WTs must also include their transformer models. In the case of generic IEC WT, the transformer model is simulated as an impedance [
6,
10].
4. Results
The voltage dip was first applied on the actual Gamesa G52 WT, the technical specifications of which are shown in
Table 2, and measurements were recorded, thus obtaining the positive-sequence values of active and reactive power. The measured voltage dip was then reproduced on both the detailed and the generic WT simulation models. Undoubtedly, the accuracy in the voltage dip’s reproduction would affect the accuracy of the models’ responses, particularly at the beginning and clearance of the fault. At simulation level, whereas older PVVC editions required the modeling of the physical test bench and the network to reproduce the voltage dip applied, the latest versions establish that a voltage-dependent source is required, setting the time series of data measured as the input signal to the voltage source, thus delivering exactly the same voltage values (see
Table 1). This is currently the so-called play-back validation approach [
21], which enables an accurate reproduction of the measured voltage dip [
22], obtaining highly reliable results.
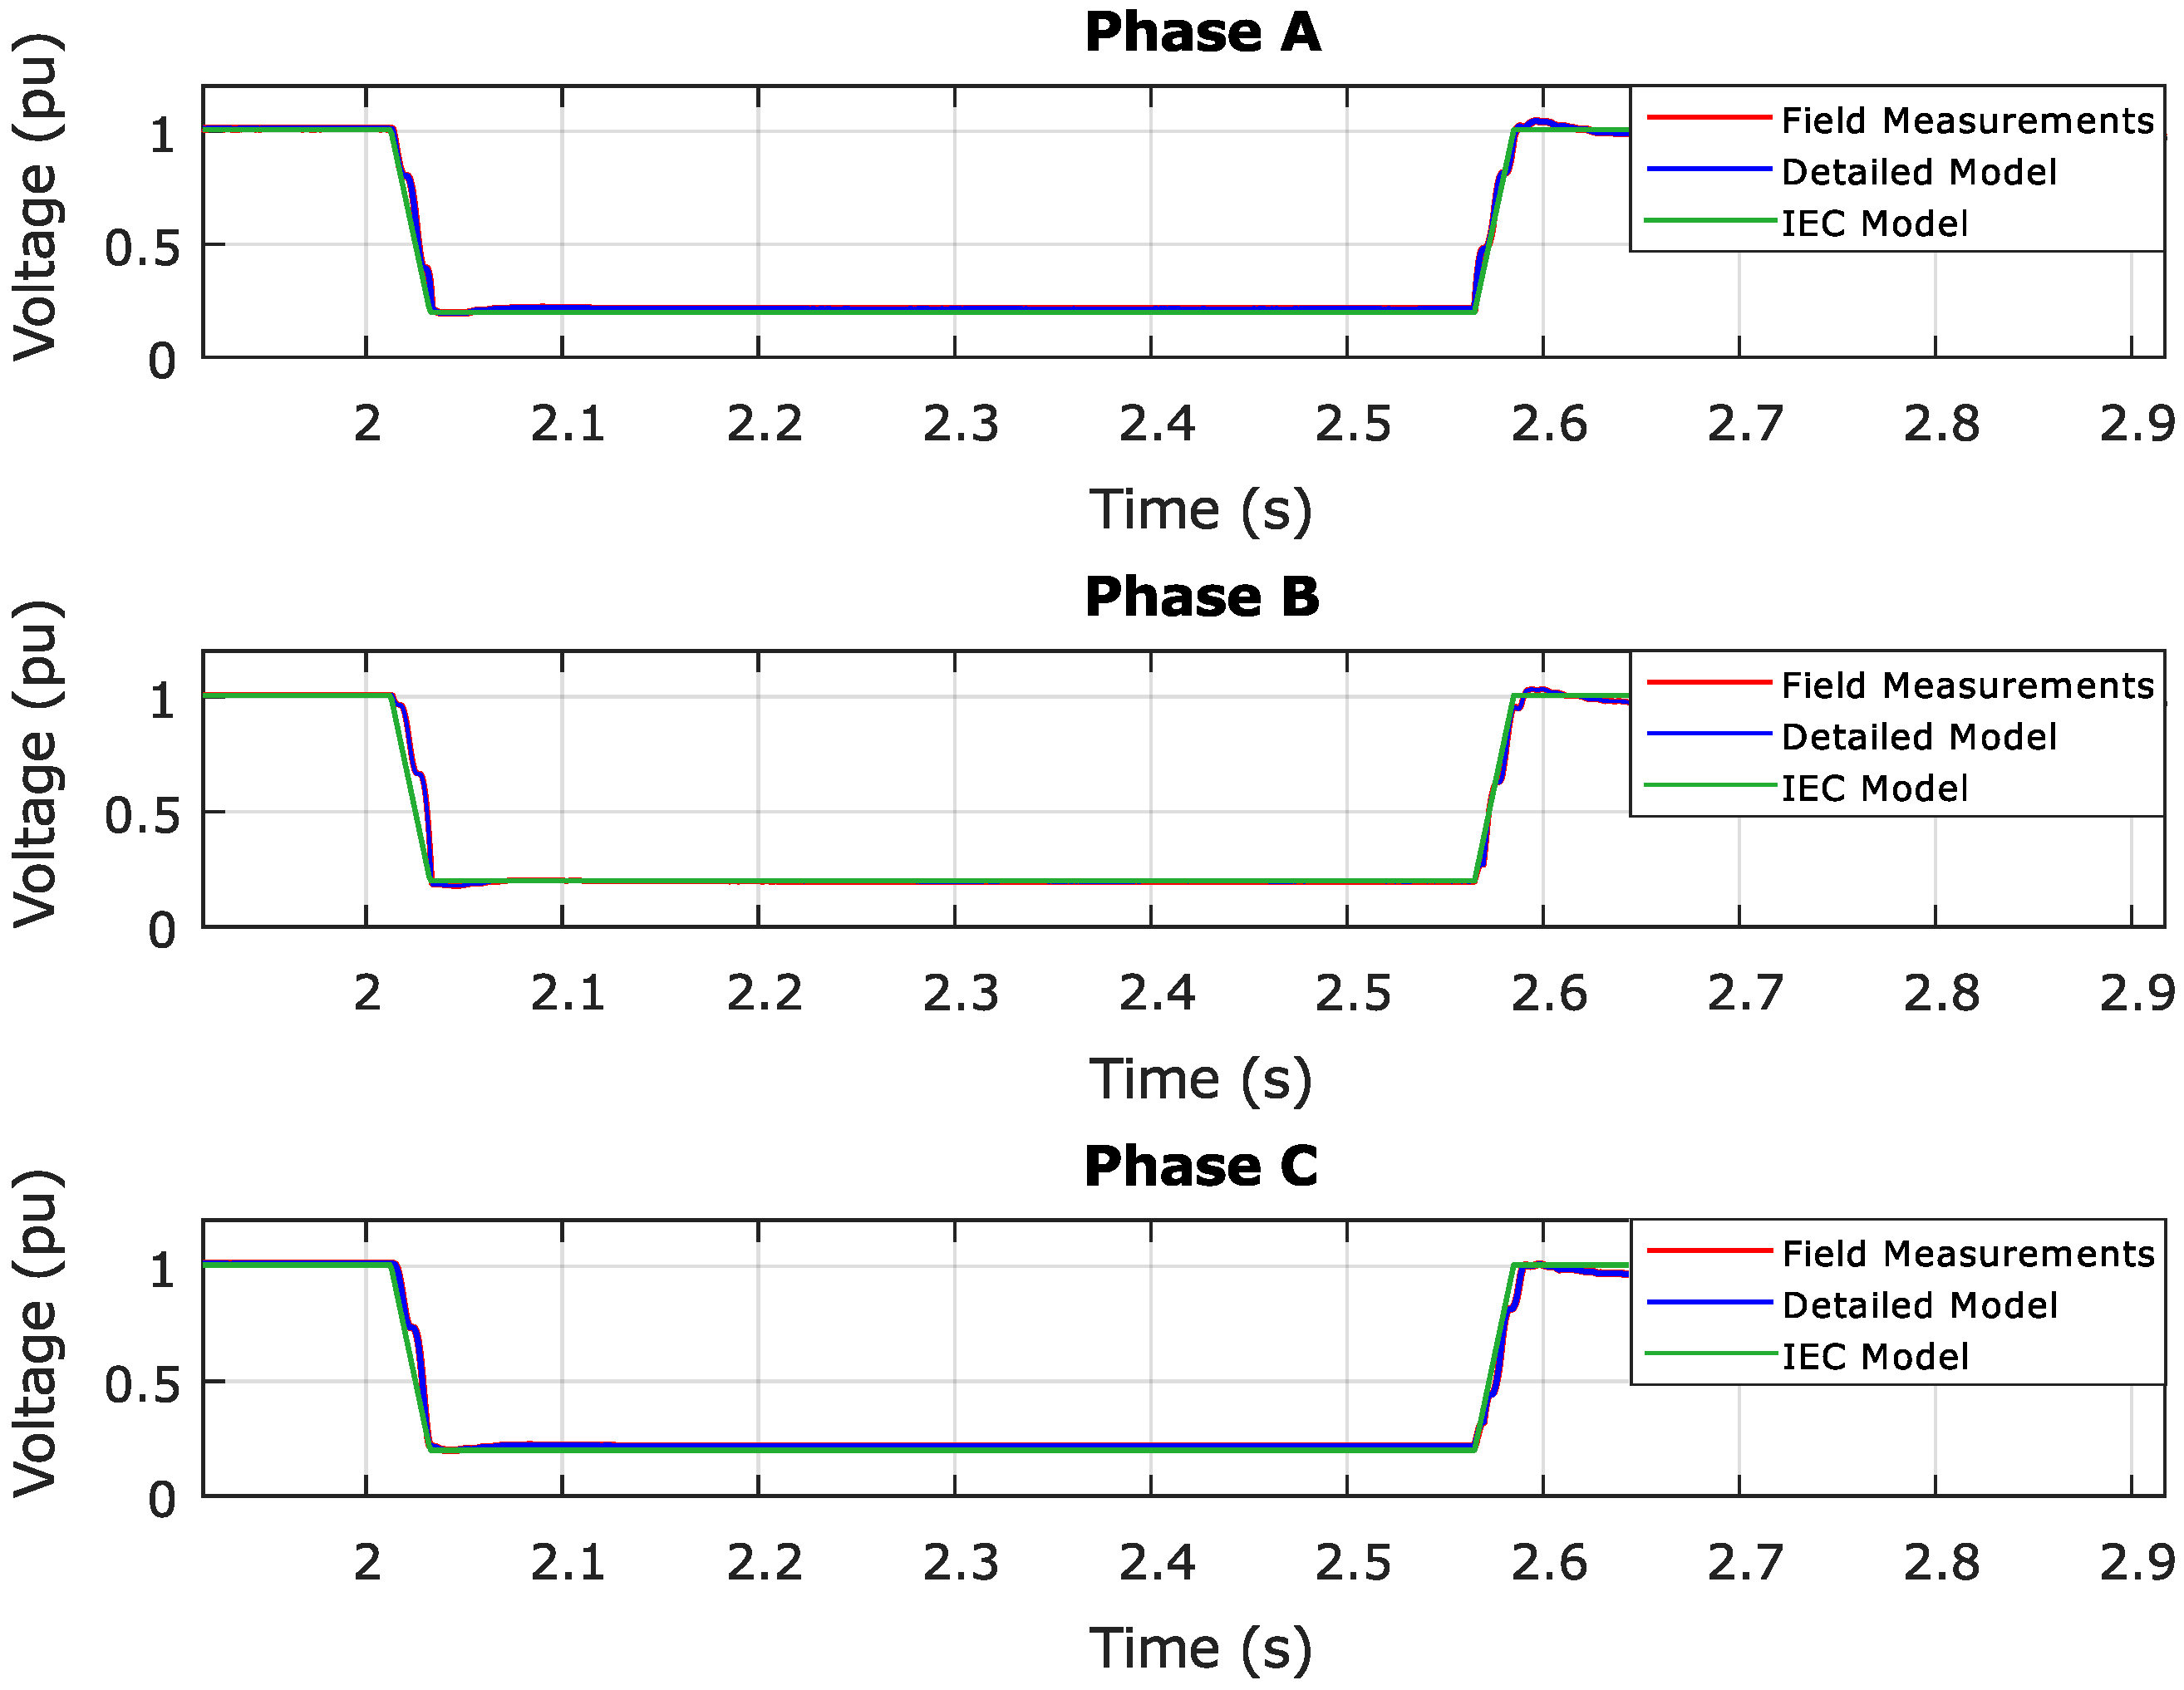
Both simulation WT models (manufacturer detailed and generic IEC) are therefore submitted to the measured voltage dip, shown in
Figure 2, the residual voltage of which is: (i) 19.66% for phase A; (ii) 17.75% for phase B; (iii) 19.91% for phase C. The duration is 0.5705 s. The faults thus fully comply with the characteristics established by the PVVC in the case of three-phase voltage dips, as the residual voltage must be equal to or less than 20% plus the voltage tolerance (+3%), and the dip duration must be higher than, or equal to, 500 ms minus the time tolerance (50 ms) [
5]. On the other hand, the time steps used for simulation are 10.024 μs in the case of the detailed model implemented in PSCAD/EMTDC and 1 ms for the generic Type 3 WT modeled in MATLAB/Simulink.
Furthermore, according to
Figure 2, which represents the field measurements of the voltage dip and the fault data once applied in both the detailed and generic WT simulation models, it can be stated that the three data series match well and that, therefore, reproduction of the measured voltage in the dynamic simulation models has been performed adequately.
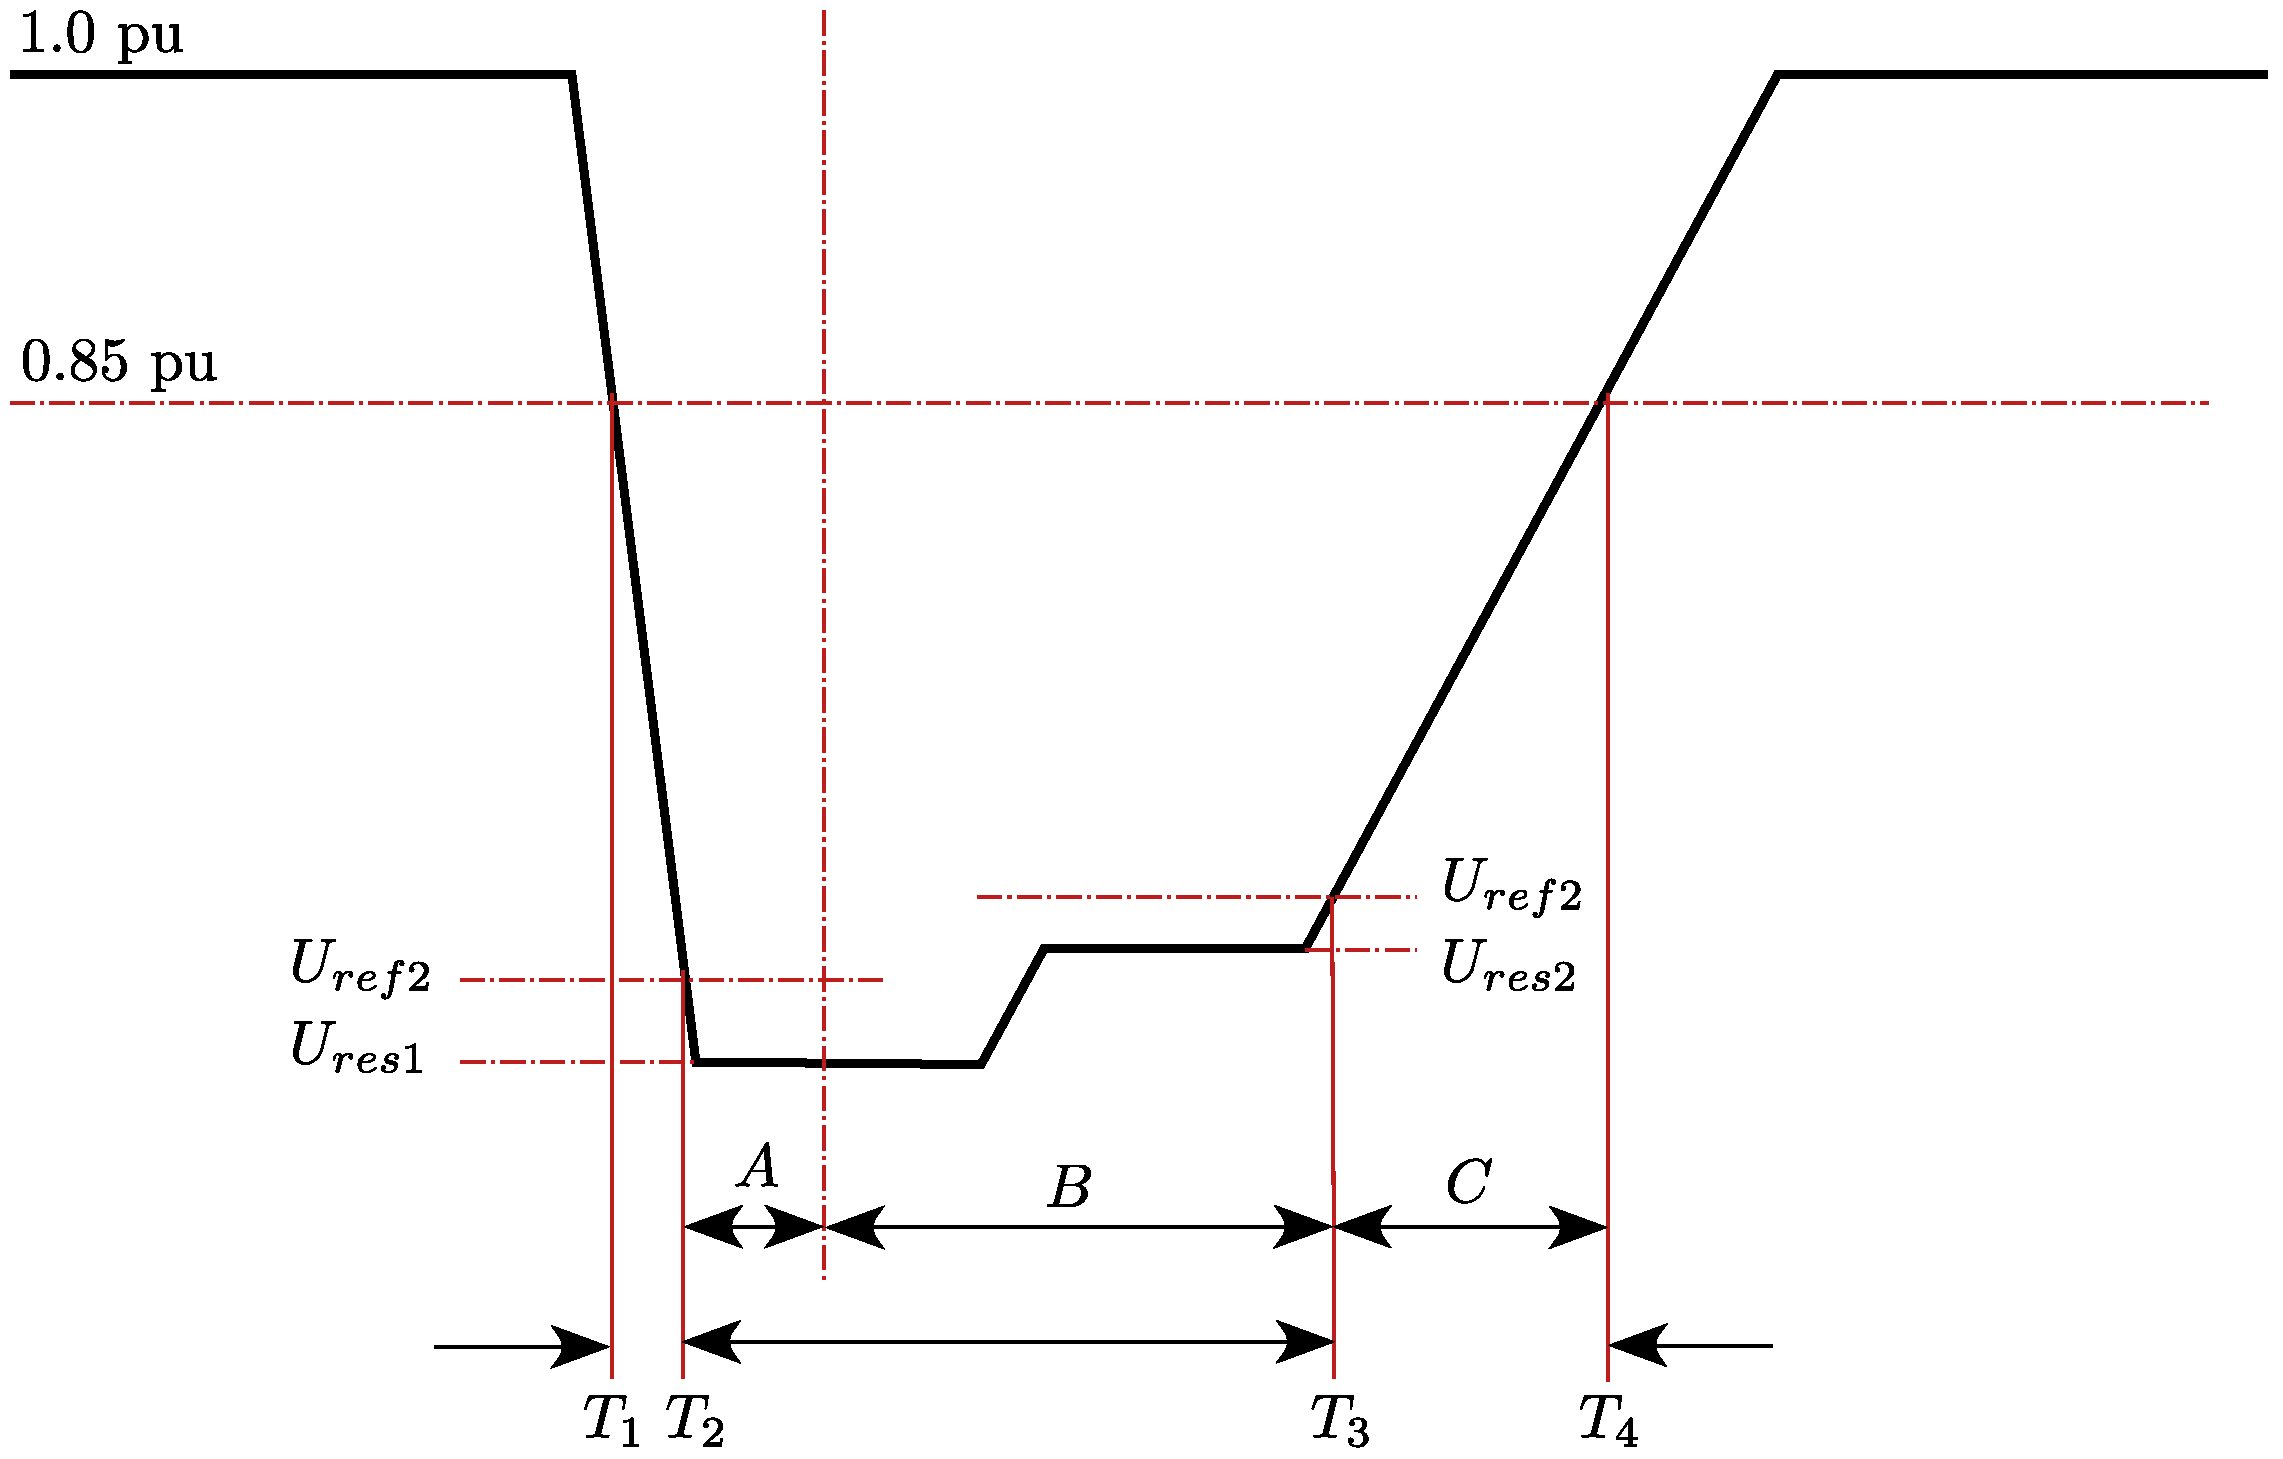
The duration of the comparison window for the application of the validation criteria is 1000 ms, starting 100 ms before the beginning of the fault. On the basis of the information depicted in
Figure 3, this 1000 ms time interval starts at [
− 100 ms] and lasts until [
+ 900 ms].
indicates the time when the fault occurs at one of the phases for the first time, as the voltage drops below the specific threshold (0.85 pu, also shown in
Figure 3).
indicates the time when the deepest part of the voltage dip starts (taking into consideration both the reference and residual voltage parameters,
and
, see [
5]).
indicates the end of the voltage dip’s deepest part, and depends on
and
. Finally,
is the instant in which the voltage at the three phases is recovered, already above the threshold (0.85 pu).
The validation criteria are therefore applied to the data series obtained over that time interval. As mentioned in
Section 2.2, the difference in both three-phase active and reactive powers between measured and simulated data should not exceed 10% for at least 85% of the data series considered. However, to apply this criterion correctly, it is necessary to know the test conditions. In other words, it is necessary to know which measurement and testing points have been considered.
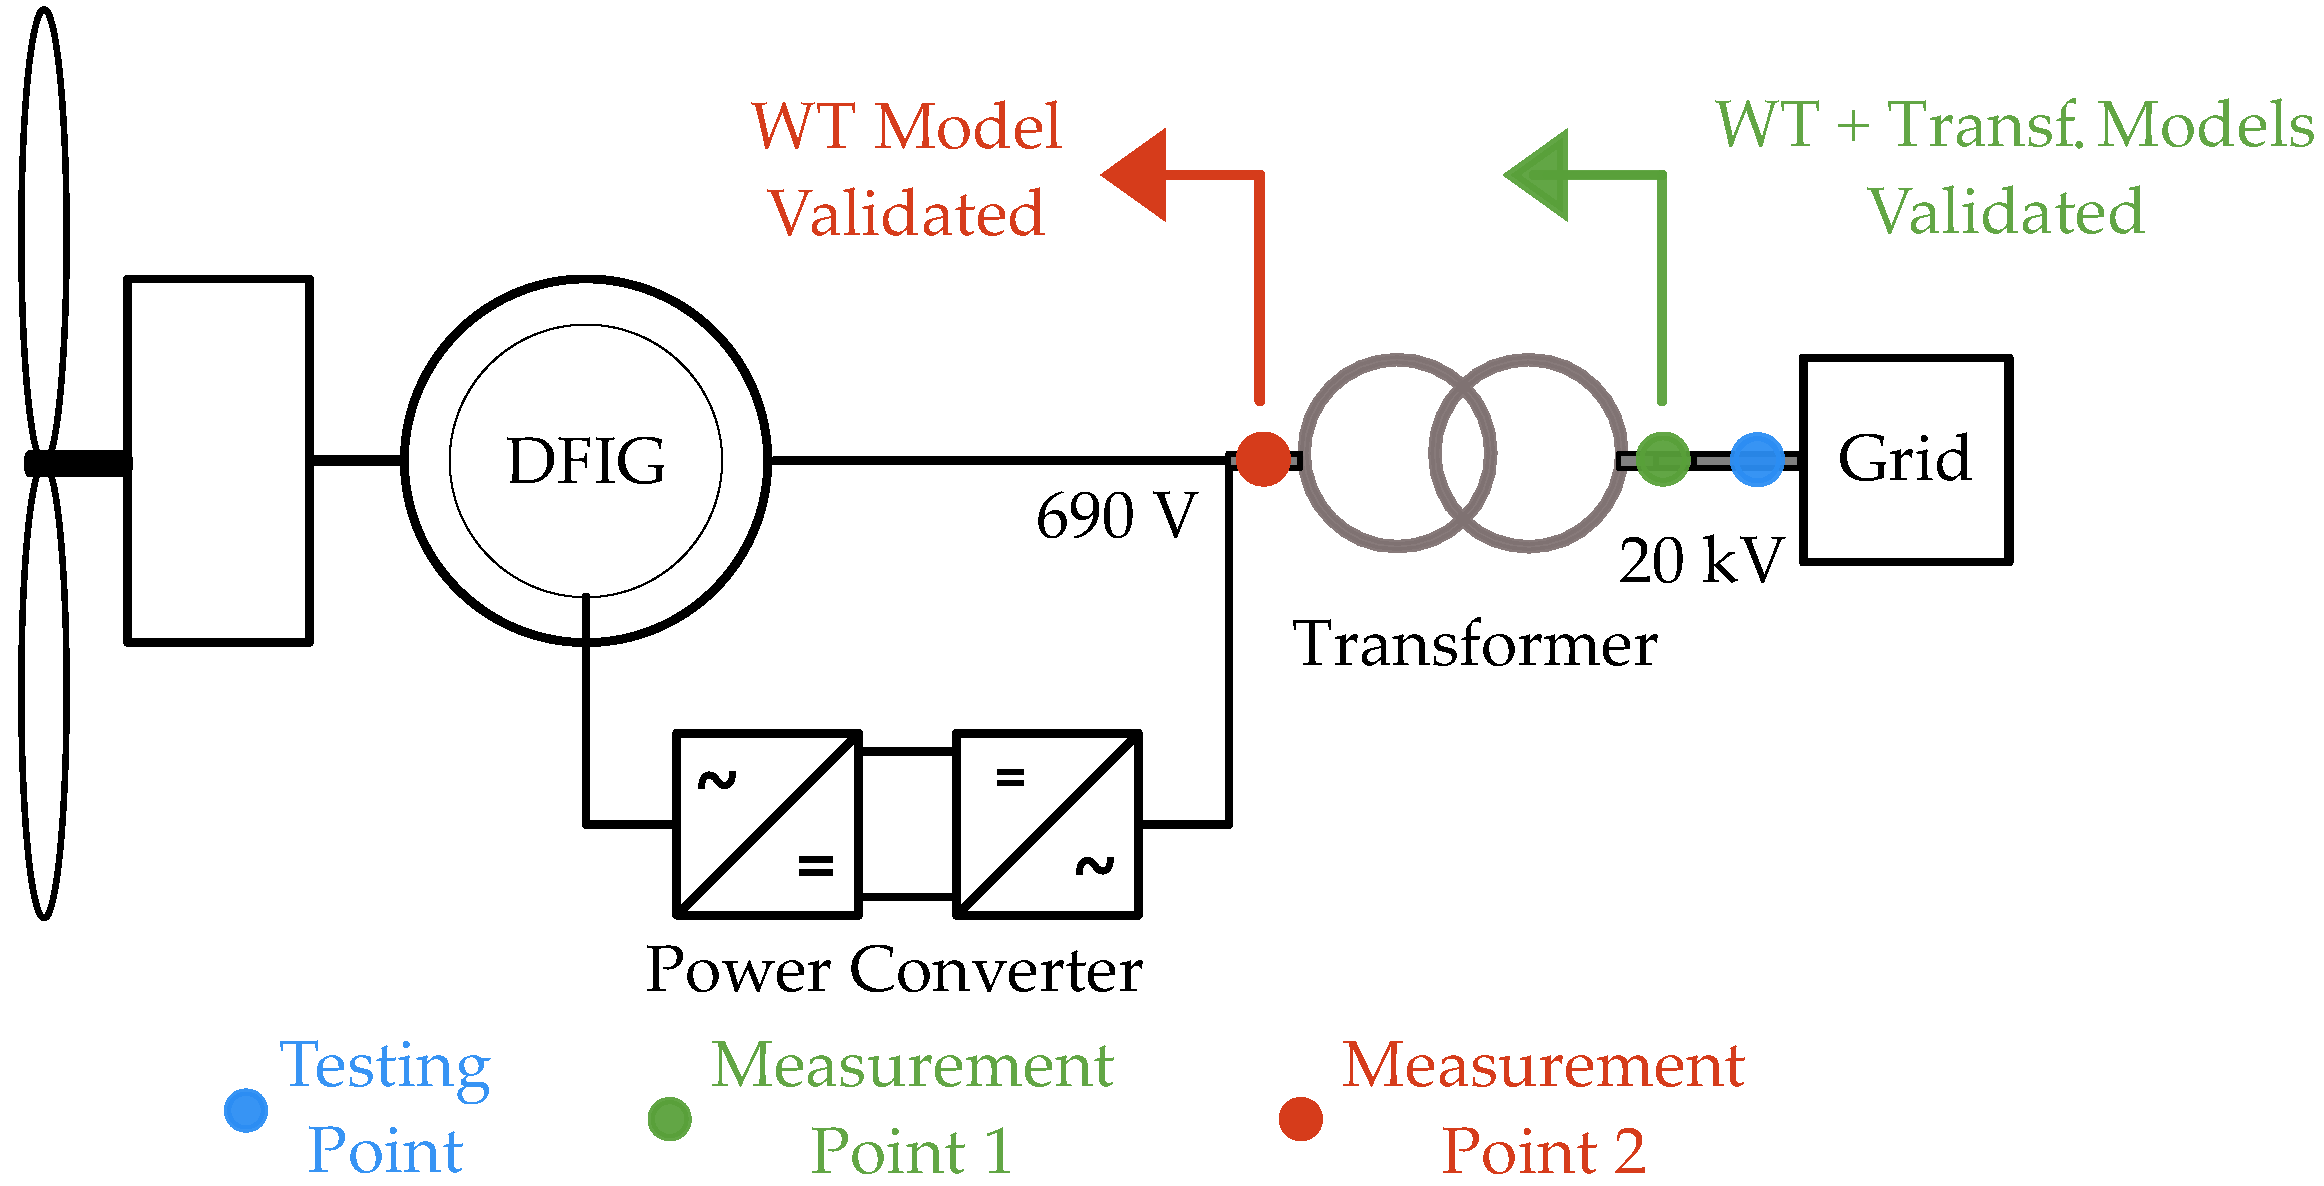
In the case of WT model validation processes, the measurement point may coincide with the testing point, i.e., with the point at which voltage dips are applied in the actual WT by the voltage dip generator. It is important to note that the dynamic WT model to be validated will comprise all the elements downstream from the measurement point. For instance, in the case that measurement and testing points coincide, both located upstream from the transformer, the transformer and the WT model itself will be considered as validated. If, on the other hand, the testing point is located at the high voltage side of the transformer and the WT model’s measurement point is at the low voltage side, only the WT model will be considered as validated. This is explained graphically in
Figure 4.
In the present case, the testing point, i.e., the point in which the voltage dip generator is connected, is located at the high voltage side of the transformer, while two different measurement points were considered and therefore two verification procedures were performed, both in the high and low voltage sides. The WT transformer has a transformation ratio of 20 kV/690 V, as indicated in
Figure 4.
Based on the information given in
Section 2.2, 1 pu is considered as the rated value to apply the PVVC criteria. Hence, 0.1 pu is the maximum deviation allowed for at least 85% of the points within the data series to be compared.
Table 3,
Table 4 and
Table 5 in
Section 4.1 and
Section 4.2 respectively, estimate these validation parameters, in addition to the percentage of points that comply with this criterion and have a maximum deviation below 0.1 pu.
In this case, the WT is operating under full load conditions of approximately 0.93 pu, also complying with the criteria established by the PVVC (full load test, ≥80%
, see
Table 1).
4.1. PVVC Criteria Applied at the Testing Point: 20 kV, Measurement Point 1
On the one hand,
Table 3 presents the IEC model’s results for the PVVC criteria applied at the testing point, i.e., at the 20 kV voltage side, which is the so-called
measurement point 1 according to
Figure 4. As testing and measurement points coincide in this case, validation results will affect both the transformer and the WT models.
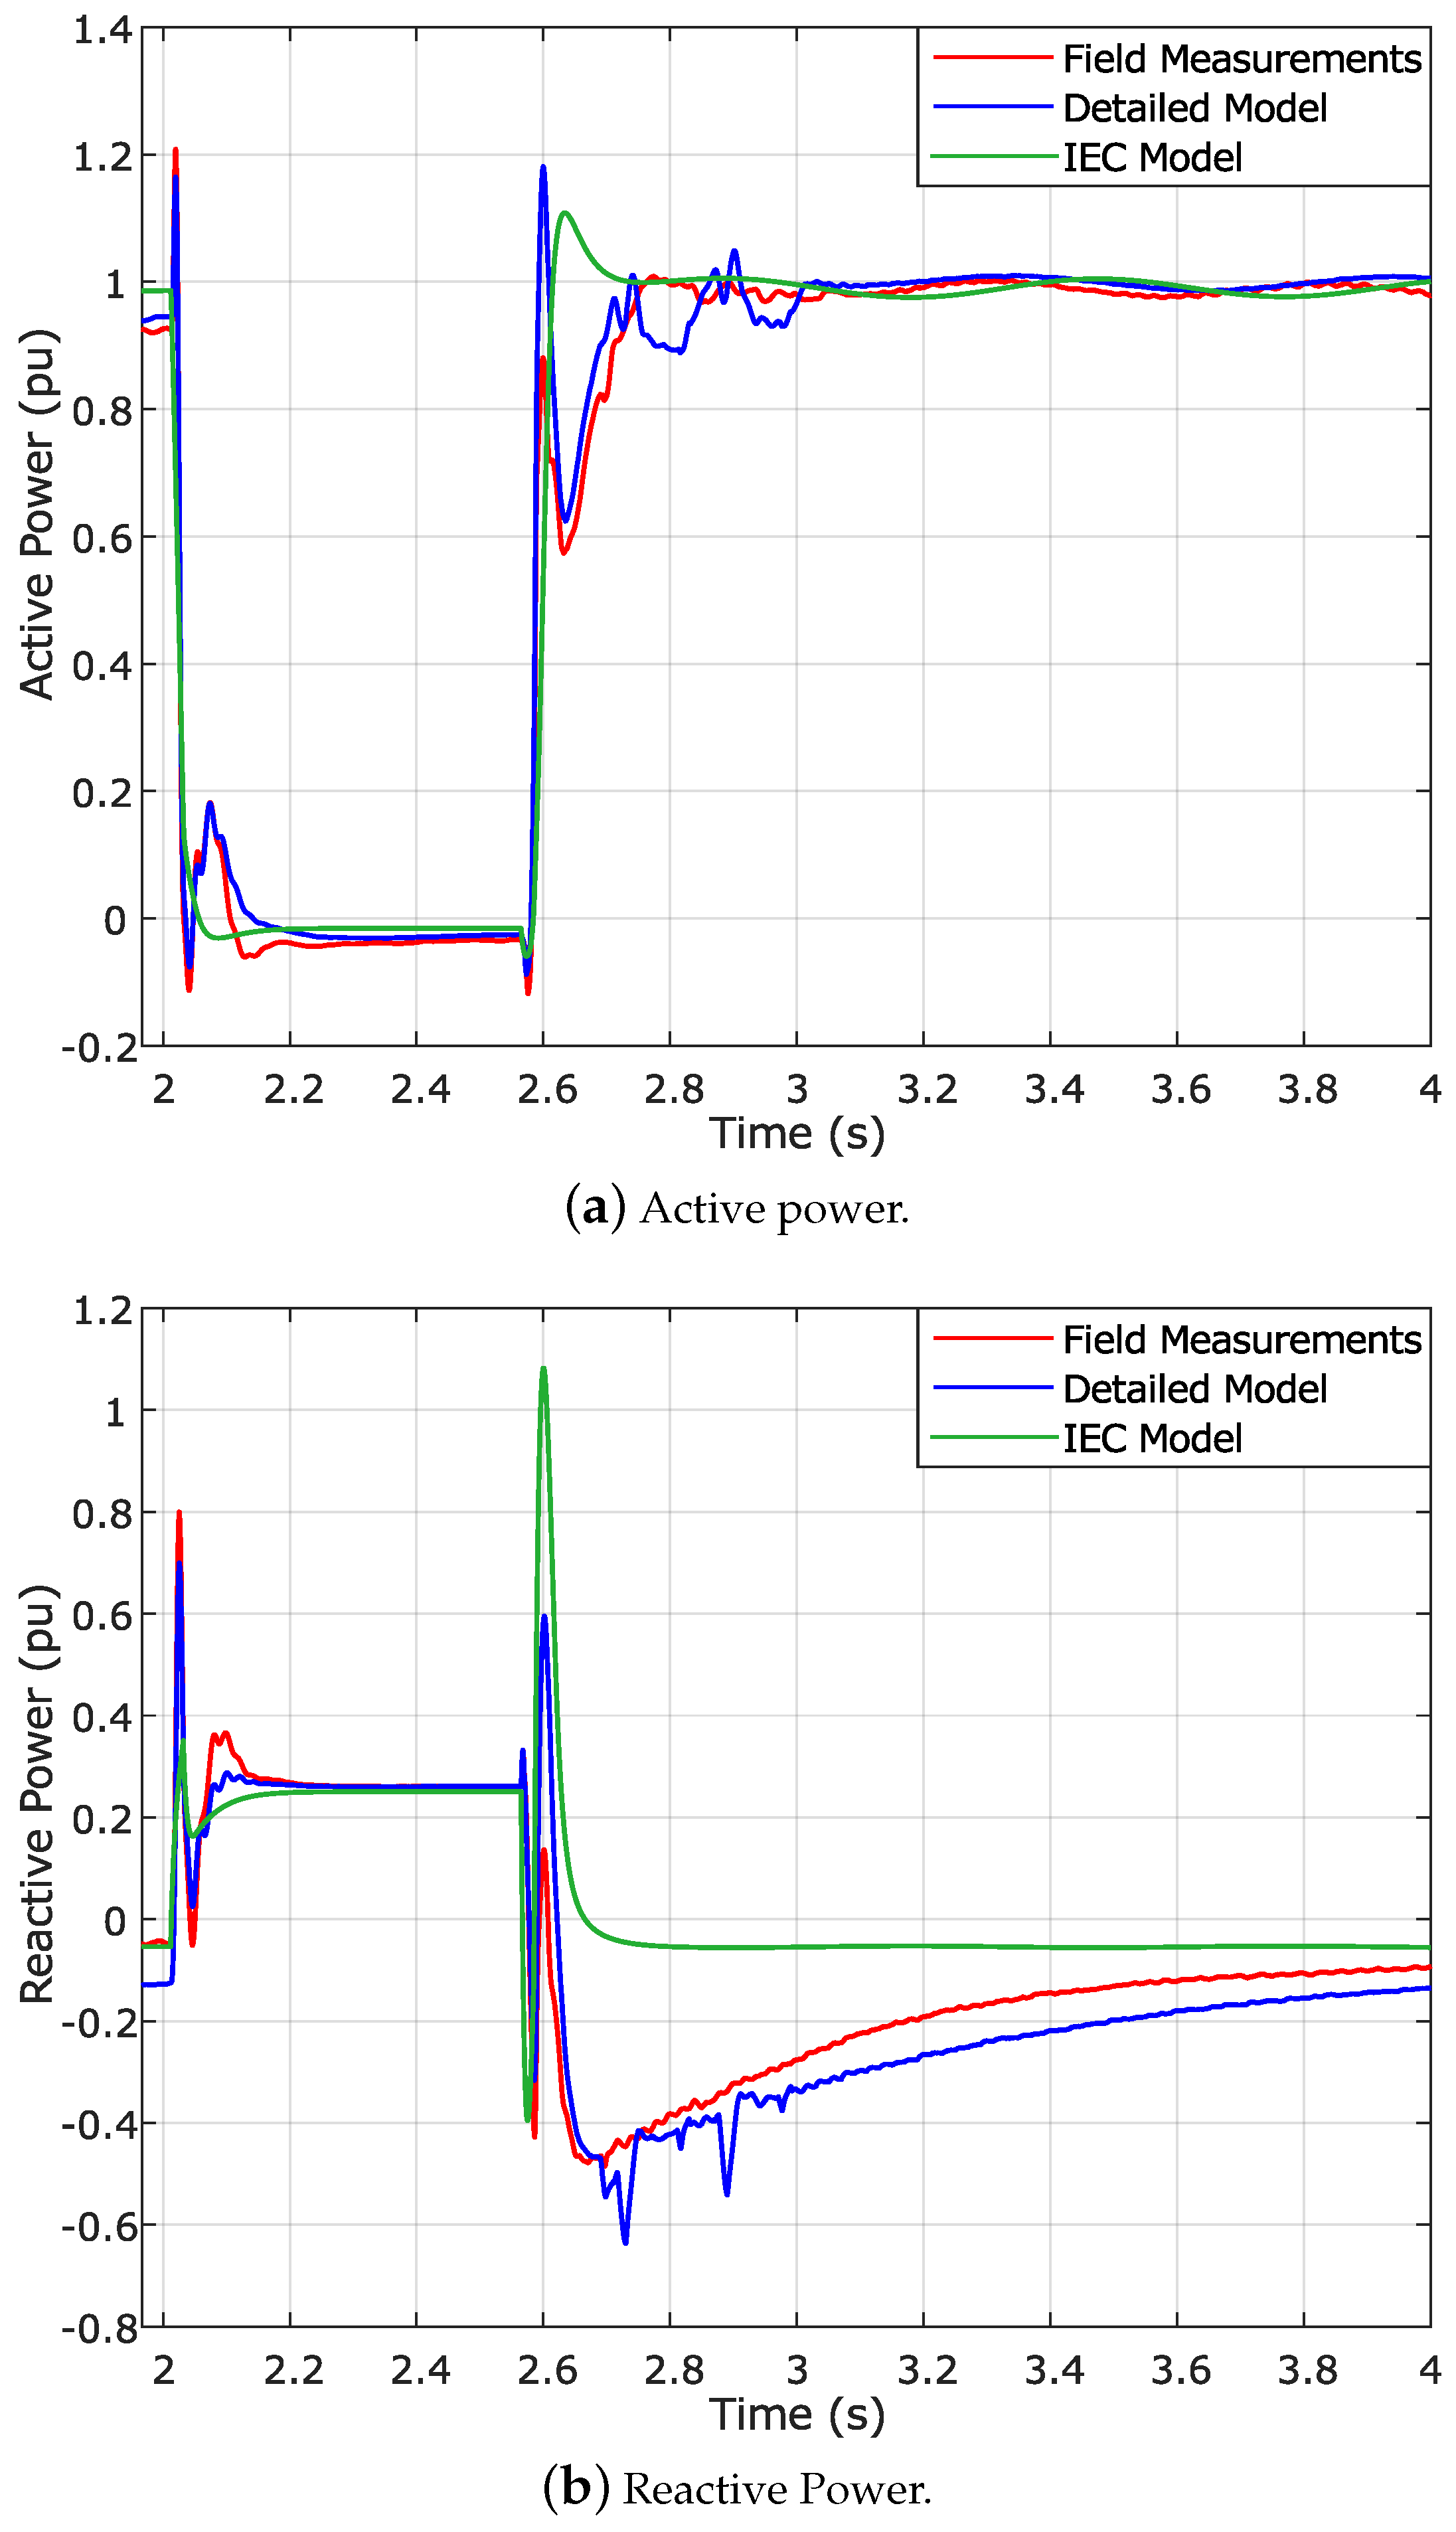
On the other hand,
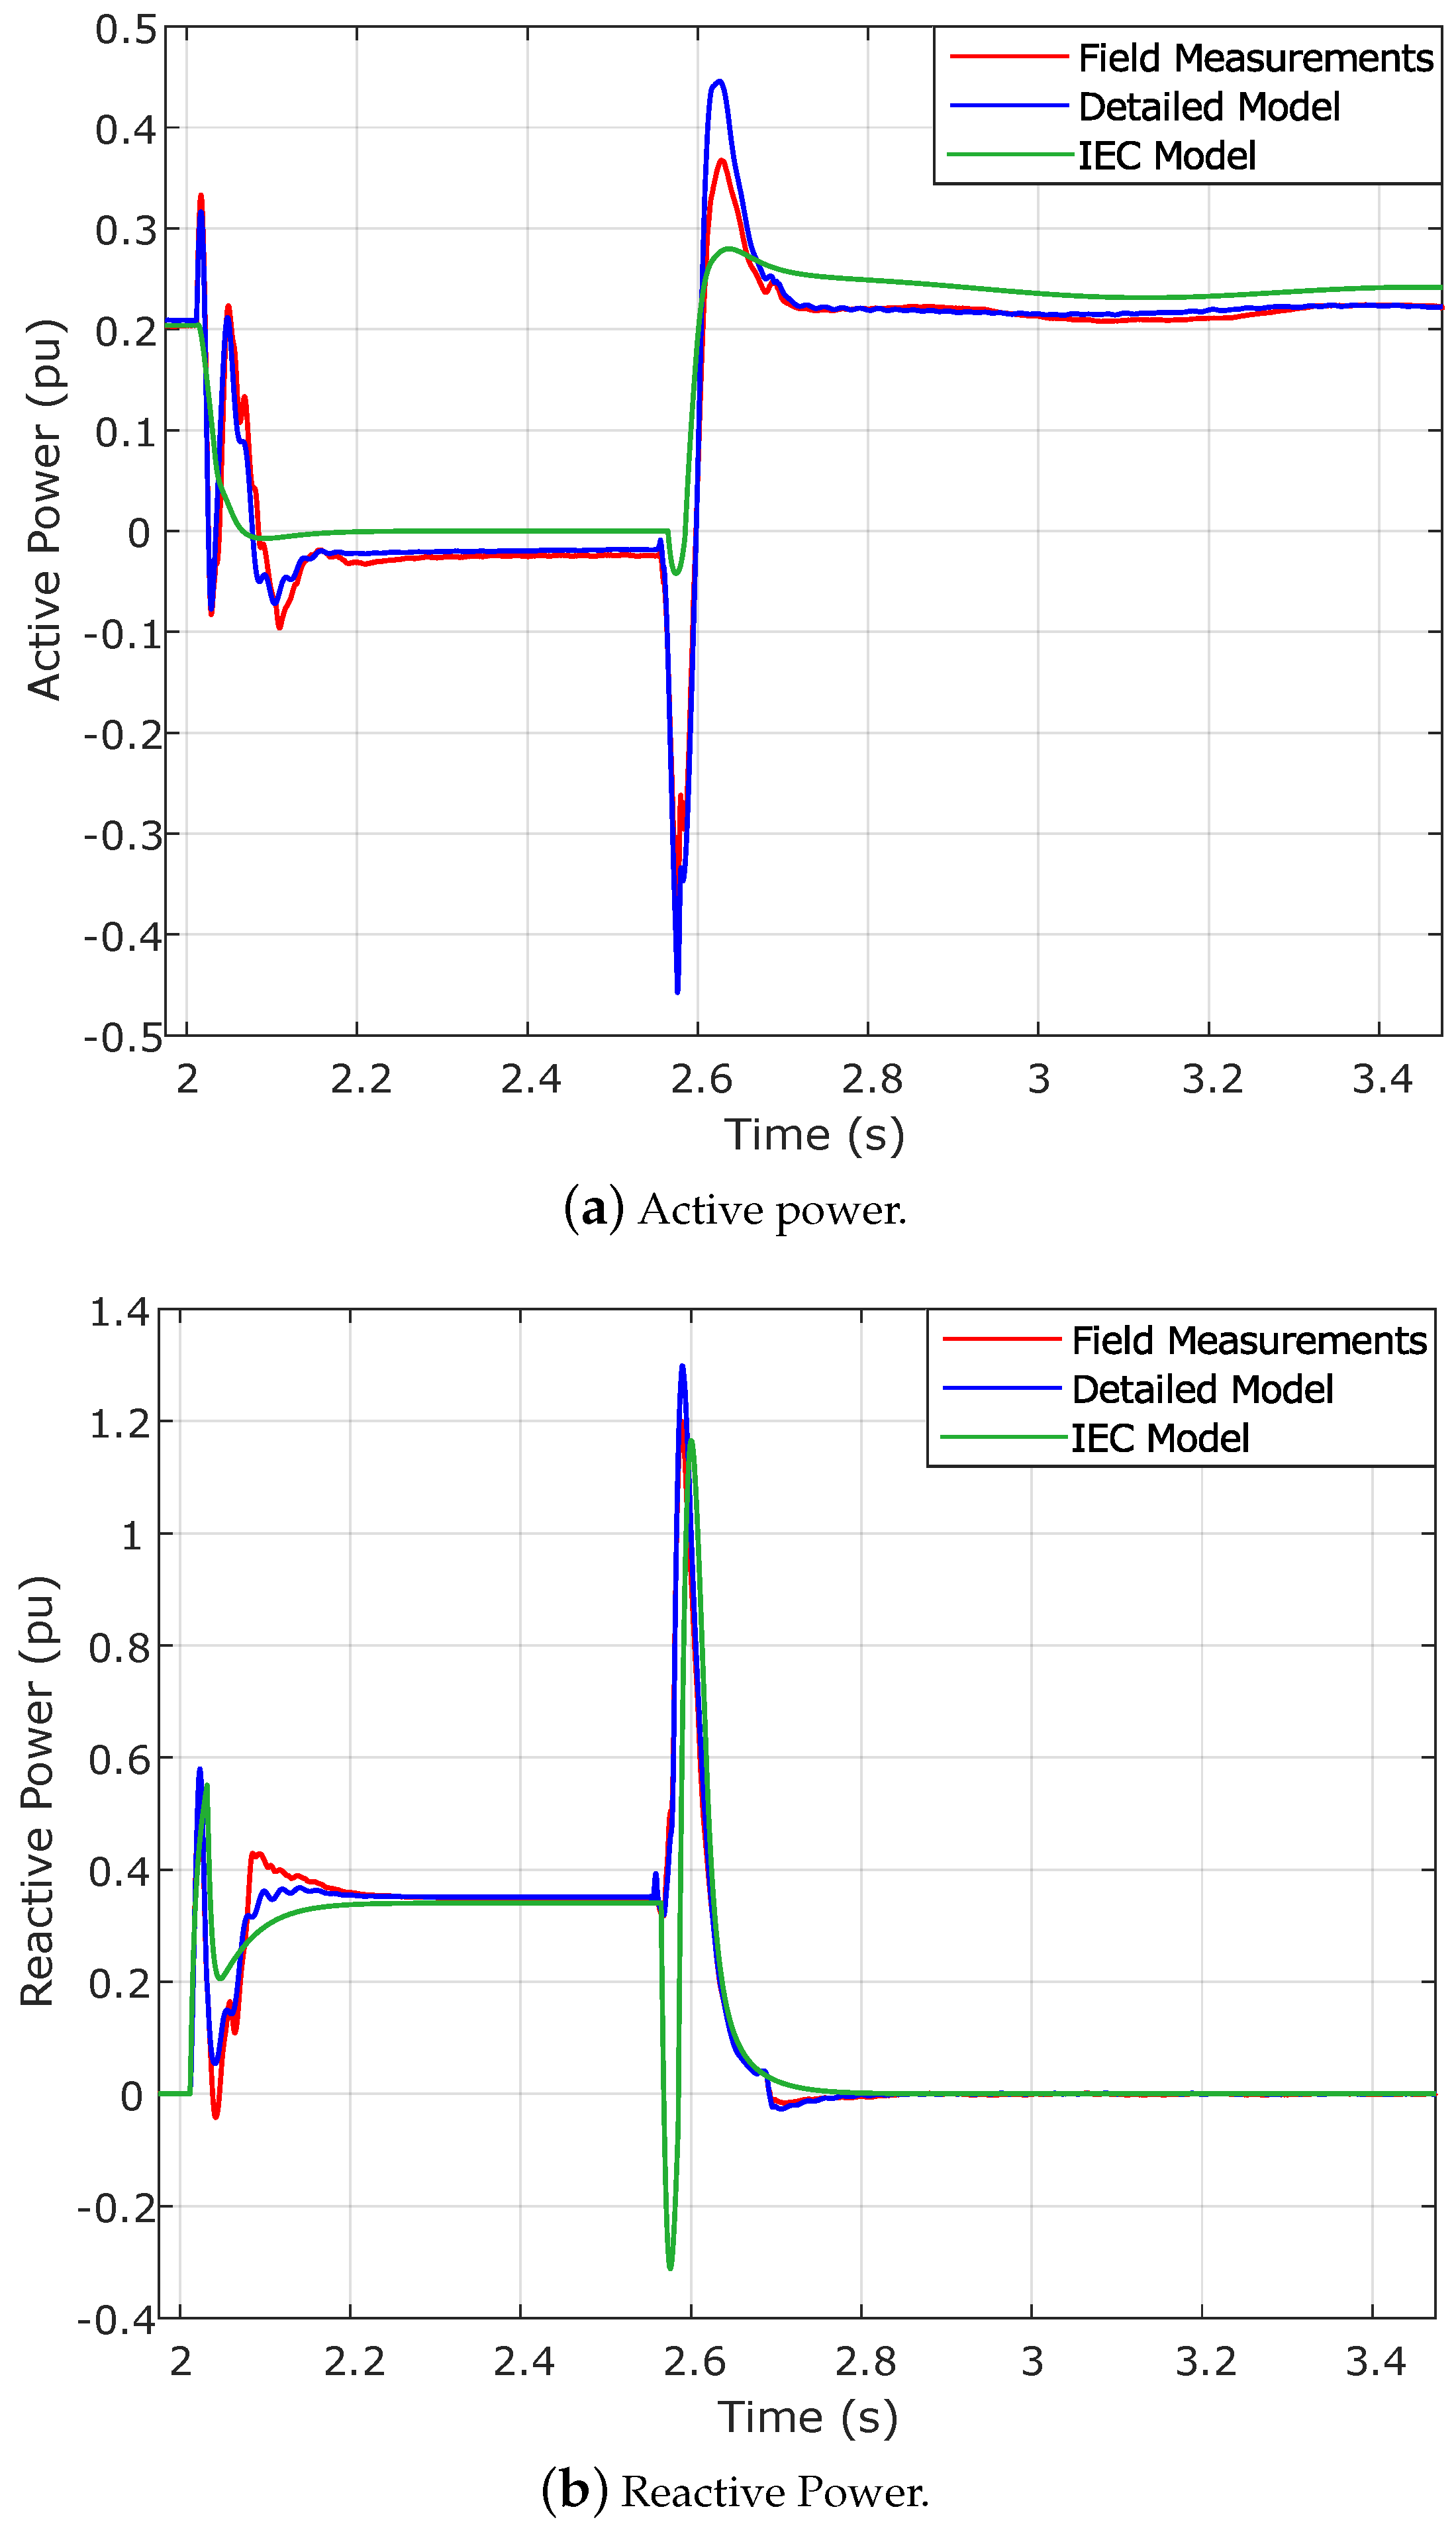
Figure 5 shows the behavior of the active and reactive power during the voltage dip in the three cases analyzed: field test, detailed WT simulation model and IEC generic WT model.
Regarding the IEC model results, considering the pertinent time window for evaluation of the data series (see
Table 3), only 80% of the points subjected to the analysis comply with the validation criteria for active power. In the case of reactive power, this value is still lower, 56%. Therefore, the validation criteria established by the PVVC are not complied with in either case. However, as will be illustrated in
Section 4.2, this non-compliance situation is reversed in one of the cases when the low-voltage measurement point is considered. It can thus be stated that, in this case, neither of the magnitudes subjected to the validation analysis comply with the PVVC criteria when it is applied at the testing point and that, therefore, the transformer model implemented along with the IEC WT model must be considered as non-validated.
Nevertheless, considering the graphic results in
Figure 5a, it is clear there exists a reasonably good correlation between the IEC model and the field measurements in the case of active power. The differences are mainly because the generic model is not able to represent the transient periods of the actual WT with great precision. To improve the representation of these transient periods, two modifications should be carried out in the generator system defined by standard IEC 61400-27-1, the modular structure of which is available in [
6]:
The PI control of the generator system should be defined based on the DQ system instead of calculating its real and imaginary components. Moreover, parameters of the active and reactive power PI controllers should have a different value, since the standard considers them equal.
An electromagnetic transient resistance, Rs, should also be included in the generator system, as in its current form only an electromagnetic transient reactance, named Xs, is considered.
Regarding the reactive power behavior of the IEC WT model (
Figure 5b), although there is also non-compliance with the PVVC, transient periods are better represented by the generic WT model in this case. However, the level of accuracy is still low if compared to the transient periods that appear in the detailed model’s responses and field measurements. This is also because simplified models such as that developed by the IEC do not represent the fundamental component of the transformer inrush current. This can be understood more easily if we look at the graphic results shown in
Section 4.2, specifically at the reactive power graph obtained for the low-voltage side measurement point (
Figure 6b), in which reactive power fits much better than in the present case.
The differences between the field measurements and the IEC model, both in the active and the reactive power responses, which are mainly due to the inability of the generic model to accurately represent the transient periods, are described with great precision in [
23]. Indeed, the study summarizes the simplifications implemented in the Type 3A WT model, which is the one modeled in the present work, as explained in
Section 3.
The validation results for the detailed WT model, also operating at full load conditions, are shown in
Table 4. As can be observed, both the active and the reactive power responses fulfill the PVVC criteria when applied at the testing point, since 91% and 90% of the data series analyzed, respectively, are below the maximum deviation allowed. This implies that the detailed transformer and WT models simulated were validated according to the Spanish Grid Code.
Compliance of the detailed model with PVVC validation criteria is also supported by
Figure 5. On the one hand,
Figure 5a shows the detailed model’s active power response facing the voltage dip. It can be seen that there is an excellent correlation between this signal and the one provided by the field measurements. The same applies to the reactive power (
Figure 5b), the signal of which is also very similar to the field measurements. In this case, transient periods are accurately represented since the detailed WT model considered the actual mechanical, electrical and electronic systems of the Gamesa G52 WT, including their parameters and algorithms.
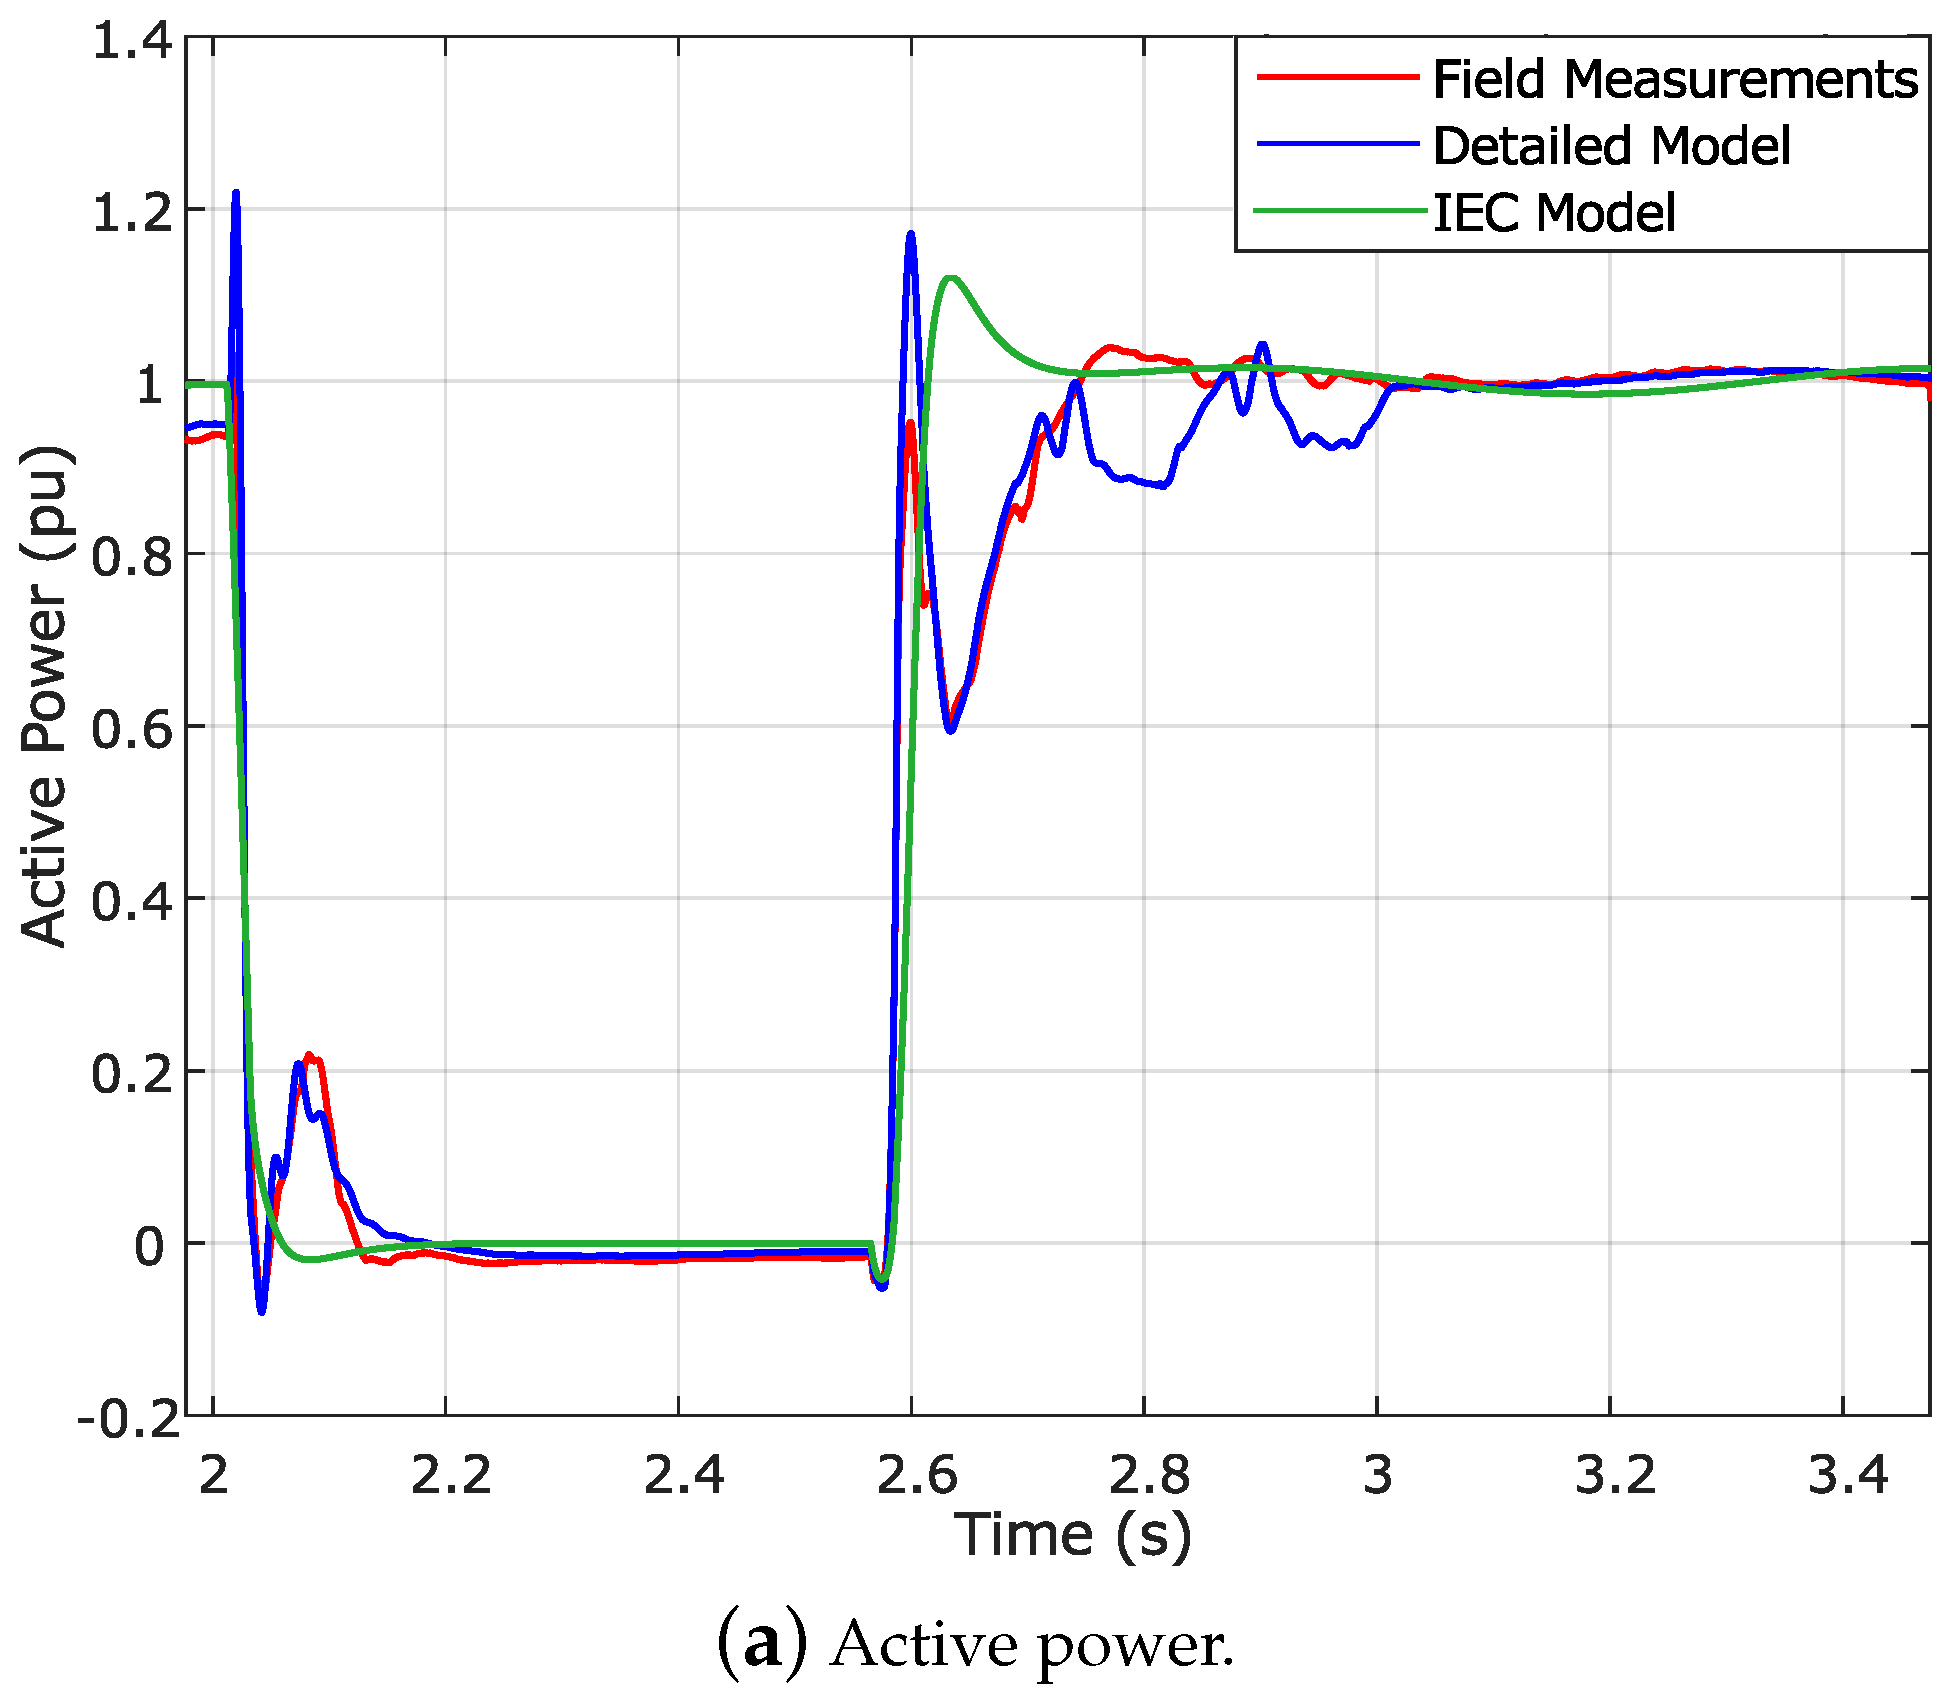
4.2. PVVC Criteria Applied at the Low Voltage Side: 690 V, Measurement Point 2
The detailed WT model representing the Gamesa G52 WT broadly complies with the validation criteria established by the Spanish Grid Code when analyzed at the testing point, and hence no additional validation analyses are required. However, the generic WT model developed by standard IEC 61400-27-1 does not meet the minimum requirements to be considered a validated WT model according to the same criteria when applied at the testing point. As listed in
Section 4.1, there are two main reasons for this situation: the inability of generic WT models to accurately represent, on the one hand, transient responses of actual WTs, and, on the other hand, the fundamental component of transformer inrush current. Indeed, modifications in the structure of the original generator system model developed by the standard have been proposed in order to improve transient responses of the generic Type 3 WT.
Nevertheless, regarding the second reason, the IEC model’s reactive power response does comply with the PVVC criteria when the transformer is not taken into account in the validation process, i.e., when the inrush current effects are no longer considered a problem. Therefore, when applying the criteria at the low voltage side, 690 V,
measurement point 2 according to
Figure 4, the percentage of data series below the maximum deviation allowed increases to 87%, higher than the 85% set as the target (
Table 5). Indeed,
Figure 6b shows that the correlation in reactive power between the generic WT model and the field measurements is much better than in the previous case (
Figure 5b). Active power, on the other hand, continues to be in non-compliance, with only 80% of data series within the margin established. The graphic results for active power (
Figure 6a), are very similar to those obtained at the testing point (
Figure 5a,
Section 4.1).
It can therefore be stated that the non-compliance situation in the previous case for reactive power is now reversed, since the response of the generic IEC WT model does fulfill the PVCC validation criteria at the low voltage side.
4.3. PVVC Criteria: WT Operating at Partial Load Conditions
The previous sections have presented the analysis of the IEC Type 3 WT model operating under full load conditions. Indeed, such a condition is presented as the worst-case scenario with respect to the compliance of the generic model with Spanish PO 12.3. Thus, the non-compliance cases have been extensively discussed, and the causes analyzed. The modeling modifications that should be implemented within the generic WT model to improve the compliance results have also been presented.
Furthermore, in order to enhance and enrich the current section, a different study case was also analyzed. In this case, the WT is operating at partial load conditions of 0.20 pu, which is in line with the requirements established by the PVVC (partial load test, 10–30%
, see
Table 1). The voltage dip applied to the IEC WT model working at partial load conditions is the same as that applied to the previous compliance analyses (see
Figure 2).
Table 6 and
Table 7 show the percentage of points that comply with the PVVC validation criteria when applied to the high and low voltage sides of the transformer, respectively.
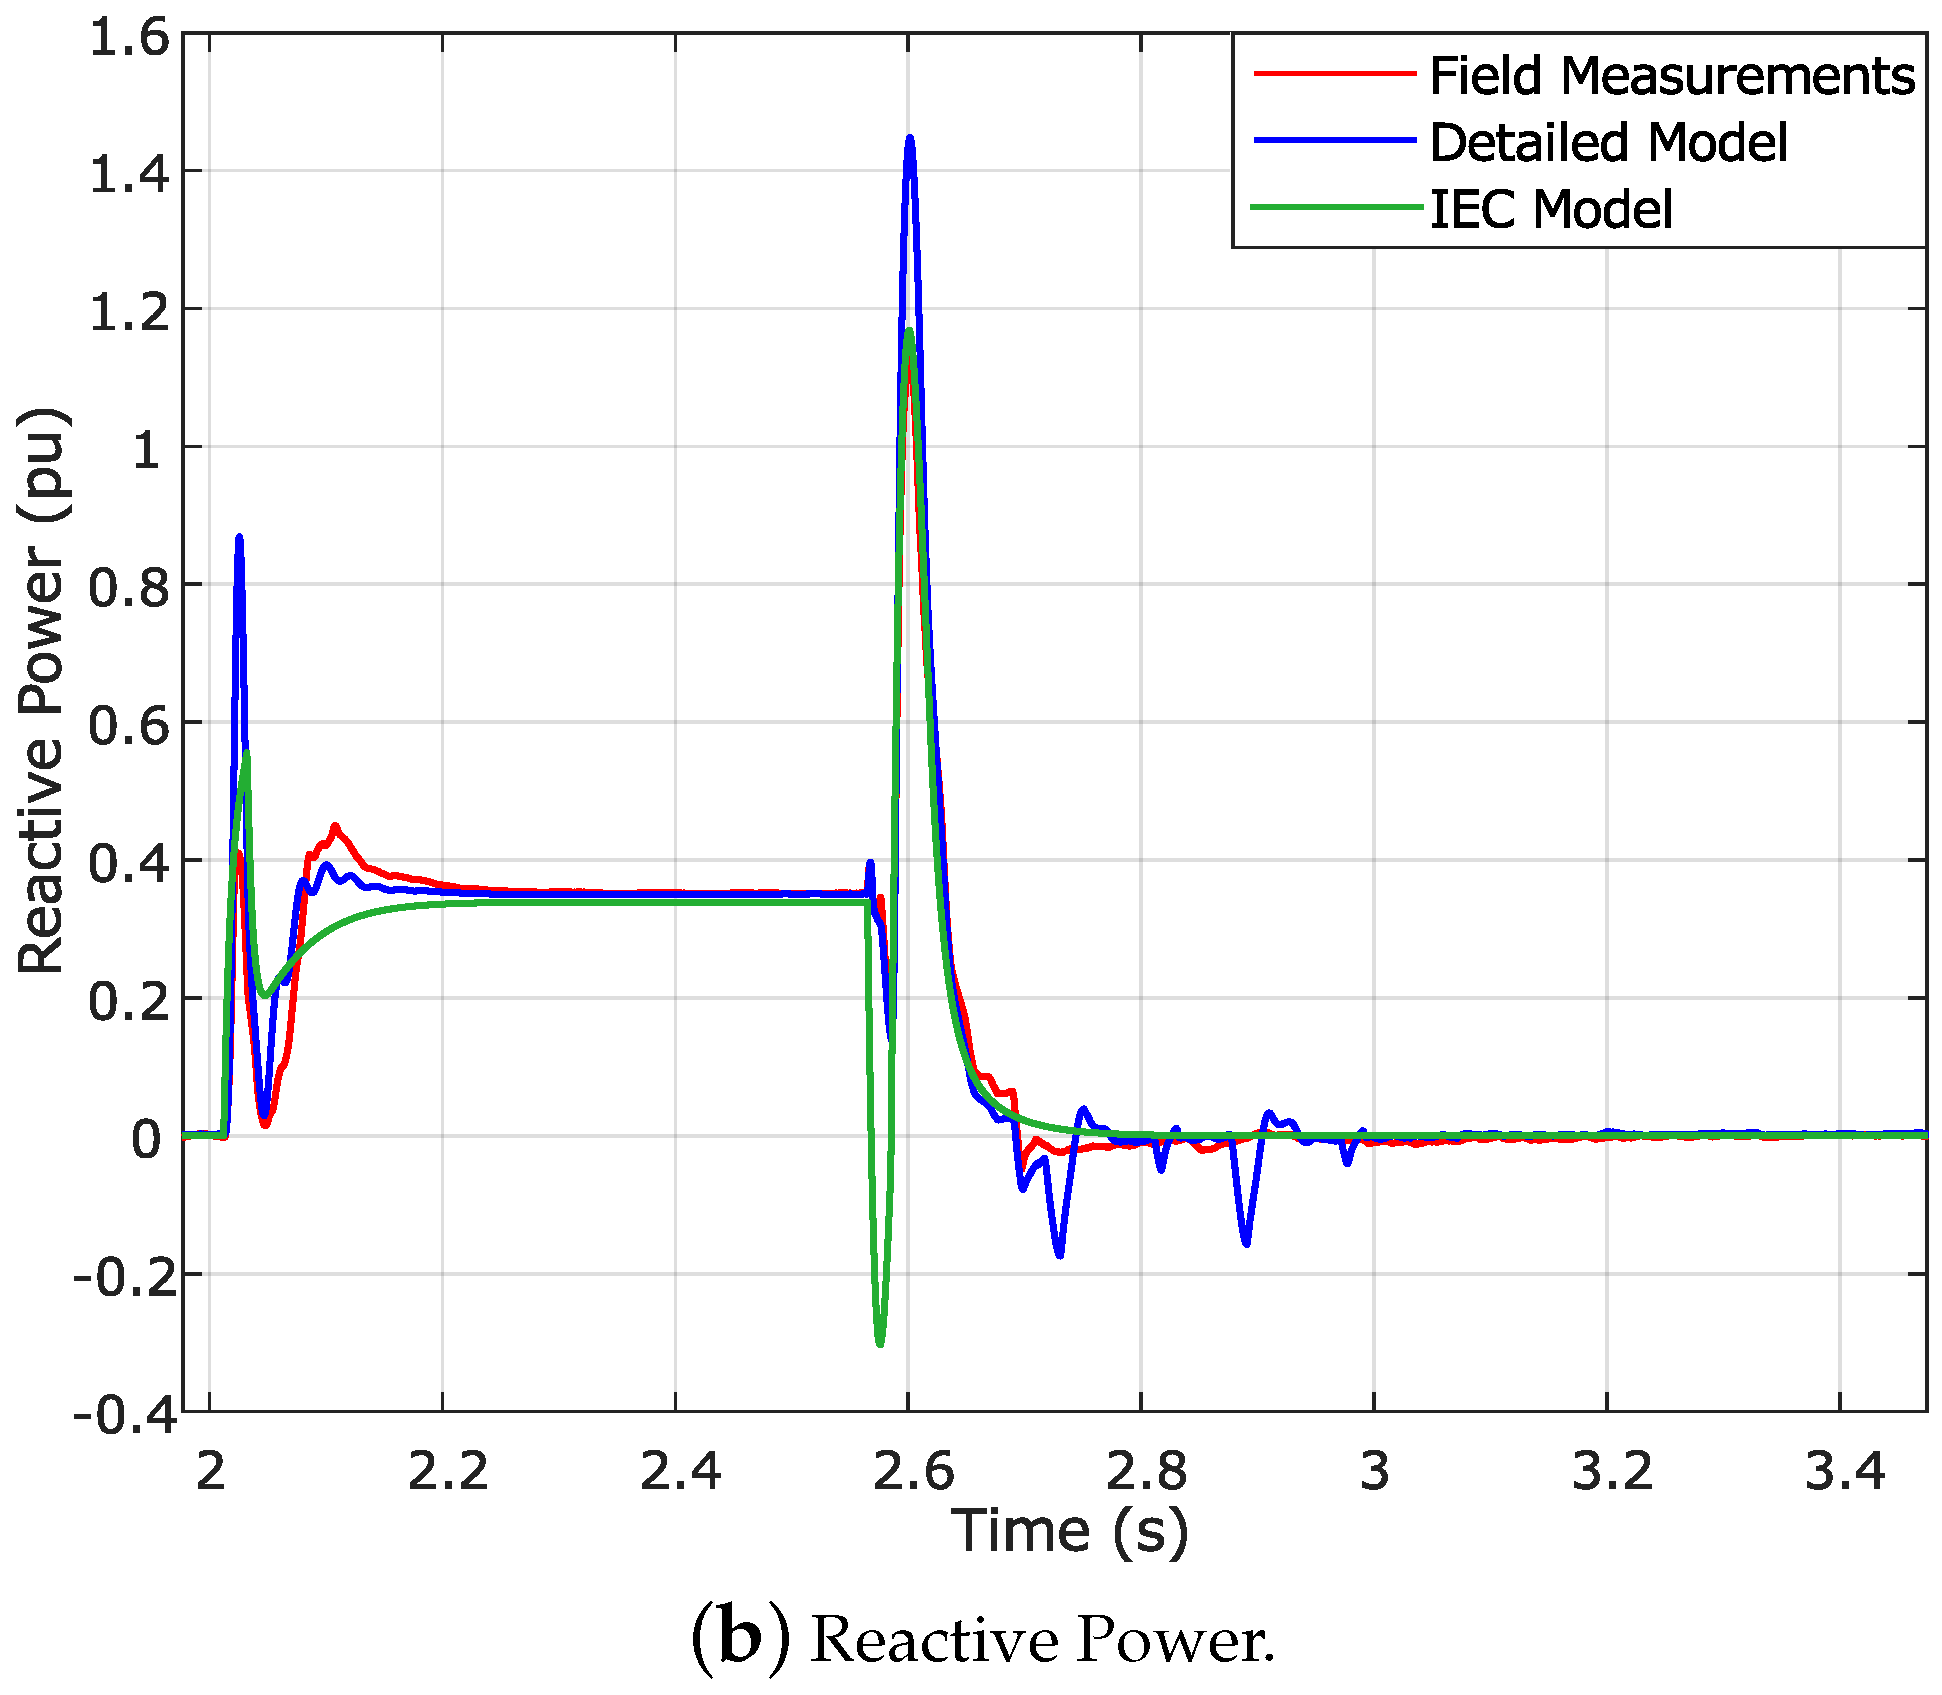
Figure 7 and
Figure 8 show the active and reactive power responses in those two measurement points.
A value of 0.1 pu must be the maximum error for at least 85% of points within the data series to be compared. As can be observed in
Table 6, the active power response fulfills the PVVC validation criteria at the high voltage side of the power transformer, i.e., at the testing point (or measurement point 1, see
Figure 4), since 88% of the data series analyzed are below the maximum deviation allowed. Indeed, if the graphic results in
Figure 7a are considered, it can be observed that there is a good correlation between the IEC model response and the field measurements, which justifies the compliance of the active power response at measurement point 1 (see
Figure 4) with the PVVC validation criteria. Moreover, the reactive power response fails to comply with PO 12.3, since only 58% of the data series are below 0.1 pu. The differences in this case may be clearly observed in
Figure 7b. As in the case of the PVVC criteria applied to the high voltage side with the WT operating at full load conditions (
Figure 5b), this non-compliance situation is also due to the inability of the generic WT model to represent the transformer inrush current.
However, in general, the compliance results improved in comparison to the WT operating at full load conditions.
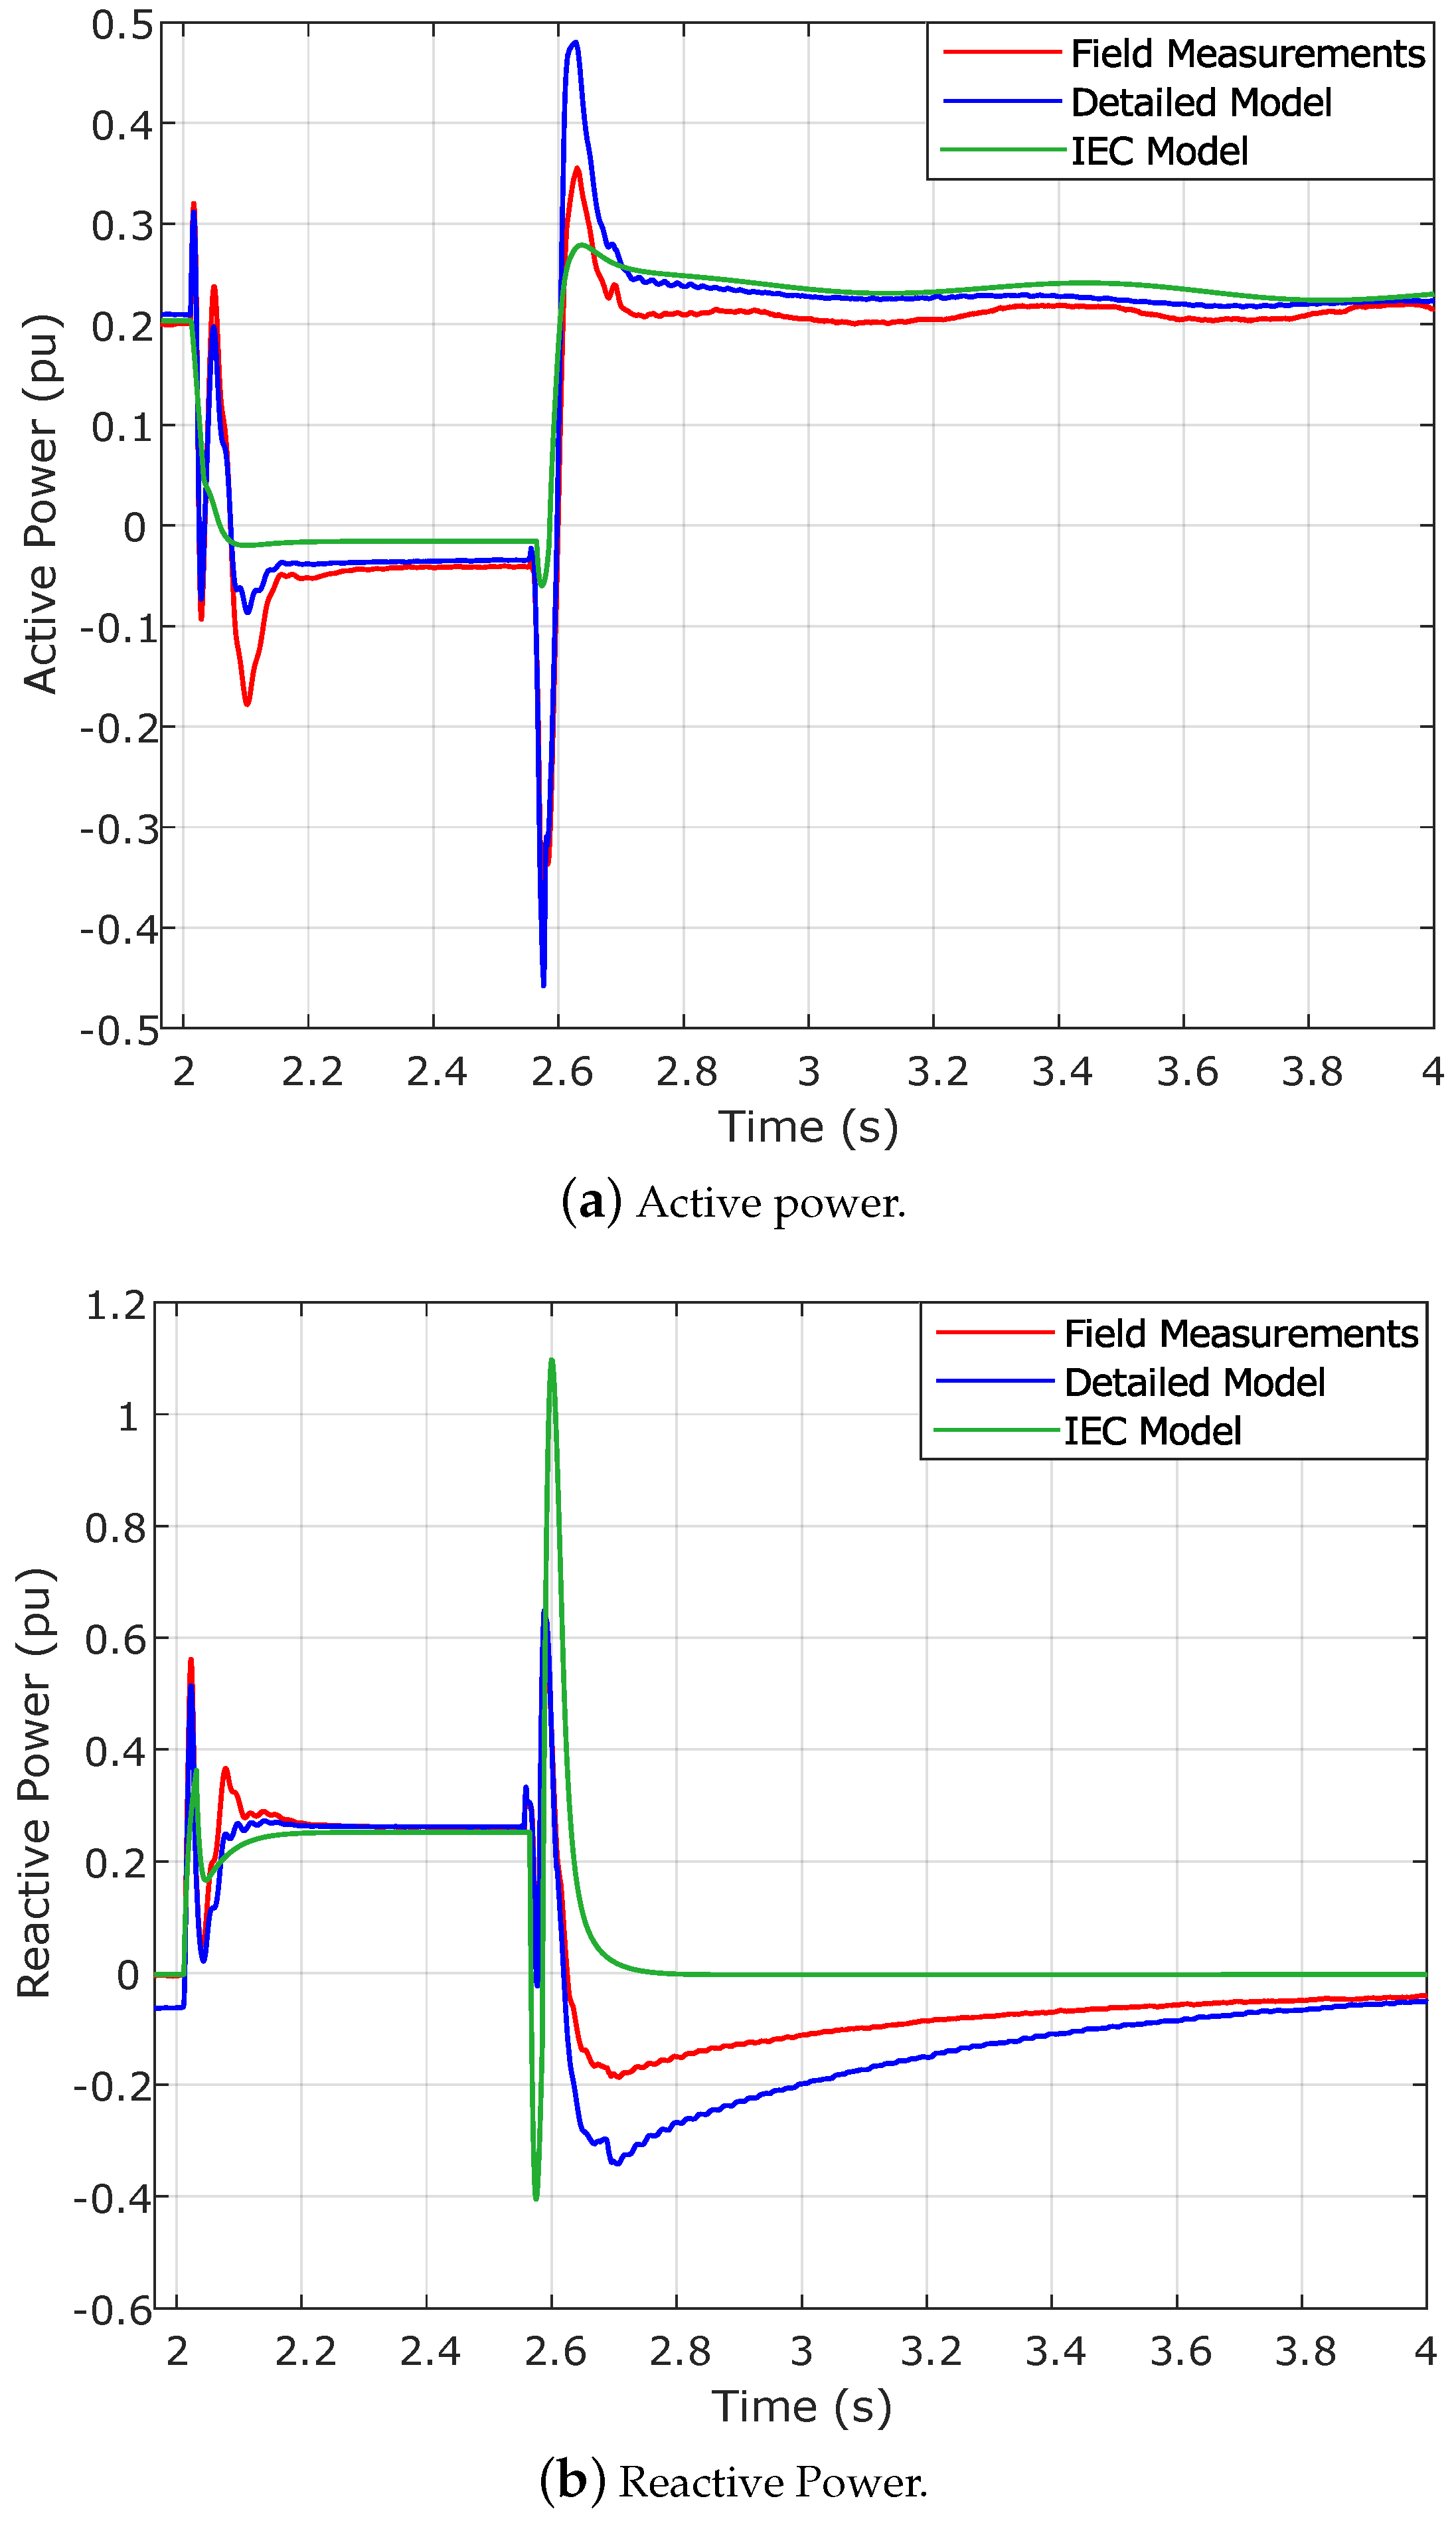
When the validation criteria are applied to the low voltage side (
Table 7 and
Figure 8), both the active and the reactive power responses of the WT operating at partial load conditions fulfill the PVVC criteria, since 91% and 88% of the data series analyzed, respectively, are below 0.1 pu. The good correlation that exists both in the active and the reactive power between the field measurements and the IEC model is observed in
Figure 8a,b, improving as regards the PVVC applied to the low voltage side. The situation for the reactive power has thus reversed, since it complies with the PVVC criteria in this case. This is for the same reasons as those given in
Section 4.2: simplified or generic models do not represent the fundamental component of the transformer inrush current.
5. Conclusions
In Spain, the Spanish Grid Code has developed a specific operation procedure, PO 12.3, which sets out the response that wind power plant installations must have under voltage dips. It also developed the so-called procedure for verification, validation and certification (PVVC), a set of guidelines that establish the steps to follow to comply with PO 12.3. Thus, in order to fulfill the requirements of PO 12.3, voltage dips were applied on actual machines using specialized equipment, and field measurements were compared to the responses of their corresponding detailed simulation models when subjected to those specific voltage dip measurements. Subsequently, errors were calculated.
Based on the concepts mentioned above, since IEC models are precisely intended to represent the wide range of actual WTs available in the market, this research work aimed to extend the functionality of international standard IEC 61400-27-1 by analyzing the compliance of these generic models with national grid code requirements such as the Spanish PO 12.3 for fault ride-through capability. In this way, field measurements from an actual Gamesa G52 WT, in addition to the dynamic responses of its corresponding detailed simulation model, were compared to the responses provided by a generic IEC 61400-27-1 Type 3 WT when they were all subjected to the same voltage dip. The PVVC was applied, and the generic WT’s active and reactive power responses were analyzed.
The results obtained are of great interest to network operators as well as other stakeholders concerned with wind power integration. When the WT is operating at full load conditions, if the PVVC is applied at the testing point, the IEC model fails to comply with PO 12.3 in both active and reactive power. This is mainly due to transient periods of the actual WT not being well represented by the generic model as a result of the simplifications introduced in the standard. To improve its electrical behavior, it is proposed that the PI control of the IEC-developed generator system be defined based on the DQ system. It would also be necessary to distinguish between the parameters defining the active and reactive power controllers, since the Standard considers them of equal value. Moreover, regarding specifically the reactive power response, it is also observed that the generic model is unable to represent the fundamental component of the transformer inrush current, unlike in the case of the WT simulation model described. This is better reflected in the reactive power response of the WT at the low voltage side, when the transformer is no longer considered in the validation calculations and hence there is no influence of the inrush current. Indeed, reactive power response does comply with the PVVC in this second case. Concerning the detailed model, its active and reactive power behavior is already validated upstream the transformer, thus broadly complying with PO 12.3. Finally, the IEC WT model operating at partial load conditions only fails to comply with the Spanish grid code in the reactive power response when the validation criteria are applied to the high voltage side. This may be mainly attributed, as in the case of nominal load conditions, to the inability of the WT model to represent the fundamental component of the transformer inrush current.
Wind power is indisputably changing the way electricity networks operate, and this will change even more in the coming years. There is uncertainty about wind lead transmission and distribution system operators thoroughly planning grid activities to ensure power supply. Thus, time-domain analyses such as the ones carried out in the present work can contribute to improving the forecasts required to guarantee proper wind power integration in actual networks. In contrast to other works on this topic, based solely on the study of the certification process of actual WPPs and WTs according to the Spanish grid code, this study analyses the generic Type 3 WT simulation model with the objective of extending the use of Standard IEC 61400-27-1, since the model is subjected for the first time to national grid code validation criteria: Spanish operation procedure PO 12.3. The results show that some modifications should be carried out in the original dynamic sub-models within the generic Type 3 in order to improve its behavior and therefore comply with PO 12.3, thus enhancing the scope of the application of standard IEC 61400-27-1.

 ,
, 


