Article

Development of an Energy Saving Strategy Model for Retrofitting Existing Buildings: A Korean Case Study

1
Department of Civil and Environmental Engineering, University of Michigan, Ann Arbor, MI 48109, USA
2
Department of Architectural Engineering, Hanyang University, Ansan 15588, Korea
3
Division of Architecture, Civil and Environmental Engineering, Hoseo University, Asan 31499, Korea
*
Author to whom correspondence should be addressed.
Energies 2019, 12(9), 1626; https://doi.org/10.3390/en12091626
Submission received: 18 March 2019 / Revised: 22 April 2019 / Accepted: 26 April 2019 / Published: 29 April 2019
(This article belongs to the Section G: Energy and Buildings)

Abstract

:
The building sector accounts for approximately 40% of national energy consumption, contributing to the environmental crisis of global warming. Using energy saving measures (e.g., improved thermal insulation, highly energy-efficient electrical and mechanical systems) provides opportunities to reduce energy consumption in existing buildings. Furthermore, if the life cycle cost (i.e., installation, operation and maintenance cost) of the measures is considered with their energy saving potential, it is possible to establish a cost-effective energy retrofit plan. Therefore, this research develops an energy saving strategy model considering its saving potential and life cycle cost of the measures for reducing energy consumption in existing buildings. To test the validity of the proposed model, a case study is carried out on an educational facility in South Korea, in response to its overconsumption of energy. The results demonstrate that in terms of energy saving and life cycle cost, the optimal energy retrofit plan is more cost-effective than the existing plan. Also, the break-even point for the optimal energy retrofit plan is within five years, and then revenue from energy saving continually occurs until 2052. For energy retrofit of existing buildings, using the proposed model would enable building owners to maximize energy savings while minimizing the life cycle cost.

1. Introduction

The building sector accounts for about 40% of national energy consumption and for about one-third of greenhouse gas emissions [1,2]. In order to reduce energy use in the building sector, it is necessary to apply energy saving measures (ESMs) to new construction and existing buildings (e.g., improvement in of thermal insulation, use of energy-efficient electrical and mechanical equipment). Several researchers [3,4,5] have emphasized that improving the energy efficiency of existing buildings has more potential than new buildings to achieve energy saving in the building sector. In particular, in developed countries where the ratio of new construction to existing buildings is gradually decreasing, the retrofit of existing buildings is more influential to reduce energy consumption in the building sector [5,6].
In general, existing buildings have lower efficiency of energy consumption than that of new construction, due to the deterioration of building materials and electrical and mechanical (E&M) equipment with time, which leads to an increase in operating and maintenance cost [7,8]. Issa et al. [9] have found that conventional schools incur higher operating and maintenance cost compared to green and energy-retrofitted schools. The results are due to the installed equipment and materials being unable to deliver the initial performance originally planned in the design phase [10]. In addition, existing buildings cannot reflect the current standard, which is enhanced compared with that of the past [6]. For example, South Korea enforced Design Guidelines for Energy Saving in Building in 1985 [11]. However, the outdated buildings constructed prior to the enforcement date were not addressed in the previous guideline. Hence, the cooling and heating loads of these existing buildings have increased. For this reason, in order to improve building energy performance, existing buildings are required to comply with the current guidelines.
Substantial decision support models to date have been proposed for the energy retrofitting of existing buildings [12,13]. The majority of the proposed models focuses on the early design phase of retrofit projects due to the following two reasons [14]. First, establishing an energy retrofit plan in a manual way is time consuming. Second, the level of details that is required for proper decision making is limited at the early design stage. The primary goal of retrofit projects is to achieve the sustainability of existing buildings (i.e., energy saving, reduction in greenhouse gas emissions) [13,15]. Additionally, considering life cycle cost (i.e., installation, operation, maintenance, demolition cost) of ESMs during the decision making process is emphasized because it maximizes energy saving while minimizing building owners’ financial burdens [14,16,17]. Until recently, several multi-criteria decision making models have received a significant attention [15,16,17,18,19,20,21,22]. For example, Alanne [15] has developed a multi-objective knapsack model for energy saving and applied this model to housing facility for validation. In the course of selecting ESMs, environmental and functional performance indices are used as selection criteria. Also, Hong et al. [16] have evaluated the life cycle cost of ESMs as well as energy saving. In the case study, 15 scenarios are analyzed based on the life cycle cost. Juan et al. [17] have developed a decision support system which considers the trade-offs between life cycle cost and quality for selected ESMs. Unfortunately, despite such significant efforts, two significant obstacles remain when finding a cost-effective energy retrofit plan. First, the current models (e.g., Energy Plus) require detailed information (e.g., weather condition, building characteristics), making it time-intensive for energy consumption calculation. This is important because limited time is given for the design alternative generation and its performance evaluation at the early design phase [14]. Although the knapsack model [15] shows a high computational efficiency, it does not analyze the life cycle cost as well as the actual amount of energy saving occurring during the life cycle of ESMs. Second, since the available ESMs in the current models are targeted to certain spatial contexts (e.g., building type, climate region), its usability to other buildings is limited. Therefore, in order to overcome these limitations in literature, this study develops an energy saving strategy model considering energy saving potential together with life cycle cost of diverse ESMs. In order to validate the proposed model, this research conducts a case study on university facilities, due to an increasing concern about their energy overconsumption [23]. With the proposed model, building owners would be allowed to establish a cost-effective energy retrofit plan for existing buildings. In other words, it is possible to maximize energy savings while minimizing the life cycle cost in existing buildings.

2. Methodology

In order to establish an optimal energy retrofit plan for improving the energy efficiency of existing buildings, previous studies have considered heuristic approaches and optimization methods. In general, the heuristic approach depends on the subjective experience of experts or decision makers to solve the problem, thus making it difficult to ensure that solutions are optimal under the given conditions [24]. On the other hand, optimization methods correspond to the process for finding an optimum using an optimization algorithm [25]. According to Goldberg [26], optimization methods can be divided into calculus-based methods, enumerative schemes, and random search algorithm. Calculus-based methods find an optimum in a local area, and can easily converge on a local extreme. Enumerative schemes are considered to search for an optimum that satisfies an objective function in many shapes and sizes. However, if the actual search area is large and discontinuous, this method takes significant time to find a global optimum. Random search algorithms are most widely used for optimization methods by researchers, and randomly explore all the search areas. To summarize, while the heuristic approach, calculus-based methods, and enumerative schemes have problems in converging upon a local solution, random search algorithms permit the finding of a global optimum in a large space. Considering the large number of ESMs, random search algorithms, such as the genetic algorithm, are appropriate optimization methods for this research.
The genetic algorithm, introduced by John Holland in 1975, is one of the random search algorithms that find an optimal solution in an extensive search area. The concept of the genetic algorithm is based on the survival of the fittest, and natural selection, which processes are claimed by Darwin. As shown in Figure 1, the creatures living in a specific environment repeat mutation and crossover as generations progress [27]. From this process, the most suitable creature in a given environment finally survives.
In this study, genetic algorithms randomly determine the usage of ESMs in the search process and produce a chromosome (Figure 2). Each gene (A to J) is listed with value, where 0 means that the ESM is not used, and 1 indicates the ESM is used. For example, the ESMs A, C, D, H, I, and J will be used for reducing energy consumption in existing buildings. Also, each gene includes information about the life cycle cost and the amount of energy saving of each ESM.

3. Energy Saving Measure Database

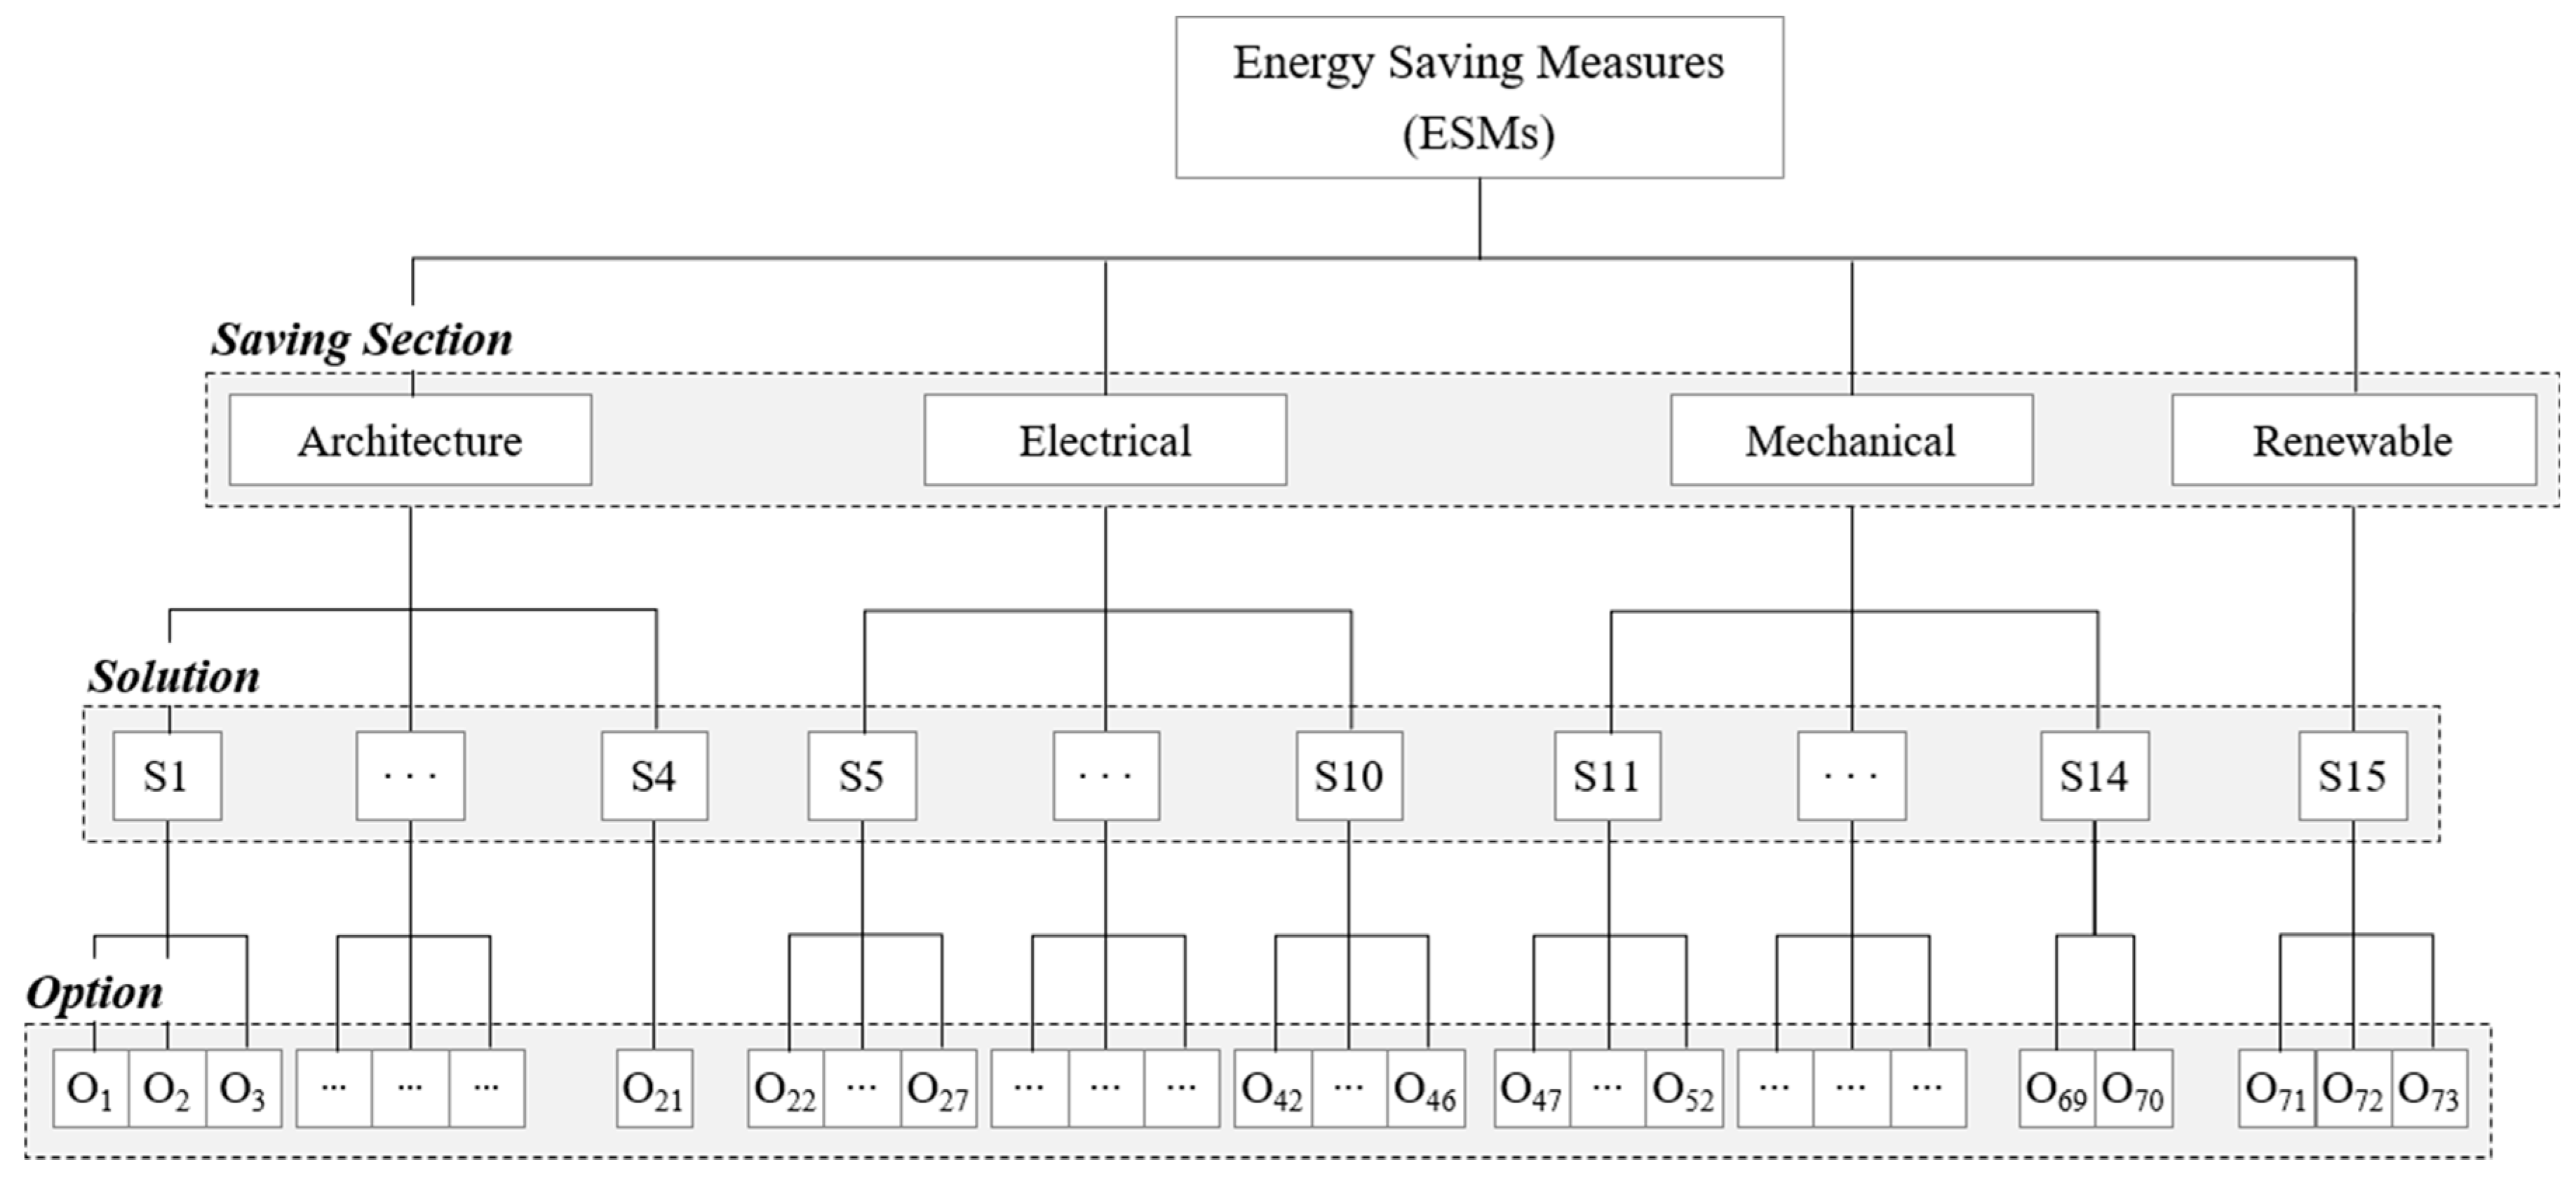
3.1. Energy Saving Measures

In order to reduce energy consumption in existing buildings, the low energy-efficient equipment and materials should be replaced with highly energy-efficient ESMs. For this study, the available ESMs were selected as follows: (1) investigate ESMs that have been applied to historical retrofit projects by an energy service company (ESCO); (2) investigate ESMs that have been used in previous studies; (3) refer to ESMs that should be satisfied according to the Design Guidelines for Energy Saving in Buildings; (4) reflect ESMs that have been used for energy retrofit in universities; and (5) determine whether the collected ESMs can be used or not through an interview with an employee working in the Facility and Technology Division of a University, Seoul in South Korea. In total, 74 ESMs are available for energy retrofit in existing buildings, and can be classified depending on their saving sector, solution, and option layer (Figure 3).

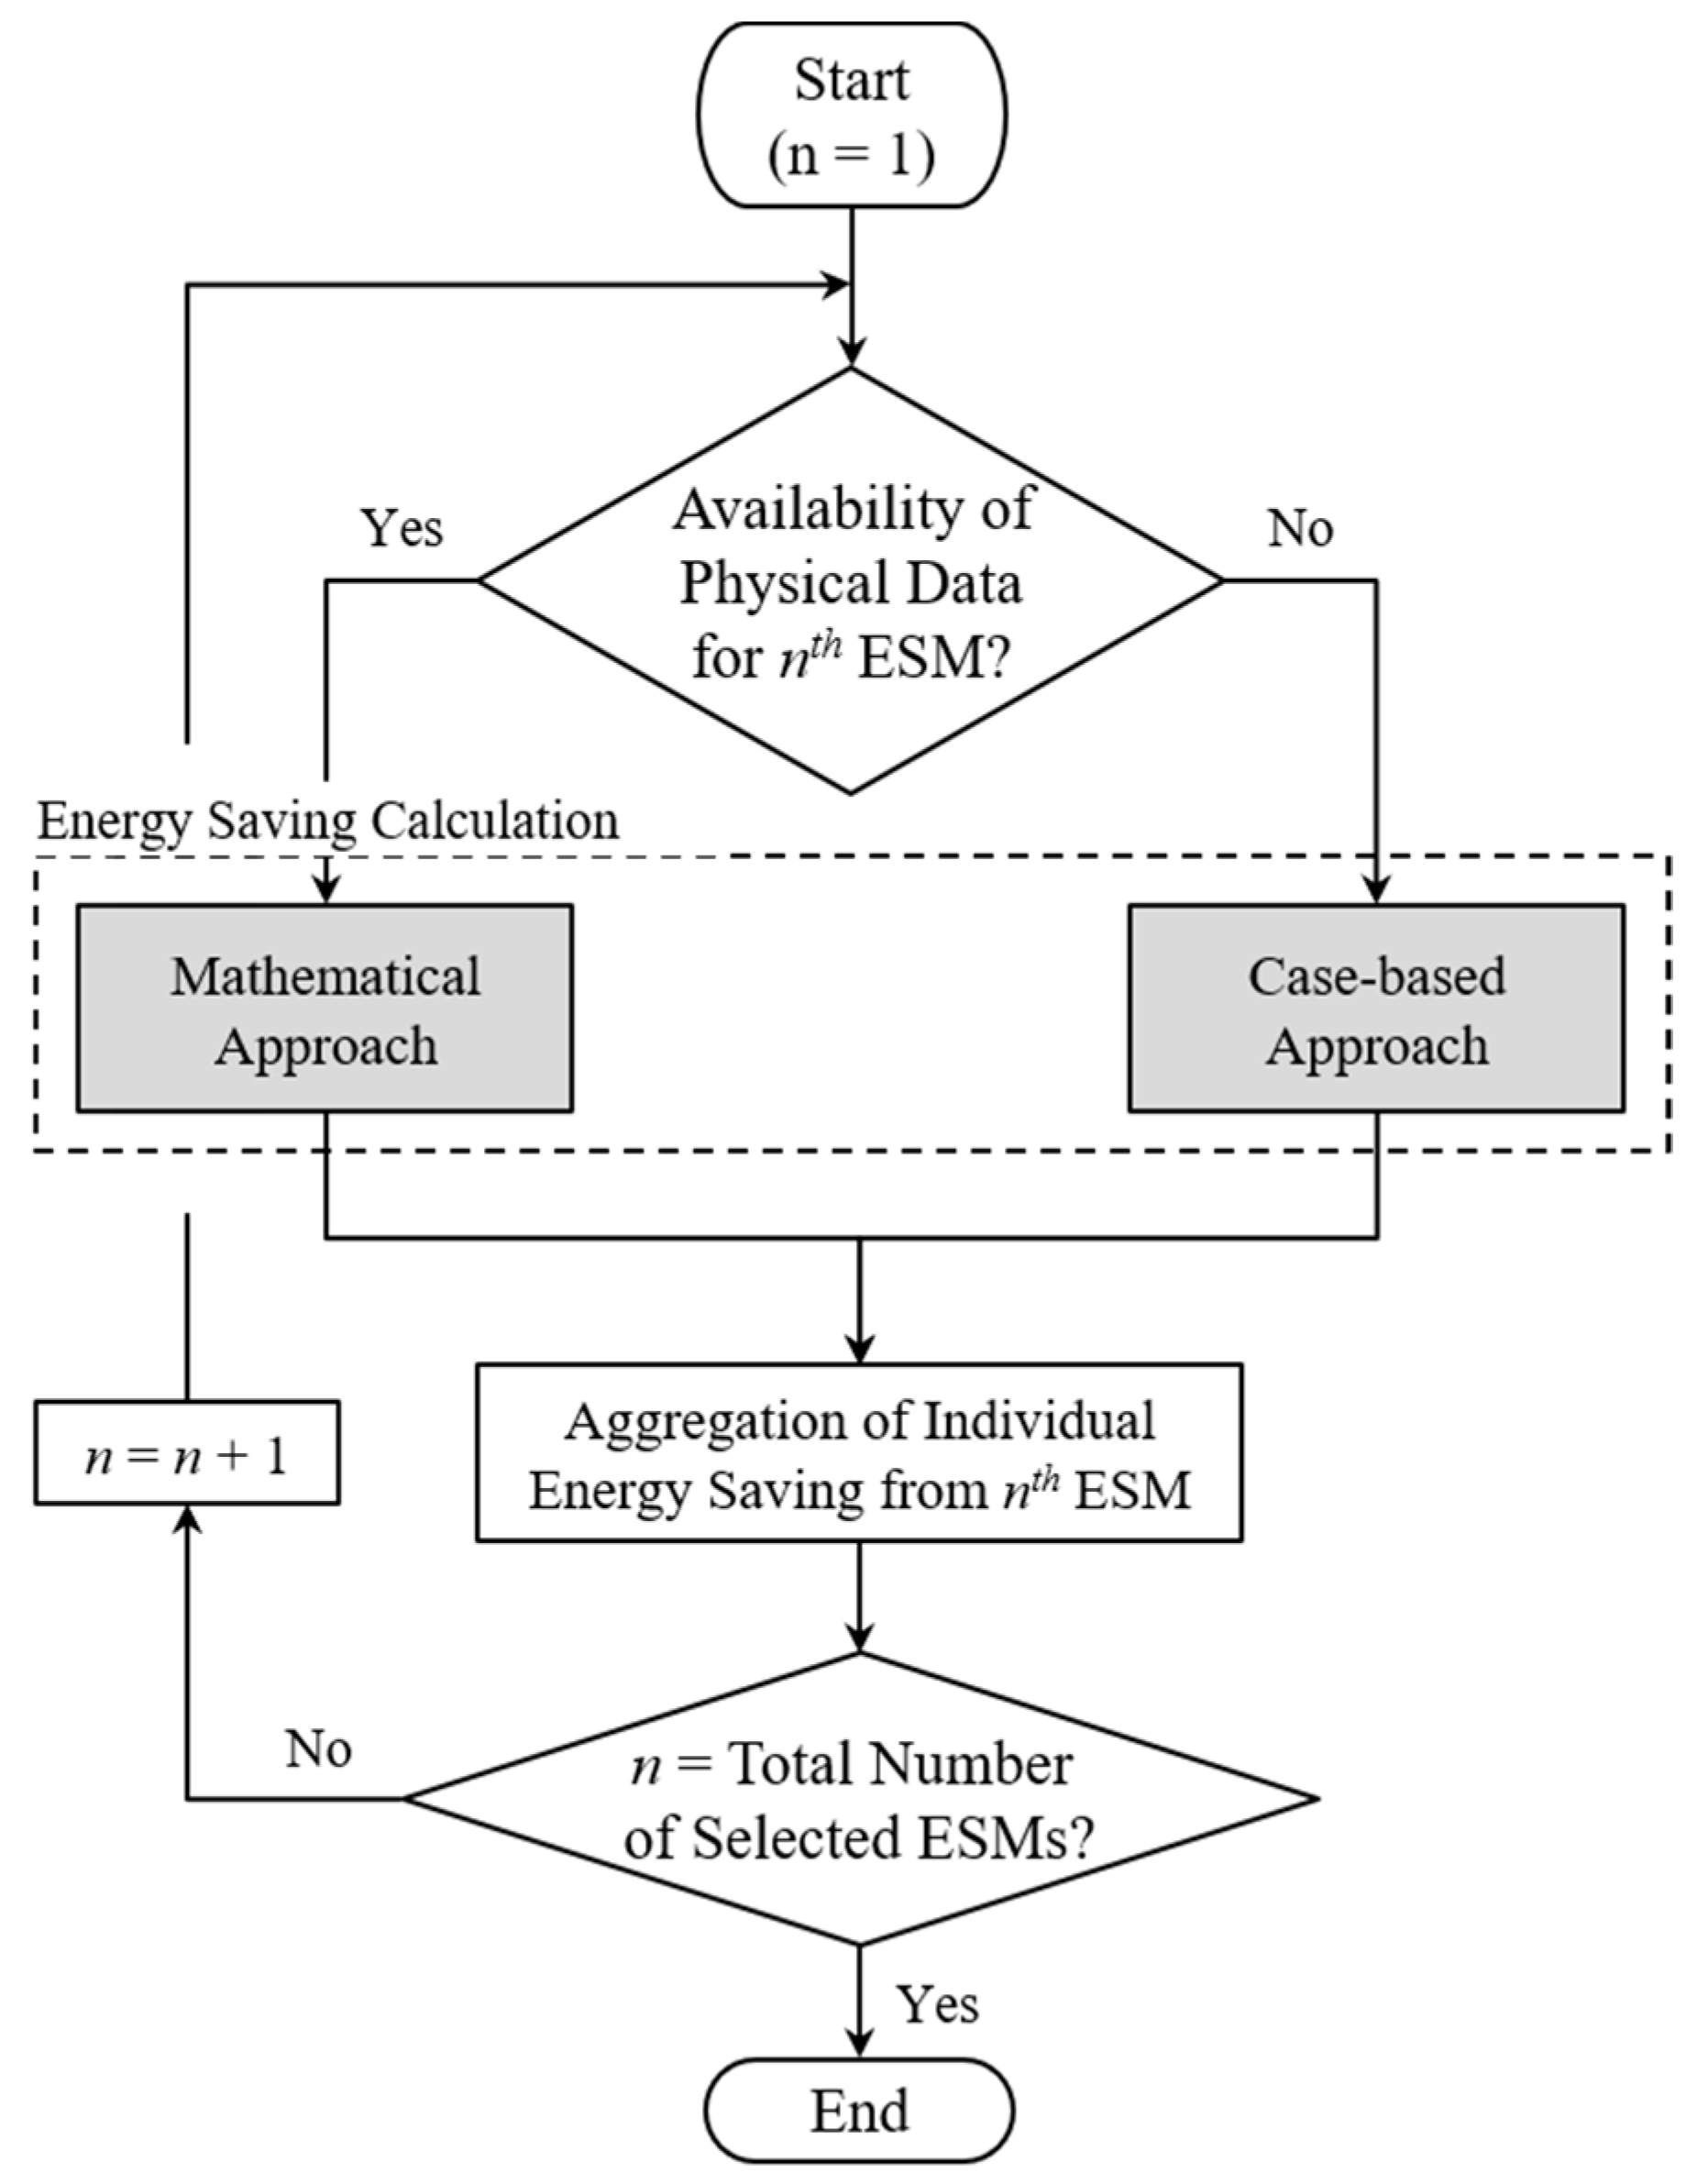
3.2. Energy Saving Calculation

In order to calculate the amount of energy saving, this study introduces the following two approaches. The first calculation approach (i.e., mathematical approach) is based on the physical property of ESMs. The amount of energy saving is calculated by subtracting the new energy consumption from the existing consumption as follow.
S n   =   E e   E n
where, Sn is the amount of energy saving for the nth ESM, Ee is the amount of existing energy consumption, En is the amount of new energy consumption, and er is the percentage of energy saving for the nth ESM. For example, when a 20 W incandescent lamp is replaced with a 7.2 W LED bulb under the same usage condition, the amount of energy saving is represented by Equation (2).
S L = ( 20 W × 1 E A × 250 d × 8 h × 0.001 ) ( 7.2 W × 1 E A × 250 d × 8 h × 0.001 ) = 25.6 k W h
The second calculation approach (i.e., case-based approach) uses the percentage of energy saving derived from previous experiments. The amount of energy saving is calculated by multiplying the percentage of energy saving by the existing energy consumption, as presented in Equation (3).
S n   =   E e × e r
where, er is the percentage of energy saving for the nth ESM. For instance, when installing a counter sensor contributes to 80% energy saving compared to existing energy consumption of 20 kWh, the amount of energy saving can be calculated using Equation (4).
S C = 20 k W h × 80 % = 16 k W h
The usage of the proposed calculation approaches is determined based on the availability of physical data for ESMs (Figure 4). Additionally, the amount of energy saving for ESMs can vary depending on weather condition and thus need to be normalized. However, this process requires a substantial effort to predict weather conditions during the life cycle of ESMs and then to investigate their energy saving effect at a temporally high level (e.g., hourly, daily). Considering that limited time and information are provided to building owners in the early design phase of retrofit projects, it is difficult to consider dynamic weather conditions during the energy saving calculation process [14]. For this reason, we calculate the amount of energy saving using the proposed two approaches. After calculating the individual amount of energy saving for the selected ESMs, the total amount of energy saving is calculated using Equation (5).
S t = ( α n × S n )
where, St is the total amount of energy saving; and αn is (0 = unused, 1 = used) for the nth ESM.

3.3. Analysis of Life Cycle Cost

From a life cycle perspective, ESMs continue to generate various expenses in the course of their installation, operation, maintenance, and demolition. Several studies [28,29,30,31] discovered that the demolition cost accounts for less than 5% of the overall cost. For this reason, this study only considers the installation, operation, and maintenance cost, and excludes the demolition cost from the analysis of life cycle cost. Equation (6) indicates a method to estimate the life cycle cost for the available ESMs Clong.
C l o n g = n = 1 75 { C i · n + C o · n + C o m · n + C p m · n } × α n
where, Ci·n is the installation cost for the nth ESM, Co·n is the operation cost for the nth ESM, Cm·n is the maintenance cost for the nth ESM and αn is (0 = unused, 1 = used) for the nth ESM.
The installation cost is a cost that is required to apply ESMs to existing buildings, including material, labor, and expense. It is calculated by multiplying the quantity of the nth ESM Qn by its unit cost Cu∙n (Equation (7)). According to Jaggs and Palmer [6], there are two indices to estimate the installation cost: (1) tender price indices, and (2) building cost indices. They consider that tender price indices are more accurate than building cost indices, since the former includes profit for a constructor. Thus, in this study, the installation cost is based on tender price indices. In order to collect the information about unit price for each ESM, we refer to the Monthly Construction Market Price: May 2012 [32].
C i · n = C u · n × Q n
The operation cost is caused by electricity, gas, and water consumption. In this research, the operation cost is defined as the amount of energy saving from ESMs during the operation phase. Thus, there should be a negative value if ESMs contribute to energy saving. The mathematical terms of Co∙n can be described by the following equation.
C o · n = S n × T n × C e
where, Sn is the amount of energy saving the nth ESM, Tn is the total operation periods (i.e., hours) during the life cycle of the nth ESM and Ce is the energy cost. For the total operation periods, we made the following two assumptions due to its dynamic variations over time, making it difficult to calculate the operation cost. First, buildings are used under the same operation conditions (e.g., the number of occupants, the time of use of electrical and mechanical equipment). Second, the life cycle of ESMs (e.g., bulbs) does not vary by its usage patterns. Moreover, the energy price varies according to the total amount of energy consumed in South Korea. However, in order to make an easier comparison with energy retrofit plans, this study uses the average price of energy provided by MKE in 2011 [33].
The maintenance cost is caused when repairing or replacing equipment during its life cycle. To determine the maintenance cycle and cost for each ESM, this study follows A Guideline for Long-term Maintenance Plan [34]. According to this guideline, maintenance is divided into two types: (1) partial, and (2) overall maintenance. In general, partial maintenance is more frequent and more economic than overall maintenance, due to the maintenance level. As a method to estimate the maintenance cost, this guideline also suggests the rate of maintenance level, which means the percentage of maintenance cost compared to the installation cost, as indicated in Equation (9).
R = C p C i
where, R is the rate of maintenance level, Cp is the maintenance cost, and Ci is the installation cost. For example, given that the installation cost is $1000 and the rate of partial maintenance level is 20%, the partial maintenance cost is $200. In this manner, the overall Com∙n and partial Cpm∙n maintenance cost is calculated using the following equations, respectively.
C o m · n = C i · n × R o m · n × L n P o m · n
C p m · n = C i · n × R p m · n × L n P p m · n
where, Rom∙n is the rate of overall maintenance for the nth ESM, Rom∙n is the rate of partial maintenance for the nth ESM, Pom∙n is overall maintenance cycle for the nth ESM, Ppm∙n is overall maintenance cycle for the nth ESM and Ln is the life cycle for the nth ESM.
Additionally, as the values of operation and maintenance costs tend to fluctuate with time, it is necessary to consider a discount rate while calculating a life cycle cost. To discount a single cash flow to present value, we use Equation (12) with the real discount rate of 2.54%, which is derived from the average value from 1993 to 2011 in South Korea [35]. When the cumulative present value of the nth ESM is negative, it is profitable.
P V = F V n ( 1 + i r ) n
where, P V is the present value, F V is the future value, and i r is the real discount rate (%).

4. Energy Saving Strategy Model

4.1. Applicable Energy Saving Measure Selection Process

4.1.1. Compatibility among Energy Saving Measures

As described in Section 3.1, there are a number of ESMs in each saving sector. Various options included in a solution are classified by the physical property of material or equipment. According to this classification, only one option in each solution has an opportunity to be selected as an energy retrofit plan. For example, when single glazing is replaced with double glazing with a thickness of 18 mm, no other double glazing with a different thickness can be selected as an energy retrofit plan. In this way, this study determines the compatibility among ESMs in the solution and option layer.
In the solution layer, the compatibility occurs in the following four ESMs (Table 1): (1) Outside Insulation and Inside Insulation, and (2) LED Bulb and Reflector.
In the option layer, the compatibility occurs in the following solutions (Table 2): Outside insulation in wall and roof, inside insulation in wall and roof, window glazing, LED bulbs in toilet, hallway and stairs, high-efficiency transformer, electric heat pump, and photovoltaic system.

4.1.2. Correlation between Energy Saving Measure and Energy Consumption

In general, buildings consume energy for heating, cooling, lighting, and personal purpose (e.g., laptop). This study defines the relation between ESMs and the purpose of energy consumption as a correlation, which is classified into primary and secondary energy saving. Primary energy saving is basic energy saving, and occurs in the directly related purpose of energy consumption. For example, applying the insulating materials to the building envelope will improve the heat insulation property. This leads to a decrease in energy consumption for heating and cooling. Secondary energy saving is an additional energy saving caused by primary energy saving. For example, primary energy saving by LED bulb results in a reduction in cooling loads, because the lighting affects the increase and decrease of cooling loads [36]. Table 3 shows the correlation according to the cause of energy saving:

4.2. Development of Energy Saving Strategy Model

This study proposes an Energy Saving Strategy Model (ESSM), which facilitates to find an optimal energy retrofit plan. This model is implemented on Excel Spreadsheet using genetic algorithm, and divided into three modules, depending on its main task (Figure 5).

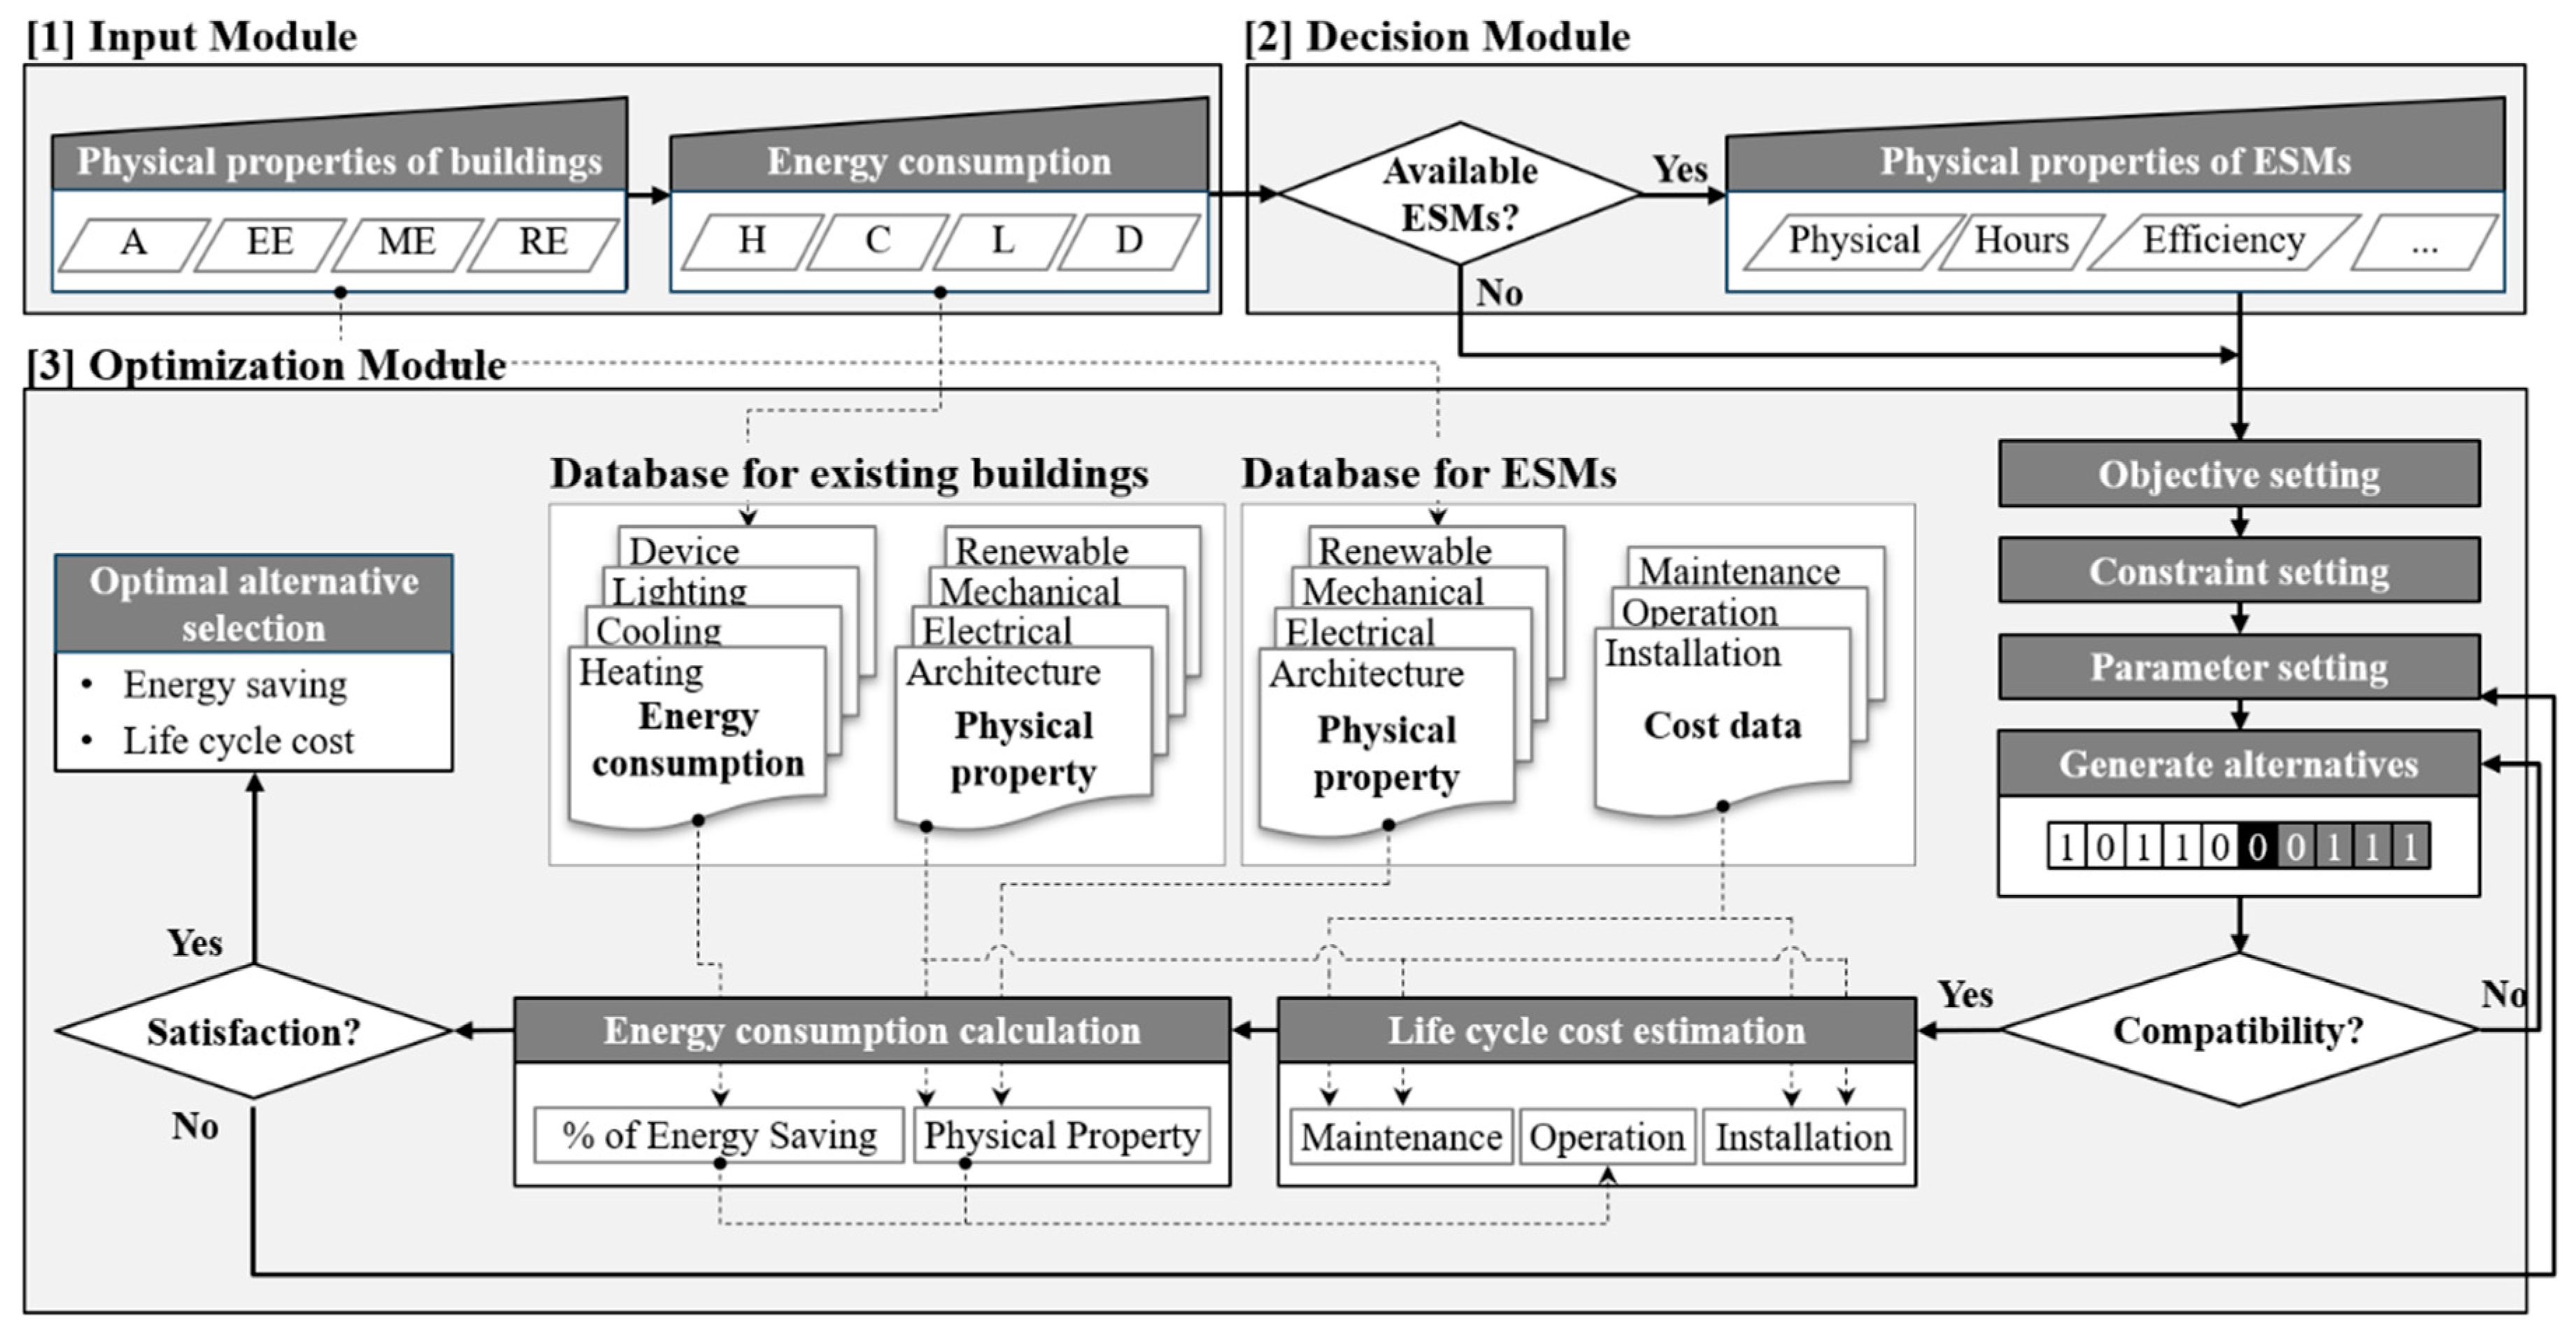
4.2.1. Input Module by User

The user inputs data about building’s physical properties, such as the area of outside wall, inside wall, and window, as shown in Table 4. The input data is transferred to module 3, and then used to calculate the amount of energy saving and the life cycle cost for energy retrofit plans. In addition, the user inputs the annual energy consumption according to its purpose, which is utilized for calculating the amount of energy saving by Equation (3) in Section 3.2.

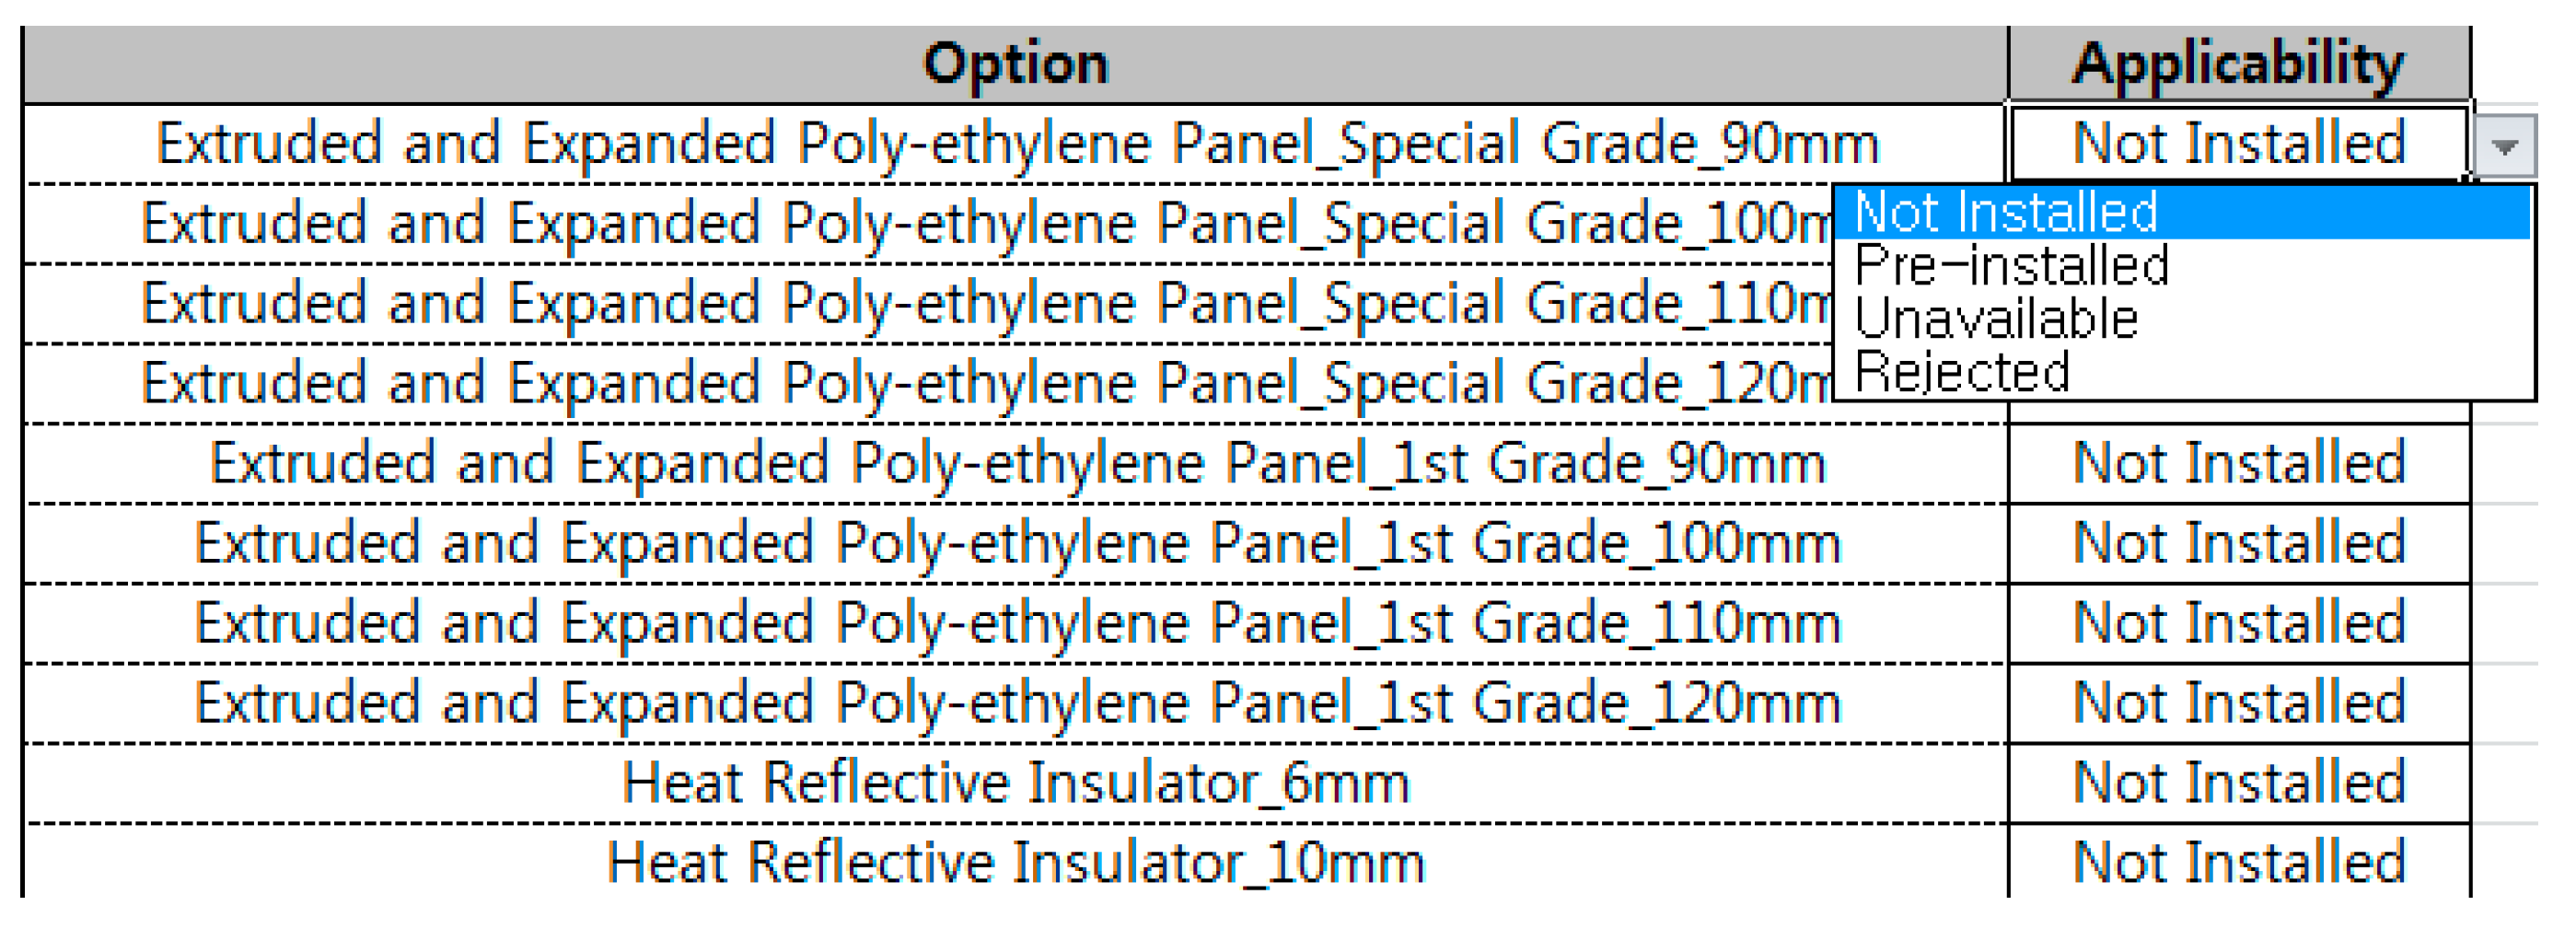
4.2.2. Decision Module by User

The user selects the applicable ESMs that can be used for energy retrofit plans. However, users need to carry out the pre-investigation about the current conditions of case buildings. Based on the results of pre-investigation, users should determine one of four options, as shown in Figure 6. The description of each option is as follows:
  • Not installed: The ESM has not been applied to the case building, therefore it is available to be installed.
  • Pre-installed: Already installed in the case building.
  • Unavailable to be installed: Due to the physical property of the ESM, it is unsuitable to be installed in the case building.
  • Rejection of installation: The user does not want to apply this ESM.

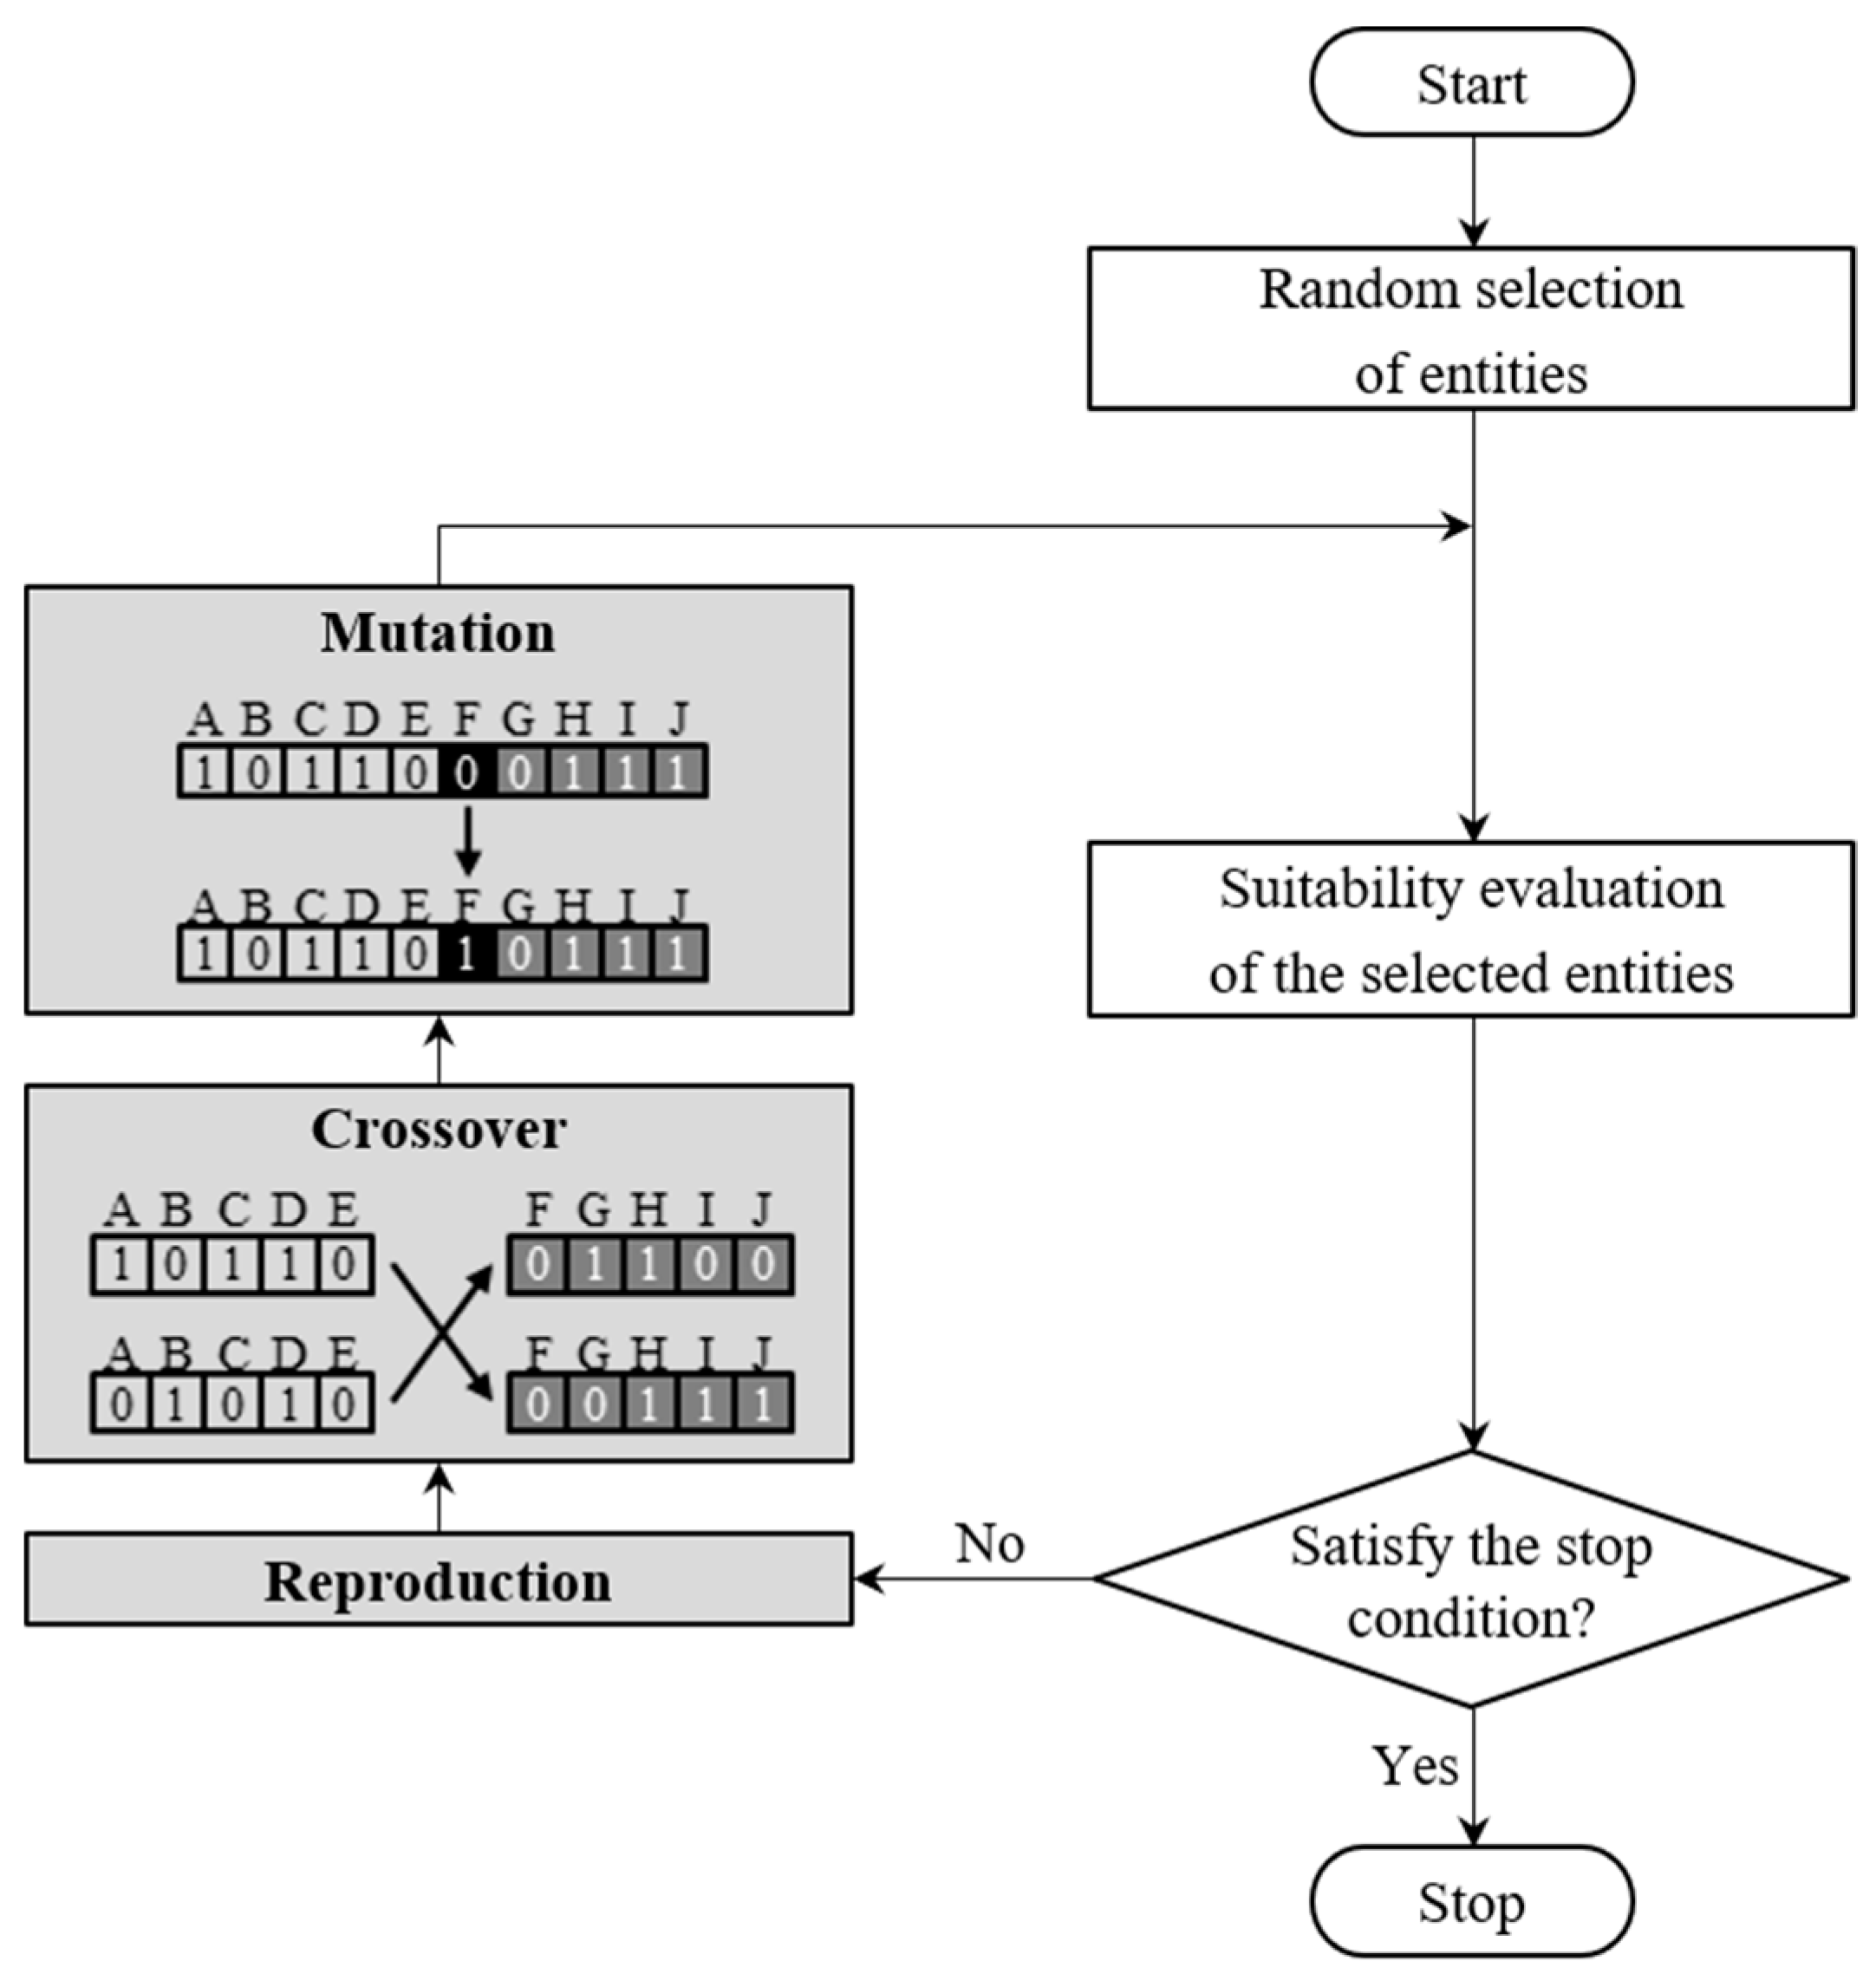
4.2.3. Optimization Module by Operator

In this module, an optimal energy retrofit plan will be selected by comparing the energy saving and life cycle cost of various energy retrofit plans. The search process using genetic algorithm is performed as follows:
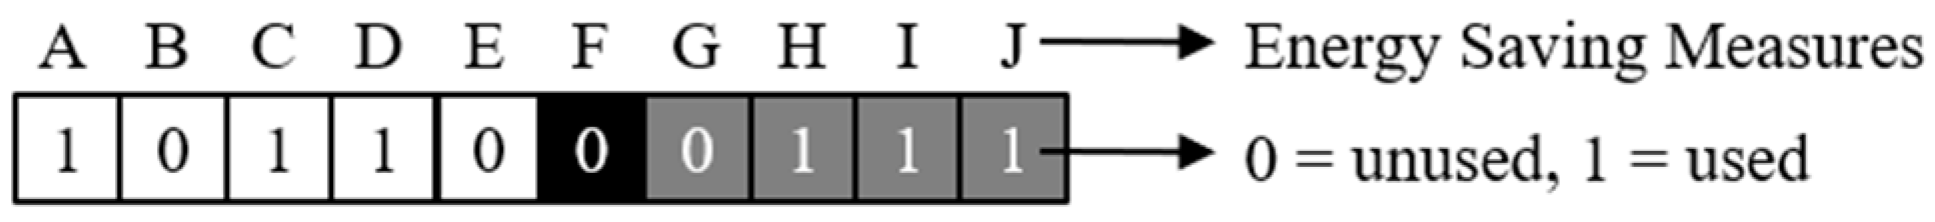
  • Step 1 - After users set up an objective, constraints, stop condition, and parameters for a retrofit project, genetic algorithms randomly produce a number of energy retrofit plans which include multiple ESMs. In this production process, the ESMs that can be applied to existing buildings have the value 0 or 1, whereas ESMs that have been already applied should have the value 0.
  • Step 2 - The operator determines whether the randomly selected ESMs are simultaneously compatible for an energy retrofit plan. When the energy retrofit plan is comprised of compatible ESMs, it survives, and is transferred to the next step (i.e., survived energy retrofit plans). On the other hand, the energy retrofit plan that has incompatible ESMs is removed.
  • Step 3 - For the survived energy retrofit plans that have compatible ESMs, the operator calculates the life cycle cost and the amount of energy saving. The life cycle cost is estimated based on the physical properties of case buildings in module 1, and the cost data from the ESM DB. The data used for energy saving calculation is different according to the calculation method. Equation (1) in Section 3.2 utilizes the physical properties of case buildings and ESMs input in module 1. On the other hand, Equation (3) is based on data about annual energy consumption transferred from module 1.
  • Step 4 - The operator finally selects an optimal energy retrofit plan compared to other survived energy retrofit plans. Until the stop condition is satisfied, each generation continually produces new energy retrofit plans by mutation and crossover.

5. Results and Discussion

5.1. Profiles of Case Building

To validate the proposed model, we carry out a case study. The case building belongs to the college of Liberal Arts on a university campus in South Korea, which was constructed in 1974. It is a non-insulated building built prior to the enforcement of the Building Energy Saving Clause. Table 5 shows profiles of the case building where the energy retrofit project is in progress.
Table 6 shows the annual energy consumption of the case building in 2011. Since the meter installed in the case building measures only the total amount of energy consumption, an occupant survey is conducted to calculate the energy consumption according to its purpose. The questionnaire consists of a number of questions, such as type of energy consuming device, quantity, and duration of device usage.

5.2. Existing Energy Retrofit Plan

To investigate the energy saving technologies planned from ESMs, we refer to the bills of quantities (BoQ) used in the case building, which is a document that represents the quantities and unit costs of material, labor, and equipment by work type. Also, in order to analyze the life cycle cost, it is assumed that the case building will serve for the next 40 years. From the BoQ, it is found that Inside Insulation, Glazing, LED bulb, Occupancy Sensor, and Counter Sensor are utilized as ESMs. Table 7 shows that the life cycle cost is $148,931, and the total amount of energy saving is 19.7113 toe.

5.3. Validation Procedure

The validation procedure for the ESSM is as follows.
Step 1. Input the physical properties of the case building.
With help from the facilities and technology division in the university, the information about the physical properties of the case building can be collected, as shown in Table 8. This information will be used to calculate the amount of energy saving, and analyze the life cycle cost for energy retrofit plans.
Step 2. Draw the applicable energy saving measures.
On the basis of the information input in step 1, this step determines the available ESMs to be applied to the case building. In the architecture sector, all of the 41 options in ESM DB are applicable, since single glazing and non-insulated wall were installed in the case building. In the electrical equipment sector, there are 13 out of 14 options available, due to the transformer capacity. The existing transformer is 500 kWh, leading to the possibility of selecting only 3 transformer options less than 500 kWh as ESMs. In the mechanical equipment sector, there is only one option in each solution, except for the electric heat pump. Similar to the previous sector, installing a heat recovery system depends on the air volume in ducts, where only one 350 CMH of six options is available. For steam traps, 20 mm in diameter could be installed as an ESM. For insulation of the piping system, although the diameter of the existing pipe is 15 mm, we selected 40 mm insulating material, without considering the thickness of 25 mm. Accordingly, it is possible to apply five options to the case building. In the renewable energy sector, it can be judged to apply three options to the case building. In summary, there are 63 options applicable for this case study (Table 9).
Step 3. Carry out the optimization.
Before the optimization, we set the objective function, constraints, parameters of genetic algorithm and stop condition for this case study. The objective of this optimization is to maximize the total amount of energy saving and minimize the life cycle cost. As a constraint, the budget limit is set at $55,900. The parameter value for population, crossover rate, and mutation rate is 60, 0.6%, and 0.05% respectively. With these parameters, the termination criterion is to not change the improvement in reliability of optimization results for two hours.

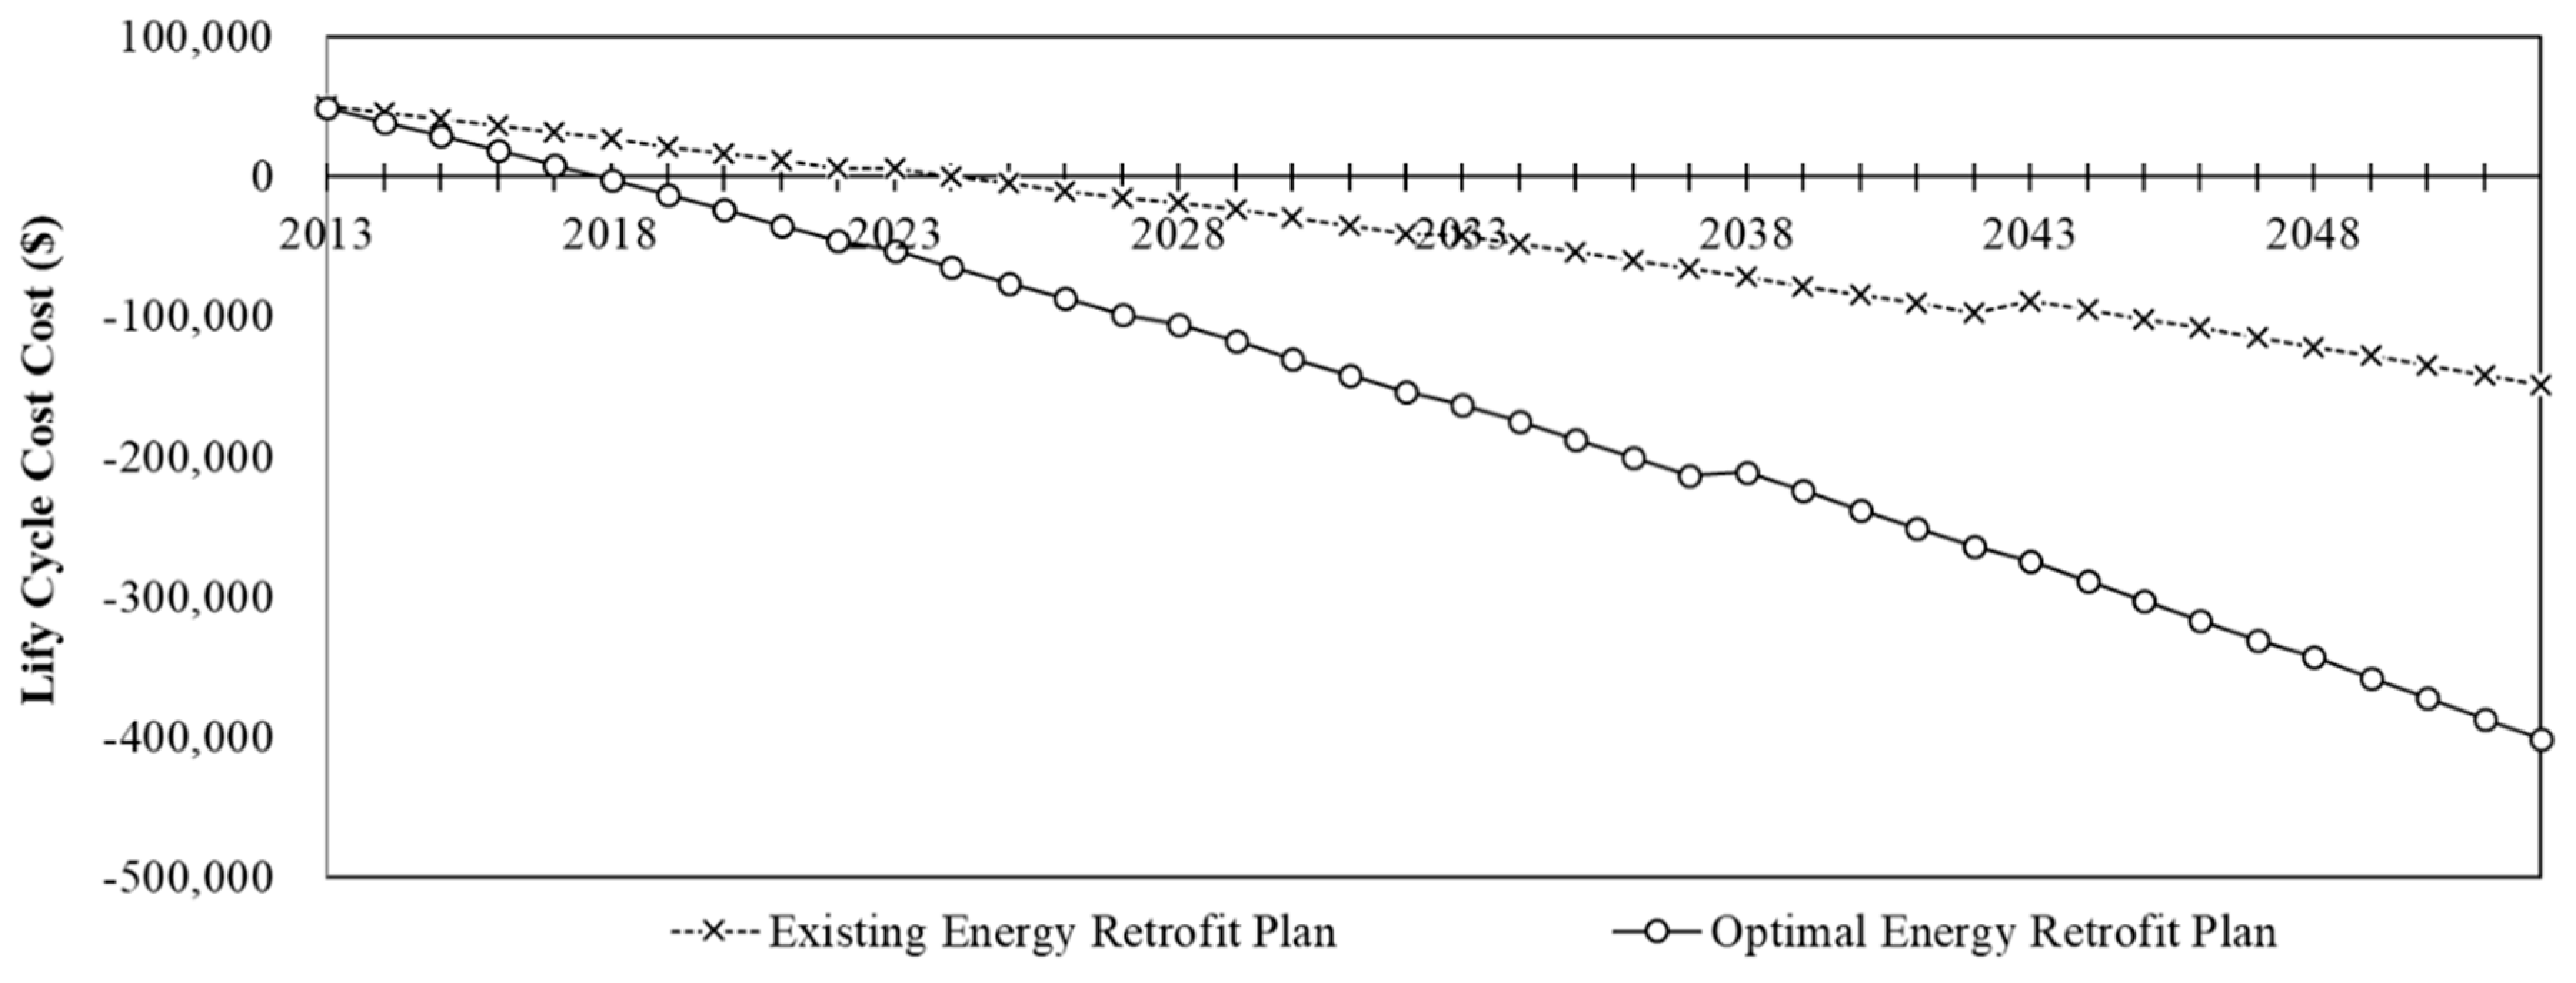
5.4. Optimization Results

Table 10 shows the optimization results of this case study. For the optimal energy retrofit plan, the total amount of energy saving is 36.5688 toe per year, and applying the ESMs incurs the life cycle cost of −$401,744 for the next 40 years. When compared with the existing energy retrofit plan, its annual energy consumption and life cycle cost tend to be higher than that of the optimal energy retrofit plan. In terms of investment efficiency, the existing energy retrofit plan requires $2591 to reduce 1 toe, whereas the optimal energy retrofit plan is $1358. This phenomenon results from a reduction in energy overconsumption of the transformer by reducing its capacity from 500 to 100 kVA. Also, such amount of energy saving leads to an increase in operation cost as revenue.
Figure 7 indicates the change in life cycle cost for the existing and optimal energy retrofit plan. The average slope of the existing energy retrofit plan tends to be lower than that of the optimal energy retrofit plan, due to the relatively low efficiency of investment, as mentioned earlier. Break-even points for the existing and optimal energy retrofit plan occur in 2024 and 2017, respectively. After that time, the revenue from energy saving occurs until 2052. Also, it is found that at the end of this period, the slope of both plans is slightly increased, due to the overall maintenance. In the existing energy retrofit plan, the double glazing is replaced with new glazing in 2043. In the optimal energy retrofit plan, the overall maintenance for the transformer takes place in 2038.

5.5. Limitation and Challenges

From the case study, it was found that the proposed ESSM generates a cost-effective retrofit plan for the university building. The optimized ESMs would be expected to not only maximize energy saving but also to minimize life cycle cost. Additionally, it seems that such benefits will increase through integrating the proposed model with heating, ventilation and air-conditioning (HVAC) system control. In general, HVAC systems account for approximately 50% of building energy consumption [37]. Yang et al. [38] reported that HVAC system control (i.e., adjustment of temperature setpoint) contributes to reducing building energy consumption up to 33.6% against the reference period. Particularly, HVAC system control has a high compatibility with other ESMs (e.g., LED bulbs, outside/inside insulation). Therefore, using HVAC system control would provide an additional energy saving even though an optimized retrofit plan is found.
For the proposed ESSM, additional efforts are required to enhance its effectiveness. For example, the percentage of energy saving which is used for the case-based energy saving calculation needs to be updated periodically because it can decrease over time (i.e., decreased performance of ESMs). Also, as various ESMs have been being proposed in the field of building energy use management, it is necessary to explore its availability for energy retrofitting of existing buildings and then to include them into the energy saving measure database.

6. Conclusions

The environmental crisis of climate change is leading to energy saving in the building sector. In particular, developed countries, where the ratio of new buildings is gradually decreasing, should reduce energy consumption in existing buildings to achieve their energy-saving goal. Using decision support models enables building owners to establish a cost-effective energy retrofit plan for existing buildings. However, the current models are time-intensive for energy consumption calculation and are targeted to certain spatial contexts. Therefore, this study develops an Energy Saving Strategy Model that considers energy saving potential of diverse ESMs together with their life cycle cost. In addition, to deal with convergence onto a local optimum, this study adopts genetic algorithms as a means to find an optimized energy retrofit plan. To validate the proposed model, a case study is carried out on a building of a university campus in South Korea. From the case study, it is found that in terms of energy saving and life cycle cost, the optimal energy retrofit plan is more cost-effective than the existing energy retrofit plan. In particular, the break-even point for the optimal energy retrofit plan is within five years, and then revenue from energy saving continually occurs until 2052. Therefore, it can be said that using the proposed model searches for all of the energy retrofit plans in the global area, and finally select optimal ESMs. The contribution of this research is to enhance the knowledge about how life cycle cost of ESMs affects the effectiveness of energy retrofit projects in existing buildings. With the proposed model, building owners would be allowed to establish an optimal energy saving strategy to maximize energy saving while minimizing life cycle cost.

Author Contributions

Conceptualization, K.S., Y.A. and N.K.; Investigation, J.A.; Methodology, K.S., Y.A. and N.K.; Supervision, Y.A. and J.A.; Validation, K.S. and N.K.; Writing—original draft, K.S. and N.K.; Writing—review & editing, K.S., Y.A., J.A. and N.K.

Acknowledgments

This work was supported by the National Research Foundation of Korea (NRF) grant funded by the Korea government (Ministry of Science and ICT) (No. 2015R1A5A1037548). The authors wish to express their gratitude for the support.

Conflicts of Interest

The authors declare no conflict of interest.

References

  1. Energy Information Administration (EIA) Total Energy: Energy Consumption by Sector. Available online: https://www.eia.gov/totalenergy/data/monthly/index.php (accessed on 21 January 2019).
  2. European Commission (EC) Statistical Pocektbook 2018. Available online: https://ec.europa.eu/energy/sites/ener/files/documents/PocketBook_ENERGY_2015 PDF final.pdf (accessed on 21 April 2019).
  3. Baker, N.V. The Handbook of Sustainable Refurbishment: Non-Domestic Buildings; Earthscan: London, UK, 2009. [Google Scholar]
  4. Ramírez-Villegas, R.; Eriksson, O.; Olofsson, T.; Ramírez-Villegas, R.; Eriksson, O.; Olofsson, T. Life Cycle Assessment of Building Renovation Measures–Trade-off between Building Materials and Energy. Energies 2019, 12, 344. [Google Scholar] [CrossRef]
  5. Nydahl, H.; Andersson, S.; Åstrand, A.; Olofsson, T.; Nydahl, H.; Andersson, S.; Åstrand, A.P.; Olofsson, T. Environmental Performance Measures to Assess Building Refurbishment from a Life Cycle Perspective. Energies 2019, 12, 299. [Google Scholar] [CrossRef]
  6. Jaggs, M.; Palmer, J. Energy performance indoor environmental quality retrofit — a European diagnosis and decision making method for building refurbishment. Energy Build. 2000, 31, 97–101. [Google Scholar] [CrossRef]
  7. Lee, S.; Ahn, Y.; Lee, S.; Ahn, Y. Analyzing the Long-Term Service Life of MEP Using the Probabilistic Approach in Residential Buildings. Sustainability 2018, 10, 3803. [Google Scholar] [CrossRef]
  8. Park, S.; Ahn, Y.; Lee, S.; Park, S.; Ahn, Y.; Lee, S. Analyzing the Finishing Works Service Life Pattern of Public Housing in South Korea by Probabilistic Approach. Sustainability 2018, 10, 4469. [Google Scholar] [CrossRef]
  9. Issa, M.H.; Attalla, M.; Rankin, J.H.; Christian, A.J. Detailed Analysis of the Construction, Operating, Maintenance, and Rehabilitation Costs of Green Toronto Schools. J. Archit. Eng. 2013, 19, 1–11. [Google Scholar] [CrossRef]
  10. Prajapati, A.; Bechtel, J.; Ganesan, S. Condition based maintenance: A survey. J. Qual. Maint. Eng. 2012, 18, 384–400. [Google Scholar] [CrossRef]
  11. Ministry of Land, Transportation and Maritime Affairs (MLTM). A Revision of Design Guidelines for Energy Saving in Building; MLTM: Seoul, Korea, 2010.
  12. Thuvander, L.; Femenías, P.; Mjörnell, K.; Meiling, P.; Thuvander, L.; Femenías, P.; Mjörnell, K.; Meiling, P. Unveiling the Process of Sustainable Renovation. Sustainability 2012, 4, 1188–1213. [Google Scholar] [CrossRef] [Green Version]
  13. Rosenfeld, Y.; Shohet, I.M. Decision support model for semi-automated selection of renovation alternatives. Autom. Constr. 1999, 8, 503–510. [Google Scholar] [CrossRef] [Green Version]
  14. Nielsen, A.N.; Jensen, R.L.; Larsen, T.S.; Nissen, S.B. Early stage decision support for sustainable building renovation—A review. Build. Environ. 2016, 103, 165–181. [Google Scholar] [CrossRef]
  15. Alanne, K. Selection of renovation actions using multi-criteria “knapsack” model. Autom. Constr. 2004, 13, 377–391. [Google Scholar] [CrossRef]
  16. Hong, T.; Kim, H.; Kwak, T. Energy-Saving Techniques for Reducing CO2 Emissions in Elementary Schools. J. Manag. Eng. 2011, 28, 39–50. [Google Scholar] [CrossRef]
  17. Juan, Y.K.; Kim, J.H.; Roper, K.; Castro-Lacouture, D. GA-based decision support system for housing condition assessment and refurbishment strategies. Autom. Constr. 2009, 18, 394–401. [Google Scholar] [CrossRef]
  18. Pohekar, S.D.; Ramachandran, M. Application of multi-criteria decision making to sustainable energy planning—A review. Renew. Sustain. Energy Rev. 2004, 8, 365–381. [Google Scholar] [CrossRef]
  19. Jensen, P.A.; Maslesa, E. Value based building renovation—A tool for decision-making and evaluation. Build. Environ. 2015, 92, 1–9. [Google Scholar] [CrossRef]
  20. Medineckiene, M.; Zavadskas, E.K.; Björk, F.; Turskis, Z. Multi-criteria decision-making system for sustainable building assessment/certification. Arch. Civ. Mech. Eng. 2015, 15, 11–18. [Google Scholar] [CrossRef]
  21. Pasanisi, A.; Ojalvo, J. A multi-criteria decision tool to improve the energy efficiency of residential buildings. Found. Comput. Decis. Sci. 2008, 33, 71–82. [Google Scholar]
  22. Kanapeckiene, L.; Kaklauskas, A.; Zavadskas, E.K.; Raslanas, S. Method and system for Multi-Attribute Market Value Assessment in analysis of construction and retrofit projects. Expert Syst. Appl. 2011, 38, 14196–14207. [Google Scholar] [CrossRef]
  23. Korea Energy Management Corporation (KEMCO). Energy Saving Statistic Handbook; KEMCO: Seoul, Korea, 2011.
  24. Kastor, A.; Sirakoulis, K. The effectiveness of resource levelling tools for Resource Constraint Project Scheduling Problem. Int. J. Proj. Manag. 2009, 27, 493–500. [Google Scholar] [CrossRef]
  25. Beightler, C.S.; Phillips, D.T.; Wilde, D.J. Foundations of Optimization, 2nd ed.; Prentice-Hall: Englewood Cliffs, NJ, USA, 1979. [Google Scholar]
  26. Goldberg, D.E. Genetic Algorithms in Search, Optimization, and Machine Learning, 28th ed.; Addison Wesley Longman: Boston, MA, USA, 1989. [Google Scholar]
  27. Song, K.; Kim, S.; Park, M.; Lee, H.-S. Energy efficiency-based course timetabling for university buildings. Energy 2017, 139. [Google Scholar] [CrossRef]
  28. Aye, L.; Bamford, N.; Charters, B.; Robinson, J. Environmentally sustainable development: A life-cycle costing approach for a commercial office building in Melbourne, Australia. Constr. Manag. Econ. 2000, 18, 927–934. [Google Scholar] [CrossRef]
  29. Crowther, P. Design for Disassembly to Recover Embodied Energy. Fac. Built Environ. Eng. 1999. Available online: http://eprints.qut.edu.au/2846/ (accessed on 21 January 2019).
  30. Stephan, A.; Crawford, R.H.; de Myttenaere, K. Towards a comprehensive life cycle energy analysis framework for residential buildings. Energy Build. 2012, 55, 592–600. [Google Scholar] [CrossRef] [Green Version]
  31. Shen, S.; Vale, B.; Vale, R. A LIFE CYCLE ENERGY COMPARISON OF THREE WORLD EXPO BUILDINGS. J. Green Build. 2011, 6, 151–167. [Google Scholar] [CrossRef]
  32. Construction Association of Korea (CAK). Monthly Construction Market Price: May 2012; CAK: Seoul, Korea, 2012. [Google Scholar]
  33. Ministry of Knowledge Economy (MKE). Yearbook of Energy Statistics; MKE: Seoul, Korea, 2012.
  34. Ministry of Land, Transportation and Maritime Affairs (MLTM). A Guideline for Long-Term Maintenance Plan; MLTM: Seoul, Korea, 2012.
  35. Bank of Korea (BOK). Economic Statistics System. 2013. Available online: http://ecos.bok.or.kr/ (accessed on 21 January 2019).
  36. American Society of Heating, Refrigerating, and Air-Conditioning Engineers (ASHRAE). ASHRAE Handbook Fundamentals; ASHRAE: Atlanta, GA, USA, 2009. [Google Scholar]
  37. Oldewurtel, F.; Sturzenegger, D.; Morari, M. Importance of occupancy information for building climate control. Appl. Energy 2013, 101, 521–532. [Google Scholar] [CrossRef]
  38. Yang, L.; Yan, H.; Lam, J.C. Thermal comfort and building energy consumption implications—A review. Appl. Energy 2014, 115, 164–173. [Google Scholar] [CrossRef]
Figure 1. Process of the Genetic Algorithm [27].
Energies 12 01626 g001
Figure 2. Expression of Energy Retrofit Plan.
Energies 12 01626 g002
Figure 3. Hierarchical Classification of ESMs.
Energies 12 01626 g003
Figure 4. Energy Saving Calculation Process.
Energies 12 01626 g004
Figure 5. Energy Saving Strategy Model using Genetic Algorithm.
Energies 12 01626 g005
Figure 6. Determination of Applicable Energy Saving Measures.
Energies 12 01626 g006
Figure 7. Changes in Life Cycle Cost for Existing and Optimal Energy Retrofit Plan.
Energies 12 01626 g007
Table 1. Compatibility in the Solution Layer.
SolutionInstallation LocationEquation
Outside Insulation
&
Inside Insulation
Wall n = 1 11 α n +   17 27 α n 1
Roof n = 12 16 α n +   28 39 α n 1
LED bulb
&
Reflector
Toilet n = 49 50 α n +   α 63 1
Stairs n = 53 54 α n +   α 60 1
Table 2. Compatibility in the Option Layer.
SolutionInstallation LocationEquation
Outside InsulationWall n = 1 11 α n 1
Roof n = 12 16 α n 1
Inside InsulationWall n = 17 27 α n 1
Roof n = 28 39 α n 1
GlazingWindow n = 40 47 α n 1
LED BulbToilet n = 49 50 α n 1
Hallway n = 51 52 α n 1
Stairs n = 53 54 α n 1
Improvement of Exit LightingEmergency Exit n = 64 66 α n 1
High-efficiency TransformerMachine Room n = 68 73 α n 1
Electric Heat PumpRoom n = 87 88 α n 1
Photovoltaic SystemRoof n = 89 91 α n 1
Table 3. Correlation between ESMs and the Purpose of Energy Consumption.
Saving SectorSolutionPrimary Energy SavingSecondary Energy Saving
HCLDHCLD
ArchitectureOutside insulationOOXXXXXX
Inside insulationOOXXXXXX
GlazingOOXXXXXX
Greenery CoverXOXXXXXX
Electrical
Equipment
LED bulbXXOXXOXX
Occupancy sensorXXOXXOXX
Counter sensorXXOXXOXX
ReflectorXXOXXOXX
Improvement of exit lightingXXOXXOXX
Mechanical
Equipment
High-efficiency transformerXXXOXXXX
Heat recovery systemOXXXXXXX
Replacement of trapOXXXXXXX
Insulation of piping systemOXXXXXXX
Electric heat pumpOOXXXXXX
Renewable EnergyPhotovoltaic systemSubtracted from the total amount of energy saving
1 H = Heating, C = Cooling, L = Lighting, D: Device.
Table 4. Information about case building (Example).
Area of Exterior Wall
(m2)
Area of Interior Wall
(m2)
Area of Slab
(m2)
Area of Window Glass
(m2)
14281384631407
Table 5. Profile of Case Building.
Liberal Arts Building #6
Completion Date1974.08.27
Building Area763 m2
Surface Area3107 m2
Size4 Floors
StructureReinforced Concrete
PurposeEducation and Research
Table 6. Annual Energy Consumption.
Energy SourceEnergy Consumption
ElectricityHeating54,716 kWh
Cooling61,833 kWh
Lighting54,240 kWh
Device122,439 kWh
GasHeating3983 Nm3
Cooling18,229 Nm3
Table 7. Annual Energy Saving and Life Cycle Cost for Existing Energy Retrofit Plan.
Energy
Source
Energy Saving MeasureInstall
Location
Life Cycle
Cost ($) *
Annual Energy Saving (toe)
SolutionOption
ArchitectureInside InsulationHeat Reflective
Insulation_10mm
Wall−91,5007.7764
Non-combustible ceiling
panel_12mm
Roof−56,5335.0892
GlazingDouble-Glazing Transparent_18mmWindow+34,3701.0095
Electrical
Equipment
LED Bulb9.6 WattsToilet+3572Add to
Counter Sensor
Hallway+4167Add to
Occupancy Sensor
Stairs−21310.3283
Occupancy Sensor-Hallway−21,7762.9303
Counter Sensor-Toilet−19,1012.5774
Total−148,93119.7113
* While positive values (+) of life cycle cost indicate a loss, negative values (−) indicate a benefit.
Table 8. Physical Properties of the Case Building.
Saving SectorQuantitative Information
ArchitectureArea of Outside Wall: 1357 m2
Area of Inside Wall: 1243 m2
Area of Roof: 744 m2
Area of Window: 507 m2
Number of Lecture Rooms: 8
Number of Laboratories: 30
Number of Offices: 15
Number of Toilets: 7
Electrical EquipmentNumber of 32 W Fluorescent Lights in Lecture Room: 144
Number of 32 W Fluorescent Lights in Laboratory: 144
Number of 32 W Fluorescent Lights in Office: 110
Number of 20 W Down-lights in Office: 12
Number of 32 W Fluorescent Lights in Hallway: 68
Number of 20 W Down-lights in Hallway: 2
Number of 32 W Fluorescent Lights in Stairs: 9
Number of 32 W Fluorescent Lights in Toilet: 34
Number of 20 W Down-lights in Toilet: 26
Number of 20 W Down-lights in Emergency Exit: 8
Rated Power of Transformer: 500 kVA
Mechanical EquipmentNumber of Boilers: 1
Length of Piping: 985 m
Number of Steam Traps
Electric Heat Pump: Not installed
Renewable EnergyPhotovoltaic System: Not installed
Table 9. Applicable Energy Saving Measures.
Saving
Sector
SolutionOptionSaving
Sector
SolutionOption
AOIExtruded and Expanded Poly-ethylene Panel_Special Grade_90mmOAGLDouble Glazing_Blue_18mmO
Extruded and Expanded Poly-ethylene Panel_Special Grade_100mmODouble Glazing_Blue_24mmO
Extruded and Expanded Poly-ethylene Panel_Special Grade_110mmODouble Glazing_Low-e_24mmO
Extruded and Expanded Poly-ethylene Panel_Special Grade_120mmODouble Glazing_High-performance Low-e_24mmO
Extruded and Expanded Poly-ethylene Panel_Special Grade_160mmOEELED7.2 WattsO
Extruded and Expanded Poly-ethylene
Panel_1st Grade_90mm
O9.6 WattsO
Extruded and Expanded Poly-ethylene
Panel_1st Grade_100mm
OOSOccupant Heat-sensingO
Extruded and Expanded Poly-ethylene
Panel_1st Grade_110mm
OCSCounter SensorO
Extruded and Expanded Poly-ethylene
Panel_1st Grade_120mm
OHRHigh-reflectorO
Extruded and Expanded Poly-ethylene
Panel_1st Grade_160mm
OIEL1.7 WattsO
Heat Reflective Insulator_6mmO3.8 WattsO
Heat Reflective Insulator_10mmO4.5 WattsO
Heat Reflective Insulator_15mmO3-Wire LightingO
IIExtruded and Expanded Poly-ethylene Panel_Special Grade_60mmOTR100 kVAO
Extruded and Expanded Poly-ethylene Panel_Special Grade_70mmO200 kVAO
Extruded and Expanded Poly-ethylene Panel_Special Grade_80mmO300 kVAO
Extruded and Expanded Poly-ethylene Panel_Special Grade_90mmO400 kVAX
Extruded and Expanded Poly-ethylene Panel_Special Grade_110mmO500kVAX
Extruded and Expanded Poly-ethylene Panel_Special Grade_120mmO1000 kVAX
Extruded and Expanded Poly-ethylene Panel_Special Grade_130mmOMEHRS150 CMHX
Extruded and Expanded Poly-ethylene
Panel_1st Grade_60mm
O250 CMHX
Extruded and Expanded Poly-ethylene
Panel_1st Grade_70mm
O350 CMHO
Extruded and Expanded Poly-ethylene
Panel_1st Grade_80mm
O500 CMHX
Extruded and Expanded Poly-ethylene
Panel_1st Grade_90mm
O800 CMHX
Extruded and Expanded Poly-ethylene
Panel_1st Grade_110mm
O1000 CMHX
Extruded and Expanded Poly-ethylene
Panel_1st Grade_120mm
ORT15 mmX
Extruded and Expanded Poly-ethylene
Panel_1st Grade_130mm
O20 mmO
Heat Reflective Insulator_6mmO25 mmX
Heat Reflective Insulator_10mmOIPS15 mm × 25 TX
Heat Reflective Insulator_15mmO15 mm × 40 TO
Noncombustible ceiling panel_9mmO25 mm × 25 TX
Noncombustible ceiling panel_12mmO25 mm × 40 TX
Noncombustible ceiling panel_15mmOEHPEHP_2.5 HorsepowerO
GLDouble Glazing_Tranparent_18mmOEHP_4.0 HorsepowerO
Double Glazing_Tranparent_24mmOREPS40 WpO
Double Glazing_Green_18mmO60 WpO
Double Glazing_Green_24mmO100 WpO
* Saving Sector: A (architectural), EE (electrical equipment), ME (mechanical equipment), RE (renewable energy)
* Solution: OI (outside insulation), II (inside insulation), GL (glazing), LED (LED bulb), OS (occupancy sensor), CS (counter sensor), HR (high-reflector), IEL (improvement of exit light), TR (transformer), HRS (heat recovery system), RT (replacement of trap), IPS (insulation of piping system), EHP (electrical heat pump), PS (photovoltaic system)
Table 10. Annual Energy Saving and Life Cycle Cost for Optimal Energy Retrofit Plan.
Saving
Sector
Energy Saving MeasureInstall
Location
Life Cycle
Cost ($)
Annual Energy Saving (toe)
SolutionOption
ArchitectureOutside InsulationHeat Reflective
Insulator_10mm
Wall−101,2719.1913
Heat Reflective
Insulator_15mm
Roof−56,9815.1490
Electrical EquipmentLED Bulb7.2 WattsHallway+2879Add to
Occupancy Sensor
Stairs−25820.3635
Occupancy Sensor-Hallway−23,1543.1000
Counter Sensor-Toilet−18,5002.5035
Improvement of Exit Light3-Wire LightingEmergency Light−45140.5679
High-efficiency Transformer100 kVATransformer−144,91113.1400
Mechanical EquipmentHeat Recovery System350 CMHBoiler−20,8400.8996
Insulation of Piping System15 mm × 40 TPiping System−31,8721.9991
Total−401,744−36.5688
* While positive values (+) of life cycle cost indicate a loss, negative values (−) indicate a benefit.

