Article

Thermodynamic Analysis of Kalina Based Power and Cooling Cogeneration Cycle Employed Once Through Configuration

Department of Mechanical Engineering, Kumoh National Institute of Technology, Gyeongbuk 39177, Korea
Energies 2019, 12(8), 1536; https://doi.org/10.3390/en12081536
Submission received: 27 March 2019 / Revised: 17 April 2019 / Accepted: 18 April 2019 / Published: 23 April 2019
(This article belongs to the Section F: Electrical Engineering)

Abstract

:
The Kalina cycle (KC) has been considered one of the most efficient systems for harvesting low grade heat since its proposal and various modifications have been proposed. Recently, Kalina based power and cooling cogeneration cycles (KPCCCs) have attracted much attention and many studies have been conducted. In this paper, a cogeneration cycle of power and absorption refrigeration based on the Kalina cycle system 11 (KCS-11) is proposed. The cycle combines a KC and aqua-ammonia absorption refrigeration cycle (ABR) with once through configuration. Compared to the stand-alone KC, the proposed cycle showed significantly higher energy efficiency—as high as 60%—without the use of rectifier, superheater or subcooler. Parametric analysis showed that the ammonia fraction, separator pressure and source temperature have a significant impact on the system performance including mass flow rates, heat transfers, power generation, cooling capacity, energy efficiencies and optimum ammonia fraction for the maximum energy efficiency.

1. Introduction

The Kalina cycle (KC) has been migrated along with the organic Rankine cycle (ORC) as an effective recovery method for low grade heat sources to reduce CO2 emissions and protect the environment [1,2]. The zeotropic ammonia-water mixture used as the working fluid in KC has many advantages [3,4,5]. However, the conventional Rankine cycle using an ammonia-water mixture did not show superior performance to ORC [6]. In 1984, Kalina [7] proposed a novel cycle in which the mixture is separated into liquid and vapor in a separator, high-concentration vapor was introduced into the turbine to produce power and the low-concentration liquid and condensate were mixed. The KC series has shown excellent performance and many studies on KC have been carried out and various modifications have been proposed [8,9].
Guzovic et al. [10] compared ORC and KC using a mid-temperature geothermal source in Croatia. Singh and Kaushik [11] conducted an energy and exergy survey of KC coupled with a coal-fired steam power plant. Li et al. [12] proposed a CAES (Compressed Air Energy Storage) system based on KC and ORC and reported that KC-CAES exhibits more efficient operation and higher efficiency than ORC-CAES. Guo et al. [13] and Zhu et al. [14] studied the KC employed dual-pressure evaporation and showed that the use of cascade of heat source improved efficiency. Cao et al. [15] and Kim et al. [16] investigated the Kalina flash cycle in which the liquid from the liquid-vapor separator of KC is flashed and the generated vapor is used to produce additional power. Ogriseck [17] studied a combined power and heat cogeneration plant based on KC and demonstrated improvement cycle efficiency and advantages of using the ammonia-water mixture.
As energy demand for cooling and air-conditioning increases, power and cooling cogeneration cycles have attracted much attention [18]. Kim and Perez-Blanco [19] studied a power and cooling cogeneration combined with ORC and a vapor compression cycle. Goswami et al. [20,21,22] proposed and analyzed power and refrigeration cogeneration cycles in which an evaporator is placed between the turbine and the absorber. The cycles use an ammonia-water mixture as working fluid and are called Goswami cycles. The higher the quality of the fluid leaving the turbine, the higher the temperature and the higher ammonia fraction of the fluid at the turbine outlet to absorb heat in the evaporator and thus a rectifier or dephlegmator is required. Zhang and Lior [23] and Liu and Zhang [24] proposed an ammonia-water based combined cycle of Rankine and absorption refrigeration cycles and investigated the relative performance of power generation and refrigeration capacity. Jawahar et al. [25] proposed a power and absorption refrigeration cogeneration cycle based on the GAX (Generator Absorber heat eXchange) cycle and analyzed the performance.
Recently, many studies on Kalina based power and cooling cogeneration cycles (KPCCCs) using low-grade heat have been conducted. Zheng et al. [26] proposed a KPCCC in which the separator was replaced witha rectifier and a condenser was introduced. Yu et al. [27] and Zhang et al. [28] proposed KPCCCs with mixer, distributor, absorber, superheater, subcooler and so forth and analyzed the performance of the system including the power and refrigeration capacity according to the main design parameters. Hua et al. [29] proposed and investigated a modified KPCCC driven by medium and low-temperature waste heat and adding an evaporator and a subcooler. Ghaebi et al. [30] and Rashidi and Yoo [31] proposed and analyzed KPCCCs incorporated ejector cooling and a KC. Shokati et al. [32] investigated three configurations of absorption refrigeration/Kalina cogeneration cycles employing double effects, single effect with four pressure levels and single effect with two absorbers and a rectifier.
Shankar and Srinivas [33] proposed a KPCCC with a selectable operating mode among four modes of KC (pure power generation), pure absorption refrigeration (VAR), power and cooling with a share in working fluid and power and cooling with once through. From the parametric study with the varying key parameters of the rectifier effectiveness and separator concentration on the system performance for the source temperature of 150 °C, they reported that the operation with once through configuration showed the highest energy utilization factor (ENUF). The cycle was equipped with a rectifier, a superheater, a subcooler and an additional heat exchanger which are not employed in KCS-11. Therefore, due to the structural complexities, it may be difficult to actually implement them as small-scale power generation systems to harvest low-grade heat.
The performance of the Goswami cycle based on the KCS-11 is limited due to the absence of the condensation of the working fluid after the turbine expansion. To the author’s knowledge, however, a basic thermodynamic performance study on the power and cooling cogeneration cycle based on the KCS-11 with once through configuration has not been reported. The present paper proposes and investigates a new cogeneration cycle with once-through configuration which can produce power and refrigeration simultaneously based on the KCS-11. The parametric study showed that the proposed cycle can get the sufficient low temperature of working fluid at the evaporator inlet for cooling and showed competitive system performance without equipment such as rectifier, superheater, subcooler and additional heat exchanger. The ammonia fraction, separator pressure and source temperature are taken as the key system parameters and the optimum performances for the maximum ENUF with respect to the ammonia fraction were also studied.

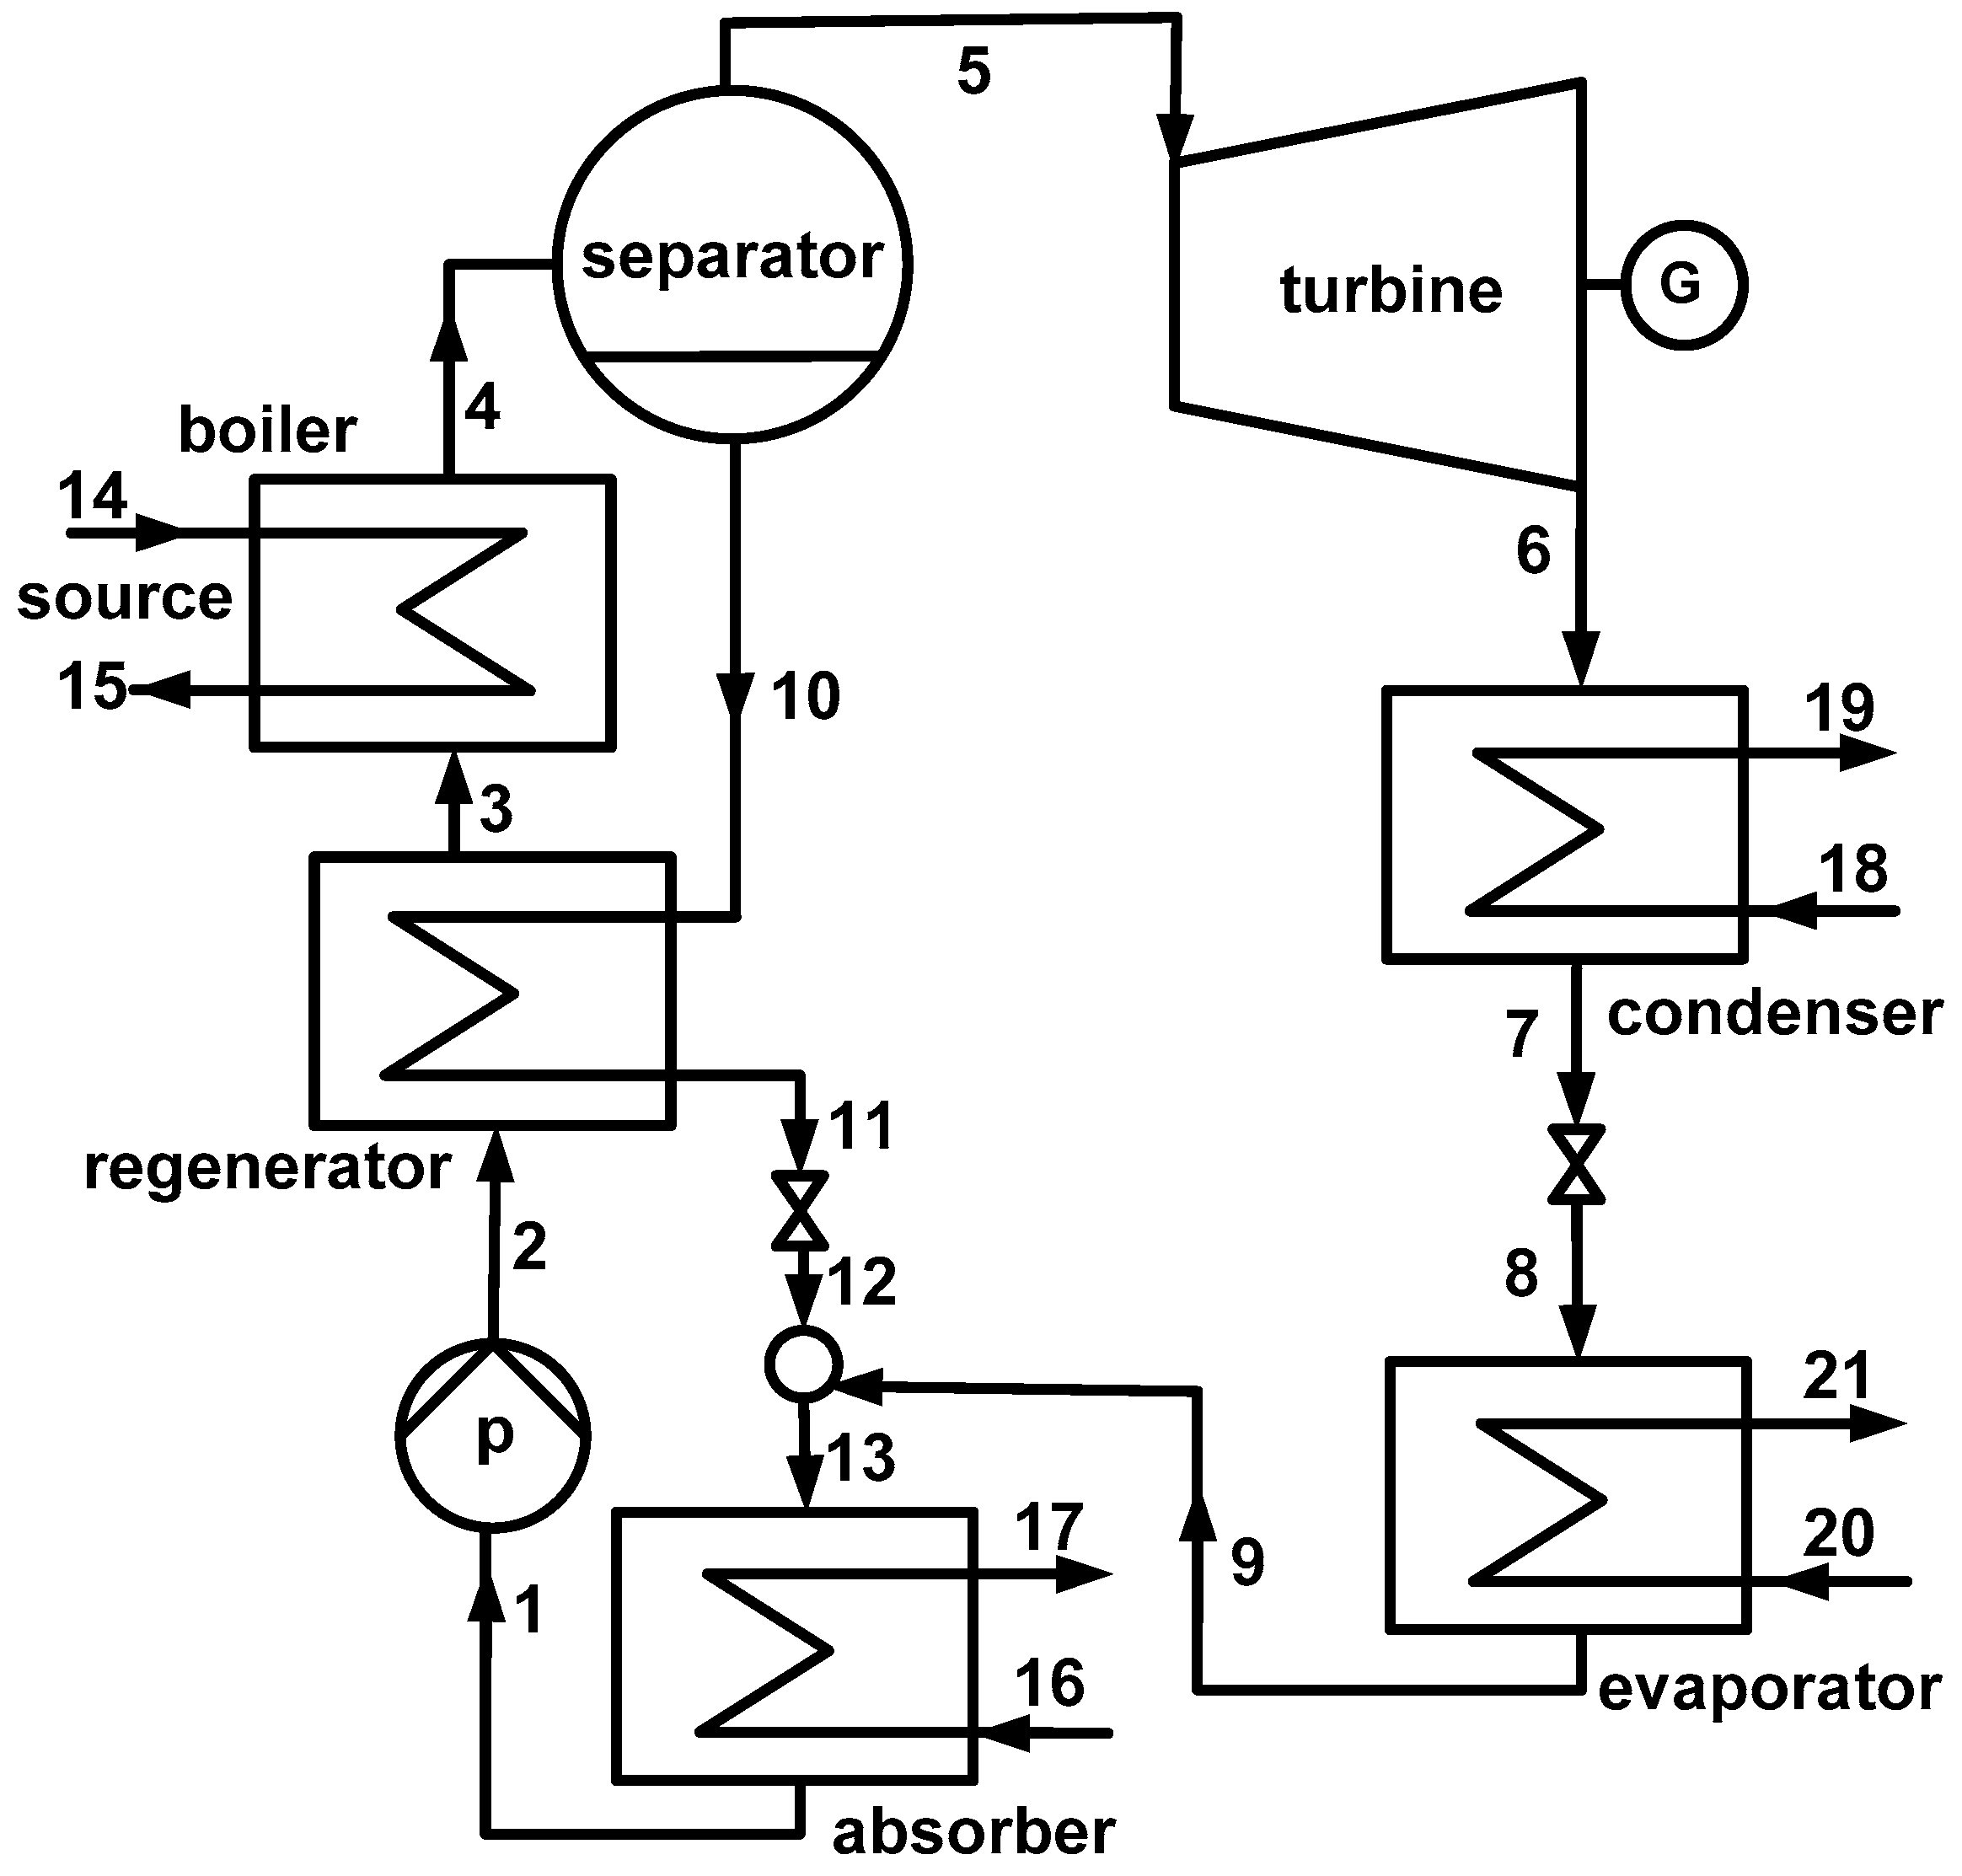
2. System Description

The schematic of the proposed system is shown in Figure 1 and its enthalpy-fraction diagram is illustrated in Figure 2 for the typical system parameters of the system. The system is driven by a low-grade heat and uses ammonia-water mixture as the working fluid and consists of a boiler, separator, condenser, evaporator, absorber, pump and regenerator.
The working fluid exits the absorber with a saturated liquid of temperature T1 and the basic ammonia fraction xb (state 1). The corresponding saturated pressure PL becomes the low pressure of the system. The fluid is then pressurized to the separator pressure PH which is the high pressure of the system (state 2). Then the fluid is preheated in the regenerator due to the liquid from the separator and enters the boiler (state 3). The working fluid is heated due to the source fluid in the boiler up to the separator temperature T4 (state 4) and then separated into ammonia-rich saturated vapor (state 5) and dilute saturated liquid (state 10) in the separator. The vapor from the separator enters the turbine and generates power with expanding to the intermediate pressure PM (state 6). Then the fluid leaves the condenser as a saturated liquid at temperature T6 (state 7). The intermediate pressure PM is the saturated pressure at temperature T6. The saturated pressure of TL is PM, which is higher than PL, because the ammonia fraction at condenser is higher than that at absorber. After the fluid is expanded through the throttle expansion valve (state 8), it extracts heat from the water or environment in the evaporator (state 9). The liquid from separator preheats the working fluid (state 11), is throttle expanded (state 12) and is mixed with the working fluid from the evaporator and enters the absorber (state 13). The source fluid enters the boiler at temperature TS (state 14) and exits after heating the working fluid (state 15). The coolant water enters (state 16) and exits (state 17) the absorber after heat removal from the working fluid. Similarly, the coolant water enters (state 18) and exits (state 19) the condenser after heat removal from the working fluid. The water enters the evaporator (state 20) and the chilled water exits (state 21).

3. System Modeling

In this study, the assumptions for the simplification of simulations are made as follows:
(1)
The system is steady.
(2)
Any pressure losses are negligible.
(3)
The isentropic efficiencies of the pump and turbines are constant.
(4)
The fluid exits the condenser and the absorber in a saturated liquid state.
(5)
The pinch temperature differences in the heat exchangers are set at the prescribed values.
If the source fluid is supplied with a temperature of TS and a mass flow rate of m14, the outlet temperature of the source fluid, the mass flow rates of working fluid at boiler m4 and at turbine m5 and the mass flow rate of the chilled water m21, can be evaluated from the conservation law of energy and the condition of pinch temperature difference as Equations (1)–(3). Here cps and cpw are isobaric specific heats of source fluid and chilled water, respectively and h is the specific enthalpy of working fluid. The system heat inlet rate Qin, turbine power Wt, pump power Wp, system net power Wn, cooling capacity Qe and cogeneration energy En are obtained as Equations (4)–(9). The power efficiency ηw, cooling efficiency ηe and ENUF are defined as the ratios of the power, cooling and useful energy, respectively, as Equations (10)–(12). The equations are listed below.
m 4 = m 14 c p s ( T s T 15 ) h 4 h 3
m 5 = m 4 ( h 4 h 10 ) h 5 h 10
m 21 = m 5 ( h 9 h 8 ) c p w ( T 20 T 21 )
Q i n = m 4 ( h 4 h 3 )
W t = m 5 ( h 5 h 6 )
W p = m 4 ( h 4 h 3 )
W n = W t W p
Q e = m 5 ( h 9 h 8 ) = m w c p w ( T 20 T 21 )
E n = W n + Q e
η w = W n Q i n
η e = Q e Q i n
E N U F = E n Q i n = η w + η e
In this paper, the calculation of the thermodynamic properties of the ammonia-water mixture follows the method of Reference [34] and the calculation of the equilibrium conditions of the liquid and vapor follows the method of Reference [4].
It is assumed that the source is air with m14 = 1 kg/s and the separator temperature is lower than the source temperature by 15 °C. The basic simulation conditions are listed in Table 1. In this paper, the effects of varying key parameters of the source temperature, the separator pressure and the ammonia fraction on the system performance are parametrically investigated and other parameters in the Table 1 are same as those in Reference [32].
The thermodynamic properties and mass flow rate at each point from basic conditions are listed in Table 2. As is seen in the table that the ammonia fractions at inlet, vapor and liquid of separator are 45.0%, 80.7% and 29.0%, respectively.
Figure 3 shows the temperature-entropy diagrams for the basic simulation conditions, except for different separator pressures of 24 bar, 32 bar and 40 bar. The increase in the separator pressure increases the mixture temperature at boiler inlet (T3) but decreases the mixture temperatures at the turbine exit (T6) and the evaporator exit (T9), while increasing the mixture entropy at the evaporator inlet (s8) but decreases the mixture entropies at boiler exit (s4), turbine inlet (s5) and turbine exit (s6). Figure 4 displays the temperature-entropy diagrams for the basic simulation conditions except for the basic ammonia fractions of 40%, 45% and 50%. Interestingly, as the ammonia fraction increases, the working fluid temperature decreases at the boiler inlet (T3) but increases at the evaporator exit (T9), while working fluid entropy decreases at the evaporator inlet (s8) but increases at the boiler exit (s4).

4. Results and Discussion

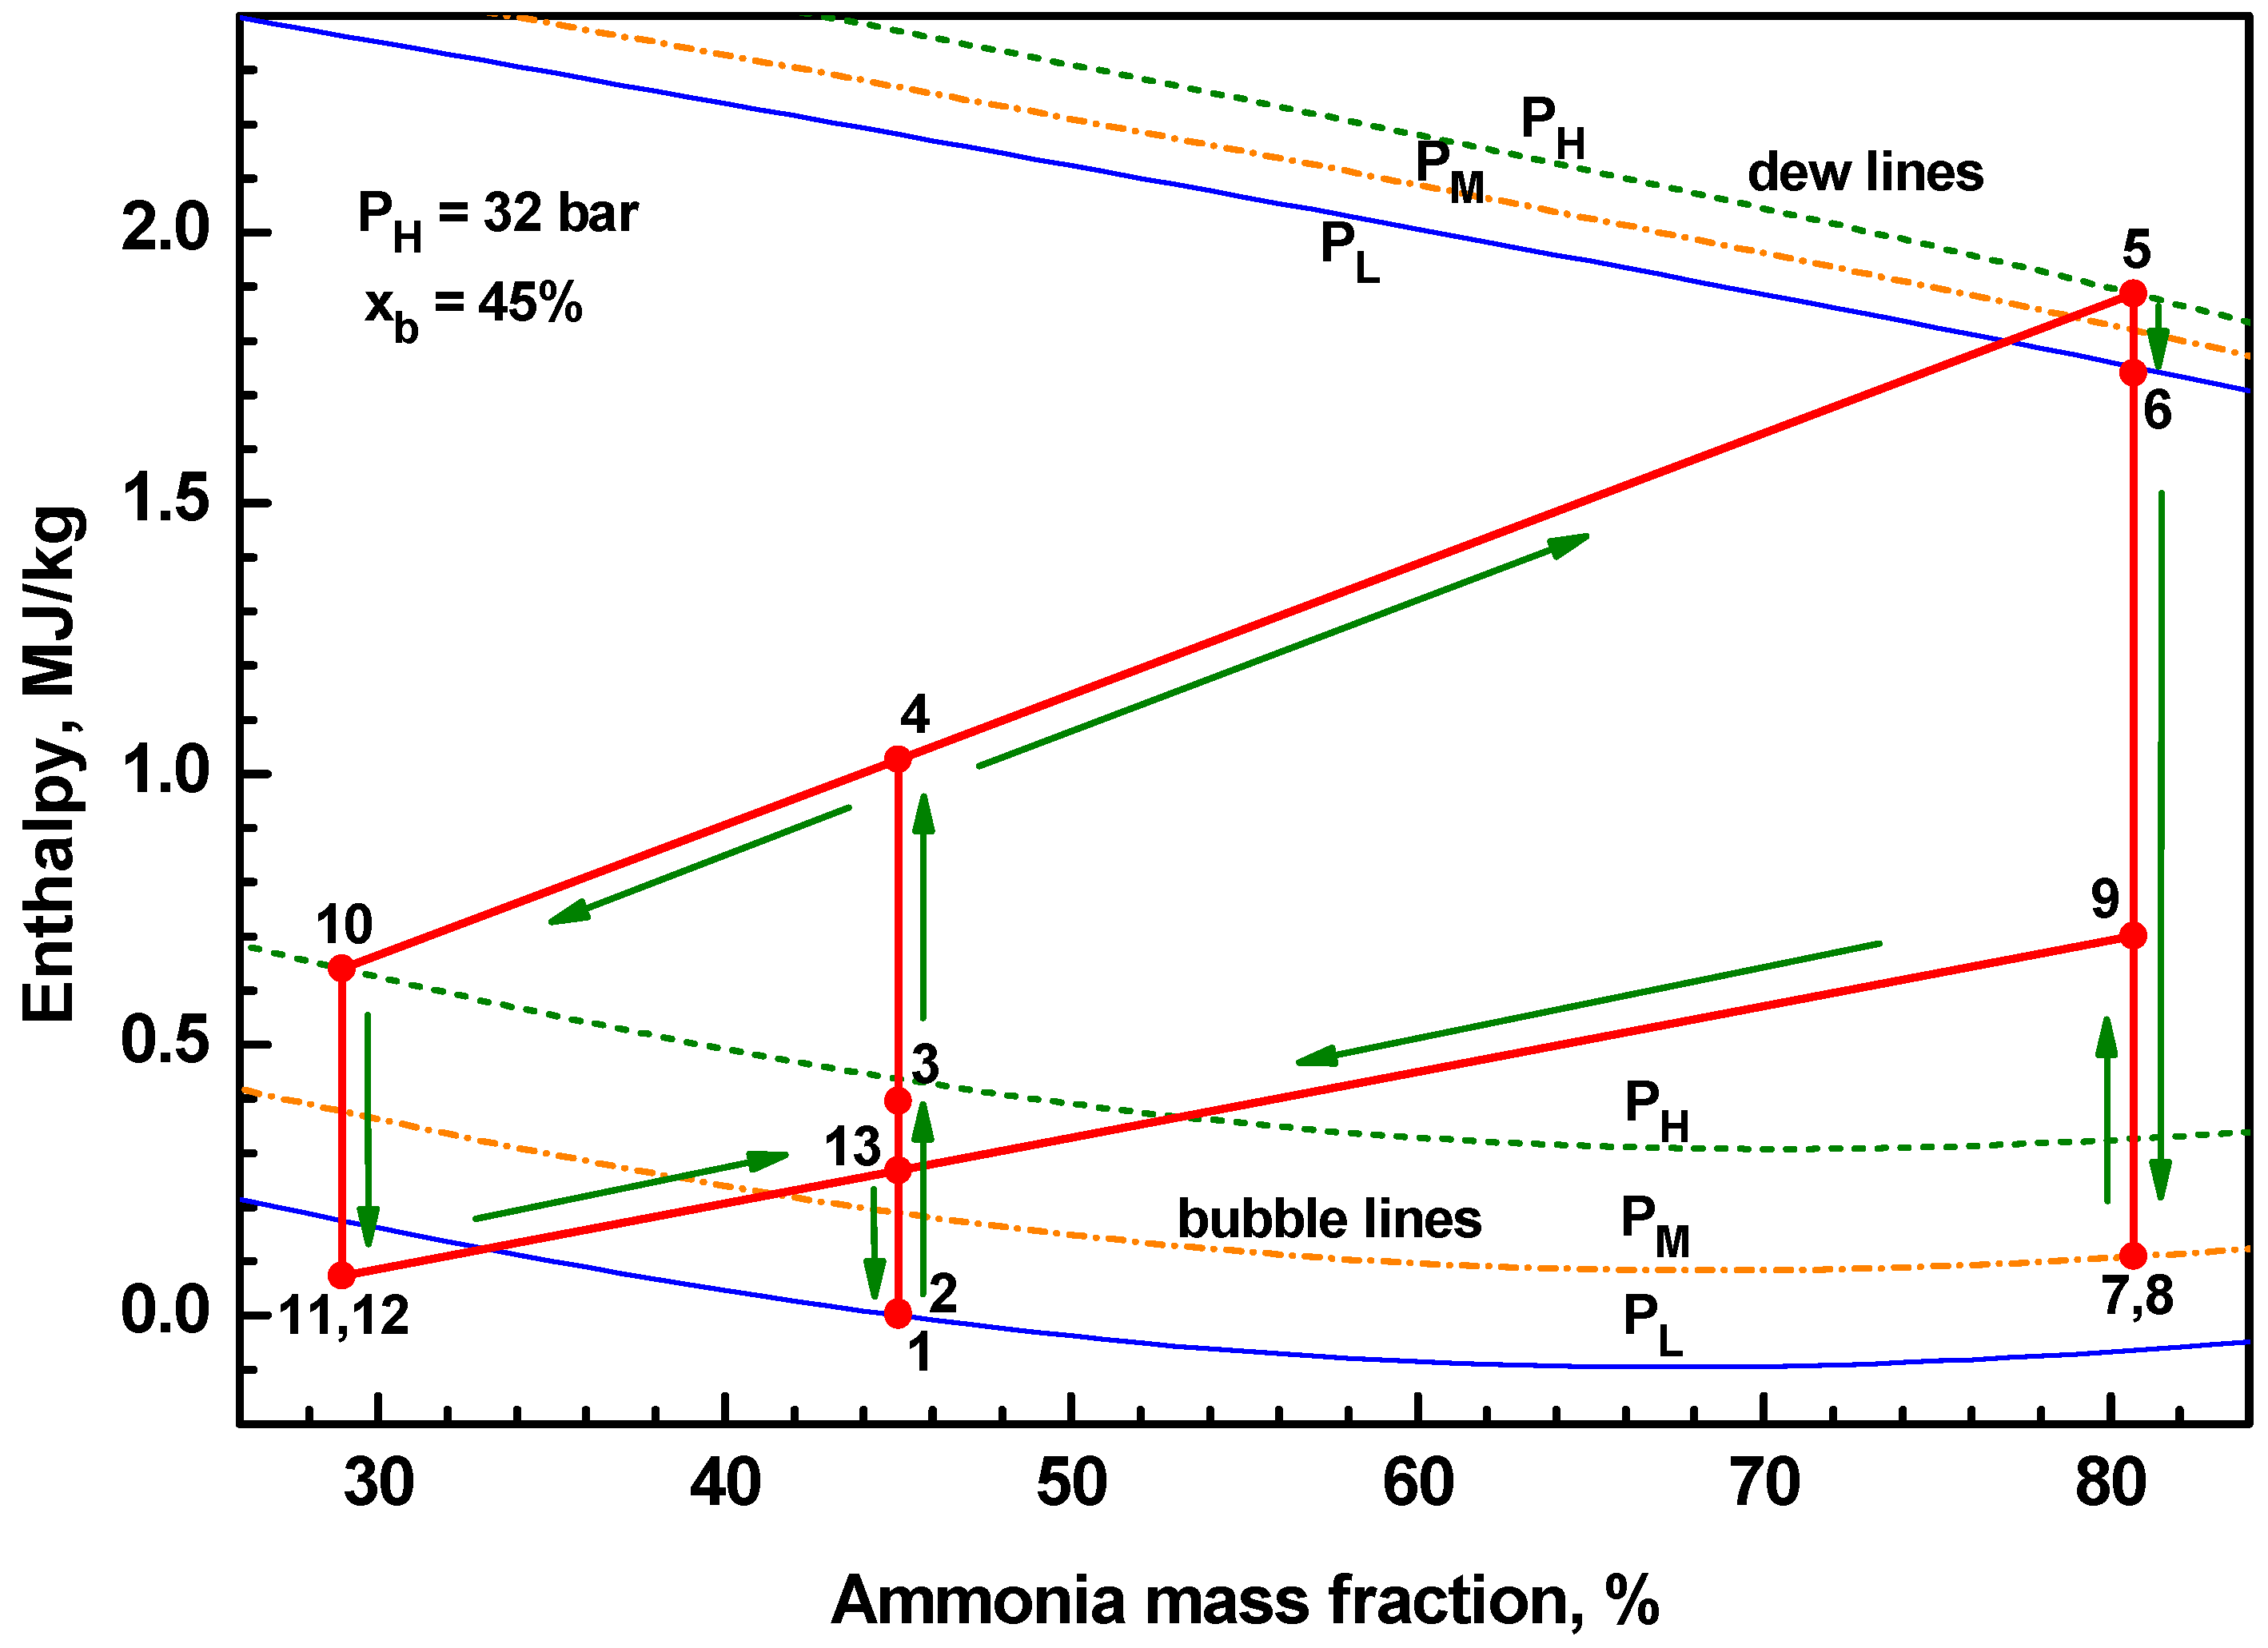
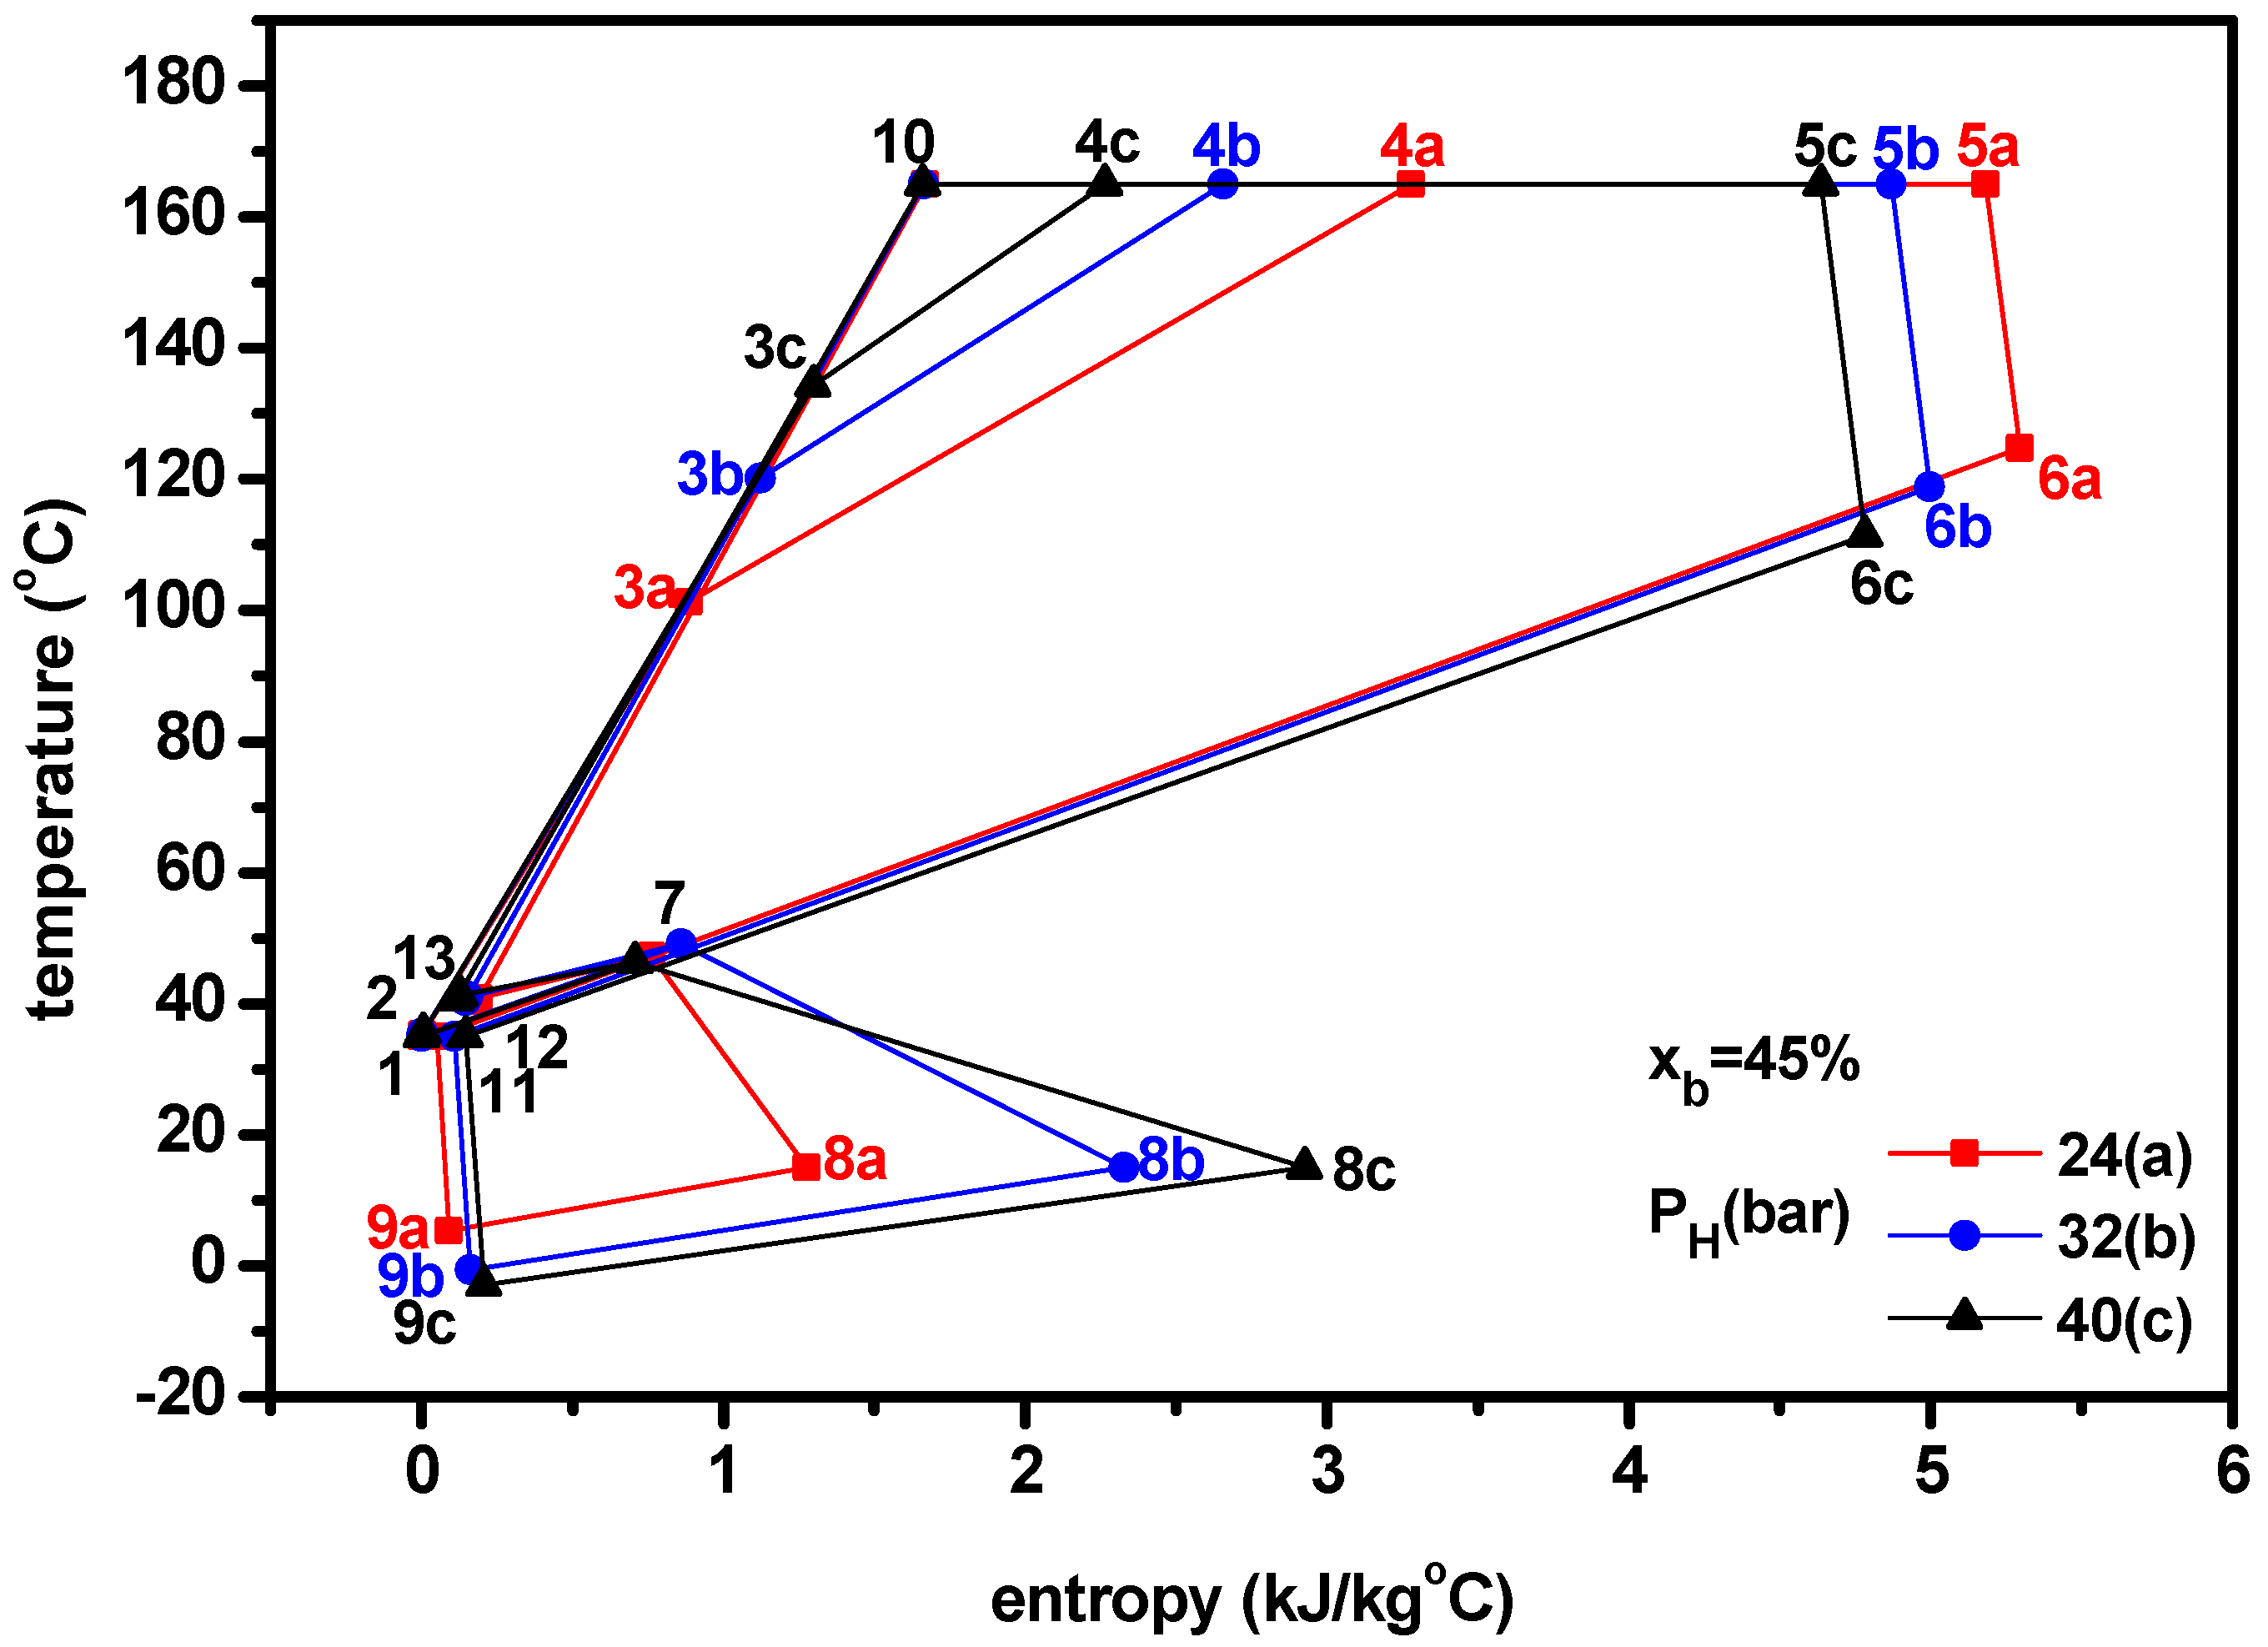
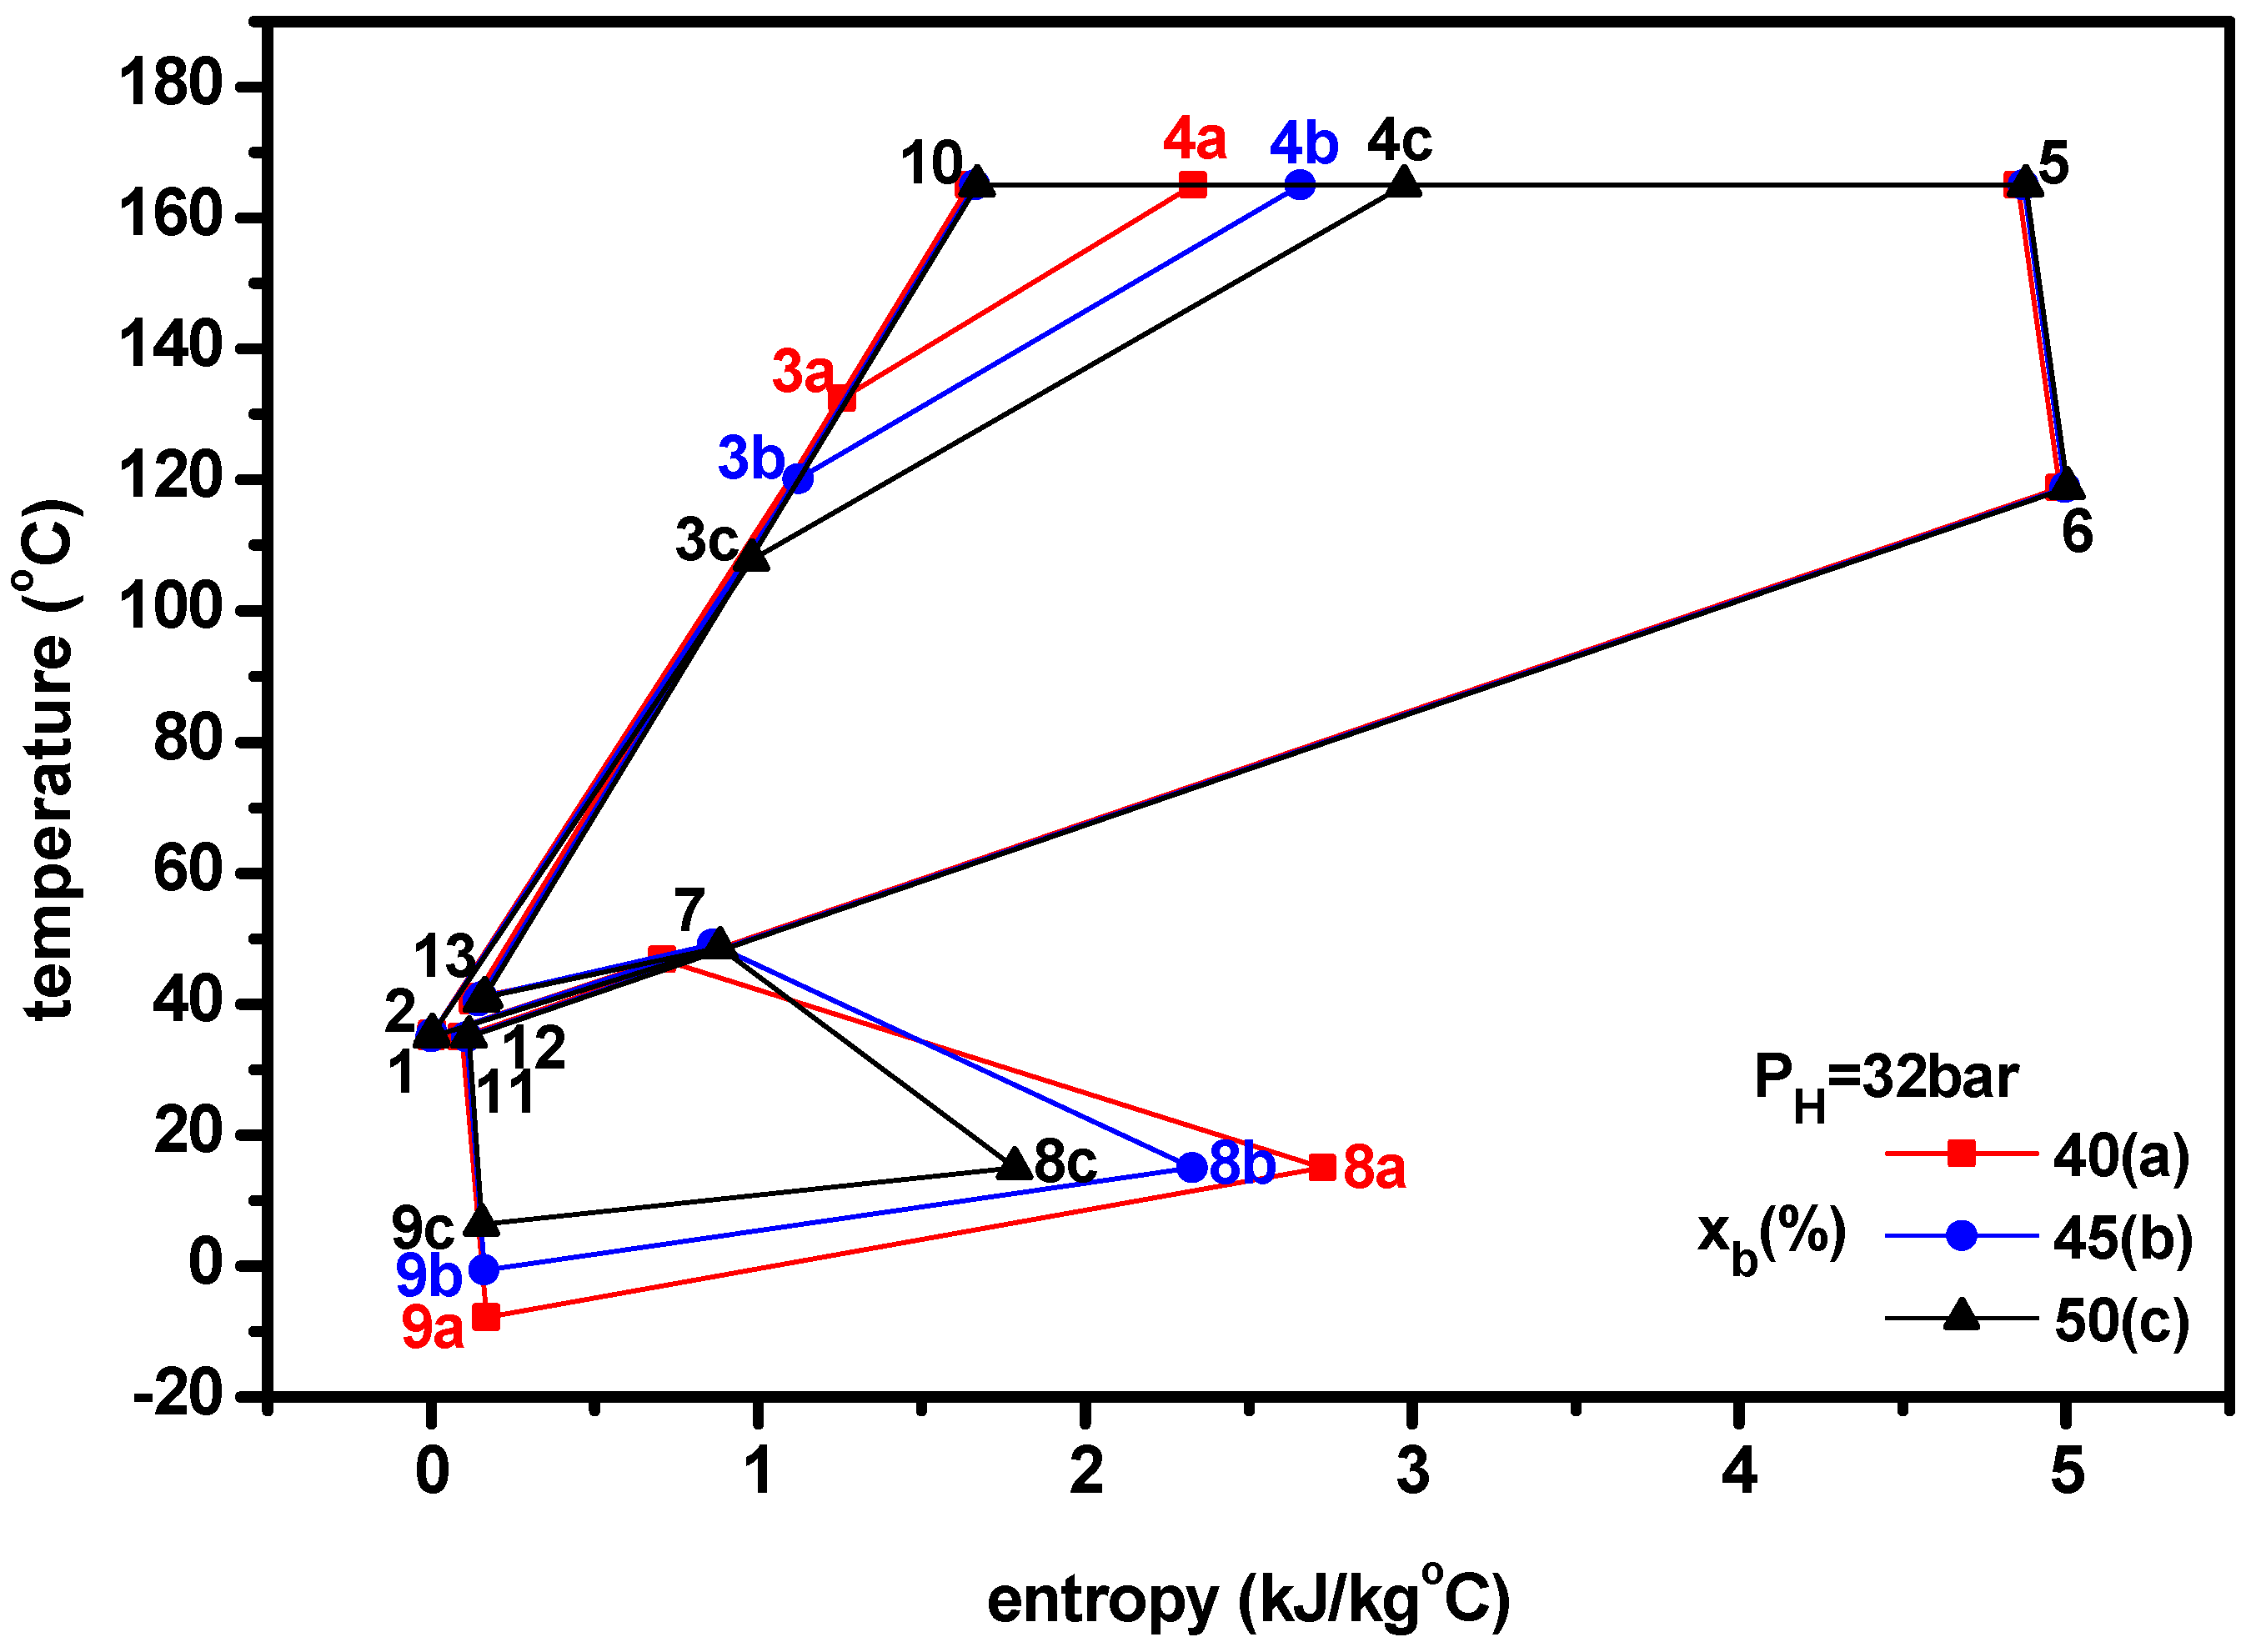
4.1. Thermodynamic Performance with Varying Ammonia Fraction

This section describes the effect of the ammonia fraction on the system performance for separator pressures of 24 bar, 32 bar and 40 bar and source temperatures of 160 °C, 180 °C and 200 °C. Figure 5 illustrates the influence of the ammonia fraction on the quality of the working fluid in the separator. The quality in the separator increases as the ammonia fraction or source temperature increases and as the separator pressure decreases. For a specified separator pressure and a source temperature, there is a lower limit and an upper limit of the ammonia fraction for the proper operation of the system. The lower limit exists since if the ammonia fraction is below the lower limit, the working fluid will be a subcooled liquid rather than a saturated mixture. The upper limit exists because if the ammonia fraction is higher than the upper limit, the working fluid temperature at the evaporator inlet (T8) rises and the temperature difference at evaporator inlet, T8T21 becomes lower than the pinch temperature difference. The higher the separator pressure or the lower the source temperature, both the lower and upper limits increase so the operating range of ammonia fraction between the lower and the upper limits is shifted to right in the quality-ammonia fraction diagram.
Figure 6 shows the effect of ammonia fraction on the heat input rate. As shown in Figure 3 and Figure 4, the heat input rate is higher for higher ammonia fraction or lower separator pressure due to the reduction of the working fluid temperature at boiler inlet. It increases with source temperature, since the working fluid temperature leaving boiler increases while its temperature at the boiler inlet remains constant. Trends in the heat input rate to varying ammonia fraction, separator pressure and source temperature are similar to those of the quality in the separator.
Figure 7 shows the effect of ammonia fraction on the mass flow rate of mixture at boiler. The mass flow rate decreases with increasing ammonia, which can be explained as follows. According to Equation (1), the mass flow rate is proportional to the heat input rate and inversely proportional to the specific enthalpy difference between the inlet and exit of the boiler. As the ammonia fraction increases, the heat input rate increases but at the same time, the enthalpy difference increases according to a decrease of the working fluid temperature at the boiler inlet and the latter is more effective than the former. When the ammonia fraction is low, the mass flow rate decreases rapidly but the decreasing rate decreases gradually with increasing ammonia fraction. The mass flow rate decreases as separator pressure increases or source temperature decreases for a specified ammonia fraction.
Figure 8 and Figure 9 show the mass flow rate of mixture at the turbine and net power, respectively, with varying ammonia fraction. The mass flow rate increases as the ammonia fraction or source temperature or separator pressure increases. It is because the mass flow rate at the turbine is evaluated by multiplying the mass flow rate at the boiler by the quality at the separator. As the ammonia fraction or source temperature increases and the separator pressure decreases, the mass flow rate at boiler increases but the quality at separator decreases. However, when the decreasing rate of the mass flow rate at boiler is great, the quality at separator is very small and thus the trends are similar to the case of the quality at the separator. The net power production increases, as the ammonia fraction or source temperature or separator pressure increases, which is similar to the case of the mass flow rate at turbine.
Figure 10 and Figure 11 show the cooling capacity and cogeneration energy, respectively, with varying ammonia fractions, separator pressures and source temperatures. As ammonia fraction increases, the cooling capacity firstly increases, reaches a peak value and then decreases, which is because the cooling capacity is obtained from the product of the mass flow rate and the refrigerating effect. As the ammonia fraction increases, the mass flow rate increases but the entropy difference of the working fluid in the evaporator and thus the refrigerating effect decreases as shown in Figure 4. Therefore, there are both the increasing and decreasing effects for the cooling capacity. The maximum cooling capacity and its corresponding ammonia fraction increases with increasing separator pressure. The total useful energy of the cogeneration energy has a peak for ammonia fraction, because the energy quantity of cooling is greater than the power. However, the optimum ammonia fraction for the maximum combined energy is greater than that for the maximum cooling capacity, due to the increasing effects of power with respect to the ammonia fraction.
Figure 12 and Figure 13 show the power efficiency and ENUF respectively, with varying ammonia fractions, separator pressures and source temperatures. As previously seen, both the power and heat input rate increase with the ammonia fraction. According to Equation (1) for power efficiency, the term of power is in the numerator while the term of heat input rate is in the denominator, thus there are both the increasing and declining factors. The power efficiency increases with ammonia fraction, which means that the increasing factor is dominant over the declining factor. According to Equation (12) for ENUF, the term of cogeneration energy is in the numerator while the term of heat input rate is in the denominator. As previously seen, the combined energy has a local maximum for ammonia fraction while the heat input rate increases with ammonia fraction. The ENUF has a peak for the ammonia fraction mainly due to the cogeneration energy. However, the optimum ammonia fraction for the maximum ENUF is much lower than that for the maximum cogeneration energy due to the increase of heat input rate with ammonia fraction.

4.2. Thermodynamic Performance with Optimal Conditions of Ammonia Fraction

In this section, the effect of the separator pressure and the source temperature on system performance is investigated under the optimum conditions of the maximum ENUF. Figure 14 illustrates the influence of the separator pressure and source temperature on the optimum ammonia fractions. The optimum fraction decreases as source temperature increases or separator pressure decreases. For a specified separator pressure, there exists a lower and an upper limit of source temperature for proper operation. The low limit exists, because when the source temperature decreases below the lower limit, the system cannot produce the net power with the separator pressure. The upper limit exists, because when the ammonia fraction becomes greater than the upper limit, the system is not able to chill the water with the separator pressure. In general, both the lower and upper limits of source temperature increase with increasing separator pressure, so the operable range of source temperature between the lower and upper limits is shifted to the right with increasing separator pressure in the figure. The optimum fraction can be correlated as a linear function with respect to the source temperature for a specified pressure as xbm = −A*TS+B. The values of A and B are 0.005181 and 1.103, 0.0004891 and 1.161,0.004616 and 1.194 and 0.004510 and 1.243for PH = 16, 24, 32 and 40 in bar, respectively.
Figure 15 displays the effect of the source temperature on the heat input rate for different separator pressures. The heat input rate has a maximum value for the source temperature and both the maximum heat transfer rate and the corresponding source temperature for the maximum value become higher for higher separator pressure. The effect of the source temperature on the cooling capacity for various separator pressures is shown in Figure 16. For a specified separator pressure, the heat input rate has a peak for source temperature. As the separator pressure increases, the maximum cooling capacity decreases, however, the corresponding source temperature for the maximum of cooling increases. The maximum cooling capacities are 64.7 kW at TS = 120 °C for PH = 16 bar, 61.7 kW at 130 °C for 24 bar, 59.9 kW at 150 °C for 32 bar and 56.8 kW at 170 °C for 40 bar, respectively.
Figure 17 shows the influence of the source temperature on the power of the system for different separator pressures. The power increases with source temperature and the increasing rate first decreases and then increases as the source temperature increases. As the separator pressure increases for a given source temperature, the power increases for low source temperatures but decreases for high source temperatures. The maximum values of power are 2.5 kW for PH = 20 bar at TS = 120 °C, 5.2 kW for 32 bar at 140 °C, 7.4 kW for 40 bar at 160 °C, 9.2 kW for 44 bar at 180 °C, 10.0 kW for 44 bar at 200 °C, 12.9 kW for 28 bar at 220 °C and 16.9 kW for 36 bar at 240 °C, respectively. Figure 18 shows influence of the source temperature on the cogeneration energy for various separator pressures. For a given separator pressure, the cogeneration energy has a peak for the source temperature, which is similar to the case of cooling, since the energy quantity of cooling is greater than the power. The maximum cogeneration energies are 66.0 kW at TS = 120 °C for PH = 16 bar, 65.5 kW at 130 °C for 24 bar, 66.1 kW at 150 °C for 32 bar and 65.9 kW at 160 °C for 40 bar, respectively. However, the cogeneration energy decreases as the source temperature increases or the separator pressure decreases for the most operable range of source temperature and separator pressure.
The influence of varying source temperature on the power efficiency for different separator pressures is presented in Figure 19. The power efficiency increases convexly with source temperature. As the separator pressure increases, the power efficiency increases for low source temperatures but decreases for high source temperatures. For different separator pressures, Figure 20 illustrates the influence of the source temperature on the ENUF which is sum of the power and cooling efficiencies. As the source temperature increases, the ENUF almost linearly decreases, since the power efficiency increases but cooling efficiency decreases and the decreasing effect of the cooling efficiency is greater than the increasing effects of the power efficiency. The ENUF increases with the separator pressure for a given source temperature. The ENUF can be correlated as a linear function with respect to the source temperature for a specified pressure as ENUF = −A*TS+B. The values of A and B are 0.004645 and 1.098, 0.0004276 and 1.110, 0.003950 and 1.108 and 0.003675 and 1.104 for PH = 16, 24, 32 and 40 in bar, respectively.

5. Conclusions

The present study proposed a Kalina (KCS-11) based power and cooling cogeneration cycle with once through configuration and presented a thermodynamic and optimal analysis under optimal conditions of ammonia fraction for the maximum ENUF. A parametric study with key parameters of ammonia fractions from 15% to 55%, separator pressures from 12 bar to 44 bar and source temperatures from 110 °C to 250 °C was carried out. The important findings can be summarized as follows.
(1)
The temperature-entropy diagrams with varying ammonia fraction and separator pressure showed the important changes of system characteristics.
(2)
For a specified set of parameters, the system has both the lower and upper limits of ammonia fraction for proper operations of cogeneration. When ammonia fraction is too low, vapor is not supplied from the separator, while when the fraction is too high, the working fluid temperature entering evaporator becomes too high to chill the water.
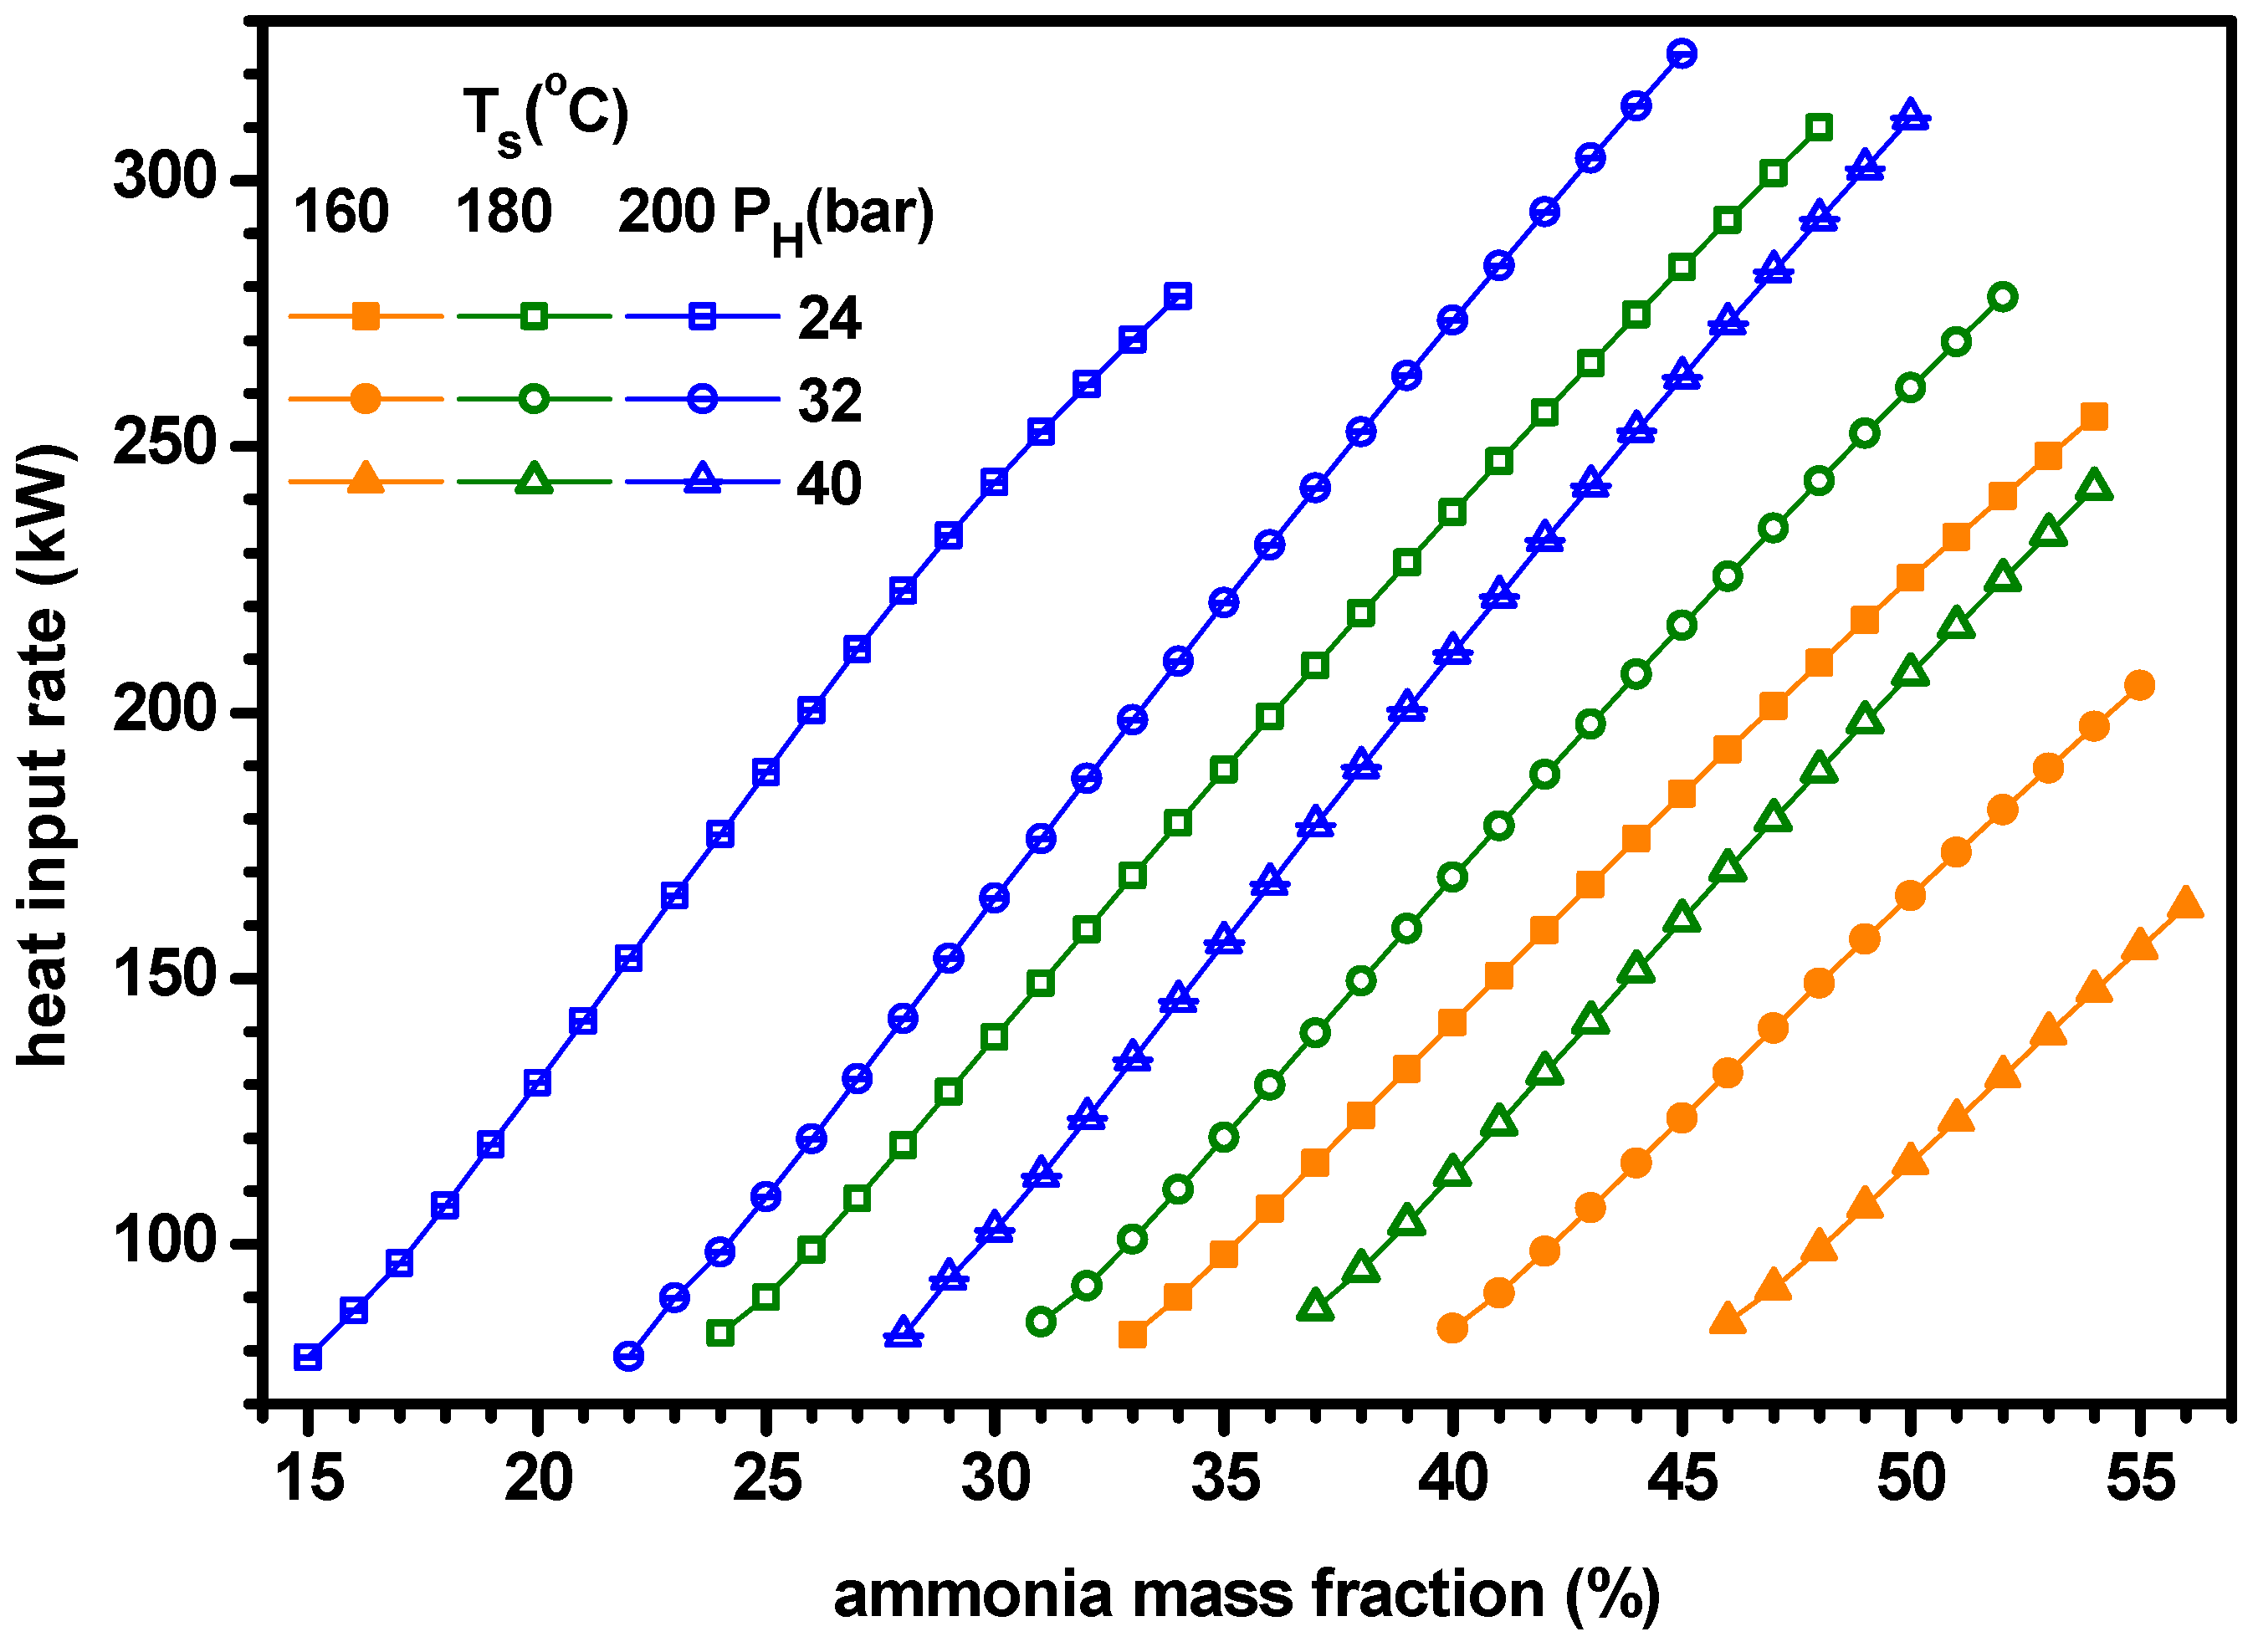
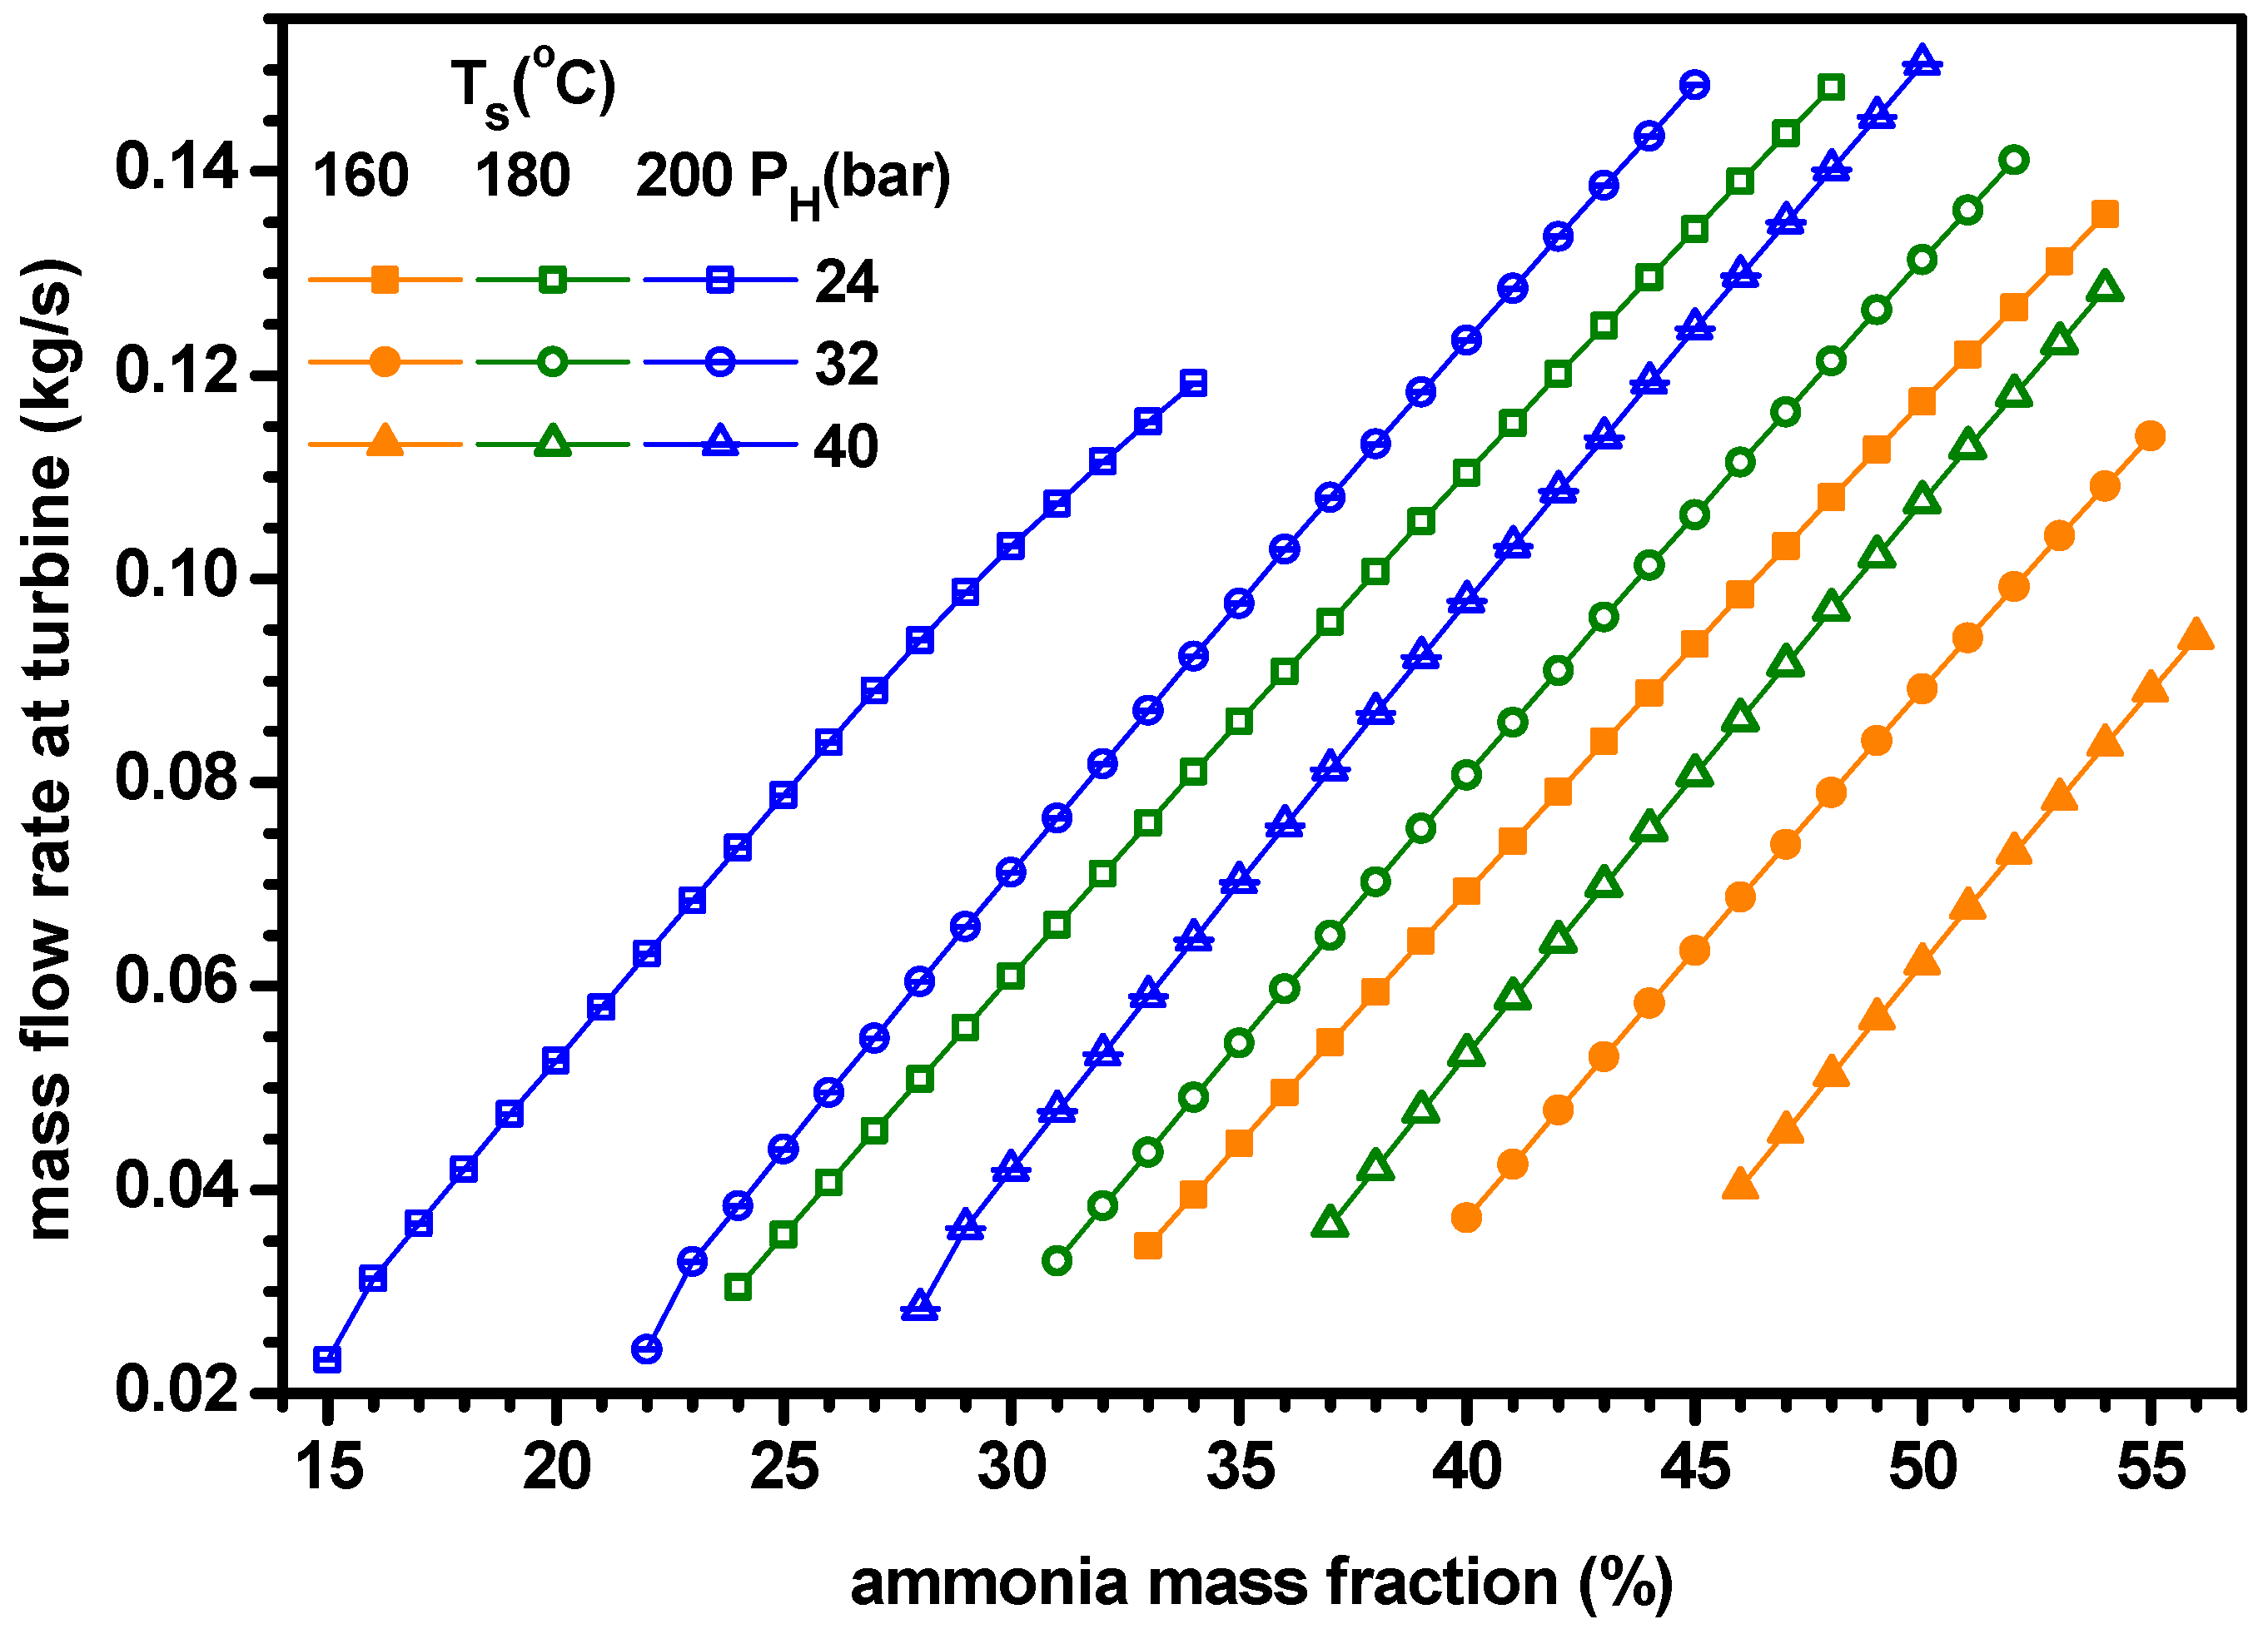
(3)
As ammonia fraction or source temperature increases or separator pressure decreases, the quality of working fluid at separator, heat input rate and mass flow rate of turbine increase but the mass flow rate at boiler decreases.
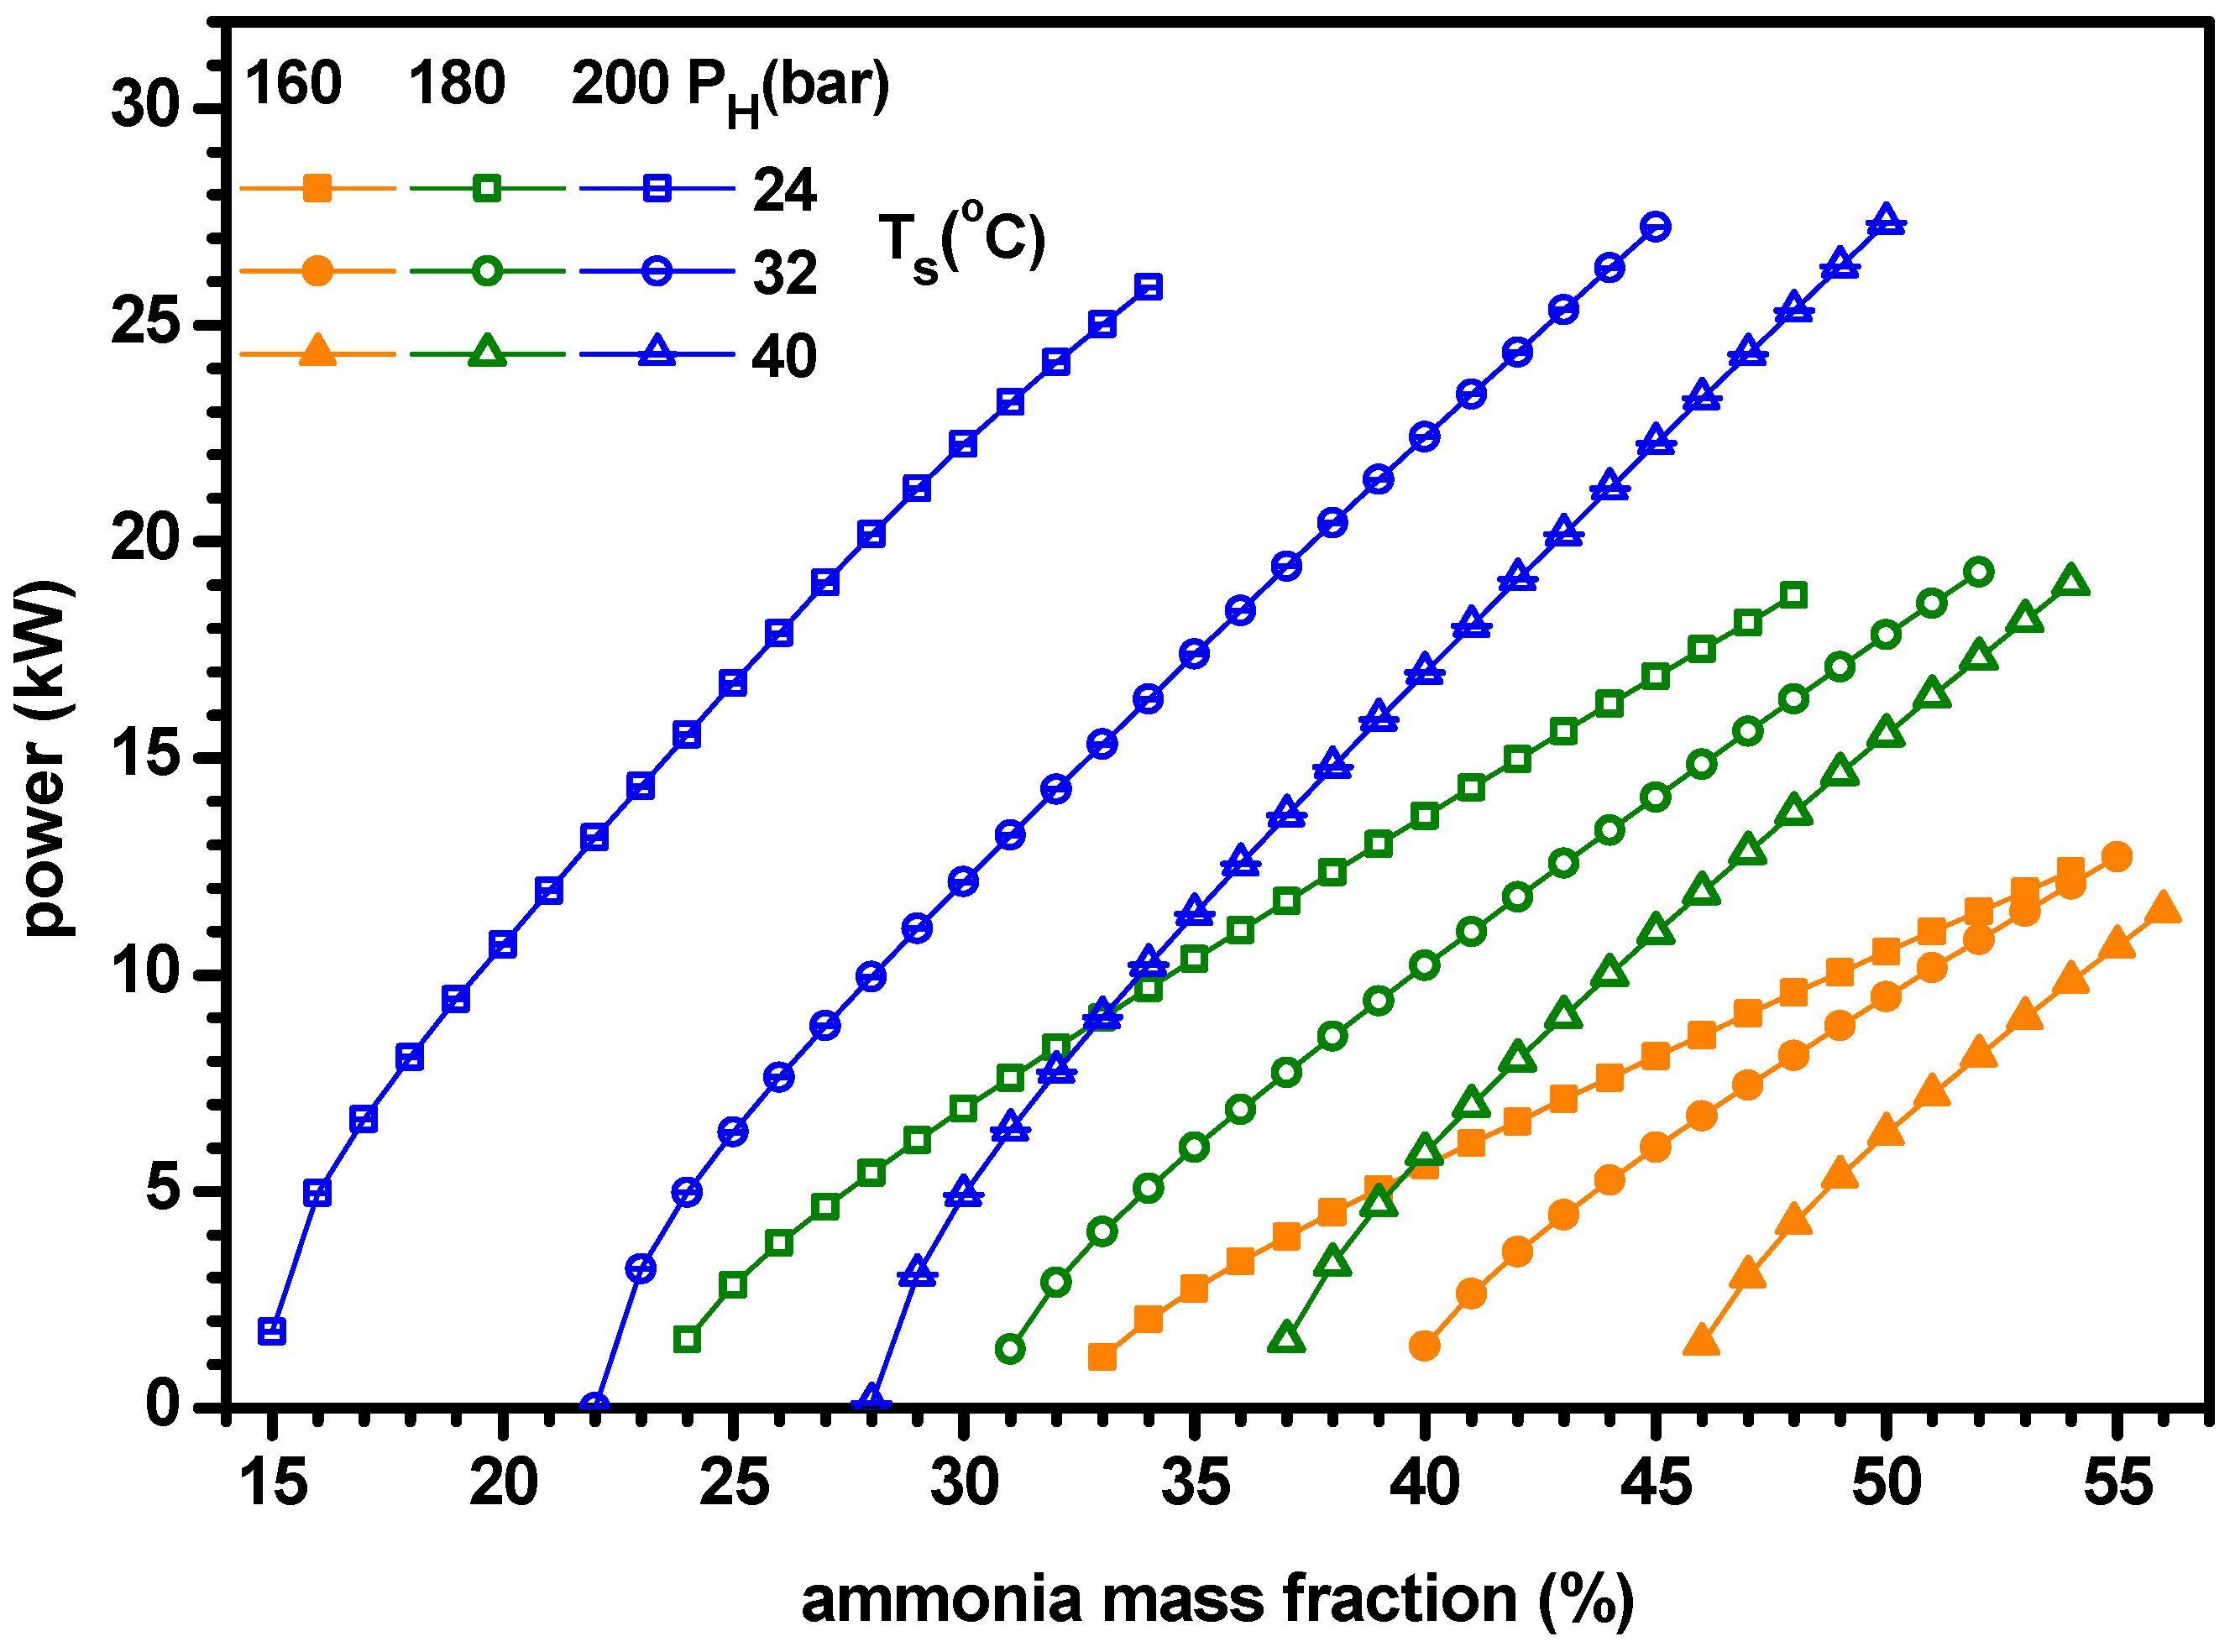
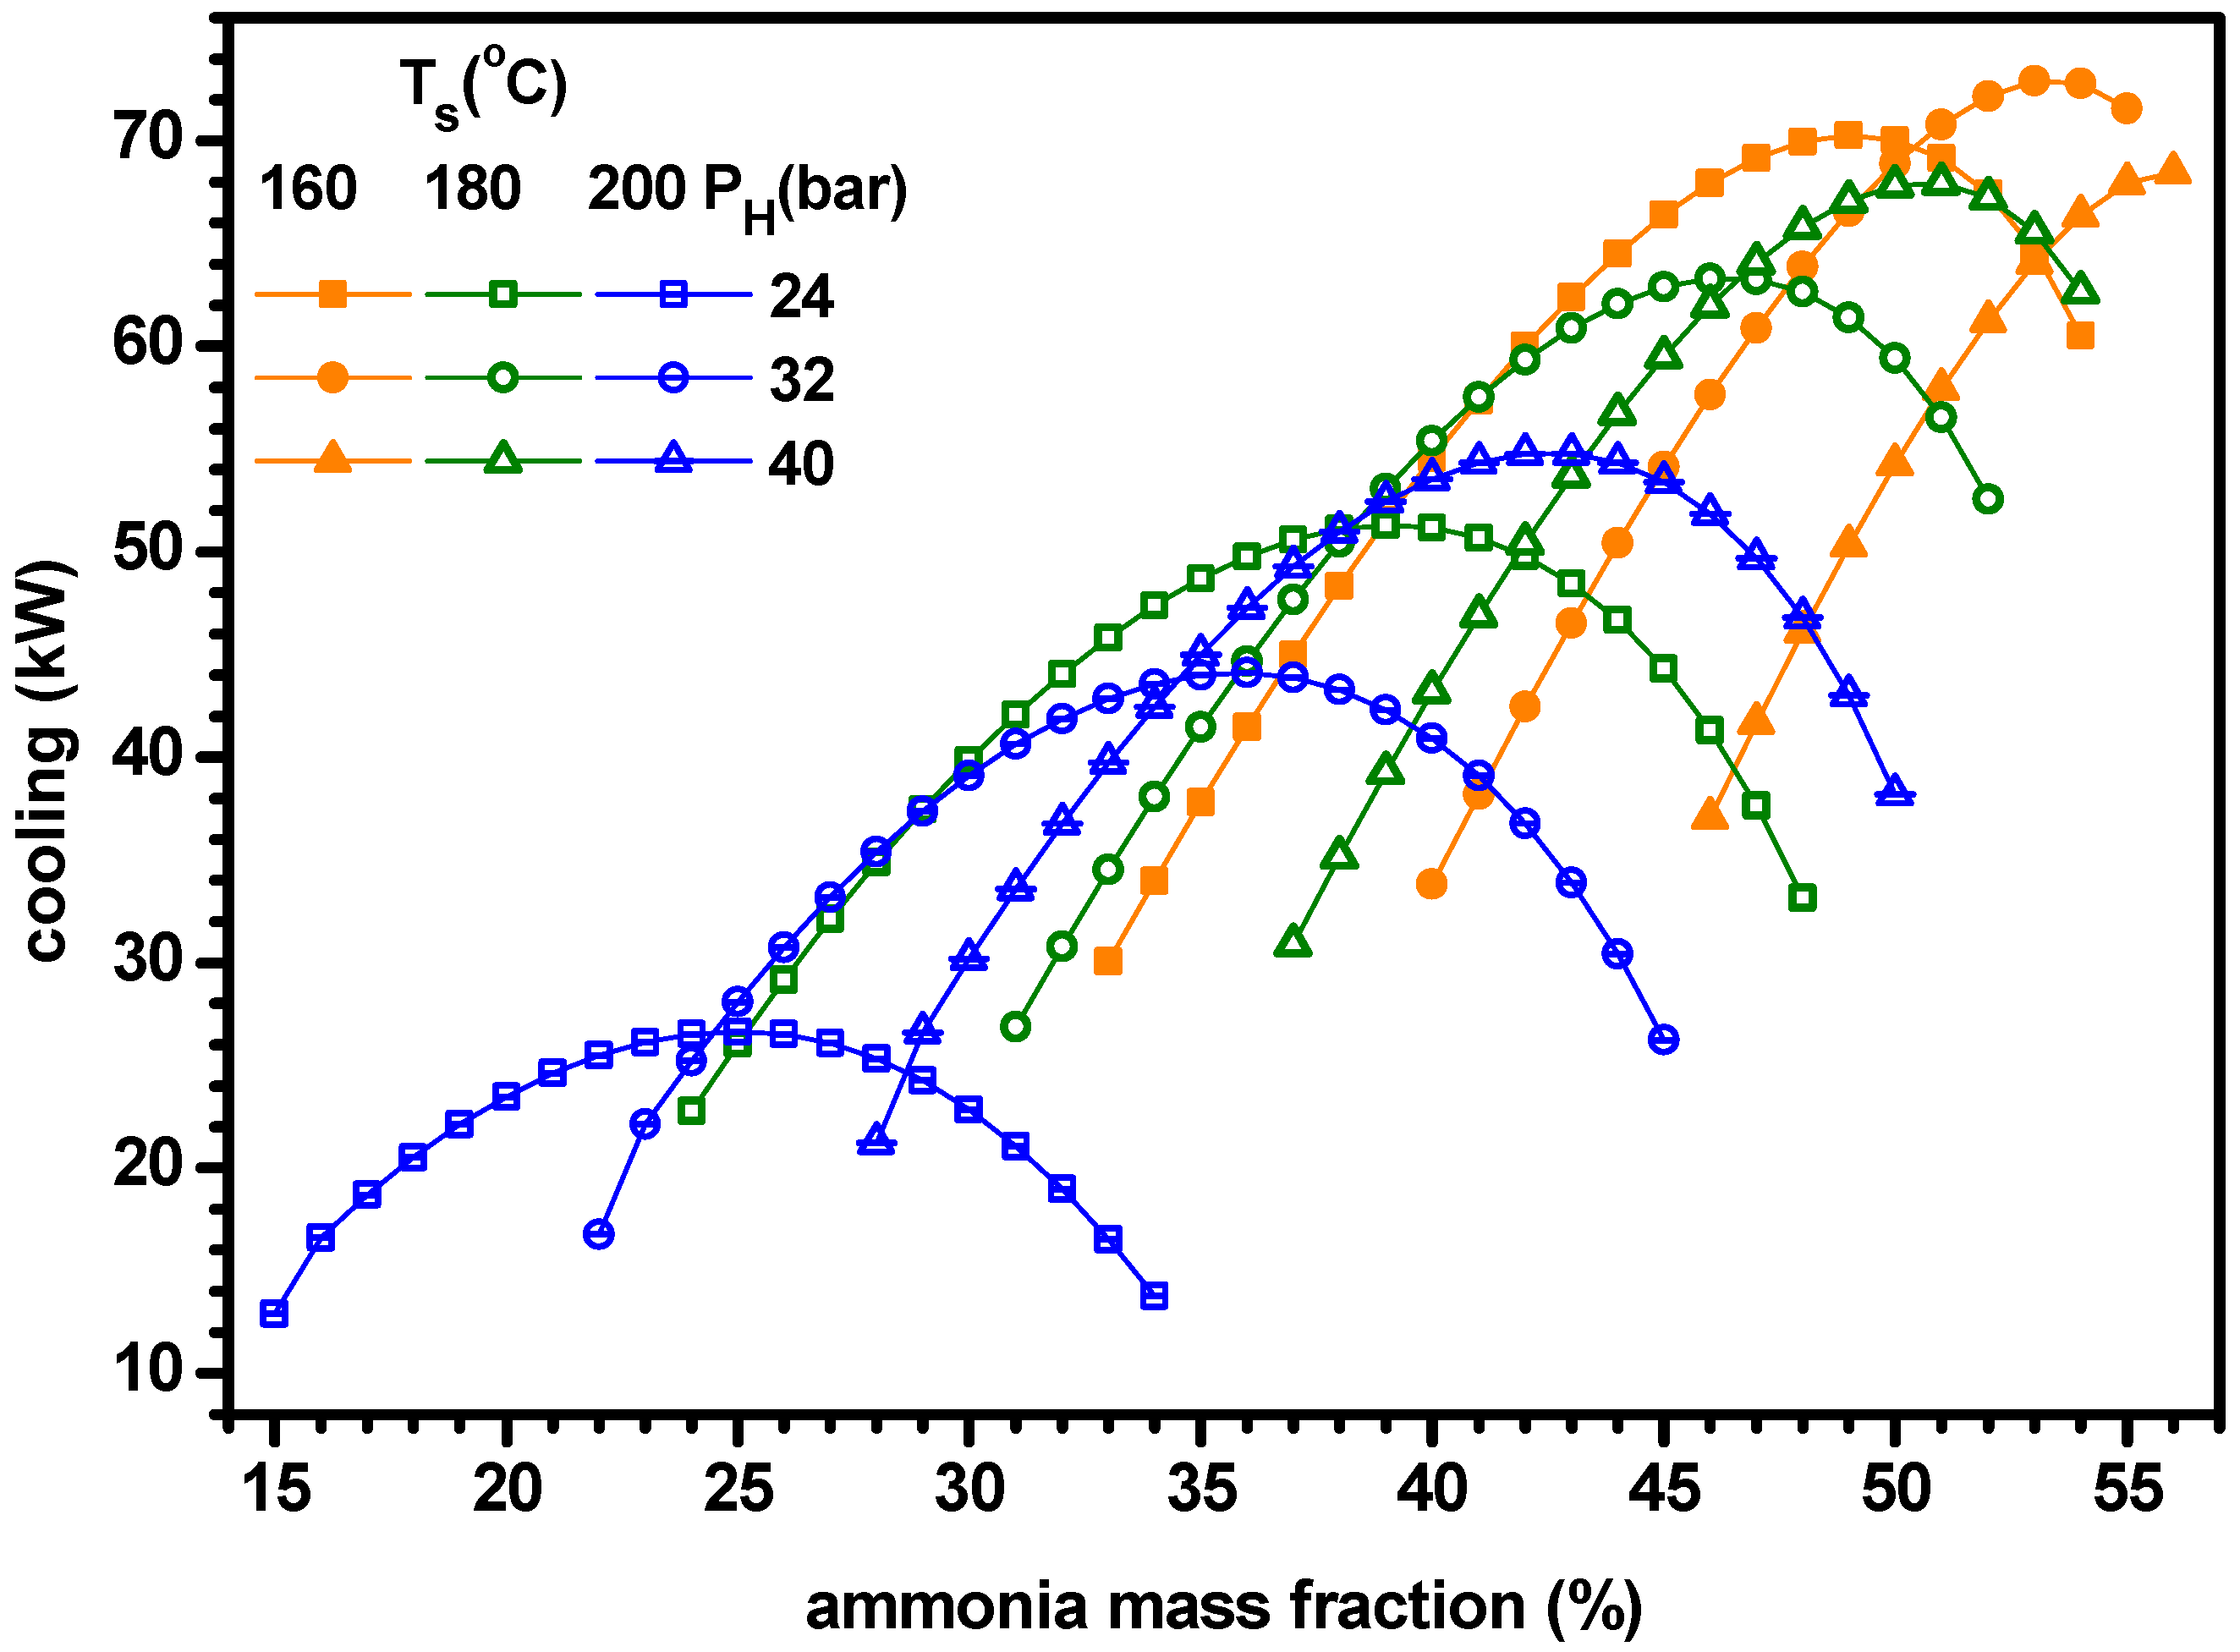
(4)
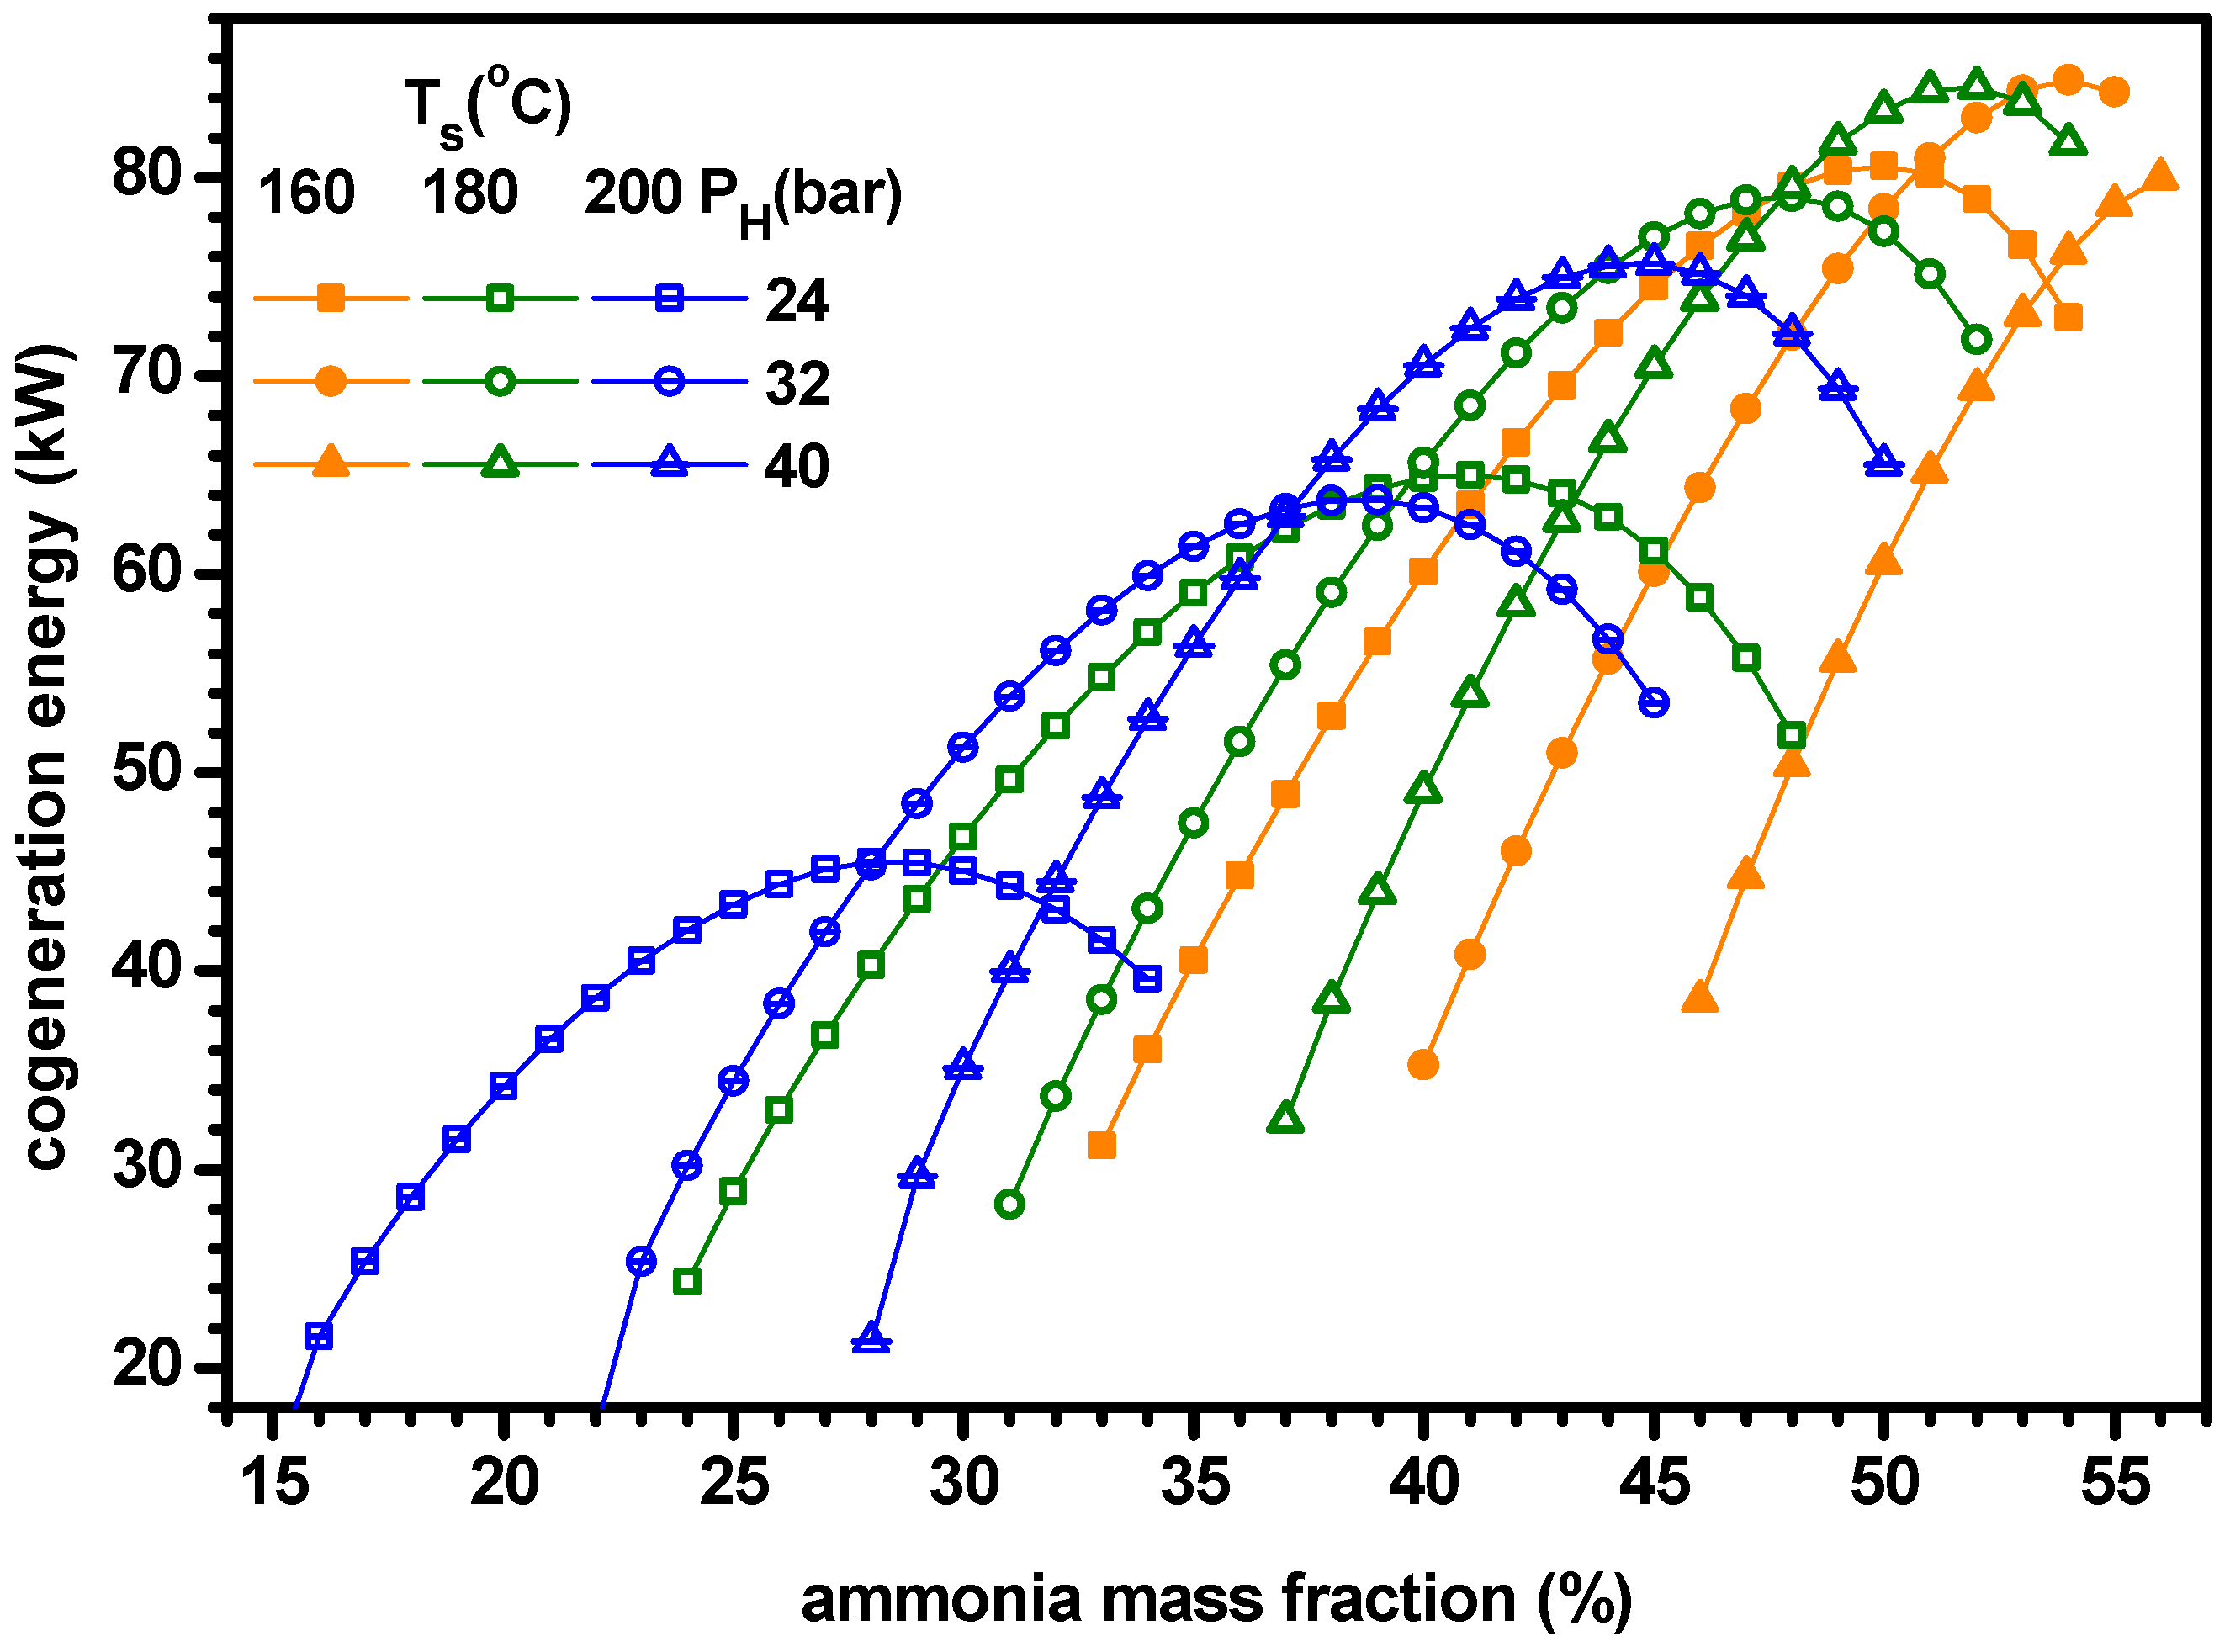
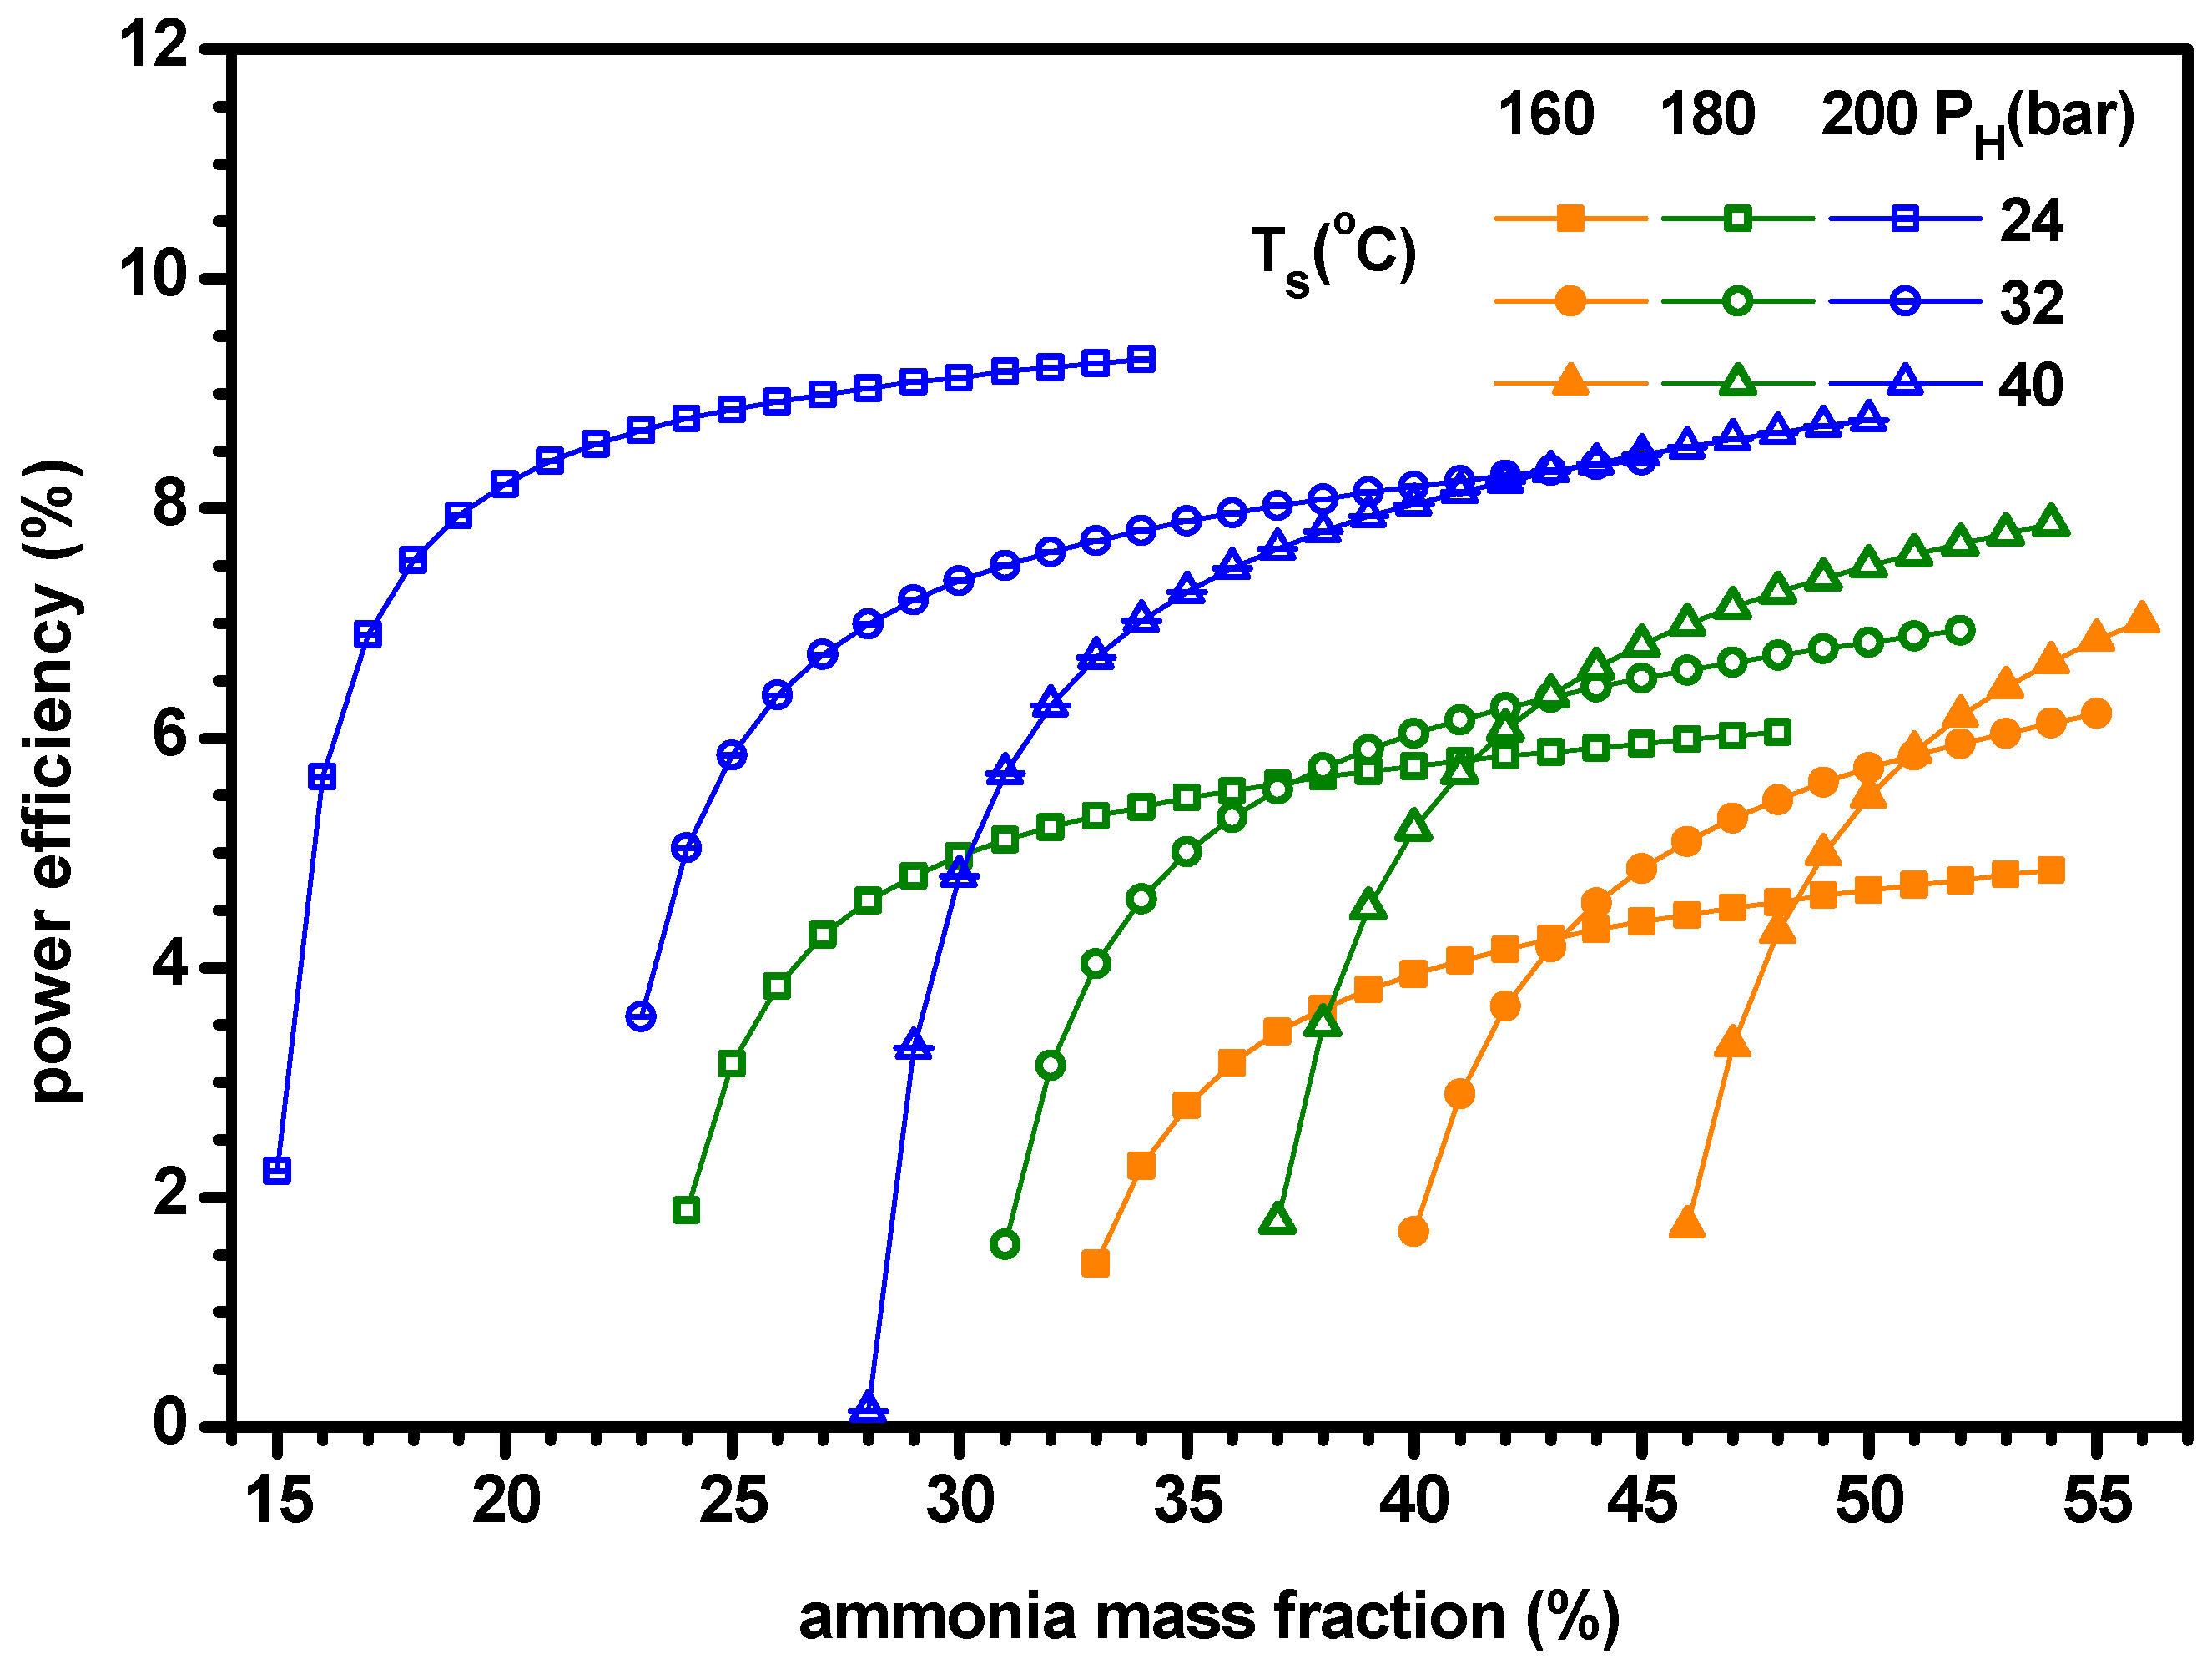
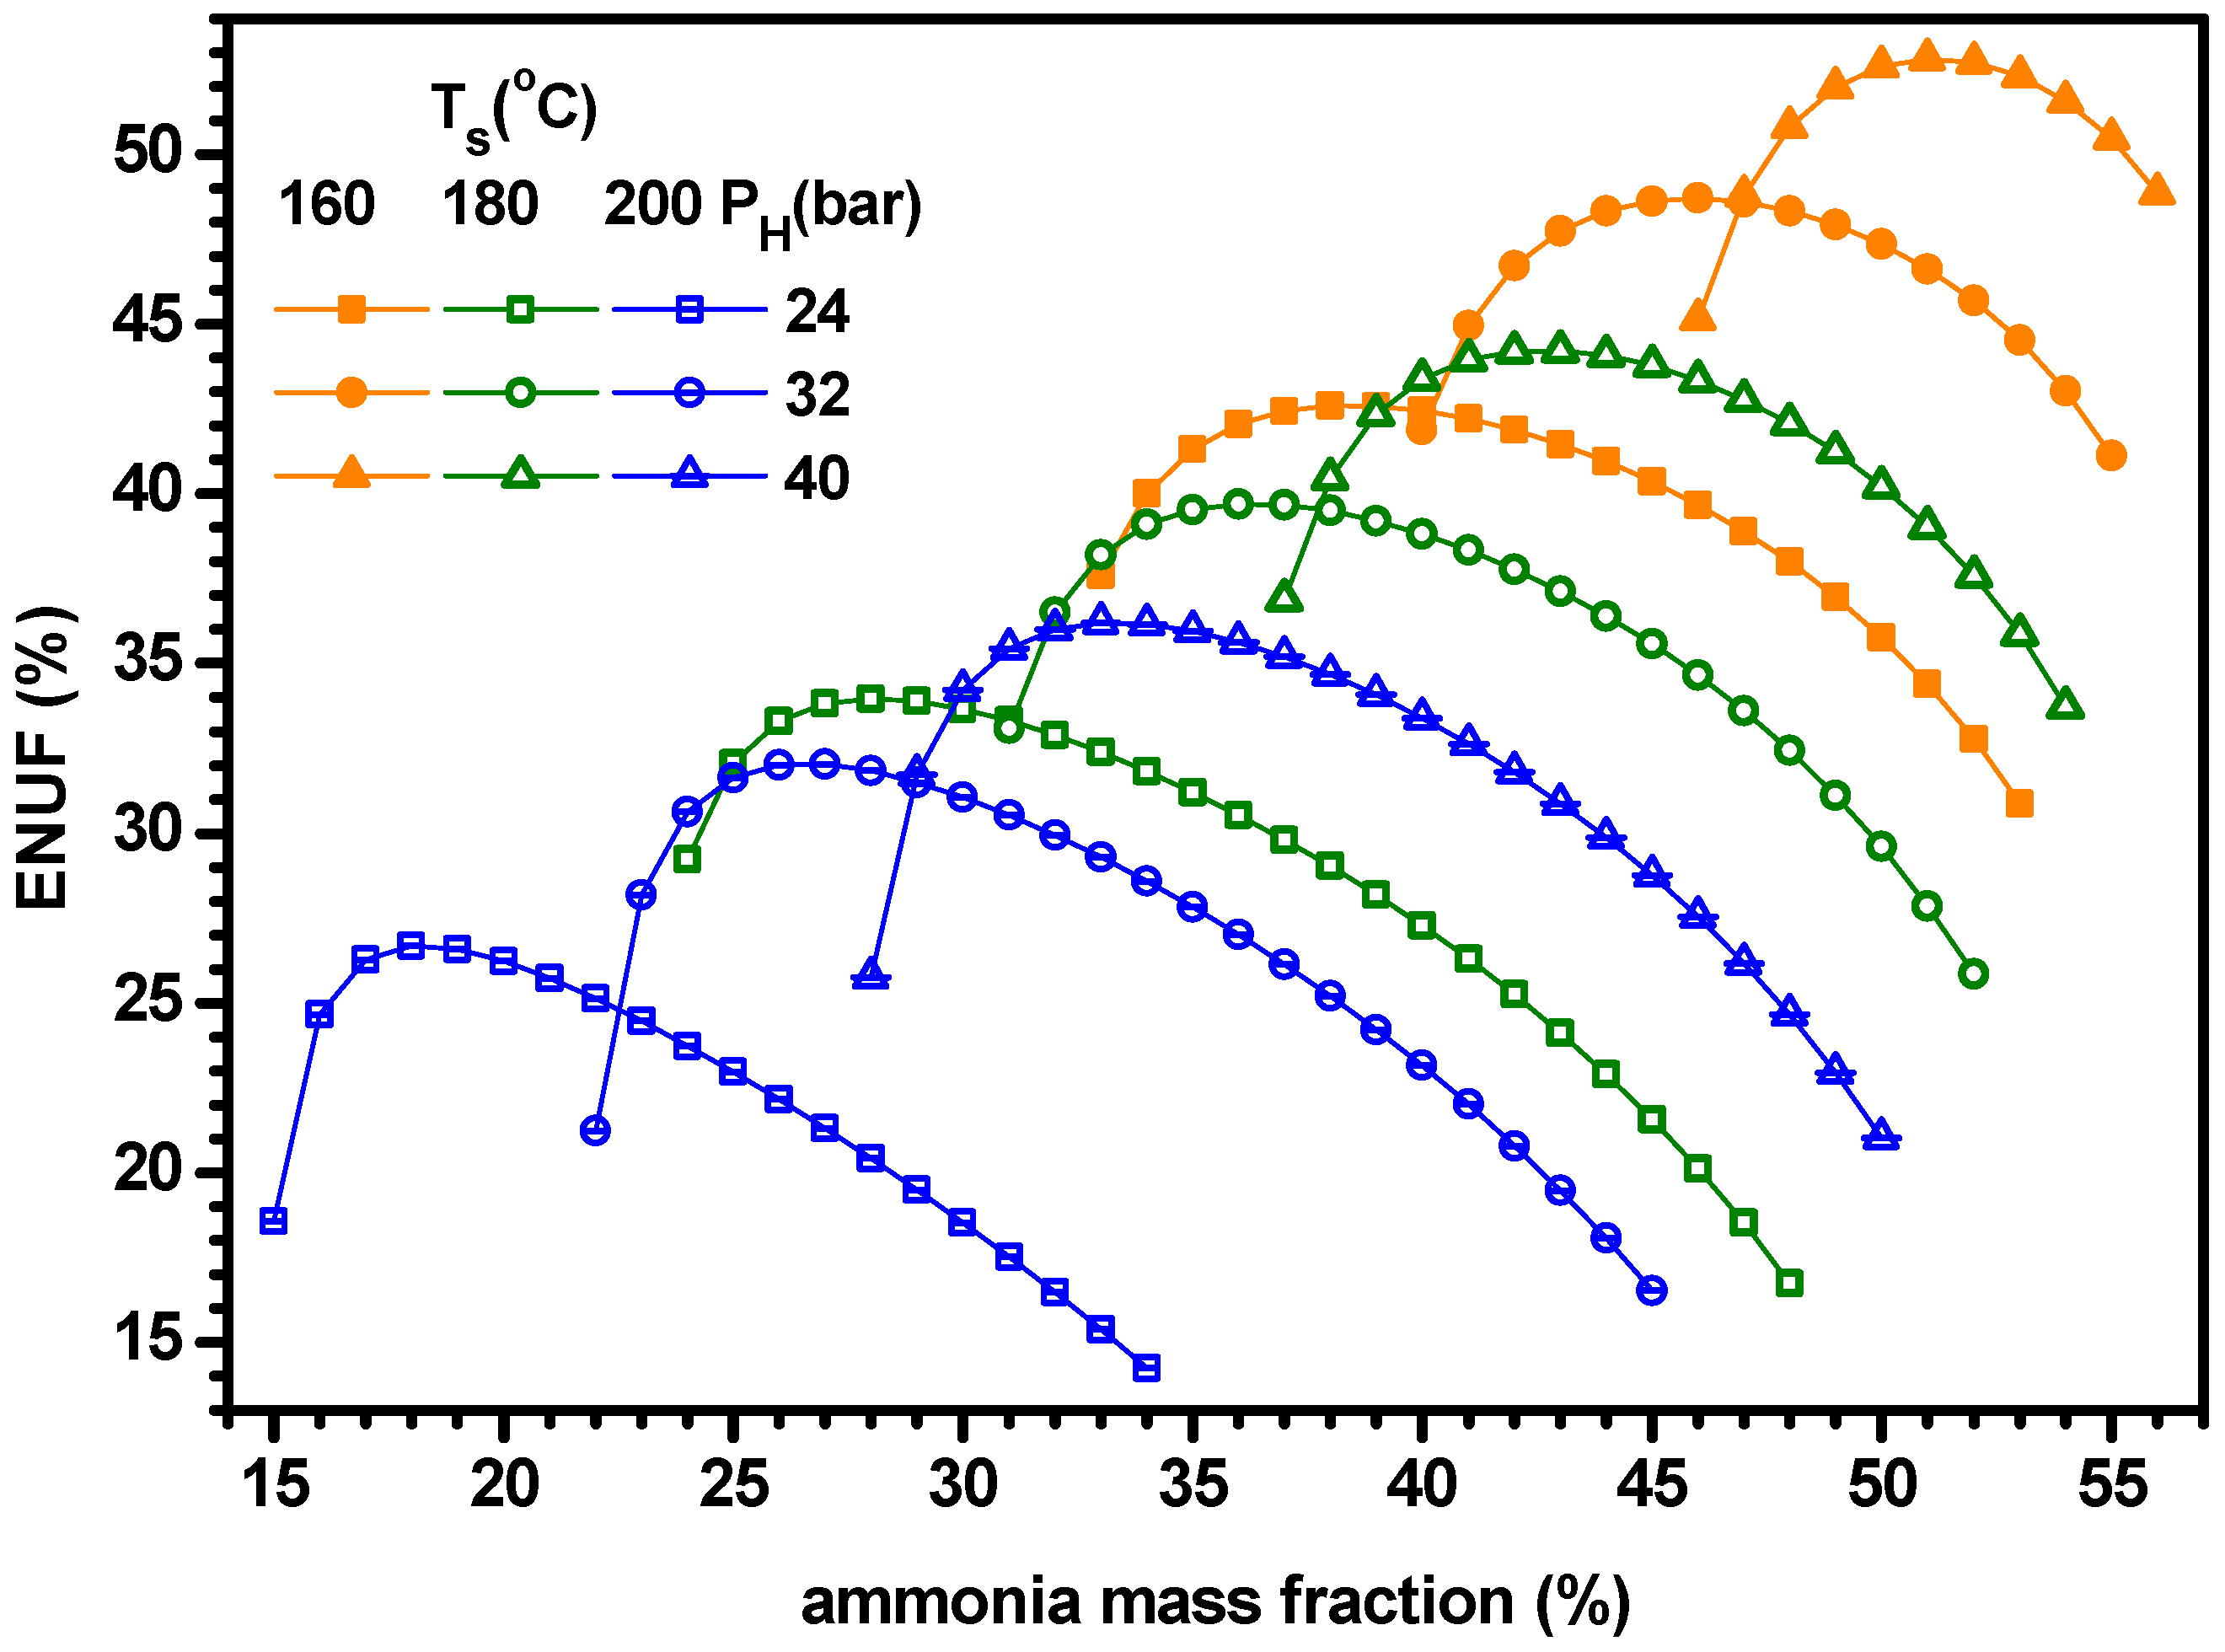
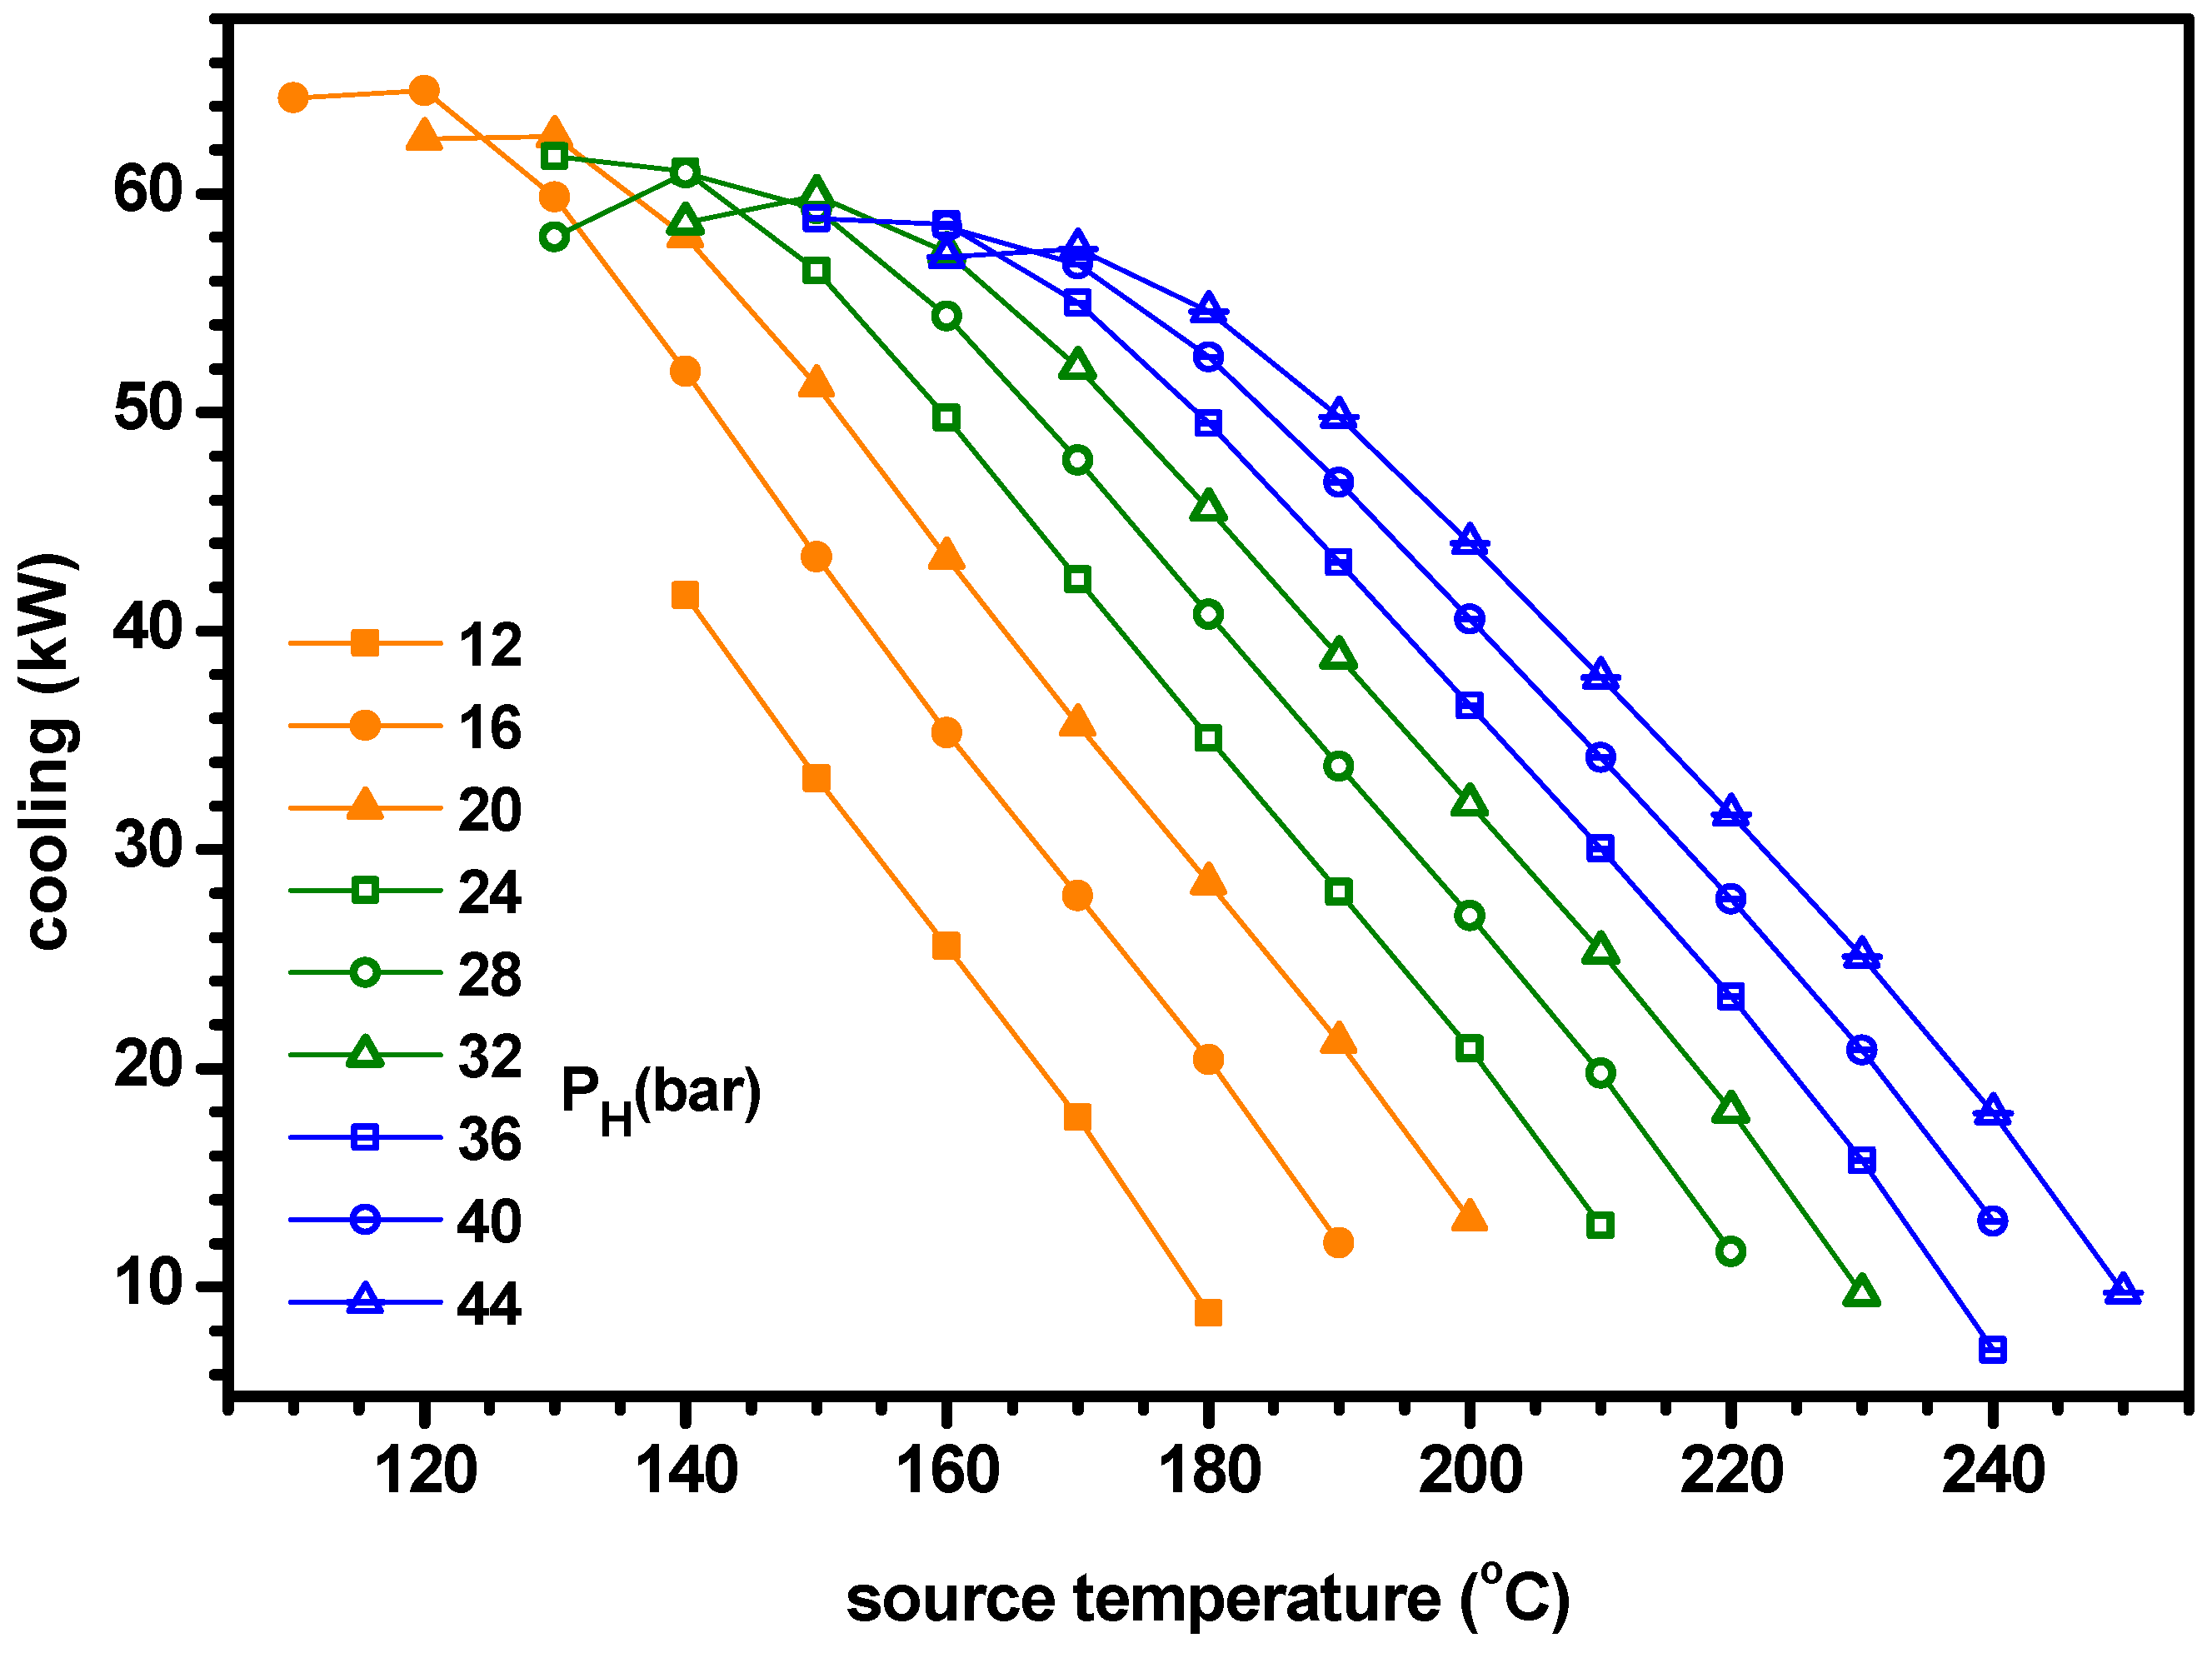
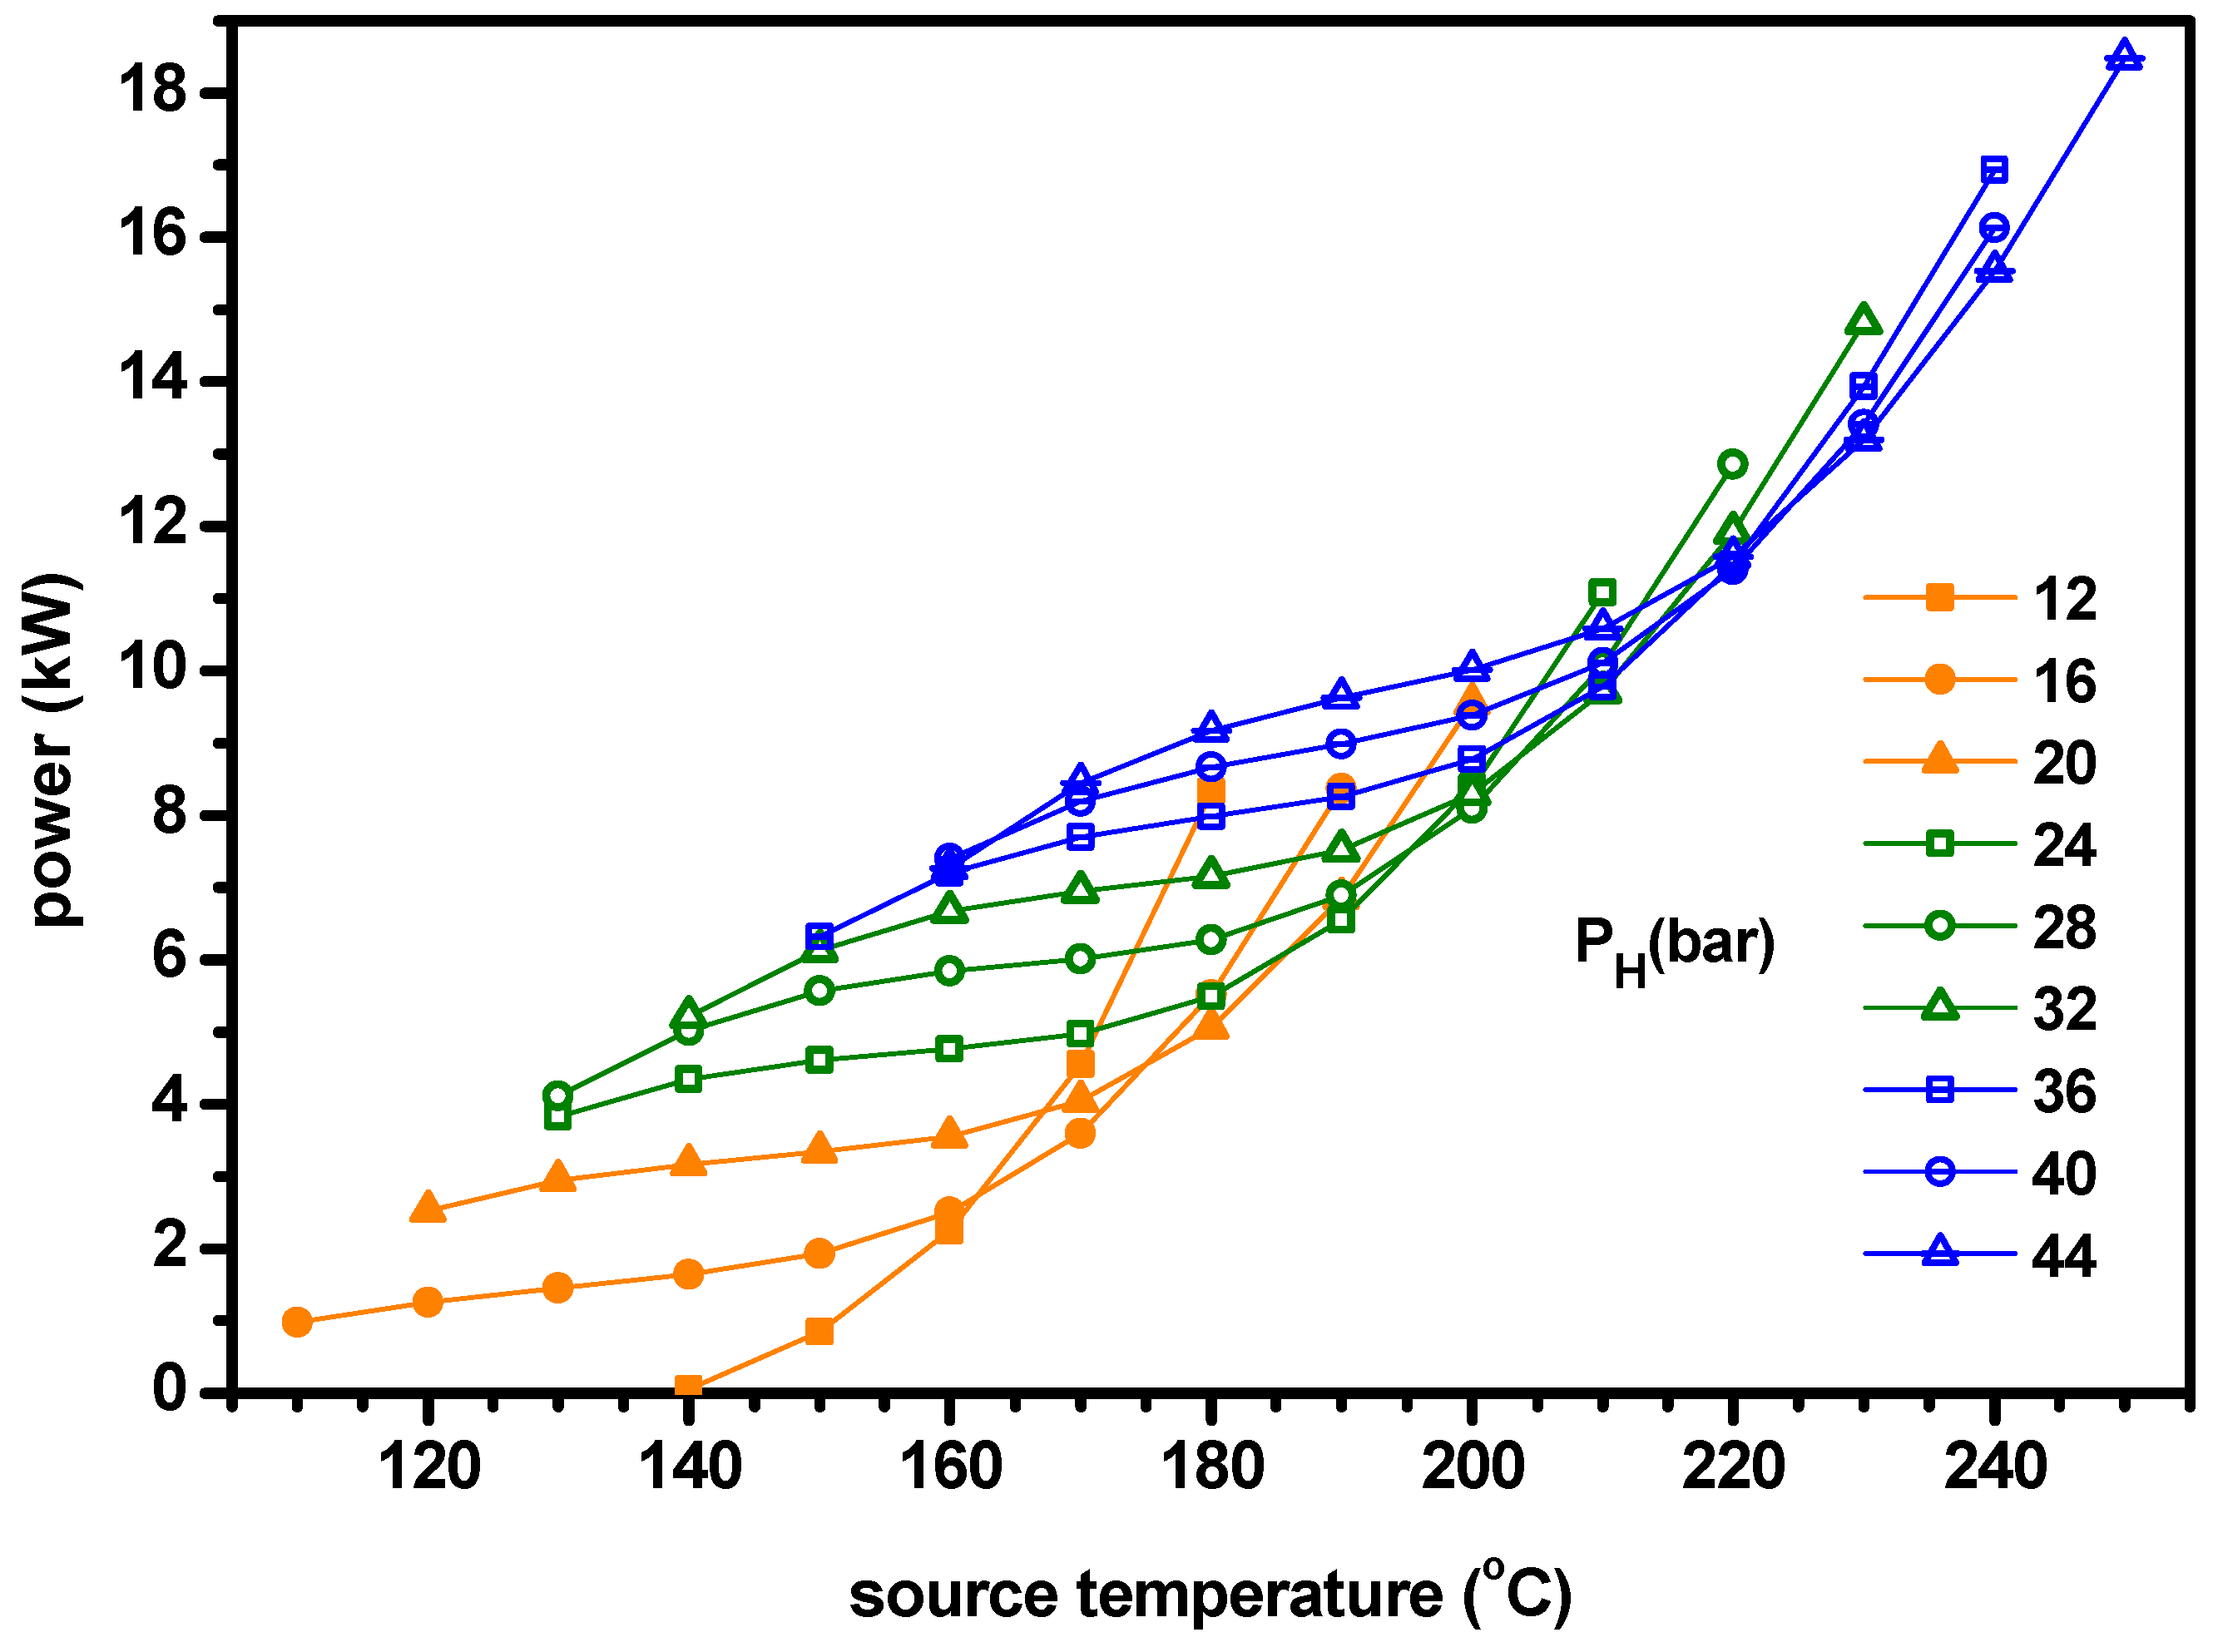
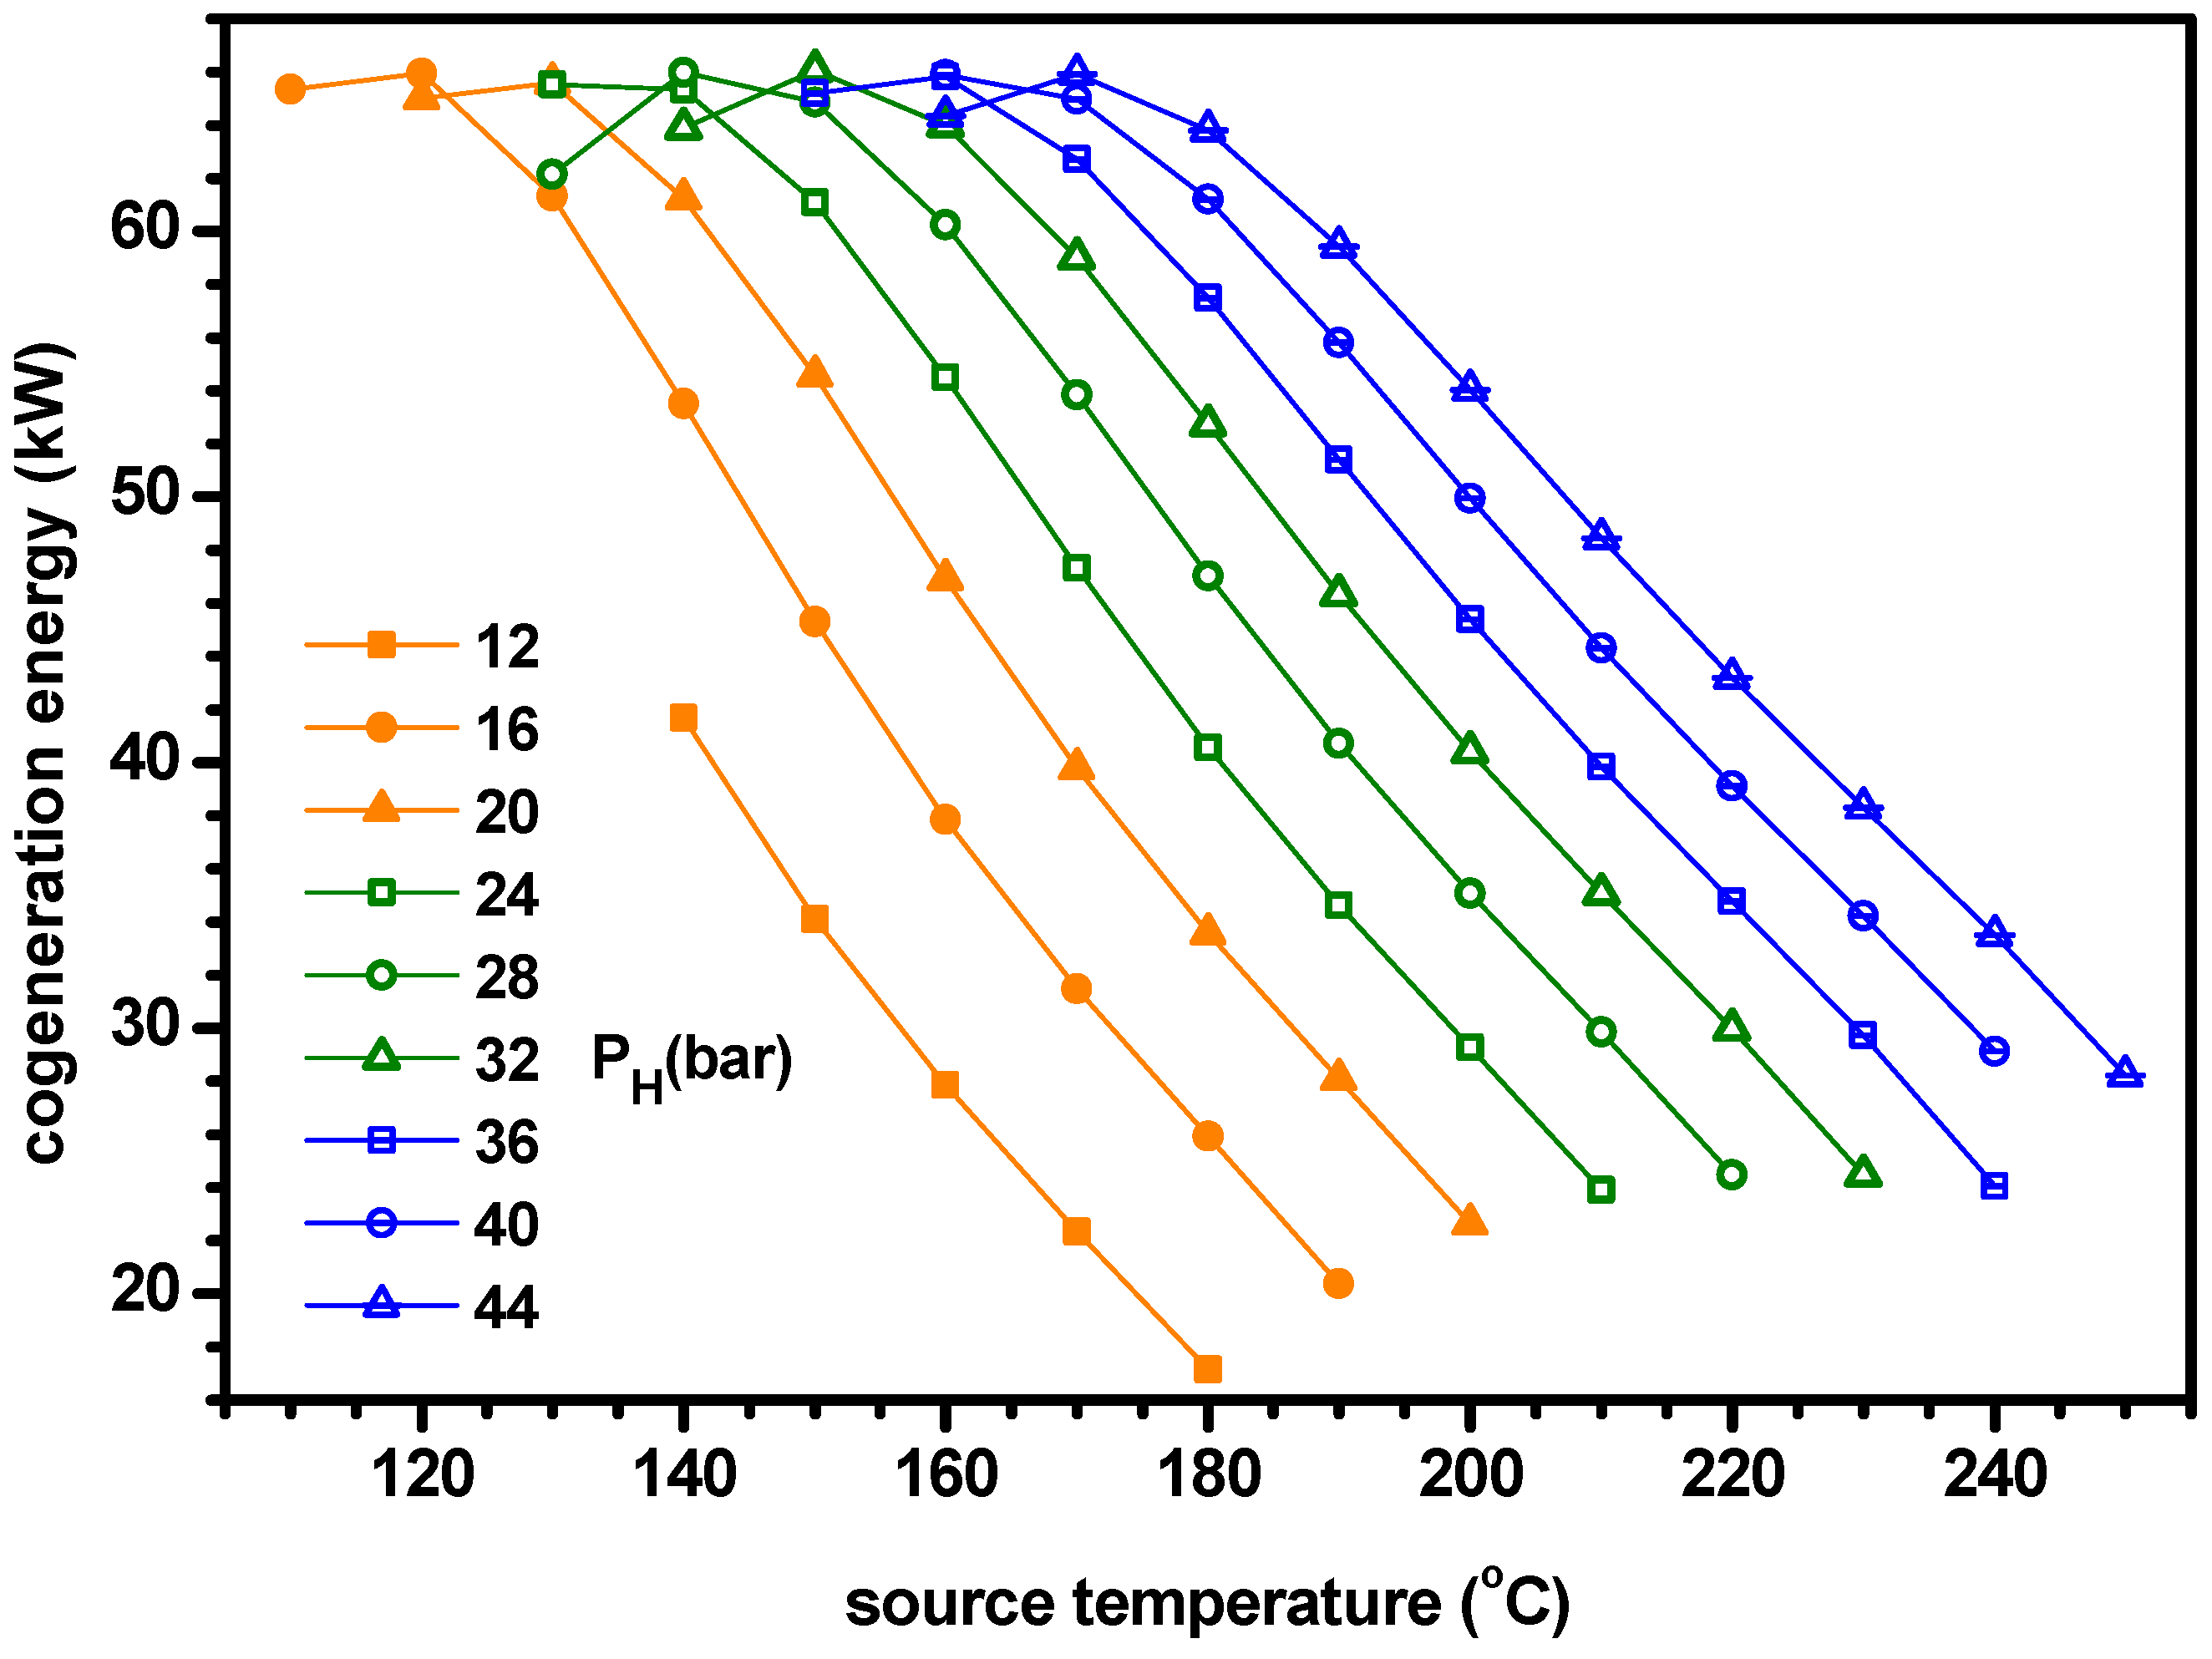
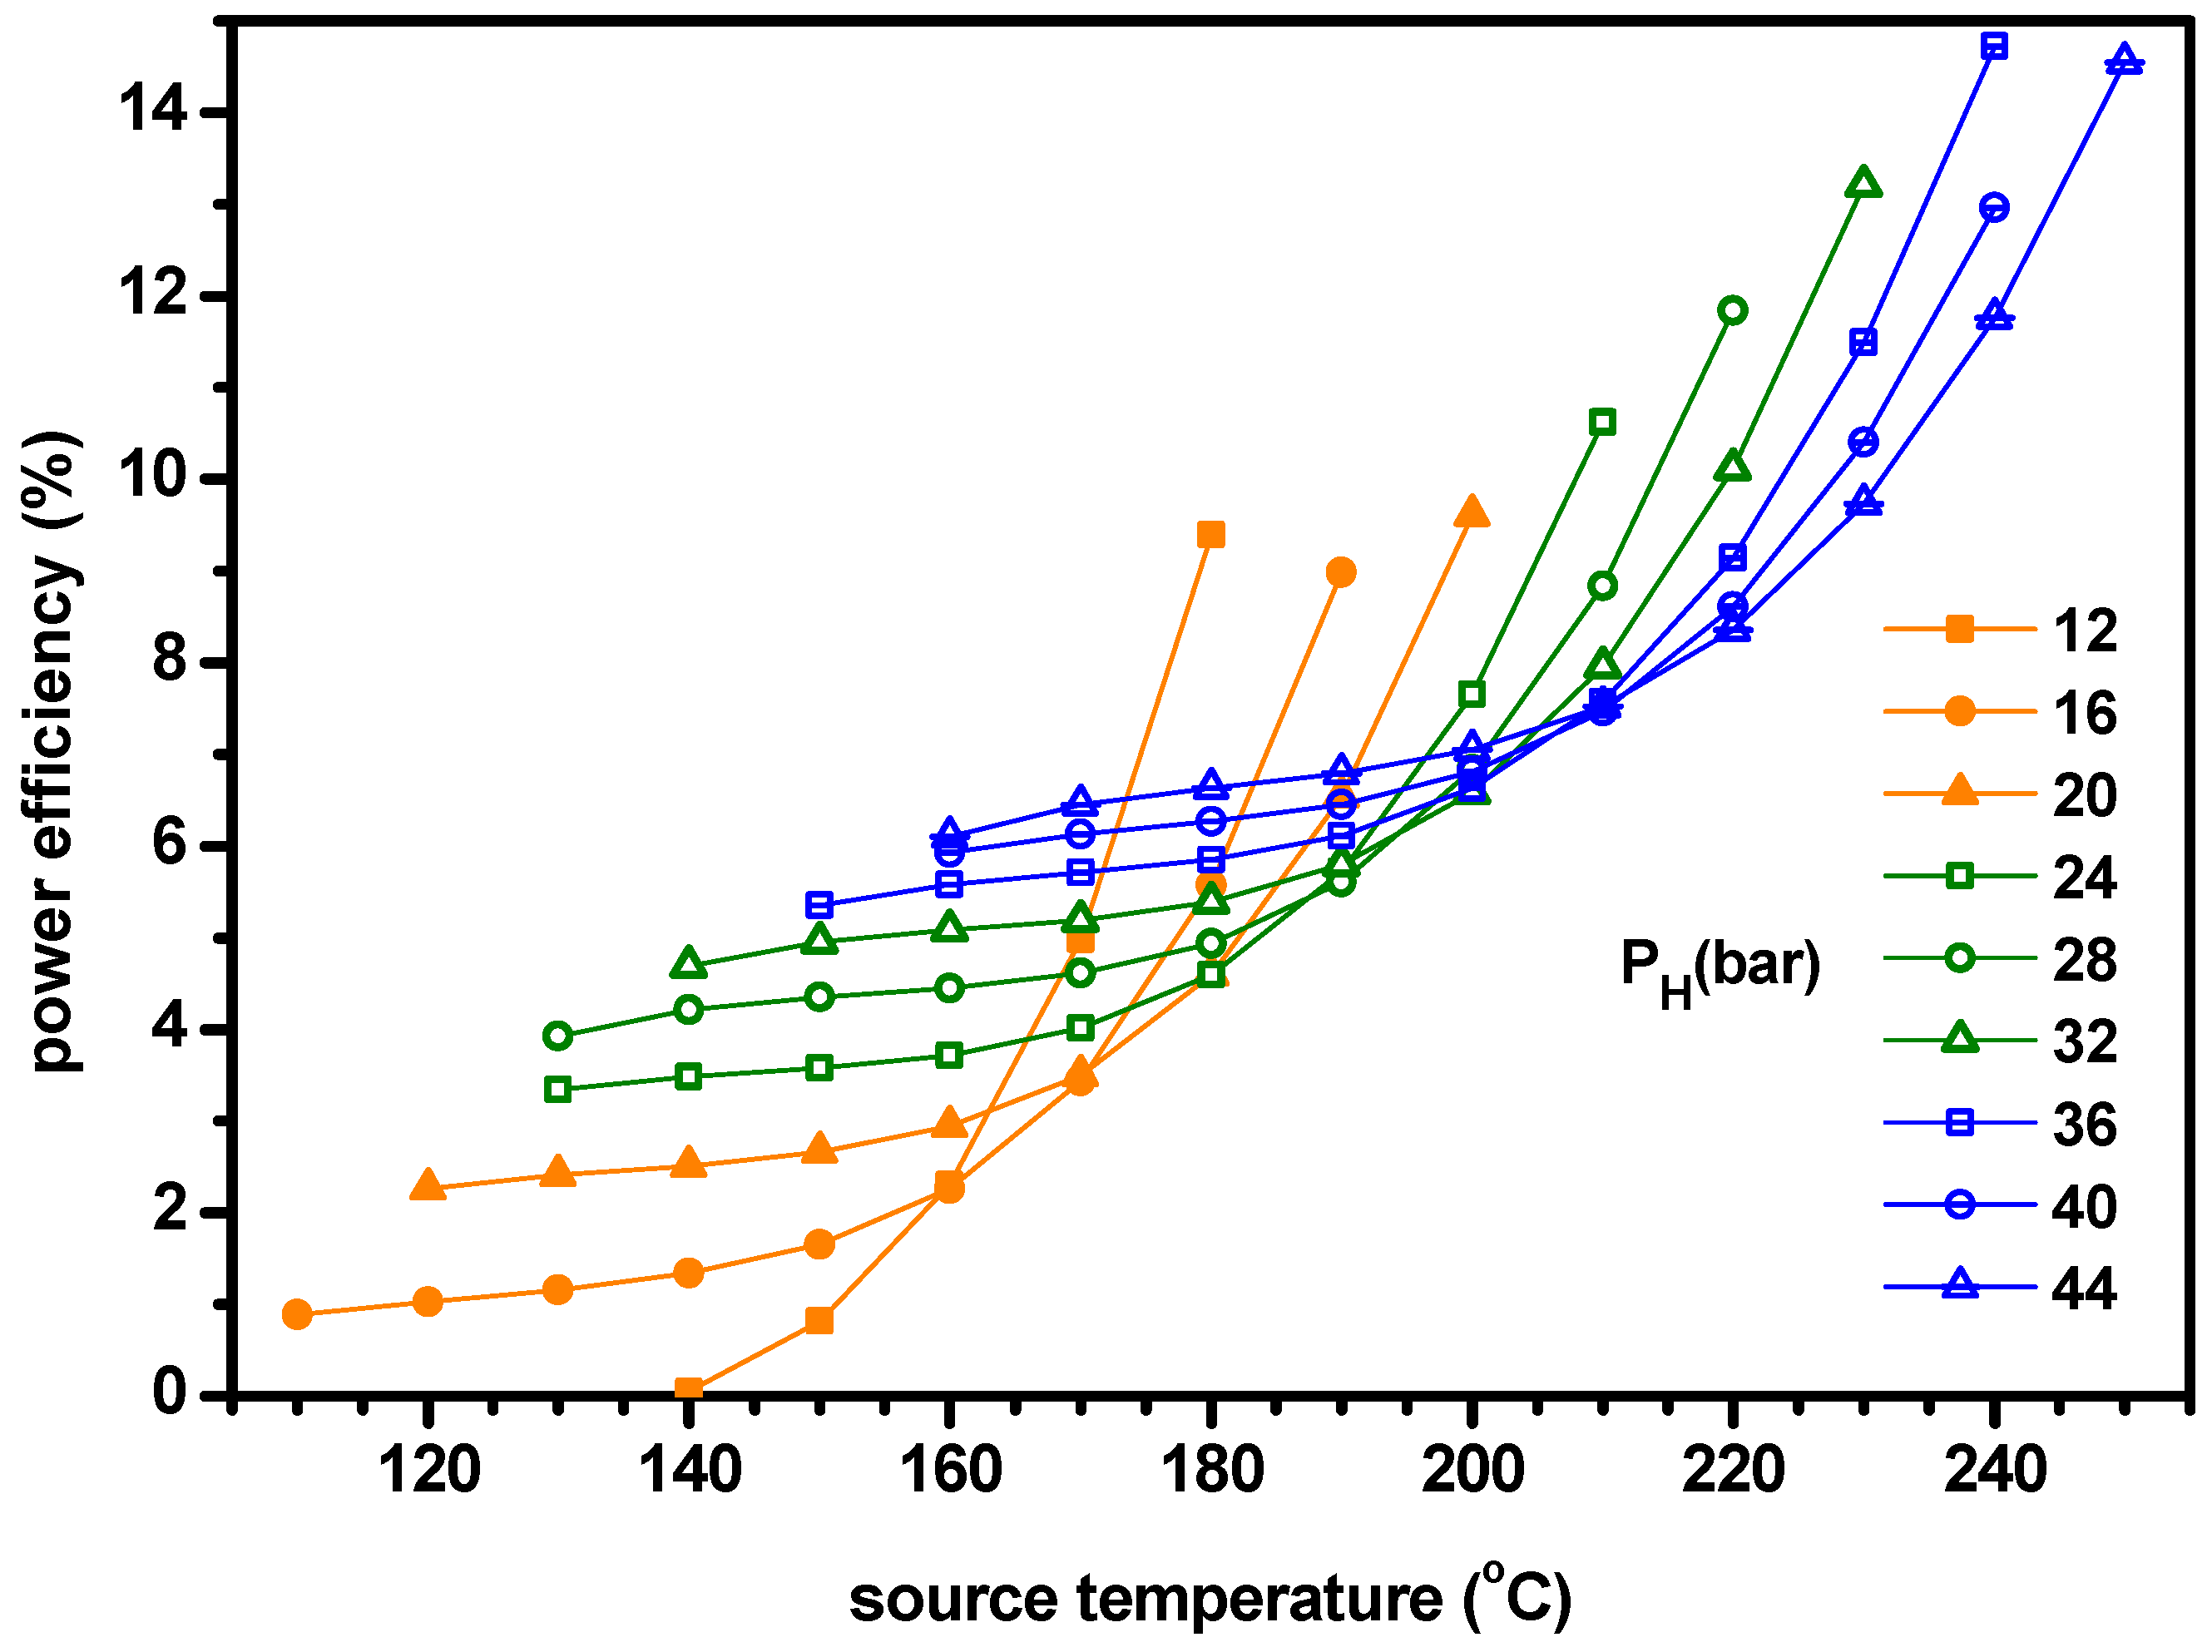
The power increases with ammonia fraction but the cooling has a maximum for ammonia fraction. As the cooling is greater than the power, the cogeneration energy has a peak for ammonia fraction. Similarly, the power efficiency increases with ammonia fraction but the cooling efficiency and ENUF have a peak for ammonia fraction.
(5)
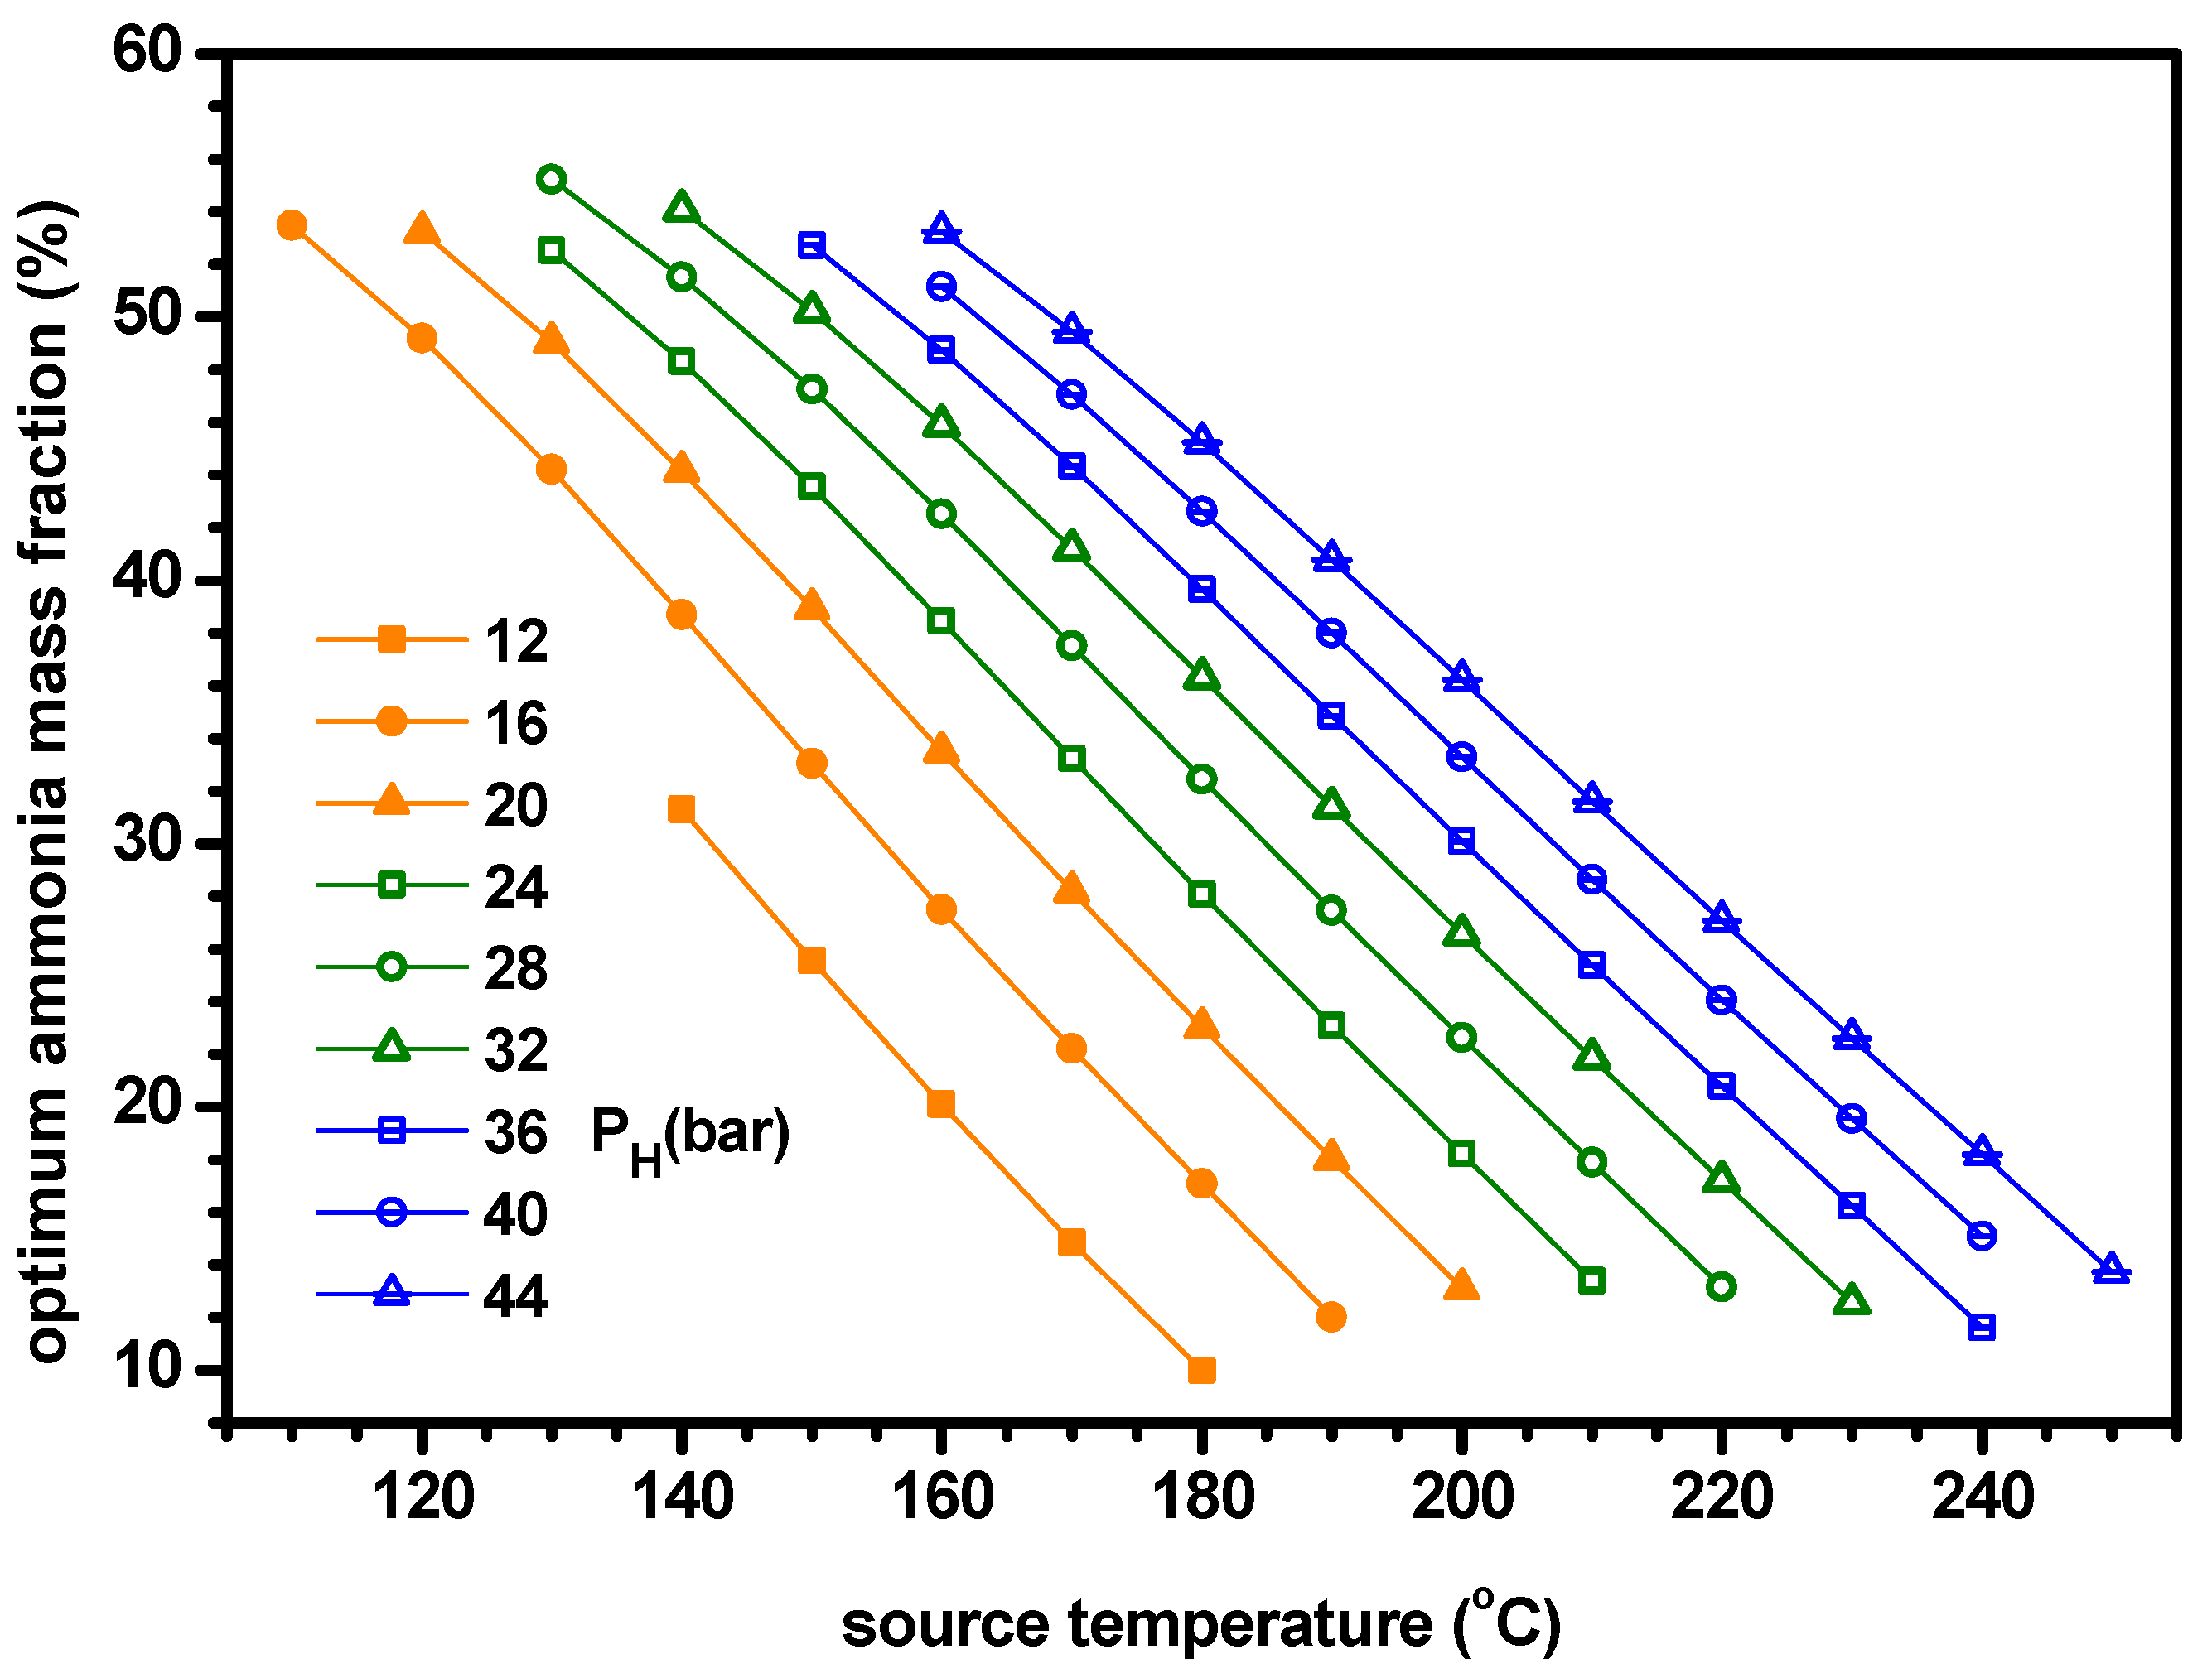
The optimum ammonia fraction for the maximum ENUF decreases with increasing source temperature or decreasing separator pressure. Under the conditions of optimal ammonia fractions, the power and power efficiency increase with the separator pressure but the cogeneration energy has a peak for the separator pressure. Under the optimal conditions, the ENUF increases as source temperature decreases or separator pressure increases.
(6)
Under the optimal conditions, the maximum cooling capacities and cogeneration energies are 64.7 kW and 66.0 kW for PH = 16 bar, 61.7 kW and 65.5 kW for PH = 24 bar, 59.9 kW and 66.1 kW for PH = 32 bar and 56.8 kW and 65.9 kW for PH = 40 bar, respectively. The optimum ammonia fraction and the ENUF can be correlated as a linear function with respect to the source temperature for a specified pressure as −A*TS+B. The values of A and B for PH = 16, 24, 32 and 40 in bar are 0.005181 and 1.103, 0.0004891 and 1.161, 0.004616 and 1.194 and 0.004510 and 1.243 for the optimum fraction and 0.004645 and 1.098, 0.0004276 and 1.110, 0.003950 and 1.108 and 0.003675 and 1.104 for ENUF, respectively.
(7)
The cogeneration energy and ENUF of the proposed system were significantly higher than power and thermal efficiency respectively of basic power generation cycle. As the proposed system is based on KCS-11 and is not employed with additional components such as rectifier and superheat, the system has a potential for efficient recovery of low-grade heat.

Funding

This research was supported by Basic Science Research Program through the National Research Foundation of Korea (NRF) funded by the Ministry of Education, Science and Technology (NRF-2018R1D1A1B07048866).

Conflicts of Interest

The authors declare no conflict of interest.

References

  1. Kim, K.H. Thermodynamic Performance and Optimization Analysis of a Modified Organic Flash Cycle for the Recovery of Low-Grade Heat. Energies 2019, 12, 442. [Google Scholar] [CrossRef]
  2. Lolos, P.A.; Rogdakis, E.D. A Kalina power cycle driven by renewable energy sources. Energy 2009, 34, 457–464. [Google Scholar] [CrossRef]
  3. Wagar, W.R.; Zamfirescu, C.; Dincer, I. Thermodynamic performance assessment of anammonia-water Rankine cycle for power and heat production. Energy Convers. Manag. 2010, 51, 2501–2509. [Google Scholar] [CrossRef]
  4. Kim, K.H.; Han, C.H.; Kim, K. Effects of ammonia concentration on the thermodynamic performances of ammonia-water based power cycles. Thermochim. Acta 2012, 530, 7–16. [Google Scholar] [CrossRef]
  5. Kim, K.H.; Ko, H.J.; Kim, K. Assessment of pinch point characteristics in heat exchangers and condensers of ammonia-water based power cycles. Appl. Energy 2014, 113, 970–981. [Google Scholar] [CrossRef]
  6. Ibrahim, O.M.; Klein, S.A. Absorption power cycles. Energy 1996, 21, 21–27. [Google Scholar] [CrossRef]
  7. Spiecker, S.; Weber, C. The future of the European electricity system and the impact of fluctuating renewable energy—A scenario analysis. Energy Policy 2014, 65, 185–197. [Google Scholar] [CrossRef]
  8. Zhang, X.X.; He, M.G.; Zhang, Y. A review of research on the Kalina cycle. Renew. Sustain. Energy Rev. 2012, 16, 5309–5318. [Google Scholar] [CrossRef]
  9. Zamfirescu, C.; Dincer, I. Thermodynamic analysis of a novel ammonia-water trilateral Rankine cycle. Acta 2008, 477, 7–15. [Google Scholar] [CrossRef]
  10. Guzović, Z.; Lončar, D.; Ferdelji, N. Possibilities of electricity generation in the Republic of Croatia by means of geothermal energy. Energy 2010, 35, 3429–3440. [Google Scholar] [CrossRef]
  11. Singh, O.K.; Kaushik, S.C. Energy and exergy analysis and optimization of Kalina cycle with a coal fired steam power plant. Appl. Eng. 2013, 51, 787–800. [Google Scholar] [CrossRef]
  12. Li, R.; Wang, H.; Yao, E.; Zhang, S. Thermo-Economic Comparison and Parametric Optimizations among Two Compressed Air Energy Storage System Based on Kalina Cycle and ORC. Energies 2017, 10, 15. [Google Scholar] [CrossRef]
  13. Guo, Z.W.; Zhang, Z.; Chen, Y.P.; Wu, J.F.; Dong, C. Dual-pressure vaporization Kalina cycle for cascade reclaiming heat resource for power generation. Energy Convers. Manag. 2015, 106, 557–565. [Google Scholar] [CrossRef]
  14. Zhu, Z.L.; Zhang, Z.; Chen, Y.P.; Wu, J.F. Parameter optimization of dual-pressure vaporization Kalina cycle with second evaporator parallel to economizer. Energy 2016, 112, 420–429. [Google Scholar] [CrossRef]
  15. Cao, L.; Wang, J.; Chen, L.; Dai, Y. Comprehensive analysis and optimization of Kalina-Flash cycles for low-grade heat source. Appl. Eng. 2018, 131, 540–552. [Google Scholar] [CrossRef]
  16. Kim, K.H.; Han, C.H.; Ko, H.J. Comparative Thermodynamic Analysis of Kalina and Kalina Flash Cycles for Utilizing Low-Grade Heat Sources. Energies 2018, 11, 3311. [Google Scholar] [CrossRef]
  17. Ogriseck, S. Integration of Kalina cycle in a combined heat and power plant, a case study. Appl. Eng. 2009, 29, 2843–2848. [Google Scholar] [CrossRef] [Green Version]
  18. Shankar, R.; Srinivas, T. Cooling cogeneration cycles. Appl. Sol. Energy 2017, 53, 61–71. [Google Scholar] [CrossRef]
  19. Kim, K.H.; Perez-Blanco, H. Performance analysis of a combined organic Rankine cycle and vapor compression cycle for power and refrigeration cogeneration. Appl. Eng. 2015, 91, 964–974. [Google Scholar] [CrossRef]
  20. Goswami, D.Y. Solar thermal power technology: Present status and ideas for the future. Energy Sources 1998, 20, 137–145. [Google Scholar] [CrossRef]
  21. Xu, F.; Goswami, D.Y.; Bhagwat, S.S. A combined power/cooling cycle. Energy 2000, 25, 233–246. [Google Scholar] [CrossRef]
  22. Sadrameli, S.M.; Goswami, D.Y. Optimum operating conditions for a combined power and cooling thermodynamic cycle. Appl. Energy 2007, 84, 254–265. [Google Scholar] [CrossRef]
  23. Zhang, N.; Lior, N. Development of a novel combined absorption cycle for power generation and refrigeration. J. Energy Res. Technol. 2007, 129, 254–265. [Google Scholar] [CrossRef]
  24. Liu, M.; Zhang, N. Proposal and analysis of a novel ammonia–water cycle for power and refrigeration cogeneration. Energy 2007, 32, 961–970. [Google Scholar] [CrossRef]
  25. Jawahar, C.P.; Saravanan, R.; Bruno Coronas, J.C. Simulation studies on gaxbasedKalina cycle for both power and cooling applications. Appl. Eng. 2013, 50, 1522–1529. [Google Scholar]
  26. Zheng, D.X.; Chen, B.; Qi, Y.; Jin, H.G. Thermodynamic analysis of a novel absorption power/cooling combined cycle. Appl. Energy 2006, 83, 311–323. [Google Scholar] [CrossRef]
  27. Yu, Z.; Han, J.; Liu, H.; Zhao, H. Theoretical study on a novel ammonia-water cogeneration system with adjustable cooling to power ratios. Appl. Energy 2014, 122, 53–61. [Google Scholar] [CrossRef]
  28. Zhang, S.; Chen, Y.; Wu, J.; Zhu, Z. Thermodynamic analysis on a modified Kalina cycle with parallel cogeneration of power and refrigeration. Energy Convers. Manag. 2018, 163, 1–12. [Google Scholar] [CrossRef]
  29. Hua, J.Y.; Chen, Y.P.; Wang, Y.D.; Roskilly, A.P. Thermodynamic analysis of ammonia–water power/chilling cogeneration cycle with low-grade waste heat. Appl. Eng. 2014, 64, 483–490. [Google Scholar] [CrossRef]
  30. Ghaebi, H.; Parikhani, T.; Rostamzadeh, H.; Farhang, B. Thermodynamic and thermo-economic analysis and optimization of a novel combined cooling and power(CCP) cycle by integrating of ejector refrigeration and Kalina cycles. Energy 2017, 139, 262–276. [Google Scholar] [CrossRef]
  31. Rashidi, J.; Yoo, C.K. A novel Kalina power-cooling cycle with an ejector absorption refrigeration cycle: Thermodynamic modelling and pinch analysis. Energy Convers. Manag. 2018, 162, 225–238. [Google Scholar] [CrossRef]
  32. Shokati, N.; Ranjbar, F.; Yari, M. A comprehensive exergoeconomic analysis of absorption power and cooling cogeneration cycles based on Kalina, part 1: Simulation. Energy Convers. Manag. 2018, 158, 437–459. [Google Scholar] [CrossRef]
  33. Shankar, R.; Srinivas, T. Performance investigation of Kalina cooling cogeneration cycles. Int. J. Refrig. 2018, 86, 163–185. [Google Scholar] [CrossRef]
  34. Xu, F.; Goswami, D.Y. Thermodynamic properties of ammonia-water mixtures for power cycle application. Energy 1999, 24, 525–536. [Google Scholar] [CrossRef]
Figure 1. Schematic of the system.
Energies 12 01536 g001
Figure 2. Enthalpy-ammonia fraction diagram of the system.
Energies 12 01536 g002
Figure 3. Temperature-entropy diagram for different separator pressures.
Energies 12 01536 g003
Figure 4. Temperature-entropy diagram for different ammonia fractions.
Energies 12 01536 g004
Figure 5. Quality at separator for varying ammonia fraction.
Energies 12 01536 g005
Figure 6. Heat input rate for varying ammonia fraction.
Energies 12 01536 g006
Figure 7. Mass flow rate at boiler for varying ammonia fraction.
Energies 12 01536 g007
Figure 8. Mass flow rate at turbine for varying ammonia fraction.
Energies 12 01536 g008
Figure 9. Power for varying ammonia fraction.
Energies 12 01536 g009
Figure 10. Cooling for varying ammonia fraction.
Energies 12 01536 g010
Figure 11. Cogeneration energy for varying ammonia fraction.
Energies 12 01536 g011
Figure 12. Power efficiency for varying ammonia fraction.
Energies 12 01536 g012
Figure 13. ENUF for varying ammonia fraction.
Energies 12 01536 g013
Figure 14. Effect of source temperature on the optimum ammonia fraction.
Energies 12 01536 g014
Figure 15. Effect of source temperature on the heat input rate.
Energies 12 01536 g015
Figure 16. Effect of source temperature on the cooling capacity.
Energies 12 01536 g016
Figure 17. Effect of source temperature on the power.
Energies 12 01536 g017
Figure 18. Effect of source temperature on the cogeneration energy.
Energies 12 01536 g018
Figure 19. Effect of source temperature on the power efficiency.
Energies 12 01536 g019
Figure 20. Effect of source temperature on the ENUF.
Energies 12 01536 g020
Table 1. Basic conditions for simulation.
SymbolParameterDataUnit
Tssource temperature180°C
T4separator temperatureTs-15°C
PHseparator pressure32bar
T1, T7condensation temperature35°C
T16, T18water inlet temperature30°C
T20temperature of chilled water in20°C
T21temperature of chilled water out15°C
ΔTpppinch temperature difference5°C
ηpisentropic efficiency of pump75%
ηtisentropic efficiency of turbine75%
xbbasic ammonia fraction45%
Table 2. Thermodynamic properties and mass flow rate for the stream in the system.
Statex(%)TP(bar)h (kJ/kg)s (kJ/kgK)m (kg/s)
145.035.03.230.00.0000.343
245.035.532.004.50.0040.343
345.0120.132.00395.91.1220.343
445.0165.032.001027.02.6570.343
580.7165.032.001887.44.8690.106
680.7118.810.921740.34.9960.106
780.735.010.92108.90.1090.106
880.7−0.63.23108.90.1630.106
980.715.03.23700.32.3270.106
1029.0165.032.00640.21.6620.237
1129.040.532.0072.80.1460.237
1229.041.03.2372.80.1550.237
1345.049.13.23267.40.8610.343
14 180.0 671.51.8141.000
15 130.1 455.11.3081.000
16 30.0 20.90.0701.778
17 42.3 72.50.2361.778
18 30.0 20.80.0693.071
19 43.6 77.30.2523.071
20 20.0 −21.0−0.0712.992
21 15.0 −42.0−0.1432.992

