Article

Assessment of the Energy Efficiency Improvement of Twenty-Five Countries: A DEA Approach

Department of Industrial Engineering and Management, National Kaohsiung University Sciences and Technology, Kaohsiung 80778, Taiwan
*
Authors to whom correspondence should be addressed.
Energies 2019, 12(8), 1535; https://doi.org/10.3390/en12081535
Submission received: 8 March 2019 / Revised: 9 April 2019 / Accepted: 21 April 2019 / Published: 23 April 2019
(This article belongs to the Special Issue Energy and Environment)

Abstract

:
Since energy efficiency and energy improvement are viewed as two of the most important keys of sustainable management, research on energy has become popular and captured much more attention. The current paper aimed to measure the energy efficiency of 25 countries with carbon dioxide (CO2) emissions as well as their energy efficiency improvement. First, a data envelopment analysis (DEA) slack-based model (SBM) was employed to obtain efficiency scores. Second, the Malmquist Productivity Index (MPI) was then used to examine the improvement during the period of 2010–2017. Findings of this study showed that developed countries had a more balanced development between gross domestic product (GDP) growth and CO2 emissions by using the same inputs as developing countries. Additionally, the findings revealed that India and China, being the two largest population countries, achieved improved energy intensity during 2010–2017; however; their energy consumption and CO2 emissions continued to grow, leading them to being the two worst countries in terms of energy efficiency.

1. Introduction

In recent years, improving energy efficiency has been often advocated as a way to increase the productivity and sustainability of society and the environment as well. According to the International Energy Agency (IEA, 2018), global energy demand rose by 1.9% in 2017—the fastest annual increase since 2010 [1], caused mainly by the emerging economies. The International Energy Agency also pointed out that the increase in the production of some industrial sectors was the most energy intensive, which boosted energy demand. In the IEA’s 2018 report, energy demand in 2017 was 584 exajoules (EJ) and is forecasted to rise 26% to 736 EJ in 2040 [1]. According to the U.S. Energy Information Administration, global energy consumption will increase by 48% by 2040, contributing to almost 26% of greenhouse gas emissions [2]. The world, therefore, is rising to the challenge of increased energy demand and the derived requirement of energy resources. Additionally, hugely increasing energy consumption causes many issues, for example, greenhouse gas emissions. Consequently, cutting back the consumption of global energy has become very crucial, with energy efficiency improvement being one of the most effective tools [1]. Energy efficiency and emission reduction as well as controlling carbon dioxide (CO2) emissions are a country’s keys to developing a sustainable economy [3]. Therefore, the assessment of energy and greenhouse gas emissions has received more attention than ever before.
In the past few years, various methods have been applied to measure energy efficiency. However, despite many studies, research on energy efficiency in relation to the environment has never been excessive or has been considered unnecessary. Additionally, it was found that there are rare studies concerning the difference between results with and without the existence of bad output. Moreover, not many studies addressing energy improvement are found in the literature. Accordingly, the purpose of this study was to offer a comprehensive view of overall energy and environmental efficiency as well as energy progress of the top 25 listed countries in terms of CO2 emissions. The two main steps of this research were first to measure energy efficiency using DEA SBM and, second, to examine the energy efficiency improvement of these countries during the period of 2010–2017 using the MPI.
Results of this study confirm that by using the same input resources, developed countries are more effective in promoting GDP growth and reducing CO2 emissions than developing countries are. Additionally, as a general observation, 25 sample countries showed no evidential energy enhancement. Furthermore, our study findings also revealed that India and China, being the two largest population countries and CO2 emitters, experienced very poor performance in terms of energy efficiency. Our findings provide important policy implications.
In the context of efficiency measurement, the non-parametric approach called data envelopment analysis (DEA) is a widely used method for measuring efficiency [3]. The DEA method for measuring energy efficiency has been so widely applied in recent decades that there are hundreds of studies assessing energy and/or environmental efficiency regionally and globally [4]. In 2018, Mardani [5] conducted a review on DEA used in measuring energy and environment where the author selected and reviewed 145 previous studies using the DEA method for assessing energy and environment. Energy efficiency has long been explored, covering not only countries’ sectors or industries but also within or across regions and countries. Using the DEA method, Hu and Kao [6] conducted a study in 2006 on the topic of energy savings, targeting the economies of the 17 Asia-Pacific Economic Cooperation (APEC) countries during 1991–2000, where energy, labor, and capital were used as inputs and the GDP was the only output. The findings showed that Hong Kong, Philippines, and the United States had the highest energy efficiency and that the energy efficiency levels could be varied across economies even for the same sector [6]. Considering the energy utilization efficiency between China and Taiwan from 2002 to 2007, the study of Yeh [7] applied DEA with three inputs (number of laborers employed, real capital stock, and quantity of energy consumed) and three outputs (GDP, CO2 emissions, and SO2 emissions). In their study, Wang [8] used several DEA models to evaluate the total-factor energy and emission performance of 30 regions in China during the period of 2000–2009 in the presence of undesirable outputs. In that research, both non-energy inputs (capital stock, labor) and energy inputs (coal, oil, and gas) were used together to produce a good output, GDP, and bad outputs, CO2 and SO2 emissions. In 2013, there were several studies measuring energy performance as well as energy efficiency, such as those carried out by Bian [9], Hong [10] Wang [11] Zhang [12], and [13]. In their study, Bian [9] surveyed energy savings and the related carbon dioxide emission reduction in China. In that study, a non-radial DEA model was employed with the joint set of inputs and both desirable and undesirable outputs. The inputs included labor, capital stock, and energy consumption, whereas the outputs consisted of GDP and CO2 emissions. Hong et al. [10] carried out a study measuring the regional environmental efficiency in China by using a super SBM over the period of 1991–2001 with three inputs (labor, capital stock, and energy used) and two outputs (GDP and waste). Wang et al. [11] used improved DEA models to measure the energy and environmental efficiency of 29 administrative regions of China during the period of 2000–2008, considering both desirable and undesirable outputs as well as energy and non-energy inputs. In that study, annual data of capital stock and labor force were considered as two non-energy inputs and energy consumption was used as energy input, whereas GDP was the only desirable output and CO2 and SO2 emissions were two undesirable outputs. With respect to environment energy efficiency, Zhang and Choi [12] used a DEA SBM to calculate pure energy efficiency and scale efficiency by incorporating three inputs (labor force, capital stock, and energy consumption) with one desirable output (real GDP) and three undesirable outputs (carbon dioxide, sulfur dioxide, and chemical oxygen demand). In their pilot research, Song [13] analyzed the current situation of energy efficiency in China. In that research, a super SBM was applied to assess the energy efficiency with variables such as labor, total energy consumption, and fixed capital formation used as inputs and GDP being the only output. In 2014, Wang and Wei [14] applied a newly developed DEA-based method to evaluate the regional energy and emission efficiencies as well as the energy saving and emission reduction potentials of the industrial sector of 30 major Chinese cities during 2006–2010. To reach the research’s objectives, three inputs (capital, labor, and total energy consumption) and three outputs (value-added, CO2 emissions, and SO2 emissions) were selected. Lin and Du [15] employed a newly developed non-radial DEA to evaluate regional energy and CO2 emission performance of China for the period of 1997–2009. Rui et al. [16] surveyed the total-factor energy efficiency of 87 sample countries during 2004–2010 by extending the non-parametric method of production economic to construct the directional distance function of slack-based measurement. Yaser [17] conducted a study on energy and CO2 emission efficiency by applying the SBM model proposed by Tone in 2001 [18]. Total labor force, gross capital formation, and total primary energy consumption were taken as inputs, whereas GDP at market price and CO2 emissions were used as good and bad outputs, respectively. Recently, Zhou [19] applied the two-stage DEA method to analyze the energy efficiency and congestion of APEC countries for the period of 1995–2012. Chen and Jia [20] explored the efficiency in terms of energy of 31 Chinese regions by using the DEA method. Wang. [21] used a DEA SBM to evaluate the energy efficiency of 17 countries during 2010–2015 and used MPI to measure the change in efficiency across that period. In the same vein, gross capital formation and labor force were used as non-energy inputs, and total energy consumption as an energy input, and the GDP was used as a desirable output and CO2 emissions as an undesirable output. Recently, Yasesr. [22] carried out a study concerning the energy and CO2 emission efficiency of major economies. A network DEA approach was run for that research with the selection of three inputs (total labor force, gross capital formation, and total energy consumption) and two outputs (GDP and CO2 emissions). Those study results found that none of the economies was efficient overall and that China was the worst country, whereas the United States were the most efficient country in terms of energy.
According to the literature, DEA SBM was frequently applied to deal with the presence of undesirable outputs; for example, the study carried out by Apergis [23] used an SBM to measure the energy efficiency of selected Organisation for Economic Co-operation and Development (OECD) countries. Regarding the concern about CO2 emissions, Liu and Liu [24] used three-stage DEA in their study to measure the low-carbon economy efficiency of the top 20 largest CO2 emitters from 2000 to 2012 with the presence of CO2 emissions as an unwelcome output. Lenz. [25] examined the energy efficiency changes in the European Union (EU) countries by using a DEA SBM. Various other studies use an SBM model for efficiency assessment with the presence of bad outputs such as those carried out by Hong [10], Zhang [12], Rui [16], and Song [13].
The rest of this paper is organized as follows. Section 2 describes the research methodology used to measure energy efficiency and evaluate energy efficiency change during 2010–2017. Section 3 presents the empirical results and Section 4 presents the discussion and the conclusions drawn from the research.

2. Research Methodology

To reach the objectives of this paper, we employed a non-parametric method, DEA, which has been widely used to assess the efficiency of decision-making units (DMUs). In accordance with environmental conservation awareness, undesirable outputs should be taken into consideration when evaluating efficiency. DEA usually assumes that producing more outputs relative to fewer inputs is a criterion of efficiency [26]. However, in the presence of undesirable outputs, promoting more good outputs and less bad outputs relative to fewer input resources should be recognized as efficient. The DEA literature includes a model to deal with this purpose, called SBM which was initially proposed by Tone in 2001 [18] and then modified in 2003. The SBM is a non-radial method that directly uses input and output slacks to produce an efficiency measure. In this study, the SBM with undesirable output method of Tone (2003) [26] was applied to measure the energy efficiency of 25 selected countries during 2010–2017.
According to Tone (2003) [26], in SBM, each DMU is assumed to have three factors—inputs, good (desirable) outputs, and bad (undesirable) outputs—represented by three vectors, x R m , Y g   R s 1 , and Y b   R s 2 , respectively.
For a DMU ( x o , y o ) ,   the decomposition is denoted as ( x o , y o g , y o b ) . The production possibility set is defined by the following:
P = { ( x , y g , y b ) | x   X λ ,   y g     Y g   λ ,     y b     Y b λ ,   L   e λ   U ,     λ   0 | },
where λ is the intensity vector, and L and U are the lower and upper bounds of the intensity vector, respectively.
A DMU ( x o , y o g , y o b ) is efficient if there is no vector ( x o , y o g , y o b )   P, such that x 0 x ,   y o g y g ,   y o b y b with at least one strict inequality. The SBM of Tone (2001) was modified as follows:
[ SBM ]   ρ * = min 1 1 m   i = 1 m s i o x i o 1 + 1 s ( r = 1 s 1 S r g y r o g   +   r = 1 s 2 S r b y r o b ) Subject   to xo   =   X λ   +   S y o g   =   Y λ   -   S g y o b   =   Y λ   +   S b L   e λ   U S ,   S g ,   S b ,   λ   0 .
The vectors S and S b refer to the excesses in inputs and undesirable outputs, and S g represents the shortage in desirable outputs. The D M U o is efficient considering bad output if and only if ρ* = 1 or, in other words, S * = 0, S g * = 0, and S b * = 0.
According to Hu and Wang [27], the traditional energy efficiency index is called particular-factor energy efficiency (PFEE) and only considers the energy consumption with respect to producing economic output. The new index, called total-factor energy efficiency (TFEE), considers the use of multiple inputs in order to produce desirable outputs and undesirable outputs. We measured energy efficiency based on the TFEE and the PFEE viewpoint of Hu and Wang [27]. According to those authors, TFEE = Target Energy Input/Actual Energy Input as is shown by Equation (2) below:
TFEE   =   ( x e   β e ) x e = 1 β e x e
Equation (3) shows the TFEE after taking all inputs, outputs and bad outputs into account [16].
TFEE   =   1   -   n α 1 n β x n x n   -   m α 2 m β y m y m   -   q α 3 q β b q b q
TFEE   =   n α 1 n ( 1 β x n x n )   +   m α 2 m ( 1 β y m y m )   +   q α 3 q ( 1 β b q b q ) .
TFEE = Total-factor input efficiency + Total-factor output efficiency + Total-factor bad output efficiency
The index PFEE computes the efficiency ratio by directly dividing GDP output by energy input as an indicator of energy efficiency.
Besides calculating technical efficiency at a given time, it is equally important to calculate efficiency over time. Comparing efficiency levels between different time periods gives researchers a better view of the change in efficiency over time, which enables them to assess how these changes influence efficiency and can help partly in predicting the fluctuations of future performance [20]. To do this, the Malmquist Productivity Index which helps to calculate the change in aggregate productivity over time was proposed. In the DEA method, the estimation of technical efficiency is based on a defined frontier and, therefore, the comparison between two different time periods based on two different frontiers is very complex. Fare. [28] proposed a model for determining the change in total productivity over time in which any DMU would be studied at two different times t and t + 1 (corresponding to two different frontiers at two points t and t + 1) and then the change would be compared in that DMU's total productivity. Let us assume that E is the distance function with t and t = 1 being two different time periods. We have the following equation:
M P I t t + 1   =   [ D 0   t ( x 0 t + 1 , y 0 t + 1 ) D 0   t ( x 0 t , y o t ) D 0   t + 1 ( x 0 t + 1 , y 0 t + 1 ) D 0   t + 1 ( x 0 t , y o t ) ] 1 / 2 ,
where M P I t t + 1 is the index between the two time periods t and t + 1: M P I t t + 1 > 1 indicates increased performance, whereas M P I t t + 1 < 1 indicates decreased performance.
The Malmquist Productivity Index can be combined by using technical change (TECHCH) and efficiency change (EFFCH). The equation can be written as follows:
M P I t t + 1 = ( EFFCH ) · ( TECHCH )   =   ( D 0   t + 1 ( x 0 t + 1 , y 0 t + 1 ) D 0   t ( x 0 t , y o t ) ) [ D 0   t ( x 0 t + 1 , y 0 t + 1 ) D 0   t + 1 ( x 0 t + 1 , y o t + 1 ) D 0   t ( x 0 t , y 0 t ) D 0   t + 1 ( x 0 t , y o t ) ] 1 / 2
Efficiency change is defined as the “catch-up effect relating to the degree to which a DMU improves or worsens its efficiency.” Efficiency change >1 indicates progress in relative efficiency from period to 1, whereas efficiency change =1 and efficiency <1 indicate no change and regress in efficiency, respectively. Technical change is defined as the “frontier-shift effect reflecting the change in the efficient frontiers between the two time periods.” Technical change >1 stands for technical progress, and technical change <1 shows technical regress. Total productivity change is used to estimate changes in the overall productivity of each DMU over time measured by the Malmquist Productivity Index (MPI). MPI >1 indicates a productivity increase, MPI = 1 indicates productivity does not change, and MPI <1 means that productivity decreases. The major cause of productivity improvement can be ascertained by comparing the values of the efficiency change and technological change indexes. Put differently, the productivity losses described can be the result of either efficiency declines or technical regresses, or both.

3. Empirical Results

3.1. Data Collection

According to data obtained from the Enerdata Yearbook 2018 [29], there are 26 countries that have CO2 emissions higher than 200 metric tons (MT) in the year 2017. Those countries were Australia, Brazil, Canada, China, Egypt, France, Germany, India, Indonesia, Iran, Italy, Japan, Kazakhstan, Malaysia, Mexico, Poland, Russia, Saudi Arabia, South Africa, South Korea, Spain, Taiwan, Thailand, Turkey, United Kingdom, and United States. However, due to the data access limitation for Taiwan figures, this study selected 25 out of the 26 countries as the research sample. Based on the related literature review, three inputs (labor, capital, total energy consumption) and two outputs (GDP and emissions) were usually employed.
In this study, defined energy efficiency refers to using economic and energy resources to promote the growth of GDP while reducing greenhouse gas emissions [24]. Therefore, an economic indicator such as labor force and capital stock together with energy input-energy consumption were selected as inputs, while GDP and greenhouse gas emissions were selected as desirable output and undesirable output, respectively. Since data regarding capital stock cannot be found directly in any one source, we used data regarding gross capital formation (constant 2010 US$) to represent the indicator for capital. In addition, among several kinds of emissions, CO2 is currently capturing the most attention. Thus, CO2 emissions were chosen as the representative of bad output in this study.
Data for this research were collected for the eight-year period from 2010 to 2017. Data regarding gross capital formation and labor force, as well as GDP values, were provided by The World Bank’s data [30], while data regarding energy consumption and CO2 emissions were gathered from the Enerdata Yearbook 2018 [29]. A summary of inputs and outputs is presented in Table 1 regarding the maximum value, minimum value, average, and standard deviation of each indicator.
As the data in Table 1 show, the mean GDP of all 25 sample countries saw an increasing trend during 2010–2014, then witnessed a drop from 2551.50 billion US$ in 2014 to 2436.61 billion US$ in 2015 and a recovery in the two consecutive years 2016 and 2017. Among these 25 countries, the United States had the highest GDP, followed by China, whereas Kazakhstan showed the lowest GDP amount. Mean CO2 emissions experienced an increase during 2010–2017, except the minor 0.2% decrease in 2015. China, the United States, and India were the top three emitting countries, whereas Egypt was the country that emitted the lowest amount of CO2 emissions. China, India, and the United States were also the three largest countries in terms of energy consumption and labor force. During 2010–2017, these 25 countries witnessed an increase in energy consumption, in the number of workers in the labor force and in gross capital.

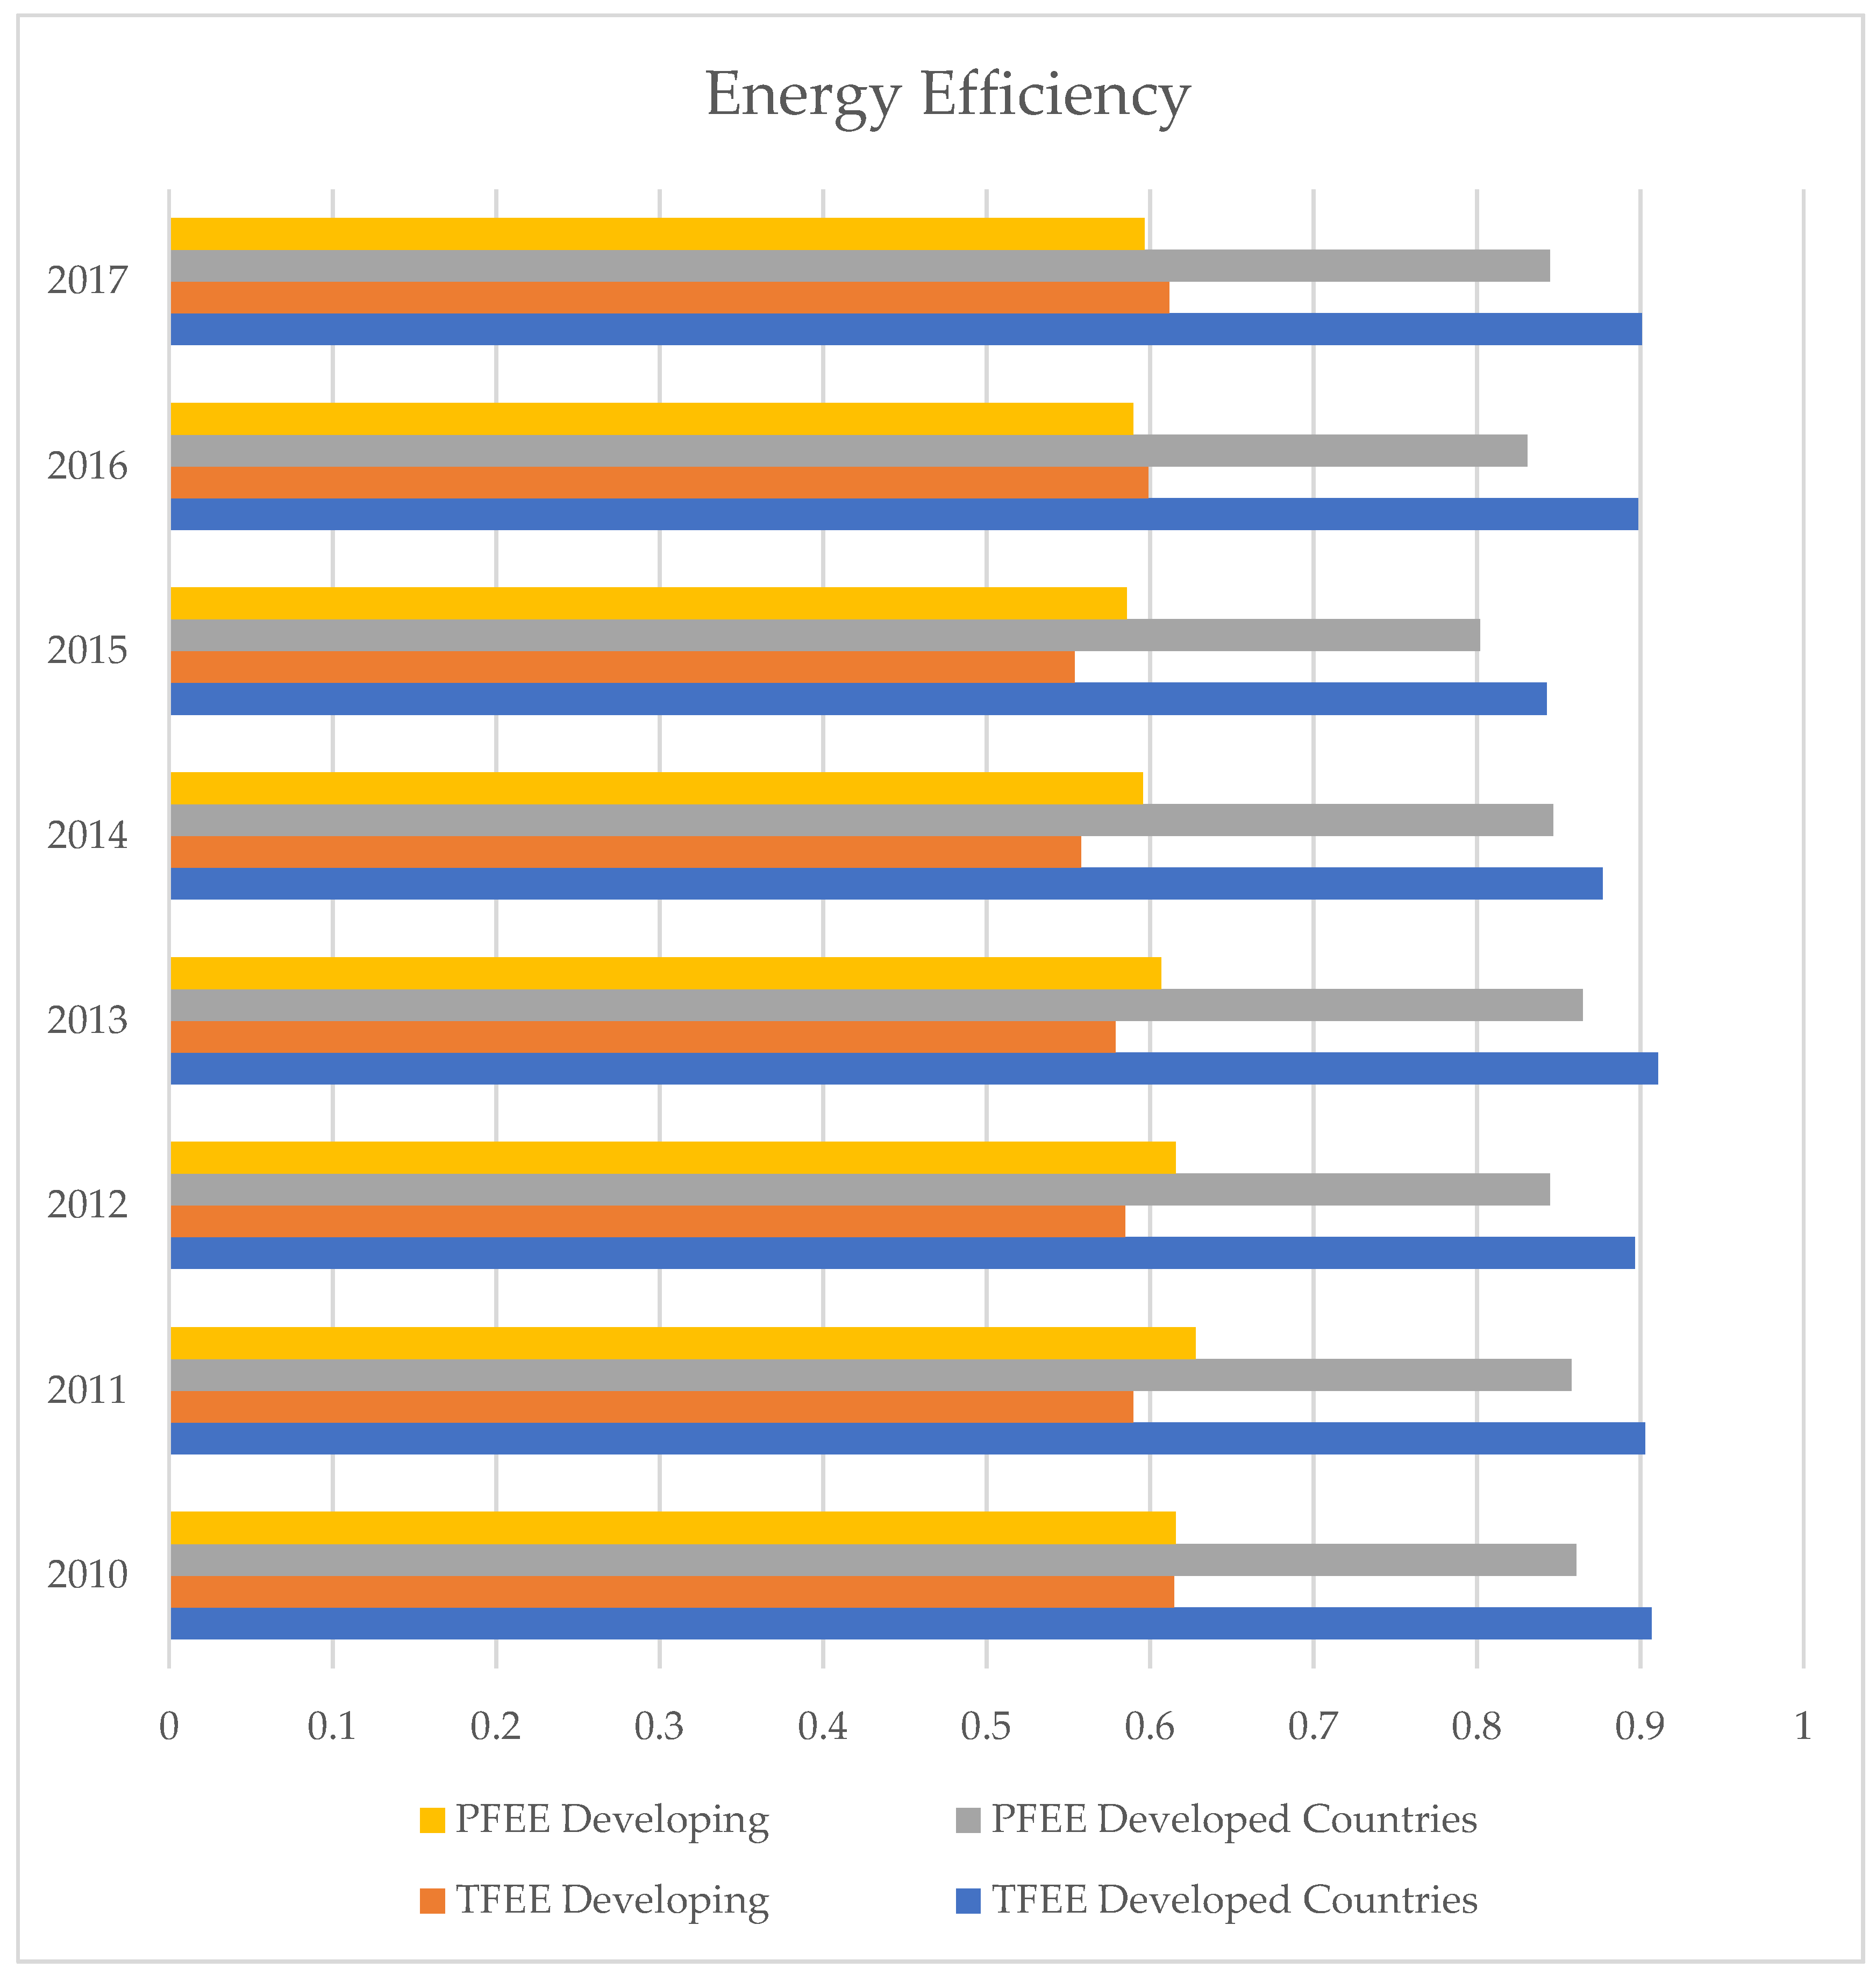
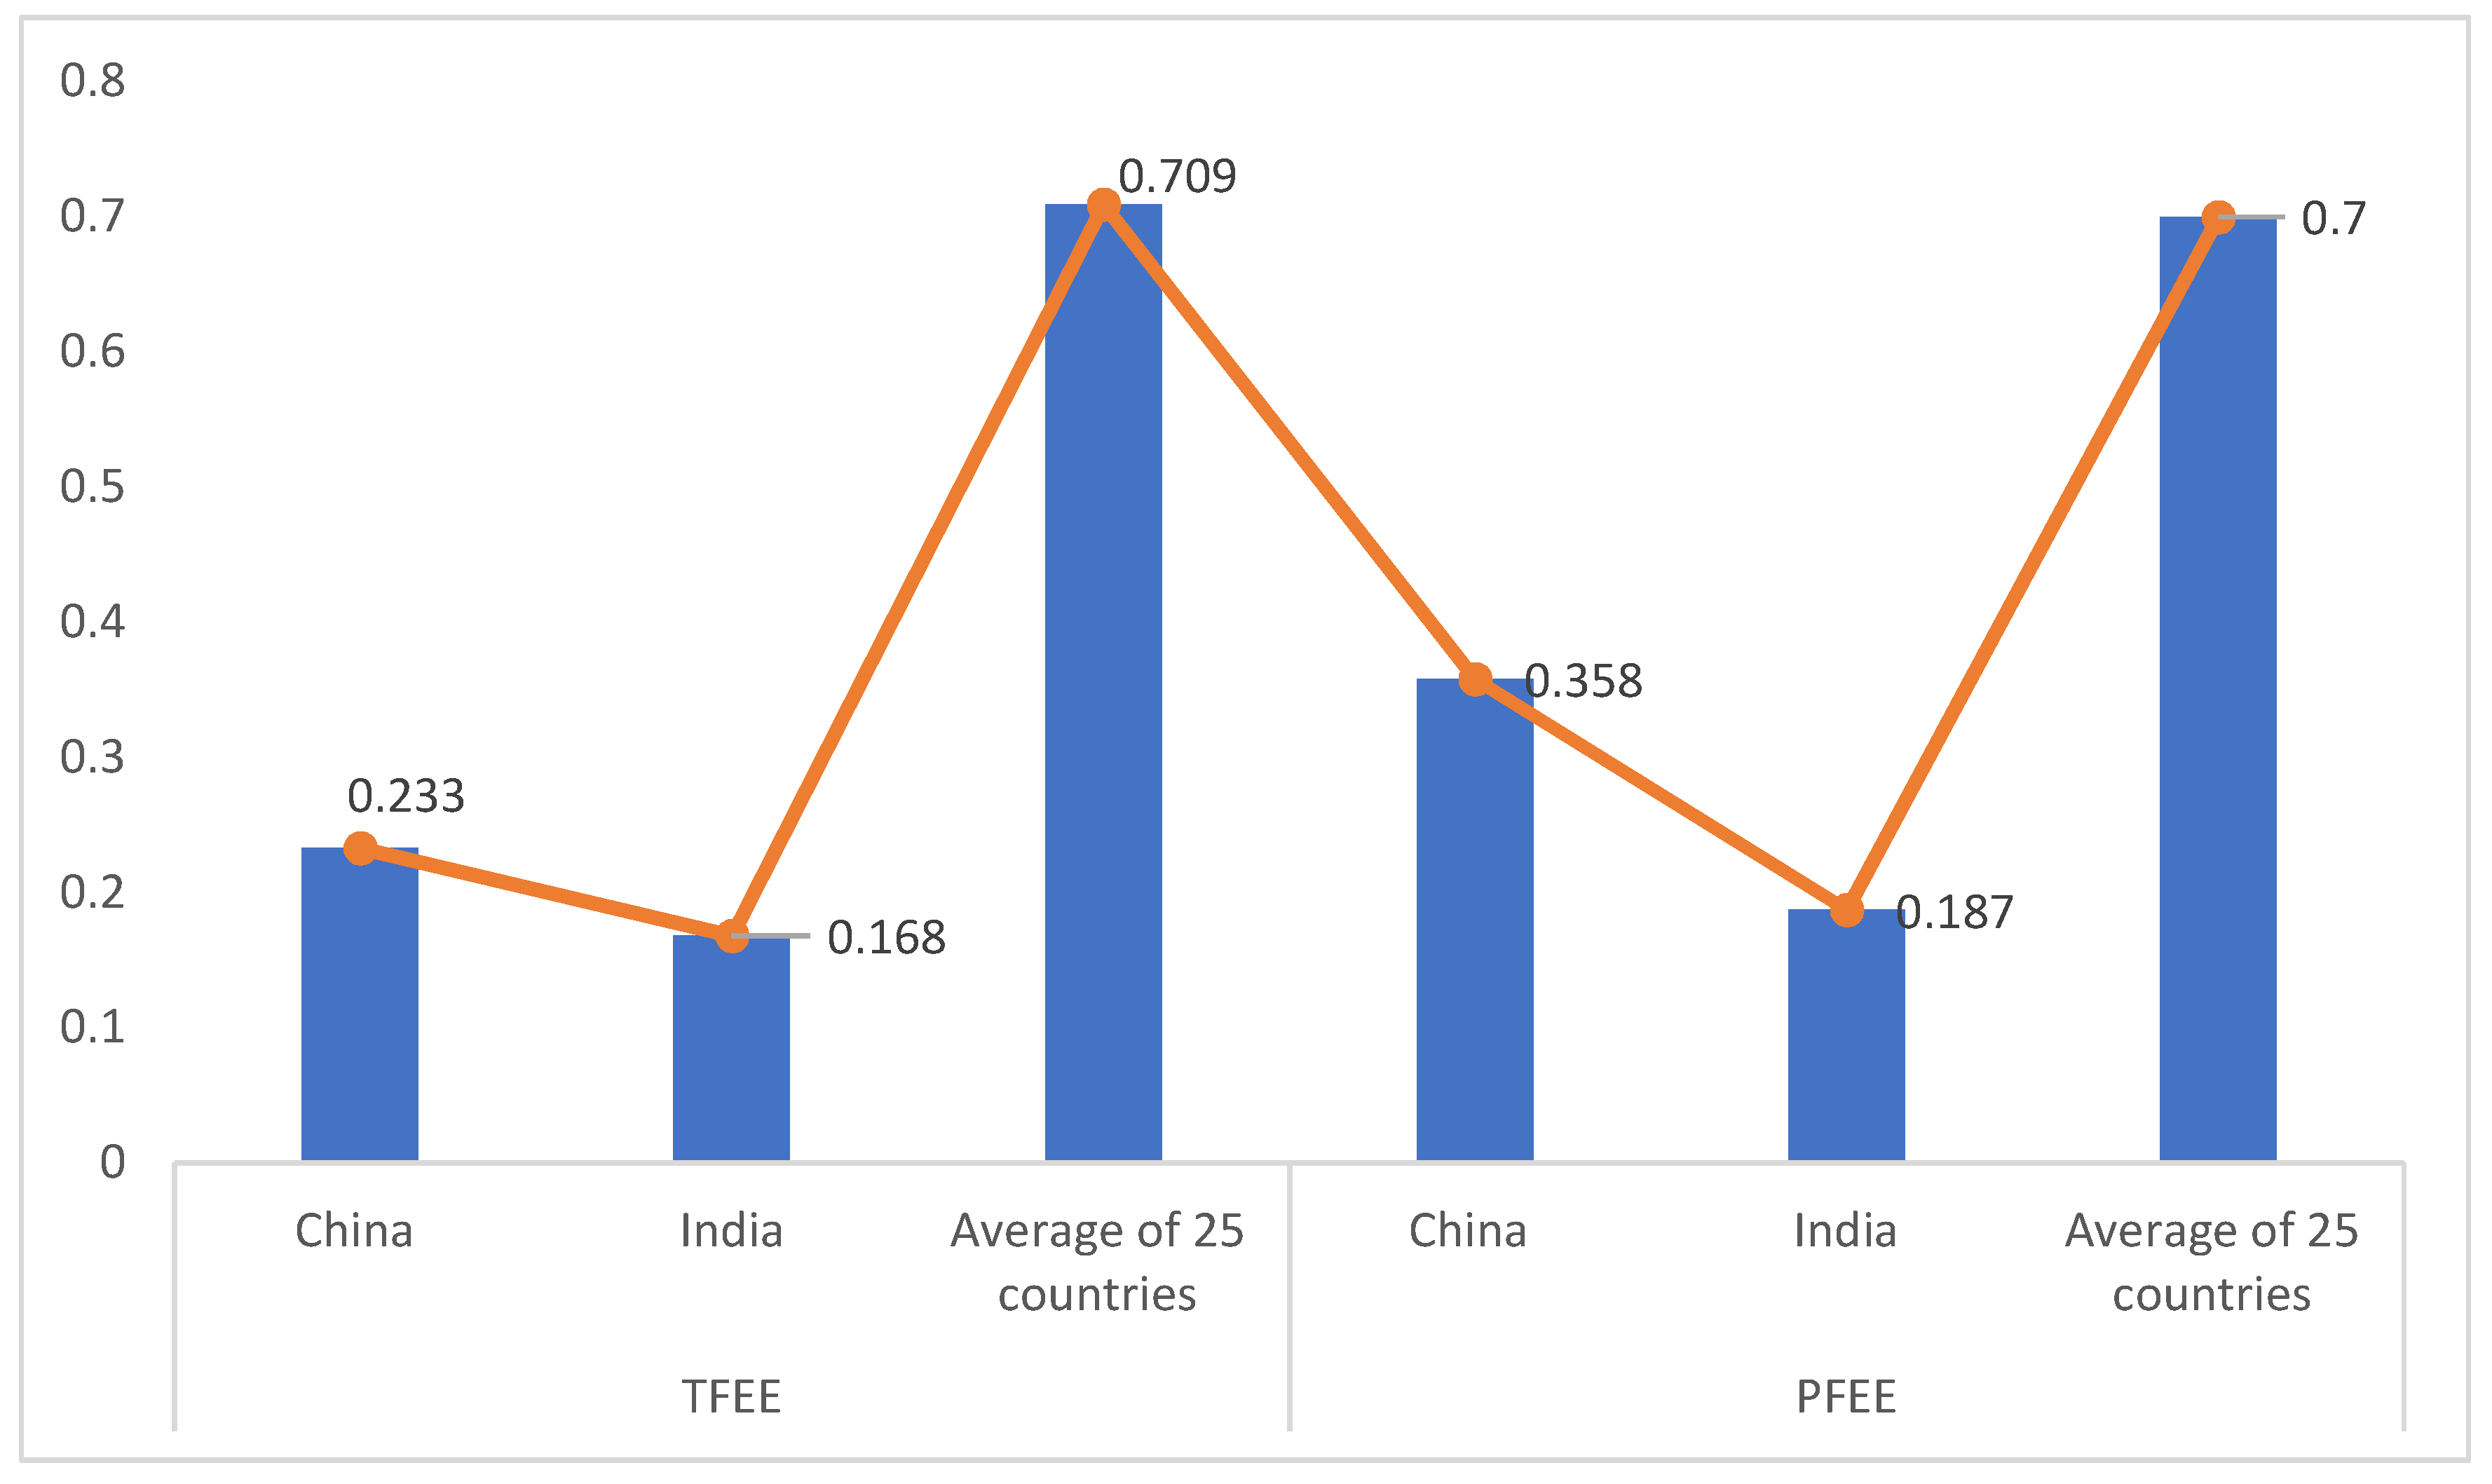
3.2. Energy Efficiency

In this study, DEA-Solver-Pro (software version 13 was used to measure energy efficiency. To deal with the undesirable output, a DEA SBM was applied. According to Hu and Wang [27], the traditional energy efficiency index only considers the energy consumption with respect to producing economic output. However, energy alone cannot produce economic output. Thus, when evaluating energy efficiency, energy should be put together with other inputs in order to produce a desired output [27]. Additionally, consuming energy also emits greenhouse gas emissions, an undesirable output. Therefore, the bad output should be also included. To gain an insight into the different results between TFEE and PFEE, two separate measures were carried out in this study. The results for TFEE and PFEE are presented in detail in Table 2 and Table 3, respectively.
Table 2 presents the energy efficiency obtained by using the multiple inputs to produce GDP and emit CO2 emissions. The results show that six countries were efficient in terms of energy over the period of 2010–2017 as the corresponding efficiency scores are “1”. This indicates that these six countries show a more balanced development between GDP growth and CO2 emissions by using the input resources more effectively than the others. It was observed that most developing countries showed a poorer performance than that of developed countries. We, therefore, divided the sample observation into two groups based on the Human Development Index (HDI) in the year 2017. We defined countries with an HDI larger than 0.89 as developed countries. These included 10 countries: Australia, Canada, France, Germany, Italy, Japan, South Korea, Spain, United Kingdom, and the United States. The developing countries included 14 countries: Brazil, China, Egypt, India, Indonesia, Iran, Kazakhstan, Malaysia, Mexico, Poland, Saudi Arabia, South Africa, Thailand, and Turkey. As mentioned above, there were six efficient countries, of which four were developed countries (Australia, Spain, the United Kingdom, and the United States) and two were developing countries (Egypt and Kazakhstan).
The average efficiency score of these 25 countries witnessed a fluctuating but decreasing trend, where the average score decreased from 0.732 in 2010 to the bottom at 0.669 in 2015 and then continually recovered to 0.719 and 0.728 in the two consecutive years 2016 and 2017, respectively. Moreover, the average efficiency score of developed countries experienced a drop from 0.907 in 2010 to 0.901 in 2017, except for the increase to 0.911 in 2013. Although there was a decreasing trend, the mean efficiency score of developed countries during 2010–2017 was quite stable. The same can be said for developing countries with the continual fall of the efficiency score from 0.615 in 2010 to 0.612 in 2017; however, the decline was insignificant. In addition, it was observed that the lowest efficiency score was in 2015 for both developed and developing countries. The reason for this was probably the faster increase in the amount of CO2 emissions in that year than other years, while the share of GDP was decreased. However, the results in Table 3 prove this phenomenon was mainly caused by the decrease in GDP because the average efficiency score reached its lowest point despite the absence of a bad output.
Furthermore, being the largest country in terms of emitting CO2, China saw the second smallest energy efficiency score, 0.233, whereas India—the third largest CO2 emitter— was the country having the poorest performance with an average score of 0.168.
Table 3 demonstrates that by taking only energy as the input to produce GDP, there are two efficient countries and both of them are from the developed group (the United Kingdom and the United States) Initially, it was expected that without considering other inputs and undesirable outputs, the efficiency score would on average be higher and the number of efficient DMU would be greater. However, the results in Table 2 and Table 3 are the opposite of the initial expectation. The results imply the effective utility of joining economic and energy resources to grow GDP and reduce CO2 emissions.
Additionally, the average efficiency score of both developed and developing countries saw a decline during 2010–2017, which is consistent with the results in Table 2. This implies that the decrease in energy efficiency of these 25 countries is largely due to the slower growth of GDP in later years in comparison to previous years. Moreover, a big gap in efficiency score between the developed and developing group can be seen, which implies that the sample developed countries had a better performance in terms of energy efficiency than the developing ones.
Moreover, Table 3 indicates that in terms of using only energy as an input to produce GDP, India is the country having the poorest performance, followed by Russia and China. China and India together account for about 36% of the global population and more than 25% of the world demand for primary energy as well as one-third of the world’s CO2 emissions [31]. Although these two countries witnessed a better development of their GDP year over year during 2010–2017, their energy consumption and CO2 emissions continued to grow, leading them to being the two worst countries in terms of energy efficiency. The average energy efficiency of developed and developing countries is presented in Figure 1, while Figure 2 illustrates the performance of China and India vs. the average of the 25 countries in terms of TFEE and PFEE.
The findings of this study are similar to the results obtained by Liu and Liu [24], measuring the energy efficiency of the top 20 CO2 emitting countries. The results of our study are also supported by the study of Wang. [21], which evaluated the energy efficiency of 17 countries during 2010–2015, and the study of Zhou [19], which measured the energy efficiency of APEC countries.

3.3. Energy Efficiency Improvement

Comparing efficiency levels between different time periods gives researchers a better view of the change in efficiency over time, which enables them to assess how these changes influence efficiency and can help partly in predicting the fluctuations of future performance [20]. To do this, we applied the Malmquist Productivity Index in our study, which helps to calculate the change in aggregate productivity over time. In this study, we examined the change in three groups: efficiency change (EFFCH), technical change (TECHCH) and total productivity change (MPI). In this study, DEA-Solver-Pro software was employed to calculate the Malmquist Input-oriented Variable return to scale (I-V) model. Results obtained for both cases considering and without considering CO2 emissions are presented in Table 4.
With economic inputs and undesirable outputs, the Malmquist Productivity Index result showed that the average efficiency change of all 25 countries was 1.056, indicating a 5.6% increase in efficiency. However, the average technical change decreased by 5.6%. The improvement in efficiency and the technical regress resulted in a 1.3% loss in total productivity. This result also revealed that, generally, efficiency change had more impact than the technical change in terms of contribution to total productivity improvement. Results obtained showed an opposite change with developed countries compared to the developing countries group. Most of the developed countries experienced a decline of efficiency with the average change of 10 countries lower than 1; consequently, the average efficiency decreased 2.2%, whereas the group of developing countries had an average score higher than 1–1.108, representing a 10.8% improvement in terms of efficiency. The average technical change of the developed countries was 1.002, indicating an insignificant 0.2% improvement in efficiency. In contrast, the average technical change of the developing countries was equal to 0.906, implying a drop of 9.4%. As a result, the average total productivity change of both developed and developing countries witnessed a minor loss of 2.1% and 0.7%, respectively.
Furthermore, the results of individual countries indicated that there were countries showing energy efficiency improvements such as Germany, South Korea, India, Brazil, Indonesia, Iran, Russia, Saudi Arabia, and Thailand. In conclusion, although there were some countries witnessing an improvement in terms of energy efficiency, the growth was insignificant.
Regarding particular-factor energy efficiency, the average efficiency change score and the technical change score for all 25 countries were 0.993 and 1.018, respectively. Values of 0.07% lower in efficiency and 1.8% higher in technical efficiency led to a 1.2% increase in total productivity. The measurement of developed countries indicated the decrease in efficiency change and the growth of technical efficiency. The opposite results were observed for the developing countries, which showed progress in terms of efficiency but a decrease in technical change. Total productivity of the developed countries increased by 5.4% and that of developing countries decreased by 1.5%.
Moreover, the Malmquist results showed a 1.2% progress regarding energy efficiency improvement. Most of the developed countries (except Canada, Japan, and Spain) experienced energy improvement. In contrast, the results of developing countries indicated that only two countries had efficiency progress, namely, China and India. India experienced an improvement in both TFEE and PFEE, which implied that India achieved a better balance between GDP growth and CO2 emission reduction during 2010–2017. On the other hand, China witnessed the rapid 113.8% improvement only in PTEE, indicating that China performed well in terms of using energy to promote the growth of GDP. However; using a large amount of energy also costs that country a huge quantity of greenhouse gas emissions, which significantly affects the TFEE.

4. Discussion and Conclusions

This study employs a DEA SBM and the Malmquist Productivity Index to assess the energy and environment efficiency as well as energy efficiency improvement of the top 25 countries on the list of countries having CO2 emissions during 2010–2017. To measure energy and environment efficiency, we used a joint production framework of both non-energy inputs (gross capital formation, labor force) and energy input (energy consumption) to promote a desirable output (GDP) and reduce an output (CO2 emissions). We first obtained energy and environment efficiency results by applying the DEA SBM in two separate cases: (1) considering undesirable outputs and (2) without considering undesirable output; and then, the comparison is made. Second, the Malmquist Productivity Index was used to measure the change in efficiency over the period of 2010–2017.
Results obtained using the SBM for total-factor energy efficiency and particular-factor energy efficiency confirmed that by using the same input resources, developed countries were more effective in promoting GDP growth and reducing CO2 emissions than developing countries. The results of this step also indicated that the performance of the top 25 CO2 emitters showed a decrease caused by GDP slowdown during 2010–2017. Additionally, the big gap in energy efficiency between the developed and developing groups can be seen in both TFEE and PFEE. This means that the developing group was less efficient than the developed one, not only in terms of using energy to promote the growth of GDP but also with respect to joining multiple economic and energy inputs to elevate GDP and reduce CO2 emissions.
Results of the Malmquist Productivity Index for TFEE denote that, as a general observation, the 25 sample countries showed no evidential energy enhancement which was proved by the MPI score lower than 1 during 2010–2017. However, Germany, South Korea, India, Brazil, Indonesia, Iran, Russia, Sau Arabia, and Thailand witnessed an improvement in terms of energy efficiency, but the growth was insignificant. On the contrary, the Malmquist result for PFEE confirms efficiency improvement in most developed countries and two developing countries (China and India).
Furthermore, our findings revealed that while India experienced a better balance between GDP growth and CO2 emission reduction during 2010–2017, China only witnessed the rapid growth of GDP by consuming a lot of energy; however; using a huge amount of energy also cost that country the very low efficiency score. caused mainly by the massive amount of CO2 emissions.
Our findings provide important policy implications. By measuring the efficiency with and without undesirable output, the results of our study reveal the downward trend of the efficiency score, caused mostly by the slowdown of GDP in the majority of these 25 countries during 2010–2017, which implies that these countries should pay more attention to effectively utilizing economic and energy inputs in order to promote GDP growth. Moreover, lower efficiency scores of the developing countries, especially China, India, Iran, Indonesia, and Russia, denote that more efforts should be made by these countries to improve energy efficiency. One of the solutions to enhance energy efficiency is attempting to not increase input resources in order to maintain economic growth [6]. In addition, a carbon tax has a significant influence on energy efficiency [17]. Therefore, applying a carbon tax is one of the key solutions to achieve energy efficiency targets. Moreover, one aspect of energy efficiency is to reduce the use of fossil fuels; therefore; renewable energy resources are very important. These countries should reconsider their energy resources and policies. Furthermore, the findings of this research illustrated that developed countries, in general, showed better energy efficiency than developing countries. Therefore, sharing and transferring the experience, knowledge, and technology from efficient countries to inefficiency ones should be considered as one of the solutions.
As mentioned above, the gap in energy efficiency between developed countries and developing countries is notable. This gap is probably caused by the inputs and outputs used or is perhaps affected by external environmental factors. Therefore, it is one of the limitations of this study and future research should examine if energy efficiency is affected by external factors. Moreover, findings of this study found a difference between TFEE and PFEE; however, this difference has not been tested for robustness. Therefore, it is suggested that future research should seriously include a sensitivity analysis in order to determine the robustness of the efficiency score.

Author Contributions

Lai-Wang Wang contributed to designing the research and analysis tools; Ke-Duc Le collected the data and wrote the paper; Thi-Duong Nguyen checked and revised the paper. All authors read and approved the final manuscript.

Funding

This research received no external funding.

Acknowledgments

We, the authors are very grateful to the Editors and reviewers for their interest in our manuscript. The authors highly appreciate the constructive comments and suggestion given by the Editors and reviewers on the earlier version of this manuscript.

Conflicts of Interest

The authors declare no conflict of interest.

Abbreviations

The following abbreviations are used in this manuscript:
DEA Data envelopment analysis
DMUs Decision-making units
SBM Slack-based model
CO2
GDP
Carbon dioxide
Gross domestic product
NOXDinitrogen monoxide
SO2Sulfur dioxide
APECAsia-Pacific Economic Cooperation
TFEETotal-factor energy efficiency
PFEEParticular-factor energy efficiency
EFFCHEfficiency change
TECHCHTechnical change
MPITotal productivity change (Malmquist Productivity Index)

References

  1. International Energy Agency, Energy Efficiency 2018: Analysis and outlook to 2040, OECD/IEA, 2018. Available online: https://webstore.iea.org/download/direct/2369?fileName=Market_Report_Series_Energy_Efficiency_2018.pdf (accessed on 18 August 2018).
  2. U.S. Energy Information Administration. Available online: https://www.eia.gov/todayinenergy/detail.php?id=26212 (accessed on 18 August 2018).
  3. Cucchiella, F.; D’Adamo, I.; Gastaldi, M.; Miliacca, M. Efficiency, and allocation of emission allowances and energy consumption over more sustainable European economies. J. Clean. Prod. 2018, 182, 805–817. [Google Scholar] [CrossRef]
  4. Borozan, D. Technical and total factor energy efficiency of European regions: a two-stage approach. Energy 2018, 152, 521–532. [Google Scholar] [CrossRef]
  5. Mardani, A. Data Envelopment Analysis in Energy and Environmental Economics: An Overview of the State-of-the-Art and Recent Development Trends. Energies 2018, 11, 2002. [Google Scholar] [CrossRef]
  6. Hu, J.L.; Kao, C.H. Efficient energy-saving targets for APEC economies. Energy Policy 2007, 35, 373–382. [Google Scholar] [CrossRef]
  7. Yeh, T.L.; Chen, T.Y.; Lai, P.Y. A comparative study of energy utilization efficiency between Taiwan and China. Energy Policy 2010, 38, 2386–2394. [Google Scholar] [CrossRef]
  8. Wang, K.; Wei, Y.M.; Zhang, S. A comparative analysis of China’s regional energy and emission performance: Which is the better way to deal with undesirable outputs. Energy Policy 2012, 46, 574–584. [Google Scholar] [CrossRef]
  9. Bian, Y.; He, P.; Xu, H. Estimation of potential energy saving and carbon dioxide emission reduction in China based on an extended non-radial DEA approach. Energy Policy 2013, 63, 962–971. [Google Scholar] [CrossRef]
  10. Hong, L.; Fang, K.N.; Yang, W.; Wang, D.; Hong, X.X. Regional environmental efficiency evaluation in China: Analysis based on the Super-SBM model with undesirable outputs. Math. Comput. Model. 2013, 58, 1018–1031. [Google Scholar]
  11. Wang, K.; Yu, S.W.; Zhang, W. China’s regional energy and environmental efficiency: A DEA window analysis based dynamic evaluation. Math. Comput. Model. 2013, 58, 1117–1127. [Google Scholar] [CrossRef]
  12. Zhang, N.; Choi, Y.R. Environmental energy efficiency of China’s regional economies: A non-oriented slacks-based measure analysis. Soc. Sci. J. 2013, 50, 225–234. [Google Scholar] [CrossRef]
  13. Song, M.; Yang, L.; Wu, J. Energy saving in China: Analysis on the energy efficiency via bootstrap-DEA approach. Energy Policy 2013, 57, 1–6. [Google Scholar] [CrossRef]
  14. Wang, K.; Wei, Y.M. China’s regional industrial energy efficiency and carbon emissions abatement costs. Energy 2014, 130, 617–631. [Google Scholar] [CrossRef]
  15. Lin, B.; Du, K. Energy and CO2 emissions performance in China’s regional economies: Do market-oriented reforms matter? Energy Policy 2015, 78, 113–124. [Google Scholar] [CrossRef]
  16. Rui, Z.F.; Zhong, Q.D.; Jin, L.H. Clean energy use and total-factor efficiencies: An international comparison. Renew. Sustain. Energy Rev. 2015, 52, 1158–1171. [Google Scholar]
  17. Yaser, I.; He, W.Z.; Wang, Z.H. Energy and CO2 emissions efficiency of major economies: A nonparametric analysis. J. Clean. Prod. 2016, 139, 779–787. [Google Scholar]
  18. Tone, K. A slacks-based measure of efficiency in data envelopment analysis. Eur. J. Oper. Res. 2001, 130, 498–509. [Google Scholar] [CrossRef] [Green Version]
  19. Zhou, D.Q.; Meng, F.Y.; Bai, Y.; Cai, S.Q. Energy efficiency and congestion assessment with energy mix effect: The case of APEC countries. J. Clean. Prod. 2017, 142, 819–828. [Google Scholar] [CrossRef]
  20. Chen, L.; Jia, G. Environmental efficiency analysis of China’s regional industry: A data envelopment analysis (DEA) based approach. J. Clean. Prod. 2017, 142, 846–853. [Google Scholar] [CrossRef]
  21. Wang, C.N.; Ho, T.H.X.; Hsueh, M.H. An Integrated Approach for Estimating the Energy Efficiency of Seventeen Countries. Energies 2017, 10, 1597. [Google Scholar] [CrossRef]
  22. Yaser, I.; Wang, Z.H.; Zhang, B.; Wang, B. Energy and CO2 emissions efficiency of major economies: A network DEA approach. Energy 2018, 147, 197–207. [Google Scholar]
  23. Apergis, N.; Aye, G.C.; Barros, C.P.; Gupta, R.; Wanke, P. Energy efficiency of selected OECD countries: A slack based model with undesirable outputs. Energy Econ. 2015, 51, 45–53. [Google Scholar] [CrossRef]
  24. Liu, X.; Liu, J. Measurement of low carbon economy efficiency with a three-stage data envelopment analysis: A comparison of the largest twenty CO2 emitting countries. Int. J. Environ. Res. Public Heal. 2016, 13, 116. [Google Scholar] [CrossRef] [PubMed]
  25. Lenz, N.; Segota, A.; Maradin, D. Total-factor energy efficiency in EU: Dto environmental impacts matter? Int. J. Energy Econ. Policy 2018, 8, 92–96. [Google Scholar]
  26. Tone, K.A. Dealing with undesirable outputs in DEA: a Slacks-Based Measure (SBM) approach. 2003. Available online: https://www.researchgate.net/publication/284047010_Dealing_with_undesirable_outputs_in_DEA_a_Slacks-Based_Measure_SBM_approach (accessed on 18 October 2018).
  27. Hu, J.L.; Wang, S.C. Total-factor energy efficiency of regions in China. Energy Policy 2006, 34, 3206–3217. [Google Scholar] [CrossRef]
  28. Fare, R.; Grosskopf, S.; Norris, M.; Zhang, Z.Y. Productivity Growth, Technical Progress, and Efficiency Changes in Industrialised Countries. Am. Econ. Rev. 1994, 84, 66–83. [Google Scholar]
  29. Enerdata Year Book. Available online: https://yearbook.enerdata.net (accessed on 5 August 2018).
  30. World Bank. Available online: https://data.worldbank.org (accessed on 5 August 2018).
  31. Khailly, K. Approaches to low carbon development in China and India. Adv. Clim. Chang. Res. 2016, 7, 213–221. [Google Scholar]
Figure 1. Average energy efficiency score of developing and developed countries.
Energies 12 01535 g001
Figure 2. Energy efficiency score of China and India vs. the average score of the 25 countries.
Energies 12 01535 g002
Table 1. Summary for the research samples during 2010–2017.
YearVariablesInputsOutputs
Non-EnergyEnergyDesirableUndesirable
Gross Capital Formation (constant 2010 billion US$)Labor Force (Million people)Energy Consumption (Mtoe)GDP (constant 2010 billion US$)CO2 Emissions (Metric Ton)
2010Max2904.64779.962536.5514,964.377711.61
Min37.568.7269.11148.05183.72
Average530.9588.34403.962139.321011.10
SD723.90168.04605.823025.831710.78
2011Max3190.24782.572722.1215,517.938432.95
Min39.598.8176.42192.63190.07
Average562.9688.84411.752373.251044.23
SD770.48168.69630.453207.721813.83
2012Max3432.35784.482819.5116,155.268612.91
Min44.268.8973.85208.00196.44
Average581.3989.45418.762429.411056.96
SD827.61169.22641.833372.711828.20
2013Max3760.89785.752909.7716,691.529026.22
Min40.538.9677.42236.63196.22
Average603.2790.23424.412484.411078.71
SD888.22170.21657.643501.111902.53
2014Max4043.34786.572954.9817,427.619069.56
Min41.229.0576.66221.42199.32
Average628.6090.95430.842551.501086.09
SD944.62171.15669.303688.521918.46
2015Max4297.51787.072975.7118,120.719095.10
Min44.779.1178.09184.39204.81
Average645.5791.64431.232432.611083.54
SD999.91172.01669.473859.931909.47
2016Max4570.85787.053017.3718,624.489085.94
Min49.809.1776.88137.28212.79
Average655.7792.51435.722473.971089.65
SD1036.39172.82676.553968.391906.72
2017Max4794.55786.743104.8719,390.609297.23
Min55.449.2380.18159.41217.88
Average681.3793.07445.312621.801114.00
SD1072.22173.47691.274171.291942.27
Table 2. Total-factor energy efficiency during 2010–2017.
DMU20102011201220132014201520162017Average
Australia1.0001.0001.0001.0001.0001.0001.0001.0001.000
Canada0.7210.6890.6800.6430.6270.6220.6520.6350.659
France1.0001.0001.0001.0001.0001.0001.0001.0001.000
Germany0.8810.8810.8401.0000.9280.7410.8370.8850.874
Italy1.0001.0001.0001.0001.0000.9371.0001.0000.992
Japan1.0001.0001.0001.0000.7480.6441.0001.0000.924
South Korea0.4710.4560.4530.4630.4670.4830.5010.4950.474
Spain1.0001.0001.0001.0001.0001.0001.0001.0001.000
United Kingdom1.0001.0001.0001.0001.0001.0001.0001.0001.000
United States1.0001.0001.0001.0001.0001.0001.0001.0001.000
Developed Countries0.9070.9030.8970.9110.8770.8430.8990.9010.892
Brazil0.6510.6570.5990.5260.4790.4611.0001.0000.672
China0.1780.1990.2210.2470.2550.2590.2480.2560.233
Egypt1.0001.0001.0001.0001.0001.0001.0001.0001.000
India0.1630.1580.1560.1570.1550.1710.1870.2000.168
Indonesia0.3810.3990.3860.3750.3500.3690.3940.3940.381
Iran0.3690.3950.4150.3620.3340.3630.3880.3690.374
Kazakhstan1.0001.0001.0001.0001.0001.0001.0001.0001.000
Malaysia1.0001.0001.0001.0000.9150.8950.8380.8180.933
Mexico0.5230.5000.4970.5040.5050.4970.4810.5100.502
Poland0.7300.7220.7250.7670.7580.7480.7740.7740.750
Russia0.2950.3060.3270.3480.3180.2770.2740.3000.306
Saudi Arabia0.9980.6750.6430.6410.6000.5530.6000.6080.665
South Africa0.5960.5910.5670.5300.5140.5250.5660.6910.573
Thailand0.5780.5790.5570.5540.5780.6100.6670.7590.610
Turkey0.7570.6710.6830.6820.6060.5830.5710.4970.631
Developing0.6150.5900.5850.5790.5580.5540.5990.6120.587
Average0.7320.7150.7100.7120.6860.6690.7190.7280.709
Table 3. Particular-factor energy efficiency during 2010–2017.
DMU20102011201220132014201520162017Average
Australia0.8990.9511.0001.0000.9440.9550.9250.9510.953
Canada0.5270.5240.5360.5190.4710.4730.4750.4730.500
France0.8460.8240.7750.7850.7130.6610.7040.7150.753
Germany0.8930.8480.7910.9240.9290.7530.8180.9030.857
Italy1.0001.0000.9821.0000.9900.9100.9510.9620.974
Japan1.0001.0001.0001.0001.0000.8851.0001.0000.986
South Korea0.4400.4290.4220.4250.4200.4280.4380.4430.431
Spain1.0001.0000.9431.0001.0000.9541.0001.0000.987
United Kingdom1.0001.0001.0001.0001.0001.0001.0001.0001.000
United States1.0001.0001.0001.0001.0001.0001.0001.0001.000
Developed Countries0.8610.8580.8450.8650.8470.8020.8310.8450.844
Brazil0.6810.6970.6450.5960.5180.4610.4940.5240.577
China0.2260.2660.3040.3860.4190.4240.4080.4280.358
Egypt0.9881.0000.9741.0000.9871.0001.0000.9610.989
India0.2060.1990.1900.1820.1710.1760.1820.1870.187
Indonesia0.4590.5000.4830.4660.4390.4440.4640.4640.465
Iran0.4140.4260.4120.3800.3530.3440.3610.3580.381
Kazakhstan1.0000.9881.0000.9501.0001.0001.0001.0000.992
Malaysia0.9961.0000.9940.8900.8920.9160.8920.9160.937
Mexico0.6340.6170.5900.5940.5990.6010.5890.6250.606
Poland0.8370.8550.8720.8790.9240.8920.8920.9000.881
Russia0.1950.2160.2260.2300.1960.1700.1710.1790.198
Saudi Arabia0.4670.5230.4750.4940.4420.4160.4320.4430.461
South Africa0.5620.5760.5860.5780.5560.5580.5720.6220.576
Thailand0.6620.6800.6450.6060.6140.6070.6320.6580.638
Turkey0.9160.8730.8490.8730.8240.7770.7660.6950.822
Developing0.6160.6280.6160.6070.5960.5860.5900.5970.604
Average0.7140.7200.7080.7100.6960.6720.6870.6960.700
Table 4. Energy efficiency improvement during 2010–2017.
DMUTFEEPFEE
EFFCHTECHCHMPIEFFCHTECHCHMPI
Australia1.0310.9931.0241.0580.9971.054
Canada0.9811.010.9910.8981.0450.938
France0.9091.020.9270.8461.2411.049
Germany1.00911.0091.0111.0841.096
Italy0.9871.0120.9990.9301.1261.047
Japan0.9111.0520.9580.7431.1180.830
South Korea0.9851.0181.0021.0061.0061.012
Spain0.9841.0080.9930.9551.0290.983
United Kingdom0.981.0060.9861.2471.1011.372
United States10.9020.9021.0001.1551.155
Developed Countries0.9781.0020.9790.9691.0901.054
Brazil1.7850.7511.340.7701.1270.868
China10.9440.9441.8941.1292.138
Egypt1.0390.760.790.9720.8800.856
India1.2110.9621.1650.9071.1421.035
Indonesia1.0780.9361.0091.0100.9650.974
Iran1.0781.0471.1280.8630.9160.791
Kazakhstan1.0360.8260.8551.0160.8580.872
Malaysia0.8470.8870.7510.9190.8890.818
Mexico0.9720.950.9230.9860.9860.972
Poland0.9890.9010.8911.0740.9210.990
Russia1.090.9511.0370.9161.0310.944
Saudi Arabia1.0981.0011.0990.9490.9340.887
South Africa1.0640.93911.1070.9020.998
Thailand1.4550.7741.1260.9950.9070.902
Turkey0.8730.9590.8380.7580.9580.727
Developing1.1080.9060.9931.0090.9700.985
Average1.0560.9440.9870.9931.0181.012

