Experimental Study on the Fire-Spreading Characteristics and Heat Release Rates of Burning Vehicles Using a Large-Scale Calorimeter


Abstract
:1. Introduction
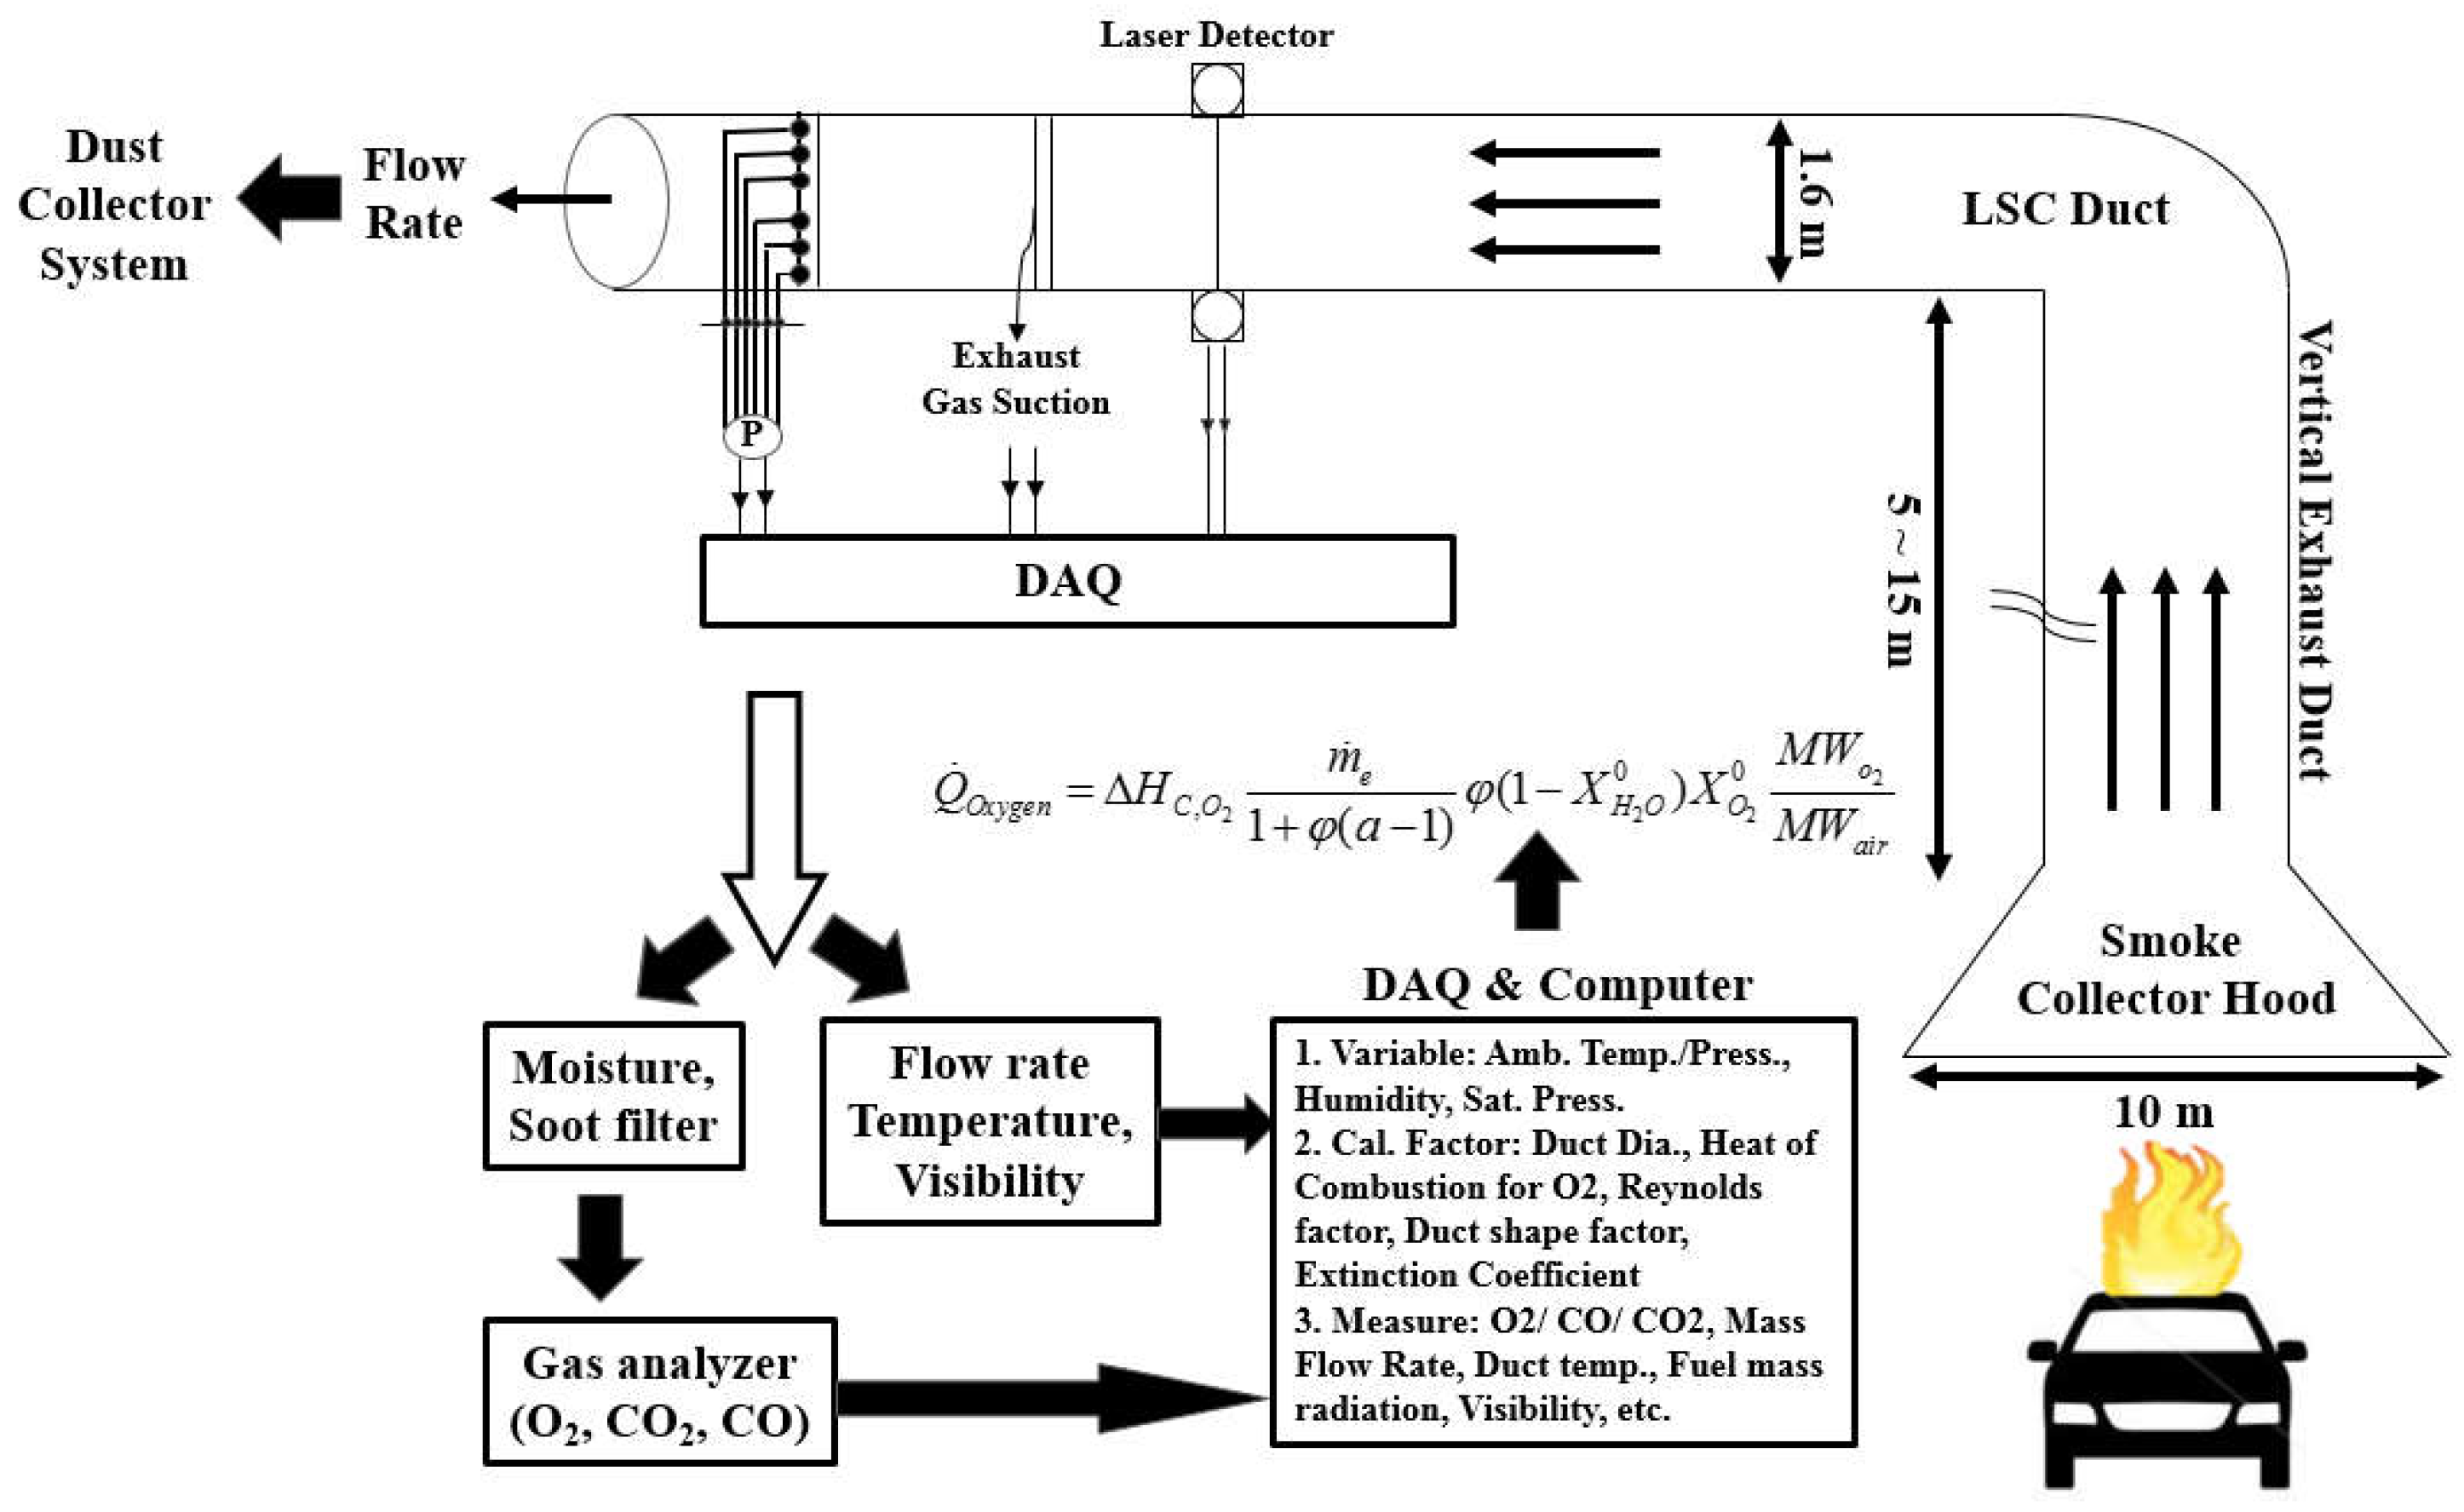
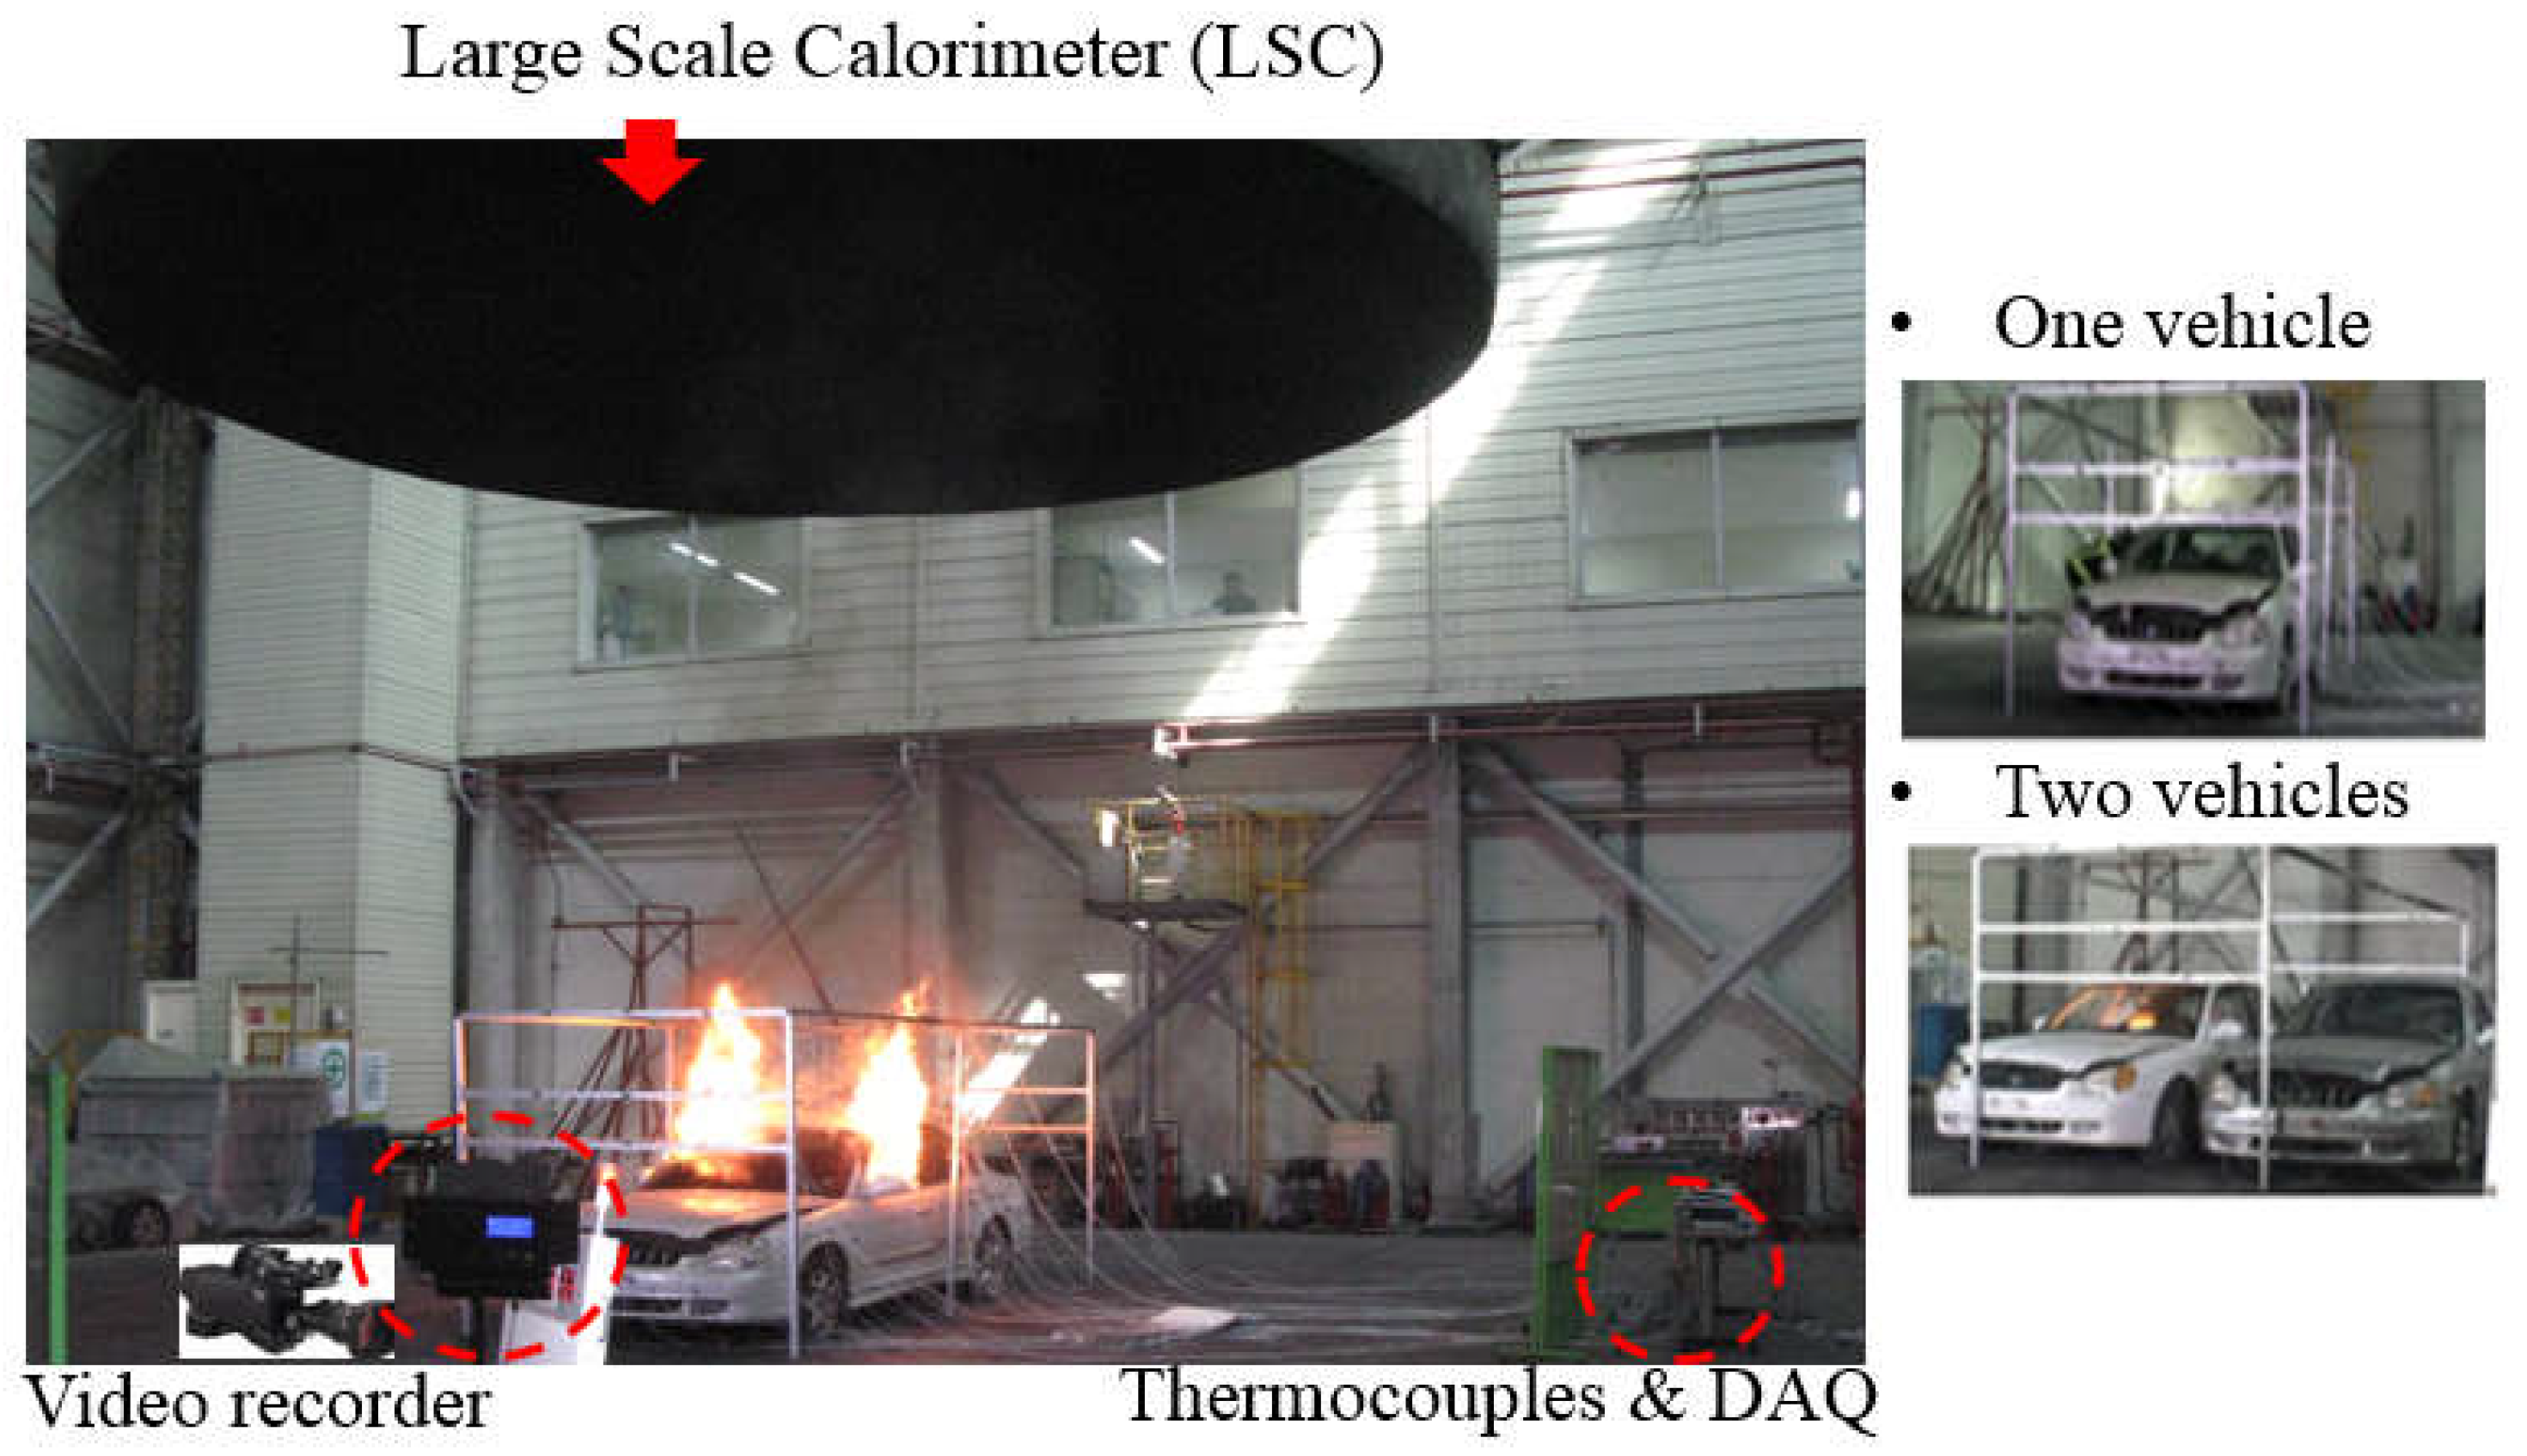
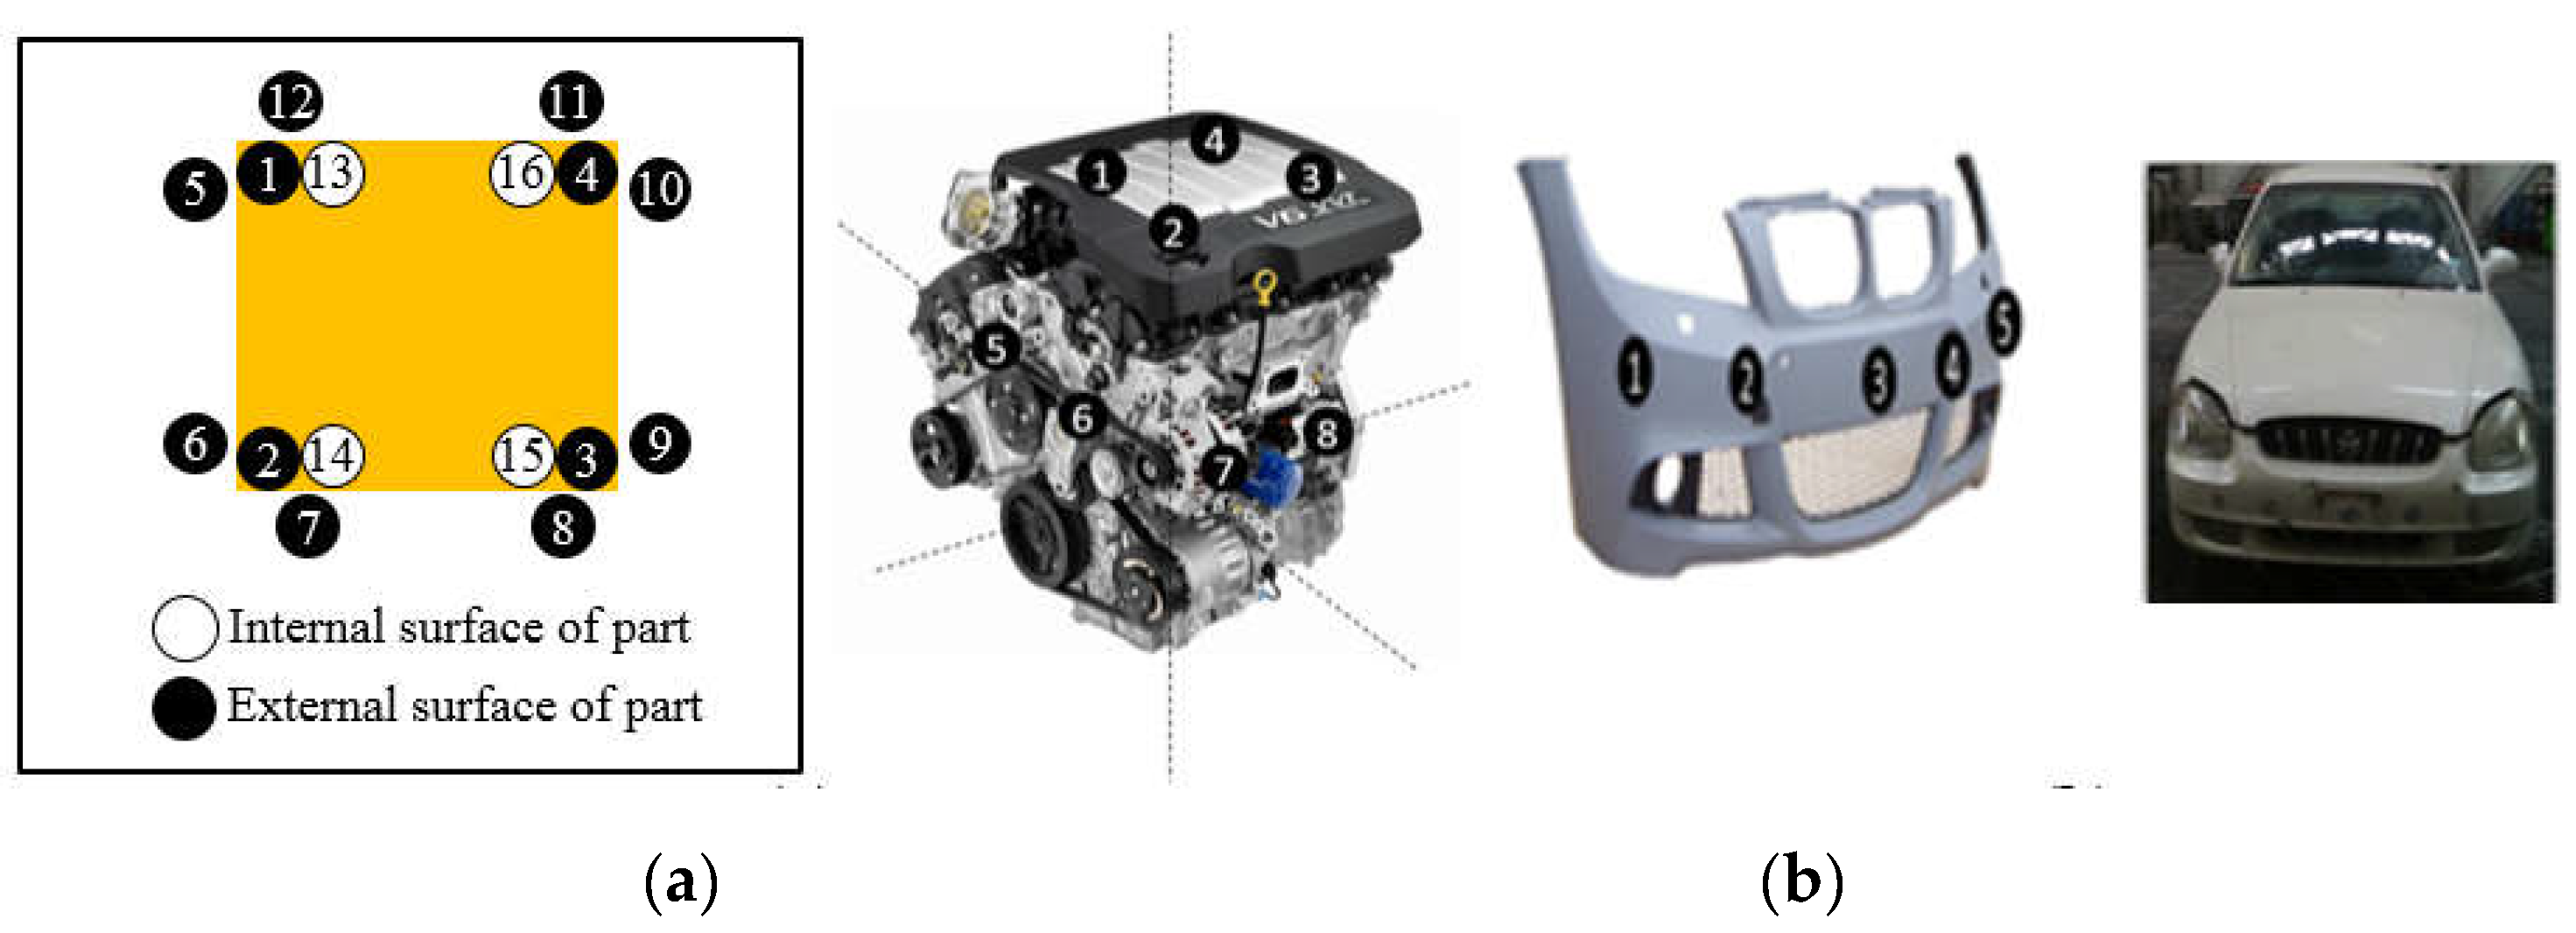
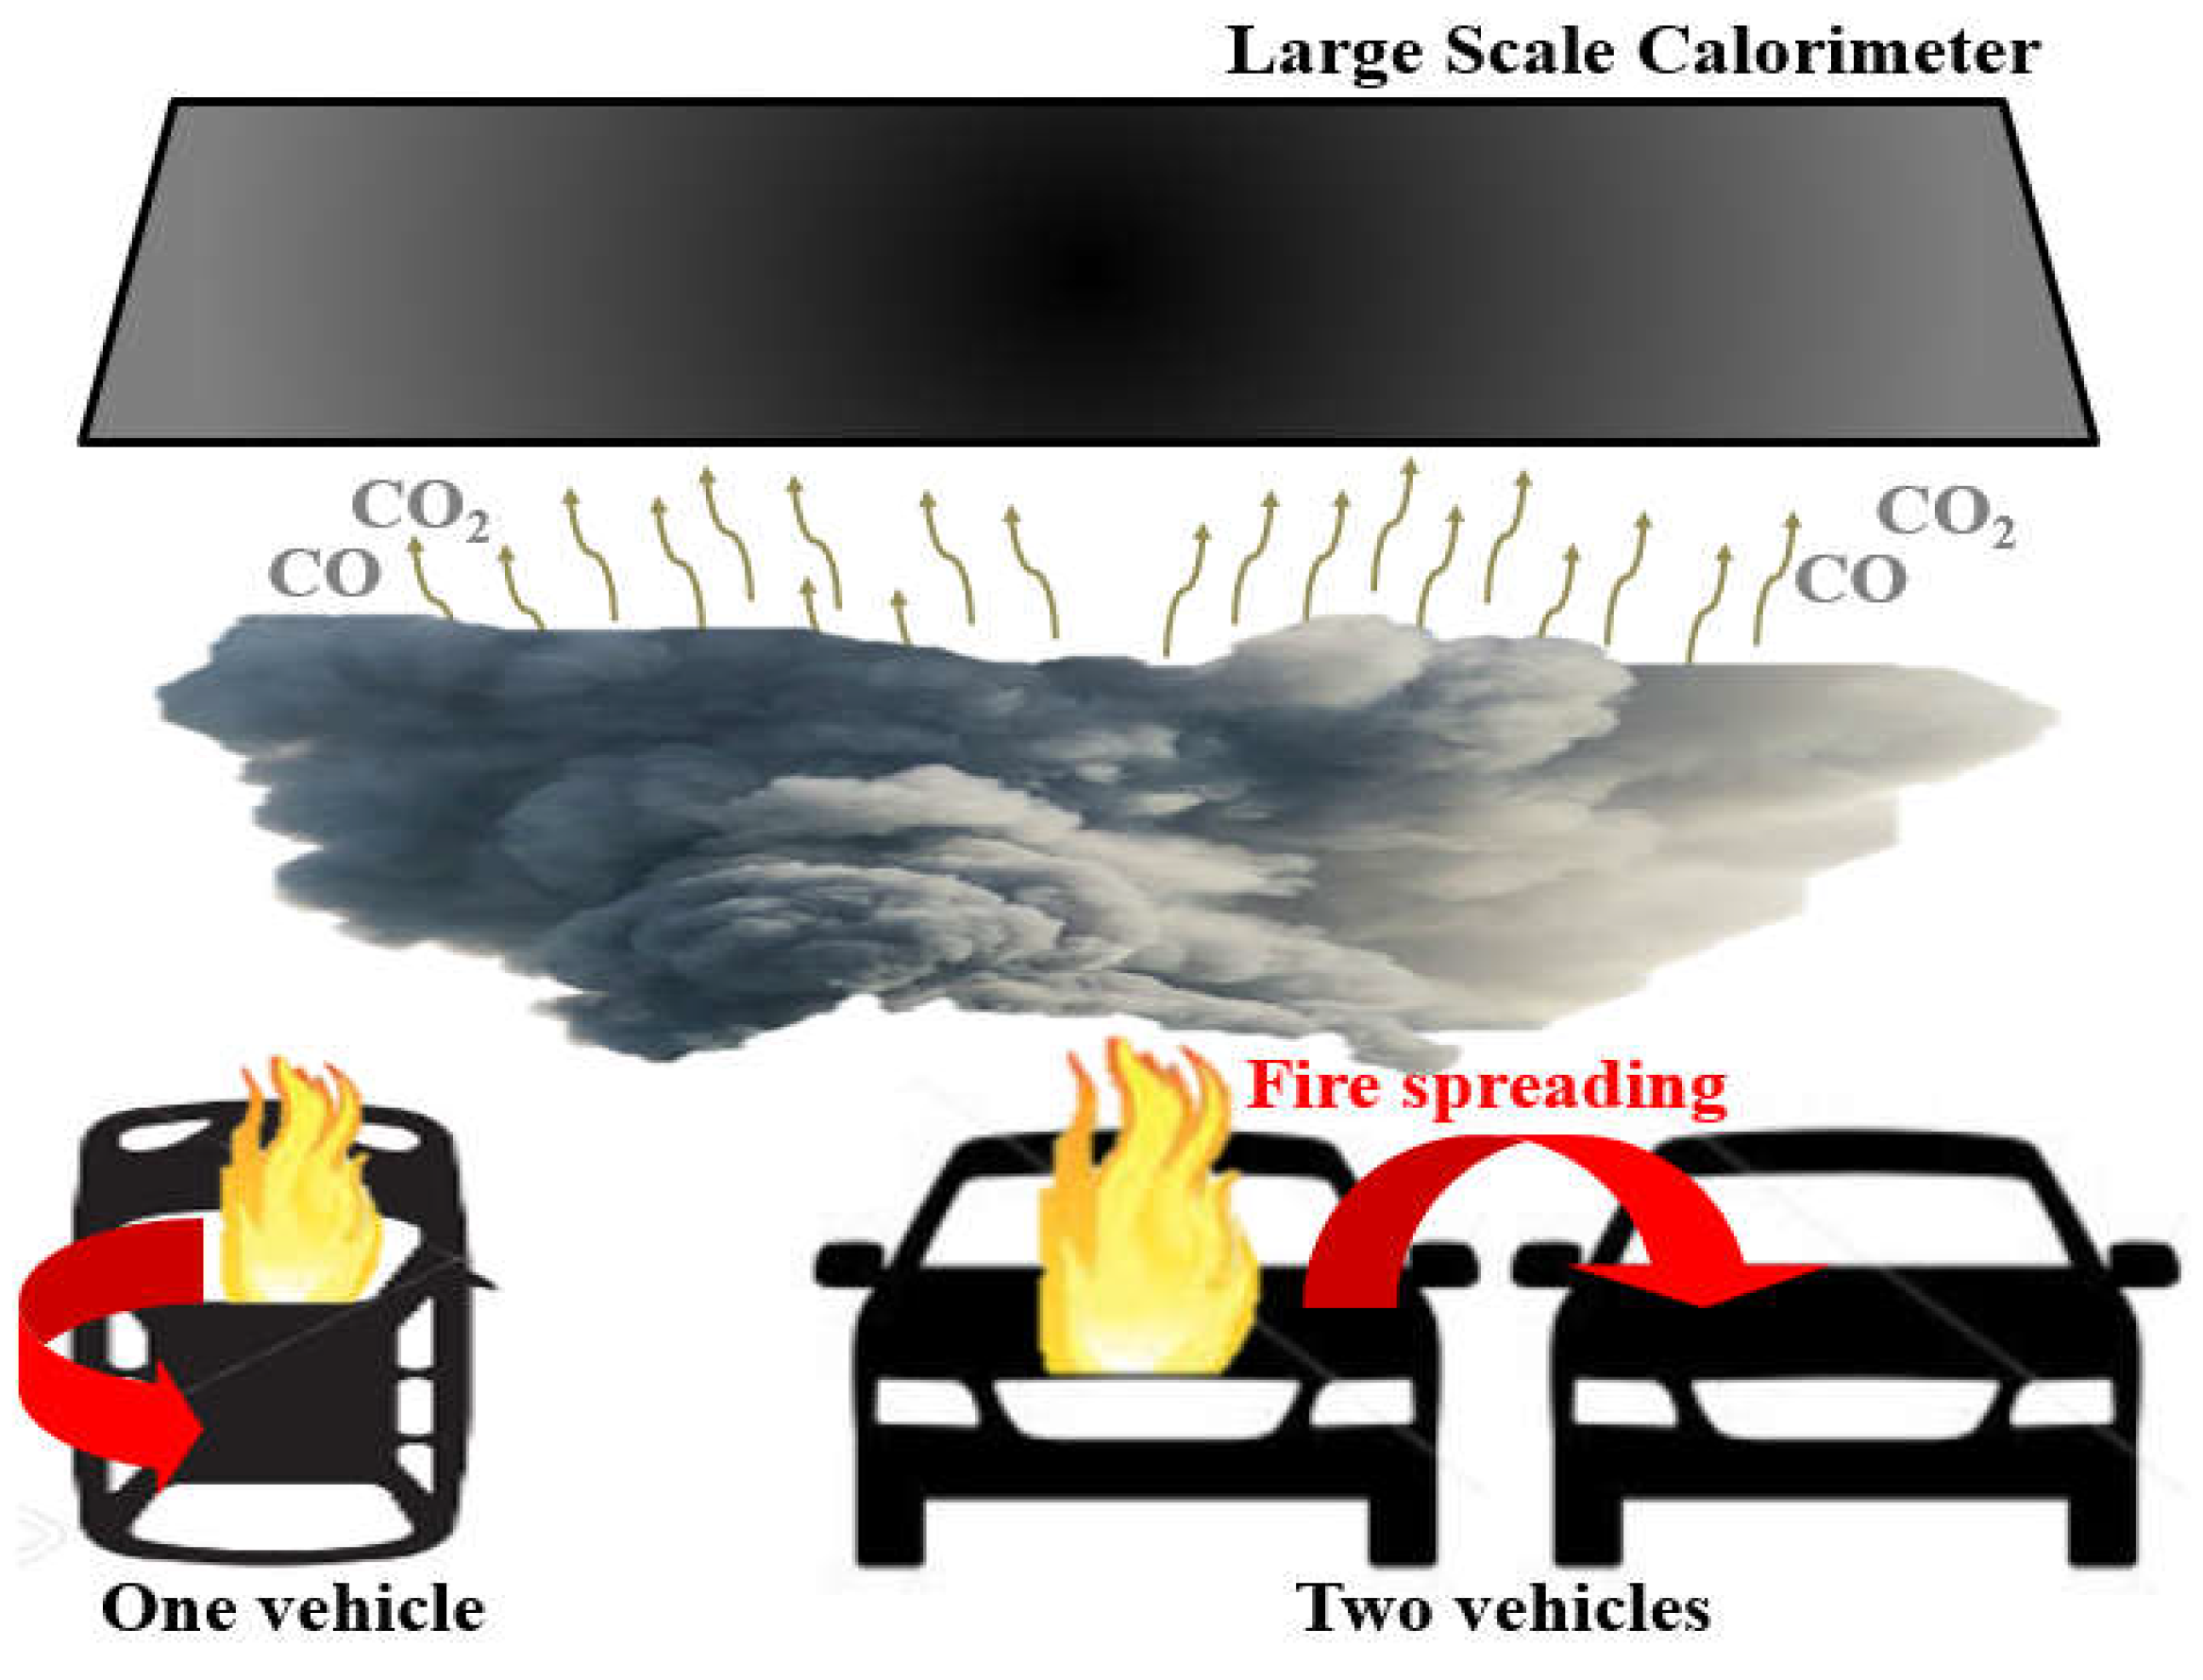
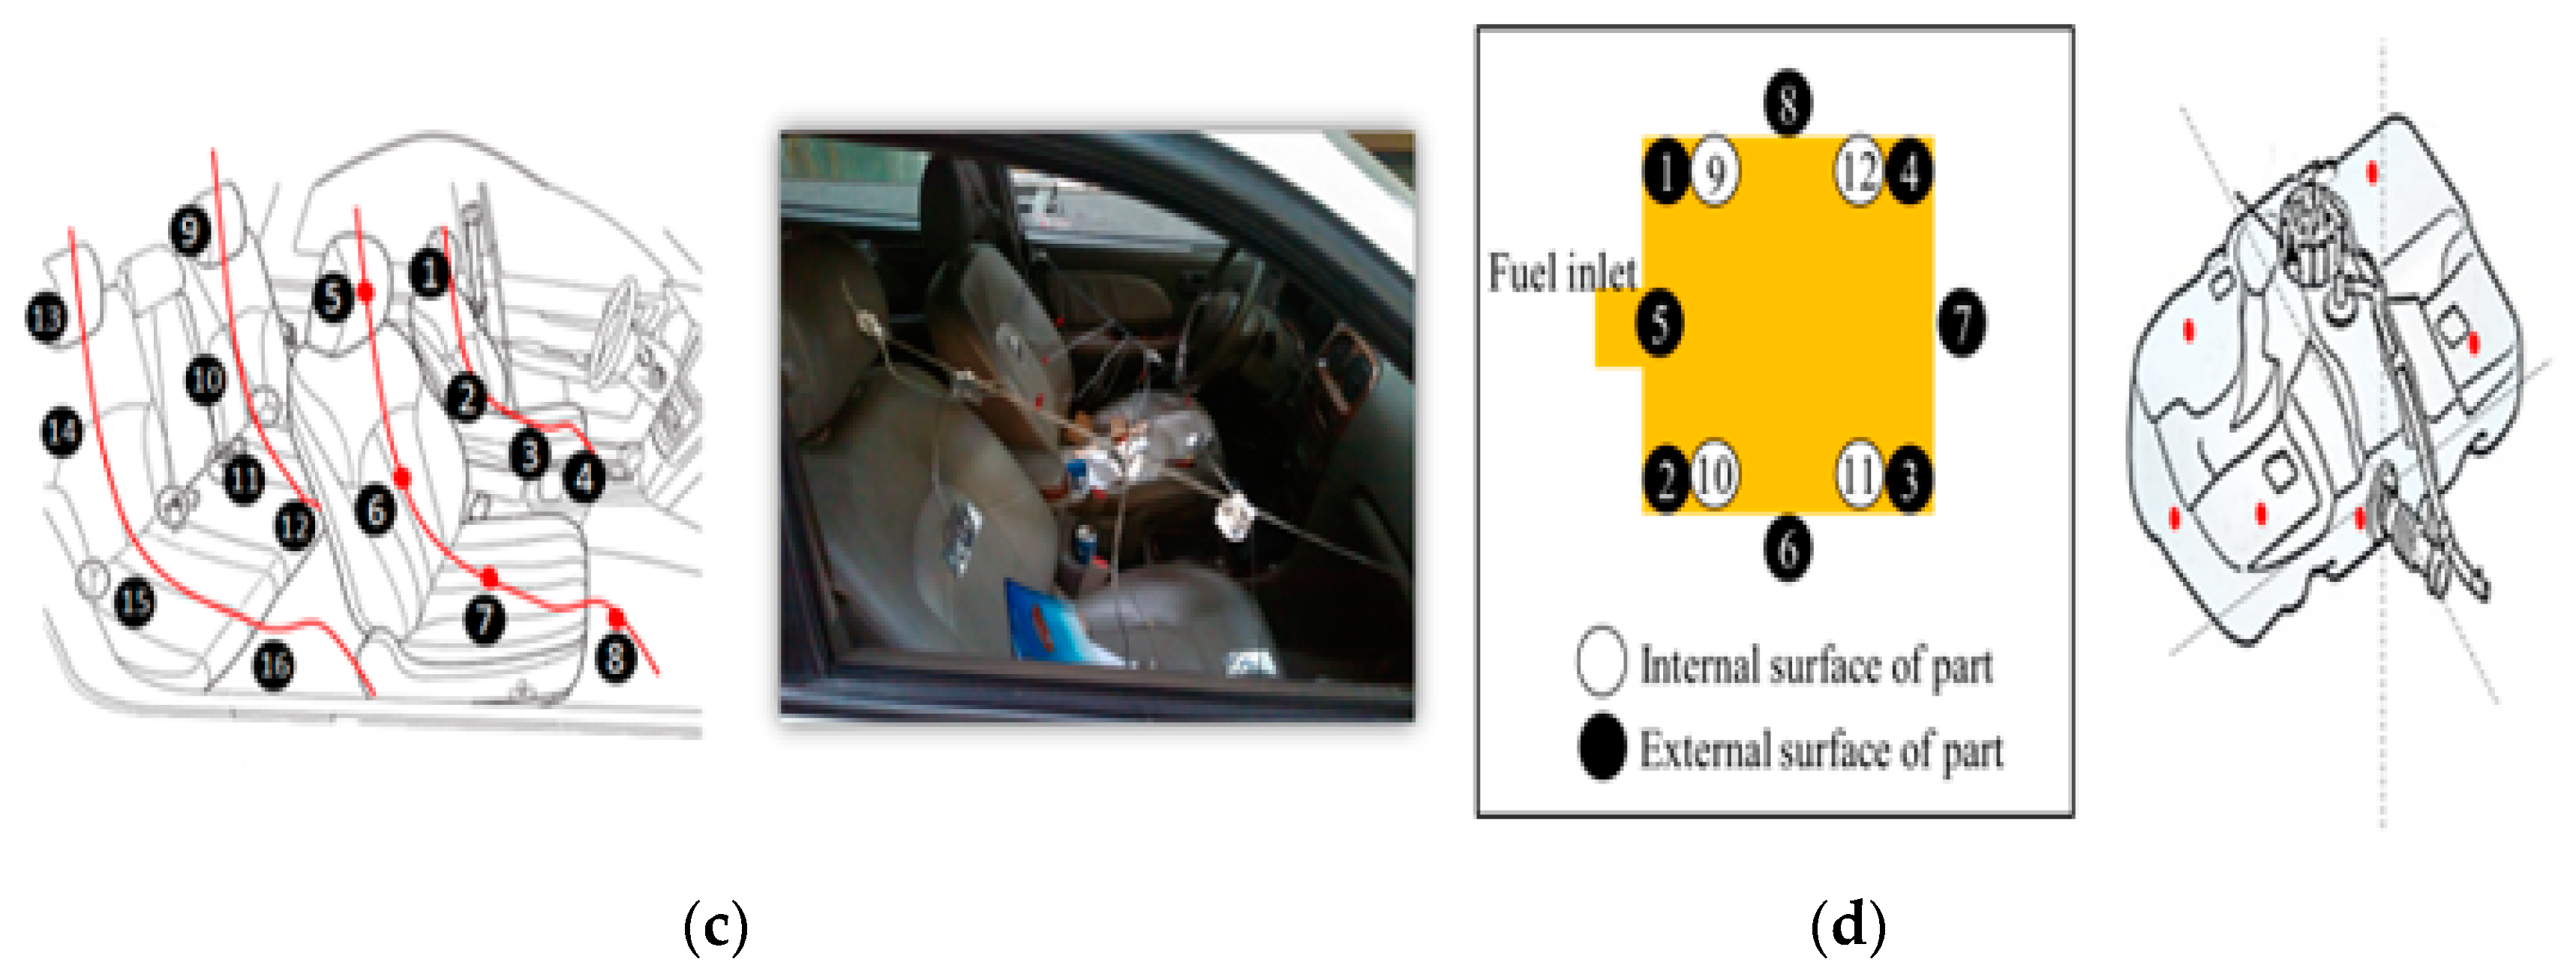
2. Experimental Setup and Conditions
3. Results and Discussion
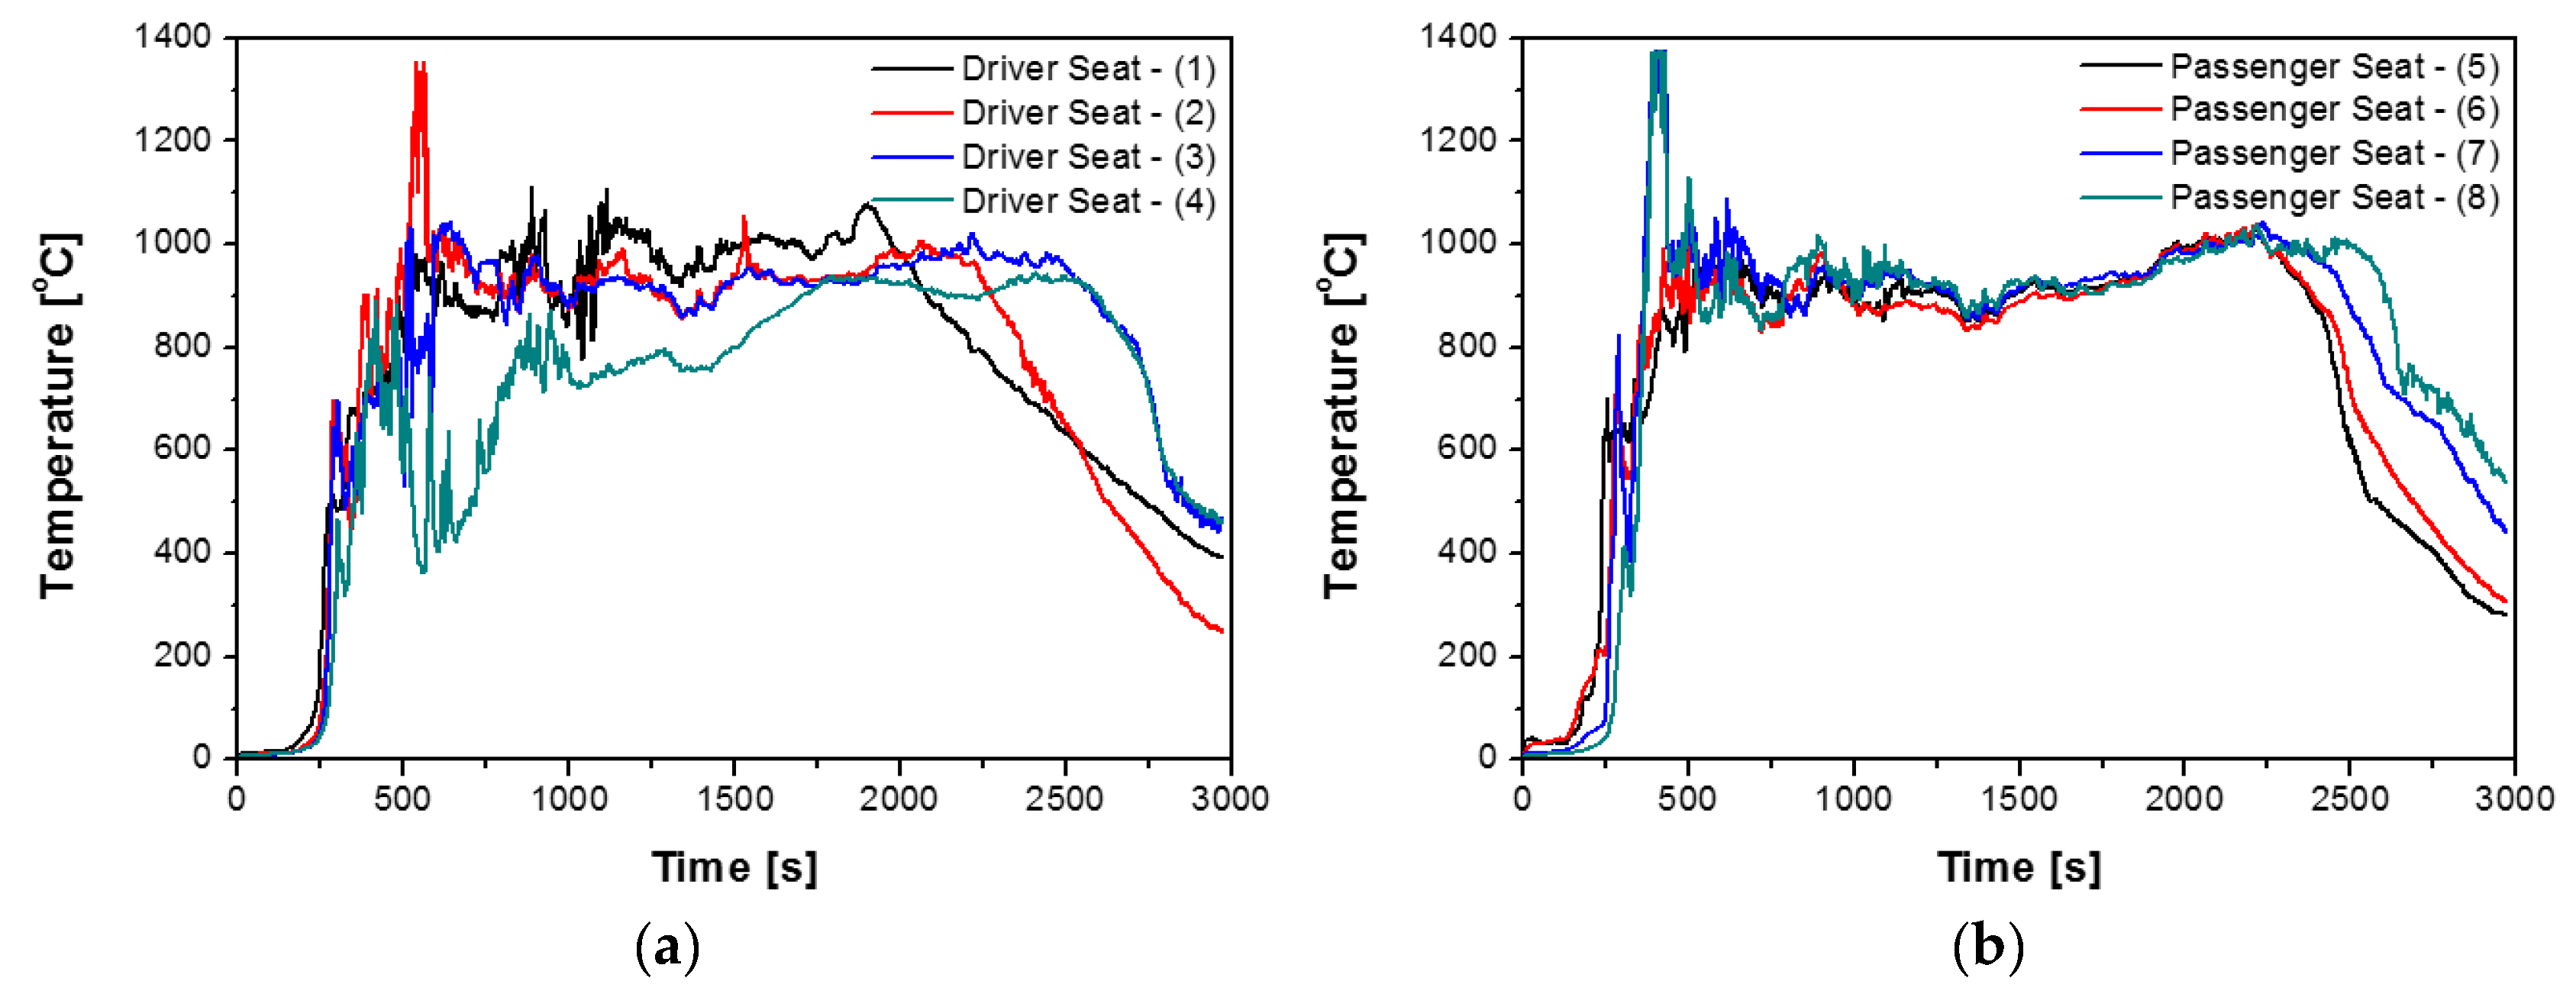
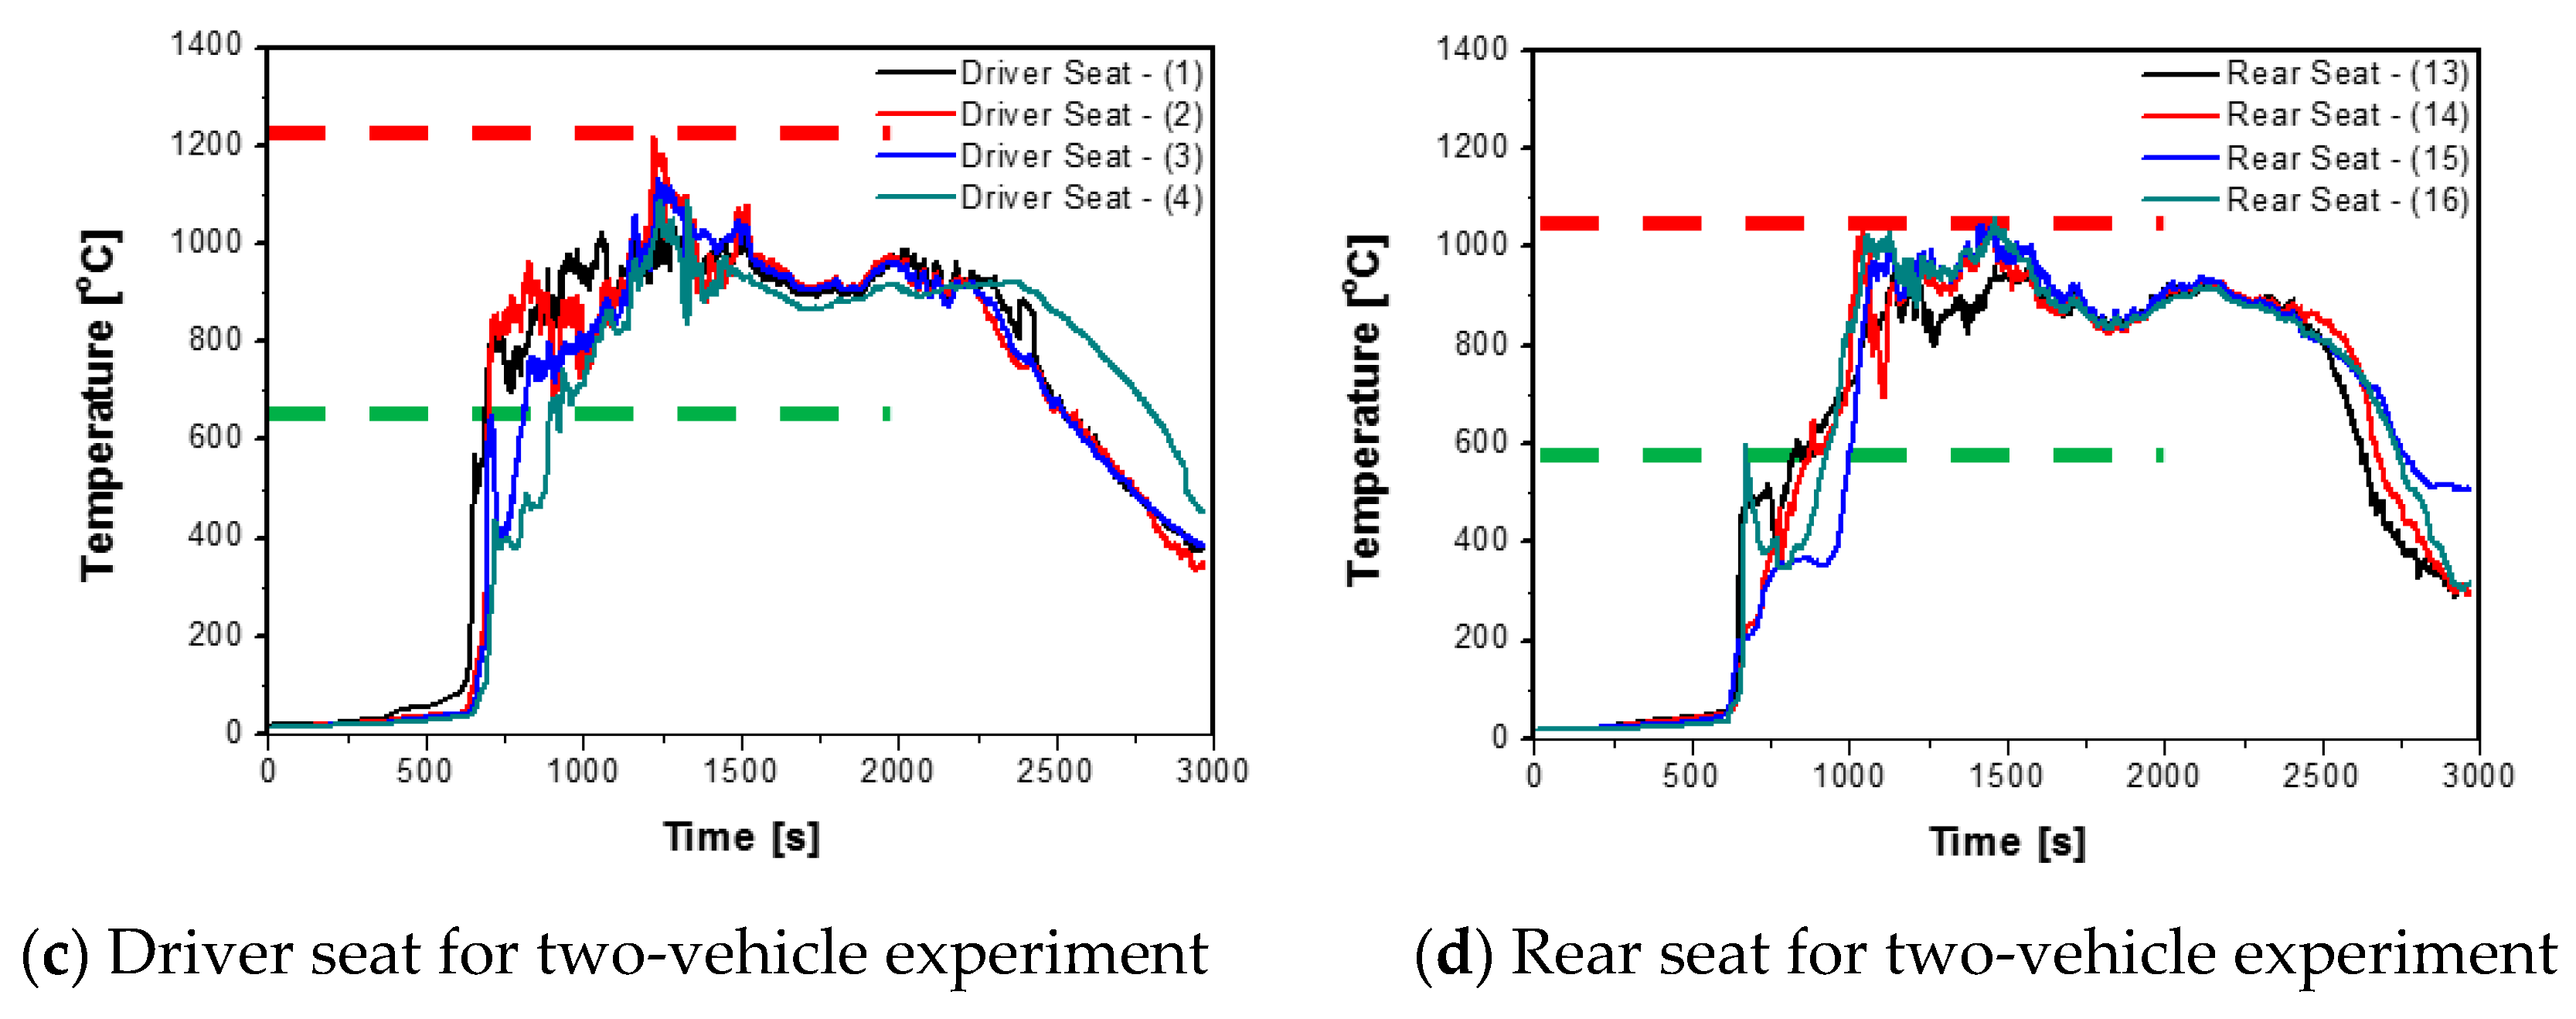
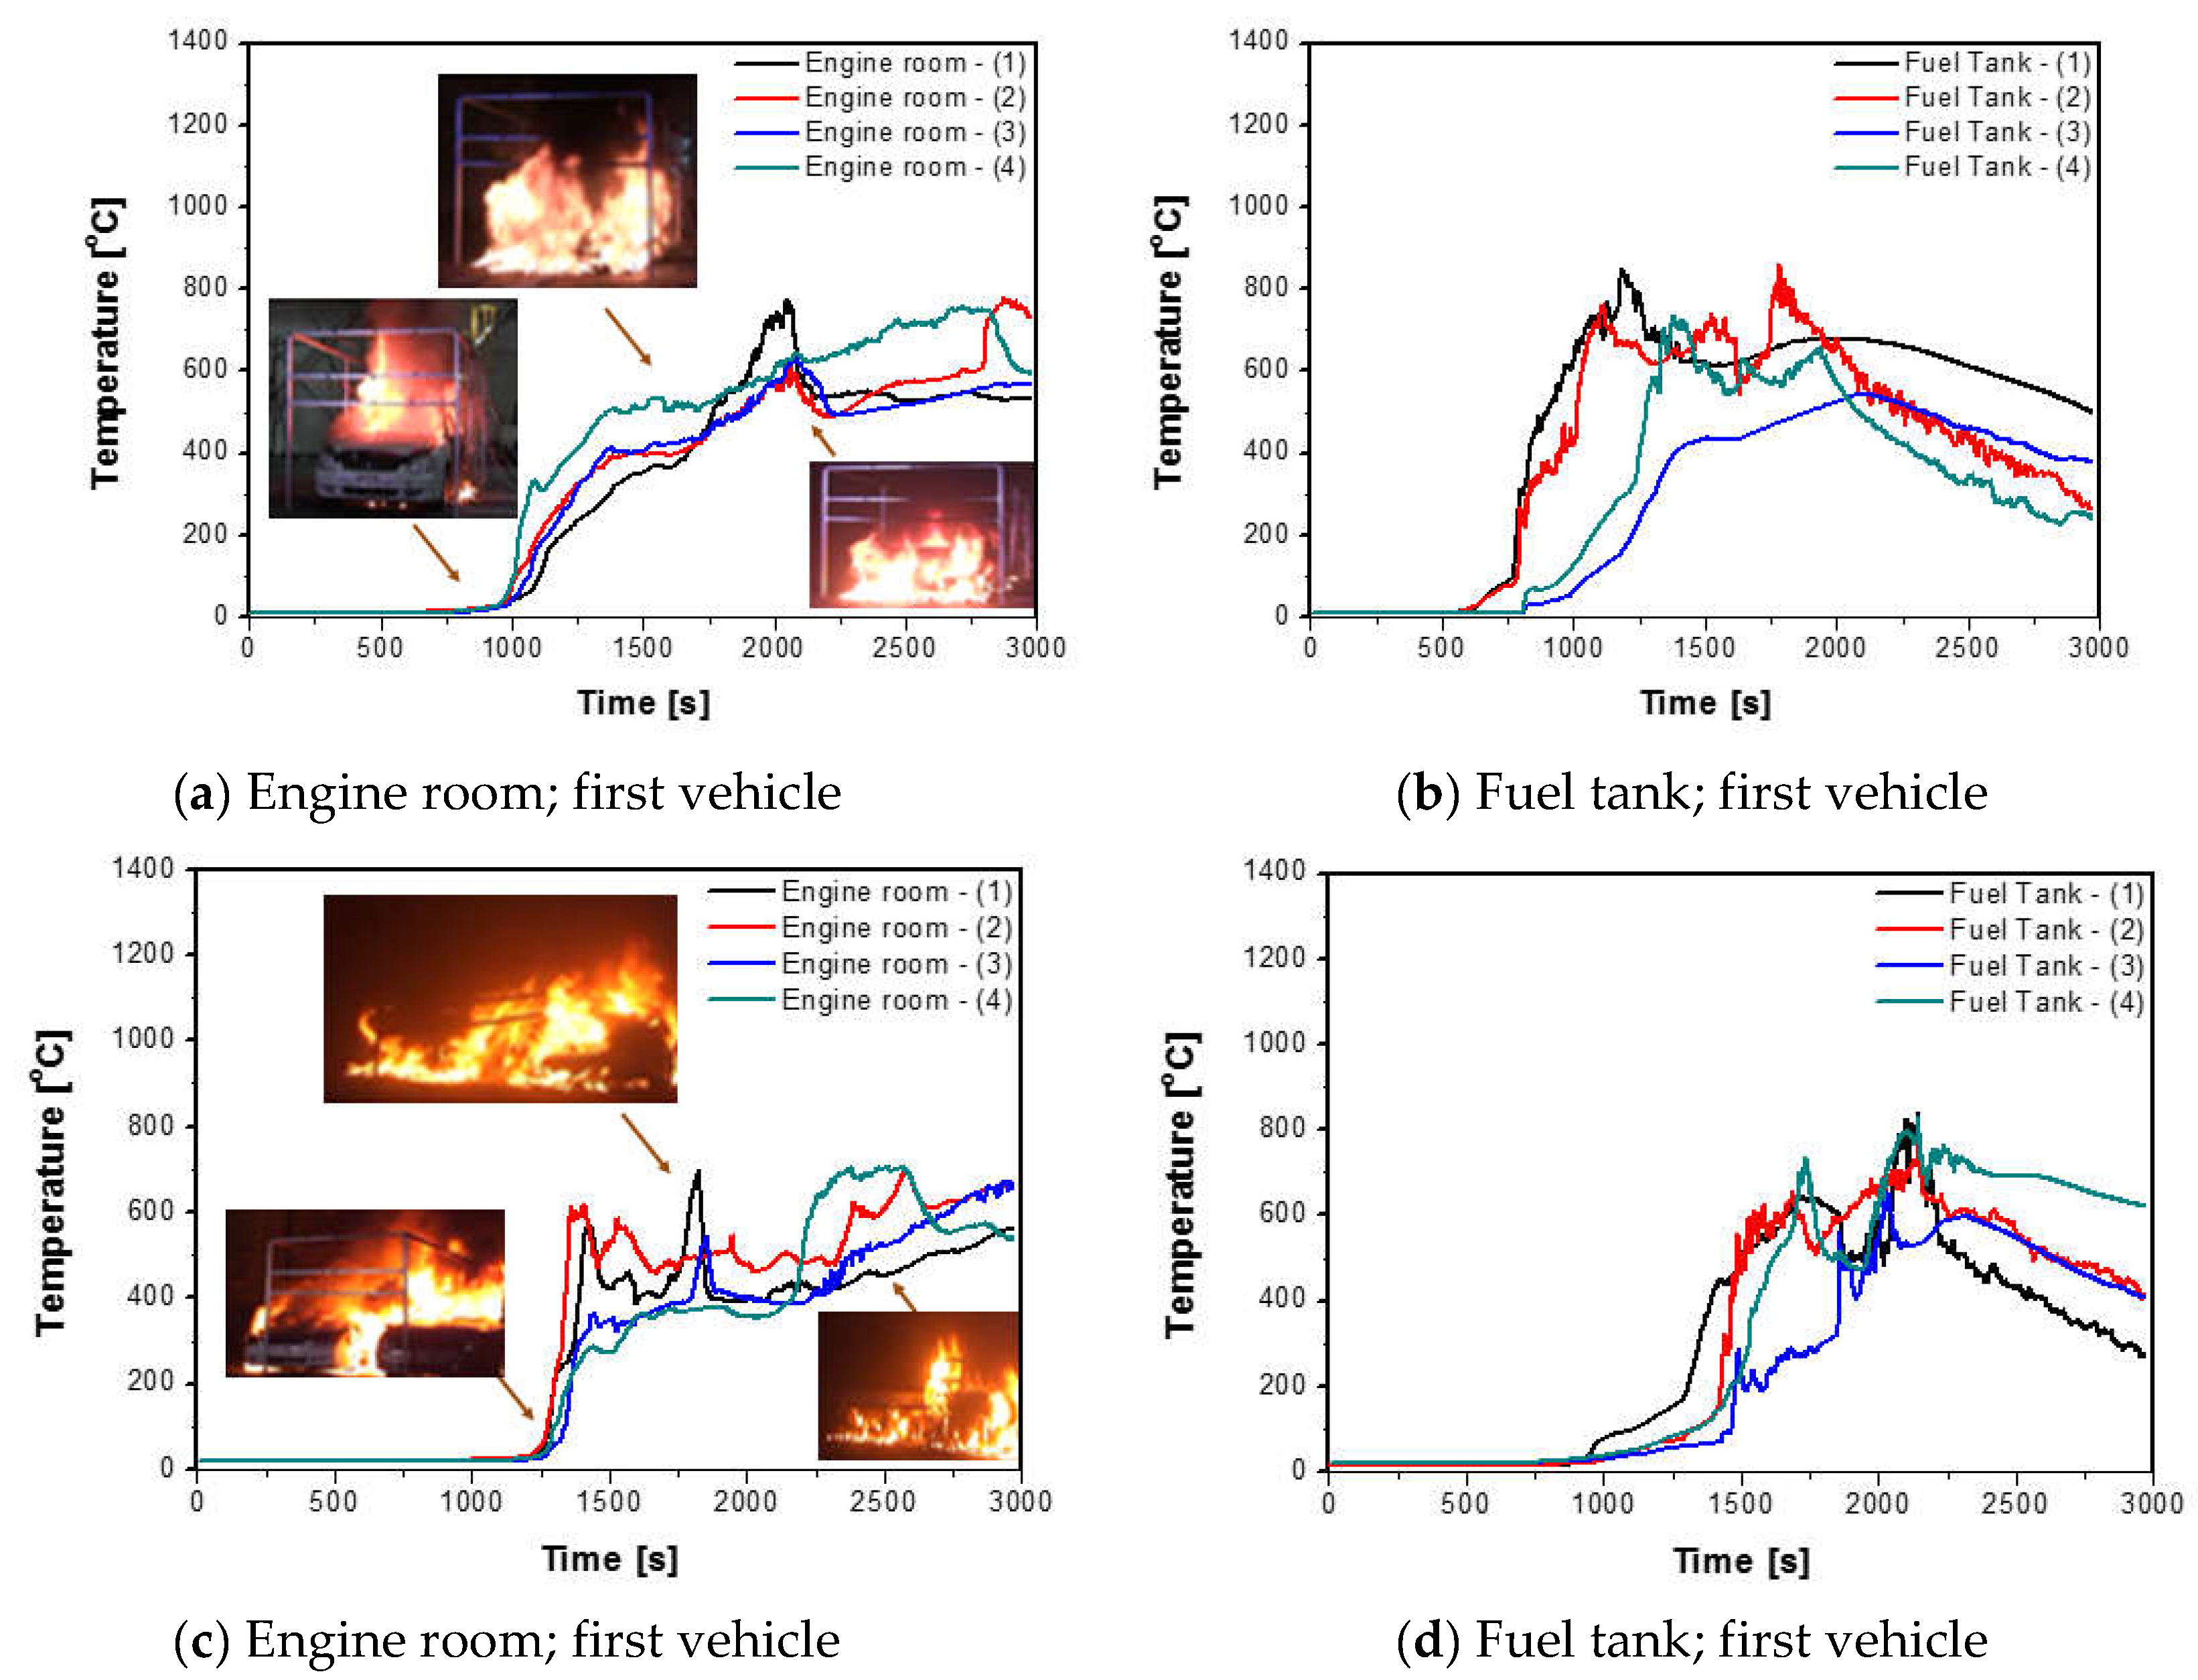
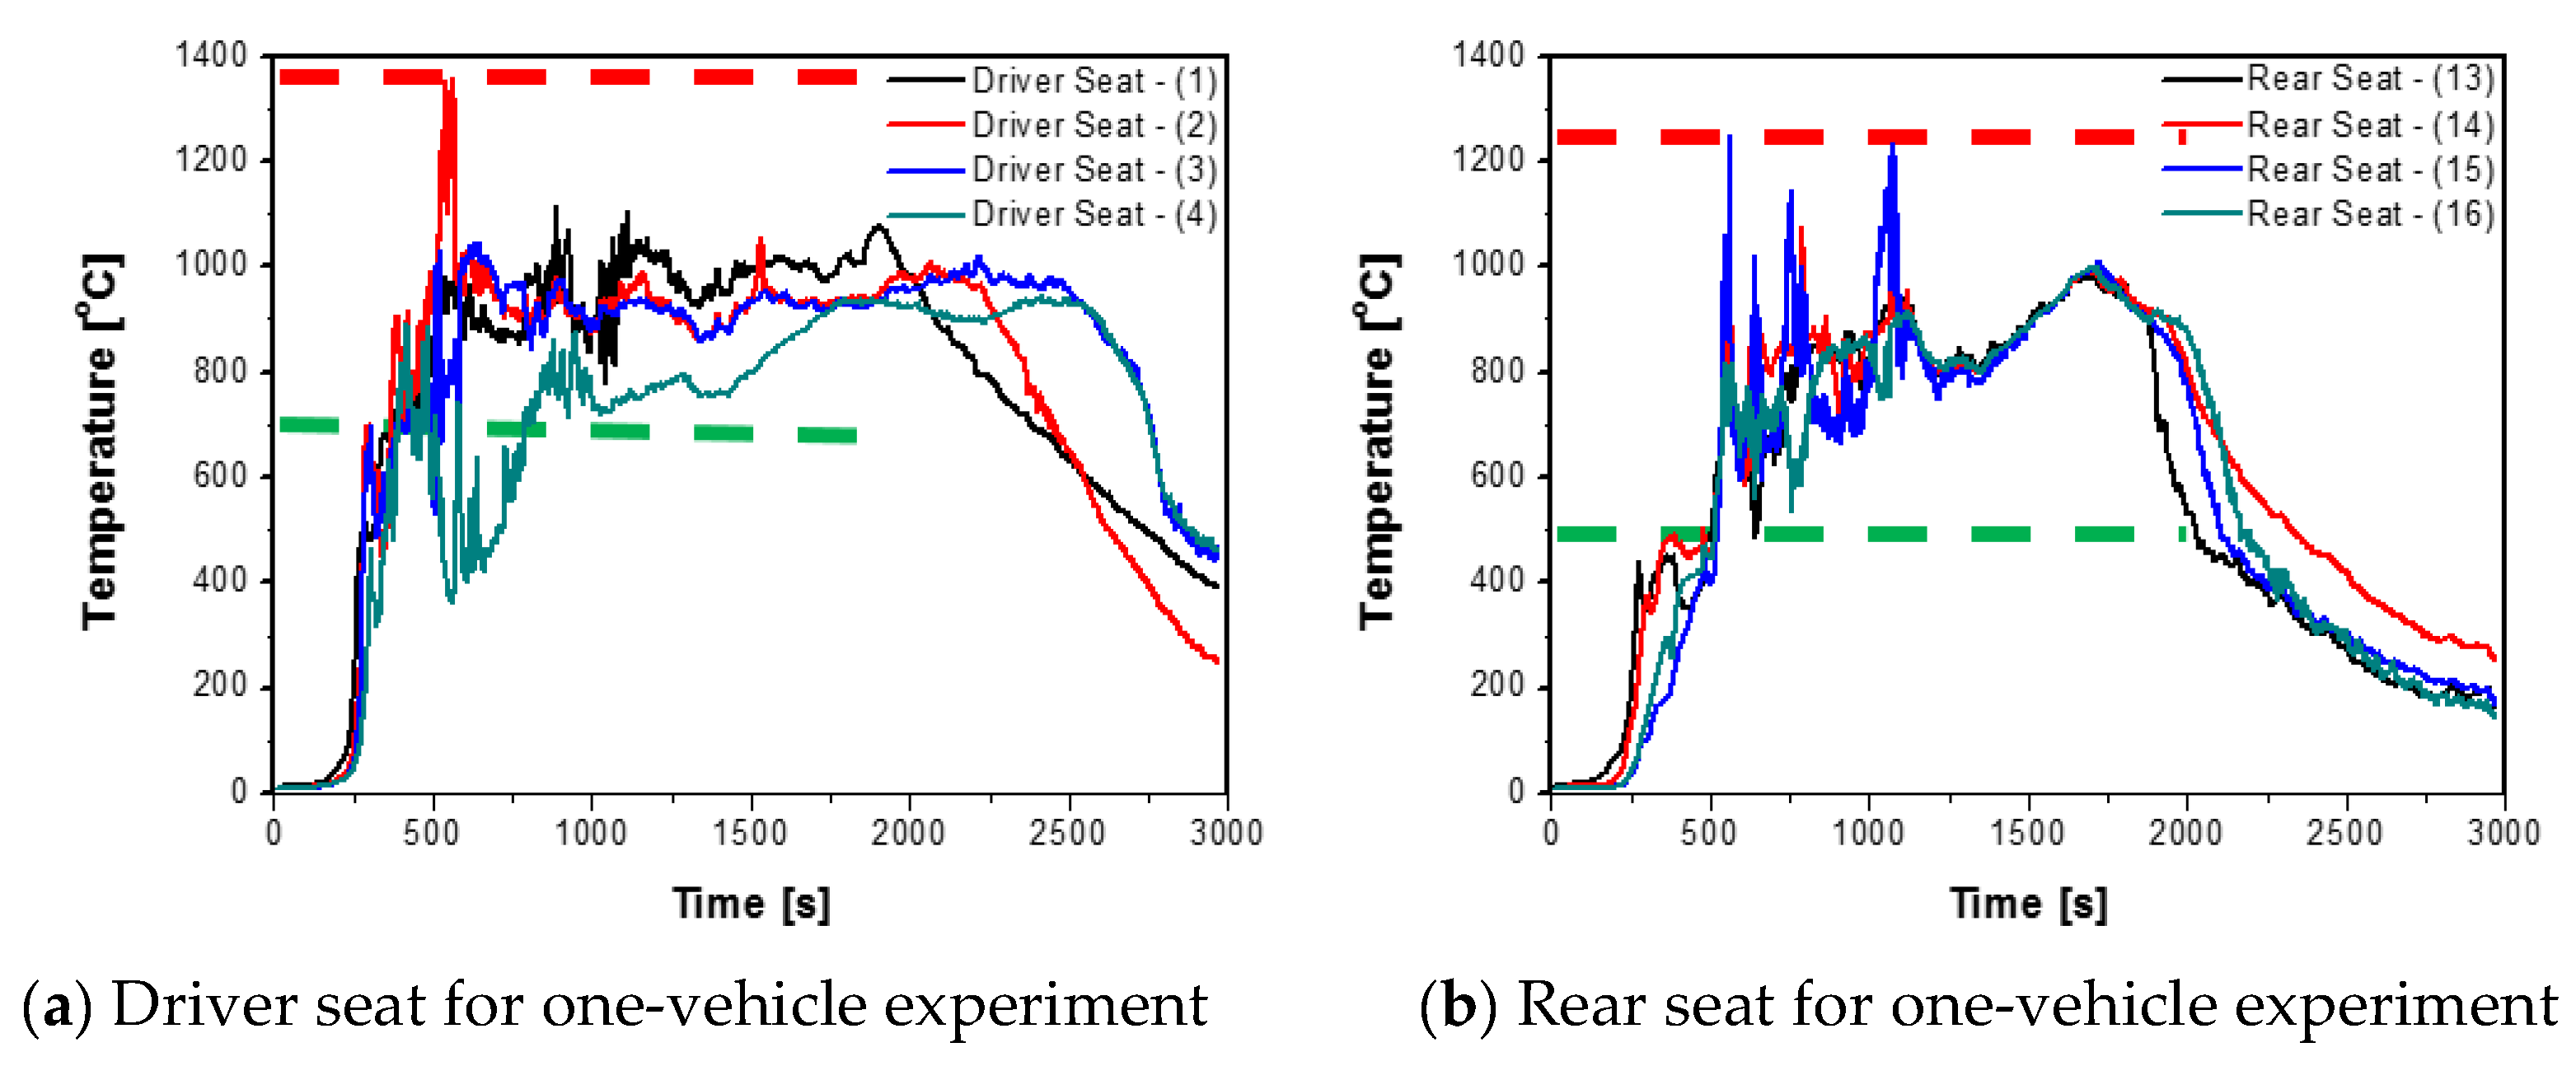
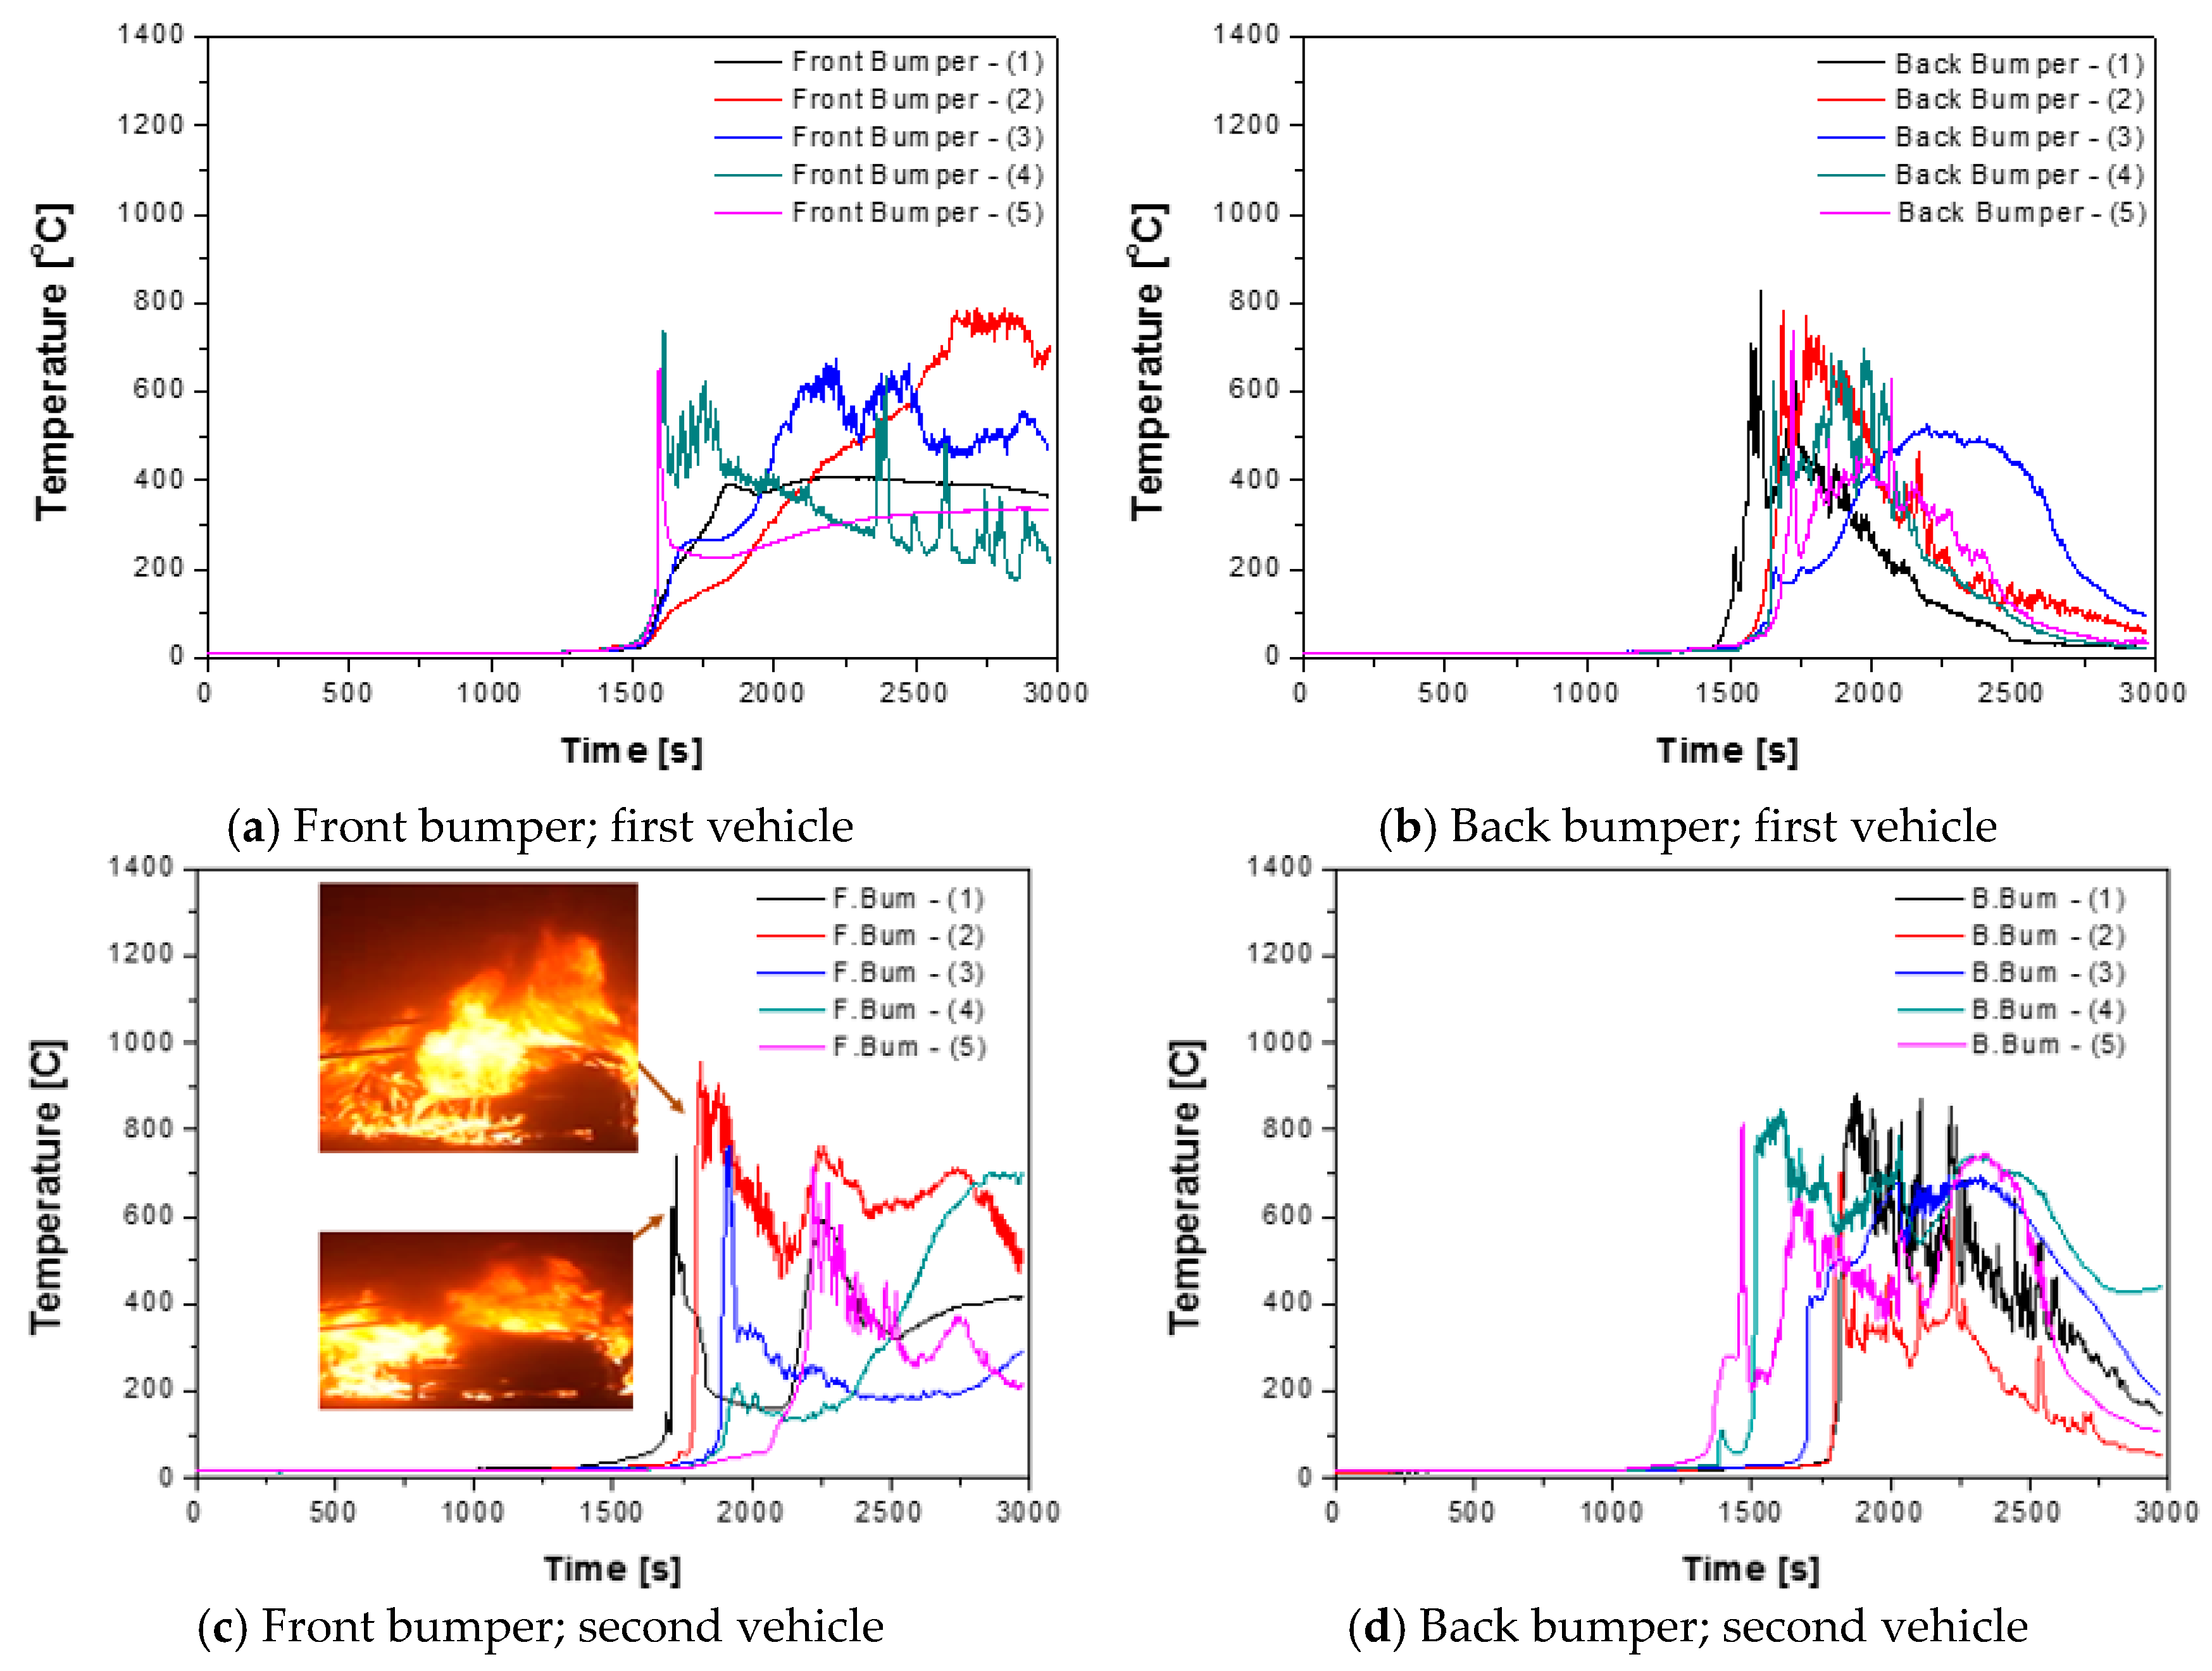
3.1. Fire-Spreading Characteristics
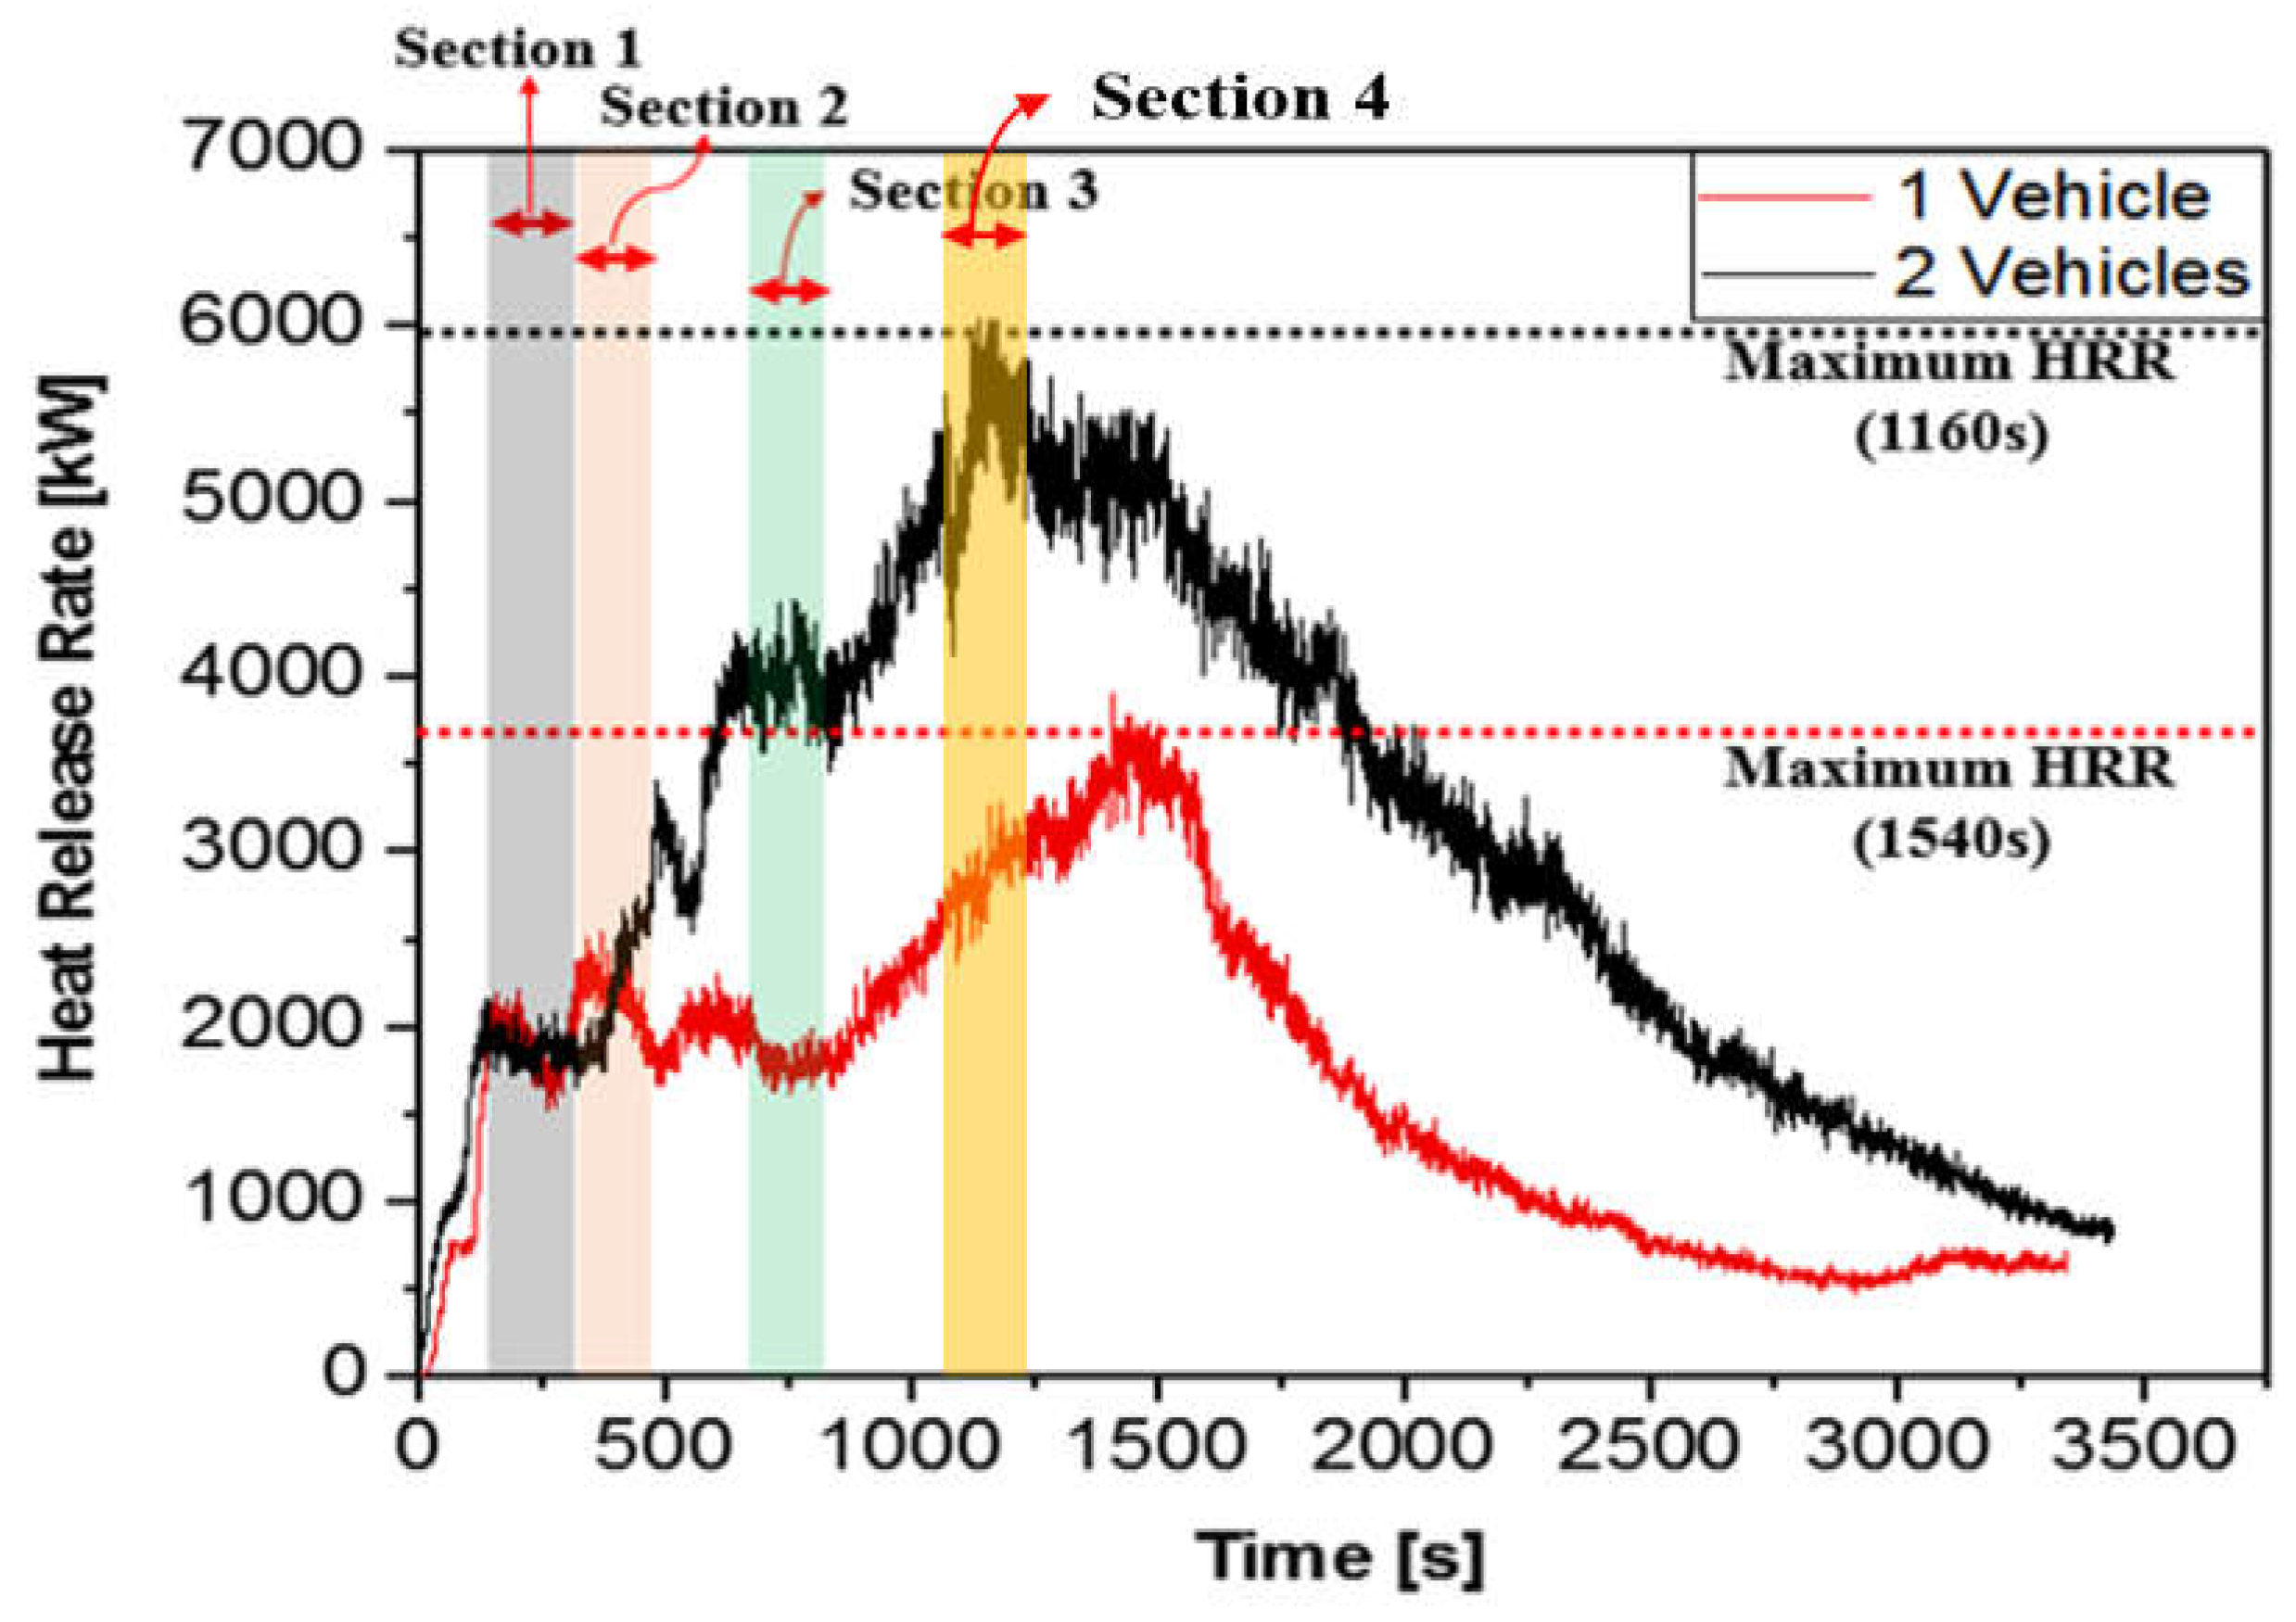
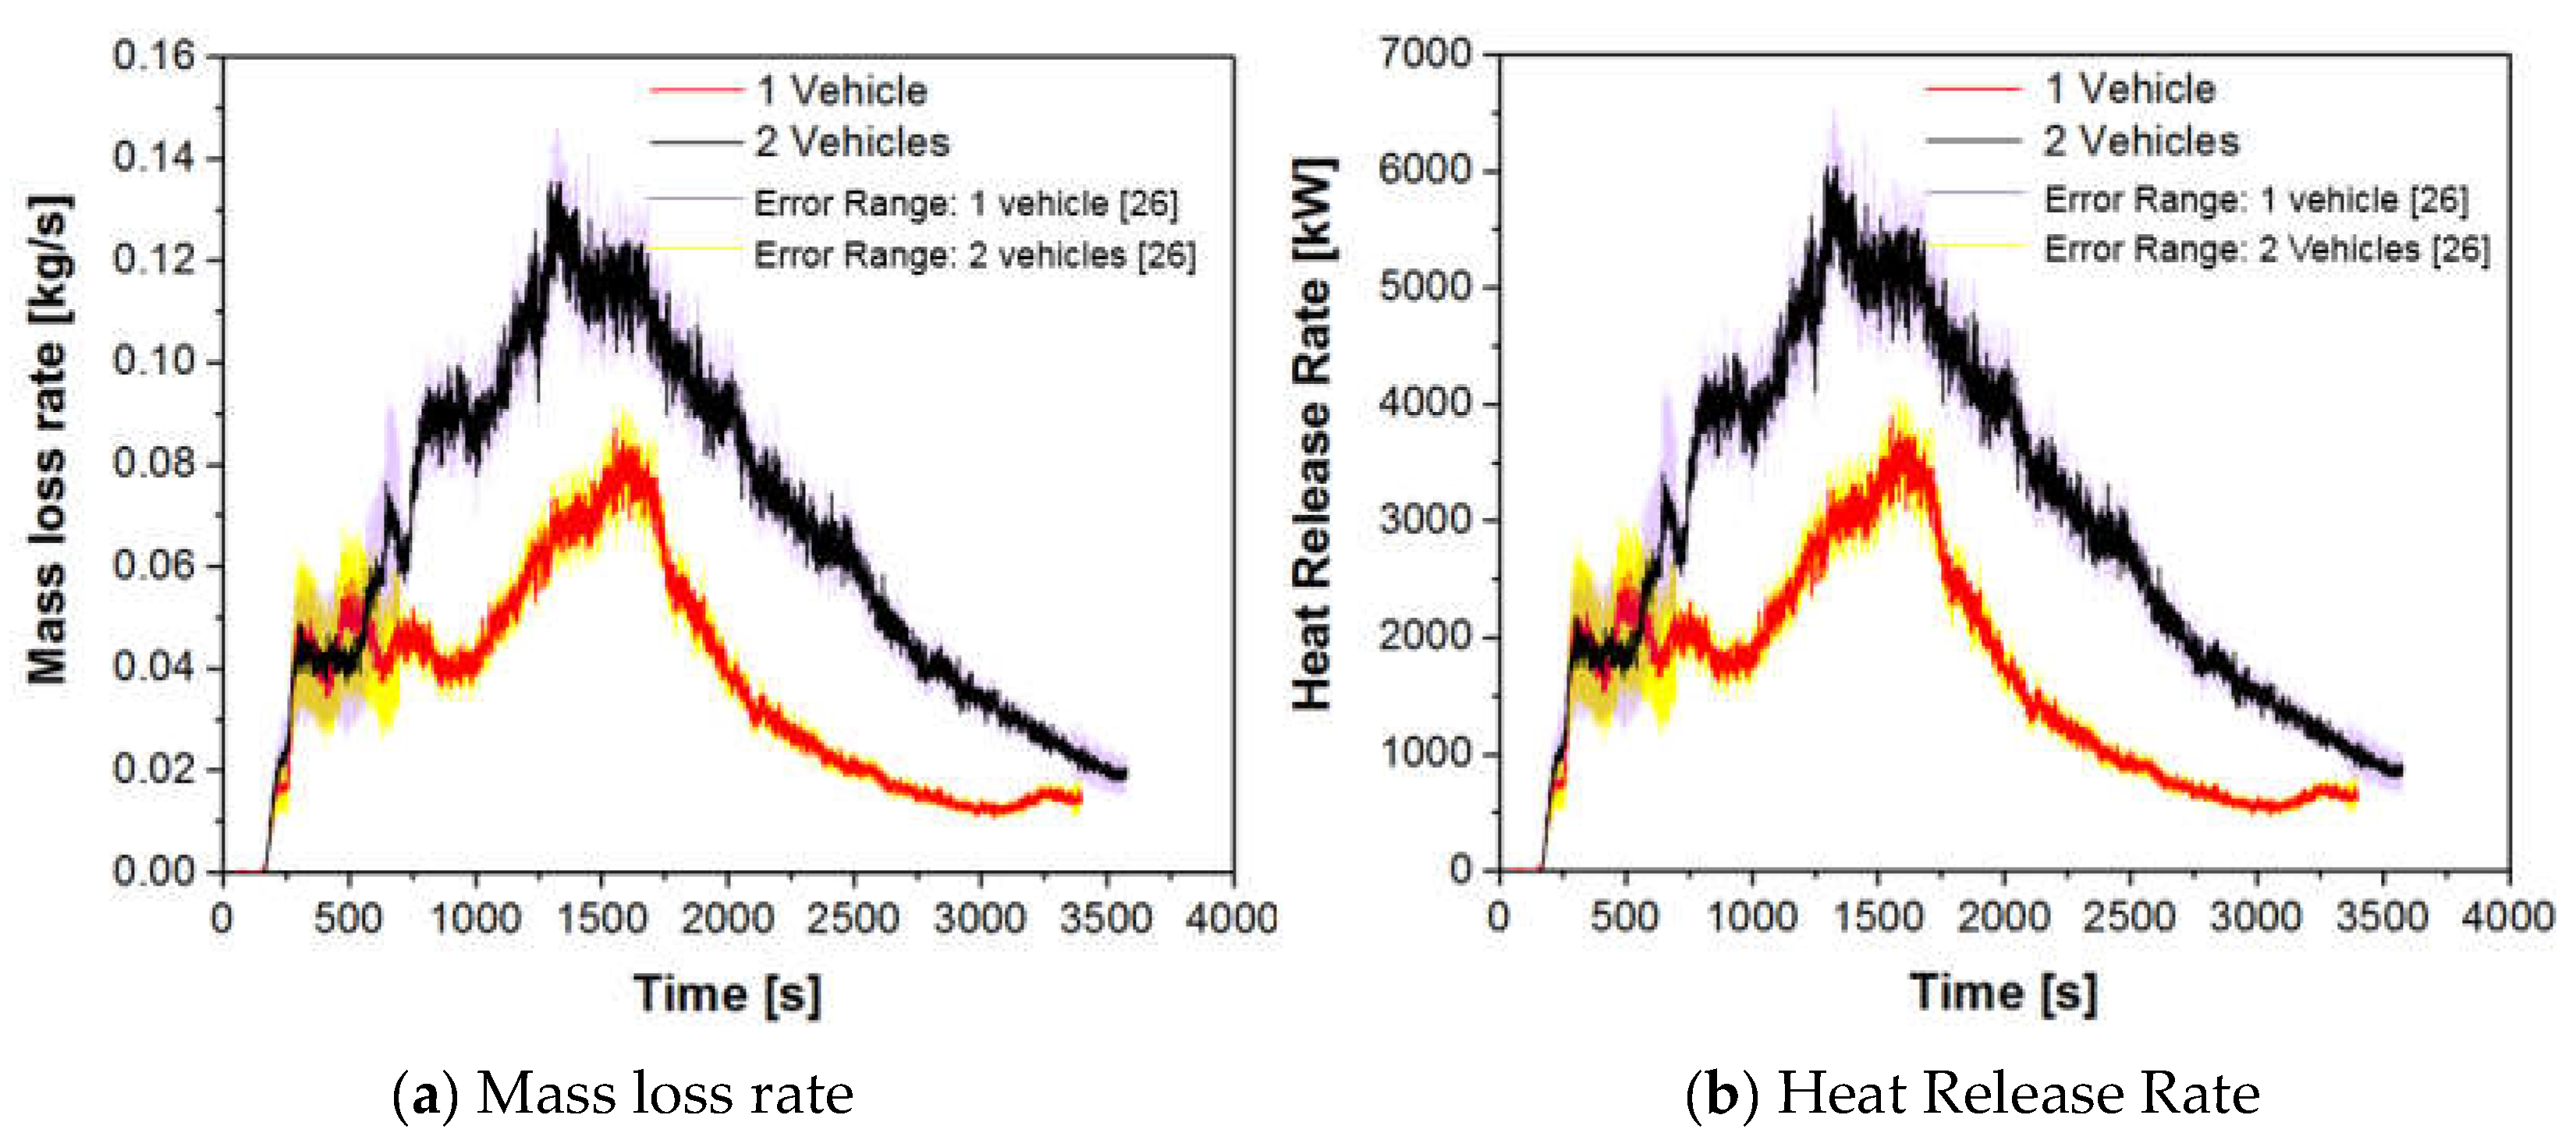
3.2. Heat Release Rate
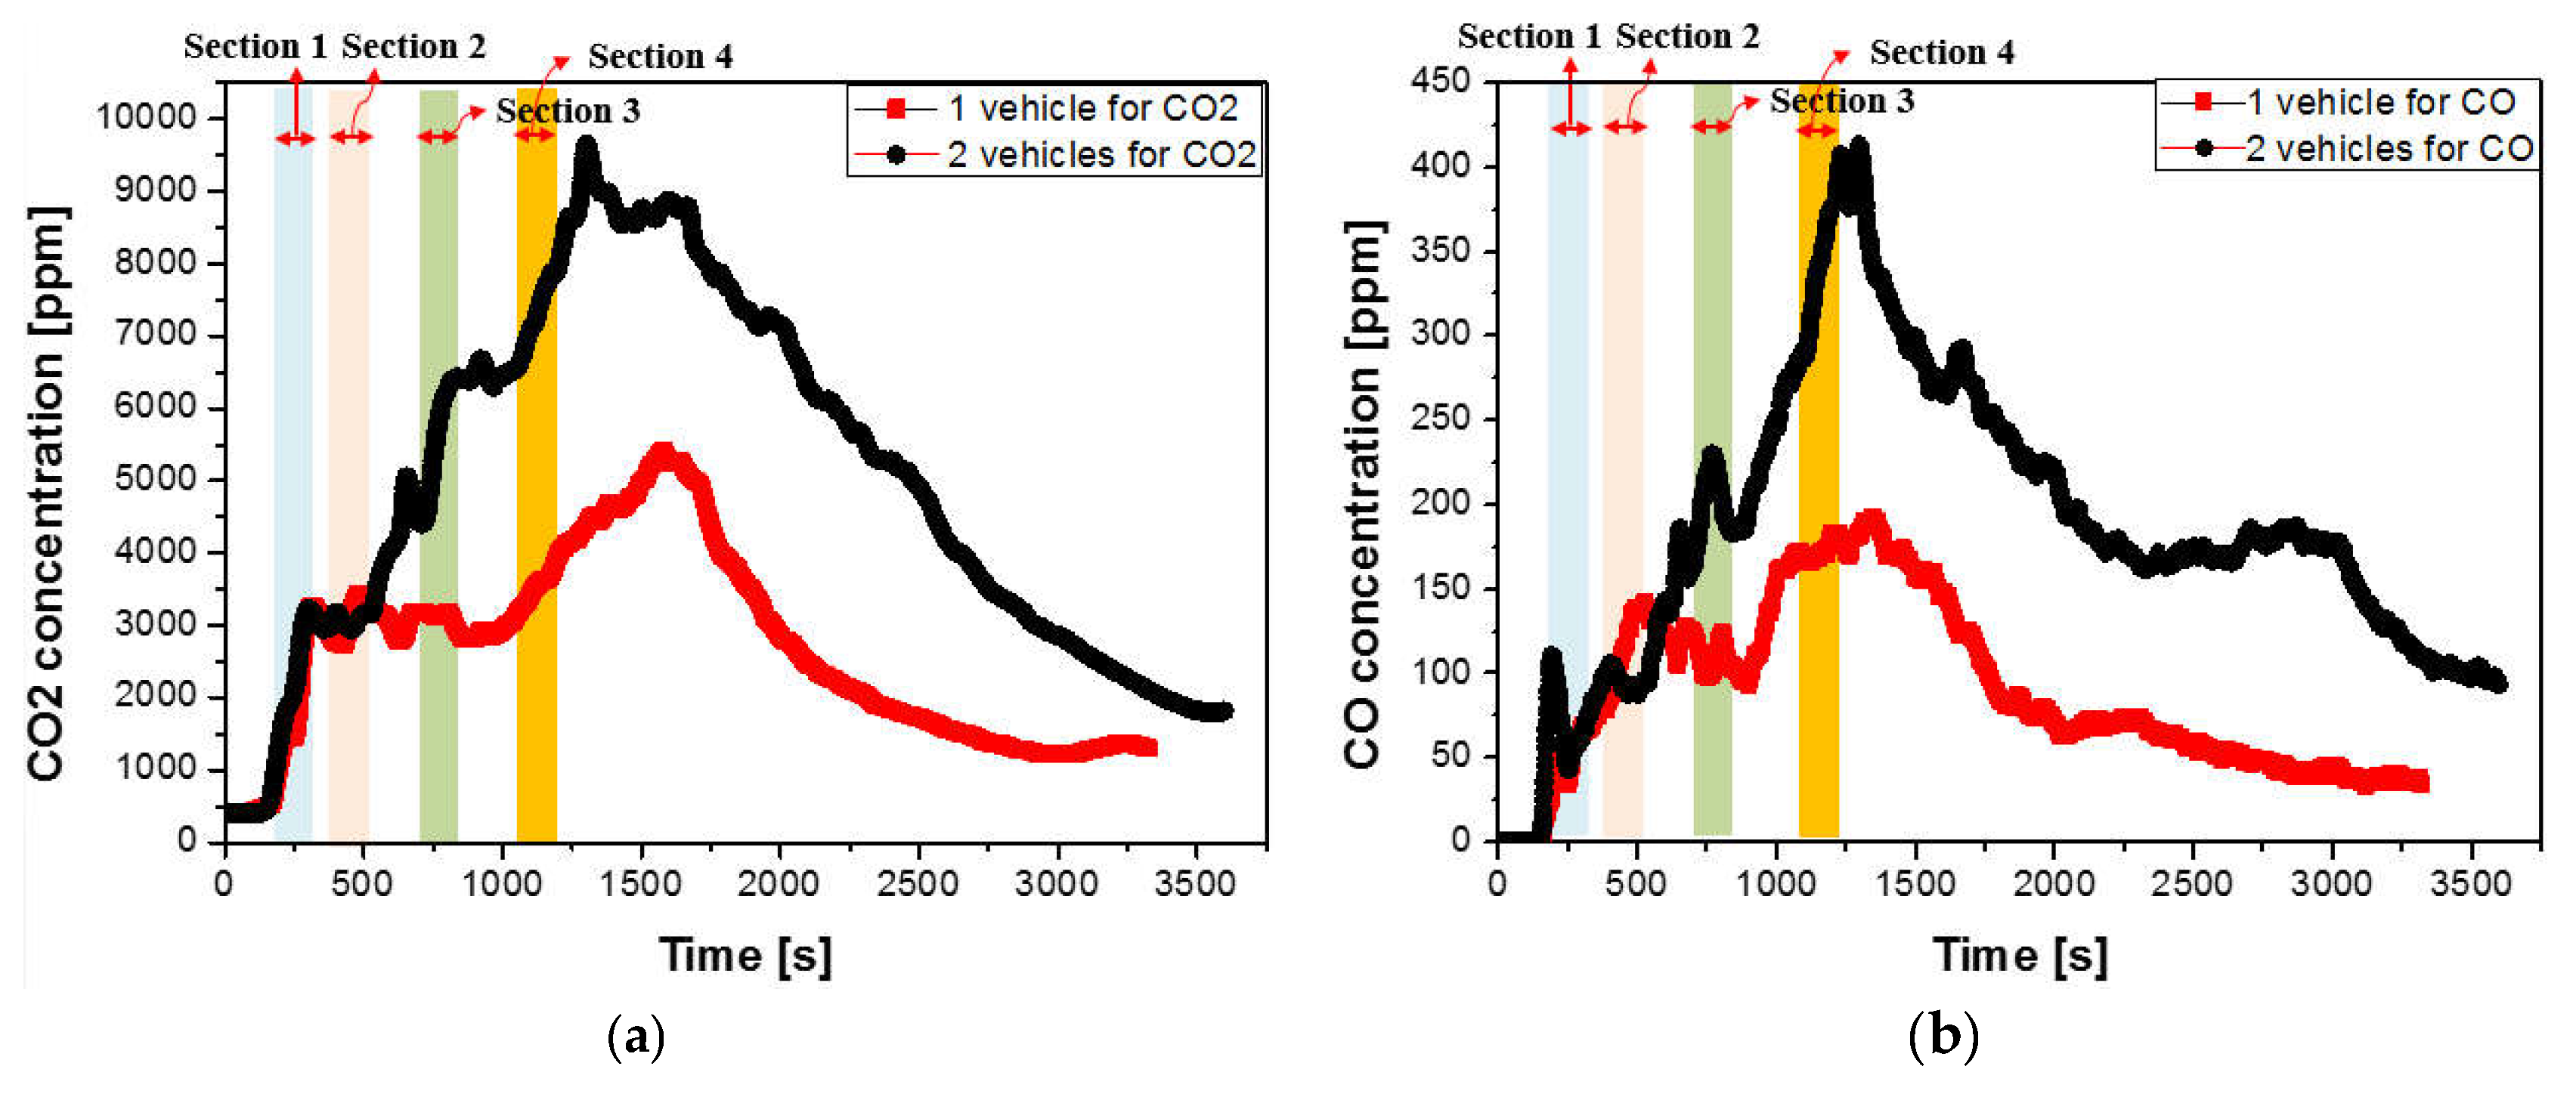
3.3. Toxic Substances
4. Conclusions
- (1)
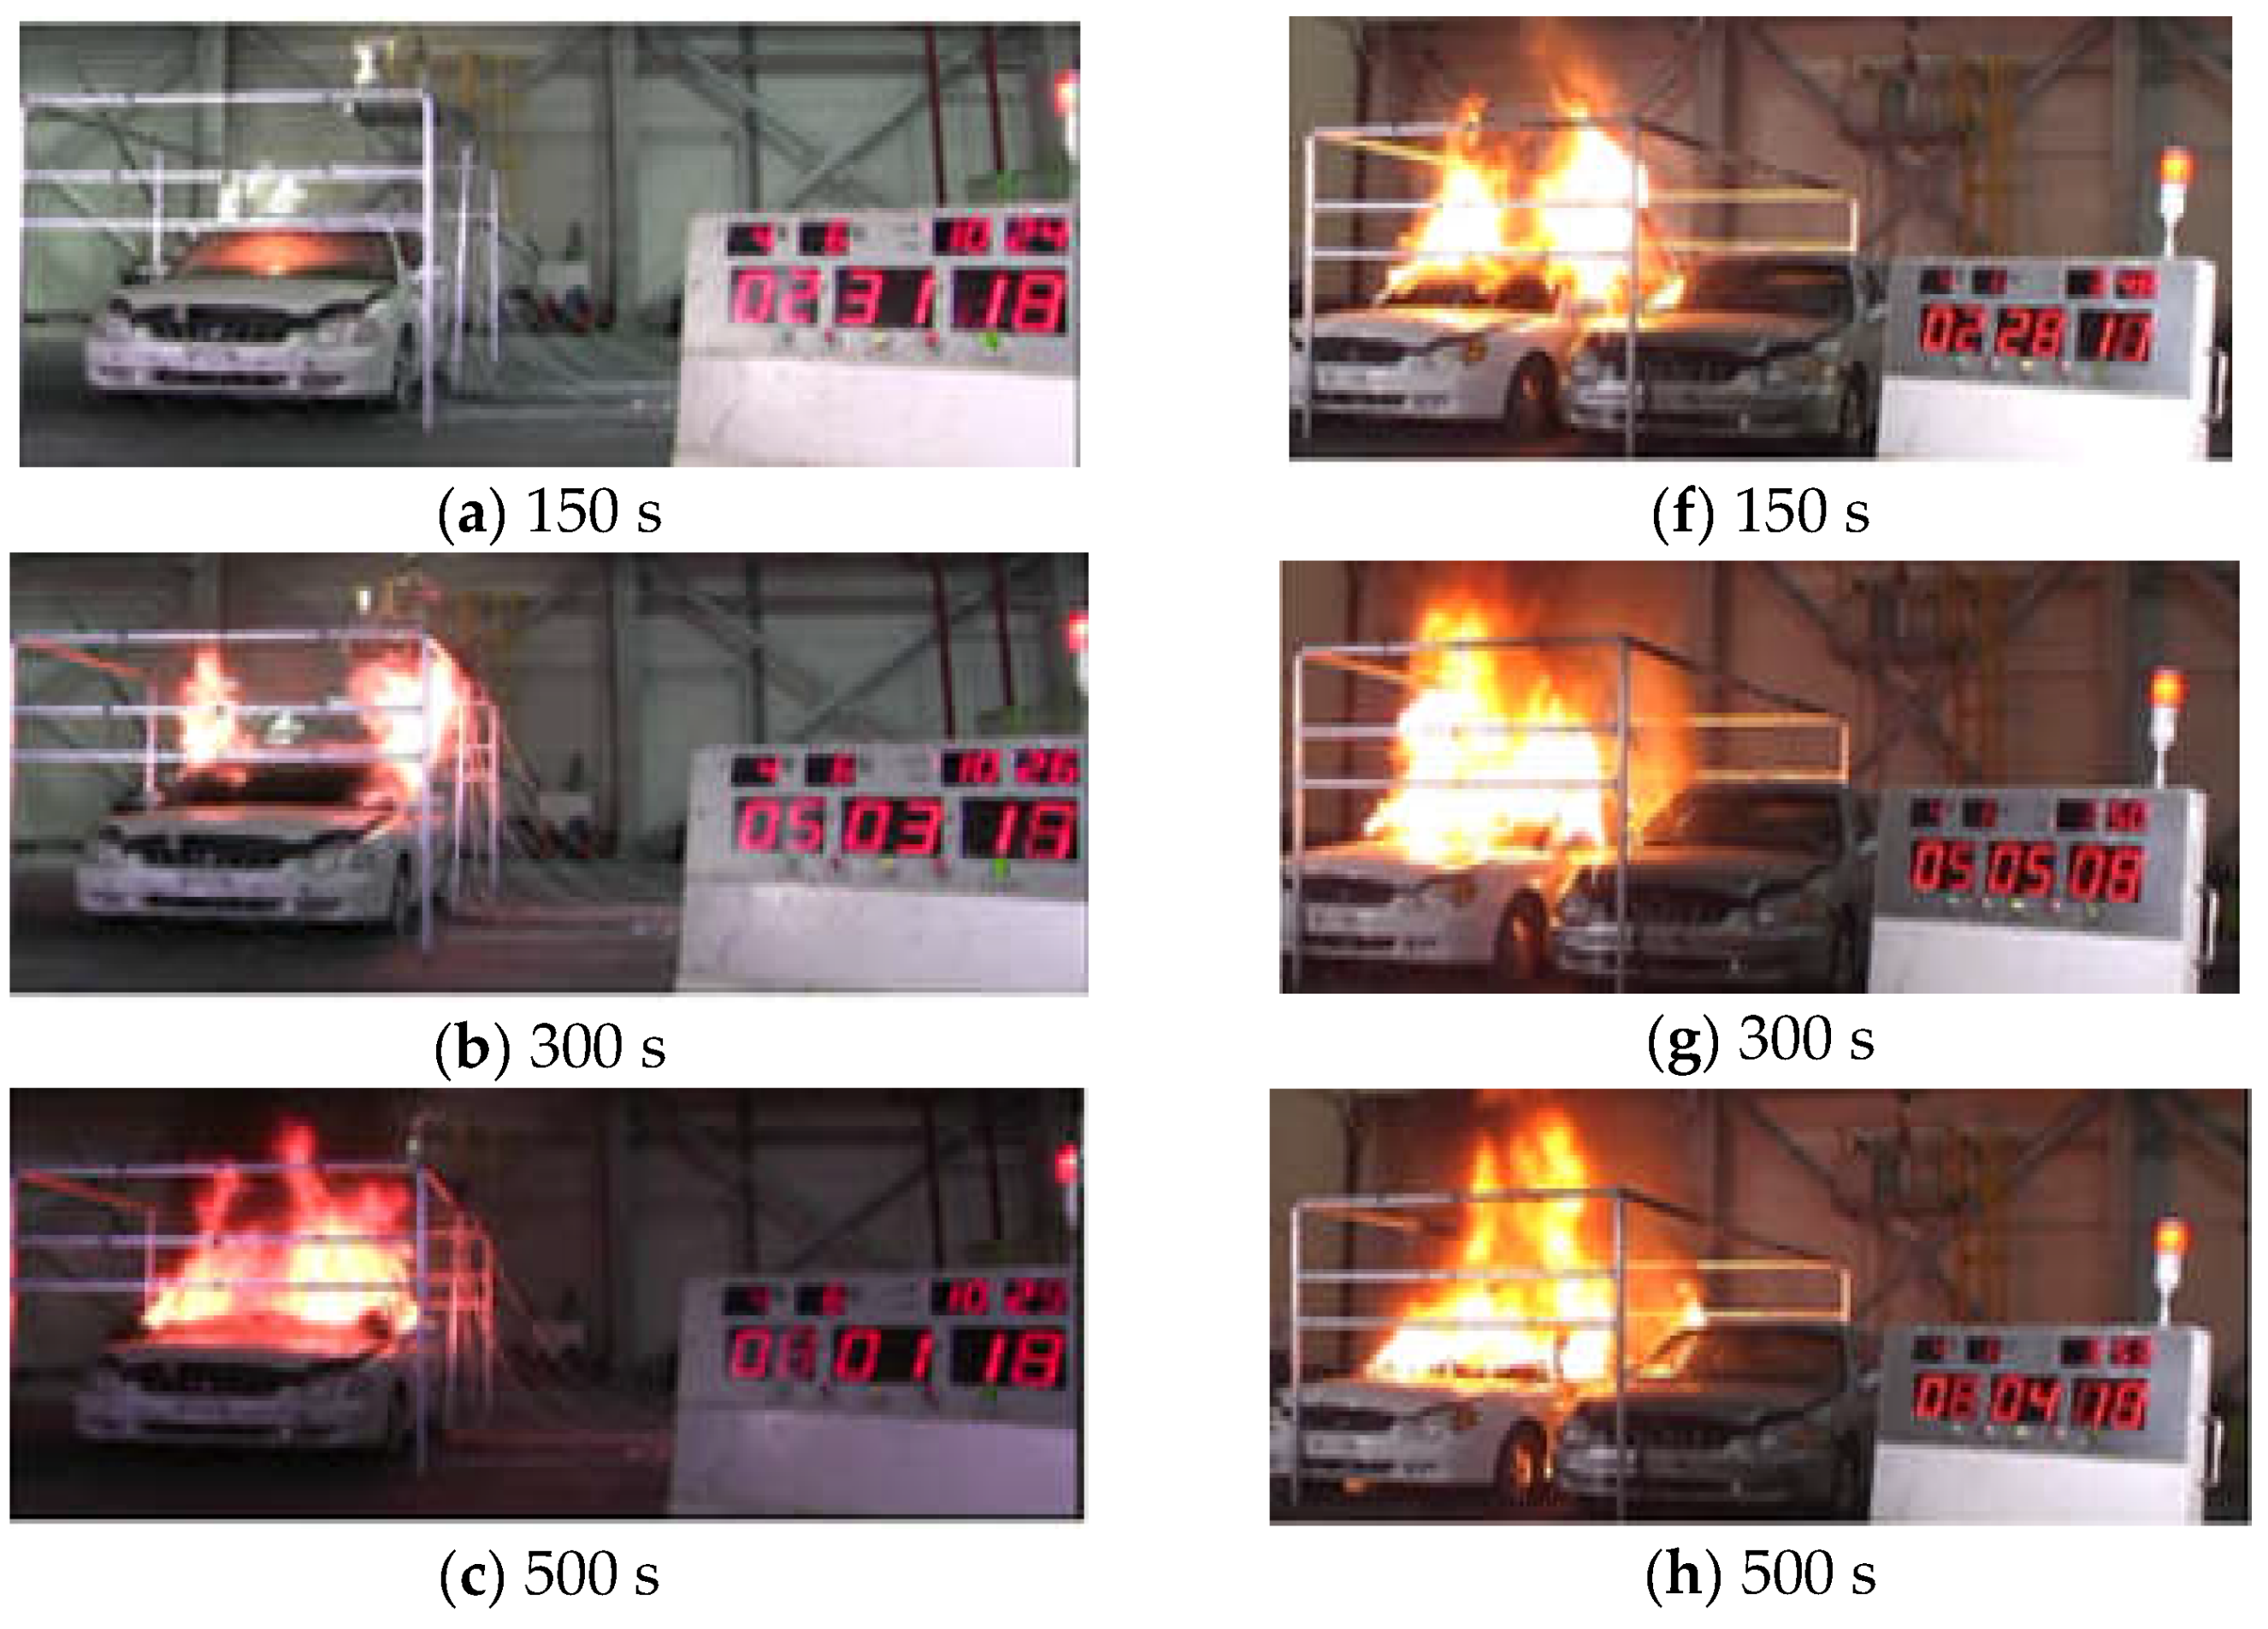
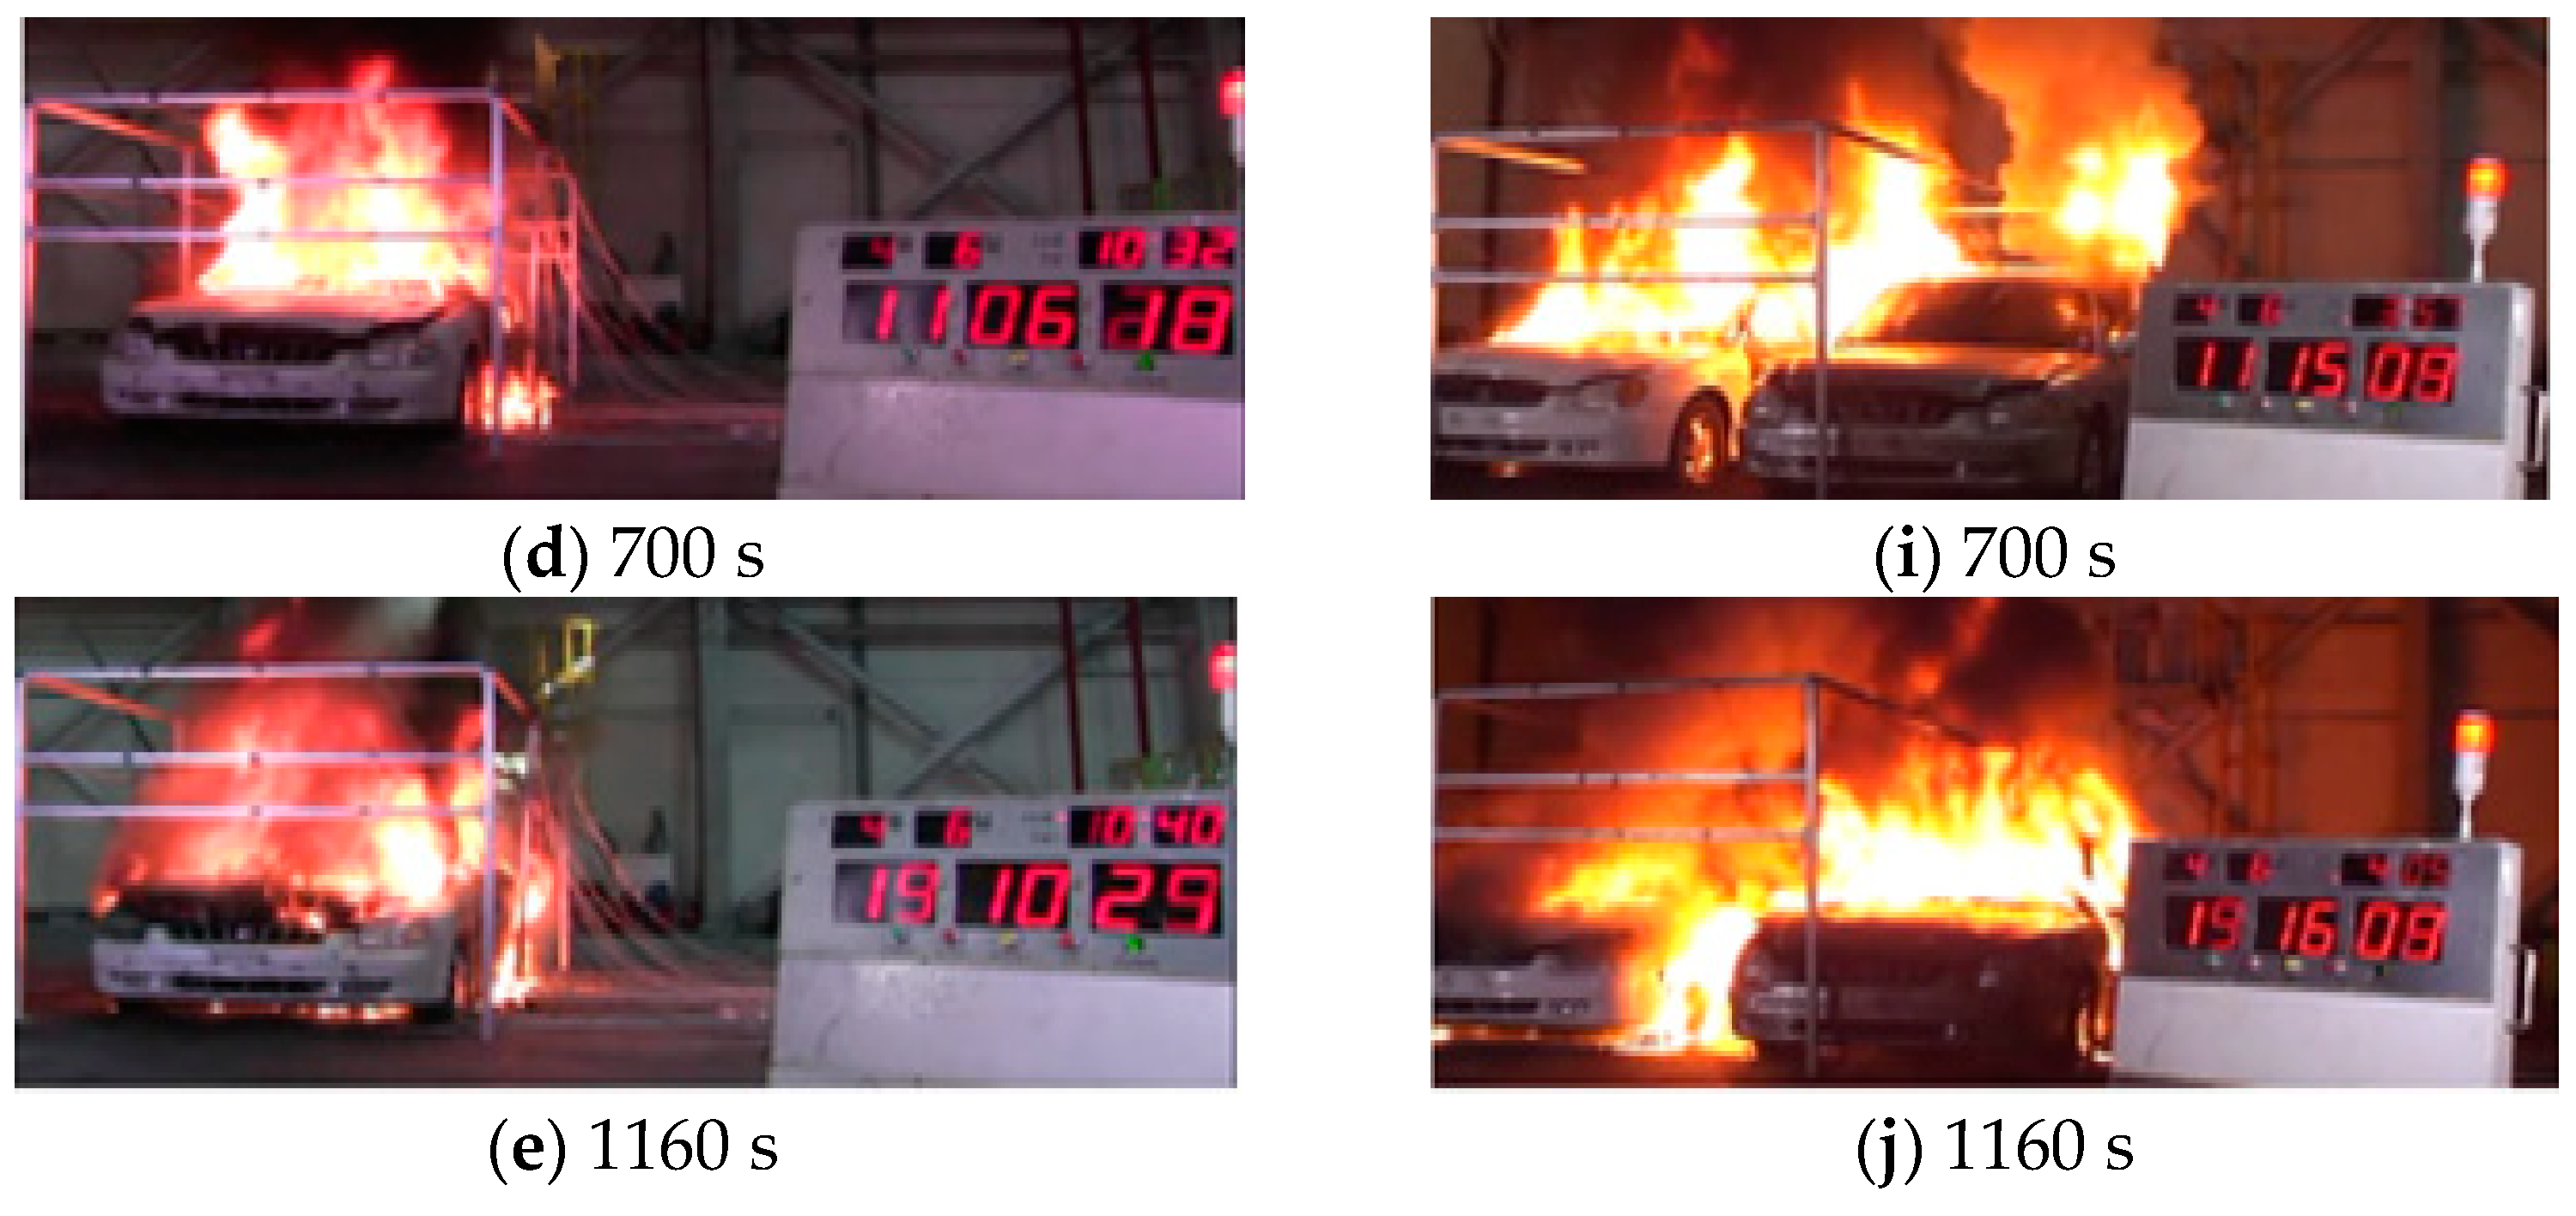
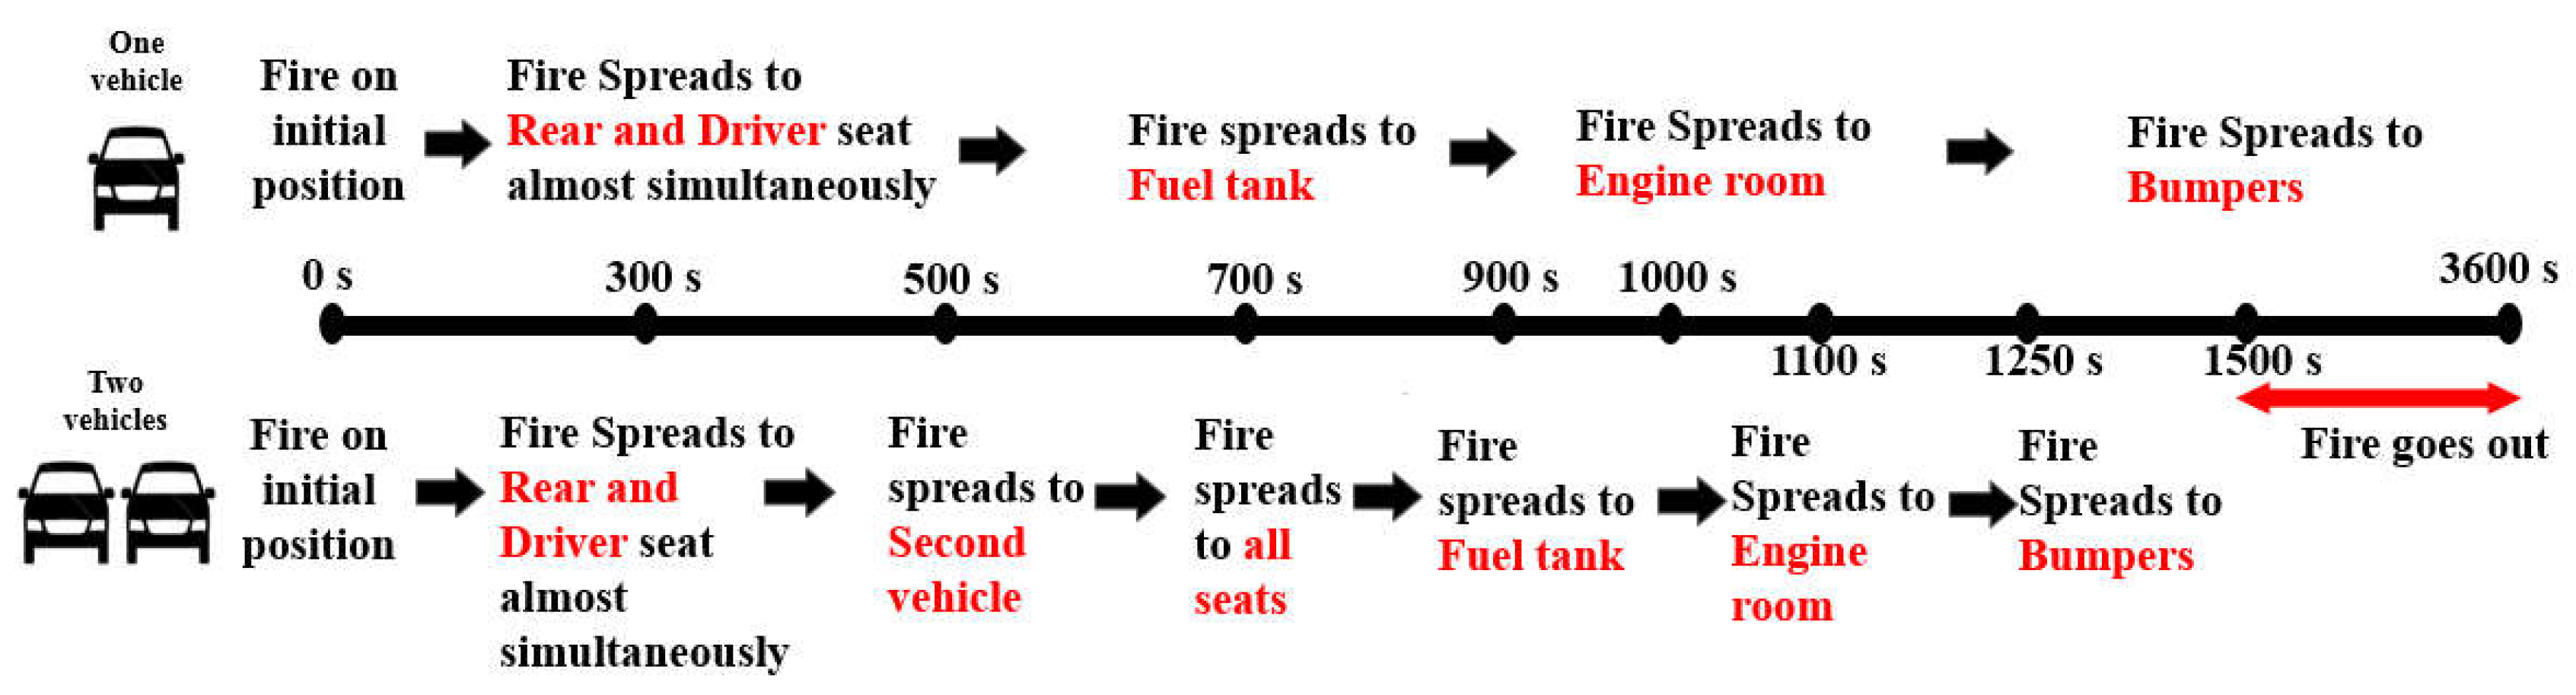
- In actual vehicle tests, the fire spread from the initial ignition location to the rear seat, engine room, fuel tank, and bumper in regular sequence. In the two-vehicle situation, a similar tendency was observed, and the fire spread to the next vehicle after about 500 s (8 min 20 s).
- (2)
- The fire rose sharply after 200 s (3 min). The maximum heat release rates of one and two vehicles were represented as 3.5 MW and 6 MW, reached at about 1540 s (25 min 40 s) and 1160 s (19 min 20 s), respectively. Since the time to reach 1 MW was about 240 s (4 min) before and after, the fire growth in a vehicle fire is considered to be a medium-fast fire phenomenon.
- (3)
- The evacuation should be totally completed within 20 min after the fire starts, because of the high concentrations of carbon dioxide and carbon monoxide in an enclosed space. This may vary, depending on the size of the location where the fire occurs.
- (4)
Author Contributions
Funding
Conflicts of Interest
Appendix A. Fire-Growth Coefficients for Vehicle Fires

| Time | One Vehicle | Two Vehicles | Time | One Vehicle | Two Vehicles |
|---|---|---|---|---|---|
| 55 | 0.000122845 | 0 | 111 | –0.00003228 | 0 |
| 56 | 0.000110589 | 0 | 112 | –0.000100544 | 0 |
| 57 | 0.000111826 | 0 | 113 | –0.000102829 | 0 |
| 58 | 0.000119181 | 0 | 114 | –0.000125789 | 0 |
| 59 | 0.000151472 | 0 | 115 | –0.000112598 | 0 |
| 60 | 0.000143496 | 0 | 116 | –0.000120963 | 0 |
| 61 | 0.000141763 | 0 | 117 | –0.000118931 | 0 |
| 62 | 0.000142229 | 0 | 118 | –0.000123675 | 0 |
| 63 | 0.00014096 | 0 | 119 | –0.000136618 | 0 |
| 64 | 0.00013857 | 0 | 120 | –0.000132197 | 0 |
| 65 | 0.000130619 | 0 | 121 | –0.000123733 | 0 |
| 66 | 0.000143594 | 0 | 122 | 0.000045496 | 0 |
| 67 | 0.000153154 | 0 | 123 | 5.5872E-06 | 0 |
| 68 | 0.000143394 | 0 | 124 | 4.16544E-05 | 0 |
| 69 | 0.000115387 | 0 | 125 | 3059376E-05 | 0 |
| 70 | 0.000326219 | 0 | 126 | 3.63424E-05 | 0 |
| 71 | 0.000223675 | 0 | 127 | 3.67568E-05 | 0 |
| 72 | 0.000277621 | 0 | 128 | 2.67056E-05 | 0 |
| 73 | 0.000272314 | 0 | 129 | –1.11936E-05 | 0 |
| 74 | 0.000274293 | 0 | 130 | 1.77728E-05 | 0 |
| 75 | 0.000288267 | 0 | 131 | 9.4848E-06 | 0 |
| 76 | 0.000282707 | 0 | 132 | 1.01104E-05 | 0 |
| 77 | 0.000298621 | 0 | 133 | –3.34768E-05 | 0 |
| 78 | 0.000276741 | 0 | 134 | 0.00000116 | 0 |
| 79 | 0.000281992 | 0 | 135 | 0.000144683 | 0 |
| 80 | 0.000264557 | 0 | 136 | 0.000136411 | 0 |
| 81 | 0.000300158 | 0 | 137 | 0.000158899 | 0 |
| 82 | 0.000287592 | 0 | 138 | 0.000142838 | 0 |
| 83 | 0.000257986 | 0 | 139 | 0.000129723 | 0 |
| 84 | 0.000279203 | 0 | 140 | 0.000139946 | 0 |
| 85 | 0.000259619 | 0 | 141 | 0.000131667 | 0 |
| 86 | 0.000282691 | 0 | 142 | 0.000127328 | 0 |
| 87 | 0.000290432 | 0 | 143 | 0.000127696 | 0 |
| 88 | 0.000129774 | 0 | 144 | 0.000236862 | 0 |
| 89 | 0.000130891 | 0 | 145 | 0.000222347 | 0 |
| 90 | 0.000116182 | 0 | 146 | 0.000211238 | 0 |
| 91 | 0.000112029 | 0 | 147 | 0.000220477 | 0 |
| 92 | 0.000117714 | 0 | 148 | 0.000215518 | 0 |
| 93 | 0.000104933 | 0 | 149 | 0.00025139 | 0 |
| 94 | 0.00010421 | 0 | 150 | 0.00021375 | 0 |
| 95 | 0.000104573 | 0 | 151 | 0.000351069 | 0 |
| 96 | 0.000099011 | 0 | 152 | 0.000364856 | 0 |
| 97 | 0.0000978 | 0 | 153 | 0.000371894 | 0 |
| 98 | 0.00009746 | 0 | 154 | 0.00035011 | 0 |
| 99 | 0.0000985872 | 0 | 155 | 0.000354869 | 0 |
| 100 | 0.000088056 | 0 | 156 | 0.000278704 | 0 |
| 101 | 0.000102904 | 0 | 157 | 0.000365112 | 0 |
| 102 | 0.0000951808 | 0 | 158 | 0.00045428 | 0 |
| 103 | 0.000102624 | 0 | 159 | 0.00038917 | 0 |
| 104 | –1.50448E-05 | 0 | 160 | 0.000341139 | 0 |
| 105 | –9.12816E-05 | 0 | 161 | 0.000341352 | 0 |
| 106 | –0.000100579 | 0 | 162 | 0.000358957 | 0 |
| 107 | –9.69392E-05 | 0 | 163 | 0.000454278 | 0 |
| 108 | –9.98464E-05 | 0 | 164 | 0.000407691 | 0 |
| 109 | –2.65664E-05 | 0 | 165 | 0.000914008 | 0 |
| 110 | –3.36192E-05 | 0 | 166 | 0.000862808 | 0 |
| 167 | 0.001054307 | 0.000220694 | 203 | 0.0100165 | 0.0120997 |
| 168 | 0.001063165 | 0.000611402 | 204 | 0.0110054 | 0.0114384 |
| 169 | 0.00104391 | 0.00068039 | 205 | 0.0110963 | 0.0124061 |
| 170 | 0.001228091 | 0.000880261 | 206 | 0.0101954 | 010114076 |
| 171 | 0.001635272 | 0.000812598 | 207 | 0.0104325 | 0.0122057 |
| 172 | 0.001834352 | 0.001029643 | 208 | 0.0106026 | 0.0121818 |
| 173 | 0.001916245 | 0.001240034 | 209 | 0.0111004 | 0.0124914 |
| 174 | 0.00199748 | 0.002309933 | 210 | 0.0111064 | 0.0135382 |
| 175 | 0.001945301 | 0.002533862 | 211 | 0.0126027 | 0.0129667 |
| 176 | 0.002285653 | 0.002699115 | 212 | 0.0107972 | 0.01428483 |
| 177 | 0.002352554 | 0.002952645 | 213 | 0.011416 | 0.0135615 |
| 178 | 0.002293226 | 0.002970237 | 214 | 0.0117953 | 0.0138855 |
| 179 | 0.003488533 | 0.003338856 | 215 | 0.0112167 | 0.0142959 |
| 180 | 0.003595838 | 0.003579187 | 216 | 0.0117955 | 0.0135957 |
| 181 | 0.003715666 | 0.00413451 | 217 | 0.0123651 | 0.0139167 |
| 182 | 0.004403666 | 0.0041032 | 218 | 0.011948 | 0.0153101 |
| 183 | 0.004578416 | 0.004038008 | 219 | 0.0121137 | 0.013121 |
| 184 | 0.00505969 | 0.005178826 | 220 | 0.0118276 | 0.0146671 |
| 185 | 0.004863582 | 0.006157565 | 221 | 0.0121345 | 0.0160241 |
| 186 | 0.005264023 | 0.007279477 | 222 | 0.0121715 | 0.0140538 |
| 187 | 0.005925605 | 0.007346544 | 223 | 0.0121353 | 0.0150714 |
| 188 | 0.005557421 | 0.006510378 | 224 | 0.0125515 | 0.0146725 |
| 189 | 0.006212605 | 0.007681355 | 225 | 0.0120098 | 0.0150361 |
| 190 | 0.006590218 | 0.007854469 | 226 | 0.0126213 | 0.0147933 |
| 191 | 0.005883032 | 0.007422917 | 227 | 0.0113123 | 0.0146584 |
| 192 | 0.003584963 | 0.007919211 | 228 | 0.0113451 | 0.0153618 |
| 193 | 0.0066938 | 0.0087581 | 229 | 0.0112896 | 0.0158492 |
| 194 | 0.0082796 | 0.0090616 | 230 | 0.0117224 | 0.0150186 |
| 195 | 0.008573 | 0.0095076 | 231 | 0.0121374 | 0.0151767 |
| 196 | 0.0081337 | 0.010333 | 232 | 0.0122526 | 0.0159671 |
| 197 | 0.0084333 | 0.0105719 | 233 | 0.0122324 | 0.0157199 |
| 198 | 0.0092459 | 0.0096946 | 234 | 0.0120766 | 0.0158552 |
| 199 | 0.0098028 | 0.0101741 | 235 | 0.0121153 | 0.0149351 |
| 200 | 0.0101057 | 0.0114833 | 236 | 0.0119933 | 0.0169582 |
| 201 | 0.009347 | 0.011416 | 237 | 0.0112681 | 0.0161582 |
| 202 | 0.0100612 | 0.0113177 | 238 | 0.0123996 | 0.016821 |
References
- Li, Y.; Spearpoint, M. Analysis of vehicle fire statistics in New Zealand parking buildings. Fire Technol. 2007, 43, 93–106. [Google Scholar] [CrossRef]
- Babrauskas, V. The Cone Calorimeter. In SFPE Handbook of Fire Protection Engineering; Springer: New York, NY, USA, 2016; pp. 952–980. [Google Scholar]
- Wang, Z.; Hu, X.; Jia, F.; Galea, E.R. A two-step method for predicting time to flashover in room corner test fires using cone calorimeter data. Fire Mater. 2012, 37, 457–473. [Google Scholar] [CrossRef]
- Lai, C.M.; Ho, M.C.; Lin, T.H. Experimental Investigations of Fire Spread and Flashover Time in Office Fires. J. Fire Sci. 2010, 28, 279–302. [Google Scholar] [CrossRef]
- Hakkarainen, T. Rate of Heat Release and Ignitability Indices in Predicting SBI Test Results. J. Fire Sci. 2001, 19, 284–305. [Google Scholar] [CrossRef]
- Katsuhiro, O.; Norimichi, W.; Yasuaki, H.; Tadaomi, C.; Ryoji, M.; Hitoshi, M.; Satoshi, O.; Hideki, S.; Yohsuke, T.; Kimio, H.; et al. Burning behavior of sedan passenger cars. Fire Saf. J. 2009, 44, 301–310. [Google Scholar] [CrossRef]
- Mangs, J.; Keski-Rahkonen, O. Characterization of the Fire Behaviour of a Burning Passenger Car. Part1: Car Fire Experiments. Fire Saf. J. 1994, 23, 17–35. [Google Scholar] [CrossRef]
- Katsuhiro, O.; Takuma, O.; Hiroki, M.; Masakatsu, H.; Norimichi, W. Burning behavior of minivan passenger cars. Fire Saf. J. 2013, 62, 272–280. [Google Scholar] [CrossRef]
- Li, D.; Zhu, G.; Zhu, H.; Yu, Z.; Gao, Y.; Jiang, X. Flame spread and smoke temperature of full-scale fire test of car fire. Case Stud. Therm. Eng. 2017, 10, 315–324. [Google Scholar] [CrossRef]
- Loladze, I. Rising atmospheric CO2 and human nutrition: Toward globally imbalanced plant stoichiometry? Trends Ecol. Evol. 2002, 17, 457–461. [Google Scholar] [CrossRef]
- Bailey, J.E.; Argyropoulos, S.V.; Kendrick, A.H.; Nutt, D.J. Behavior and Cardiovascular Effects of 7.5% CO2 in Human Volunteers. Med. J. Aust. 2005, 21, 18–25. [Google Scholar] [CrossRef]
- Mayr, F.B.; Spiel, A.; Leitner, J.; Marsik, C.; Germann, P.; Ullrich, R.; Wagner, O.; Jilma, B. Effects of Carbon Monoxide inhalation during Experimental Endotoxemia in Humans. Am. J. Respir. Crit. Care Med. 2005, 171, 354–360. [Google Scholar] [CrossRef] [PubMed]
- Truchot, B.; Fouillen, F.; Collet, S. An experimental evaluation of toxic gas emissions from vehicle fires. Fire Saf. J. 2018, 97, 111–118. [Google Scholar] [CrossRef]
- Deckers, X.; Haga, S.; Sette, B.; Merci, B. Smoke control in case of fire in a large car park: Full-scale experiments. Fire Saf. J. 2013, 57, 11–21. [Google Scholar] [CrossRef]
- Yan, Z.; Guo, Q.; Zhu, H. Full-scale experiments on fire characteristics of road tunnel at high altitude. Tunn. Undergr. Space Technol. 2017, 66, 134–146. [Google Scholar] [CrossRef]
- Blanchard, E.; Boulet, P.; Desanghere, S.; Cesmat, E.; Meyrand, R.; Garo, J.P.; Vantelon, J.P. Experimental and numerical study of fire in a midscale test tunnel. Fire Saf. J. 2012, 47, 18–31. [Google Scholar] [CrossRef]
- Lonnermark, A.; Ingason, H. Fire Spread and Flame Length in Large-Scale Tunnel Fires. Fire Technol. J. 2006, 42, 283–302. [Google Scholar] [CrossRef]
- Horvath, I.; Beeck, J.V.; Merci, B. Full-scale and reduced-scale tests on smoke movement in case of car park fire. Fire Saf. J. 2013, 57, 35–43. [Google Scholar] [CrossRef]
- Ingason, H. Model scale railcar fire tests. Fire Saf. J. 2007, 42, 271–282. [Google Scholar] [CrossRef]
- Lee, S.R.; Ryou, H.S. An experimental study of the effect of the aspect ratio on the critical velocity in longitudinal ventilation tunnel fires. Fire Sci. J. 2005, 23, 119–138. [Google Scholar] [CrossRef]
- Lee, S.R.; Ryou, H.S. A numerical study on smoke movement in longitudinal ventilation tunnel fires for different aspect ratio. Build. Environ. J. 2006, 41, 719–725. [Google Scholar] [CrossRef]
- Baek, D.; Bae, S.; Ryou, H.S. A numerical study on the effect of the hydraulic diameter of tunnels on the plug-holing phenomena in shallow underground tunnels. J. Mech. Sci. Technol. 2017, 31, 2331–2338. [Google Scholar] [CrossRef]
- Baek, D.; Sung, K.H.; Ryou, H.S. Experimental study on the effect of heat release rate and aspect ratio of tunnel on the plug-holing phenomena in shallow underground tunnels. Int. J. Heat Mass Transf. 2017, 113, 1135–1141. [Google Scholar] [CrossRef]
- McCaffrey, B. Flame Height. In SFPE Handbook of Fire Protection Engineering, 2nd ed.; National Fire Protection Assoc.: Quincy, MA, USA, 1995. [Google Scholar]
- Heskestad, G. Fire Plumes. In SFPE Handbook of Fire Protection Engineering, 2nd ed.; National Fire Protection Assoc.: Quincy, MA, USA, 1995. [Google Scholar]
- Melcher, T.; Zonke, R.; Trott, M.; Krause, U. Experimental investigations on the repeatability of real scale fire test. Fire Saf. J. 2016, 82, 101–114. [Google Scholar] [CrossRef]
- Park, Y.; Lee, Y.; Na, J.; Ryou, H.S. Numerical Study on the Effect of Tunnel Aspect Ratio on Evacuation with Unsteady Heat Release Rate Due to Fire in the Case of Two Vehicles. Energies 2019, 12, 133. [Google Scholar] [CrossRef]
- Shipp, M.; Spearpoint, M. Measurements of the severity of fires involving private motor vehicles. Fire Mater. 1995, 19, 143–151. [Google Scholar] [CrossRef]
- Ingason, H. An Overview of Vehicle Fires in Tunnels; SP Swedish National Testing and Research Institute: Boras, Sweden, 2001. [Google Scholar]
- Agency for Toxic Substances and Disease Registry (ATSDR). Available online: www.atsdr.cdc.gov/2012 (accessed on 27 February 2019).


| Measurement | Specification |
|---|---|
| Duct pressure difference | Output: 4–20 mA, Range: 0–1245 Pa Model: PADT-D1000 Pa |
| Duct Temperature | K-type wire, Range: −200–1000 °C |
| Gas Analyzer | Output: 4–20 mA, Range: O2 20.95%, CO2 8%, CO 0.8% Model: Servomax 4100 |
| Laser | Output: 0–8.4 mV, Range: 0–100% Model: 25-LHP-213-249 |
| Load Cell | Output: 4–20 mA, Range: 0–3000 kg Manufacturer: Sartorious |
| Heat Flux | Plate Type, Range: −200–1000 °C Model: GTW-10-32-485A |
| Mass Flow | Output: 4–20 mA, Range: 0–2500 L/min Model: DPE-S |
| Time (s) After Ignition | Fire Reaches Maximum Temperature and Goes Out | |
|---|---|---|
| First Vehicle | Second Vehicle | |
| 0 | Ignition in passenger seat | |
| 150 | Fires active in passenger seat | |
| 300 | Fire spreads to driver and rear seats almost simultaneously | |
| 500 | - | Fire spreads to the second vehicle |
| 700 | Fire spreads to fuel tank | Fire dramatically spreads to seats |
| 900 | - | Fire spreads to fuel tank |
| 1000 | Fire spreads to engine room | - |
| 1100 | - | Fire spreads to engine room |
| 1250 | - | Fire spreads to bumpers |
| 1500 | Fire spreads to bumpers | - |
| 1500–3600 | Fire goes out | Fire goes out |
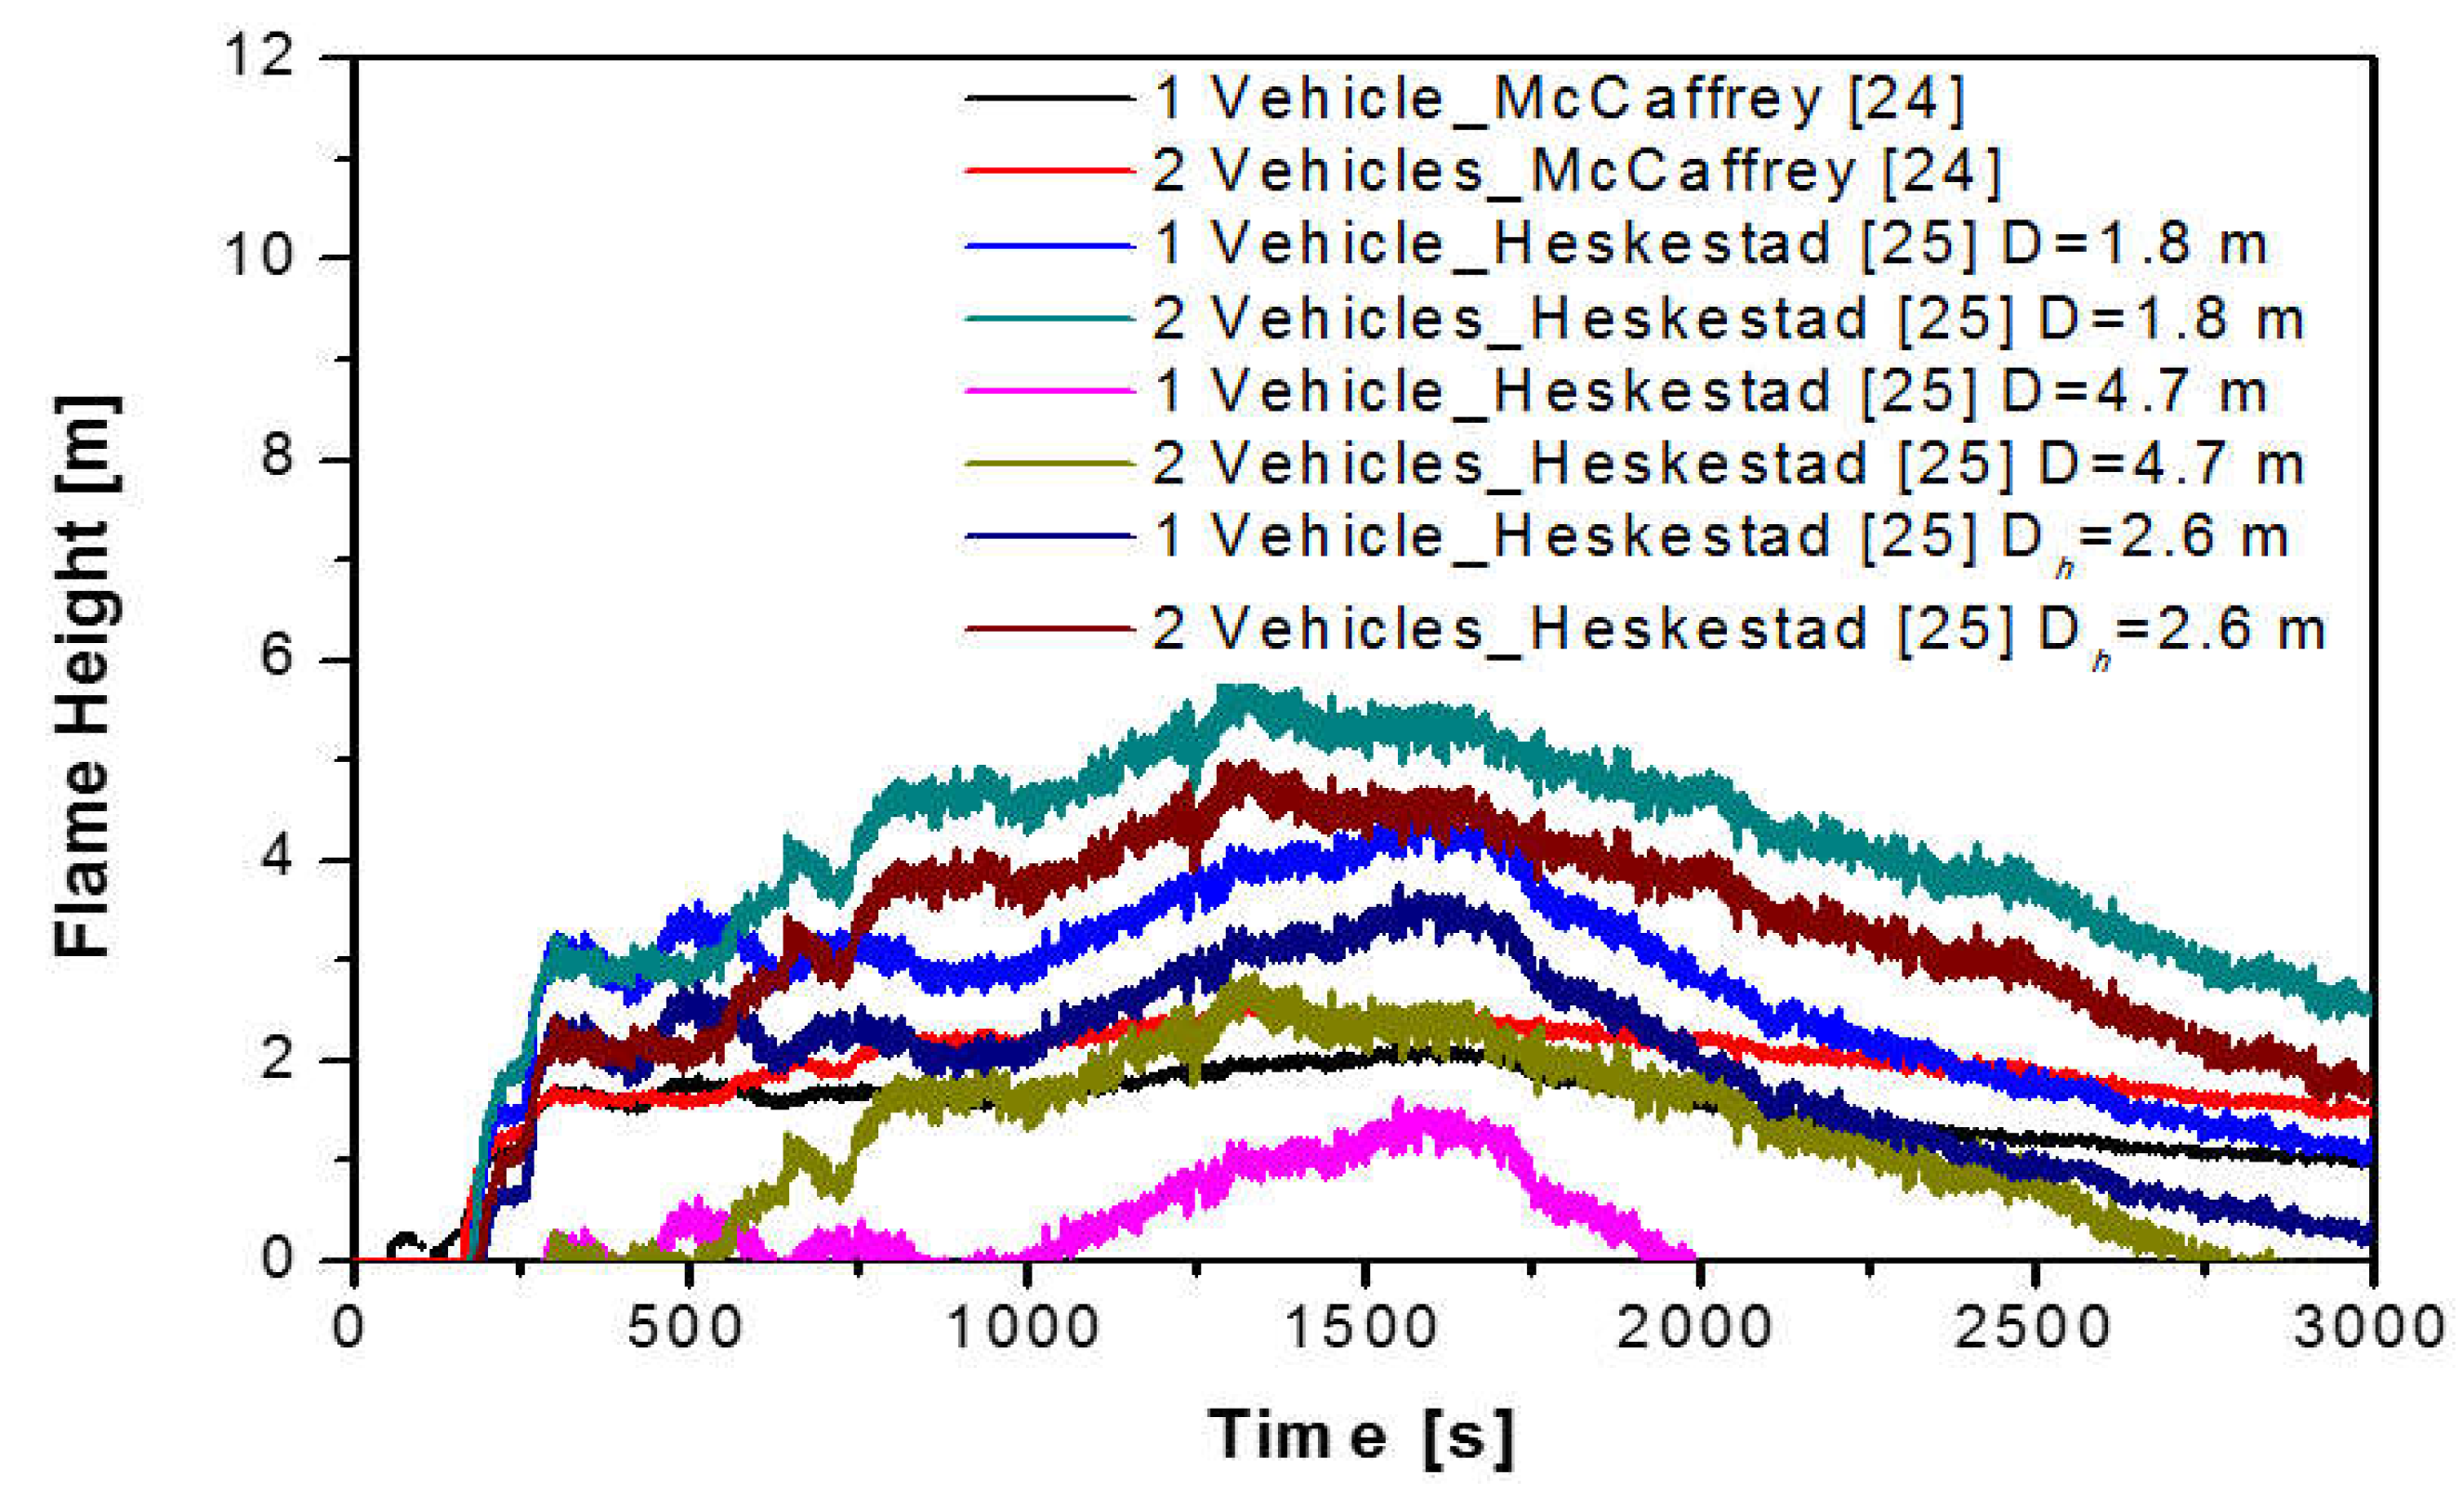
| Number of Vehicle | Maximum Flame Height (m) | |||
|---|---|---|---|---|
| McCaffrey [24] | Heskestad [25] | |||
| - | D = 1.8 | D = 4.7 | Dh = 2.6 | |
| One | 2.1 | 4.3 | 1.35 | 3.49 |
| Two | 2.6 | 7.6 | 2.83 | 4.97 |
| Type of Vehicles | Maximum Heat Release Rate (MW) | |||
|---|---|---|---|---|
| Okamoto et al. [6] | Shipp et al. [28] | Ingason [29] | Park et al. | |
| Small passenger car | 3.5 | 8 | 2.5 | 3.5 |
| Large passenger car | 4.2 | - | <5 | - |
| 2 passenger cars | - | - | 3.5–10 | 6 |
| Section | CO2 Concentration (ppm) | Effect on Health [30] | ||
|---|---|---|---|---|
| One Car | Two Cars | One Car | Two Cars | |
| Section 1 | 1000–3000 | General condition and mild headaches | ||
| Section 2 | 3000 | Poor air condition and headaches | ||
| Section 3 | 3000 | 4500–6200 | Poor air condition and headaches | |
| Section 4 | 3000–3500 | 6500–8000 | Headaches | Respiratory, circulatory, and cerebral impairment |
| Section | CO Concentration (ppm) | Effect on Health [30] | ||
|---|---|---|---|---|
| One Car | Two Cars | One Car | Two Cars | |
| Section 1 | 0–50 | 0–100 | Slight headaches | |
| Section 2 | 75–150 | Headaches | ||
| Section 3 | 100–125 | 150–225 | Headaches | Dizziness, nausea, fatigue, headaches |
| Section 4 | 150–175 | 300–425 | Dizziness, nausea, fatigue, headaches | Headache and nausea; life threatening in 3 h |
© 2019 by the authors. Licensee MDPI, Basel, Switzerland. This article is an open access article distributed under the terms and conditions of the Creative Commons Attribution (CC BY) license (http://creativecommons.org/licenses/by/4.0/).
Share and Cite
Park, Y.; Ryu, J.; Ryou, H.S. Experimental Study on the Fire-Spreading Characteristics and Heat Release Rates of Burning Vehicles Using a Large-Scale Calorimeter. Energies 2019, 12, 1465. https://doi.org/10.3390/en12081465
Park Y, Ryu J, Ryou HS. Experimental Study on the Fire-Spreading Characteristics and Heat Release Rates of Burning Vehicles Using a Large-Scale Calorimeter. Energies. 2019; 12(8):1465. https://doi.org/10.3390/en12081465
Chicago/Turabian StylePark, Younggi, Jaiyoung Ryu, and Hong Sun Ryou. 2019. "Experimental Study on the Fire-Spreading Characteristics and Heat Release Rates of Burning Vehicles Using a Large-Scale Calorimeter" Energies 12, no. 8: 1465. https://doi.org/10.3390/en12081465
APA StylePark, Y., Ryu, J., & Ryou, H. S. (2019). Experimental Study on the Fire-Spreading Characteristics and Heat Release Rates of Burning Vehicles Using a Large-Scale Calorimeter. Energies, 12(8), 1465. https://doi.org/10.3390/en12081465