Experimental Investigation of the Ventilation Performance of Different Air Distribution Systems in an Office Environment—Cooling Mode


Abstract
1. Introduction
2. Theory and Mathematical Models
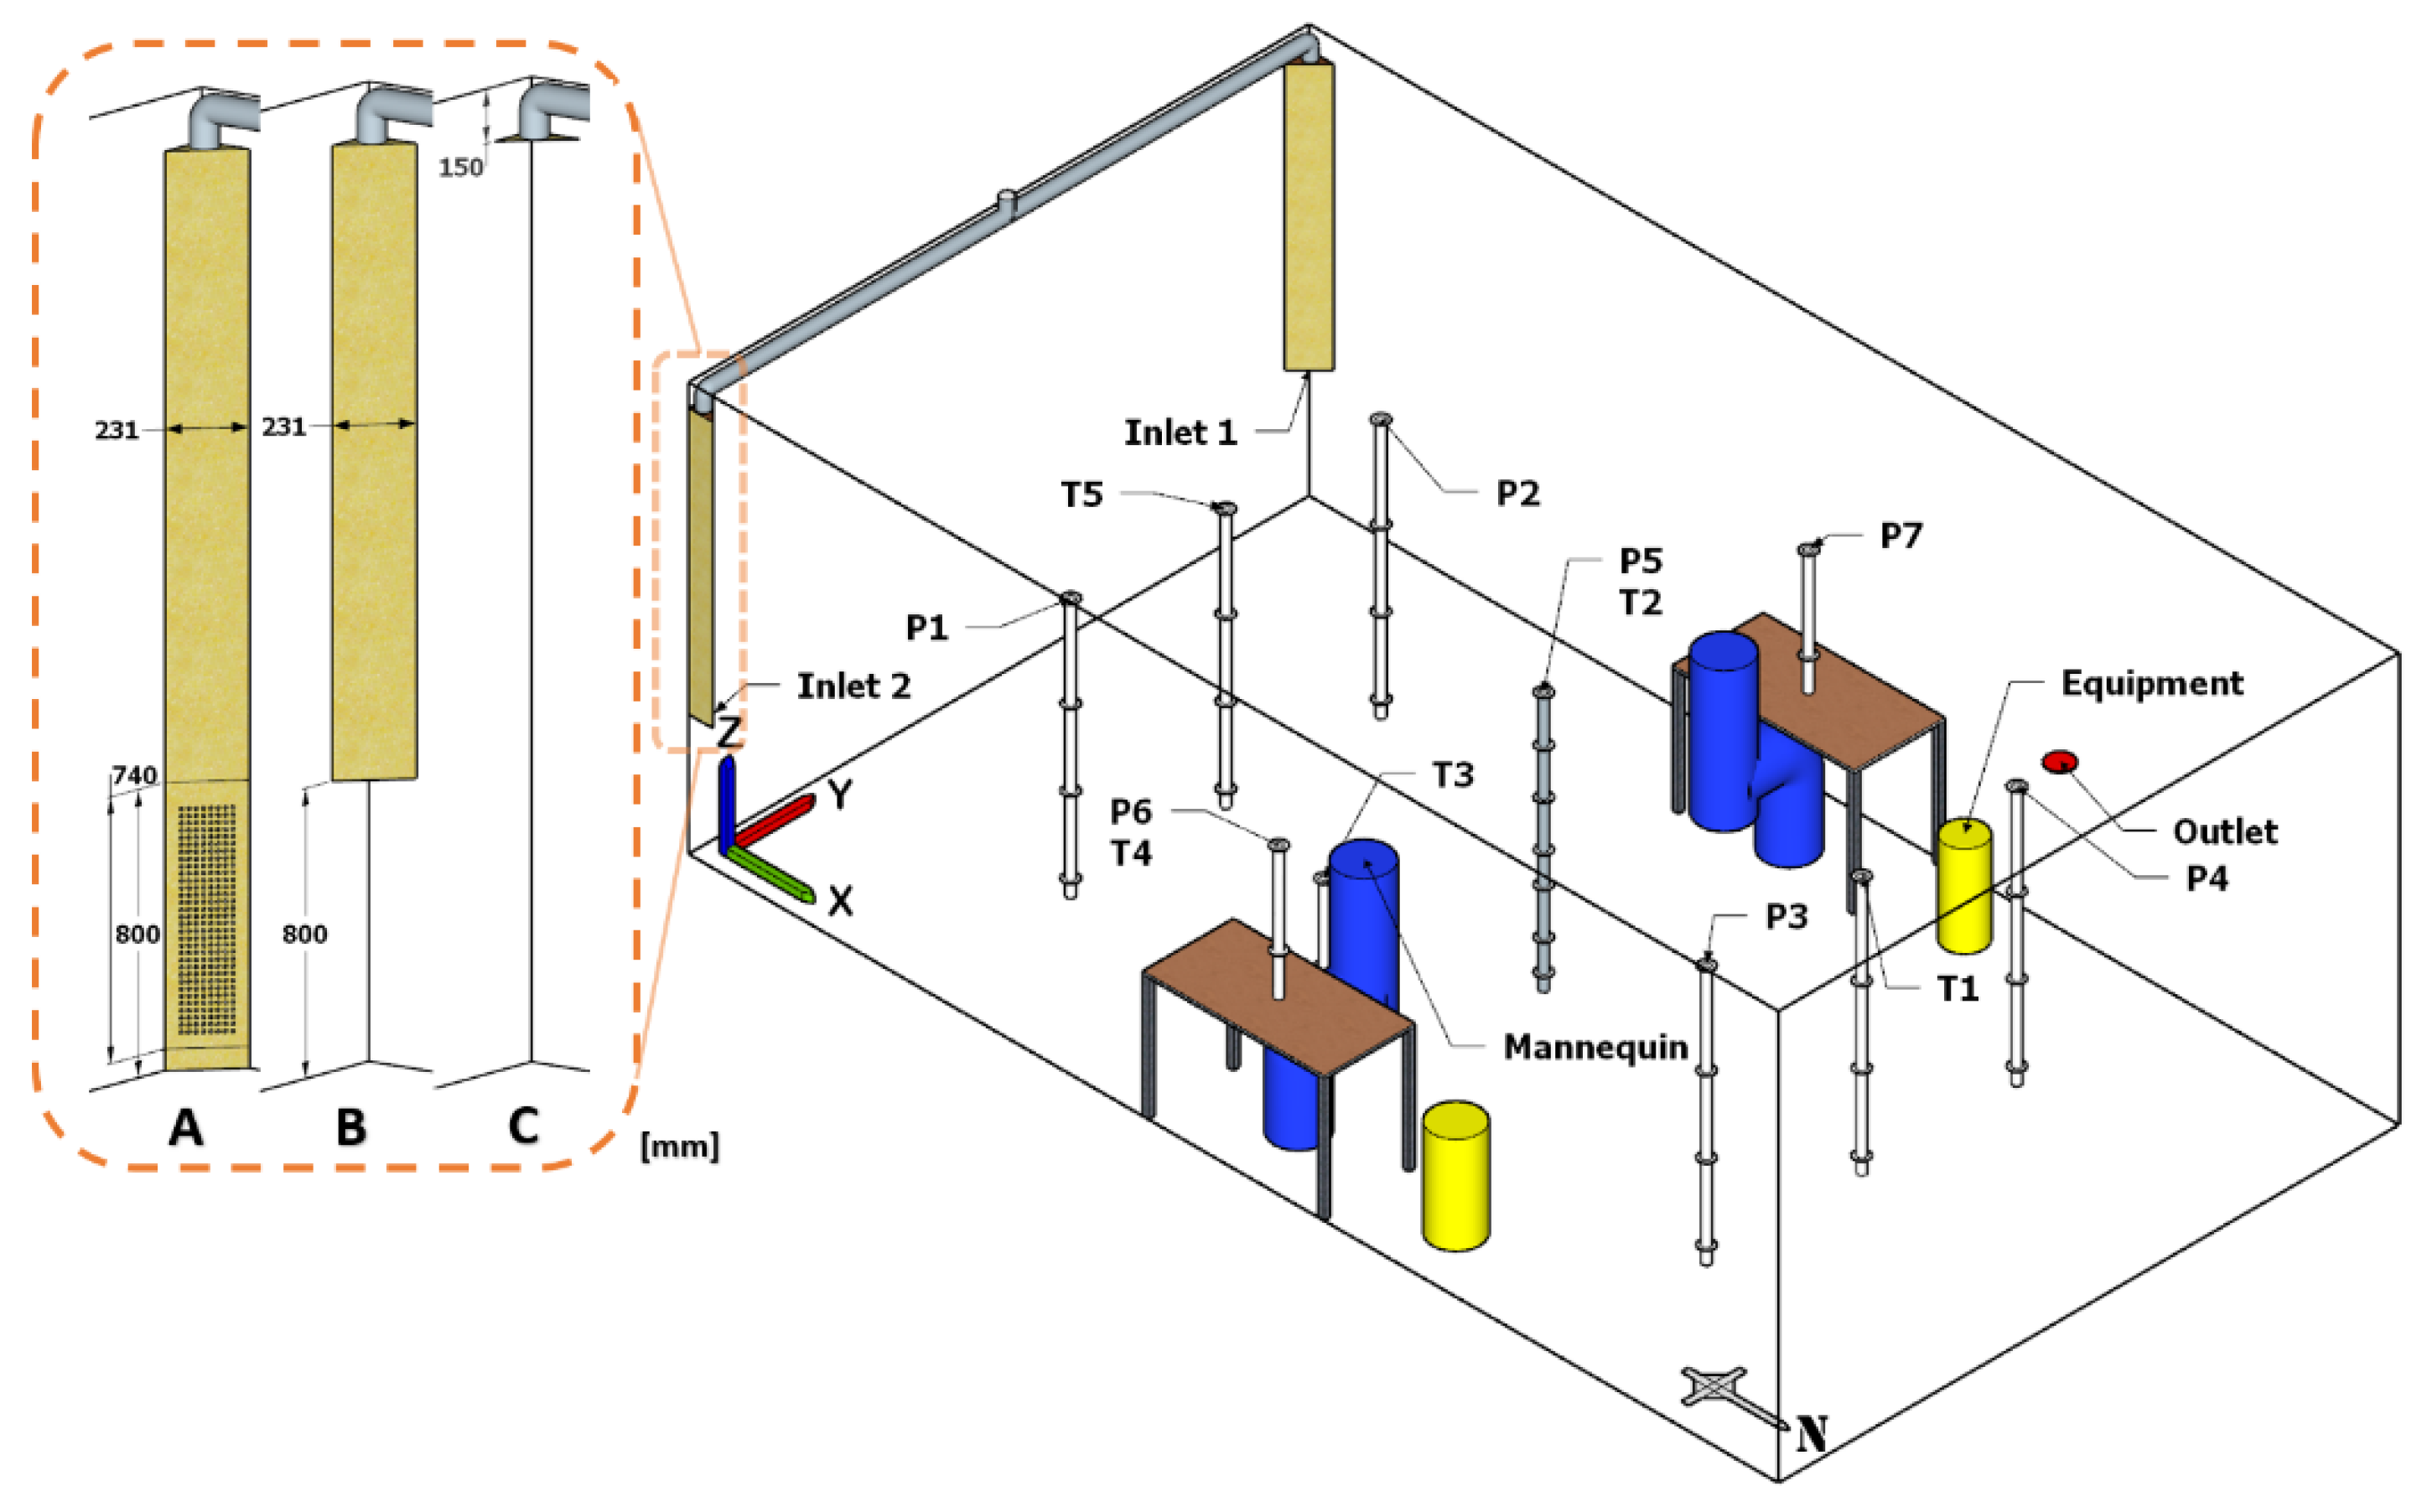
3. Experimental Set-Up
4. Results and Discussion
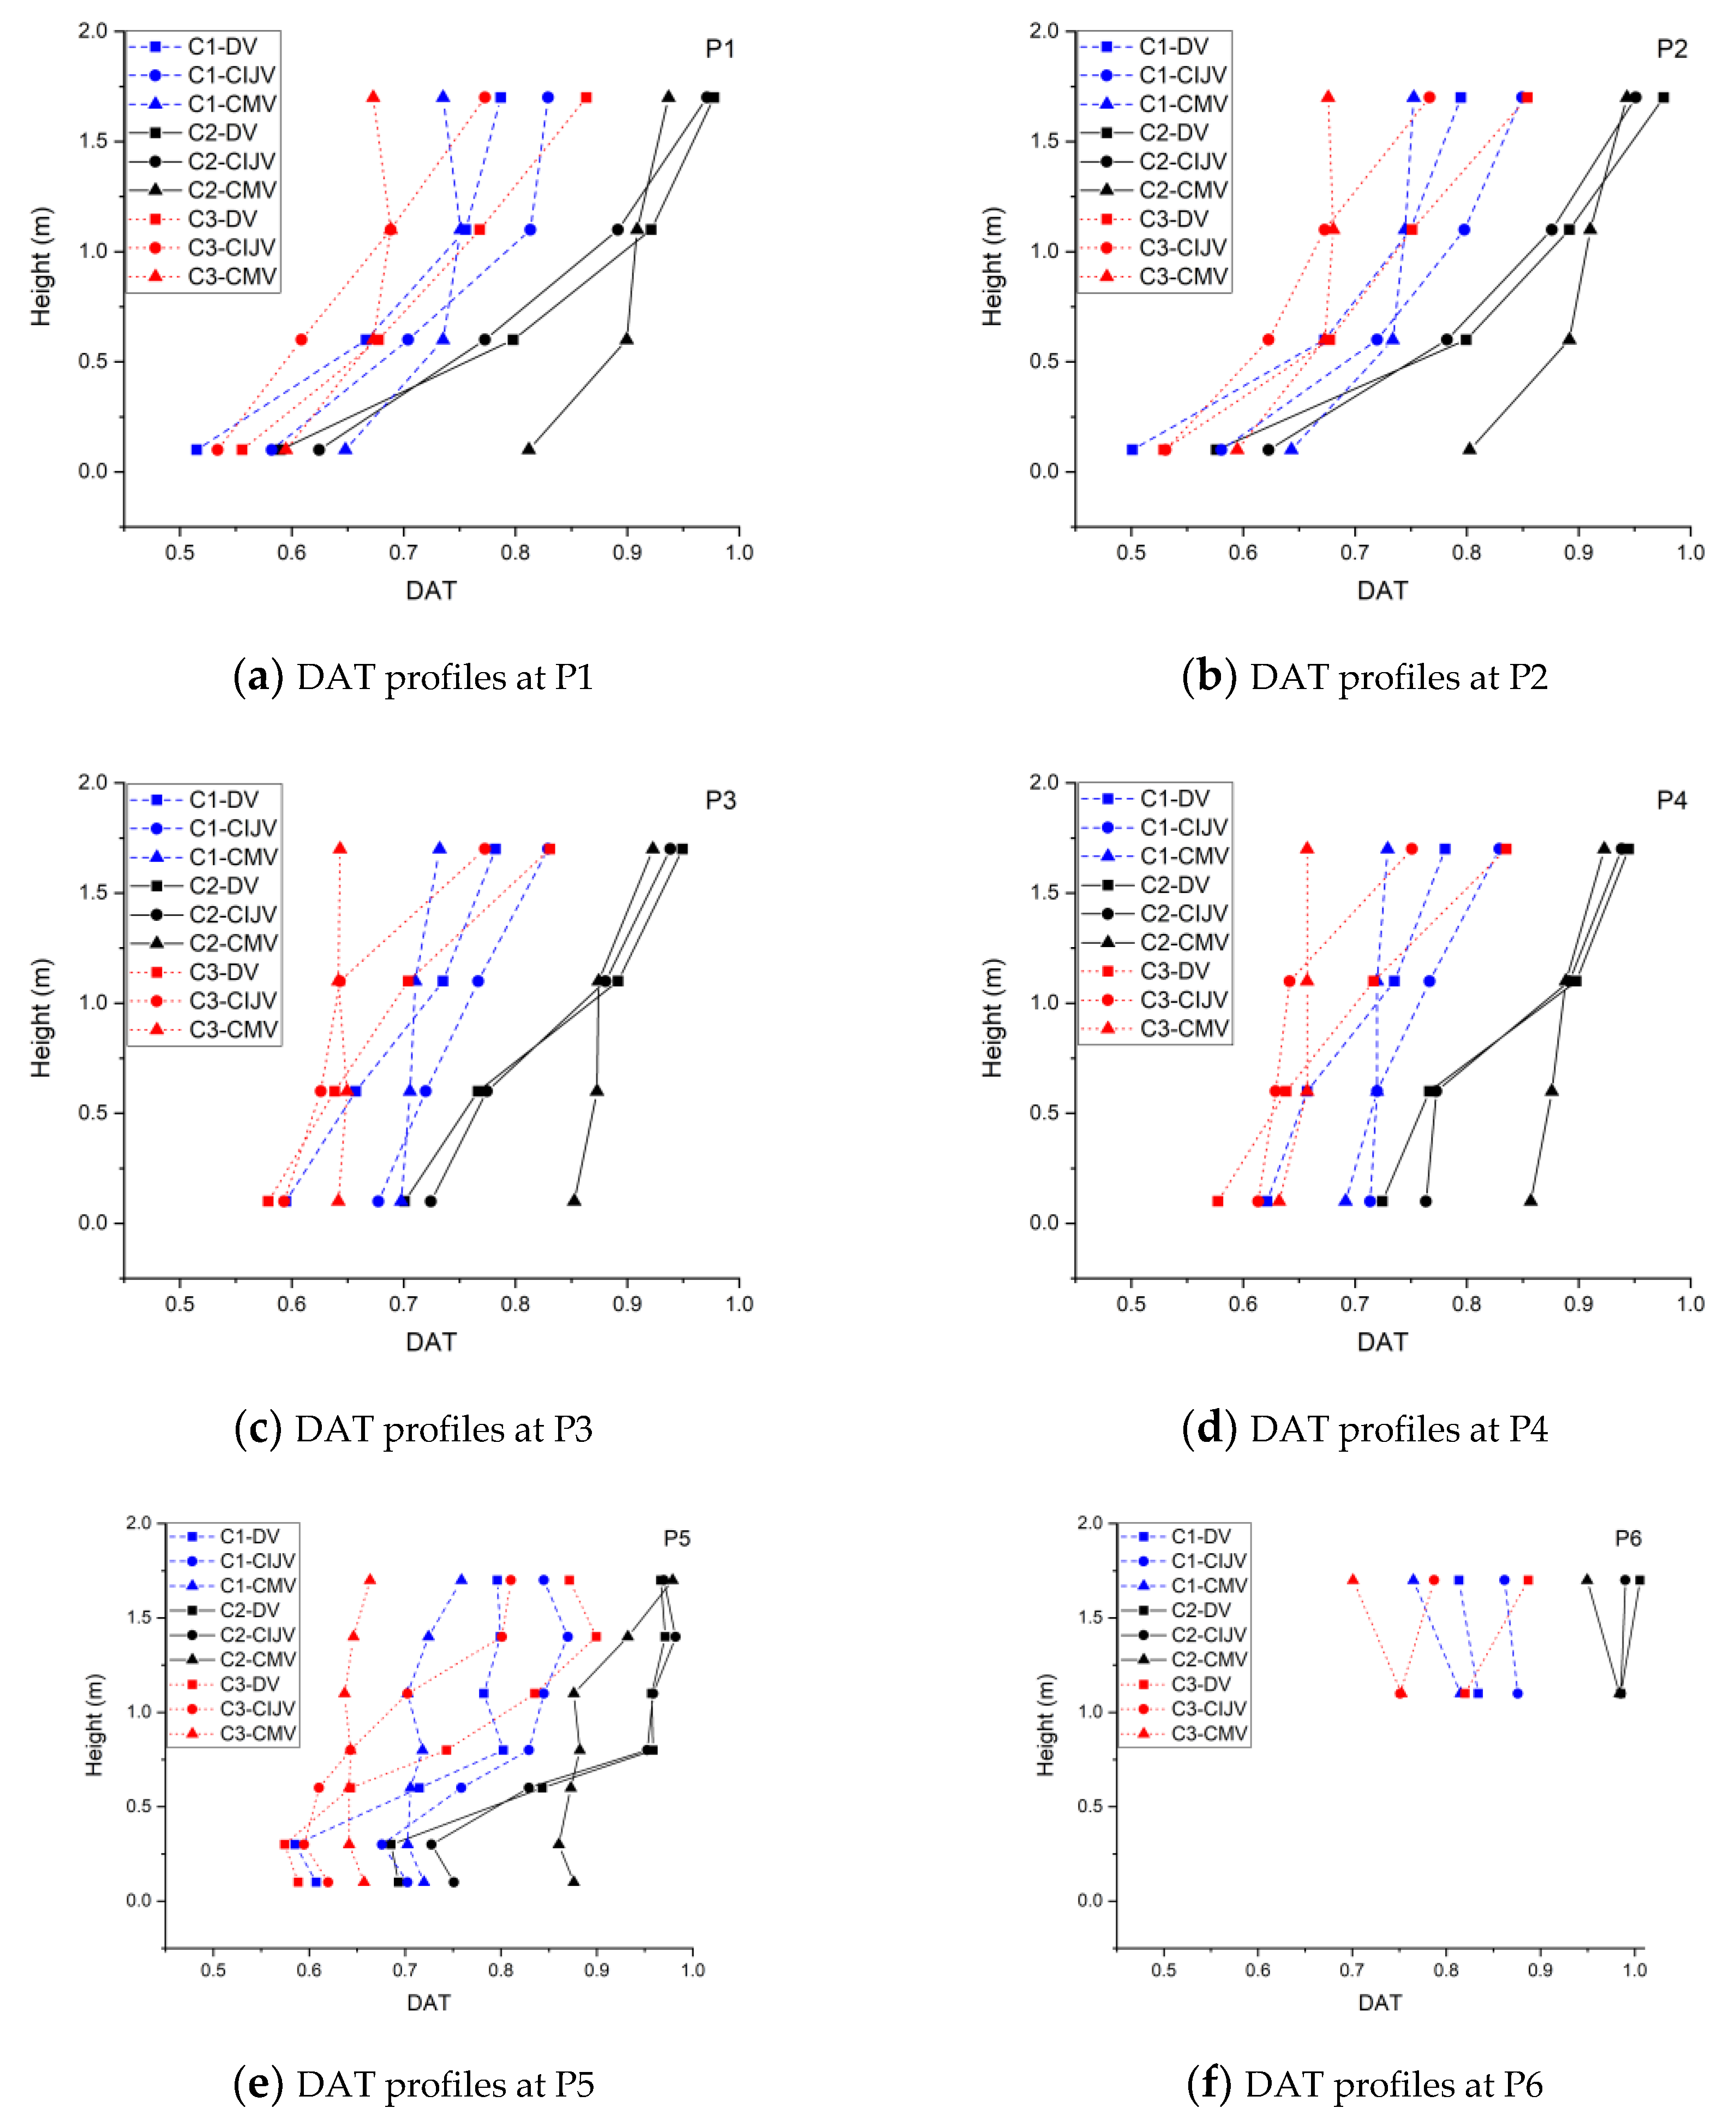
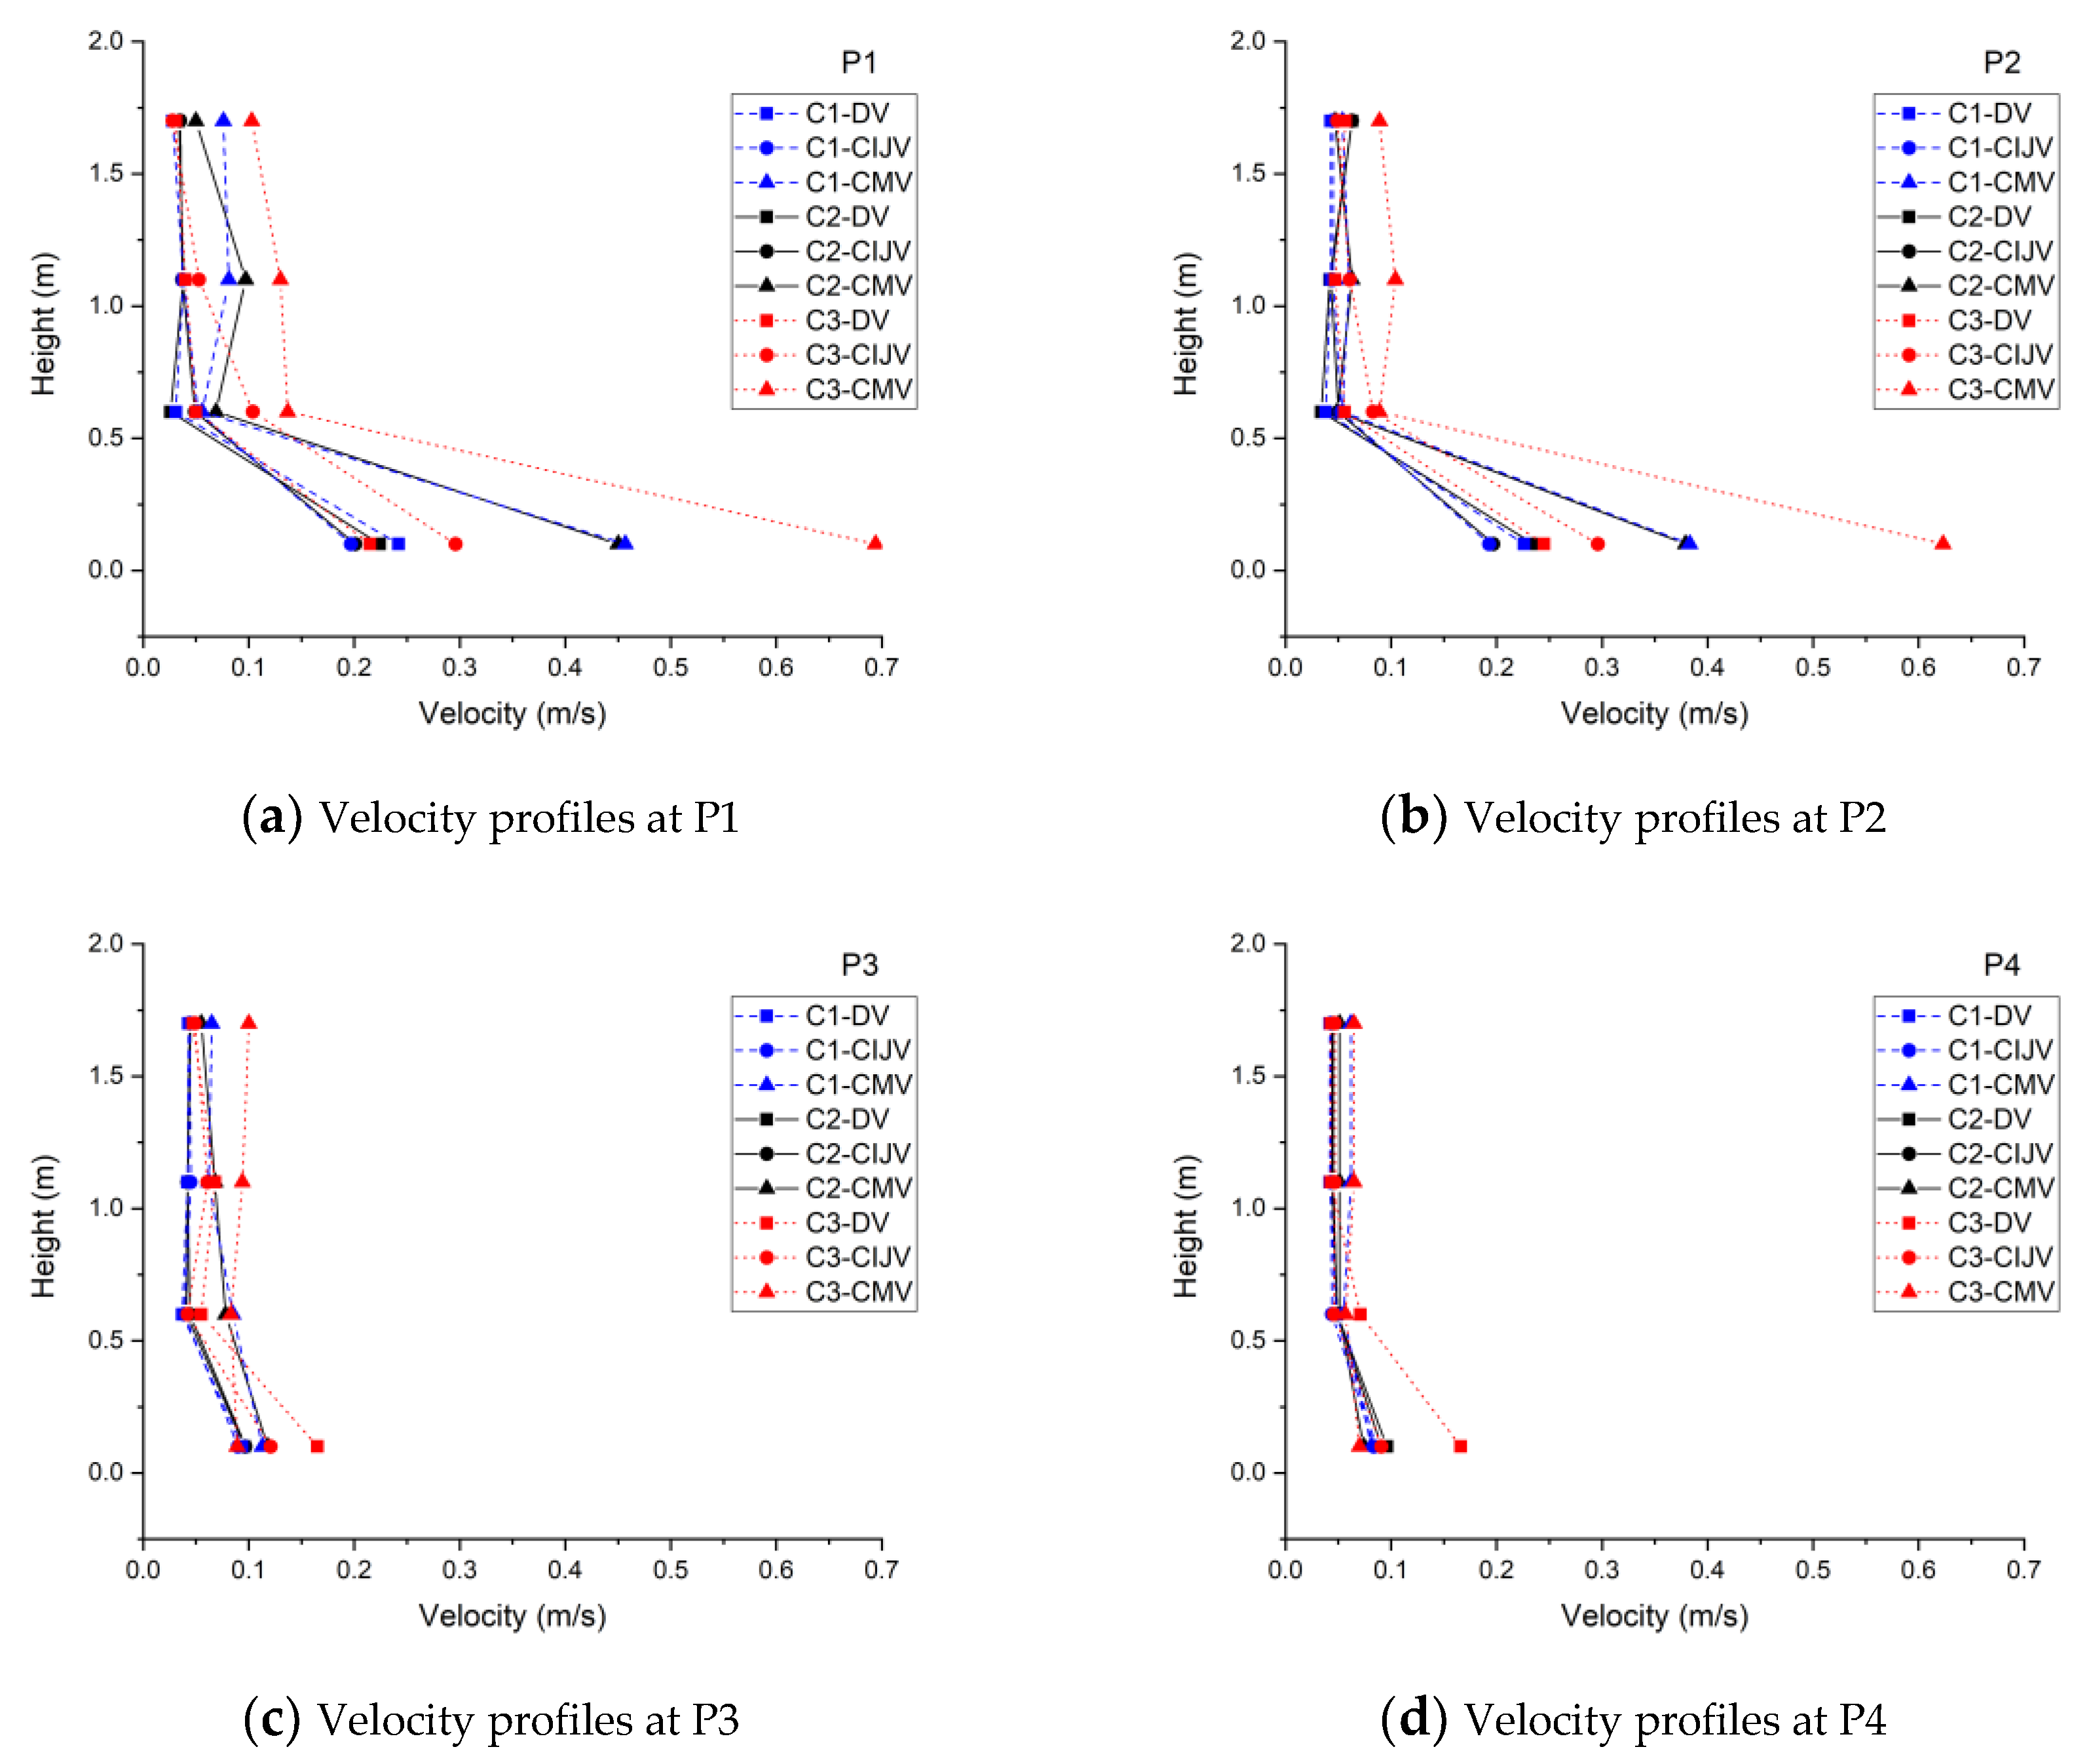
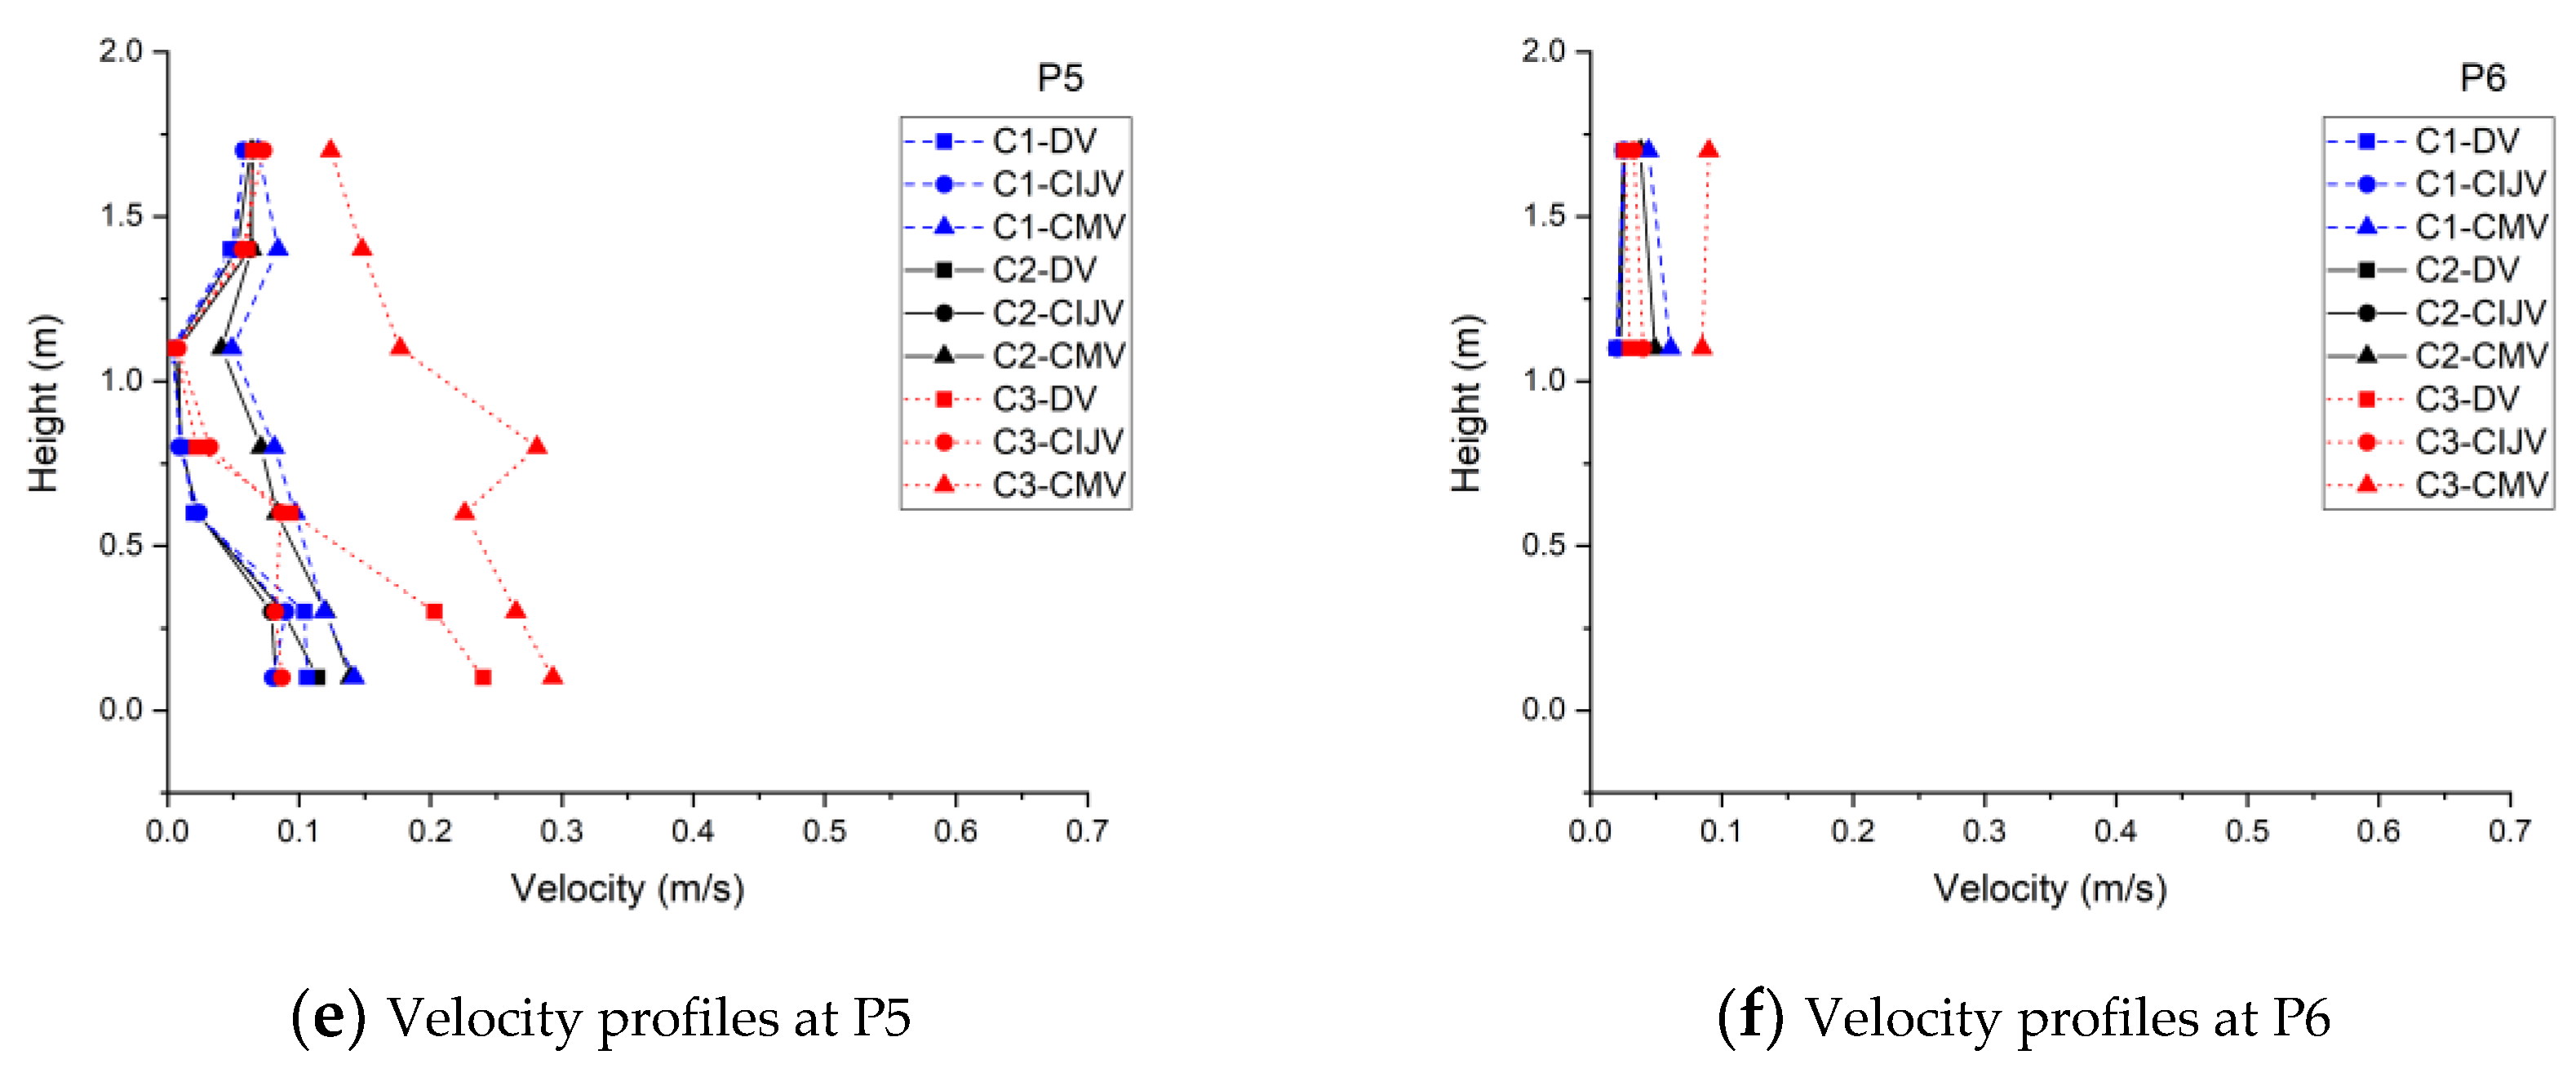
4.1. Flow Pattern and Thermal Conditions
4.2. Ventilation Effectiveness
5. Conclusions
Author Contributions
Funding
Acknowledgments
Conflicts of Interest
Nomenclature
| ACE | air change effectiveness [-] |
| ACEavg | average spatial air change effectiveness in a region [-] |
| ACEp | local air change effectiveness [-] |
| AEE | air exchange effectiveness [-] |
| Ari | inlet Archimedes number [-] |
| CIJV | corner impinging jet ventilation |
| CMV | corner mixing ventilation |
| DAT | dimensionless vertical air temperature [-] |
| DR | draught rate [%] |
| DRmax | maximum draught rate between 0.1 m and 1.7 m above floor level [%] |
| DV | displacement ventilation |
| IAQ | indoor air quality |
| IJV | impinging jet ventilation |
| MV | mixing ventilation |
| PD | percentage dissatisfied due to vertical air temperature difference [%] |
| WCJ | wall confluent jets ventilation |
| Ae | inlet supply opening area [m2] |
| Cp | local tracer gas concentration [ppm] |
| Co | tracer gas concentration at outlet [ppm] |
| Ip | local turbulent intensity [-] |
| g | gravitational acceleration [m/s2] |
| qv | ventilation flow rate [m3/s] |
| the root mean square of turbulent velocity fluctuations [m/s] | |
| t | time [s] |
| arithmetic mean air temperature based on the values at the heights of 0.1, 0.6, and 1.1 m [°C] | |
| Ta | local air temperature [°C] |
| Ti | mean supply air temperature [°C], [K] |
| To | mean outlet air temperature [°C] |
| Tr | mean air temperature in the center of the room at 1.7 m above floor level [°C], [K] |
| vertical air temperature gradient between 0.1 m and 1.1 m above floor level [°C] | |
| maximum air temperature gradient between 0.1 m and 1.7 m above floor level [°C] | |
| ua | local air velocity [m/s] |
| uin | nominal inlet air velocity [m/s] |
| mean air velocity [m/s] | |
| maximum air velocity between 0.1 m and 1.7 m above floor level [m/s] | |
| V | volume [m3] |
| temperature effectiveness [-] | |
| room mean age of air [s] | |
| nominal time constant [s] | |
| arithmetic average age of air [s] | |
| local mean age of air [s] |
References
- Vimalanathan, K.; Babu, T.R. The effect of indoor office environment on the work performance, health and well-being of office workers. J. Environ. Health Sci. Eng. 2014, 12, 113. [Google Scholar] [CrossRef] [PubMed]
- Allen, J.G.; MacNaughton, P.; Satish, U.; Santanam, S.; Vallarino, J.; Spengler, J.D. Associations of cognitive function scores with carbon dioxide, ventilation, and volatile organic compound exposures in office workers: A controlled exposure study of green and conventional office environments. Environ. Health Perspect. 2015, 124, 805–812. [Google Scholar] [CrossRef]
- IEA World Energy Balances 2018: Overview. 2018, p. 24. Available online: https://webstore.iea.org/world-energy-balances-2018-overview (accessed on 12 October 2018).
- Xing, H.; Hatton, A.; Awbi, H. A study of the air quality in the breathing zone in a room with displacement ventilation. Build. Environ. 2001, 36, 809–820. [Google Scholar] [CrossRef]
- Chen, H.; Janbakhsh, S.; Larsson, U.; Moshfegh, B. Numerical investigation of ventilation performance of different air supply devices in an office environment. Build. Environ. 2015, 90, 37–50. [Google Scholar] [CrossRef]
- Serra, N.; Semiao, V. Comparing displacement ventilation and mixing ventilation as HVAC strategies through CFD. Eng. Comput. 2009, 26, 950–971. [Google Scholar] [CrossRef]
- He, G.; Yang, X.; Srebric, J. Removal of contaminants released from room surfaces by displacement and mixing ventilation: Modeling and validation. Indoor Air 2005, 15, 367–380. [Google Scholar] [CrossRef] [PubMed]
- Lin, Z.; Chow, T.; Fong, K.; Tsang, C.; Wang, Q. Comparison of performances of displacement and mixing ventilations. Part II: Indoor air quality. Int. J. Refrig. 2005, 28, 288–305. [Google Scholar] [CrossRef]
- Chen, H.; Moshfegh, B.; Cehlin, M. Numerical investigation of the flow behavior of an isothermal impinging jet in a room. Build. Environ. 2012, 49, 154–166. [Google Scholar] [CrossRef]
- Chen, H.; Moshfegh, B.; Cehlin, M. Investigation on the flow and thermal behavior of impinging jet ventilation systems in an office with different heat loads. Build. Environ. 2013, 59, 127–144. [Google Scholar] [CrossRef]
- Chen, H.; Moshfegh, B.; Cehlin, M. Computational investigation on the factors influencing thermal comfort for impinging jet ventilation. Build. Environ. 2013, 66, 29–41. [Google Scholar] [CrossRef]
- Haghshenaskashani, S.; Sajadi, B.; Cehlin, M. Multi-objective optimization of impinging jet ventilation systems: Taguchi-based CFD method. Build. Simul. 2018, 11, 1207–1214. [Google Scholar] [CrossRef]
- Cehlin, M.; Larsson, U.; Chen, H. Numerical investigation of Air Change Effectiveness in an Office Room with Impinging Jet Ventilation. In Proceedings of the 4th international Conference on Building Energy & Environment (COBEE2018), Melbourne, Australia, 5–9 February 2018; pp. 641–646. [Google Scholar]
- Karimipanah, T.; Awbi, H. Theoretical and experimental investigation of impinging jet ventilation and comparison with wall displacement ventilation. Build. Environ. 2002, 37, 1329–1342. [Google Scholar] [CrossRef]
- Koufi, L.; Younsi, Z.; Cherif, Y.; Naji, H.; El Ganaoui, M. A numerical study of indoor air quality in a ventilated room using different strategies of ventilation. Mech. Ind. 2017, 18, 221. [Google Scholar] [CrossRef][Green Version]
- Ye, X.; Zhu, H.; Kang, Y.; Zhong, K. Heating energy consumption of impinging jet ventilation and mixing ventilation in large-height spaces: A comparison study. Energy Build. 2016, 130, 697–708. [Google Scholar] [CrossRef]
- Cao, G.; Awbi, H.; Yao, R.; Fan, Y.; Sirén, K.; Kosonen, R.; Zhang, J.J. A review of the performance of different ventilation and airflow distribution systems in buildings. Build. Environ. 2014, 73, 171–186. [Google Scholar] [CrossRef]
- Awbi, H.B. Ventilation for good indoor air quality and energy efficiency. Energy Procedia 2017, 112, 277–286. [Google Scholar] [CrossRef]
- Larsson, U. On the Performance of Stratified Ventilation; Linköping University Electronic Press: Linköping, Sweden, 2018. [Google Scholar]
- Arghand, T.; Karimipanah, T.; Awbi, H.B.; Cehlin, M.; Larsson, U.; Linden, E. An experimental investigation of the flow and comfort parameters for under-floor, confluent jets and mixing ventilation systems in an open-plan office. Build. Environ. 2015, 92, 48–60. [Google Scholar] [CrossRef]
- Wu, X.; Fang, L.; Olesen, B.W.; Zhao, J. Air distribution and ventilation effectiveness in a room with floor/ceiling heating and mixing/displacement ventilation. In Proceedings of the 8th International Symposium on Heating, Ventilation and Air Conditioning (ISHVAC2013), Xi’an, China, 19–21 October 2013; pp. 59–67. [Google Scholar]
- Amai, H.; Novoselac, A. Experimental study on air change effectiveness in mixing ventilation. Build. Environ. 2016, 109, 101–111. [Google Scholar] [CrossRef]
- Conceição, E.Z.; Lúcio, M.M.J.; Awbi, H.B. Comfort and airflow evaluation in spaces equipped with mixing ventilation and cold radiant floor. Build. Simul. 2013, 6, 51–67. [Google Scholar] [CrossRef]
- Shan, X.; Zhou, J.; Chang, V.W.-C.; Yang, E.-H. Comparing mixing and displacement ventilation in tutorial rooms: Students’ thermal comfort, sick building syndromes, and short-term performance. Build. Environ. 2016, 102, 128–137. [Google Scholar] [CrossRef]
- Ren, S.; Tian, S.; Meng, X. Comparison of Displacement Ventilation, Mixing Ventilation and Underfloor Air Distribution System. In Proceedings of the 2015 International Conference on Architectural, Civil and Hydraulics Engineering (ICACHE 2015), Guangzhou, China, 28–29 November 2015; pp. 79–82. [Google Scholar]
- Zhou, J.; Chau, H.; Kang, Y.; Hes, D.; Noguchi, M.; Aye, L. Comparing mixing ventilation and displacement ventilation in university classrooms. In Proceedings of the Zero Energy Mass Custom Home (ZEMCH2018), Melbourne, Australia, 29 January–1 February 2018; pp. 263–274. [Google Scholar]
- Cheng, Y.; Lin, Z. Experimental study of airflow characteristics of stratum ventilation in a multi-occupant room with comparison to mixing ventilation and displacement ventilation. Indoor Air 2015, 25, 662–671. [Google Scholar] [CrossRef]
- Vachaparambil, K.; Cehlin, M.; Karimipanah, T. Comparative Numerical Study of the Indoor Climate for Mixing and Confluent Jet Ventilation Systems in an Open-plan Office. In Proceedings of the 4th International Conference On Building Energy & Environment (COBEE2018), Melbourne, Australia, 5–9 February 2018; pp. 73–78. [Google Scholar]
- ISO 7730. Ergonomics of the Thermal Environment-Analytical Determination and Interpretation of Thermal Comfort Using Calculation of the PMV and PPD Indices and Local Thermal Comfort Criteria; ISO: Geneva, Switzerland, 2005. [Google Scholar]
- Nielsen, P.V. Displacement Ventilation: Theory and Design; Aalborg University: Aalborg, Denmark, 1993; p. 42. Available online: https://www.forskningsdatabasen.dk/en/catalog/2389386598 (accessed on 5 October 2018).
- Qingyan, C.; Van Der Kooi, J.; Meyers, A. Measurements and computations of ventilation efficiency and temperature efficiency in a ventilated room. Energy Build. 1988, 12, 85–99. [Google Scholar] [CrossRef]
- Artmann, N.; Jensen, R.L.; Manz, H.; Heiselberg, P. Experimental investigation of heat transfer during night-time ventilation. Energy Build. 2010, 42, 366–374. [Google Scholar] [CrossRef]
- Olesen, B.W.; Simone, A.; KrajcÍik, M.; Causone, F.; Carli, M.D. Experimental study of air distribution and ventilation effectiveness in a room with a combination of different mechanical ventilation and heating/cooling systems. Int. J. Vent. 2011, 9, 371–383. [Google Scholar] [CrossRef]
- ASHRAE Standard 129-1997 (RA 2002). Measuring Air Change Effectiveness; ASHRAE: Atlanta, GA, USA, 2002. [Google Scholar]
- Mundt, M.; Mathisen, H.M.; Moser, M.; Nielsen, P.V. Ventilation Effectiveness; REHVA: Brussels, Belgium, 2004; ISBN 978-29-6004-680-9. [Google Scholar]
- Breum, N. Ventilation efficiency in an occupied office with displacement ventilation—A laboratory study. Environ. Int. 1992, 18, 353–361. [Google Scholar] [CrossRef]
- Krajčík, M.; Simone, A.; Olesen, B.W. Air distribution and ventilation effectiveness in an occupied room heated by warm air. Energy Build. 2012, 55, 94–101. [Google Scholar] [CrossRef]
- Fisk, W.; Faulkner, D.; Pih, D.; McNeel, P.; Bauman, F.; Arens, E. Indoor air flow and pollutant removal in a room with task ventilation. Indoor Air 1991, 1, 247–262. [Google Scholar] [CrossRef]
- Larsson, U.; Moshfegh, B. Comparison of ventilation performance of three different air supply devices: A measurement study. Int. J. Vent. 2017, 16, 244–254. [Google Scholar] [CrossRef]
- Sandberg, M.; Blomqvist, C. A quantitative estimate of the accuracy of tracer gas methods for the determination of the ventilation flow rate in buildings. Build. Environ. 1985, 20, 139–150. [Google Scholar] [CrossRef]
- Almesri, I.; Awbi, H.; Foda, E.; Sirén, K. An air distribution index for assessing the thermal comfort and air quality in uniform and nonuniform thermal environments. Indoor Built Environ. 2013, 22, 618–639. [Google Scholar] [CrossRef]
- Faulkner, D.; Fisk, W.; Sullivan, D. Indoor airflow and pollutant removal in a room with floor-based task ventilation: Results of additional experiments. Build. Environ. 1995, 30, 323–332. [Google Scholar] [CrossRef]
- Buratti, C.; Mariani, R.; Moretti, E. Mean age of air in a naturally ventilated office: Experimental data and simulations. Energy Build. 2011, 43, 2021–2027. [Google Scholar] [CrossRef]
- Cehlin, M.; Karimipanah, T.; Larsson, U.; Ameen, A. Comparing thermal comfort and air quality performance of two active chilled beam systems in an open-plan office. J. Build. Eng. 2019, 22, 56–65. [Google Scholar] [CrossRef]
- Sandberg, M.; Sjöberg, M. The use of moments for assessing air quality in ventilated rooms. Build. Environ. 1983, 18, 181–197. [Google Scholar] [CrossRef]
- Sandberg, M. What is ventilation efficiency? Build. Environ. 1981, 16, 123–135. [Google Scholar] [CrossRef]
- Both, B.; Szánthó, Z. Objective investigation of discomfort due to draught in a tangential air distribution system: Influence of air diffuser’s offset ratio. Indoor Built Environ. 2018, 27, 1105–1118. [Google Scholar] [CrossRef]
- Cehlin, M. Visualization of Air Flow, Temperature and Concentration Indoors: Whole-Field Measuring Methods and CFD. Ph.D. Thesis, KTH, Stockholm, Sweden, 2006. [Google Scholar]
- Novoselac, A.; Srebric, J. A critical review on the performance and design of combined cooled ceiling and displacement ventilation systems. Energy Build. 2002, 34, 497–509. [Google Scholar] [CrossRef]
- Loveday, D.; Parsons, K.; Taki, A.; Hodder, S. Displacement ventilation environments with chilled ceilings: Thermal comfort design within the context of the BS EN ISO7730 versus adaptive debate. Energy Build. 2002, 34, 573–579. [Google Scholar] [CrossRef]
- Schiavon, S.; Bauman, F.; Tully, B.; Rimmer, J. Room air stratification in combined chilled ceiling and displacement ventilation systems. HVAC&R Res. 2012, 18, 147–159. [Google Scholar]
- Li, Y.; Sandberg, M.; Fuchs, L. Vertical temperature profiles in rooms ventilated by displacement: Full-scale measurement and nodal modelling. Indoor Air 1992, 2, 225–243. [Google Scholar] [CrossRef]
- Cermak, R.; Melikov, A.K. Air quality and thermal comfort in an office with underfloor, mixing and displacement ventilation. Int. J. Vent. 2006, 5, 323–352. [Google Scholar] [CrossRef]
- Yin, Y.; Xu, W.; Gupta, J.K.; Guity, A.; Marmion, P.; Manning, A.; Gulick, B.; Zhang, X.; Chen, Q. Experimental study on displacement and mixing ventilation systems for a patient ward. HVAC&R Res. 2009, 15, 1175–1191. [Google Scholar] [CrossRef]


| Category | DR | Maximum Mean Air Speed (m/s) | PD | |
|---|---|---|---|---|
| Summer | Winter | |||
| A | <10% | 0.12 | 0.10 | <3% |
| B | <20% | 0.19 | 0.16 | <5% |
| C | <30% | 0.24 | 0.21 | <10% |
| Case | Ventilation System | Supply Flow Rate [L/s] | Occupant [W] | Equipment [W] | Inlet Temp. [°C] | uin [m/s] | Ari × 10−4 |
|---|---|---|---|---|---|---|---|
| C1-DV | DV | 2 × 20 | 2 × 100 | - | 17.6 | 0.67 | 649 |
| C1-CIJV | CIJV | 2 × 20 | 2 × 100 | - | 17.6 | 1.51 | 91 |
| C1-CMV | CMV | 2 × 20 | 2 × 100 | - | 17.3 | 3.98 | 8 |
| C2-DV | DV | 2 × 20 | 2 × 100 | 2 × 75 | 17.6 | 0.67 | 787 |
| C2-CIJV | CIJV | 2 × 20 | 2 × 100 | 2 × 75 | 17.6 | 1.51 | 104 |
| C2-CMV | CMV | 2 × 20 | 2 × 100 | 2 × 75 | 17.6 | 3.98 | 9 |
| C3-DV | DV | 2 × 30 | 2 × 100 | 2 × 75 | 17.6 | 1.00 | 317 |
| C3-CIJV | CIJV | 2 × 30 | 2 × 100 | 2 × 75 | 17.6 | 2.26 | 39 |
| C3-CMV | CMV | 2 × 30 | 2 × 100 | 2 × 75 | 17.6 | 5.97 | 3 |
| Case | Position | C1-DV | C1-CIJV | C1-CMV | C2-DV | C2-CIJV | C2-CMV | C3-DV | C3-CIJV | C3-CMV |
|---|---|---|---|---|---|---|---|---|---|---|
| PD | P1 | 1.2% | 1.1% | 0.6% | 1.9% | 1.3% | 0.5% | 1.0% | 0.7% | 0.5% |
| P2 | 1.2% | 1.0% | 0.5% | 1.7% | 1.2% | 0.6% | 1.1% | 0.7% | 0.5% | |
| P3 | 0.7% | 0.5% | 0.3% | 0.9% | 0.7% | 0.4% | 0.6% | 0.4% | 0.3% | |
| P4 | 0.6% | 0.4% | 0.4% | 0.8% | 0.6% | 0.4% | 0.7% | 0.4% | 0.4% | |
| P5 | 0.8% | 0.7% | 0.3% | 1.3% | 1.0% | 0.3% | 1.2% | 0.5% | 0.3% |
| Case | Position | C1-DV | C1-CIJV | C1-CMV | C2-DV | C2-CIJV | C2-CMV | C3-DV | C3-CIJV | C3-CMV |
|---|---|---|---|---|---|---|---|---|---|---|
| ACEp | T1 | 1.64 | 1.47 | 1.05 | 1.15 | 1.39 | 1.13 | 1.34 | 1.13 | 1.03 |
| T2 | 1.41 | 1.46 | 1.08 | 1.09 | 1.25 | 1.15 | 1.25 | 1.21 | 1.06 | |
| T3 1 | 1.61 | 1.55 | 1.07 | 1.50 | 1.37 | 1.14 | 1.30 | 1.17 | 1.04 | |
| T4 | 1.47 | 1.54 | 1.03 | 1.32 | 1.38 | 1.11 | 1.32 | 1.14 | 1.01 | |
| T5 | 1.33 | 1.38 | 1.06 | 1.04 | 1.17 | 1.13 | 1.21 | 1.26 | 1.03 | |
| ACEavg 2 | 1.48 | 1.47 | 1.06 | 1.20 | 1.31 | 1.13 | 1.28 | 1.18 | 1.03 | |
| AEE | 0.58 | 0.61 | 0.52 | 0.56 | 0.54 | 0.55 | 0.55 | 0.53 | 0.50 |
| Case | Position | C1-DV | C1-CIJV | C1-CMV | C2-DV | C2-CIJV | C2-CMV | C3-DV | C3-CIJV | C3-CMV |
|---|---|---|---|---|---|---|---|---|---|---|
| 1 | P1 | 1.25 | 1.24 | 1.08 | 1.30 | 1.30 | 1.14 | 1.31 | 1.31 | 1.00 |
| P2 | 1.26 | 1.24 | 1.08 | 1.32 | 1.31 | 1.15 | 1.34 | 1.32 | 1.01 | |
| P3 | 1.22 | 1.2 | 1.09 | 1.27 | 1.25 | 1.15 | 1.37 | 1.29 | 1.02 | |
| P4 | 1.21 | 1.18 | 1.08 | 1.26 | 1.23 | 1.14 | 1.36 | 1.28 | 1.01 | |
| P5 | 1.15 | 1.13 | 1.08 | 1.20 | 1.17 | 1.14 | 1.27 | 1.24 | 1.01 | |
| 2 | P6 | 0.97 | 0.99 | 0.95 | 1.01 | 1.01 | 1.02 | 1.07 | 1.07 | 0.87 |
| P7 | 1.00 | 1.04 | 1.01 | 1.05 | 1.06 | 1.08 | 1.12 | 1.14 | 0.92 |
© 2019 by the authors. Licensee MDPI, Basel, Switzerland. This article is an open access article distributed under the terms and conditions of the Creative Commons Attribution (CC BY) license (http://creativecommons.org/licenses/by/4.0/).
Share and Cite
Ameen, A.; Cehlin, M.; Larsson, U.; Karimipanah, T. Experimental Investigation of the Ventilation Performance of Different Air Distribution Systems in an Office Environment—Cooling Mode. Energies 2019, 12, 1354. https://doi.org/10.3390/en12071354
Ameen A, Cehlin M, Larsson U, Karimipanah T. Experimental Investigation of the Ventilation Performance of Different Air Distribution Systems in an Office Environment—Cooling Mode. Energies. 2019; 12(7):1354. https://doi.org/10.3390/en12071354
Chicago/Turabian StyleAmeen, Arman, Mathias Cehlin, Ulf Larsson, and Taghi Karimipanah. 2019. "Experimental Investigation of the Ventilation Performance of Different Air Distribution Systems in an Office Environment—Cooling Mode" Energies 12, no. 7: 1354. https://doi.org/10.3390/en12071354
APA StyleAmeen, A., Cehlin, M., Larsson, U., & Karimipanah, T. (2019). Experimental Investigation of the Ventilation Performance of Different Air Distribution Systems in an Office Environment—Cooling Mode. Energies, 12(7), 1354. https://doi.org/10.3390/en12071354