Article

Optimal Low-Carbon Economic Environmental Dispatch of Hybrid Electricity-Natural Gas Energy Systems Considering P2G

1
School of Mechanical Electronic and Information Engineering, China University of Mining & Technology (Beijing), Beijing 100083, China
2
School of Engineering, University of Edinburgh, Edinburgh EH9 3DW, UK
*
Author to whom correspondence should be addressed.
Energies 2019, 12(7), 1355; https://doi.org/10.3390/en12071355
Submission received: 8 March 2019 / Revised: 4 April 2019 / Accepted: 5 April 2019 / Published: 9 April 2019

Abstract

:
Power to gas facilities (P2G) could absorb excess renewable energy that would otherwise be curtailed due to electricity network constraints by converting it to methane (synthetic natural gas). The produced synthetic natural gas can power gas turbines and realize bidirectional energy flow between power and natural-gas systems. P2G, therefore, has significant potential for unlocking inherent flexibility in the integrated system, but also poses new challenges of increased system complexity. A coordinated operation strategy that manages power and natural-gas network constraints together is essential to address such challenges. In this paper, a novel low-carbon economic environmental dispatch strategy is presented considering all the constraints in both systems. The multi-objective black-hole particle swarm optimization algorithm (MOBHPSO) is adopted. In addition to P2G, a gas demand management strategy is proposed to support gas flow balance. A new solving approach that combines the effective redundancy method, trust region method, and Levenberg-Marquardt method is proposed to address the complex coupled constraints. Case studies that use an integrated IEEE 39-bus power and Belgian high-calorific 20-node gas system demonstrate the effectiveness and scalability of the proposed model and optimization method. The analysis of dispatch results illustrates the benefit of P2G for the wind power accommodation, and low-carbon, economic, and environmental improvement of integrated system operation.

1. Introduction

With further acceleration of the low-carbon energy process, as well as the energy crisis, environmental pollution, and other issues, the capacity of renewable energy sources has increased continuously. Due to the intermittency and uncertainty of wind power as well as the lack of peak load regulation of power system, it is likely that more and more wind power generation will have to be curtailed in order to maintain the power system reliability [1]. To solve this problem, much research is carried out to explore practical means to reduce the curtailment of wind power generation. The growing interdependence of the power system and natural-gas system and the development of power to gas technologies [2,3,4,5,6,7,8] creates operational interactions between the power system and natural-gas system, which could obtain additional benefits for both systems, including reducing the curtailed wind power generation. On the one hand, the power system tends to require more flexible power energy from the natural-gas system to shift peak load compared with the gas-fired units [3], which is conductive to the accommodation of wind power. On the other hand, the natural-gas system absorbs methane or hydrogen produced by P2G to guarantee the continuity of gas supply and the wind power energy will be stored and transported in the existing natural-gas system for generating low-carbon electricity or heat later [9,10,11], which uses the curtailed wind power directly. Therefore, the integrated electricity-natural gas energy systems with P2G have become one of the effective forms to reduce the curtailment of wind power generation.
The diagram of integrated electricity-natural gas energy systems with P2G is shown in Figure 1. It can be seen that the power system and the natural-gas system exchange the energy between P2G and gas-fired units. When the curtailed wind power is converted to hydrogen or methane through power to hydrogen facilities (P2H) or power to methane facilities (P2M), P2G which includes P2H and P2M is the load of power system and the gas source of natural-gas system. Meanwhile, the gas-fired units are the load of natural-gas system and the generators of power system. Obviously, operation parameters of P2G, power system and natural-gas system are interrelated and interactive which can affect the operation cost, CO2 emissions, reliability, and stability of both systems. Therefore, how to deal with the interactive relationship between power system and natural-gas system and how to achieve coordinated optimal operation with economic environmental benefits are the key issues for the integrated power system and natural-gas system.
For the integrated electricity-natural gas energy systems, the initial research is focused on optimal power flow [12,13,14,15], unit commitment [16], optimal dispatch [17,18,19], steady-state analysis [20], and system planning [21]. For the calculation of optimal power flow, the total operation cost is usually considered as optimal objective and the dual interior point method [12], the Monte Carlo method [13] and the point estimation method [14] are adopted frequently. Some studies introduce an energy hub to deal with the translation of different energies in the hybrid electricity-natural gas energy systems [13,17]. For the optimization of system operation, the operation of power system and the operation of natural-gas system are mostly optimized separately using the deterministic optimization methods or stochastic optimization methods [18]. For the steady-state analysis of the hybrid electricity-natural gas energy systems, based on the steady-state analysis of power system, the analysis model of natural-gas system is realized by analogy analysis between power system and natural-gas system, and then the comprehensive steady-state analysis model of hybrid electricity-natural gas energy systems is given [20]. For the optimal system planning, a chance constrained programing approach is presented to minimize the investment cost of the integrated energy systems [21]. In these studies, P2G is not considered. As the coupling operation link of the power system and natural-gas system, P2G plays a more and more important role in wind power accommodation with broad prospects and potential for energy development [22,23,24]. Therefore, it is necessary to carry out the research on optimal operation of integrated electricity-natural gas energy systems considering P2G. The early studies on P2G are mainly focused on technology implementation and security application [6,25,26,27,28]. Recently, although some achievements about optimal operation of integrated electricity-natural gas energy systems considering P2G have been achieved [6,7,8,24,29,30,31,32,33,34,35,36,37,38], it still seems to be in the exploratory stage from the following aspects.
(1) Optimal objectives: The minimum total operation cost is mostly adopted [6,24,29,30,31,32,37]. In only a few studies, the maximum wind power accommodation [33], the minimum energy purchase cost [34], or net power demand smoothness [38] is also considered as the objective. However, environmental benefit is rarely considered. As we know, the low-carbon and emission reduction requirements become more and more important. Therefore, it is necessary to take environmental benefit into consideration.
(2) Optimal models: The operation model of power system and operation model of natural-gas system are mainly established separately based on the two-level optimal power flow structure [6,30,31,32]. It seems that rare consideration is given to coordinated optimization between the two energy systems.
(3) Optimal algorithms: Generally, the traditional algorithms are adopted in most studies, such as the mix-integer linear programming method [3,24], mixed-integer quadratic programming method [37], and interior point method [35]. However, the intelligent optimization algorithms with high global search ability and fast convergence speed are rarely used.
(4) Constraints handling methods: The constraints handling methods affect the operation results directly. Few articles give full details about the constraints handling methods, especially for the complicated dynamic nodal balance constraint and volume limits of gas storage in the natural-gas system.
On the above premises, this paper establishes the optimal operation model of the hybrid electricity-natural gas energy systems considering operation cost, natural-gas cost reduction due to P2G, CO2 emissions, and SOx emissions to achieve low-carbon, economic, and environmental benefits. The multi-objective black-hole particle swarm optimization algorithm (MOBHPSO) [39,40,41,42] is adopted. The power flow is calculated using the Newton-Raphson method. The non-linear gas flow equations are solved by the trust region method [43,44] and Levenberg-Marquardt (L-M) method [45,46], respectively. The gas demand management strategy is proposed to balance the gas flow. Moreover, the detailed handling methods of inequality constraints in natural-gas system are also given in this paper. Several case studies are carried out on a hybrid IEEE 39-bus power system and Belgian high-calorific 20-node gas system in a period of 24 h to investigate the low-carbon, economic and environmental benefits of P2G in terms of cost reduction ($6.165 × 10⁵), rate decline of wind curtailment (from 24.85% to 4.04%), CO2 emissions reduction (3630 tons), and SOx emissions reduction (0.254 ton).

2. Problem Formulation

The optimal low-carbon economic environmental dispatch problem of hybrid electricity-natural gas energy systems with P2G is a complicated non-convex, coupled, non-linear, multi-objective, and multi-constraint optimization problem. It contains three parts: The first one is the optimization of power system; the second one is the optimization of natural-gas system; and the last one is the coordination of the hybrid electricity-natural gas energy systems. The flow chart of this optimization problem is shown in Figure 2. Each part of the flow chart will be described in detail.

2.1. Optimal Economic Environmental Dispatch of Power System

2.1.1. Objectives

(1) Minimum Fuel Cost of the Power System
Min F p = i = 1 N G t = 1 T a i P G i ( t ) 2 + b i P G i ( t ) + c i
(2) Minimum SOx Pollutant Emissions of the Power System
Min E S O x = i = 1 N G t = 1 T ( α i + β i P G i ( t ) + γ i P G i ( t ) 2 + δ i e λ i P G i ( t ) )
(3) Minimum Load Loss Rate of the Power System
Min L p = t = 1 T [ P L ( t ) + k = 1 N P 2 G P P 2 G , k ( t ) i = 1 N G P G i ( t ) ] t = 1 T P L ( t )
where Fp is the fuel cost of power system; NG is the number of power generations; T is the number of time periods; PGi (t) is the power generation output at time t; ai, bi, ci are coefficient of the fuel cost; ESOx is the pollutant emission of SOx; αi, βi, γi, δi, λi are coefficient of the pollutant emission; Lp is the load loss rate presenting the reliability of power supply; NP2G is the number of P2G; PL(t) is the power load at time t; PP2G (t) is the power supplied to the P2G facilities at time t.
The power output of gas-fired units is calculated by the product of the gas flow injected to the gas-fired units QGT(t), higher heating value of natural gas HHVg and the energy conversion efficiency ηGT(t). In this paper, the last objective is converted into a constraint by being less than a given value ε.

2.1.2. Constraints

(1)
Power Output Limits
P G i min P G i ( t ) P G i max
where P G i min and P G i max represent the minimum power output and maximum power output of unit i, respectively.
(2)
Ramp Rate Limits
{ P G i ( t ) max { P G i min , P G i ( t 1 ) Δ P G i d o w n } , P G i ( t ) P G i ( t 1 ) P G i ( t ) min { P G i max , P G i ( t 1 ) + Δ P G i u p } , P G i ( t ) P G i ( t 1 )
where Δ P G i u p and Δ P G i d o w n represent the ramp up rate and the ramp down rate of unit i, respectively.
(3)
Line Capacity Limit
S l ( t ) S l max
where S l max is the maximum capacity of line l.

2.2. Optimal Low-Carbon Economic Dispatch of Natural-Gas System Considering P2G

2.2.1. Objectives

(1) Minimum the Operational Cost of Natural-Gas System
Min C w e l l + C g s + C P 2 G S P 2 G
C w e l l = n = 1 N w t = 1 T Q w n ( t ) u w n ( t )
C g s = m = 1 N g s t = 1 T Q g s , m ( t ) u g s , m ( t )
C P 2 G = k = 1 N P 2 G t = 1 T P P 2 G , k ( t ) u P 2 G , k
S P 2 G = k = 1 N P 2 G t = 1 T Q P 2 G , k ( t ) u a v e ( t )
where Cwell, Cgs, and CP2G represent the operation cost of gas wells, the operation cost of gas storage, and the operation cost of P2G, respectively. SP2G is the saved natural-gas cost due to the P2G. Nw, Ngs represent the number of gas wells and the number of gas storage, respectively; Qwn(t) is the gas flow of gas well n; uwn(t) is the gas price of gas well n at time t; Qgs,m(t) is the gas flow of gas storage m at time t (It is positive for inflow and negative for outflow); ugs,m(t) is the storage price for gas storage m at time t; uP2G,k is the operation cost of P2G k; QP2G,k(t) is the gas flow of P2G k at time t; uave(t) is the average gas price (In this paper, it is the average price of gas wells).
(2) Minimum CO2 Emissions of the Natural-Gas System
Min E C O 2 = n = 1 N w t = 1 T E w n ( t ) + m = 1 N g s t = 1 T E g s , m ( t ) k = 1 N P 2 G t = 1 T E P 2 G , k ( t )
where ECO2 represents CO2 emissions of the natural-gas system; Ewn(t), Egs,m(t) are the CO2 emissions of gas well n, gas storage m at time t, respectively; EP2G,k(t) is the amount of CO2 absorbed by the methanation process of P2G k at time t.

2.2.2. Constraints

(1) Gas Flow Limits of Gas Wells
Q w n min Q w n ( t ) Q w n max
where Q w n min , Q w n max represent the minimum gas flow and the maximum gas flow of gas well n, respectively.
(2) Gas Pressure Limits of Gas Nodes
M i min M i ( t ) M i max
where Mi(t) represents gas pressure of gas node i at time t. M i min and M i max are the minimum and maximum gas pressure of gas node i.
(3) Gas Flow Equation of Pipelines
The natural-gas system satisfies the mass conservation law of fluid dynamics and Bernoulli equation in the operation. The relationship between gas flow of pipelines and gas pressure of gas nodes can be modeled as follows [12,35].
Q i j ( t ) | Q i j ( t ) | = C i j ( M i ( t ) 2 M j ( t ) 2 )
Q i j ( t ) = Q i j i n ( t ) + Q i j o u t ( t ) 2
where Qij(t) is the average gas flow of pipeline ij (Pipeline ij is the pipeline between gas node i and gas node j); Q i j i n (t) and Q i j o u t (t) are the injection and withdrawal gas flow of pipeline ij, respectively; Cij is a constant related to the length, diameter, temperature and compressibility factor of pipeline ij.
(4) Line Pack Equation
Due to the compressibility of natural gas, the injection gas flow and the withdrawal gas flow of the same pipeline would be different. Some excess natural gas can be stored in the pipelines, which is called line pack. The line pack of pipeline ij is related to the average pressure and its own parameters of pipelines, which can be modeled as below [12,15].
L i j ( t ) = ω i j M i j ( t )
M i j ( t ) = M i ( t ) + M j ( t ) 2
L i j ( t ) = L i j ( t 1 ) + Q i j i n ( t ) Q i j o u t ( t )
where Lij(t) is the line pack of pipeline ij at time t; ωij is a constant related to pipeline parameters, gas constant, compressibility factor, gas density, and gas temperature.
(5) Nodal Gas Flow Balance Equation
For each gas node, the gas flows into the node must equals the gas flows out of the node.
n i Q w n ( t ) + m i Q g s , m ( t ) + k i Q P 2 G , k ( t ) j S e t _ I ( i ) Q i j i n ( t ) + j S e t _ O ( i ) Q i j o u t ( t ) Q G T , i ( t ) Q L i ( t ) = 0
where, the first three items are the gas flow of gas wells, gas storage, and P2G located at gas node i at time t, respectively; QGT,i(t) and QLi(t) indicate the gas flow injected to gas-fired units and the gas load at gas node i at time t, respectively; Set_I(i) is the set of pipeline ij which lets gas node i as the input node; Set_O(i) is the set of pipeline ij which lets gas node i as the output node.
(6) Gas Flow Limits and Capacity Limits of Gas Storage
Q g s , m min Q g s , m ( t ) Q g s , m max
V m min V m ( t ) V m max
V m ( t ) = V m ( t 1 ) + Q g s , m ( t )
where Q g s , m min and Q g s , m max are the minimum and maximum gas flow of gas storage m, respectively; Vm(t), V m min , V m max are the capacity of gas storage m at time t, the minimum and maximum capacity of gas storage m, respectively. When the gas is injected to the gas storage, Qgs,m(t) is positive, otherwise it is negative.
(7) Compressor
The compressors are used to boost the pressure of the natural-gas network, which can help the natural gas transporting to each gas load. In this paper, the energy consumed by the compressors is calculated by using natural gas flow through the compressors. The consumed gas flow of compressor r, Q c r c o n s u m e (t), is calculated as presented below [15].
Q c r c o n s u m e ( t ) = β c r P c r ( t )
P c r ( t ) = Q c r ( t ) η c r τ ( ( M o r ( t ) M i r ( t ) ) τ 1 )
where βcr is energy conversion coefficient of compressor r; Pcr(t) is the consumed energy by compressor r; Qcr(t) is the gas flow flowing through compressor r at time t; ηcr is the efficiency of compressor r; τ = (α − 1)/α and α is variability index of compressors; Mor(t) and Mir(t) are the pressure of output node and input node of compressor r, respectively.
(8) Gas Flow Limit of P2G
Q P 2 G , k min Q P 2 G , k ( t ) Q P 2 G , k max
where Q P 2 G , k min and Q P 2 G , k max are the minimum and maximum gas flow of P2G k, respectively.

2.3. Gas Demand Management Strategy to Coordinate the Two Energy Systems

When the pressure of some gas nodes is higher than the maximum pressure or lower than the minimum pressure, which means the gas demand and the gas supply is not balanced on these gas nodes, then the gas demand management strategy is used. The main idea is to adjust the gas flow of gas turbines to achieve the gas demand balance, which means changing the power output of gas-fired units. Then, the power output of units in power system will be adjusted.

2.4. Constraints Handling Methods

The constraints of power system are handled using the methods presented in Reference [39]. In this paper, the constraints of natural-gas system are handled by the proposed method as shown below.

2.4.1. Equality Constraints Handling Method

In this paper, the set of non-linear constraints Equations (15)–(20) of the natural-gas system are solved by the trust region algorithm [43,44] and Levenberg-Marquardt algorithm (L-M) [45,46]. Trust region and L-M methods are both simple and powerful tools for solving systems of nonlinear equations and large-scale optimization problems. They have the advantages of guaranteeing a solution whenever it exists [43,44,45,46]. In this paper, the trust region method and L-M method are used to solve the gas flow non-linear equations, respectively. The optimization results are compared in the case studies.

2.4.2. Inequality Constraints Handling Method

For the inequality constraints (13)–(14), (21)–(22), (26), the gas flow is the minimum when it is lower than the minimum value and the gas flow is the maximum when it is over the maximum value. For the gas storage volume constraint, the effective redundancy method is proposed in this paper. The details of this method are as below.
a)
For gas storage m at time t;
b)
If Vm(t) ≤ V m m i n , calculate ΔV = V m m i n Vm(t);
c)
For ii = 1:t, calculate the gas flow redundancy of gas storage m at time ii. ΔQgs(ii) = min{ Q g s , m m a x Qgs,m(ii), V m m a x Vgs,m(ii)}. If the gas node where the gas storage m is connected with P2G, ΔQP2G(ii) = Q P 2 G m a x QP2G(ii), the effective redundancy ΔQ(ii) = min{ΔQgs(ii), ΔQP2G(ii)}; else, ΔQ(ii) = ΔQgs(ii). Then, arrange ΔQ in descending order;
d)
According to the descending order, QP2G(ii) and Qgs,m(ii) are adjusted successively until Vm(t) ≥ V m m i n ;
e)
Update Vm(t);
f)
If Vm(t) ≥ V m m a x , calculate ΔV = Vm(t) − V m m a x ;
g)
For ii = 1:t, calculate the gas flow redundancy of gas storage m at time ii. ΔQgs(ii) = min{Qgs,m(ii) – Q g s , m m i n , Vgs,m(ii) − V m m i n }. If the gas node where the gas storage m is connected with P2G, ΔQP2G(ii) = QP2G(ii) − Q P 2 G m i n , the effective redundancy ΔQ(ii) = min{ΔQgs(ii), ΔQP2G(ii)}; else, ΔQ(ii) = ΔQgs(ii). Then, arrange ΔQ in descending order;
h)
According to the descending order, QP2G(ii) and Qgs,m(ii) are adjusted successively until Vm(t) ≤ V m m a x ;
i)
Update Vm(t).

3. Case Studies Application

3.1. Description of Case Studies

The hybrid electricity-natural gas energy systems shown in Figure 3 are composed by the revised IEEE 39-bus power system [35] and Belgian high-calorific 20-node gas system [3]. The IEEE 39-bus power network has 46 branches, five coal-fired units, three gas-fired units and two wind power units, where the capacity of wind power units accounts for 35% of the total installed capacity of 3903 MW. The Belgian high-calorific 20-node gas system has 24 pipelines, two gas wells, three gas storages and two compressors. The parameters of the power system are from References [35,40] and the parameters of natural gas system are from Reference [3]. The revised parameters are shown in Table 1 and Table 2 (inflow of gas storage is positive and outflow of gas storage is negative). Gas pressure limits of gas nodes are given in Table 3. Power demand and gas demand are given in Table 4. In addition, the theoretical predicted wind power output is given in Figure 4. The efficiency of P2G process is taken as 64% [6]. Wind curtailment cost is set as $100/MWh [47]. The short-term optimal dispatch for this hybrid energy system is studied to illustrate the behavior of the proposed model, the adopted algorithm and the proposed constraints handling methods in several case studies. These case studies are simulated with a low level of initial line pack (0.5 Mm3). In addition, all the case studies are implemented using MATLAB language programming.

3.2. Analysis of Simulation Results

The Newton-Raphson method is used to obtain the power flow. Trust region method and L-M method are used to solve the non-linear equations to obtain the gas flow in natural-gas system, respectively. Furthermore, MOBHPSO [39,40,41,42] is used to optimize the multi-objective dispatch problem of hybrid electricity-natural gas energy systems based on the established models (1–3,7,12), the proposed flow chart (Figure 2), and the proposed constraints handling methods. The optimization results are shown in Table 5 and Table 6. All the constraints are satisfied. The comparisons of power output and gas flow among different case studies are given in Figure 5 and Figure 6, respectively. Moreover, it can be found the different performance of trust region method and L-M method from Figure 7 and Table 6. The wind power absorbed by P2G and the gas flow of P2G are shown in Figure 8. The volume of gas storages is given in Figure 9. The gas pressure of each gas node can be found in Appendix A.
From the obtained results, it can be seen that power output, gas flow of gas wells, gas flow of P2G, gas flow of gas storages, volume of gas storages, and gas pressure of gas nodes all satisfy their respective upper and lower bound constraints. Besides, the nodal gas flow balance equation is satisfied. Moreover, power demand and power supply are balanced which can be drawn from the calculated load loss rate Lp = 6.37 × 10⁻¹⁸. Then, the above results show that all the constraints are satisfied using the proposed constraints handling methods.

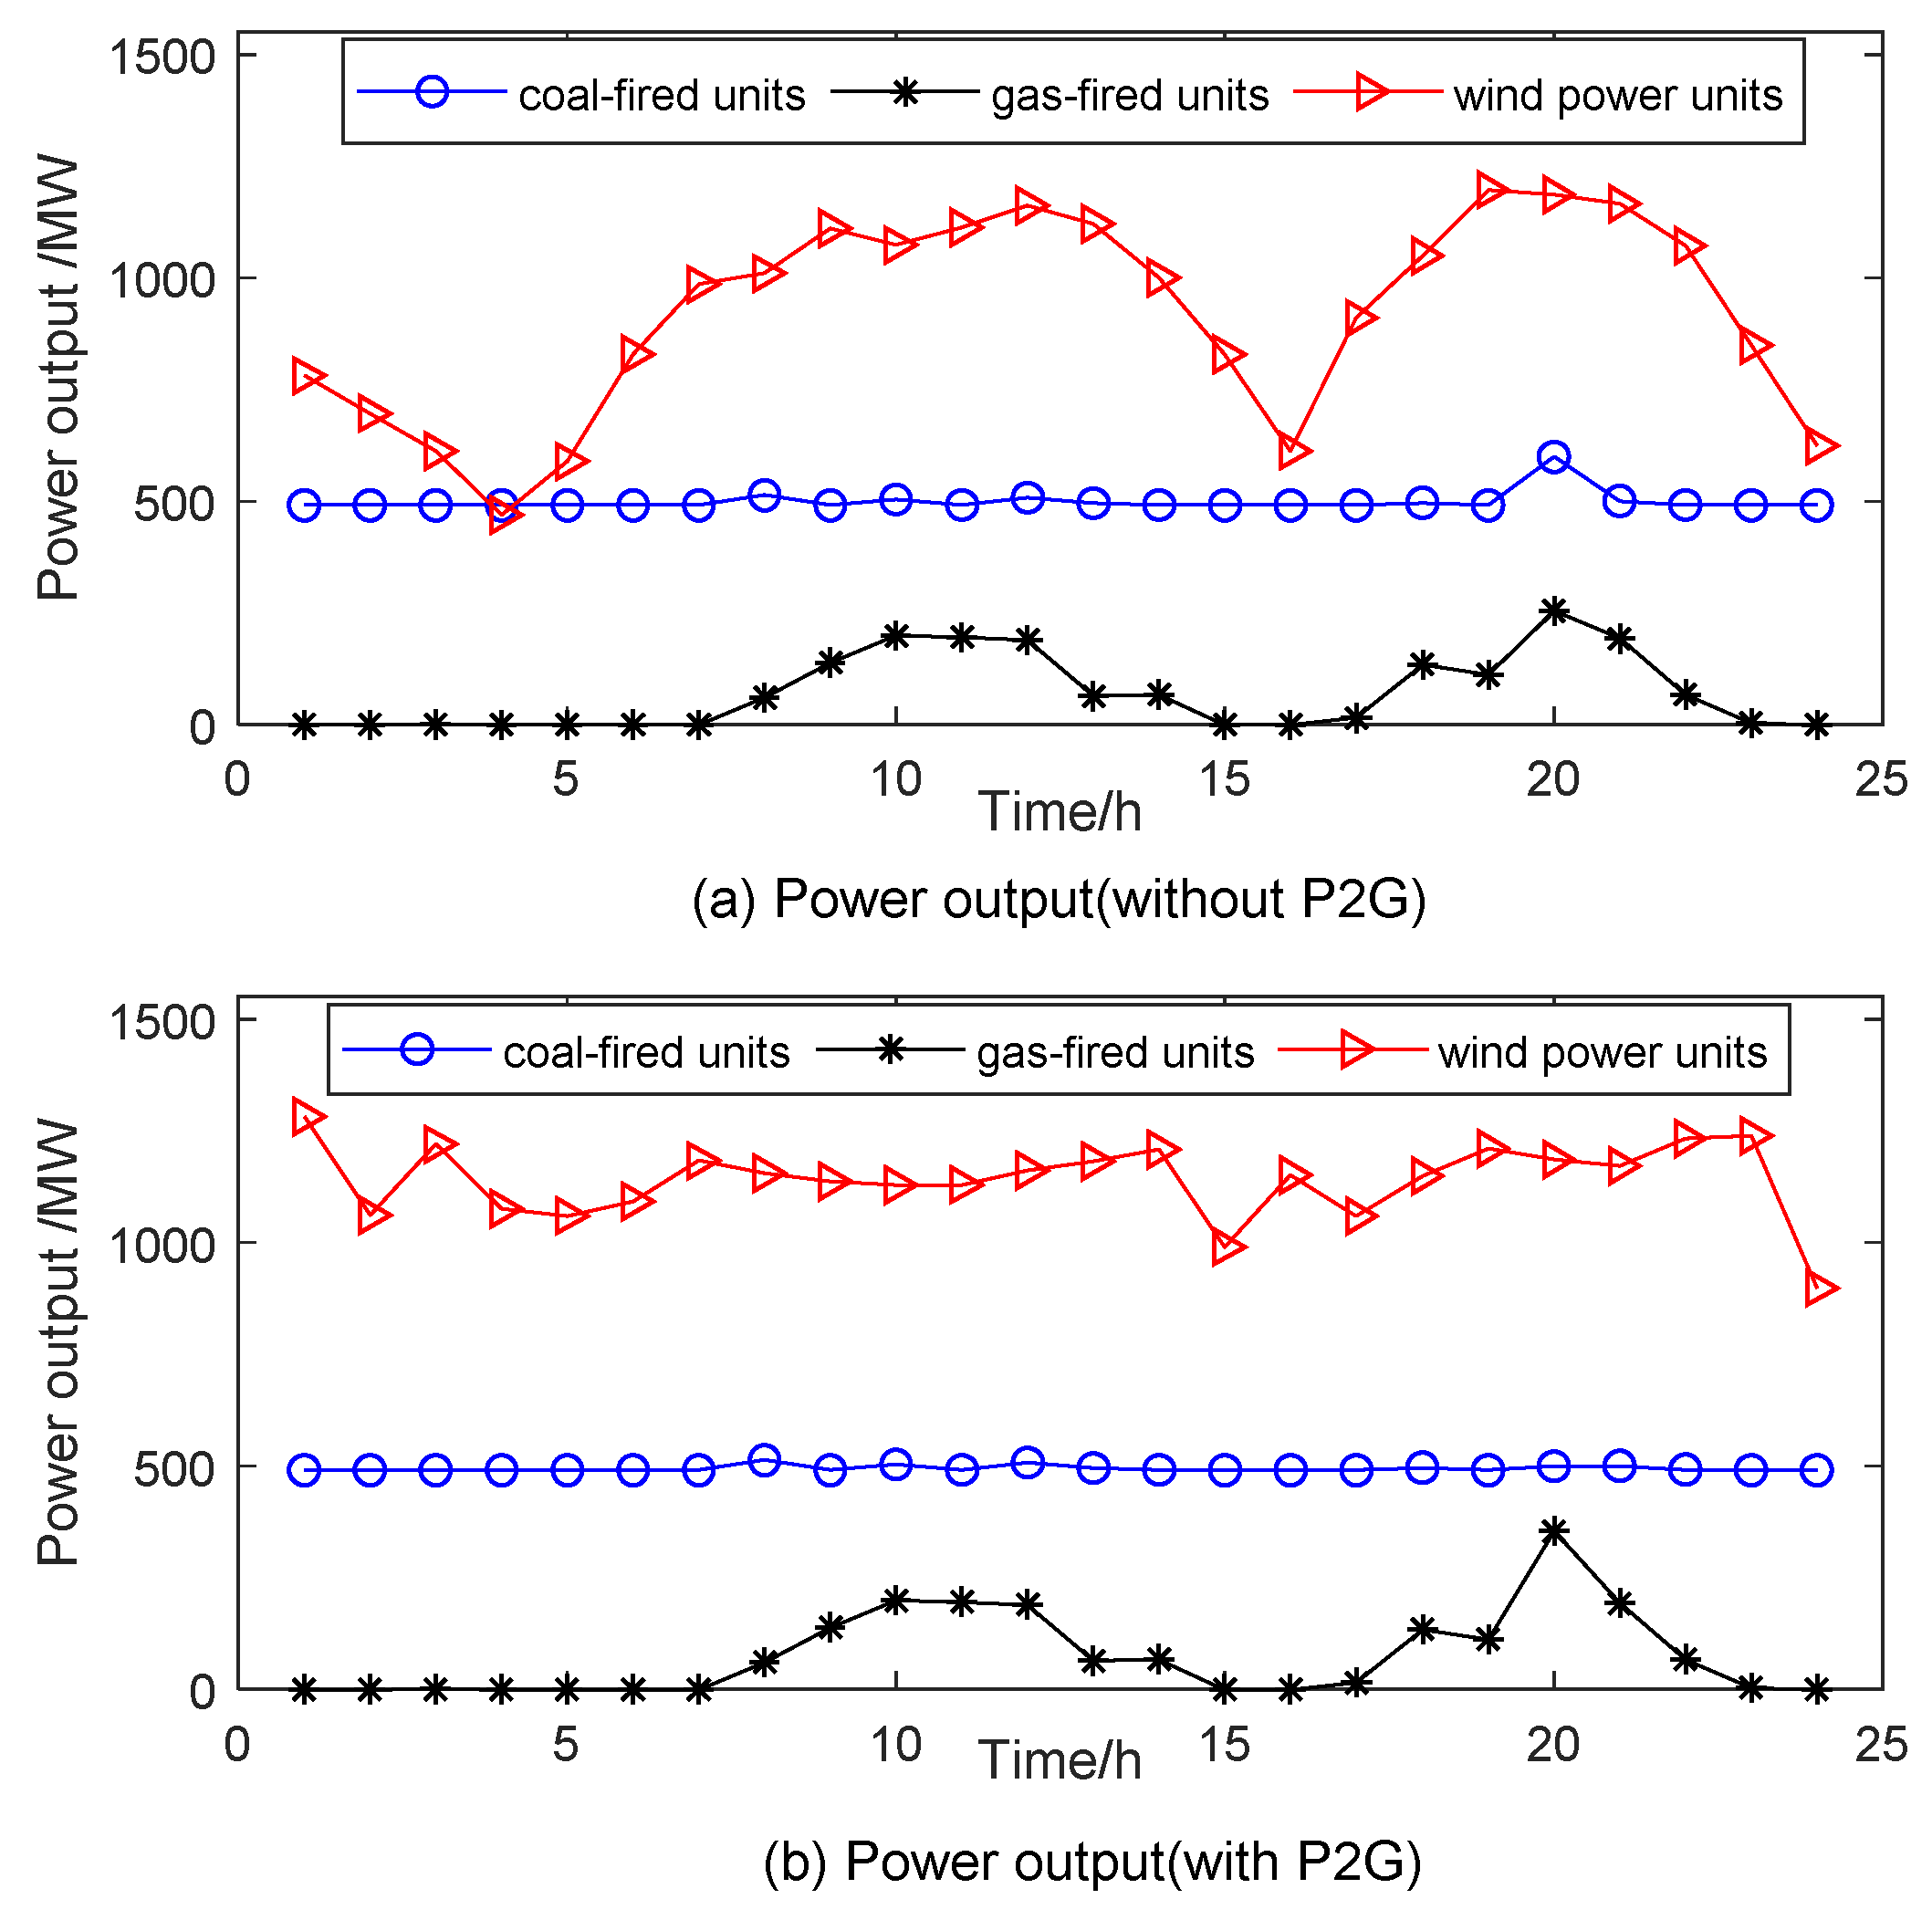
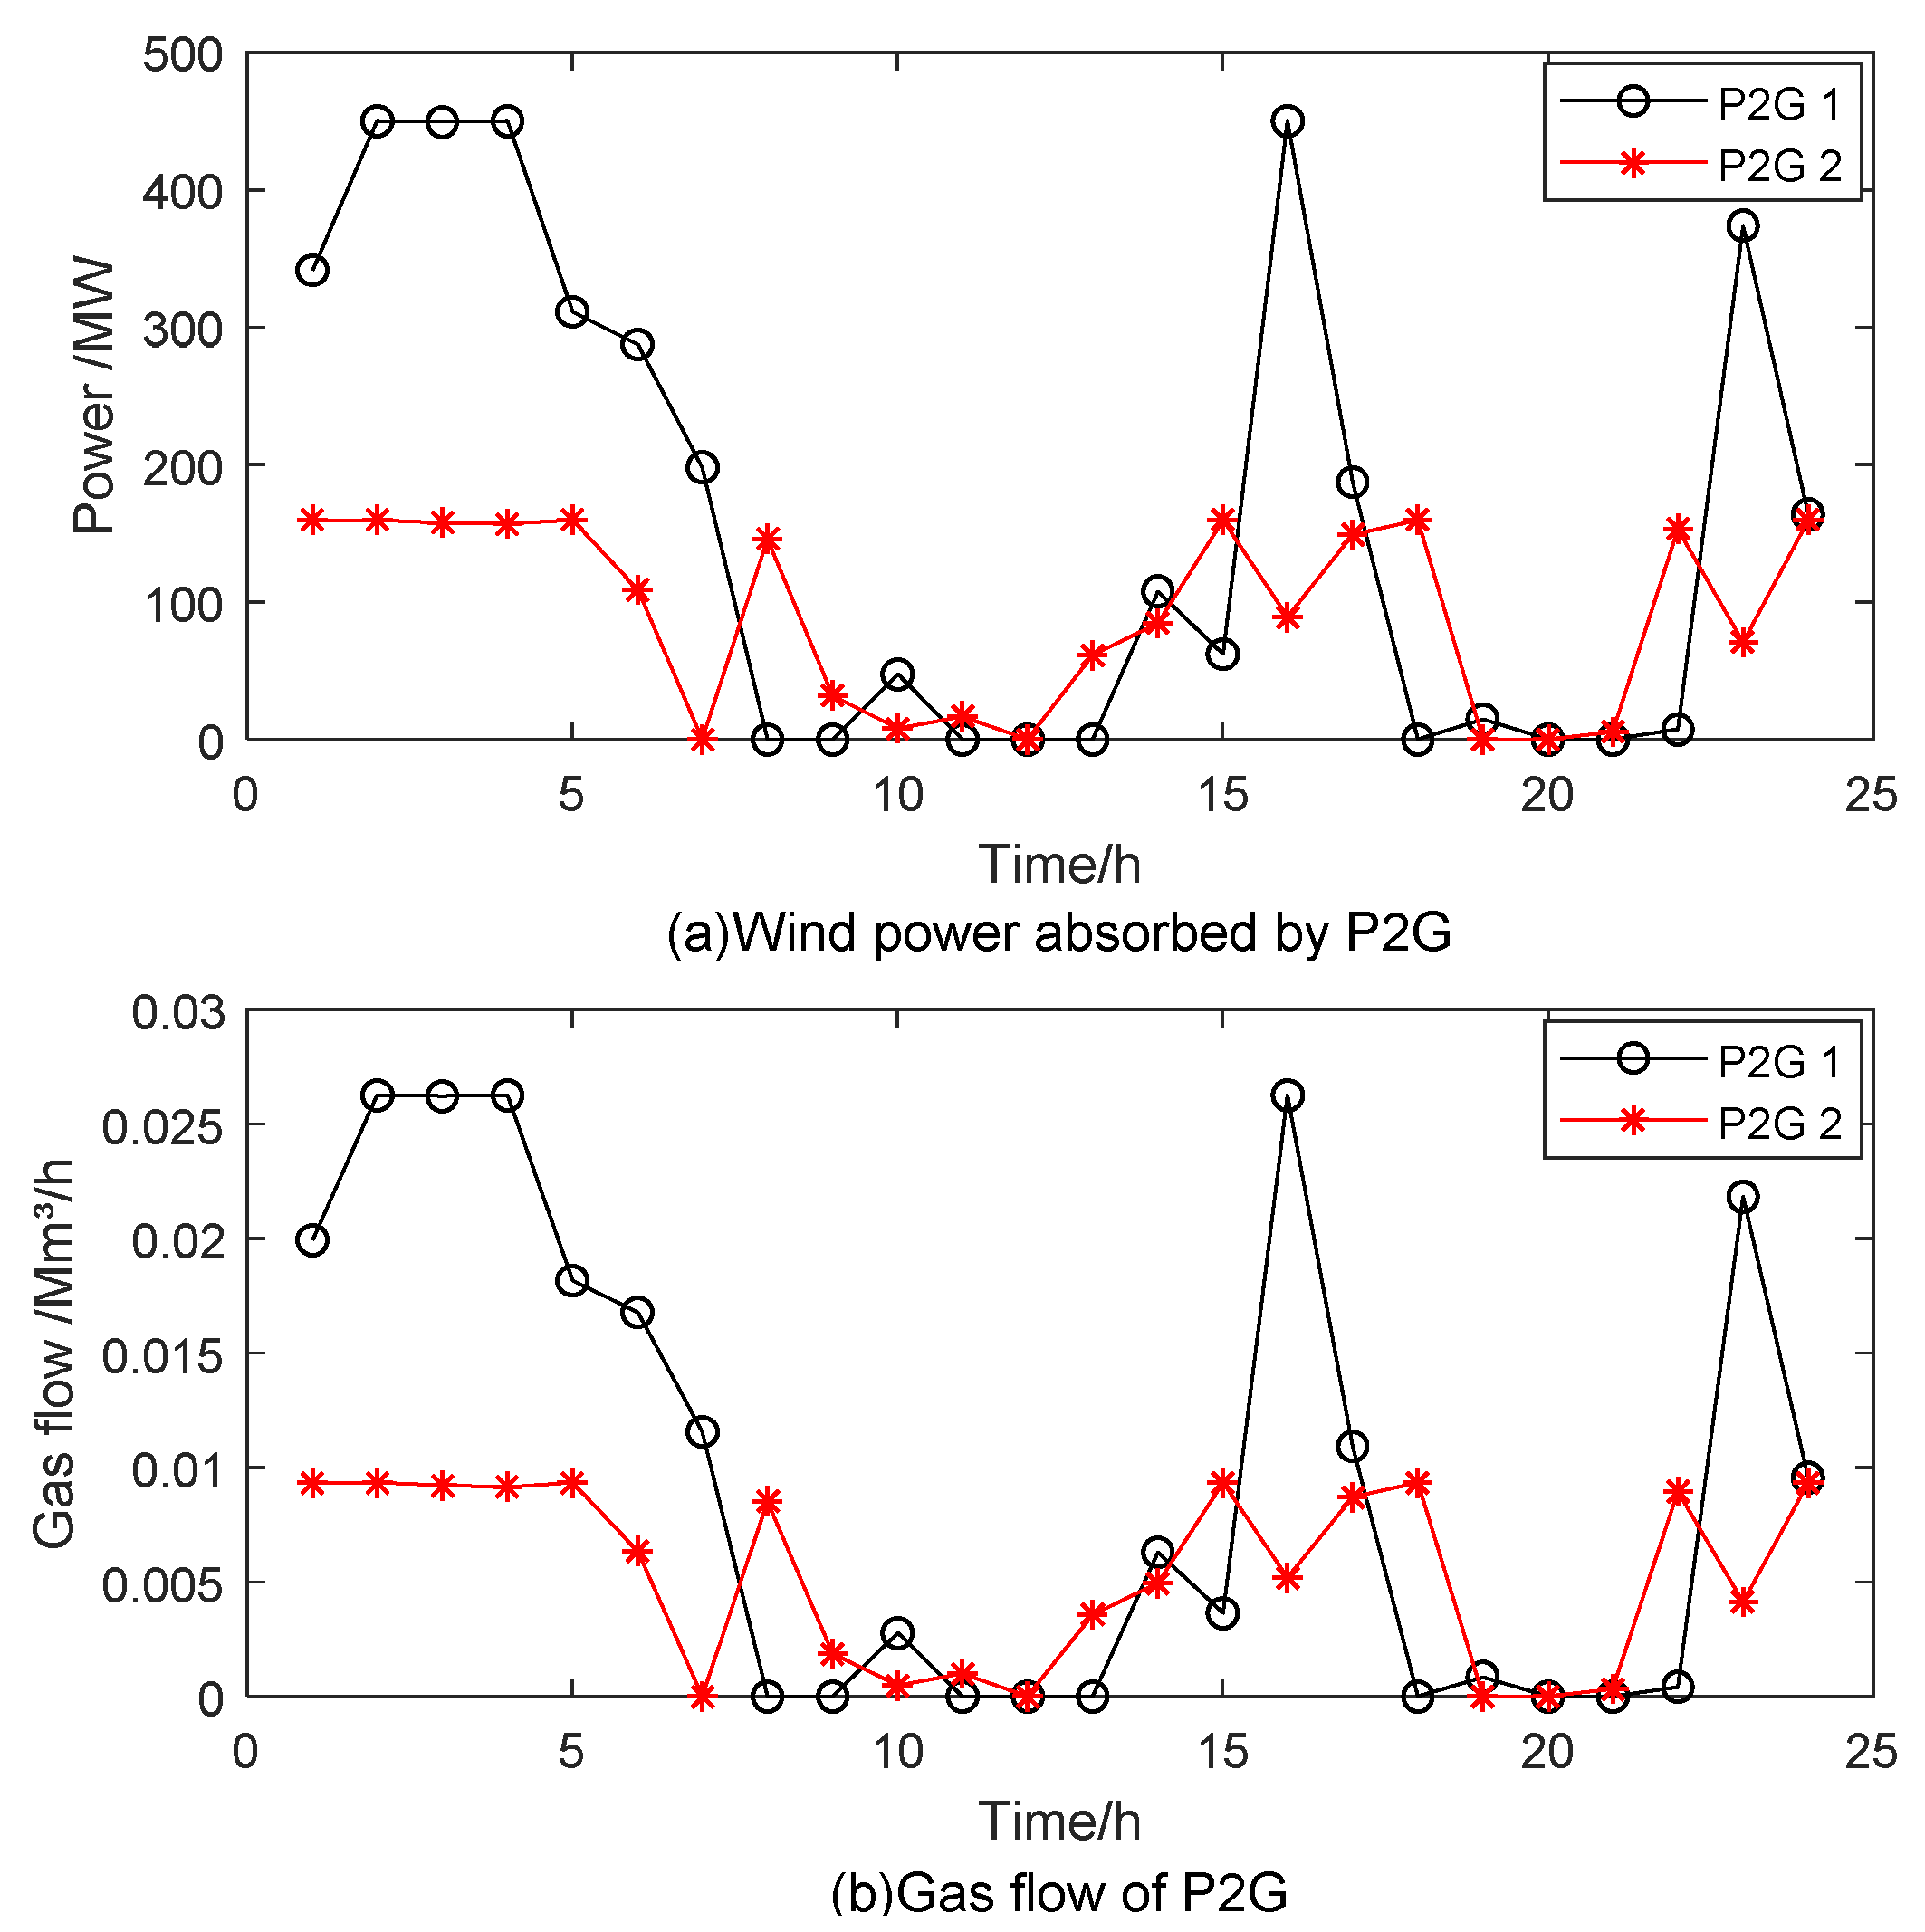
3.2.1. Effects of P2G on the Power System

(1) From Table 5 and Figure 5, it can be seen that the fuel cost of power system with P2G is a little higher than that without P2G. At hour 20, owing to the gas injection from P2G, the pipeline pressure is higher than the maximum value, so the ‘gas demand management strategy’ is used and needs to increase the gas demand by increasing the output of gas-fired units connected with gas node 5 and 14. Then, to guarantee the power load balance, the output of coal-fired units would be reduced. Because the fuel cost of gas-fired units is higher than that of coal-fired units and the SOx emissions of gas-fired units are lower than that of coal-fired units, it leads to increase of fuel cost and decline of SOx emissions. The SOx emissions are reduced by 0.254 ton. In addition, from Figure 8, most abandoned wind power can be absorbed by P2G. During hours 3-5, P2G works at its maximum value when the abandoned wind power is over the maximum capacity of P2G. Owing to the P2G, the wind power output is much smoother and so is the output of coal-fired units, which is propitious to the stability and reliability of the power system.
(2) From Table 6 and Figure 7a, it is obvious that the rate of abandoned wind power is declined from 24.85% to 6.71% (trust region) and from 24.85% to 4.04% (L-M), respectively; The wind power output is increased by 5321.66MWh (trust region) and 6104.48MWh (L-M), respectively.

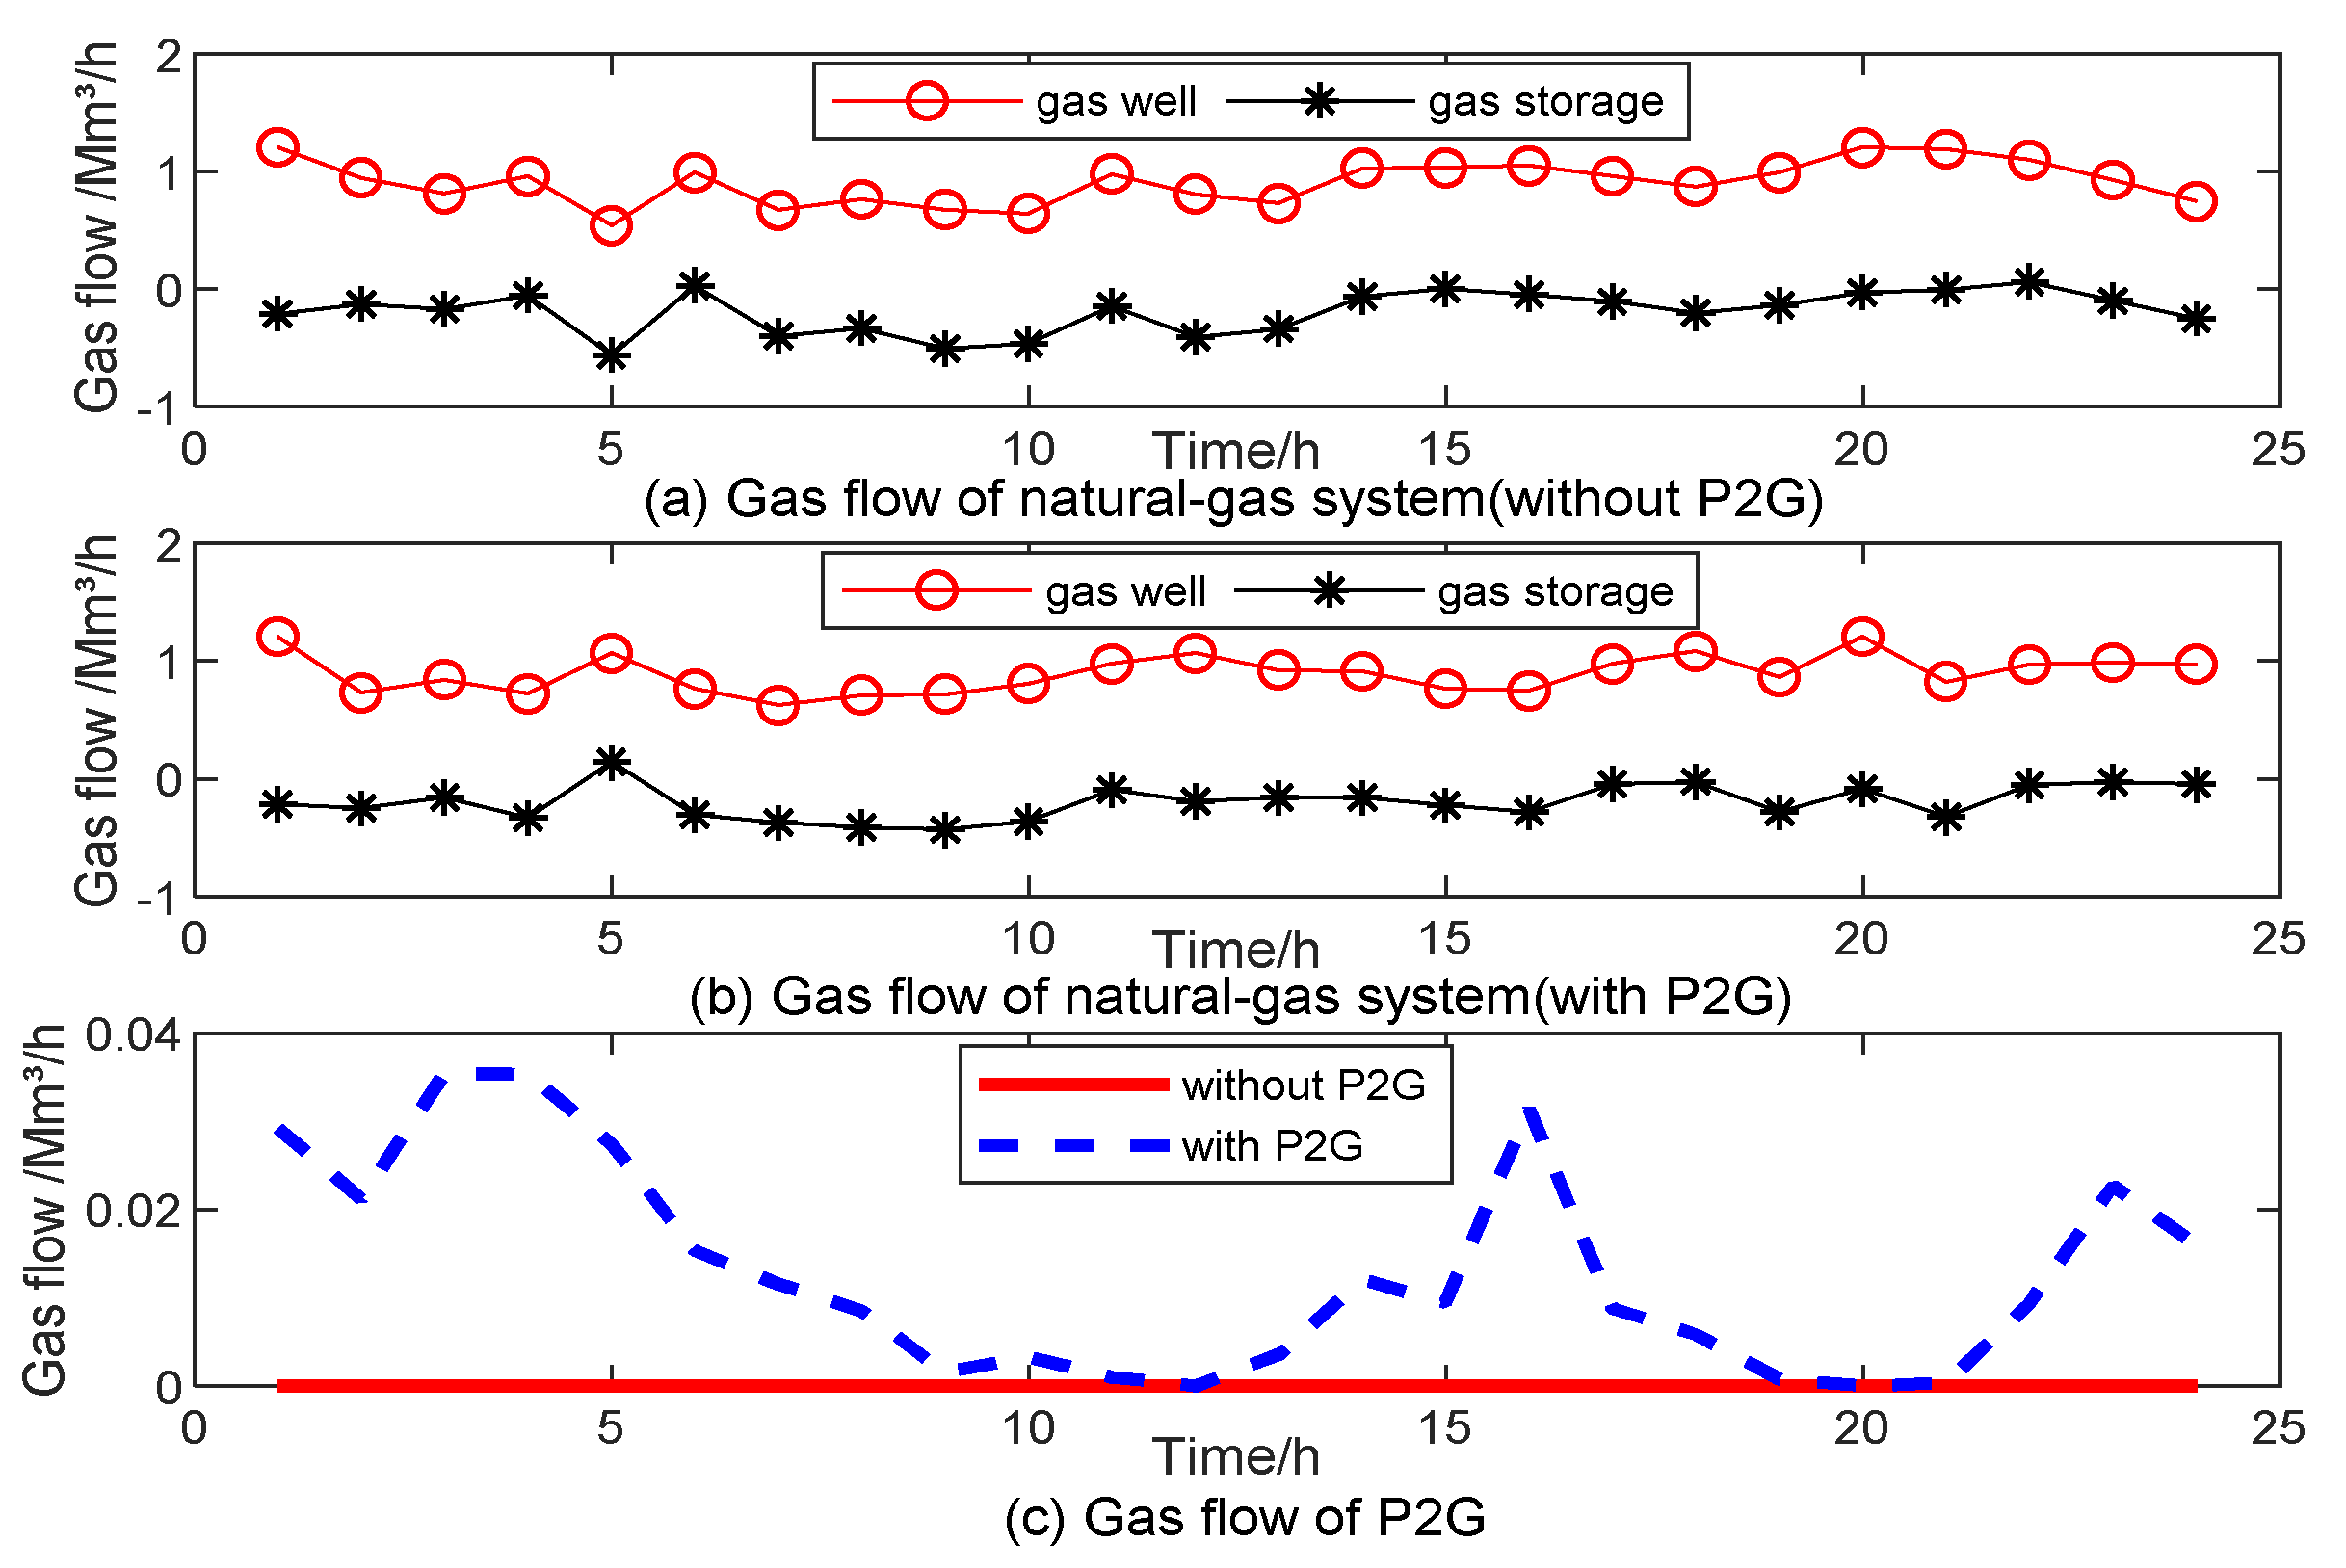
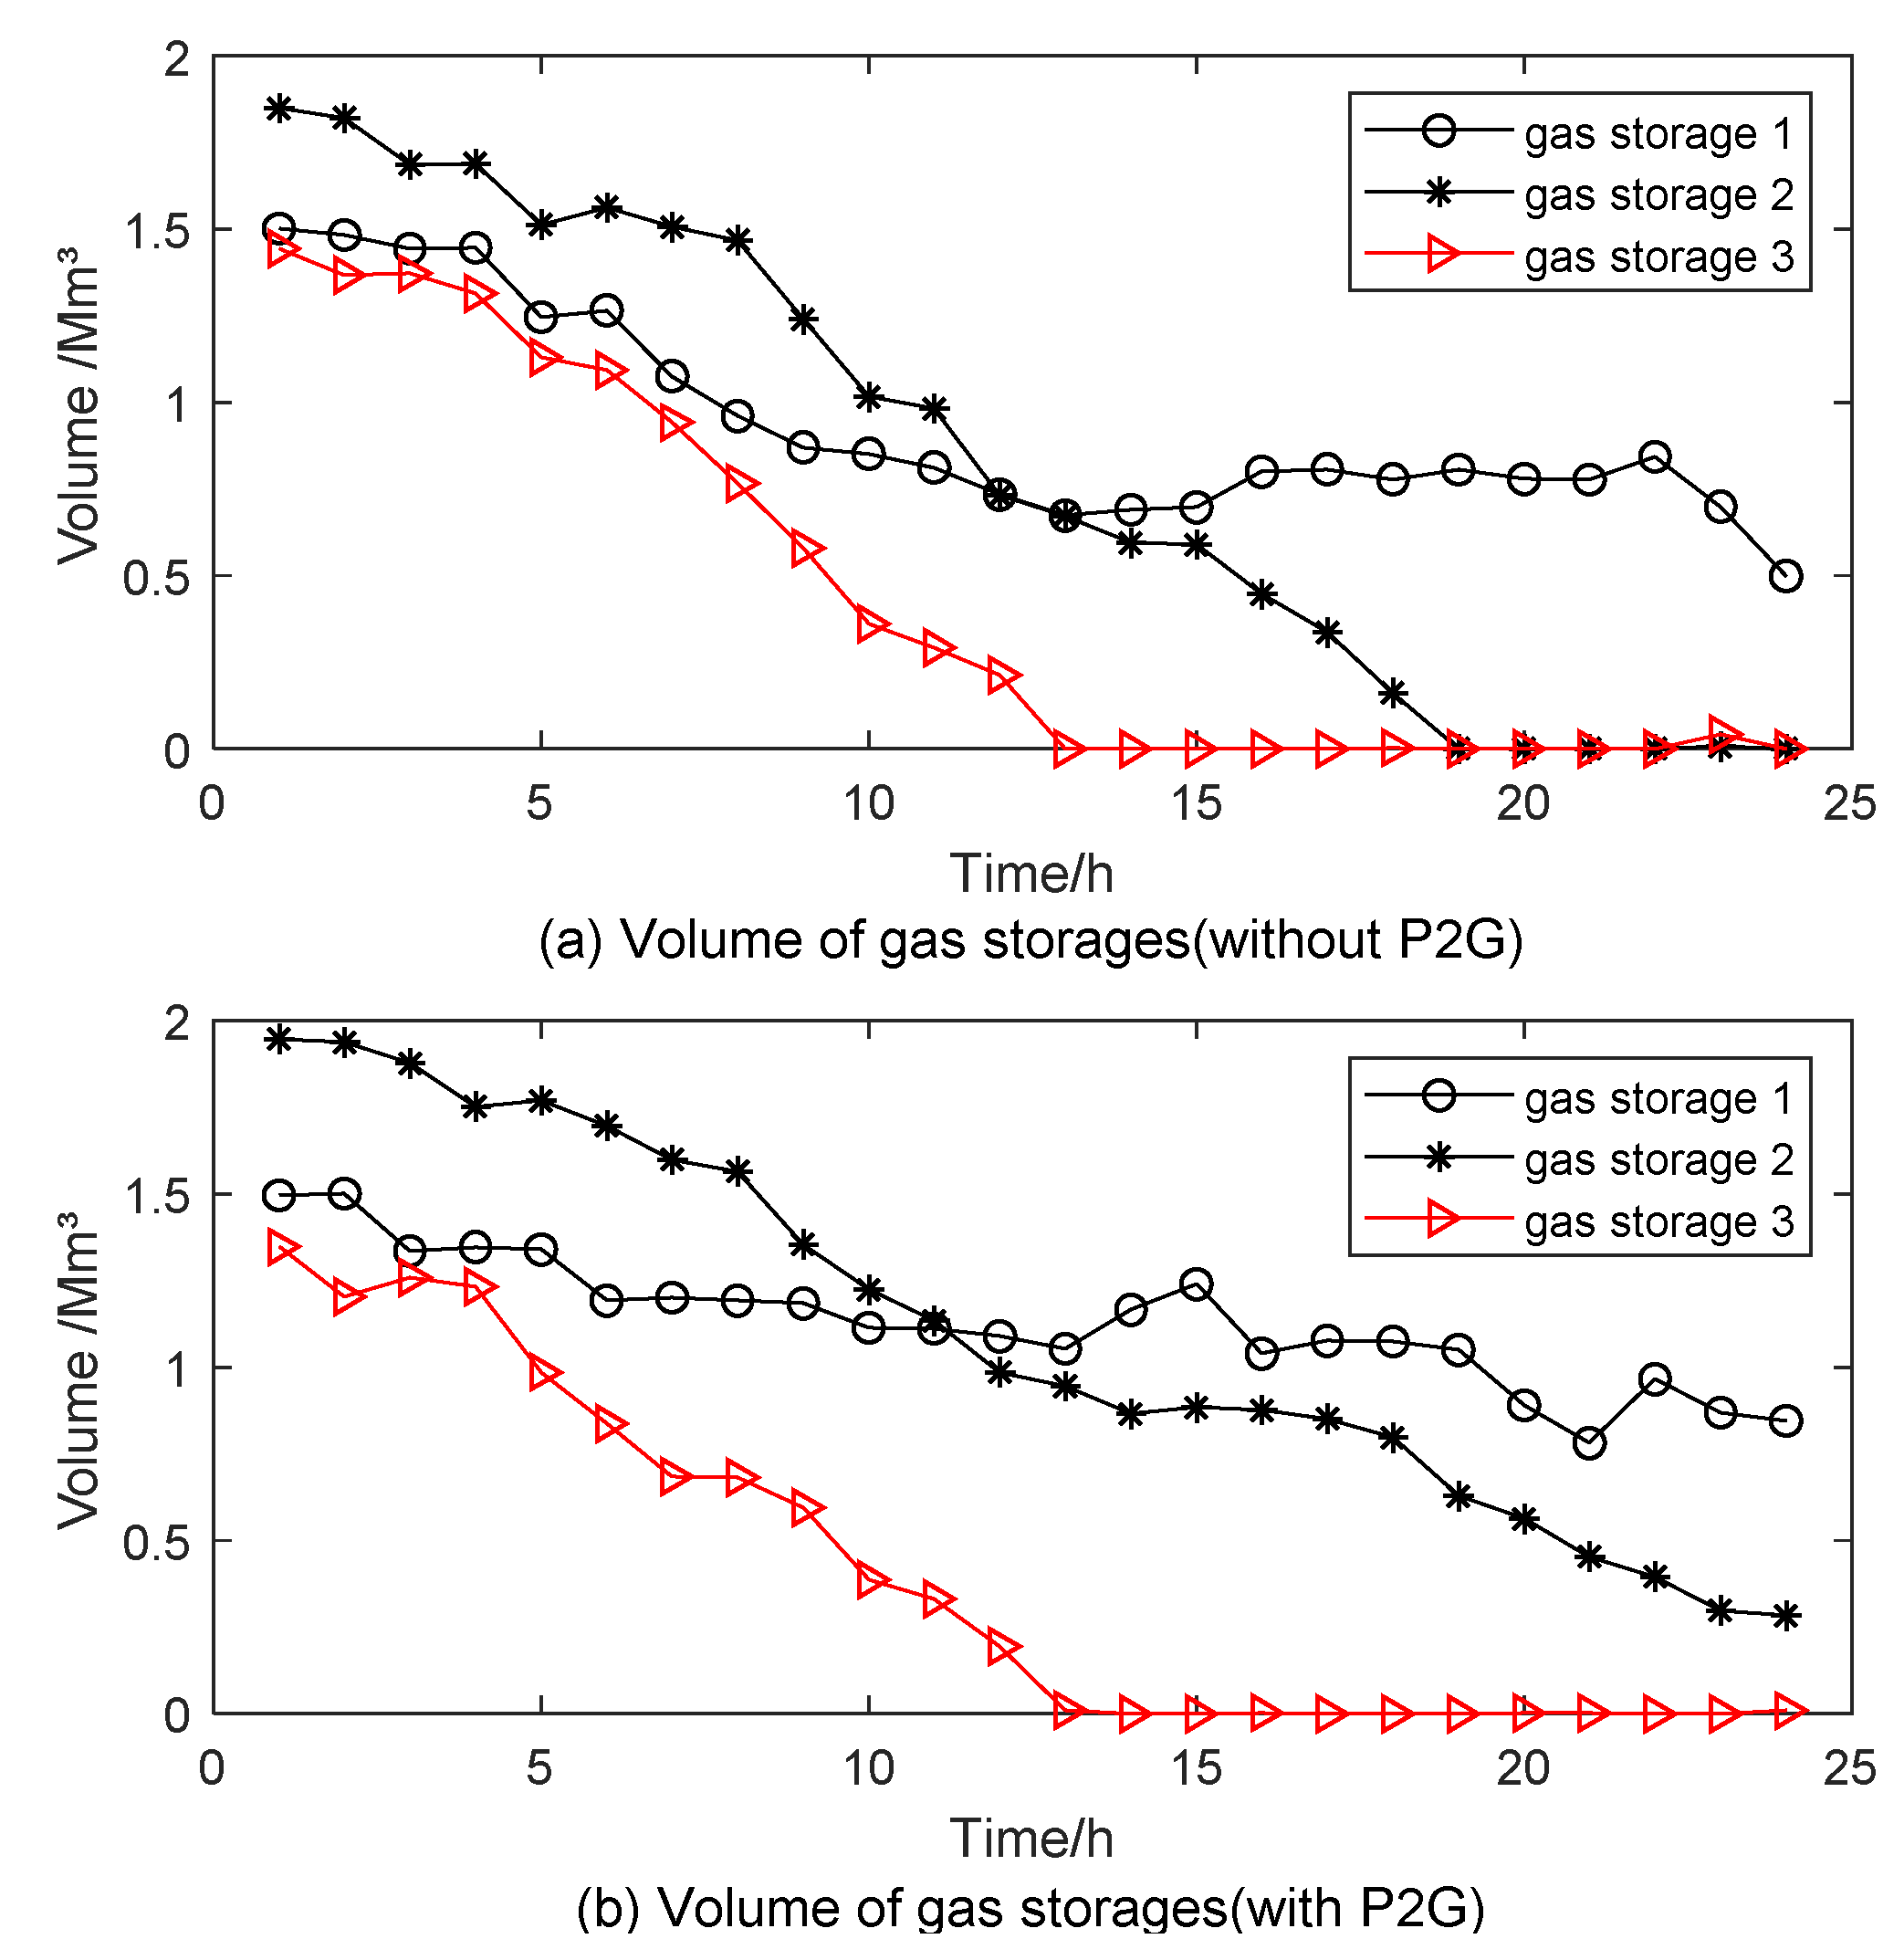
3.2.2. Effects of P2G on the Natural-gas System

From Figure 6 and Figure 9, it is obvious that the gas flow of gas wells and gas storages is lower when P2G is considered. In addition, the volume of gas storages with P2G is much larger than that without P2G. This is because the economic, clean, and low-carbon energy converted by P2G from wind power has the priority of use compared with that from natural gas network, which creates considerable economic and environmental benefits for the integrated energy systems. The cost benefit of P2G is evaluated in terms of the natural gas cost which it displaces. From Table 6, it can be seen the gas cost is reduced by $9000 (trust region) and $10,000 (L-M), respectively; Moreover, the environmental benefit of P2G in terms of CO2 reduction and CO2 absorbed in the P2G methanation process is measured. The total CO2 emissions are declined by 1200 tons (trust region) and 3630 tons (L-M), respectively.

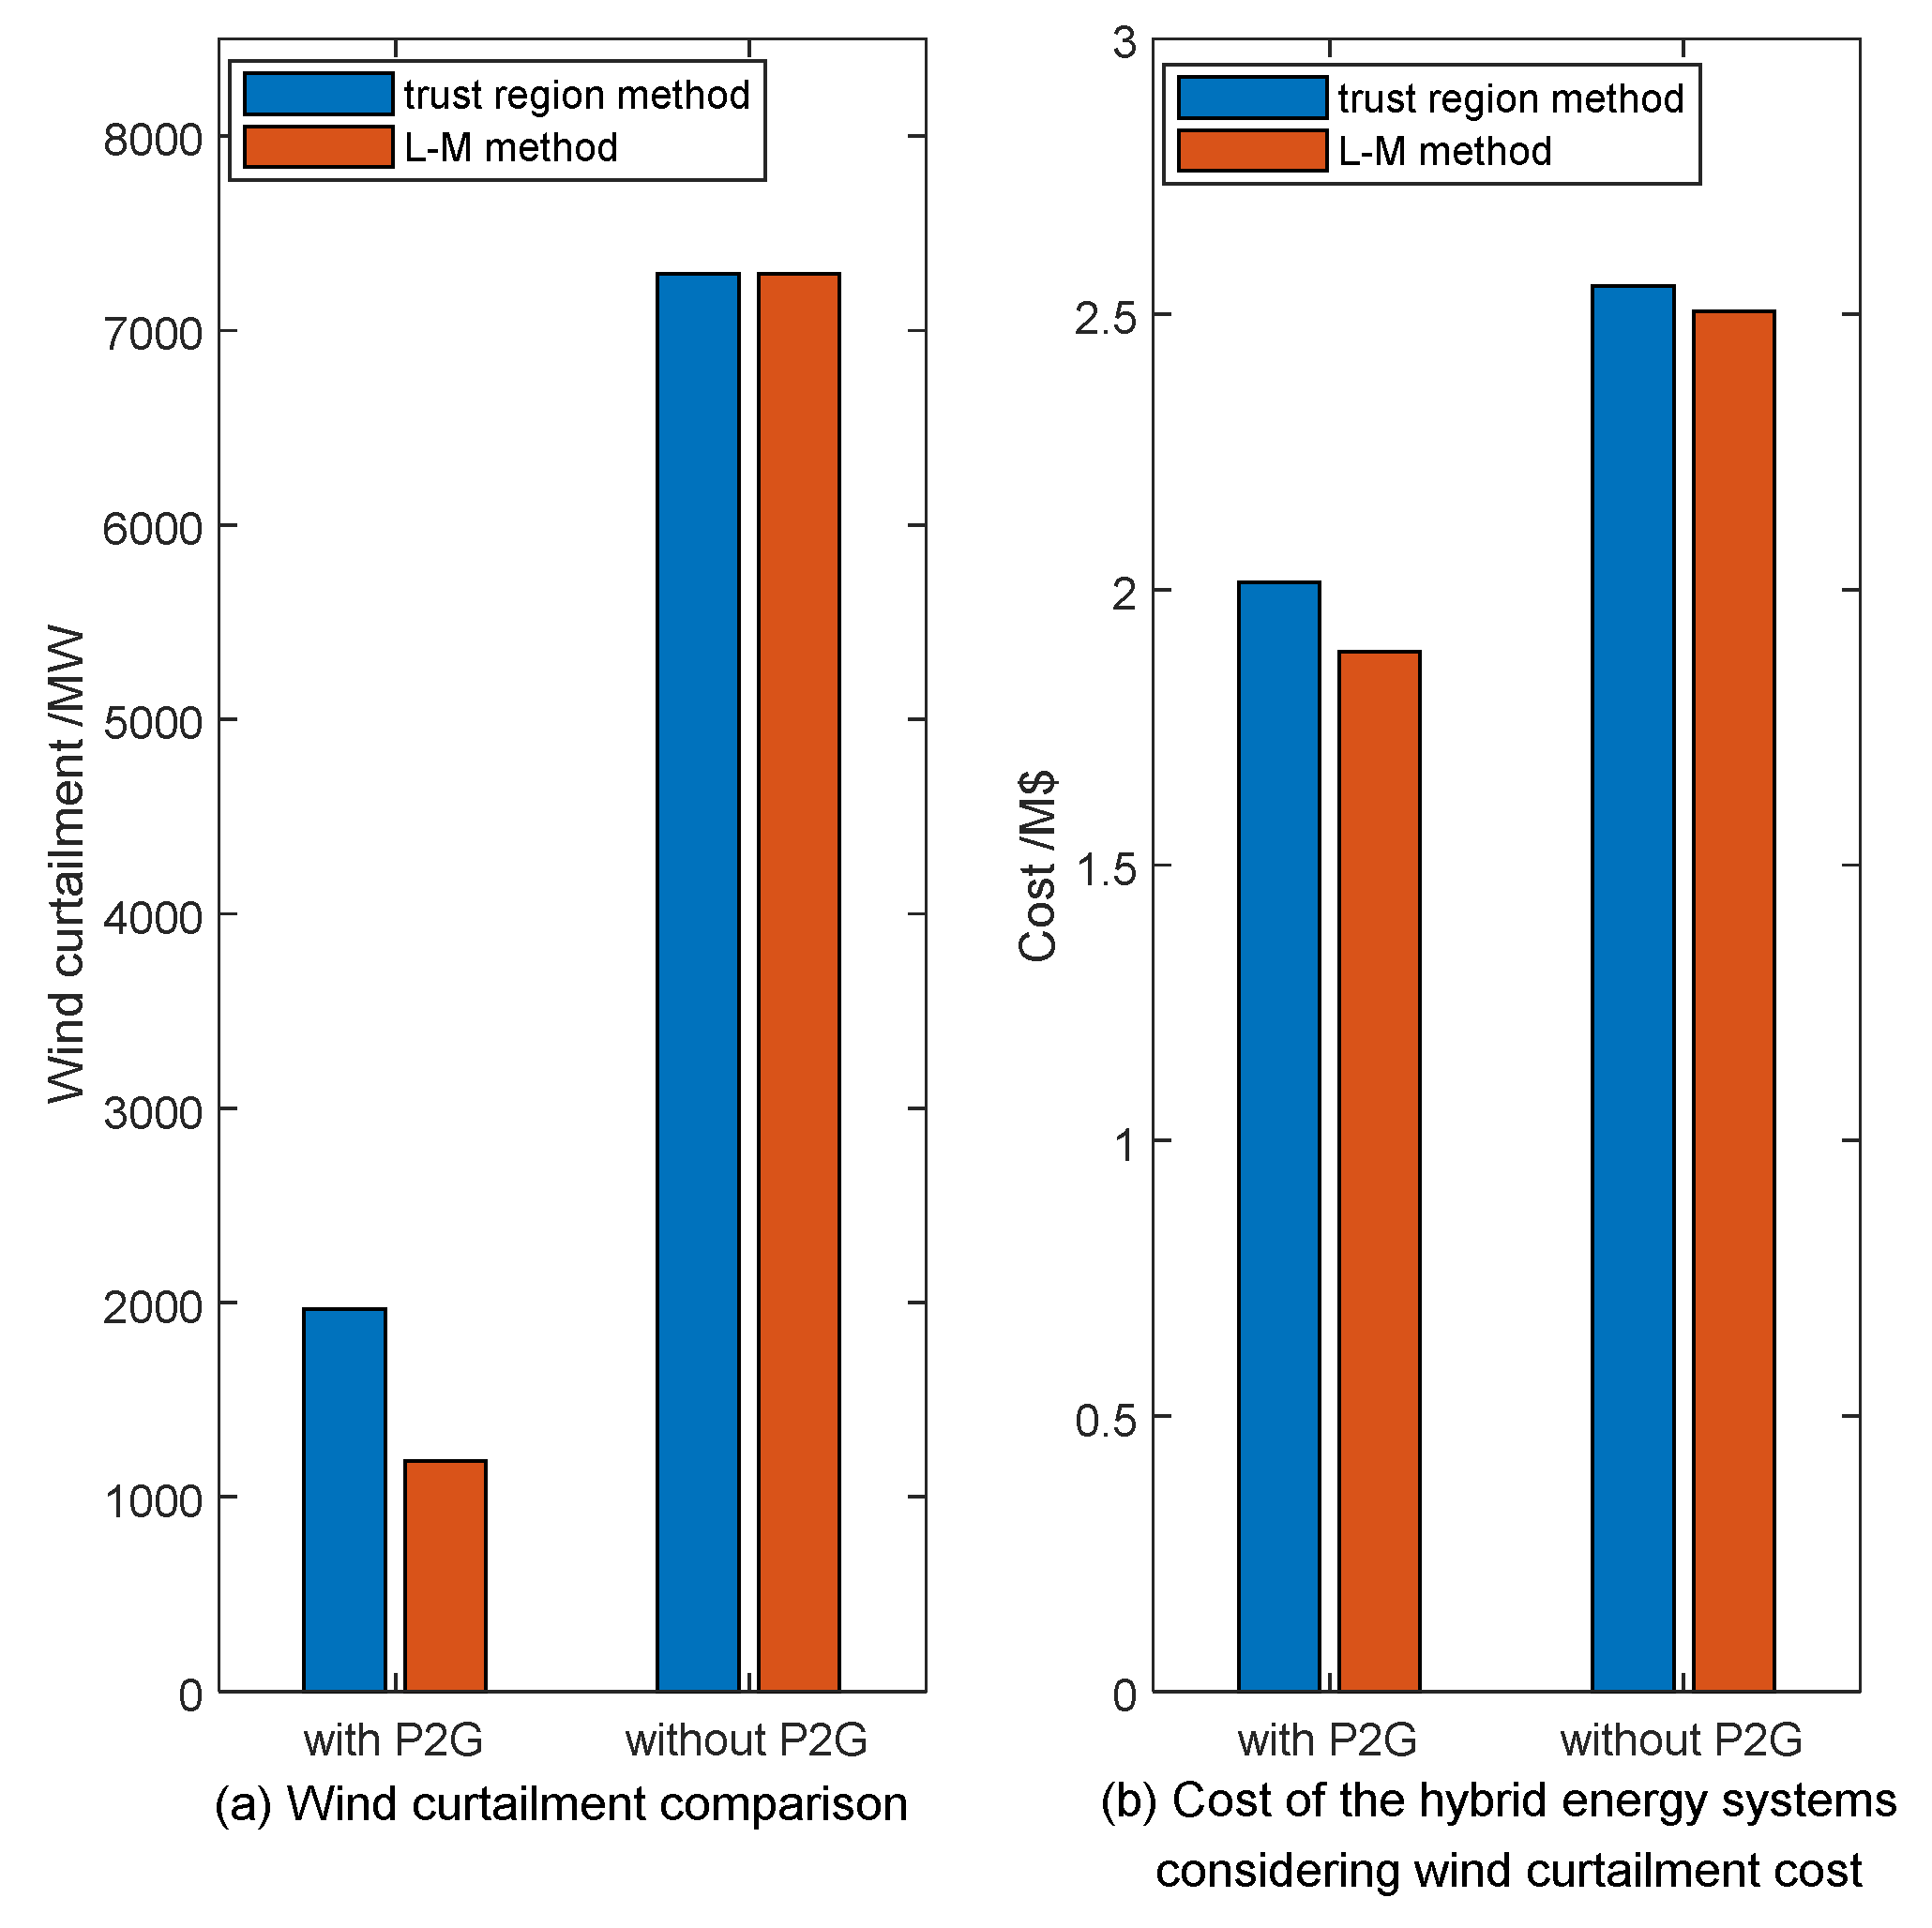
3.2.3. Total Cost Reduction of the Hybrid Energy Systems

The total cost of the hybrid electricity-natural gas energy systems including the wind power curtailment cost is reduced by $5.372 × 10⁵ (trust region) and $6.165 × 10⁵ (L-M), which can be seen from Figure 7b.
It can be concluded that the proposed model shows that the proposed constraints handling methods are effective and the feasibility of MOBHPSO algorithm for solving the multi-objective optimal dispatch problem of the hybrid electricity-natural gas energy systems is indicated. Moreover, the trust region method and L-M method are effective to solve the non-linear gas flow problem. It also can be seen that the results obtained from L-M method is much better than those obtained from trust region method.

4. Conclusions

This paper presented a multi-objective optimal dispatch model of the hybrid electricity-natural gas energy systems coupled by P2G and gas turbines in order to achieve the maximum of low-carbon economic environmental benefits. The proposed model provides not only enhanced flexibility, as it easily handles bidirectional energy flow and guarantees global optimality, but also considers the compressibility of gas, line pack of pipelines among other complicated system characteristics. The non-linear and non-convex functions of gas flow model are addressed by trust region method and L-M method. The L-M method has much better performance, which can be drawn from the simulation results. Moreover, the case studies simulation results show the feasibility of MOBHPSO algorithm for solving the multi-objective optimal dispatch problem of the hybrid electricity-natural gas energy systems and the effectiveness of proposed constraints handling methods. The obtained results also illustrate that P2G can significantly benefit the operation of both power system and natural gas system in smoothing power output, cutting down gas cost, reducing CO2 emissions and SOx emissions as well as avoiding wind curtailment. More specifically, the gas cost is cut down up to $10,000, the total CO2 emissions are declined up to 3630 tons and the SOx emissions are reduced by 0.254 ton as well as the wind power curtailment is decreased up to 6104.48 MWh with the rate of abandoned wind power declined from 24.85% to 4.04%. Besides, the total cost including wind power curtailment cost is reduced up to $6.165 × 10⁵.

Author Contributions

J.L. proposed the optimization model and algorithms, carried out case studies, completed the entire analysis, wrote and revised this paper; G.P.H. gave essential and important advice on the model of natural-gas system; W.S. gave some important suggestions on the calculation of gas flow and revised this paper.

Funding

This research was part funded by EPSRC through the Hydrogen’s Value in the Energy System project, grant number EP/L018284/1 and the National Centre for Energy Systems Integration, grant number EP/P001173/1.

Acknowledgments

The authors would like to thank the financial support of the China Scholarship Council (CSC), as well as Carlos M. Correa-Posada who provided some important data used for the case studies.

Conflicts of Interest

The authors declare no conflict of interest.

Appendix A

Table A1. Gas pressure of each gas node.
Node No.12345678910
Hour 174.746973.838572.535656.744445.518941.036242.870943.839455.746761.3213
Hour 267.063566.500165.649555.117039.923738.180340.981845.824650.240155.2641
Hour 370.978270.628769.625856.855653.133046.943147.442640.351054.509659.9605
Hour 467.703267.171566.396157.249970.713354.950854.203742.944853.398658.7385
Hour 560.312659.890659.221251.734633.922033.580837.139046.931849.991854.9910
Hour 660.234860.009159.282351.211248.207140.785041.223644.195150.025555.0280
Hour 761.706561.219060.511152.766056.640746.267246.266544.852251.105956.2164
Hour 872.021071.292070.171455.545030.762930.759637.314340.582650.348255.3830
Hour 959.653859.219358.519250.430463.620646.367545.928038.784552.469457.7163
Hour 1063.837663.422962.589452.898540.664738.531240.351545.144453.496958.8466
Hour 1170.686669.974968.897154.913627.623027.591135.220241.799050.947856.0425
Hour 1268.917368.336667.381855.260641.960538.535840.982643.469752.365957.6024
Hour 1364.645664.163363.313252.943632.358231.516236.104644.783050.401155.4412
Hour 1468.124367.194666.205053.689745.284940.278741.561739.292451.896157.0857
Hour 1577.347276.339675.104058.251328.626228.707637.748040.538650.142255.1564
Hour 1674.017973.669872.555257.379636.583435.436340.261540.323450.946256.0408
Hour 1772.702671.901070.810356.134535.531534.666139.357639.772650.213555.2349
Hour 1875.134174.365173.195557.244437.524036.475940.846438.148150.253755.2791
Hour 1970.489369.924368.980656.898663.160351.161851.139838.195253.717959.0897
Hour 2090.079089.409787.895566.062730.616632.706144.581738.531351.269356.3962
Hour 2172.925072.485271.464257.278144.513641.671544.029038.216256.407462.0482
Hour 2269.507868.366867.347053.890037.196435.803639.064338.533254.357959.7937
Hour 2370.048469.609068.653756.651259.895949.689049.703240.421853.297958.6277
Hour 2456.745656.319955.579046.781133.059031.203433.367638.344564.631171.0942
Node No.11121314151617181920
Hour 154.108150.585546.087544.745635.304725.745349.710535.417026.120825.9488
Hour 251.723650.344547.820046.713437.853629.158249.953740.219131.277931.1271
Hour 354.367551.362345.176340.714331.660021.118151.035643.008935.462335.3304
Hour 453.873151.425546.473343.506534.308724.381651.166844.606937.996037.8745
Hour 551.946750.934149.061048.408239.053230.591850.722145.169939.141039.0242
Hour 651.306649.850646.902045.309536.210327.282949.673644.841339.151539.0360
Hour 752.244550.617247.486045.914236.801627.891350.407045.103739.322839.2076
Hour 850.836048.709144.101341.057531.866621.343748.556644.177038.634338.5179
Hour 952.301849.473843.557739.596629.370017.215549.271344.125538.348038.2301
Hour 1054.300052.193148.281646.374636.701327.368051.923445.623039.505239.3897
Hour 1151.682949.654645.247642.390033.284923.297749.499844.994339.399339.2845
Hour 1252.984250.828746.578044.199235.024725.432050.614445.282339.531639.4170
Hour 1351.705150.212047.258945.817636.645927.623550.028245.124739.464739.3501
Hour 1451.973049.382743.784439.814730.318519.070149.211644.556538.970238.8546
Hour 1550.521148.326643.703440.939931.368420.157348.164943.677338.093937.9760
Hour 1651.104148.702343.760340.730231.177519.942648.507143.454937.639537.5197
Hour 1750.422048.103243.238840.229530.503918.917047.921543.025237.179037.0577
Hour 1850.150047.576442.090638.479228.480915.597247.395242.503836.613436.4903
Hour 1953.156249.880843.142538.569228.372515.192549.624343.500037.242837.1207
Hour 2051.198348.474342.561538.594328.770115.857748.292743.279537.319837.1984
Hour 2155.617151.848344.088238.536228.417115.292951.560844.956338.661638.5433
Hour 2254.161150.971844.034039.108728.776715.874650.770145.418639.508239.3929
Hour 2353.390650.615544.748040.933031.094919.598350.424745.393639.697439.5833
Hour 2463.309158.178747.770739.503728.762316.124057.773449.468643.038642.9313

References

  1. Mazza, A.; Bompard, E.; Chicco, G. Application of power to gas technologies in emerging electrical systems. Renew. Sustain. Energy Rev. 2018, 92, 794–806. [Google Scholar] [CrossRef]
  2. Hibbard, P.J.; Schatzki, T. The interdependence of electricity and natural gas: Current factors and future prospects. Electr. J. 2012, 25, 6–17. [Google Scholar] [CrossRef]
  3. Correa-Posada, C.M.; Sánchez-Martín, P. Integrated power and natural gas model for energy adequacy in short-term operation. IEEE Trans. Power Syst. 2015, 30, 3347–3355. [Google Scholar] [CrossRef]
  4. Schiebahn, S.; Grube, T.; Robinius, M.; Tietze, V.; Kumar, B.; Stolten, D. Power to gas: Technological overview, systems analysis and economic assessment for a case study in Germany. Int. J. Hydrogen Energy 2015, 40, 4285–4294. [Google Scholar] [CrossRef]
  5. Götz, M.; Lefebvre, J.; Mörs, F.; McDaniel Koch, A.; Graf, F.; Bajohr, S.; Reimert, R.; Kolb, T. Renewable power-to-gas: A technological and economic review. Renew. Energy 2016, 85, 1371–1390. [Google Scholar] [CrossRef]
  6. Maroufmashat, A.; Fowler, M. Transition of future energy system infrastructure: Through power-to-gas pathways. Energies 2017, 10, 1089. [Google Scholar] [CrossRef]
  7. Mukherjee, U.; Maroufmashat, A.; Narayan, A.; Elkamel, A.; Fowler, M. A stochastic programming approach for the planning and operation of a power to gas energy hub with multiple energy recovery pathways. Energies 2017, 10, 868. [Google Scholar] [CrossRef]
  8. Eveloy, V.; Gebreegziabher, T. A review of projected power-to-gas deployment scenarios. Energies 2018, 11, 1824. [Google Scholar] [CrossRef]
  9. Clegg, S.; Mancarella, P. Integrated modeling and assessment of the operational impact of power-to-gas (P2G) on electrical and gas transmission networks. IEEE Trans. Sustain. Energy 2015, 6, 1234–1244. [Google Scholar] [CrossRef]
  10. Department of Energy and Climate Change. The Future of Heating: Meeting the Challenge; HM Government: London, UK, 2013. [Google Scholar]
  11. Ball, M.B.; Wietschel, M. The Hydrogen Economy: Opportunities and Challenges; Cambridge University Press: Cambridge, UK, 2009.
  12. An, S.; Li, Q.; Gedra, T.W. Natural gas and electricity optimal power flow. In Proceedings of the IEEE PES Transmission and Distribution Conference and Exposition, Dallas, TX, USA, 7–12 September 2003. [Google Scholar] [CrossRef]
  13. Chen, S.; Wei, Z.N.; Sun, G.Q.; Wang, D.; Sun, Y.H.; Zang, H.X.; Zhu, Y. Probabilistic energy flow analysis in integrated electricity and natural-gas energy systems. Proc. CSEE 2015, 35, 6331–6340. [Google Scholar] [CrossRef]
  14. Sun, G.Q.; Chen, S.; Wei, Z.N.; Chen, S.; Li, Y.C. Probabilistic optimal power flow of combined natural gas and electric system considering correlation. Autom. Electr. Power Syst. 2015, 39, 11–17. [Google Scholar] [CrossRef]
  15. Osiadacz, A.J. Simulation and Analysis of Gas Networks; Gulf Publishing Company: Houston, TX, USA, 1987. [Google Scholar]
  16. Liu, C.; Shahidehpour, M.; Fu, Y.; Li, Z.Y. Security-constrained unit commitment with natural gas transmission constraints. IEEE Trans. Power Syst. 2009, 24, 1523–1536. [Google Scholar] [CrossRef]
  17. Geidl, M.; Andersson, Q. Optimal power flow of multiple energy carriers. IEEE Trans. Power Syst. 2007, 22, 145–155. [Google Scholar] [CrossRef]
  18. Qadrdan, M.; Wu, J.Z.; Jenkins, N.; Ekanayake, J. Operating strategies for a GB integrated gas and electricity network considering the uncertainty in wind power forecasts. IEEE Trans. Sustain. Energy 2014, 5, 128–138. [Google Scholar] [CrossRef]
  19. Chaudry, M.; Jenkins, N.; Strbac, G. Multi-time period combined gas and electricity network optimization. Electr. Power Syst. Res. 2008, 78, 1265–1279. [Google Scholar] [CrossRef]
  20. Wang, W.L.; Wang, D.; Jia, H.J.; Chen, Z.Y.; Guo, B.Q.; Zhou, H.M.; Fan, M.H. Steady state analysis of electricity-gas regional integrated energy system with consideration of NGS network status. Proc. CSEE 2017, 37, 1293–1304. [Google Scholar] [CrossRef]
  21. Odetayo, B.; Kazemi, M.; MacCormack, J.; Rosehart, W.D.; Zareipour, H.; Seifi, A.R. A chance constrained programming approach to the integrated planning of electric power generation, natural gas network and storage. IEEE Trans. Power Syst. 2018, 33, 6883–6893. [Google Scholar] [CrossRef]
  22. Guandalini, G.; Robinius, M.; Grube, T.; Campanari, S.; Stolten, D. Long-term power-to-gas potential from wind and solar power: A country analysis for Italy. Int. J. Hydrogen Energy 2017, 42, 13389–13406. [Google Scholar] [CrossRef] [Green Version]
  23. Liu, W.J.; Wen, F.S.; Xue, Y.S. Power-to-gas technology in energy systems: Current status and prospects of potential operation strategies. J. Mod. Power Syst. Clean Energy 2017, 5, 439–450. [Google Scholar] [CrossRef]
  24. He, L.C.; Lu, Z.G.; Zhang, J.F.; Geng, L.J.; Zhao, H.; Li, X.P. Low-carbon economic dispatch for electricity and natural gas systems considering carbon capture systems and power-to-gas. Appl. Energy 2018, 224, 357–370. [Google Scholar] [CrossRef]
  25. International Energy Agency. Prospects for Hydrogen and Fuel Cell; International Energy Agency: Paris, France, 2005. [Google Scholar]
  26. De Vries, H.; Florisson, O.; Tiekstra, G. Safe operation of natural gas appliances fueled with hydrogen/natural gas mixtures (progress obtained in the naturally-project). In Proceedings of the International Conference on Hydrogen Safety, San Sebastián, Spain, 11–13 September 2007. [Google Scholar] [CrossRef]
  27. Dodds, P.E.; Demoullin, S. Conversion of the UK gas system to transport hydrogen. Int. J. Hydrogen Energy 2013, 38, 7189–7200. [Google Scholar] [CrossRef] [Green Version]
  28. Biegger, P.; Kirchbacher, F.; Medved, A.R.; Miltner, M.; Lehner, M.; Harasek, M. Development of honeycomb methanation catalyst and its application in power to gas systems. Energies 2018, 11, 1679. [Google Scholar] [CrossRef]
  29. Li, Y.; Liu, W.J.; Zhao, J.H.; Wen, F.S.; Dong, C.Y.; Zheng, Y.; Zhang, R. Optimal dispatch of combined electricity-gas-heat energy systems with power-to-gas devices and benefit analysis of wind power accommodation. Power Syst. Technol. 2016, 40, 3680–3688. [Google Scholar] [CrossRef]
  30. Clegg, S.; Mancarella, P. Integrated electrical gas network flexibility assessment in low-carbon multi-energy systems. IEEE Trans. Sustain. Energy 2016, 7, 718–731. [Google Scholar] [CrossRef]
  31. Ye, J.; Yuan, R.X. Integrated natural gas, heat, and power dispatch considering wind power and power-to-gas. Sustainability 2017, 9, 602. [Google Scholar] [CrossRef]
  32. Li, G.Q.; Zhang, R.F.; Jiang, T. security-constrained bi-level economic dispatch model for integrated natural gas and electricity systems considering wind power and power-to-gas process. Appl. Energy 2017, 194, 696–704. [Google Scholar] [CrossRef]
  33. Guandalini, G.; Campanari, S.; Romano, M.C. Power-to-gas plants and gas turbines for improved wind energy dispatchability: Energy and economic assessment. Appl. Energy 2015, 147, 117–130. [Google Scholar] [CrossRef]
  34. Chen, Z.Y.; Wang, D.; Jia, H.J.; Wang, W.L.; Guo, B.Q.; Qu, B.; Fan, M.H. Research on optimal day-ahead economic dispatching strategy for microgrid considering P2G and multi-source energy storage system. Proc. CSEE 2017, 37, 3067–3077. [Google Scholar] [CrossRef]
  35. Wei, Z.N.; Zhang, S.D.; Sun, G.Q.; Zang, H.Y.; Chen, S.; Chen, S. Power-to-gas considered peak load shifting research for integrated electricity and natural-gas energy systems. Proc. CSEE 2017, 37, 4601–4609. [Google Scholar] [CrossRef]
  36. He, C.; Liu, T.Q.; Wu, L.; Shahidepour, M. Robust coordination of interdependent electricity and natural gas systems in day-ahead scheduling for facilitating volatile renewable generations via power-to-gas technology. J. Mod. Power Syst. Clean Energy 2017, 5, 375–388. [Google Scholar] [CrossRef]
  37. Shu, K.G.; Ai, X.M.; Fang, J.K.; Yao, W.; Chen, Z.; He, H.B.; Wen, J.Y. Real-time subsidy based robust scheduling of the integrated power and gas system. Appl. Energy 2019, 236, 1158–1167. [Google Scholar] [CrossRef]
  38. Qu, K.P.; Zheng, B.M.; Yu, T.; Li, H.F. Convex decoupled-synergetic strategies for robust multi-objective power and gas flow considering power to gas. Energy 2019, 168, 753–771. [Google Scholar] [CrossRef]
  39. Liu, J.; Luo, X.J. Environmental economic dispatching adopting multi-objective random black-hole particle swarm optimization algorithm. Proc. CSEE 2010, 30, 105–111. [Google Scholar] [CrossRef]
  40. Liu, J.; Luo, X.J. Short-term optimal environmental economic hydrothermal scheduling based on handling complicated constraints of multi-chain cascaded hydropower station. Proc. CSEE 2012, 32, 27–35. [Google Scholar] [CrossRef]
  41. Liu, J.; Luo, X.J. Optimal economic emission hydrothermal scheduling using a novel algorithm based on black hole theory and annual profit analysis considering fuel gas desulphurization. In Proceedings of the 1st International IET Renewable Power Generation Conference, Edinburgh, UK, 6–8 September 2011. [Google Scholar] [CrossRef]
  42. Liu, J.; Lu, Q.W.; Liu, Y. Optimal capacity allocation of hybrid wind-solar-battery power system containing electric vehicles. In Proceedings of the 5th International IET Renewable Power Generation Conference, London, UK, 21–22 September 2016. [Google Scholar]
  43. Byrd, R.H.; Gilbert, J.C.; Nocedal, J. A trust region method based on interior point techniques for nonlinear programming. Math. Program. 2000, 89, 149–185. [Google Scholar] [CrossRef] [Green Version]
  44. Mohamed Abdelmageed Abdelaziz, M.; Farag, H.E.; El-Saadany, E.F.; Mohamed, Y.A.I. A novel and generalized three-phase power flow algorithm for islanded microgrids using a newton trust region method. IEEE Trans. Power Syst. 2013, 28, 190–201. [Google Scholar] [CrossRef]
  45. Wilamowski, B.M.; Yu, H. Improved computation for Levenberg-Marquardt training. IEEE Trans. Neural Netw. 2010, 21, 930–937. [Google Scholar] [CrossRef]
  46. Kanzowa, C.; Yamashitab, N.; Fukushimab, M. Levenberg-Marquardt methods with strong local convergence properties for solving nonlinear equations with convex constraints. J. Comput. Appl. Math. 2004, 172, 375–397. [Google Scholar] [CrossRef]
  47. Zheng, J.; Wen, F.S.; Li, L.; Wang, K.; Gao, C. Transmission system expansion planning considering combined operation of wind farms and energy storage systems. Autom. Electr. Power Syst. 2013, 37, 135–142. [Google Scholar] [CrossRef]
Figure 1. Diagram of integrated electricity and natural-gas energy systems with power to gas (P2G).
Energies 12 01355 g001
Figure 2. Flow chart.
Energies 12 01355 g002
Figure 3. The hybrid electricity-natural gas energy systems.
Energies 12 01355 g003
Figure 4. Predicted output of wind power units.
Energies 12 01355 g004
Figure 5. Comparison of power output without P2G and with P2G.
Energies 12 01355 g005
Figure 6. Comparison of gas flow without P2G and with P2G.
Energies 12 01355 g006
Figure 7. Results comparison of trust region method and L-M method.
Energies 12 01355 g007
Figure 8. Wind power absorbed by P2G and the gas flow of P2G.
Energies 12 01355 g008
Figure 9. Volume of gas storages without P2G and with P2G.
Energies 12 01355 g009
Table 1. Parameters of power units.
Power UnitsPmax/MWPmin/MWRamp Up Rate/MW/hRamp Down Rate/MW/h
Coal-fired unit 14701508080
Coal-fired unit 24701358080
Coal-fired unit 3340738080
Coal-fired unit 4300605050
Coal-fired unit 5243735050
Gas-fired unit 12600260260
Gas-fired unit 22300230230
Gas-fired unit 32200220220
Wind power unit 17500750750
Wind power unit 26200620620
Table 2. Parameters of gas storage.
Gas Storage No.Initial Capacity/Mm3Max Capacity/Mm3Min Capacity/Mm3Max Gas Flow/Mm3/hMin Gas Flow/Mm3/h
Gas Storage 11.53.500.35-0.20
Gas Storage 22.04.500.45-0.25
Gas Storage 31.53.500.35-0.25
Table 3. Gas pressure limits of gas nodes.
Node No.1234567891011121314151617181920
Mmin/bar3030303010103030505030303030151525251515
Mmax/bar1001001008080808070707770707070707070707070
Table 4. Power demand and gas demand.
Time/h123456789101112
Power demand/MW/h12721188110496010801320147615841740177618001860
Gas demand/Mm3/h1.030.970.920.980.991.031.231.451.791.831.741.61
Time/h131415161718192021222324
Power demand/MW/h168015601320110414161680180020401860163213441116
Gas demand/Mm3/h1.461.421.391.381.391.301.261.191.151.151.120.97
Table 5. Optimization results of the power system.
Case StudiesFuel Cost (M$)SOx Emission (ton)
Without P2G1.08038.193
With P2G1.08437.939
Table 6. Optimization results of the natural-gas system.
Case StudiesMethodsCost of Natural-Gas/M$CO2 Emission/104 tonRate of Abandoned Wind PowerOperation Cost of P2G/M$Absorbed CO2 by the Methanation Process/104 tonIncreased Wind Power by P2G/MWh
Without P2GTrust Region0.7415.79124.85%000
L-M0.6955.79024.85%000
With P2GTrust Region0.7325.7276.71%0.1060.0565321.66
L-M0.6855.4914.04%0.1220.0646104.48

