Article

Simulation of Temperature Distribution on the Face Skin in Case of Advanced Personalized Ventilation System

Department of Building Services and Building Engineering, University of Debrecen; Otemeto str. 2-4, 4028 Debrecen, Hungary
*
Author to whom correspondence should be addressed.
Energies 2019, 12(7), 1185; https://doi.org/10.3390/en12071185
Submission received: 4 March 2019 / Revised: 20 March 2019 / Accepted: 21 March 2019 / Published: 27 March 2019
(This article belongs to the Special Issue Energy Performance and Indoor Climate Analysis in Buildings)

Abstract

:
Energy saving is one of the most important research directions in the building sector. Personalized ventilation systems are energy conscious solutions providing fresh air for the occupants. As a side effect, cooling energy can be saved due to higher convective heat removal. Using the data gathered from previous experiments performed with the developed personalized ventilation system, a ±1.408 °C accurate simulation model was created in ANSYS 19.2 Academic version in order to determine the temperature distribution on the face. In this paper, the method and the first results are presented. It was clearly demonstrated by measurements and simulations that the personalized ventilation equipment used has a considerable effect on the skin temperature of the face. The developed model can be used to analyze the skin temperature on the faces of people using the novel, personalized ventilation equipment. This way the time spent on examination can be reduced considerably.

1. Introduction

Buildings are responsible for about 40% of the total energy consumption in the European Union. The situation is similar in the United States and other countries. This is the reason why energy saving in the building sector has been getting more and more important in the last decades. The share of heating and cooling energy demand depends on the local climate conditions. However, it can be stated that in summer periods, the number of heat waves and the temperature amplitude is increasing [1]. In European countries the energy performance directive encourages member states to only build nearly zero-energy buildings in the future [2,3]. In countries where heating represents 60–70% of the total energy use of a building, severe requirements were adopted regarding thermal performance of the building envelope in order to reduce heat losses. New insulation materials are tested in order to meet the requirements with lower thicknesses [4,5,6]. However, in such buildings small heat loads can lead to high indoor temperatures. To optimize the facade solutions, including window properties, external wall insulation, window-to-wall ratio, and external shading, simulations and cost optimization calculations were performed even in cold climates [7]. In case of free-running office or educational buildings with large glazed areas, extreme high indoor temperatures may appear [8,9]. In case of new buildings, the improved air tightness of the envelope may lead to the increase of carbon dioxide concentration and humidity of the indoor air [10]. Complex studies have to be performed in order to choose the appropriate ventilation strategy [11]. Advanced personalized ventilation (PV) systems may be an energy conscious solution to assure proper air quality and thermal comfort in buildings. According to Melikov, the focus must be shifted from total volume air distribution to advanced air distribution based on the following principles [12]:
  • remove/reduce the air pollution and generated heat (when not needed) locally;
  • provide clean air, also heating and cooling, where, when, and as much as needed;
  • make active control of the air distribution possible;
  • involve each occupant in creating his/her own preferred microenvironment.
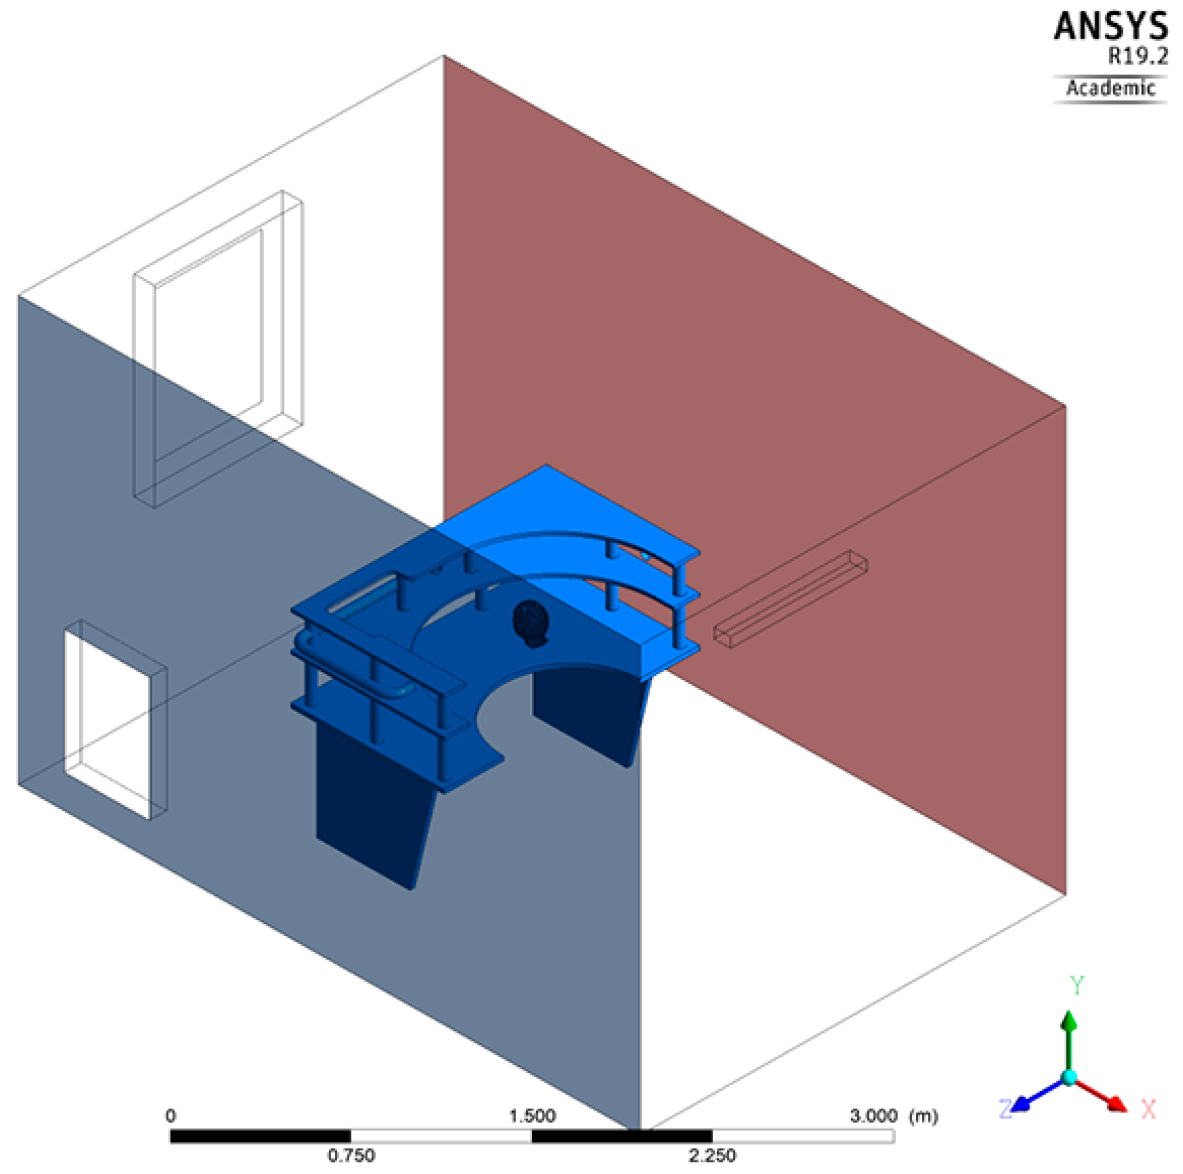
Schiavon et al. found that the energy consumption of PV is 51% lower compared to mixing ventilation [13]. Having lower air flow will lead to lower energy consumption for cooling. Pan et al. proved that energy savings up to 45% can be obtained by comparing a partition-type fan coil unit with a central air conditioning system [14].
PV has the advantage that each occupant is authorized to optimize and control the temperature, flow rate (local air velocity), and direction of the locally supplied air flow [15]. Zhang et al. demonstrated that the local discomfort caused by stratification of the air temperature can be reduced by PV’s and the stratification can be higher [16]. It was shown that by applying 0.8 m s−1 air velocity around the head, the acceptable stratification goes up to 6 °C if the air temperature around the head is 26.8 °C. In the face skin, the number of thermo-receptors is high in comparison to other body segments. According to Lynette Jones, there are more cold spots than warm spots, the density of spots varies across the body, and the time to respond to a cold stimulus is significantly shorter than to a warm stimulus [17]. This is the reason why PV systems may improve thermal sensation of occupants in warm indoor environments. Another advantage of these systems is that PV can help to improve work performance. Maula et al. performed a study in order to analyze the effect of a temperature of 29 °C on performance in tasks involving different cognitive demands. They aimed to assess the effect on perceived performance, subjective workload, thermal comfort, perceived working conditions, cognitive fatigue, and somatic symptoms, in a laboratory with a realistic office environment [18]. They made a comparison to a temperature of 23 °C. It was shown that performance was negatively affected by slightly warmer temperatures in the N-back working memory task. The effect of a cooling jet on performance and comfort in a warm office environment (29.5 °C air temperature) was analyzed by Maula et al. and it was demonstrated that the jet improved the speed of response in a working memory task with increasing exposure time [19].
Because of elevated air velocities around the head and chest of the occupants, draft may appear and can lead to discomfort. Griefahn et al. studied the significance of air velocity and turbulence intensity on responses to horizontal drafts in a constant air temperature of 23 °C [20]. They found that draft-induced general annoyance and draft-induced local annoyance, as stated for the neck and for the forearm, increased with air velocity and/or with turbulence intensity. The decrease in skin temperature, however, was only related to air velocity but not to turbulence intensity. However, draft sensation is related to general thermal sensation [21]. Moreover, with special air terminal devices, better thermal comfort sensation is obtained and draft might be avoided [22,23].
Most PV systems have one air terminal device [24,25,26,27,28]. Conceicao et al. presented the results of their study on comfort level in desks equipped with two personalized ventilation systems [29]. In the experimental tests the mean air velocity and the turbulence intensity in the upper air terminal device were 3.5 m s−1 and 9.7%, while in the lower air terminal device they were 2.6 m s−1 and 15.2%. The mean air temperature in the air terminal devices was around 28 °C, while the mean radiant temperature in the occupation area, the mean air temperature far from the occupation area, and the internal mean air relative humidity were, 28 °C, 28 °C and 50% respectively. They found that The Predicted Percentage of Dissatisfied people reduce from 27.77% (without personalized ventilation) to 16.1% (with personalized ventilation).
The aim of our research was to develop a simulation model in order to analyze the skin temperature distribution on the face of a sitting person at the desk, where the air is introduced around the head alternatively from different directions. Based on previous measurements carried out, the model was created in ANSYS environment.

2. ALTAIR PV System

At the University of Debrecen, Department of Building Services and Building Engineering an advanced personalized ventilation system (ALTAIR) was developed [30,31]. The novelty of ALTAIR PV system is providing the air flow jet around the head of the occupants alternatively from different directions (left-front-right). ALTAIR operates like a hand-held fan, the time steps of changing the air flow direction and the air flow velocity can be chosen by the user (Figure 1).
In the Indoor Environment Quality laboratory of the University of Debrecen, numerous measurements were carried out testing the ALTAIR equipment under elevated operative temperatures and asymmetric radiations [32,33,34].
It was clearly demonstrated that the reduction of the skin temperature on the face was minimum 0.5 K or higher depending on the indoor temperature, which varied continuously during the operation of ALTAIR to avoid adaptation. In Figure 2, the temperature distribution on the face was presented when the air jet was blown on the right side of the face, respectively when the air jet was not blown on the right side of the face. The air temperature and the mean radiant temperature in the room were 28 °C.
The variation of the skin temperature on the face over 30 min can be observed in Figure 3 in a closed space with 28 °C operative temperature (data were gathered every 10 s). The ALTAIR PV system was in operation with 20 m3 h−1 air jet and the direction was varied (in this case) every 20 s (left-front-right-front-left-front-right-...). The air jet temperature was equal to the temperature of indoor air.
One of the biggest challenges of the PV systems is to avoid draft. Even though draft might be favorable from a thermal comfort point of view in warm environments, in most cases occupants claim discomfort perceiving the draft. Having a database of skin temperatures in different environmental conditions created the basis for a numerical model in order to determine the distribution of the face skin temperatures in different environments. In the following chapters the methodology and first results are presented.

3. Methods

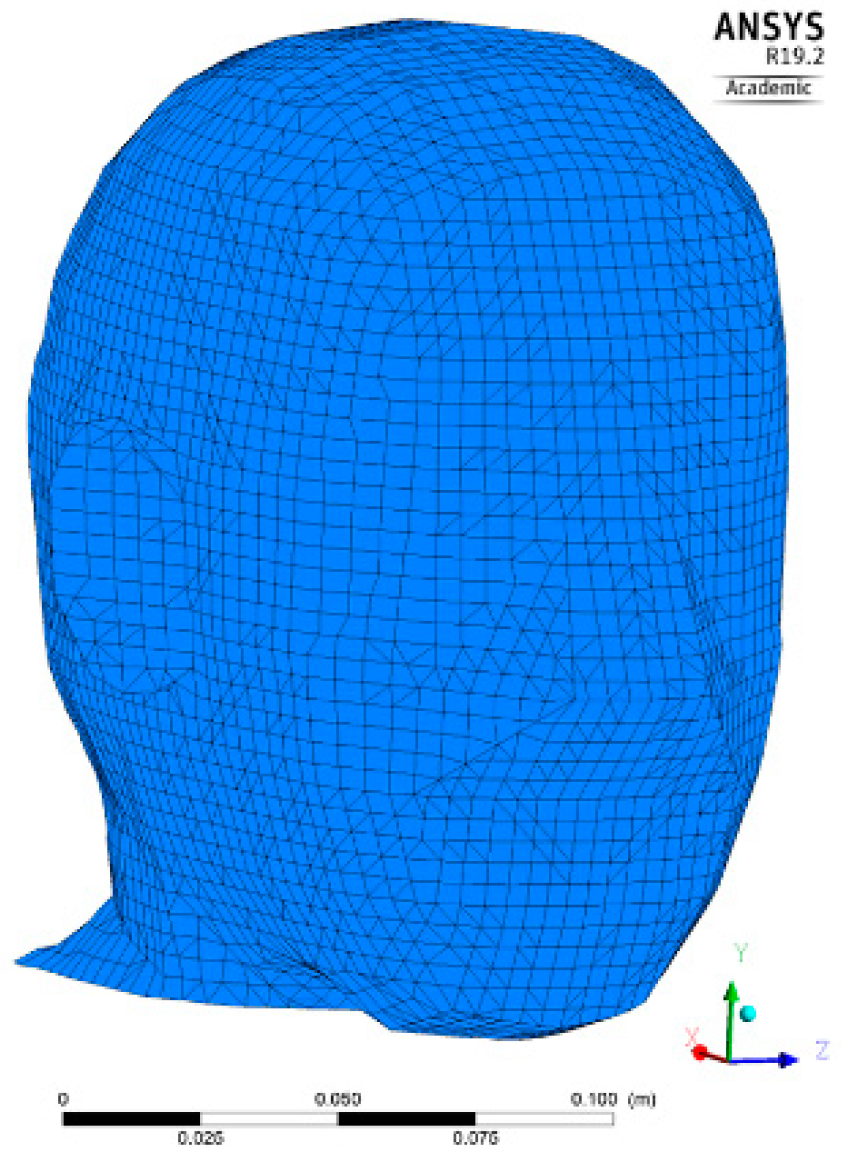
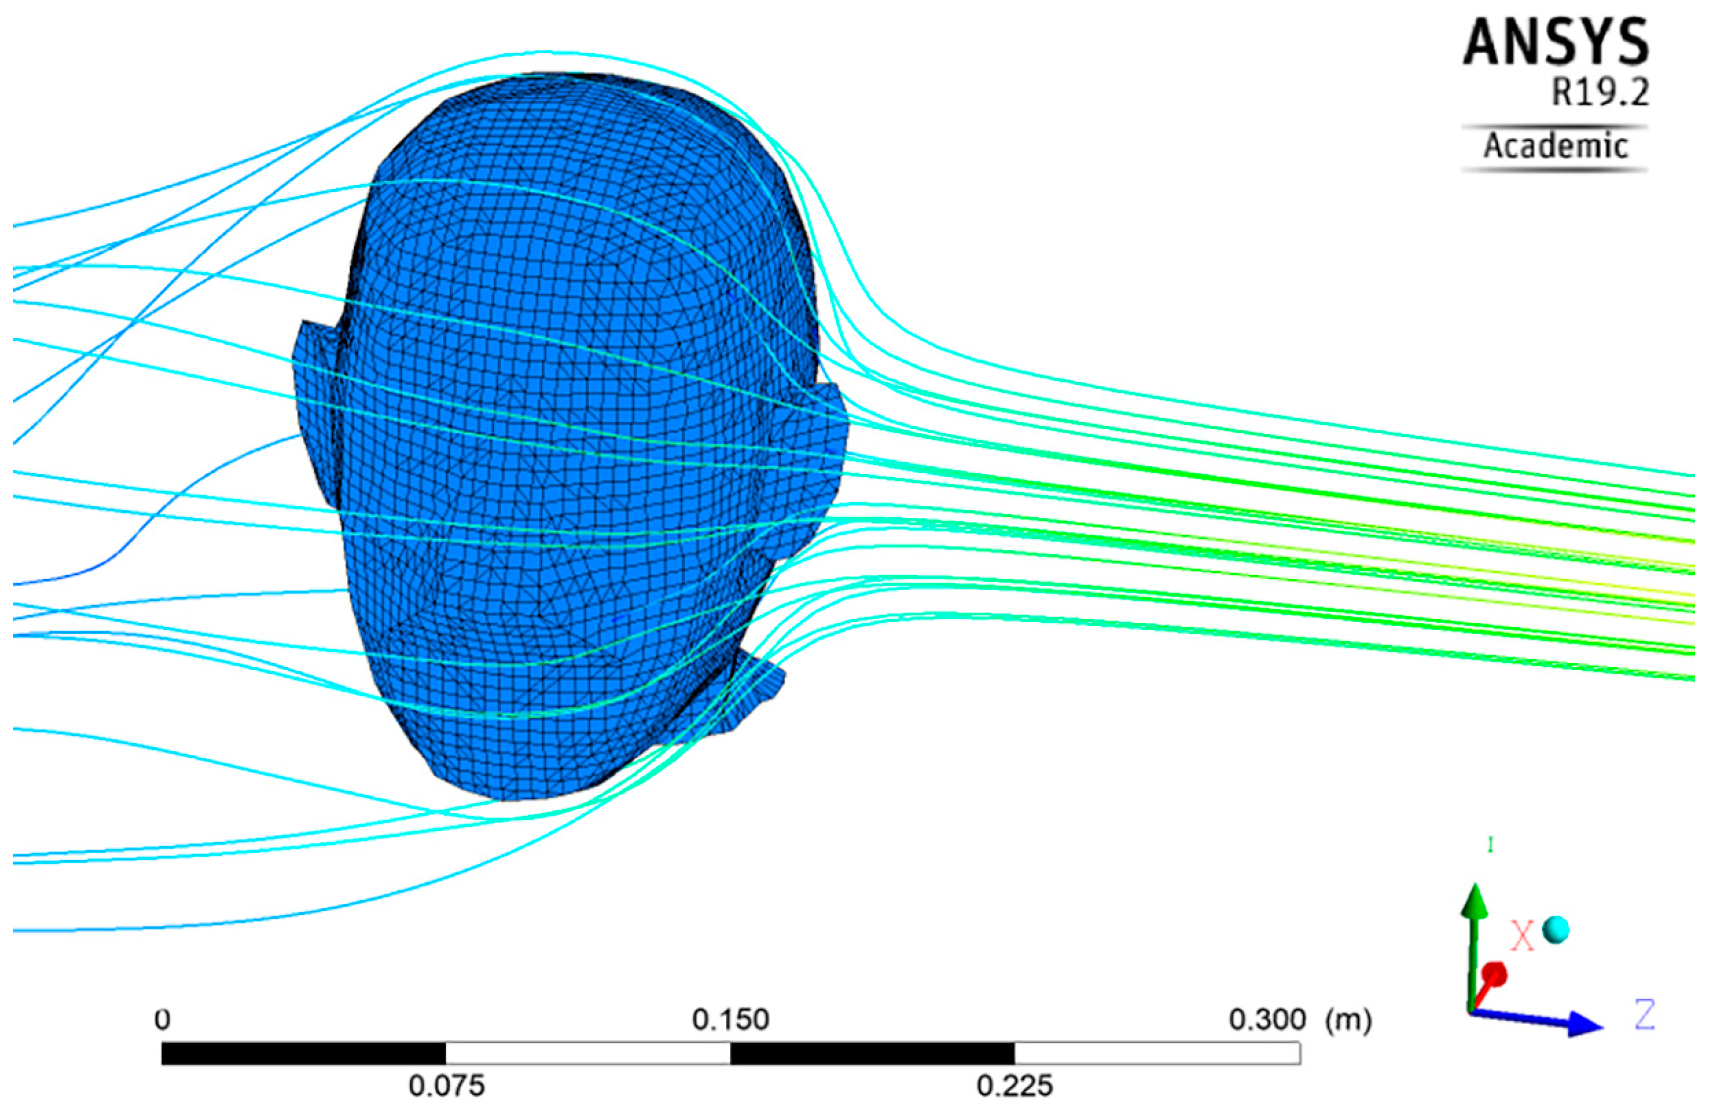
3.1. Geometry and Mesh

The numerical model was made in ANSYS 19.2 Academic version. Our first step was to define the flow domain where the analysis was carried out. The geometry was a digital copy of the Indoor Environment Quality Laboratory of the University of Debrecen, where the measurements were taken with the ALTAIR [34]. In this 2.5 m wide, 3.65 m long, 2.55 m high room (Figure 4), the ALTAIR can be found. The PV system was situated in front of a 900 mm × 630 mm large glazed surface.
At the ALTAIR a hypothetical person was seated whose head was defined, although the rest of the body was not modelled. This head was a royalty free 3D model of a male head (Figure 5). It can be seen from Figure 4 and Figure 5 that a simplified geometry was created to reduce the complexity of the geometric model. The tolerance was less then ±2 mm of the 3D model.
The mesh was generated in such a density that the distance of the nodes did not affect the resulting values. For this reason, several mesh independency examinations were made when the cases converged. In the final mesh, element sizes of 20 mm and 2 mm were applied around the desk and around the head respectively.

3.2. Physics Model

The physics model was created in ANSYS Fluent 19.2, where two independent airflows, thermodynamic changes and diffuse solar radiation were modelled. Due to the complex ventilation systems and fine geometries, robust and turbulent flows were produced. It gave us a reason to use k-ε model. With this model it was possible to take the kinetic energy change and the turbulence dissipation into account.
The examined face was placed in the room (Figure 4) where the wall was cooled from the left (blue surface) and heated (red surface) from the right. By the cooling, an average cold surface temperature (TSC) and by the heating, an average warm surface temperature (TSW) was achieved. In front of the face there was a window from which diffuse solar radiation Isolar = 20 W m−2 was emitted in to the room. The surface of the face had a 70 W m−2 heat load, while the rest of the surfaces in the room had 0 W m−2 heat losses. 0.98 [35] was chosen to be the absorption coefficient of the skin and 0.9 was chosen for the rest of the surfaces according to the MSZ EN ISO 6946:2017 Hungarian Standard [36].
Two ventilation systems were placed in the examined room. One supplied VAF = 50 m3 h−1 fresh air with a temperature of TAF and a personalized ventilation system (ALTAIR) that circulated VAV [m3 h−1] air in the room with a temperature of TAV.
The minimum and the maximum values of the previously mentioned parameters are presented in Table 1.
We wanted to create an accurate model that can be considered to be valid. To validate the model, we have chosen an important parameter that was not given as an input parameter. In the validation process we examined how closely we could approach this value. It was known from a previous research paper [34] that the average face temperature (AFT) was 32 °C for male participants and this parameter was chosen as the validation parameter. For validation 1.6 °C (5% of 32 °C) accuracy was chosen because the complexity of the model could cause such a degree of deviation. When the mesh and the physical model were considered to be validated, combinations of the minimum and maximum parameter values were made to examine the sensitivity of the AFT.

3.3. Radiation Model
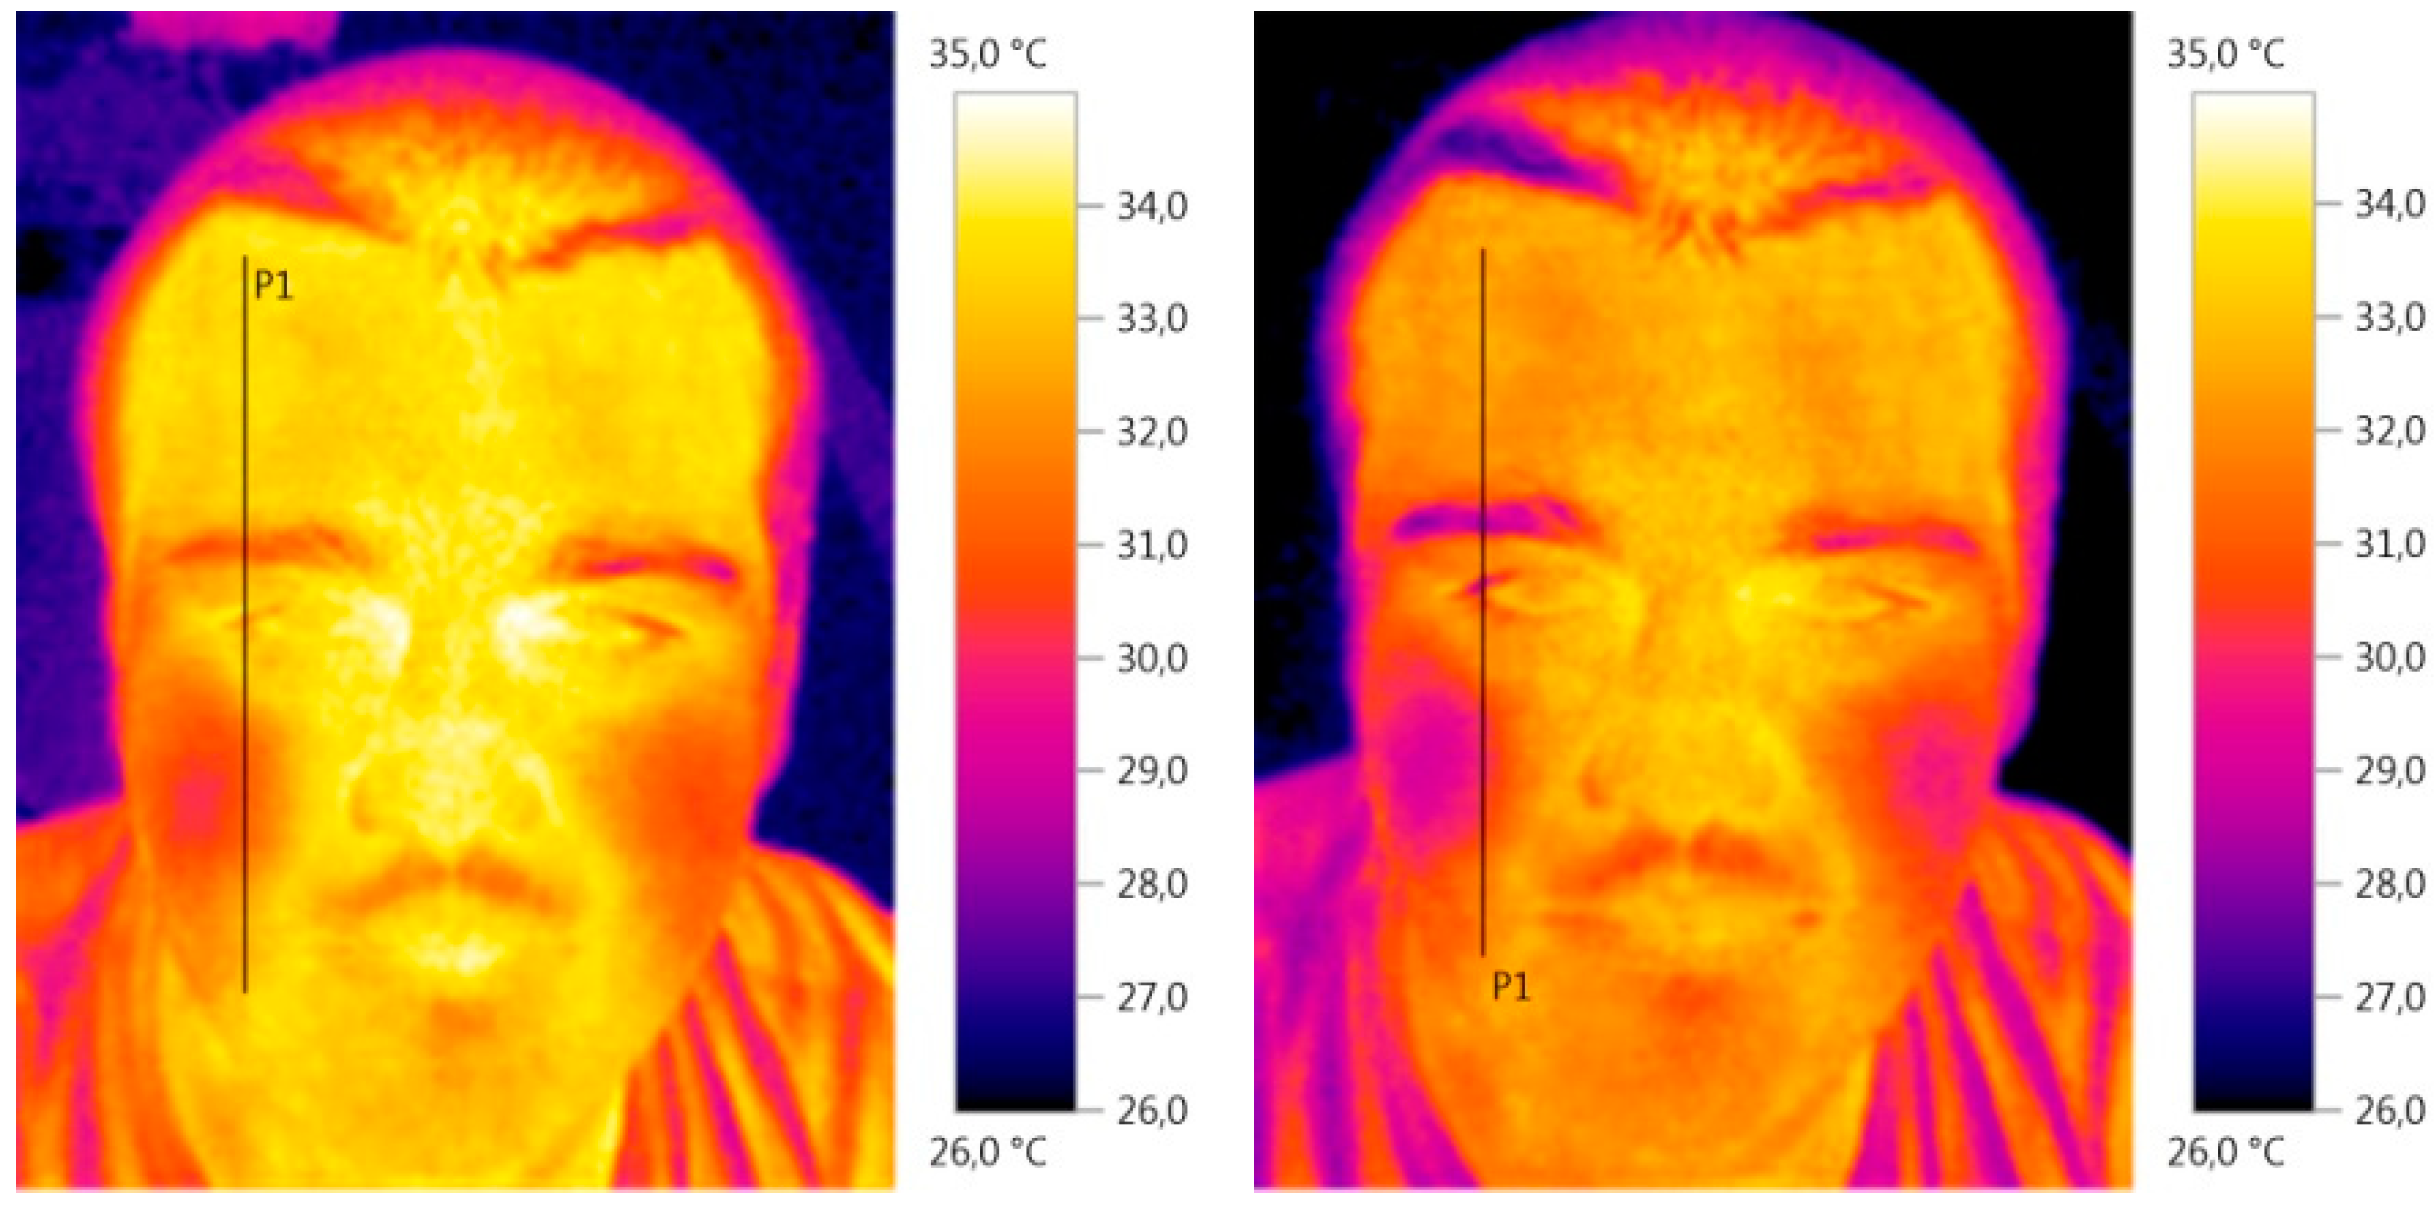
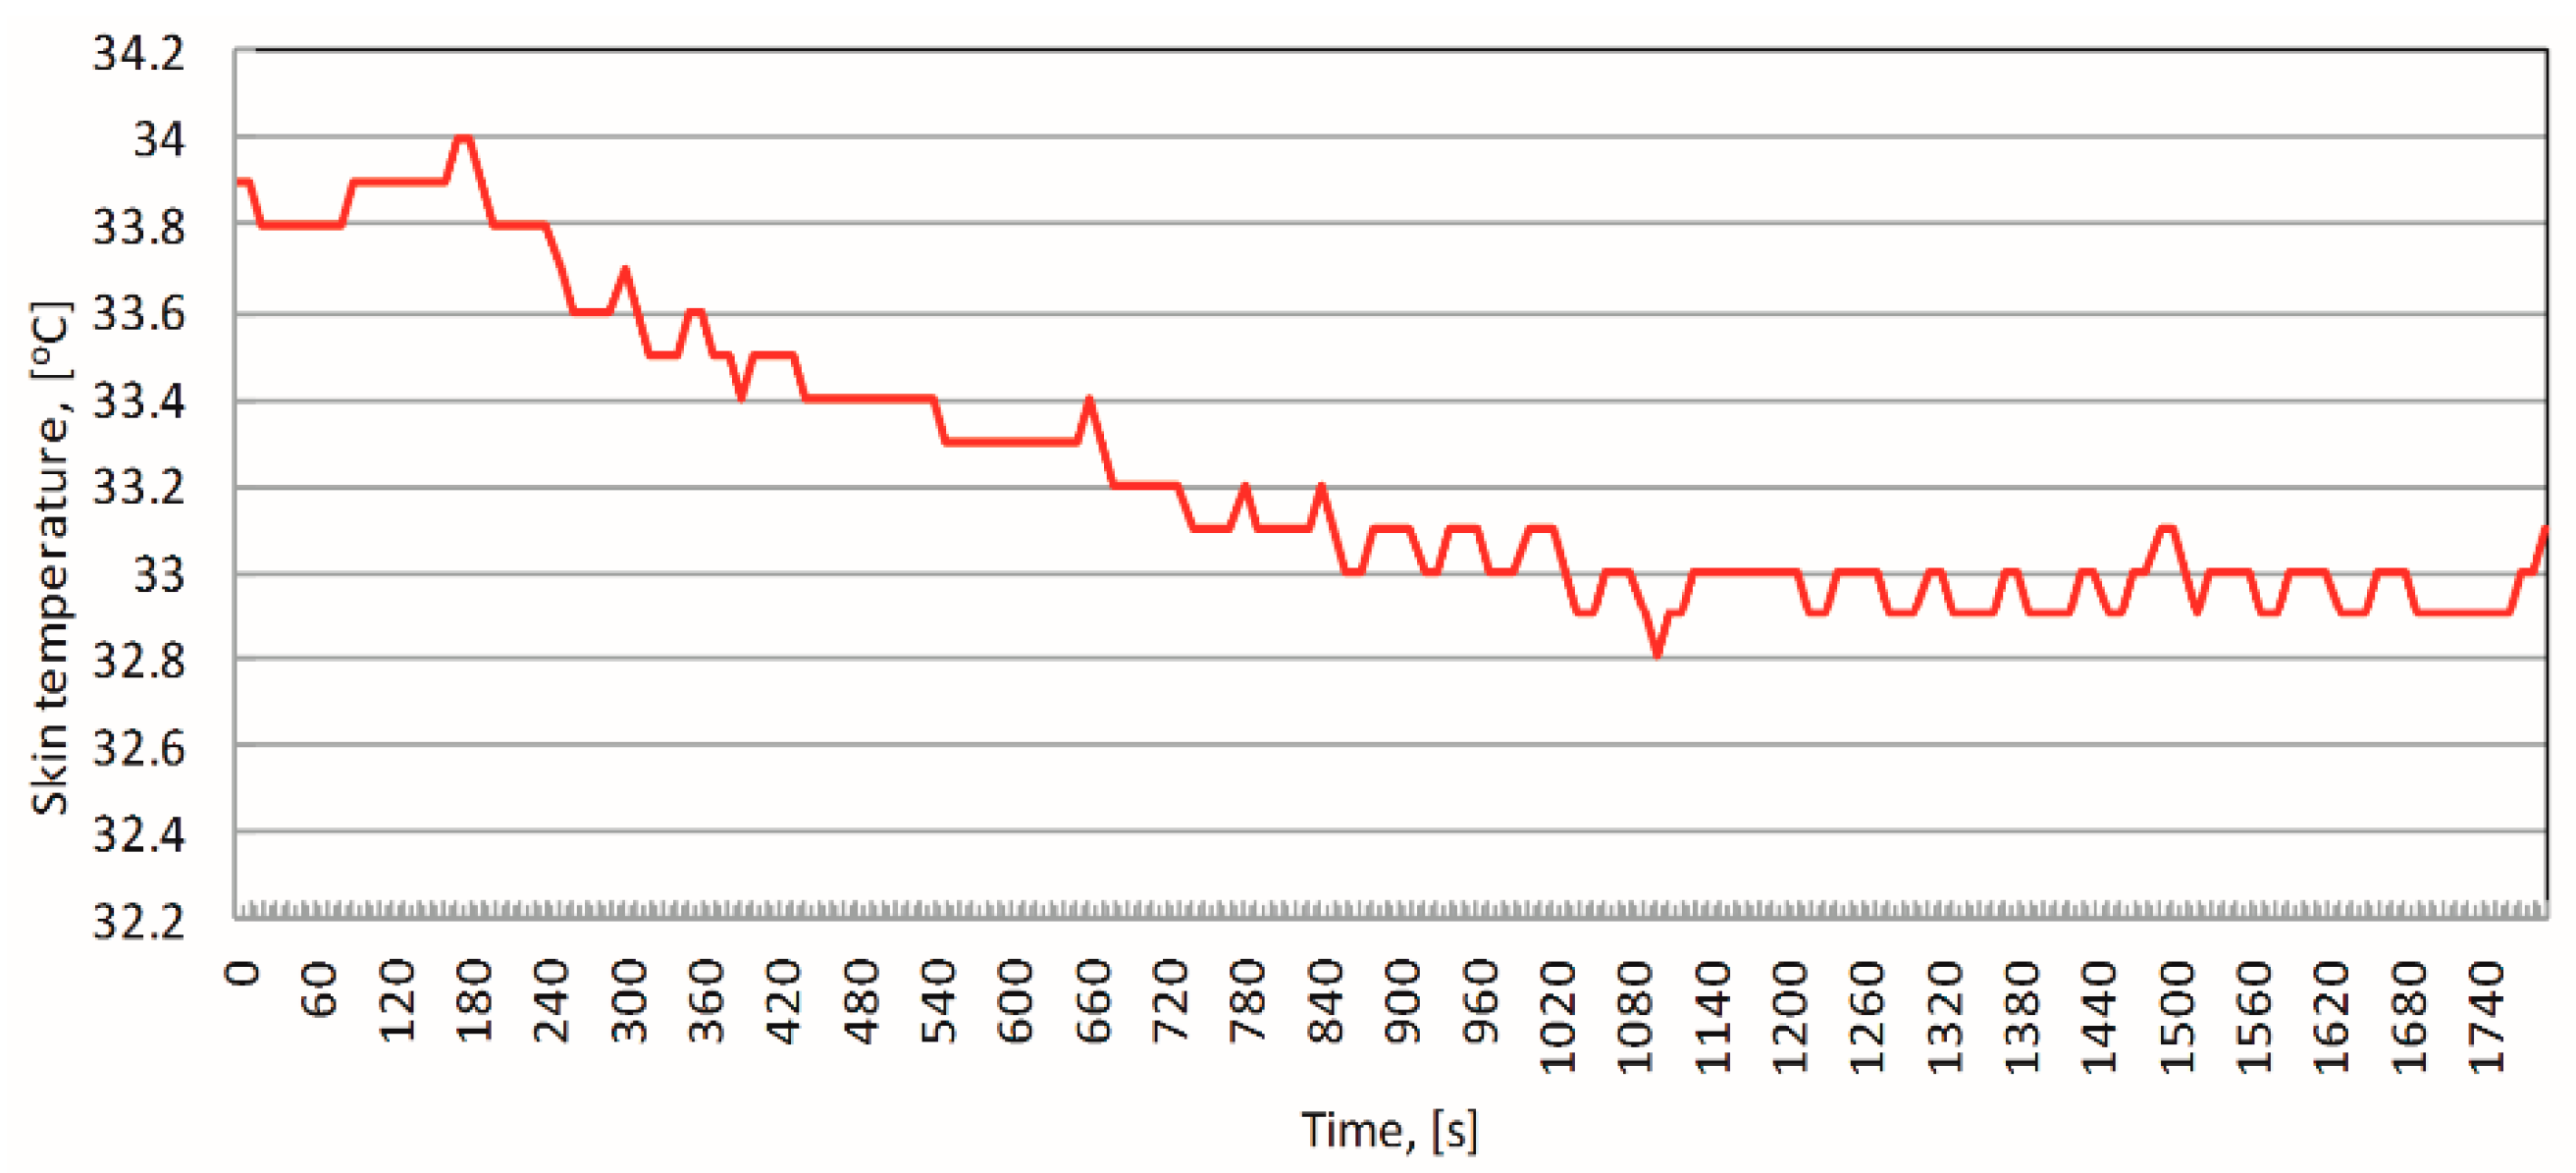
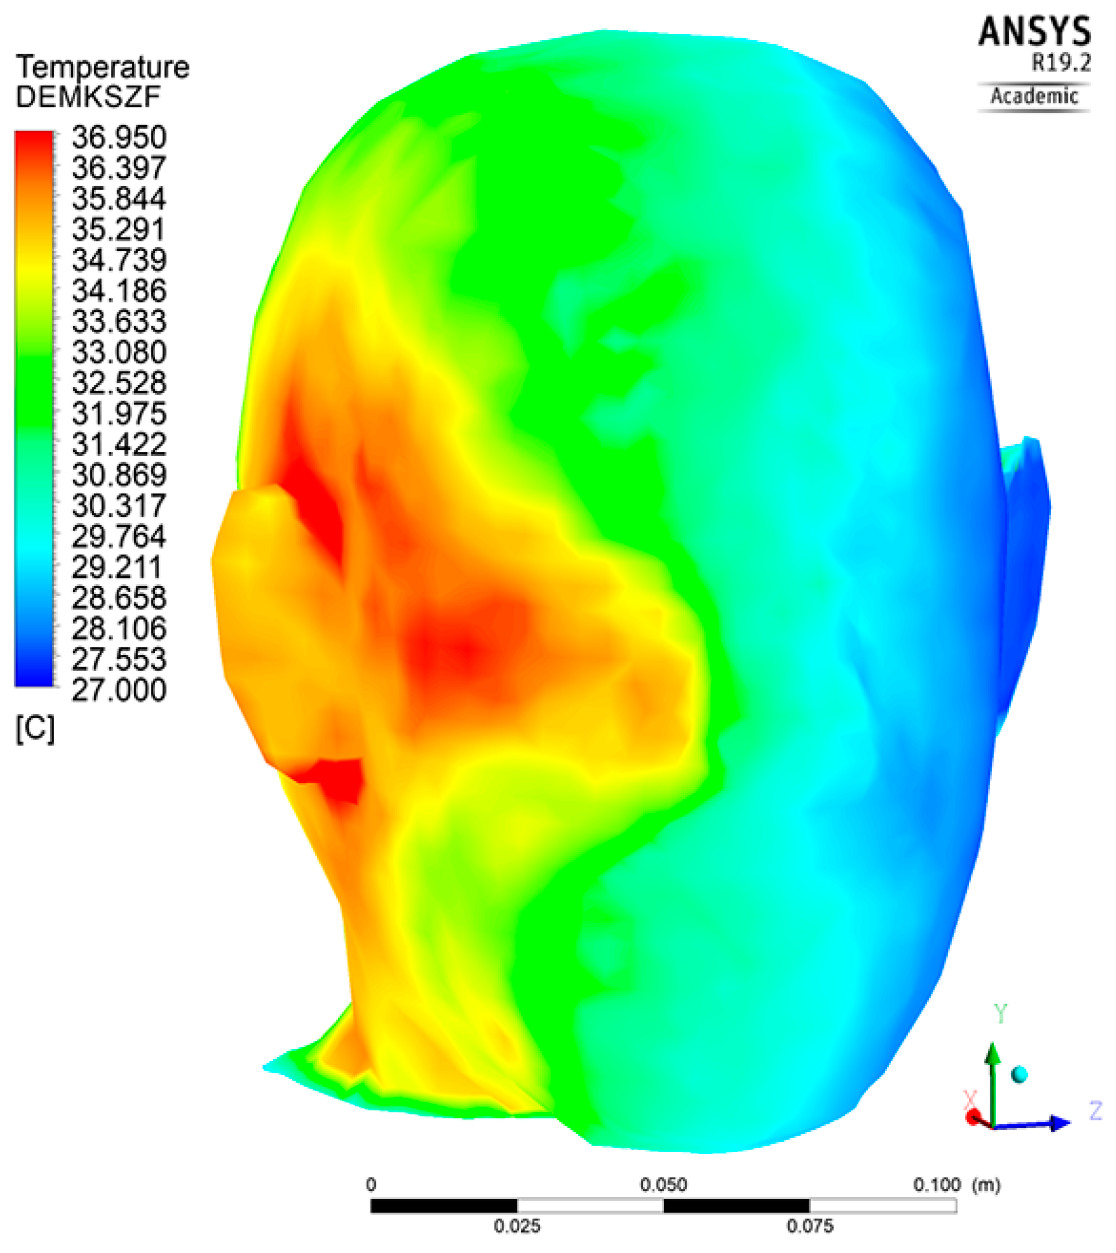
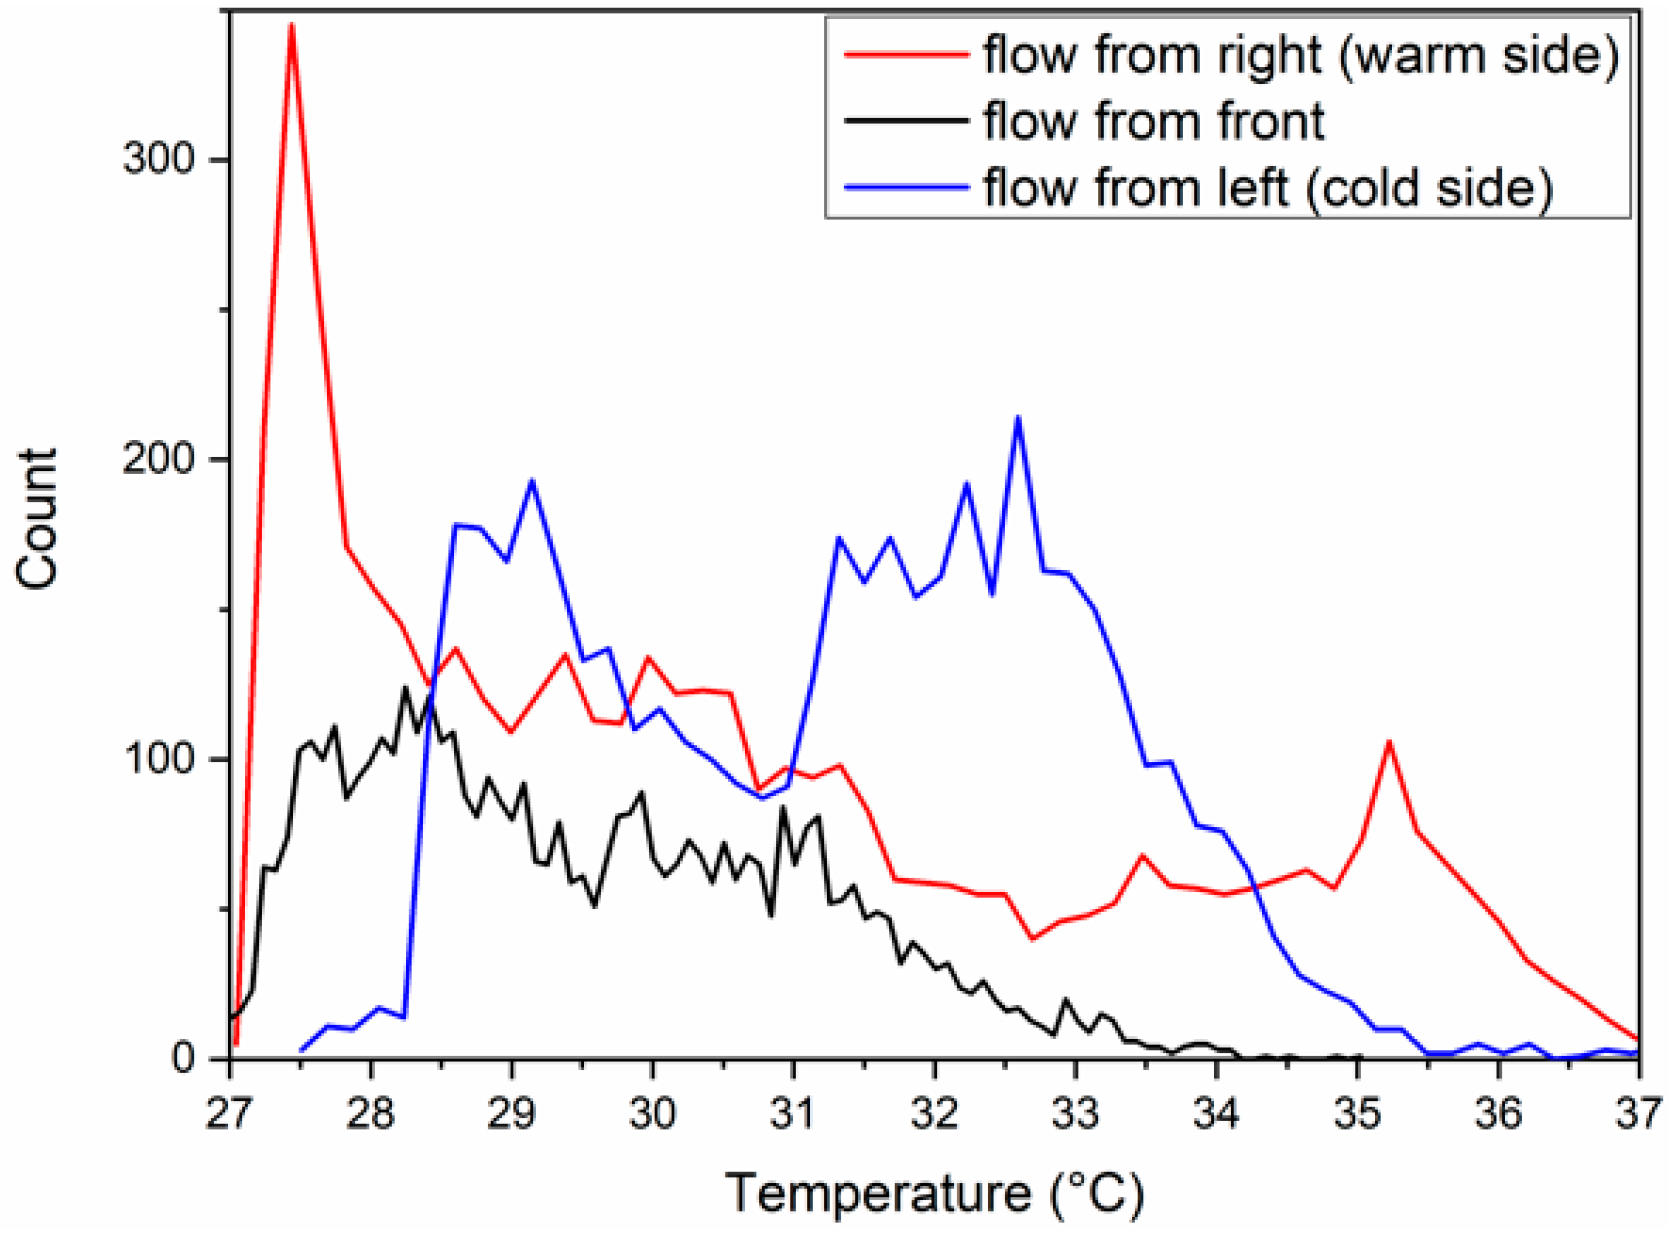
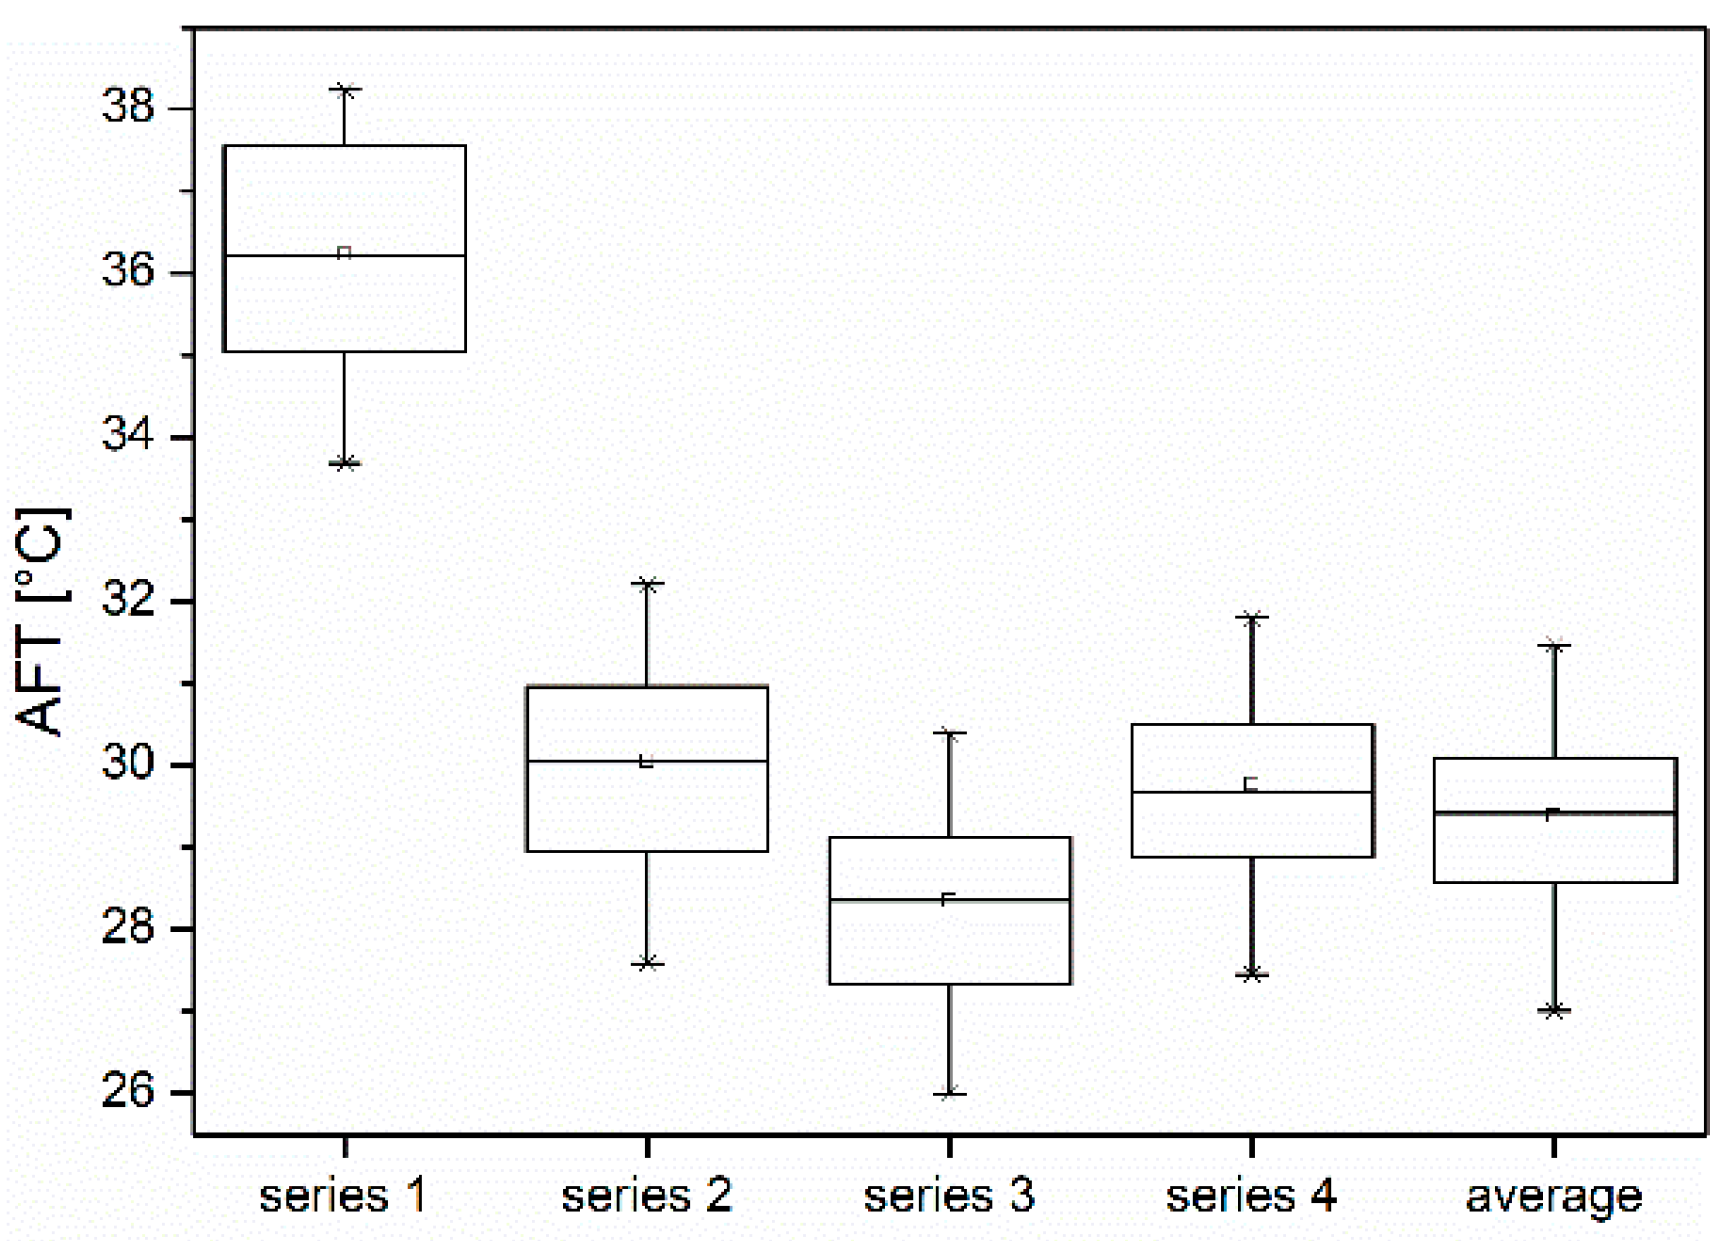
During the simulation, radiation had to be modelled due to the diffuse solar radiation and heat radiation from the warm surfaces. For the solar radiation simulation three parameters had to be defined. Direction, direct and diffuse irradiation, and the transmissivity factor of the semi-opaque surface from where the radiation was excepted [37]. In the examined case the window had a transmissivity factor of 1 and there was no direct solar radiation. For radiation modelling, the Monte Carlo and the surface to surface method was examined.
The Monte Carlo is a probability-based model. The basis of this model is that it calculates the discrete particle (photons) energy that is randomly emitted from the surface. To achieve good convergence with the measured data, the number of cases should be increased, however the large number of photons requires large computational power [37,38]. To reduce the processing power this method was not preferred. When the model was examined, several hotspots were generated on the face due to the amount of the simulated photons being low. By increasing the number of the photons the peak temperatures were lowered but the temperature distribution was not considered to be adequate. This model was not used for the final presented cases.
The surface to surface (S2S) model ignores the movement of the photons and it calculates radiation between two surfaces. These surfaces are Lambert-surfaces that are defined by the absorption factor. With this factor absorption, emission, and scattering of the radiation can be modelled. When the absorption coefficients were defined, the view factors were also calculated for all surfaces. This method showed smooth distribution without considerable peaks. Because of the fact that only diffuse radiation and smooth temperature distribution occurred, the S2S radiation model was used for the validated and also for the following cases.

4. Results

The ALTAIR changed the direction of the flow in every 20 s during the operation. Consequently, the validation had to be done for the average values of three cases, when the air flow came from the left, the right, and the front of the face. The AFT in Celsius and in Kelvin and the calculated errors can be seen in Table 2. The average error from the three directions was 4.4%, this value was mostly increased by the frontal flow. In the further cases similar phenomena occurred during the analysis. This 4.4% error means that with the presented simulation model we could predict the AFT with ±1.408 °C accuracy under the circumstances that the freedom of the model allows. It has to be mentioned that in all three cases the calculated AFT values were lower than the validation value.
The AFT distribution is shown in Figure 6. This figure was made to depicting that when the face was blown from the left side, it caused a considerable cooling for this side of the face, while large hotspots appeared on the right side that was protected from the flow.
The flow around the head created by ALTAIR can be seen on Figure 7. The streamlines are not appearing on the other side of the head. Due to this phenomenon, the thermal surface resistance of that side increases for a short period of time which can lead to temperature rise. Since the three directions are constantly alternating, the shown temperature raise easily dissipates.
The histogram of the face temperatures (Figure 8) shows that the lowest temperatures appeared when the flow was initiated from the front, while the highest temperatures were achieved when the flow was formed from the cold (left) side of the room. The phenomenon that increased the surface resistance helped the already warm (right) side of the face to be heated by the warm wall. The lowest temperature occurred when the flow of ALTAIR touched the face from the warm side (right).

Results from the Cases

56 cases were made using the validated model by changing the temperature values and the direction of the flow of ALTAIR, and the AFT of all cases is presented in Table 3. The cases are sorted into four categories when the ALTAIR was turned off (series 1), when the ALTAIR blew from the left position (series 2), the front position (series 3) and the right position (series 4) as shown in Figure 9.
The box chart (Figure 10) reveals that without the produced ventilation from the ALTAIR the mean temperature would raise up by an average of 6.72 °C. In all the examined series the maximum AFT differences were 4.48 ± 0.09 °C while the average standard error was ±1.04 °C. This means that by changing the wall and air temperatures the value deviations were roughly the same, although the mean temperatures were different. Series 2 had the highest mean temperatures, while series 3 had the lowest. It can also be observed that when the flow was attacking from the side, the temperature values had a slight deviation compared to each other, although data from series 2 displays warmer temperatures. Considerable (in average 1.5 °C) AFT changes occurred when the warm surface temperature and the ventilation temperature were alternated, in the rest of the cases the deviation was less than ±1 °C.

5. Conclusions

Personalized ventilation systems may improve the thermal comfort and the indoor air quality in closed spaces with elevated indoor temperatures. However, draft has to be avoided otherwise users will experience discomfort. The skin temperature on the face is an important parameter which gives useful information about thermal comfort sensation. In this paper, skin temperatures were calculated with a ±1.408 °C accuracy in ANSYS 19.2 Academic version. In the simulation two independent airflows, surface to surface radiation and various surface temperatures, were modelled with ANSYS Fluent in 56 different cases. It was shown that flow from the personal ventilation system has a considerable effect on the average face temperature. The average flow temperature of the personalized ventilation has a strong connection to the average face temperature. We predicted that the lowest average face temperature occurs when the flow originates from the front of the face.

Author Contributions

Conceptualization, Funding Acquisition, Methodology, Project Administration, Writing, Supervision, Review F.K.; Editing, Investigation, Software, Validation, Writing-Original Draft Preparation, F.S.; Data curation, Formal Analysis, Methodology F.K. and F.S.

Funding

This research was funded by Ministry of Human Capacities grant number 20428-3/2018/FEKUTSTRAT and the APC was funded by Ministry of Human Capacities and University of Debrecen.

Acknowledgments

The research was financed by the Higher Education Institutional Excellence Programme of the Ministry of Human Capacities in Hungary, within the framework of the Energetics Thematic Programme of the University of Debrecen.

Conflicts of Interest

The authors declare no conflict of interest.

Nomenclature

AFTaverage face skin temperature [°C]
εemission coefficient [-]
Isolarsolar radiation [W m−2]
TAFfresh air temperature [°C]
TAVventilated air temperature [°C]
TSCaverage cold surface temperature [°C]
TSWaverage warm surface temperature [°C]
VAVventilated air volume flow [m3 h−1]
VAFfresh air volume flow [m3 h−1]

References

  1. Schär, C.; Vidale, P.L.; Lüthi, D.; Frei, C.; Häberli, C.; Liniger, M.A.; Appenzeller, C. The role of increasing temperature variability in European summer heatwaves. Nature 2004, 427, 332–336. [Google Scholar] [CrossRef]
  2. Kurnitski, J.; Saari, A.; Kalamees, T.; Vuolle, M.; Niemelä, J.; Tarke, T. Cost optimal and nearly zero (nZEB) energy performance calculations for residential buildings with REHVA definition for nZEB national implementation. Energy Build. 2011, 43, 3279–3288. [Google Scholar] [CrossRef]
  3. Kurnitski, J.; Allard, F.; Braham, D.; Goeders, G.; Heiselberg, P.; Jagemar, L.; Kosonen, R.; Lebrun, J.; Mazzarella, L.; Railio, J.; Seppänen, O.; Schmidt, M.; Virta, M. How to define nearly net zero energy buildings nZEB– REHVA proposal for uniformed national implementation of EPBD recast. Rehva J. 2011, 48, 6–11. [Google Scholar]
  4. Riffat, S.B.; Qiu, G. A review of state-of-the-art aerogel applications in buildings. Int. J. Low-Carbon Technol. 2013, 8, 1–6. [Google Scholar] [CrossRef]
  5. Umberto, B.; Lakatos, Á. Thermal Bridges of Metal Fasteners for Aerogel-enhanced Blankets. Energy Build. 2019, 185, 307–315. [Google Scholar]
  6. Lakatos, Á. Stability investigations of the thermal insulating performance of aerogel blanket. Energy Build. 2019, 185, 103–111. [Google Scholar] [CrossRef]
  7. Thalfeldt, M.; Pikas, E.; Kurnitski, J.; Voll, H. Facade design principles for nearly zero energy buildings in a cold climate. Energy Build. 2013, 67, 309–321. [Google Scholar] [CrossRef]
  8. Kalmár, F. Interrelation between glazing and summer operative temperatures in buildings. Int. Rev. Appl. Sci. Eng. 2016, 7, 51–60. [Google Scholar] [CrossRef]
  9. Kalmár, F. Summer operative temperatures in free running existing buildings with high glazed ratio of the facades. J. Build. Eng. 2016, 6, 236–242. [Google Scholar] [CrossRef]
  10. Zemitis, J.; Borodinecs, A.; Frolova, M. Measurements of moisture production caused by various sources. Energy Build. 2016, 127, 884–891. [Google Scholar] [CrossRef]
  11. Baranova, D.; Sovetnikov, D.; Semashkina, D.; Borodinecs, A. Correlation of energy efficiency and thermal comfort depending on the ventilation strategy. Procedia Eng. 2017, 205, 503–510. [Google Scholar] [CrossRef]
  12. Melikov, A.K. Advanced air distribution. ASHRAE J. 2011, 53, 73–78. [Google Scholar]
  13. Schiavon, S.; Melikov, A.K.; Sekhar, C. Energy analysis of the personalized ventilation system in hot and humid climates. Energy Build. 2010, 42, 699–707. [Google Scholar] [CrossRef]
  14. Pan, C.S.; Chiang, H.C.; Yen, M.C.; Wang, C.C. Thermal comfort and energy saving of a personalized PFCU air conditioning system. Energy Build. 2005, 37, 443–449. [Google Scholar] [CrossRef]
  15. Melikov, A.K. Personalized ventilation. Indoor Air 2004, 14, 157–167. [Google Scholar] [CrossRef] [PubMed]
  16. Zhang, H.; Huizenga, C.; Arens, E.; Yu, T. Modeling thermal comfort in stratified environments. In Proceedings of the Indoor Air, Beijing, China, 4–9 September 2005; pp. 133–137. [Google Scholar]
  17. Jones, L. Thermal touch. Scholarpedia 2009, 4, 7955. [Google Scholar] [CrossRef]
  18. Maula, H.; Hongisto, V.; Ostman, L.; Haapakangas, A.; Koskela, H.; Hyöna, J. The effect of slightly warm temperature on work performance and comfort in open-plan offices—A laboratory study. Indoor Air 2016, 26, 286–297. [Google Scholar] [CrossRef]
  19. Maula, H.; Hongisto, V.; Koskela, H.; Haapakangas, A. The effect of cooling jet on work performance and comfort in warm office environment. Build. Environ. 2016, 104, 13–20. [Google Scholar] [CrossRef]
  20. Griefahn, B.; Künemund, C.; Gehring, U. The significance of air velocity and turbulence intensity for responses to horizontal drafts in a constant air temperature of 23 °C. Int. J. Ind. Ergon. 2000, 26, 639–649. [Google Scholar] [CrossRef]
  21. Toftum, J.; Nielsen, R. Draught sensitivity is influenced by general thermal sensation. Int. J. Ind. Ergon. 1996, 18, 295–305. [Google Scholar] [CrossRef]
  22. Melikov, A.K.; Cermak, R.; Majer, M. Personalized ventilation: evaluation of different air terminal devices. Energy Build. 2002, 34, 829–836. [Google Scholar] [CrossRef]
  23. Sun, W.; Tham, K.W.; Zhou, W.; Gong, N. Thermal performance of a personalized ventilation air terminal device at two different turbulence intensities. Build. Environ. 2007, 42, 3974–3983. [Google Scholar] [CrossRef]
  24. Cermak, R.; Holsoe, J.; Mayer, E.; Melikov, A.K. PIV measurements at the breathing zone with personalized ventilation. In Proceedings of the Eight International Conference Air Distribution in Rooms, Roomvent, Copenhagen, Denmark, 8–11 September 2002; pp. 349–352. [Google Scholar]
  25. Gao, N.; Niu, J. CFD study on micro-environment around human body and personalized ventilation. Build. Environ. 2004, 39, 795–805. [Google Scholar] [CrossRef]
  26. Gao, N.; Niu, J. Modeling the performance of personalized ventilation under different conditions of room air and personalized air. Int. J. Heat. Vent. Air-Cond. Refrig. Res. 2005, 11, 587–602. [Google Scholar] [CrossRef]
  27. Kaczmarczyk, J.; Melikov, A.K.; Fanger, P.O. Human response to personalized ventilation and mixing ventilation. Indoor Air 2004, 14, 1–13. [Google Scholar] [CrossRef]
  28. Sekhar, S.C.; Gong, N.; Tham, K.W.; Cheong, K.W.; Melikov, A.K.; Wyon, D.P.; Fanger, P.O. Findings of personalized ventilation studies in a hot and humid climate. Int. J. Heat. Vent. Air-Cond. Refrig. Res. 2005, 114, 603–620. [Google Scholar] [CrossRef]
  29. Conceiçao, E.Z.E.; Manuela, M.; Lúcio, J.R.; Rosa, S.P.; Custódio, A.L.V.; Andrade, R.L.; Meira, M.J.P.A. Evaluation of comfort level in desks equipped with two personalized ventilation systems in slightly warm environments. Build. Environ. 2010, 45, 601–609. [Google Scholar] [CrossRef]
  30. Kalmár, F.; Kalmár, T. Alternative personalized ventilation. Energy Build. 2013, 65, 37–44. [Google Scholar] [CrossRef]
  31. Kalmár, F. Innovative method and equipment for personalized ventilation. Indoor Air 2015, 25, 297–306. [Google Scholar] [CrossRef] [PubMed]
  32. Kalmár, F. An indoor environment evaluation by gender and age using an advanced personalized ventilation system. Build. Serv. Eng. Res. Technol. 2017, 38, 505–521. [Google Scholar] [CrossRef] [Green Version]
  33. Kalmár, F. Impact of elevated air velocity on subjective thermal comfort sensation under asymmetric radiation and variable airflow direction. J. Build. Phys. 2018, 42, 173–193. [Google Scholar] [CrossRef]
  34. Kamár, F.; Kalmár, T. Study of human response in conditions of surface heating; asymmetric radiation and variable air jet direction. Energy Build. 2018, 179, 133–143. [Google Scholar] [CrossRef]
  35. Buzug, M.B.T.; Holz, D.; Kohl-Bareis, M.; Schmitz, G. Frontiers in Medical Imaging. In Proceedings of the VDE Kongress 2004, Berlin, Germany, 18–20 October 2004; pp. 37–42. [Google Scholar]
  36. MSZ EN ISO 6946:2017. Building Components and Building Elements. Thermal Resistance and Thermal Transmittance. Calculation Method (ISO 6946:2017); ISO: Geneva, Switzerland, 2017. [Google Scholar]
  37. Baehr, H.D.; Stephan, K. Heat and Mass Transfer; Springer: Berlin/Heidelberg, Germany, 2006. [Google Scholar]
  38. Frank, A.; Heidemann, W.; Spindler, K. Modeling of the surface-to-surface radiation exchange using a Monte Carlo method. J. Phys. Conf. Ser. 2016, 745, 032143. [Google Scholar] [CrossRef] [Green Version]
Figure 1. ALTAIR PV system.
Energies 12 01185 g001
Figure 2. Skin temperature on the right side of the face (left) 32.7 °C average temperature along the line without air jet; (right) 31.4 °C average temperature along the line with air jet).
Energies 12 01185 g002
Figure 3. Face skin temperature variation.
Energies 12 01185 g003
Figure 4. Room geometry.
Energies 12 01185 g004
Figure 5. Face geometry.
Energies 12 01185 g005
Figure 6. Face surface temperature distribution, blown from left.
Energies 12 01185 g006
Figure 7. Streamlines around the head.
Energies 12 01185 g007
Figure 8. Histogram of the surface temperatures from the face.
Energies 12 01185 g008
Figure 9. Sketch of the measurement setup.
Energies 12 01185 g009
Figure 10. AFT values.
Energies 12 01185 g010
Table 1. Input parameters.
ParametersTSCTSWTAFTAVVAV
Units[°C][°C][°C][°C][m3 h−1]
Validation case17.531.1242420
Minimum value163022220
Maximum value2036262640
Table 2. Average face temperature values for validation.
Parameters[K]Error[°C]Error
left303.920.40%30.783.81%
front302.690.80%29.557.66%
right304.590.18%31.451.72%
validation [35]305.14-32-
average303.730.46%30.594.40%
Table 3. Average face temperature values.
TSCTSWTAVTAFSeries 1Series 2Series 3Series 4Average
[°C][°C][°C][°C][°C][°C][°C][°C][°C]
1630222233.6927.5925.9927.4527.01
2030222235.0528.4526.8328.3427.88
1636222236.2129.6327.3128.7828.57
2036222237.5530.4928.1429.6729.43
16302226-28.0026.4928.1927.56
2030222628.8627.3329.0828.42
1636222630.0427.8029.5229.12
2036222630.8928.6430.4029.98
1630262228.9527.9128.8928.58
2030262229.8028.6729.7729.41
1636262230.9629.1130.2130.09
2036262231.8129.9131.0830.93
1630262634.3929.3428.3529.6129.10
2030262635.7530.2029.1130.4929.93
1636262636.9031.3629.5730.9330.62
2036262638.2432.2130.3931.8031.47

